research team capital inc. morning comments...
TRANSCRIPT

Paradigm Capital Inc, IIROC/TSX member 1
June 18, 2015
Growth Smart Employee Benefits, Inc: [INITIATING COVERAGE] Disruptive Technology in Health
Benefits Processing [Est: new, $0.80 TP, Buy]
Event: We believe SEB has reached an inflection point in its business as it transitions from a purely development-focused company to a profitable and rapidly growing technology service provider. Through its recent acquisitions, SEB has achieved significant scale and is well positioned to capture meaningful market share in its target markets. At 0.7x 2016e EV/Sales and 9.8x 2016e EV/EBITDA, we believe SEB represents an attractive opportunity with significant growth potential. We are initiating coverage with a Buy rating and $0.80 target price.
Analyst: Christopher Lam
Please Note: Click on the company title to directly view associated research note.
Previously published research notes available at www.paradigmcap.com/research or contact a Paradigm Capital sales representative. Log-in required – register here
Once you have initially logged in, you will not be prompted to repeat the process.
If you wish to unsubscribe from Paradigm Capital’s research, please click here
RESEARCH TEAM
Growth
Daniel Kim (Head of Research) 416.363.6644
Corey Hammill 416.361.0754
Christopher Lam 416.363.9567
J. Marvin Wolff, CFA 416.361.3376Mining & Agriculture
Don MacLean 416.360.3459
David Davidson 416.360.3462
Don Blyth 416.360.3461
Lauren McConnell 416.366.7776
Jeff Woolley, CFA 416.361.9557
Spencer Churchill, CFA 416.361.6056Oil & Gas
Ken Lin, CFA 403.513.1042
Ian Macqueen 403.513.1034
Jason Tucker 403.513.1031Quantitative / Technical Analysis
Tina Normann 416.216.3564
Research Associates
Kevin Archibald 416.368.6150
Jesse MacLean 416.361.0628
Kevin O’Flaherty 416.363.4618
Brian Sorenson 403.513.1032
Bridget Zhang 416.216.3574
SALES TEAM
David Roland 416.216.6844
James Bates 416.363.6228
John Bellamy (Head of Sales) 416.361.6032
Jeffrey Bigelow 416.361.1895
Diane Braxatoris 416.366.5838
Christopher Chang 416.360.5129
Naomi Ebata, CFA 416.364.9764
Tanner Kohara 416.216.3583
Brittney Kuczynski 416.304.6842
Wolfgang Rosner 514.447.8950
Paradigm Capital Inc. Morning Comments

Paradigm Capital Inc, IIROC/TSX member 1 Our disclosure statements are located at the end of this report
June 18, 2015
Financial Summary ($M)
Paradigm Estimates(y/e Nov.30) Revenue EBITDA EPS EV/Rev EV/EBITDA P/EFY14 20.2 (3.3) (0.10) 2.5 x nmf nmfFY15e 53.6 2.9 (0.01) 1.0 x 17.9 x nmfFY16e 69.8 5.3 0.00 0.7 x 9.8 x nmf
Consensus EstimatesFY15e N/A
All figures in C$, unless otherwise noted. Source: Company filings, FactSet Consensus Estimates, Paradigm Capital Inc.
Investment Thesis With a proprietary software platform and pan-Canadian operating presence, we believe Smart Employee Benefits (SEB) is well positioned to capture market share within the multi-billion-dollar benefits industry in Canada. We believe SEB will be able to grow its user base through acquisition and new contract wins.
Highlights $65 billion Canadian health benefits industry: The government-funded and specialty
health benefits market is estimated at ~$27 billion, and the employee group health benefits market is estimated at ~$38 billion. Approximately 10–15% of premiums paid by plan members is directed to back-end claims processing, an outsourced service that is SEB’s focus and core competency.
Unique tech, a fully integrated benefits platform: SEB has developed a unique end-to-end administration and adjudication platform that can manage all benefit types within the same environment (i.e., drugs, dental, extended health, disability, etc). The current industry is composed of many disparate systems and manual processes.
Explosive acquisition‐led growth: SEB has made 9 acquisitions in the past two years for acquired annualized revenue ~$56.6 million. SEB recently announced the acquisition of Maplesoft worth an estimated $50M in additional annualized revenue (not included in our estimates). SEB plans to acquire additional technology companies for unique products, access to customers and additional vendor qualifications. It also plans to acquire profitable Third-Party Administrators (TPAs) that have existing benefits client relationships and contracts.
Positioning itself to be a top government contractor: SEB is already a key technology service provider to the Federal Government with its recently announced acquisition, adding 18 multi-million-dollar contracts (nine with values over $10 million). Acquisitions have improved service offerings and provided additional vendor qualifications that we believe positions SEB as a top government contractor that will drive further growth via contract wins.
Valuation and Conclusion We believe SEB has reached an inflection point in its business as it transitions from a purely development-focused company to a profitable and rapidly growing technology services provider. Through its recent acquisitions, SEB has achieved significant scale and is well positioned to capture meaningful market share in its target markets. At 0.7x 2016e EV/Sales and 9.8x 2016e EV/EBITDA, we believe SEB represents an attractive opportunity with significant growth potential. We are initiating coverage with a Buy rating and $0.80 target price, based on blended 2.0x EV/Sales and 12.0x EV/EBITDA multiples.
Company Profile (C$) Sector SoftwareTicker SEB‐T
Stock Rating BuyClosing Price $0.4512‐Mth Target $0.80Potential ROR 78%
Shares O/S Bsc (M) 87Shares O/S FD (M) 114Mkt Cap, Bsc (M) $39Mkt Cap, FD (M) $52
Cash (M) $3Debt (M) $16Enterprise Value (M) $51
Company Description
Smart Employee Benefits is a technology solutions and services company focused on automating group benefit plan administration and health claims processing environments for government agencies and private corporations. SEB offers its clients a fully integrated software environment for end-to-end health benefits management. SEB is based in Mississauga, ON.
Research Team Christopher Lam, Analyst 416.363.9567
1-Year Stock Chart
Jul Aug Sep Oct Nov Dec Jan Feb Mar Apr May Jun
0.4
0.45
0.5
0.55
0
200
400
600
800
1,000
1,200
1,400
1,600
1,800
2,000
Source: FactSet Prices
Smart Employee Benefits, Inc. (SEB‐CA)Price (CAD) Volume (Thousands)
Volume Smart Employee Benefits, Inc.
Smart Employee Benefits, Inc.
Disruptive Technology in Health Benefits Processing
Paradigm Capital Inc., IIROC/TSX member 2 June 18, 2015
Table of Contents
Health Insurance Industry Primer ......................................................................................... 3
Company Overview ............................................................................................................... 5
Business Strategy .................................................................................................................. 9
Unique Technology and Competitive Strategy ................................................................... 10
Gaining Market Share through Acquisitions ....................................................................... 11
Positioned for Organic Growth via Government Contracts ................................................ 13
Financials ............................................................................................................................ 14
Income Statement .............................................................................................................. 14
Balance Sheet ...................................................................................................................... 16
Cash Flow Statement .......................................................................................................... 17
Valuation – Initiating Coverage with Buy Rating and $0.80 Target Price ........................... 18
Key Risks to Our Price Target .............................................................................................. 19
Appendix 1: Management Profiles ..................................................................................... 20
Appendix 2: Independent Director Profiles ........................................................................ 21

Paradigm Capital Inc., IIROC/TSX member 3 June 18, 2015
Health Insurance Industry Primer
Health and Life Insurance is an industry worth over $90 billion (2013). Group health insurance plans (e.g., drug, disability, dental, physiotherapy, chiropractic, etc.) are the largest single component and represent ~40% ($38 billion) of the total industry premiums (Figure 1). The other segments include pooled benefits, such as group/individual life insurance and other defined annuities. The Insurance provider market is highly concentrated with the top 10 insurance providers controlling over 95% of the claims in Canada. Sun Life (SLF-T NR), Great West Life (GWO-T, NR) and Manulife (MFC-T, NR) are the dominant companies and control 65% of the market. Figure 1: Canadian Health and Life Insurance Industry
Top 10 Canadian Providers
Market Share%
Sun Life 22.3 Great West Life 21.1 Manulife Financial 21.0 Blue Cross 10.0 Desjardin Financial 6.3 SSQ Financial 4.6 Greenshields 4.1 Industrial Alliance 2.8 Standard Life 2.0 La Capitale 1.5
Total 95.7
Source: Company filings, Canadian Life and Health Insurance Association Inc.
In addition to the insurance providers, Third-Party Administrators and benefits brokers/consultants play critical roles in the delivery of benefits plans.
Third‐Party Administrator (TPA): An individual or firm that manages employee group benefit plans on behalf of an employer. TPAs have the expertise to administer the entire claims process — a task historically handled by conventional group insurance carriers. TPAs are responsible for a range of services, from premium administration and billing to a full suite of services, including maintenance of eligibility records, benefits plan documentation and communication, and claims adjudication. For small and mid-sized businesses, a TPA can provide group insurance administrative services more cost effectively
Health Plans are a target market for SEBand represent $38B in premiums paid in 2013
Paradigm Capital Inc., IIROC/TSX member 4 June 18, 2015
and with more flexibility than traditional insurance carriers. While a typical administration fee for traditional insurance carriers is 25–35%, a well-managed TPA will charge 10–50%.
Group Benefits Brokers/Consultants: An individual or firm that advises an employer or plan sponsor in matters relating to group insurance or employee benefits. Benefits consulting firms typically provide their services on a fee-for-service basis.
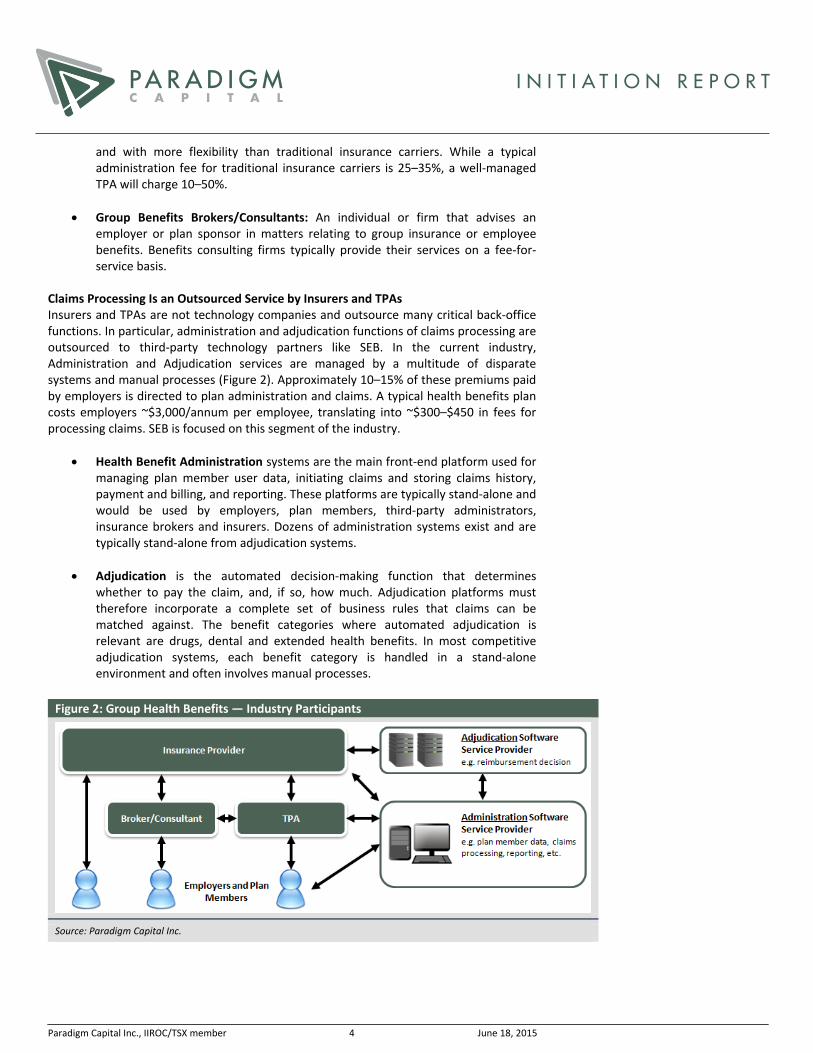
Claims Processing Is an Outsourced Service by Insurers and TPAs Insurers and TPAs are not technology companies and outsource many critical back-office functions. In particular, administration and adjudication functions of claims processing are outsourced to third-party technology partners like SEB. In the current industry, Administration and Adjudication services are managed by a multitude of disparate systems and manual processes (Figure 2). Approximately 10–15% of these premiums paid by employers is directed to plan administration and claims. A typical health benefits plan costs employers ~$3,000/annum per employee, translating into ~$300–$450 in fees for processing claims. SEB is focused on this segment of the industry.
Health Benefit Administration systems are the main front-end platform used for managing plan member user data, initiating claims and storing claims history, payment and billing, and reporting. These platforms are typically stand-alone and would be used by employers, plan members, third-party administrators, insurance brokers and insurers. Dozens of administration systems exist and are typically stand-alone from adjudication systems.
Adjudication is the automated decision-making function that determines
whether to pay the claim, and, if so, how much. Adjudication platforms must therefore incorporate a complete set of business rules that claims can be matched against. The benefit categories where automated adjudication is relevant are drugs, dental and extended health benefits. In most competitive adjudication systems, each benefit category is handled in a stand-alone environment and often involves manual processes.
Figure 2: Group Health Benefits — Industry Participants
Source: Paradigm Capital Inc.

Paradigm Capital Inc., IIROC/TSX member 5 June 18, 2015
Company Overview
Smart Employee Benefits (SEB) was founded in 2011 by John McKimm, CEO, and Robert Prentice, CFO. The pair previously founded Brainhunter, a Canadian provider of professional IT resources, staffing, recruitment, payroll management and other software solutions. Brainhunter was sold to Zylog Systems in 2010 for $35 million and is now part of Fairfax Financial (FFH-T, NR). With deep experience serving both government and corporate clients, SEB was founded as an opportunity to provide unique disruptive technology solutions within a large industry that is ripe for change. SEB’s main focus is to provide technology solutions within the health benefits industry, particularly claims administration and adjudication. Until recently, the company was focused on developing its unique end-to-end health benefits platform by integrating claims processing functionality that is traditionally handled by multiple systems and multiple vendors. By 2013, the core platform was largely complete and SEB began executing on an acquisition-led growth strategy that would provide new functionality, operational infrastructure, scale, immediate revenue and new sales channels. SEB has made 10 strategic acquisitions since 2013 to become a competitive solution provider to both government and corporate clients (Figure 3).
Figure 3: SEB Corporate Timeline
2010 2011 2012 2013 2014 2015 2016
Feb 2013: Acquires Logitek Technologies
Development Phase
Dec 2013: Acquires 50% of Informica
Mar 2014: Acquires Antian Professional Services
Jun 2014: Acquires Stroma Service Consulting
Sep 2014: Acquires Adeeva/Meschino Health and Wellness
Nov 2014: Acquires Banyan Work Health Solutions
Feb 2015: Acquires SEB Benefits & HR Consulting
Mar2013: Acquires SOMOS Consulting Group
Mar 2015: Acquires Paradigm Consulting Group
Growth Phase
Jun 2015:Acquires Maplesoft Group
Source: Company filings, Paradigm Capital Inc.
SEB now has ~300 employees with offices in Mississauga (head office), Ottawa, North Bay, Regina, Winnipeg and Vancouver. SEB has an additional 57 employees across India, United Arab Emirates and Australia.

Paradigm Capital Inc., IIROC/TSX member 6 June 18, 2015
Through its national footprint, SEB has acquired an extensive customer base with public and private sector clients (Figure 4). The client mix provides diversification benefits and reduces revenue concentration around key customers. Figure 4: Select SEB Clients
Insurance Industry Clients Public Sector ClientsGreat-West Life
Canada Life Crown Life
Investors Group Manulife
Wawanesa Insurance London Life
Workers Compensation Board of Manitoba Saskatchewan Workers Compensation Board
The Co-operators Group
Public Safety CanadaRCMP
Shared Services Canada Health Canada
Citizenship & Immigration Canada SaskPower
SaskTel Canadian Institute of Health Research
York University Ryerson University
Government of Saskatchewan
Source: Company filings
SEB has two interdependent business segments (group benefits and technology) and delivers services to clients via Software-as-a-Service (SaaS) and Business Process Outsourcing (BPO) models.
Figure 5: SEB Functional Operations Overview
Source: Company filings

Paradigm Capital Inc., IIROC/TSX member 7 June 18, 2015
Group Benefits Division — Plan Administration and Claims Processing SEB operates as a TPA of group benefits and manages the planning and delivery of benefits to plan members. This includes the consulting services related to plan design, as well as managing the day-to-day operations of maintaining plan member accounts. SEB is an end-to-end solution provider and also offers both the back-office technology platform that supports the front-office sales and consulting services. SEB handles all benefit types, including dental, drug, travel claims, student benefits and disability management. Services are delivered via four segments (segment reflects company names at acquisition):
Segment Description
SES Benefits Benefits Software Platform SEB’s proprietary health benefits administration and adjudication platform delivered via SaaS model.
SEB Benefits and HR Consulting (50% ownership)
Benefits Consulting Services Consulting practice providing innovative consulting services and solutions for corporate and government clients in the areas of group and health benefits, retirement plans and human resources.
Banyan (50% ownership)
Disability Management TPA and Software PlatformA TPA providing absence-management services to employers and disability insurers. Banyan typically assists employees with stay-at-work and return-to-work solutions via a variety of behavioural and physical assessment and treatment services. Acquired in Q1/15, Banyan also provided SEB with an industry-leading case-management software platform.
Adeeva/Meschino Health and Wellness (75% ownership in Meschino)
Web‐based Health and Wellness Platform A content-rich individual health management platform providing educational information, personal health assessments and specialized nutritional supplements.
Paradigm Capital Inc., IIROC/TSX member 8 June 18, 2015
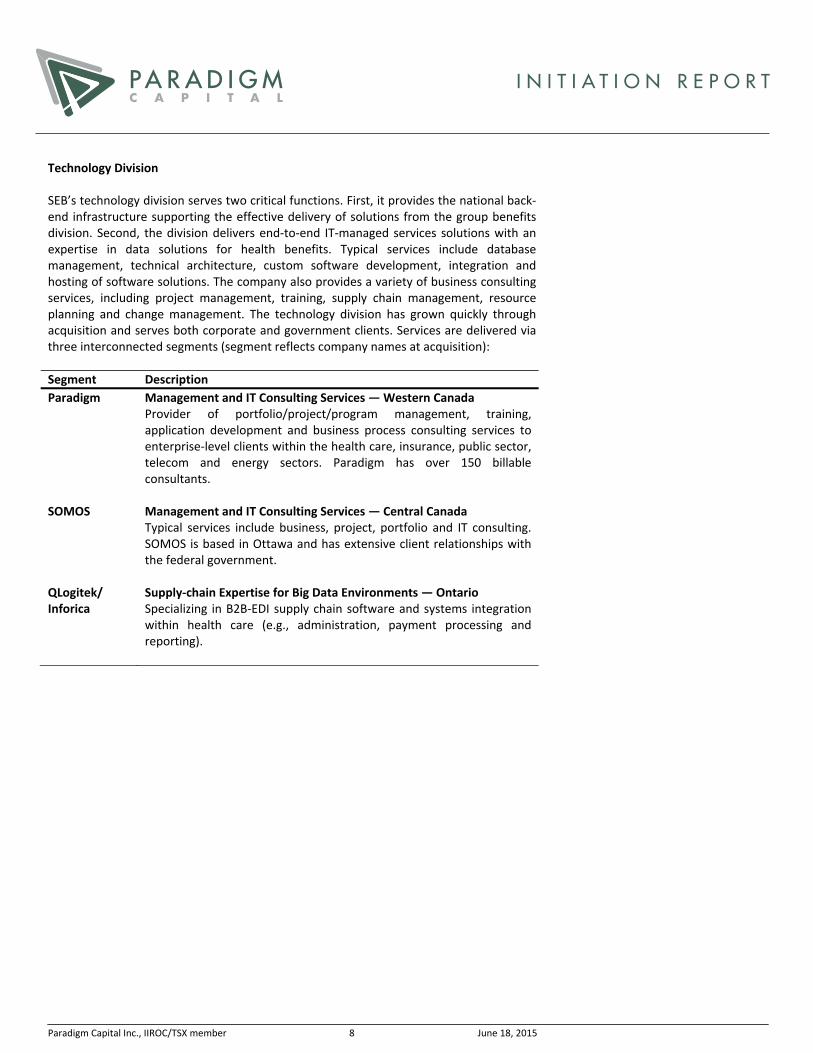
Technology Division SEB’s technology division serves two critical functions. First, it provides the national back-end infrastructure supporting the effective delivery of solutions from the group benefits division. Second, the division delivers end-to-end IT-managed services solutions with an expertise in data solutions for health benefits. Typical services include database management, technical architecture, custom software development, integration and hosting of software solutions. The company also provides a variety of business consulting services, including project management, training, supply chain management, resource planning and change management. The technology division has grown quickly through acquisition and serves both corporate and government clients. Services are delivered via three interconnected segments (segment reflects company names at acquisition): Segment Description
Paradigm Management and IT Consulting Services —Western CanadaProvider of portfolio/project/program management, training, application development and business process consulting services to enterprise-level clients within the health care, insurance, public sector, telecom and energy sectors. Paradigm has over 150 billable consultants.
SOMOS Management and IT Consulting Services — Central CanadaTypical services include business, project, portfolio and IT consulting. SOMOS is based in Ottawa and has extensive client relationships with the federal government.
QLogitek/ Inforica
Supply‐chain Expertise for Big Data Environments — OntarioSpecializing in B2B-EDI supply chain software and systems integration within health care (e.g., administration, payment processing and reporting).

Paradigm Capital Inc., IIROC/TSX member 9 June 18, 2015
Business Strategy
Business Strategy to Date: Building the Platform and Scaling Up Between 2011 and 2013, SEB was a purely development-focused company investing heavily in R&D to build its unique health benefits administration and adjudication platform. The company initiated an aggressive acquisition program in 2013 to achieve operational scale and acquire customers for its new platform. A majority of its acquisitions have been IT-managed services firms with strategic assets that improve the platform or the competitiveness through vendor qualifications (client contracts, references, security clearance, project experience, etc.). Additionally, the company has been focused on restructuring and integrating its acquisitions. SEB has also divested divisions that do not fit within its strategy moving forward. Strategy Moving Forward: Growing User Base through Acquisition and RFP wins SEB plans to accelerate its acquisition growth strategy in two large target markets:
Target Market 1: Employee Group Health Benefits This market includes insurance plans provided by employers to their employees. Plans may include pooled benefits (life insurance, disability, etc.), health benefits (drug, health and wellness, etc.) and dental benefits. Based on total value of claims, this market was worth ~$38 billion in 2013. Within this market, SEB plans to acquire profitable brokers/TPAs and transfer their vendor relationships and client base to SEB’s own platform. This effectively turns what was previously a cost centre for a TPA into a profit centre.
Target Market 2: Government‐funded and Specialty Health Benefits
Government-funded benefits include Workers Compensation boards (12 in Canada with >$10 billion in claims), federal and provincial government health plans (aboriginal, dental, drugs, military, RCMP, etc.), hospitals, and public and private Crown corporations. Within this market, SEB plans to acquire companies with existing client contracts/relationships and vendor qualifications. With its pending acquisition of Maplesoft, SEB is also well positioned for new contract wins.

Paradigm Capital Inc., IIROC/TSX member 10 June 18, 2015
Unique Technology and Competitive Strategy
Although SEB is a relative newcomer to the health benefits arena, we believe its platform is a differentiated product that could quickly drive meaningful market penetration. Companies within the health benefits industry generally provide either administration only or adjudication-only systems. SEB is one of the few available solutions that effectively integrate both functions and is the only platform capable of processing multiple benefit types in the same environment (i.e., drug, dental, disability, etc). Figure 6: SEB Benefits Claims Platform Overview
Source: Company filings
The administration system market is highly fragmented and highly competitive with dozens of small vendors each controlling minimal market share. At the other end of the spectrum, the adjudication services market is highly concentrated with several large firms controlling the majority of the drug and dental claims in Canada. TELUS (T-T, NR) is the largest adjudication vendor with both Sun Life and Great West Life as clients. The TELUS platform adjudicates roughly 45% of drug claims and 25–35% of dental and paramedical claims in Canada. Express Scripts (ESRX-Q, NR) controls roughly 20% of the market via its major client Manulife. Claims Secure and Greenshield each have ~5% market share. Given the competitive nature of this industry, we believe SEB’s strategy of acquiring TPAs avoids direct sales competition. SEB is moving upstream and effectively acquiring control of the outsourcing decision maker. Once acquired, SEB can naturally transition vendor relationships and all clients to its own back-office environments.

Paradigm Capital Inc., IIROC/TSX member 11 June 18, 2015
Gaining Market Share through Acquisitions
Acquisitions have been a critical component of SEB’s strategy as it has provided the company with technological advancements, complementary product offerings, key client contracts and a pan-Canadian operating presence. SEB’s most recent acquisitions of Paradigm and Maplesoft are transformational, adding significant scale, extensive government client contracts and over $106 million in projected annualized revenue (Figure 7). Figure 7: Recent Acquisitions
Annualized Price/ Strategic Value
Acquired Company
Sales at Acq.
(C$M)
Annualized
Sales SEB Division
Access to
Customers
Technoloy
Solutions
Strategic
Relationships Profitable
QLogitek Technologies 4.0 0.7x Technology • • • •SOMOS Consulting Group 7.5 0.2x Technology • • • •Inforica 2.0 0.4x Technology • • • •Antian Professional Services 1.0 0.7x Technology • • •Stroma Service Consulting 6.0 0.3x Technology • • •Adeeva/Meschino Health and Wellness 1.9 0.6x Benefits • • • •Banyan 10.0 0.3x Benefits • • • •SEB Benefits & HR consulting 0.2 0.6x Benefits • • •Paradigm Consulting Group 24.0 0.7x Technology • • • •Maplesoft Group Inc. 50.0 0.4x Technology • • • •
Toral 106.6
Average 0.5x
Source: Company filings
Moving forward, SEB’s strategy will be focused on acquiring a claims customer base and expanding technological expertise and platform offerings. We believe this is the fastest way to growth and exploit the inherent leverage of a SaaS-based platform. Acquisition targets may span both benefits and technology divisions and fit one or more of the following criteria:
Access to customers (TPAs/brokers/consultants): Rather than direct sales competition with technology competitors, SEB is focusing on acquiring TPA/brokers/consultants, as these groups have existing benefit clients that are the back-office outsourcing decision makers.
Technology Solutions: Acquired technology should be complementary to SEB’s health care solution offerings. Non-complementary solutions will be wound down or divested.
Strategic Relationships: Acquisition targets with security clearances, government client references and vendor contract relationships that can be transferred to SEB and its operating divisions.
Profitable: Acquisition targets should be profitable at acquisition so that they are immediately accretive to SEB.
Acquisition Price and Currency: SEB is willing to pay 2–5x EBITDA for acquisitions that fit at least one of the above criteria. In line with past acquisitions, SEB plans to utilize a combination of cash, SEB shares, vendor take-backs and retention warrants as currency for deals.

Paradigm Capital Inc., IIROC/TSX member 12 June 18, 2015
Blue Sky: Unions Contracts Although opportunistic, we believe unions represent one of the greatest sources of growth for SEB’s claims processing platform and that it will pursue TPAs serving the major unions. Despite declining membership, unions continue to represent ~30% of Canadian workers (Figure 8). This translates into ~$14 billion in premiums and an addressable market of $1.4–$2.0 billion for SEB (assuming a $3,000 annual premium per employee and 10–15% paid for claims processing). We have highlighted select TPAs serving Canadian unions and employee associations that could be acquisition targets for SEB (Figure 9). Figure 8: Union Coverage Rate in Canada, 1997–2013
35
33 3332
32 31
31 3131 31
31 3130
31
3030 30
27
28
29
30
31
32
33
34
35
Percentage
Source: Government of Canada
Figure 9: Potential TPA Targets
Company Name Head Office Select Client Contracts
Benefits Plan Administration Limited (BPA)
Mississauga, ON International Union of Operating Engineers Ontario Teamsters Benefit Trust
McAteer Group of Companies Markham, ON Canadian Brotherhood of Boilermakers Edmonton Pipe Industry Union Sheet Metal Workers International Association
Manion Wilkins Toronto, ON Canadian Elevator Industry Union Ironworkers Benefit Trust United Brotherhood of Carpenters
Mosey Mosey Mississauga, ON Town of Richmond Hill Town of Hanover Bruce Country
Prudent Benefits Administration (PBAS)
Toronto, ON United Food and Commercial Workers Union Cape Bretton University Student Union City of Edmonton
Source: Paradigm Capital Inc.
Paradigm Capital Inc., IIROC/TSX member 13 June 18, 2015
Positioned for Organic Growth via Government Contracts
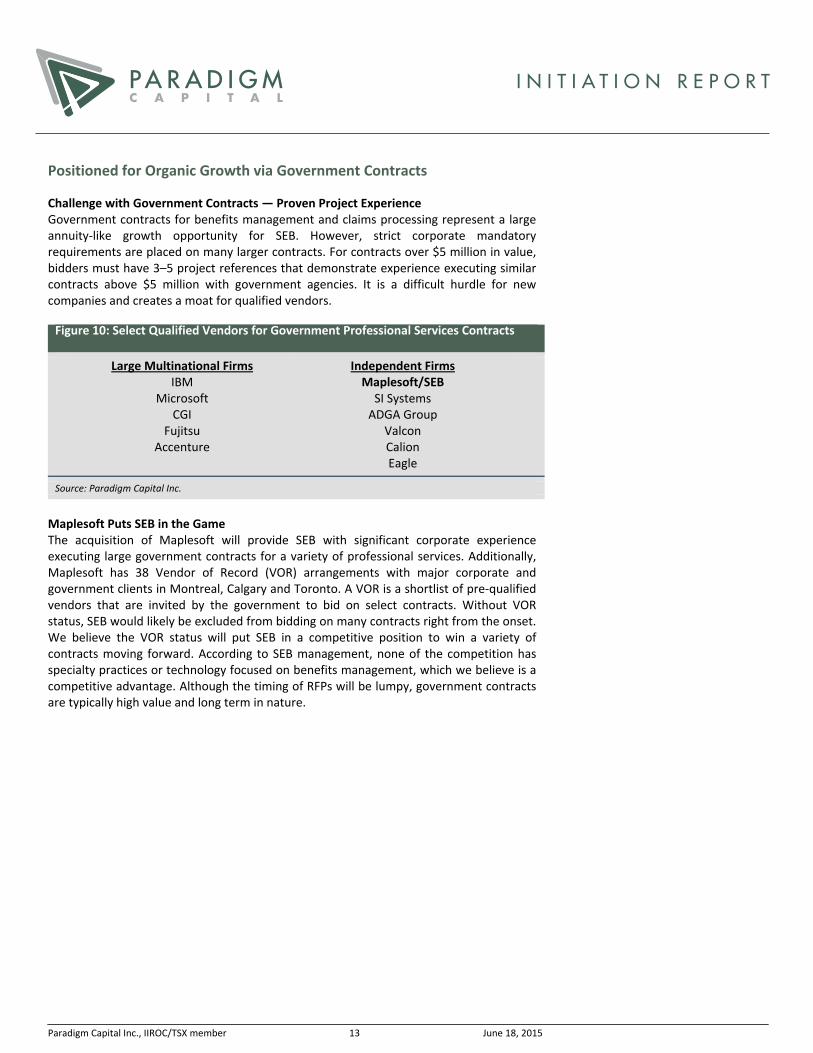
Challenge with Government Contracts — Proven Project Experience Government contracts for benefits management and claims processing represent a large annuity-like growth opportunity for SEB. However, strict corporate mandatory requirements are placed on many larger contracts. For contracts over $5 million in value, bidders must have 3–5 project references that demonstrate experience executing similar contracts above $5 million with government agencies. It is a difficult hurdle for new companies and creates a moat for qualified vendors. Figure 10: Select Qualified Vendors for Government Professional Services Contracts
Large Multinational Firms Independent FirmsIBM
Microsoft CGI
Fujitsu Accenture
Maplesoft/SEBSI Systems
ADGA Group Valcon Calion Eagle
Source: Paradigm Capital Inc.
Maplesoft Puts SEB in the Game The acquisition of Maplesoft will provide SEB with significant corporate experience executing large government contracts for a variety of professional services. Additionally, Maplesoft has 38 Vendor of Record (VOR) arrangements with major corporate and government clients in Montreal, Calgary and Toronto. A VOR is a shortlist of pre-qualified vendors that are invited by the government to bid on select contracts. Without VOR status, SEB would likely be excluded from bidding on many contracts right from the onset. We believe the VOR status will put SEB in a competitive position to win a variety of contracts moving forward. According to SEB management, none of the competition has specialty practices or technology focused on benefits management, which we believe is a competitive advantage. Although the timing of RFPs will be lumpy, government contracts are typically high value and long term in nature.
Paradigm Capital Inc., IIROC/TSX member 14 June 18, 2015
Financials
Income Statement
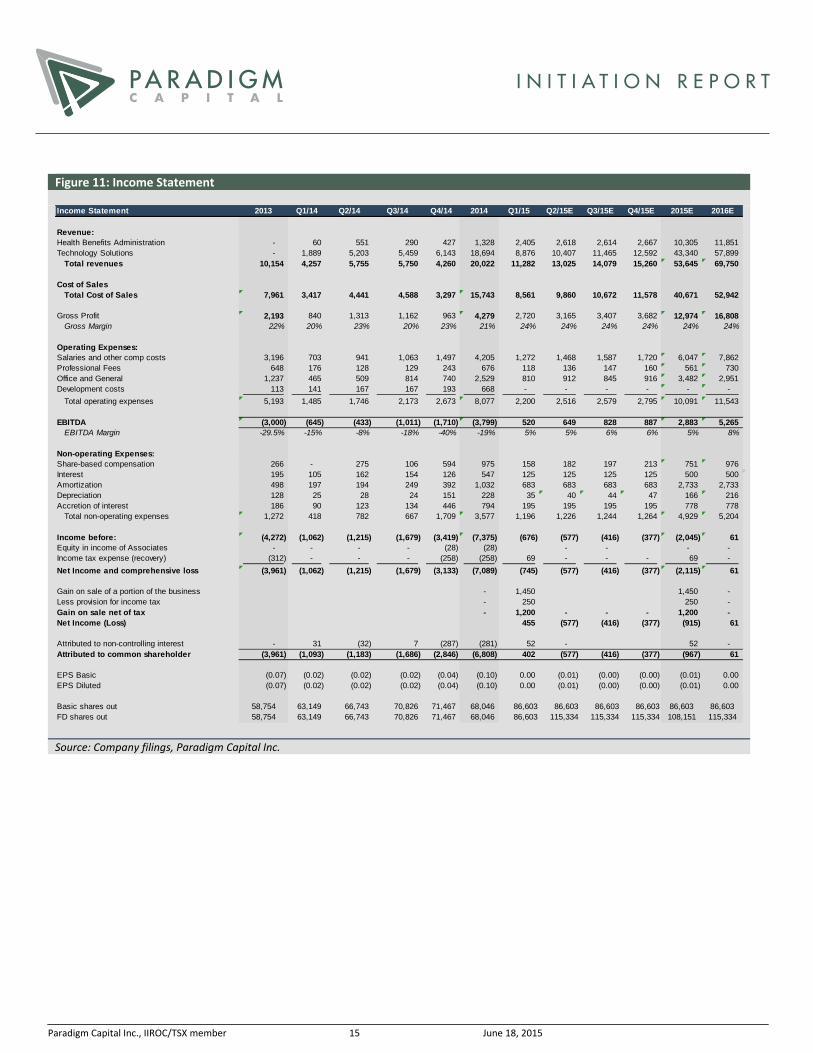
First Profitable Quarter – A Key Milestone Q1/15 was SEB’s first profitable quarter with EBITDA of $520,000 on $11.3 million in total revenue (4.6% margin). We believe this was the key turning point for the company, signifying a transition from a purely development-focused company to a profitable services provider. We believe SEB will continue to generate positive EBITDA as it executes its strategy of rolling up profitable firms. Explosive Revenue Growth from Acquisitions The revenue growth in 2014 (98% year-over-year) and expected revenue growth for 2015 (165% year-over-year) are almost entirely owing to acquisitions. We forecast revenue of $53.6 million and $69.8 million in FY15 and FY16, respectively. This includes estimated revenue from closed acquisitions and contract wins. We have not included expected acquisitions. We have made conservative assumptions on organic growth as we wait to see evidence of client on-boarding to SEB’s claims platform. Gross and EBITDA Margins Differ by Division Gross margins within the group benefits division have higher potential for expansion as SEB’s claims platform is delivered via a SaaS model. We forecast gross margins for the benefits division to remain flat at ~30% until a significant number of users are on-boarded to the system. However, we do believe gross margins for the division could reach 50–60% longer term. Because of the TPA sales and consulting component of the benefits division, we do not expect SEB to achieve 80–90% gross margins, as seen by pure-play SaaS providers. We forecast EBITDA margins for the benefits division to remain flat. Leverage to our margin forecasts may be driven by revenue generated by the claims platform. Within the technology division, employee compensation is the largest cost of sales. We believe the gross margins in this division may cap at 25% if SEB uses an employee-only model. Gross margins for consultants are ~15%. We expect gross margins may fluctuate between 15% and 25% based on use of consultants. We forecast technology division gross margins of 23% through FY15 and FY16. Maplesoft Acquisition Provides Upside to Our Numbers To be conservative, we have not included the positive impact of the announced Maplesoft acquisition. SEB is currently performing due diligence and we do not expect the transaction to close for several months. That said, the Maplesoft acquisition leaves room for upside to our numbers. The closing of this acquisition could provide up to $50 million in revenue in FY16. We will update our numbers once we are reasonably assured the transaction will close.
Paradigm Capital Inc., IIROC/TSX member 15 June 18, 2015
Figure 11: Income Statement Income Statement 2013 Q1/14 Q2/14 Q3/14 Q4/14 2014 Q1/15 Q2/15E Q3/15E Q4/15E 2015E 2016E
Revenue:Health Benefits Administration - 60 551 290 427 1,328 2,405 2,618 2,614 2,667 10,305 11,851 Technology Solutions - 1,889 5,203 5,459 6,143 18,694 8,876 10,407 11,465 12,592 43,340 57,899
Total revenues 10,154 4,257 5,755 5,750 4,260 20,022 11,282 13,025 14,079 15,260 53,645 69,750
Cost of SalesTotal Cost of Sales 7,961 3,417 4,441 4,588 3,297 15,743 8,561 9,860 10,672 11,578 40,671 52,942
Gross Profit 2,193 840 1,313 1,162 963 4,279 2,720 3,165 3,407 3,682 12,974 16,808 Gross Margin 22% 20% 23% 20% 23% 21% 24% 24% 24% 24% 24% 24%
Operating Expenses:Salaries and other comp costs 3,196 703 941 1,063 1,497 4,205 1,272 1,468 1,587 1,720 6,047 7,862 Professional Fees 648 176 128 129 243 676 118 136 147 160 561 730 Office and General 1,237 465 509 814 740 2,529 810 912 845 916 3,482 2,951 Development costs 113 141 167 167 193 668 - - - - - -
Total operating expenses 5,193 1,485 1,746 2,173 2,673 8,077 2,200 2,516 2,579 2,795 10,091 11,543
EBITDA (3,000) (645) (433) (1,011) (1,710) (3,799) 520 649 828 887 2,883 5,265 EBITDA Margin -29.5% -15% -8% -18% -40% -19% 5% 5% 6% 6% 5% 8%
Non-operating Expenses:Share-based compensation 266 - 275 106 594 975 158 182 197 213 751 976 Interest 195 105 162 154 126 547 125 125 125 125 500 500 Amortization 498 197 194 249 392 1,032 683 683 683 683 2,733 2,733 Depreciation 128 25 28 24 151 228 35 40 44 47 166 216 Accretion of interest 186 90 123 134 446 794 195 195 195 195 778 778
Total non-operating expenses 1,272 418 782 667 1,709 3,577 1,196 1,226 1,244 1,264 4,929 5,204
Income before: (4,272) (1,062) (1,215) (1,679) (3,419) (7,375) (676) (577) (416) (377) (2,045) 61 Equity in income of Associates - - - - (28) (28) - - - - Income tax expense (recovery) (312) - - - (258) (258) 69 - - - 69 -
Net Income and comprehensive loss (3,961) (1,062) (1,215) (1,679) (3,133) (7,089) (745) (577) (416) (377) (2,115) 61
Gain on sale of a portion of the business - 1,450 1,450 - Less provision for income tax - 250 250 - Gain on sale net of tax - 1,200 - - - 1,200 - Net Income (Loss) 455 (577) (416) (377) (915) 61
Attributed to non-controlling interest - 31 (32) 7 (287) (281) 52 - 52 - Attributed to common shareholder (3,961) (1,093) (1,183) (1,686) (2,846) (6,808) 402 (577) (416) (377) (967) 61
EPS Basic (0.07) (0.02) (0.02) (0.02) (0.04) (0.10) 0.00 (0.01) (0.00) (0.00) (0.01) 0.00 EPS Diluted (0.07) (0.02) (0.02) (0.02) (0.04) (0.10) 0.00 (0.01) (0.00) (0.00) (0.01) 0.00
Basic shares out 58,754 63,149 66,743 70,826 71,467 68,046 86,603 86,603 86,603 86,603 86,603 86,603FD shares out 58,754 63,149 66,743 70,826 71,467 68,046 86,603 115,334 115,334 115,334 108,151 115,334
Source: Company filings, Paradigm Capital Inc.

Paradigm Capital Inc., IIROC/TSX member 16 June 18, 2015
Balance Sheet
At the end of Q1/15, SEB had $3.2 million in cash and net debt of $12.5 million. Leverage is not yet a concern at 1.1x net debt/EBITDA, but could be a concern moving forward should SEB use a greater proportion of debt to finance its acquisitions. Figure 12: Balance Sheet Balance Sheet 2013 2014 Q1/15 Q2/15E Q3/15E Q4/15E 2015Assets
Cash 258 403 3,233 3,402 4,052 4,756 4,756
Funds in lawyer's trust account - - 1,500 1,500 1,500 1,500 1,500
Short term investments - - - - - - - Accounts receivable 2,552 5,093 10,721 10,721 10,721 10,721 10,721 Inventory - 96 65 99 107 116 116 Prepaids and deposits 82 465 755 1,149 1,242 1,346 1,346
Total current assets 2,892 6,057 16,274 16,871 17,622 18,439 18,439
Advances to acquisition target 750 - - - - - - Long-term deposits - 275 275 275 275 275 275 Investments in associates - 3,301 68 68 68 68 68 Equipment 472 623 1,005 965 921 874 874 Software 1,741 1,990 3,097 3,097 3,097 3,097 3,097 Intellectual property - 93 90 90 90 90 90 Customer relationships 1,094 2,014 6,326 6,326 6,326 6,326 6,326 Trade Names 705 1,235 5,599 5,599 5,599 5,599 5,599 Goodwill 1,148 3,283 6,723 6,723 6,723 6,723 6,723 Accumulated amortization - - (683) (1,367) (2,050) (2,050) Total assets 8,801 18,871 39,457 39,330 39,355 39,440 39,440
Liabilities
Bank loan 847 1,482 1,391 1,391 1,391 1,391 1,391 Accounts payable 1,896 4,505 6,099 6,099 6,099 6,099 6,099 Deferred revenue 356 722 554 639 691 749 749 Current portion of equipment leases payable 97 35 23 23 23 23 23 Current portion of equipment loans 74 33 26 26 26 26 26 Current portion of convertible debt - 679 1,737 1,737 1,737 1,737 1,737 Current portion of contingent consideration payable - 94 90 90 90 90 90 Government remittances and current taxes payable 20 775 1,024 1,024 1,024 1,024 1,024 Short term notes due to shareholders 5 7 9,270 9,270 9,270 9,270 9,270
Total current liabilities 3,295 8,331 20,214 20,299 20,351 20,409 20,409 - -
Leases payable 37 9 4 (6) (9) (12) (12) Royalty liability - - - - - - - Contingent liability - 1,138 3,159 3,159 3,159 3,159 3,159 Equipment loans - - (2) (2) (2) (2) Convertible debt 2,628 4,010 3,309 3,309 3,309 3,309 3,309 Deferred income taxes 571 865 836 836 836 836 836 Preferred Shares 350 350 350 350 350 350 Accreted Interest - 195 389 584 584
Total non-current liabilities 3,236 6,371 7,658 7,840 8,032 8,223 8,223
Total liabilities 6,531 14,703 27,872 28,140 28,383 28,632 28,632
Shareholders' Equity
Share capital 7,879 15,093 19,998 20,180 20,377 20,591 20,591 Share issue costs (505) (613) (613) (613) (613) (613) (613) Contributed surplus 724 926 1,309 1,309 1,309 1,309 1,309 Warrants 2,553 3,693 3,996 3,996 3,996 3,996 3,996 Options 311 1,255 1,413 1,413 1,413 1,413 1,413 Retained Earnings (8,692) (15,500) (15,098) (15,675) (16,090) (16,467) (16,467)
Total shareholders' equity 2,271 4,855 11,005 10,610 10,392 10,228 10,228
Non-controlling interest in subsidiaries - (686) 580 580 580 580 580 Total liabilities and shareholders' equity 8,801 18,871 39,457 39,330 39,355 39,440 39,440 Source: Company filings, Paradigm Capital Inc.
Paradigm Capital Inc., IIROC/TSX member 17 June 18, 2015
Cash Flow Statement
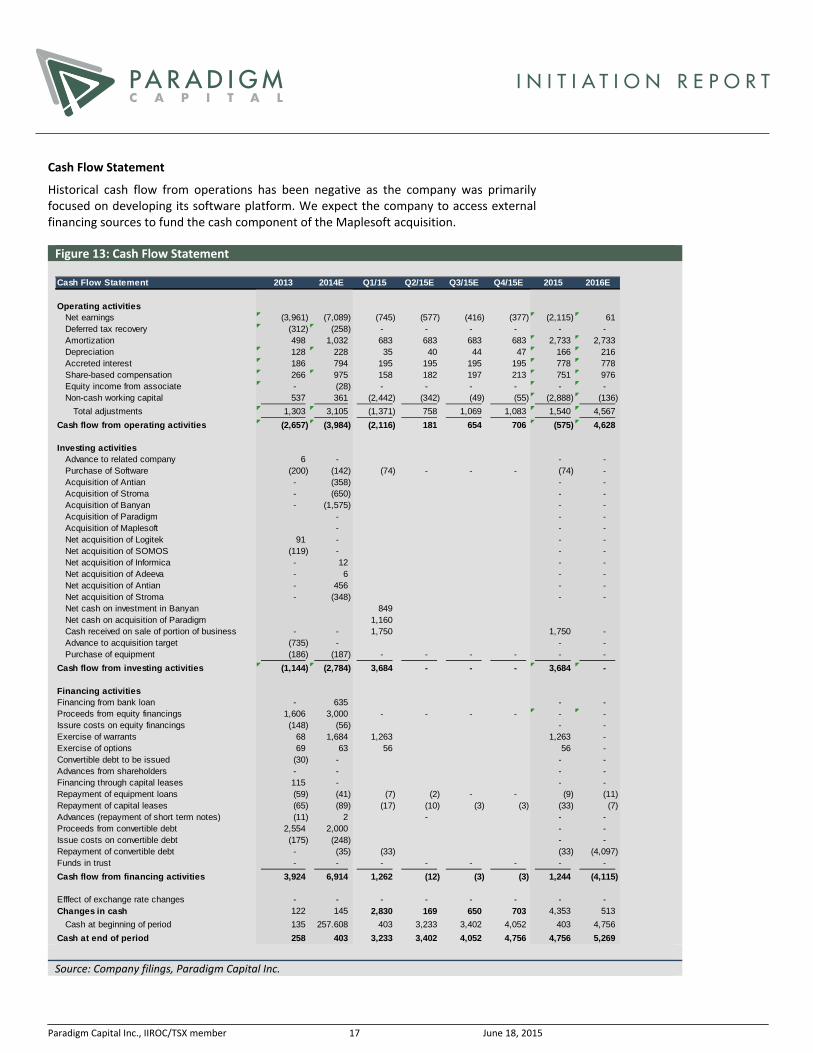
Historical cash flow from operations has been negative as the company was primarily focused on developing its software platform. We expect the company to access external financing sources to fund the cash component of the Maplesoft acquisition. Figure 13: Cash Flow Statement Cash Flow Statement 2013 2014E Q1/15 Q2/15E Q3/15E Q4/15E 2015 2016E
Operating activitiesNet earnings (3,961) (7,089) (745) (577) (416) (377) (2,115) 61 Deferred tax recovery (312) (258) - - - - - - Amortization 498 1,032 683 683 683 683 2,733 2,733 Depreciation 128 228 35 40 44 47 166 216 Accreted interest 186 794 195 195 195 195 778 778 Share-based compensation 266 975 158 182 197 213 751 976 Equity income from associate - (28) - - - - - - Non-cash working capital 537 361 (2,442) (342) (49) (55) (2,888) (136)
Total adjustments 1,303 3,105 (1,371) 758 1,069 1,083 1,540 4,567
Cash flow from operating activities (2,657) (3,984) (2,116) 181 654 706 (575) 4,628
Investing activitiesAdvance to related company 6 - - - Purchase of Software (200) (142) (74) - - - (74) - Acquisition of Antian - (358) - - Acquisition of Stroma - (650) - - Acquisition of Banyan - (1,575) - - Acquisition of Paradigm - - - Acquisition of Maplesoft - - - Net acquisition of Logitek 91 - - - Net acquisition of SOMOS (119) - - - Net acquisition of Informica - 12 - - Net acquisition of Adeeva - 6 - - Net acquisition of Antian - 456 - - Net acquisition of Stroma - (348) - - Net cash on investment in Banyan 849 Net cash on acquisition of Paradigm 1,160 Cash received on sale of portion of business - - 1,750 1,750 - Advance to acquisition target (735) - - - Purchase of equipment (186) (187) - - - - - -
Cash flow from investing activities (1,144) (2,784) 3,684 - - - 3,684 -
Financing activitiesFinancing from bank loan - 635 - - Proceeds from equity financings 1,606 3,000 - - - - - - Issure costs on equity financings (148) (56) - - Exercise of warrants 68 1,684 1,263 1,263 - Exercise of options 69 63 56 56 - Convertible debt to be issued (30) - - - Advances from shareholders - - - - Financing through capital leases 115 - - - Repayment of equipment loans (59) (41) (7) (2) - - (9) (11) Repayment of capital leases (65) (89) (17) (10) (3) (3) (33) (7) Advances (repayment of short term notes) (11) 2 - - - Proceeds from convertible debt 2,554 2,000 - - Issue costs on convertible debt (175) (248) - - Repayment of convertible debt - (35) (33) (33) (4,097) Funds in trust - - - - - - - -
Cash flow from financing activities 3,924 6,914 1,262 (12) (3) (3) 1,244 (4,115)
Efffect of exchange rate changes - - - - - - - - Changes in cash 122 145 2,830 169 650 703 4,353 513
Cash at beginning of period 135 257.608 403 3,233 3,402 4,052 403 4,756
Cash at end of period 258 403 3,233 3,402 4,052 4,756 4,756 5,269 Source: Company filings, Paradigm Capital Inc.
Paradigm Capital Inc., IIROC/TSX member 18 June 18, 2015
Valuation — Initiating Coverage with a Buy Rating and $0.80 Target
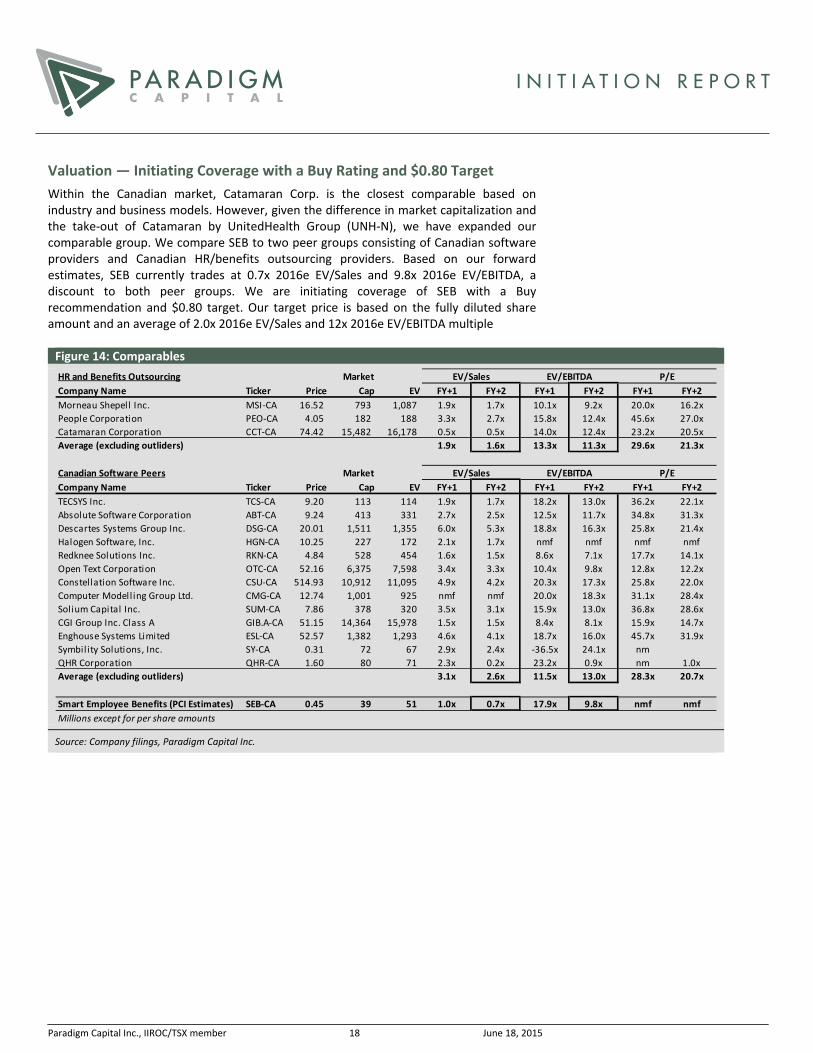
Within the Canadian market, Catamaran Corp. is the closest comparable based on industry and business models. However, given the difference in market capitalization and the take-out of Catamaran by UnitedHealth Group (UNH-N), we have expanded our comparable group. We compare SEB to two peer groups consisting of Canadian software providers and Canadian HR/benefits outsourcing providers. Based on our forward estimates, SEB currently trades at 0.7x 2016e EV/Sales and 9.8x 2016e EV/EBITDA, a discount to both peer groups. We are initiating coverage of SEB with a Buy recommendation and $0.80 target. Our target price is based on the fully diluted share amount and an average of 2.0x 2016e EV/Sales and 12x 2016e EV/EBITDA multiple Figure 14: Comparables
HR and Benefits Outsourcing Market EV/Sales EV/EBITDA P/E
Company Name Ticker Price Cap EV FY+1 FY+2 FY+1 FY+2 FY+1 FY+2
Morneau Shepell Inc. MSI-CA 16.52 793 1,087 1.9x 1.7x 10.1x 9.2x 20.0x 16.2xPeople Corporation PEO-CA 4.05 182 188 3.3x 2.7x 15.8x 12.4x 45.6x 27.0xCatamaran Corporation CCT-CA 74.42 15,482 16,178 0.5x 0.5x 14.0x 12.4x 23.2x 20.5xAverage (excluding outliders) 1.9x 1.6x 13.3x 11.3x 29.6x 21.3x
Canadian Software Peers Market EV/Sales EV/EBITDA P/E
Company Name Ticker Price Cap EV FY+1 FY+2 FY+1 FY+2 FY+1 FY+2
TECSYS Inc. TCS-CA 9.20 113 114 1.9x 1.7x 18.2x 13.0x 36.2x 22.1xAbsolute Software Corporation ABT-CA 9.24 413 331 2.7x 2.5x 12.5x 11.7x 34.8x 31.3xDescartes Systems Group Inc. DSG-CA 20.01 1,511 1,355 6.0x 5.3x 18.8x 16.3x 25.8x 21.4xHalogen Software, Inc. HGN-CA 10.25 227 172 2.1x 1.7x nmf nmf nmf nmfRedknee Solutions Inc. RKN-CA 4.84 528 454 1.6x 1.5x 8.6x 7.1x 17.7x 14.1xOpen Text Corporation OTC-CA 52.16 6,375 7,598 3.4x 3.3x 10.4x 9.8x 12.8x 12.2xConstellation Software Inc. CSU-CA 514.93 10,912 11,095 4.9x 4.2x 20.3x 17.3x 25.8x 22.0xComputer Modell ing Group Ltd. CMG-CA 12.74 1,001 925 nmf nmf 20.0x 18.3x 31.1x 28.4xSolium Capital Inc. SUM-CA 7.86 378 320 3.5x 3.1x 15.9x 13.0x 36.8x 28.6xCGI Group Inc. Class A GIB.A-CA 51.15 14,364 15,978 1.5x 1.5x 8.4x 8.1x 15.9x 14.7xEnghouse Systems Limited ESL-CA 52.57 1,382 1,293 4.6x 4.1x 18.7x 16.0x 45.7x 31.9xSymbil ity Solutions, Inc. SY-CA 0.31 72 67 2.9x 2.4x -36.5x 24.1x nmQHR Corporation QHR-CA 1.60 80 71 2.3x 0.2x 23.2x 0.9x nm 1.0xAverage (excluding outliders) 3.1x 2.6x 11.5x 13.0x 28.3x 20.7x
Smart Employee Benefits (PCI Estimates) SEB‐CA 0.45 39 51 1.0x 0.7x 17.9x 9.8x nmf nmf
Millions except for per share amounts
Source: Company filings, Paradigm Capital Inc.

Paradigm Capital Inc., IIROC/TSX member 19 June 18, 2015
Key Risks to Our Price Target
Competition: Employee health benefits administration and adjudication is a highly competitive industry in Canada with many deep-rooted relationships. Several competitors have significant control of the claims market that SEB is entering. Similarly, government contracts are also highly competitive and subject to public tender. In both markets, SEB competes with large bidders against other large incumbent firms with significant resource and financial flexibility.
Fee‐for‐Service Contracts: A significant portion of SEB’s project revenue comes from IT professional services contracts that are delivered on a “time and materials” model. As such, SEB is exposed to fluctuations in demand for professional services.
Regulatory Changes: The insurance industry in Canada is regulated by both the federal and provincial governments. As such, unforeseen regulatory changes may require SEB to alter its business practices.
Debt Levels: SEB utilizes debt as a source of financing for acquisitions. At the end of
Q1/15, SEB had ~$15 million in total debt and a net debt/EBITDA ratio of 1.1x. The company’s acquisition strategy may lead to risky debt levels, which could lead to dilutive equity issues.

Paradigm Capital Inc., IIROC/TSX member 20 June 18, 2015
Appendix 1: Management Profiles
John McKimm – CEO, President, CIO: Mr. McKimm has over 35 years of experience as a director and officer of public and private companies where he provided operations, investment banking and corporate financing expertise. John previously founded and was Chairman and CEO of Brainhunter Inc., a technology-based service company that went public after raising more than $70 million in debt and equity capital, and growing it to >$235 million in annual revenue. Mr. McKimm is a graduate of the University of New Brunswick with a BBA, and a graduate of the University of Western Ontario with an MBA and a Bachelor of Law. Robert Prentice — CFO, COO, Corporate Secretary: Mr. Prentice has over 40 years of experience as a financial professional and in many industry sectors. Most recently, he was CFO and a founder of Brainhunter Inc. Mr. Prentice has extensive operational expertise in creating best practices discipline and structure in high-growth opportunities, as well as extensive public company expertise and has been involved in multiple acquisitions and financings as a member of the negotiating, due diligence and integration teams. Shelly Frank — Vice President, Marketing: Ms. Frank played a leading role in establishing a publicly traded travel technology company and championed international financing efforts that raised more than $18 million for the development and implementation of the key technology involved. Through a reverse take-over opportunity, she participated in creating a public entity for this multimedia facility, going on to co-develop a business strategy that focused on residual-based income streams and strategic partnerships to create a solid base for continued growth in a then-emerging industry. Peter Yu — CTO: Mr. Yu has over 16 years of experience in software development, including experience related to payment service platforms, E-government, fraud alert for credit and debit cards, group benefit adjudication and administration platforms. Mr. Yu is multilingual and has operated successfully in utilizing onshore/offshore/nearshore development initiatives for domestic and international clients. Adam Jasek – Executive Vice President, Business Development, President SOMOS Consulting Group: Mr. Jasek has an entrepreneurial vision and spirit, depicted through over 40 years of experience in founding and managing successful businesses, while also holding experience in technical consulting roles. Prior to joining SOMOS, he served as the CEO of ADGA Information Technology Engineering Services at the ADGA Group and was responsible for consulting operations in Toronto and Ottawa. He founded AJJA Information Technology Consultants Inc. in 1980 and was its CEO until 2005. Mr. Jasek holds a Bachelor of Science in Computer Science from Queen’s University.

Paradigm Capital Inc., IIROC/TSX member 21 June 18, 2015
Appendix 2: Independent Director Profiles
Ron Barbaro, Chairman of the Board: Chairman of Levon Resources Ltd. since 2010; Chairman of The Brick Ltd. until 2012 (Director until 2013); Director of Trans Global Life and Trans Global Insurance until 2013; Director of Imvescor Restaurant Group Inc. until 2013; Northbridge Financial Corporation until 2009. Nancy Elliot, Chair of the Governance and Compensation Committee: A lawyer practicing at Elliott Law Firm in corporate and immigration matters relating particularly to Chinese immigration to and investment in Canada. Keith Harris: A consultant and corporate director through his financial advisory firm Naiscoot Capital Corporation.; Director of Maudore Minerals Ltd. since 2012; Director of Diamond Estates Wines and Spirits Inc. since 2011. From January 2008 to December 2010, he was President and CEO of Stifel Nicolaus Canada Inc. Christine Hrudka: Owner of an Independent Pharmacy in Saskatoon; Sessional Lecturer at the University of Saskatchewan (College of Pharmacy and Edwards School of Business); President of a software development company specializing in software for the restaurant industry; Director, Pharmacy Association of Saskatchewan since 2012; Director, CU Place; Past President and Director Saskatchewan College of Pharmacists 2008 to 2012. Stephen Peacock, Chair of the Audit, Risk, Acquisition and Special Committee: President of Bearspaw Capital Corp., a private investment firm since 2002. Director of Avery Resources Inc. 2005 to 2008.
Paradigm Capital Inc, IIROC/TSX member 22 June 18, 2015
DISCLAIMER SECTION
Company Ticker Disclosures
Smart Employee Benefits, Inc. SEB-T 3
Christopher Lam visited SEB’s head office in April 2015.
1. The analyst has an ownership position in the subject company.
2. Paradigm Capital Inc. has assumed an underwriting liability for, and/or provided financial advice for consideration to the subject companies during the past 12 months.
3. Paradigm Capital Inc. expects to receive or intends to seek compensation for investment banking services from the subject companies in the next 3 months.
4. Paradigm Capital Inc. has greater than a 1% ownership position in the subject company. 5. The analyst has a family relationship with an Officer/Director of subject company.
Paradigm’s disclosure policies and research distribution procedures can be found on our website at www.paradigmcap.com. Paradigm Capital Inc. research is available on Bloomberg, CapitalIQ, FactSet and Thomson Reuters or at www.paradigmcap.com. Issued by Paradigm Capital Inc.
Research Rating System Paradigm Capital Inc. uses the following rating recommendation guidelines in its research:
Number of PercentageRecommendation Companies Breakdown
Buy 114 56% Buy – Expected returns of 20% or more over 12 months.
Spec. Buy 22 11% Speculative Buy - Expected returns of 20% or more over the next 12 months on high-risk development or pre-revenue companies, such as junior mining and other early stage companies.
Hold 23 11% Hold - Expected returns of less than +/- 20% over the next 12 months.
Sell* 5 2% Sell - Expected returns of -20% or more over the next 12 months.
Under Review 39 19% Under Review - Estimates, Target and/or Recommendation under review.
Total 203*Includes companies with a "Tender" recommendation
About Paradigm Capital Inc.
Paradigm Capital Inc. (PCI) is a research-driven, independent, institutional equity investment dealer focused on sectors and companies that have attractive long-term secular growth prospects. PCI’s research is available on our website at www.paradigmcap.com. Please speak to your Sales or Trading Representative if you require access to the website.
The analyst (and associate) certify that the views expressed in this report accurately reflect their personal views about the subject securities or issuers. No part of their compensation was, is, or will be, directly or indirectly, related to the specific recommendations expressed in this research report.
Analysts are compensated through a combined base salary and bonus payout system. The bonus payout is determined by revenues generated directly or indirectly from various departments including Investment Banking, based on a system that includes the following criteria: reports generated, timeliness, performance of recommendations, knowledge of industry, quality of research and investment guidance and client feedback. Analysts are not directly compensated for specific Investment Banking transactions.
The opinions, estimates and projections contained herein are those of PCI as of the date hereof and are subject to change without notice. PCI makes every effort to ensure that the contents herein have been compiled or derived from sources believed reliable and contain information and opinions, which are accurate and complete. However, PCI makes no representation or warranty, express or implied, in respect thereof, and takes no responsibility for any errors and omissions that may be contained herein and accepts no liability whatsoever for any loss arising from any use of or reliance on this research report or its contents. Information may be available to PCI, which is not reflected herein. This research report is not to be construed as an offer to sell or solicitation for or an offer to buy any securities. PCI, its affiliates and/or their respective officers, directors or employees may from time to time acquire, hold or sell securities mentioned herein as principal or agent. PCI may act as financial advisor and/or underwriter for certain of the corporations mentioned herein and may receive remuneration for same. PCI is a member of The Toronto Stock Exchange, The TSX Venture Exchange and The Investment Industry Regulatory Organization of Canada (IIROC).
Any products or services mentioned on this website are made available only in accordance with local law (including applicable securities laws) and only where they may be lawfully offered for sale. PCI will not open accounts except in jurisdictions in which it is registered.
To U.S. Residents: This report was prepared by PCI which is not subject to U.S. rules with regard to the preparation of research reports and the independence of analysts. PCI U.S. , affiliate of PCI, accepts responsibility for the contents herein, subject to the terms as set out above. Any U.S. person wishing to effect transactions in any security discussed herein should do so through PCI U.S.

Paradigm Capital Inc, IIROC/TSX member 23 June 18, 2015
RESEARCH
Technology – Industrial Technology
Daniel Kim (Head of Research) 416.363.6644
Technology –Health Care
Christopher Lam 416.363.9567
Energy Services
Jason Tucker 403.513.1031
Oil and Gas
Ken Lin, CFA 403.513.1042
Ian Macqueen, P.Geol. 403.513.1034
Infrastructure / Travel & Leisure
Corey Hammill 416.361.0754
Metals, Mining & Agriculture
David Davidson 416.360.3462
Jeff Woolley, CFA 416.361.9557
Spencer Churchill, CFA 416.361.6056
Gold and Precious Metals
Don MacLean 416.360.3459
Don Blyth 416.360.3461Lauren McConnell 416.366.7776
Industrial Products
Marvin Wolff, CFA 416.361.3376
Quantitative / Technical Analysis
Tina Normann 416.216.3564
Research Associates
Kevin Archibald 416.368.6150
Jesse MacLean 416.361.0628
Kevin O’Flaherty 416.363.4618
Brian Sorenson 403.513.1032
Bridget Zhang 416.216.3547
SALES
John Bellamy (Head of Sales) 416.361.6032
David Roland 416.216.6844
James Bates 416.363.6228
Jeff Bigelow 416.361.1895
Diane Braxatoris 416.366.5838
Christopher Chang 416-360-5129
Naomi Ebata, CFA 416.364.9764
Tanner Kohara 416.216.3583
Brittney Kuczynski 416.304.6842
Wolfgang Rosner 514.447.8950
TRADING
Jonathan Hill (Head of Trading) 416.361.9295
Peter Dunlop 416.361.6053
Matthew Green 416.364.7988
Mervin Kopeck 416.364.5451
Conor O’Brien 416.368.8353
Mel Peralta 416.361.6030
OFFICES
Toronto
95 Wellington Street West, Suite 2101, PO Box 55
Toronto, Ontario M5J 2N7
General Line 416.361.9892
Fax Line 416.361.6050
Calgary
110-9th Avenue SW
Suite 500
Calgary, Alberta T2P 0T1
General Line 403.513.1025
Fax (Research) 403.265.8721
STOCK RATING SYSTEM
Buy: Expected returns of 20% or more over 12 months.
Speculative Buy: Expected returns of 20% or more over the next 12 months on high-risk development or pre-revenue companies, such as junior mining and other early stage companies.
Hold: Expected returns of less than 20% over the next 12 months.
Sell: Expected returns of -20% or more over the next 12 months. .