research universities (very high research activity)fsse.indiana.edu/pdf/fsse_ir_2009/fsse09 reports...
TRANSCRIPT
Frequency DistributionsAugust 2009
Research Universities (very high research activity)
Interpreting the Frequency Distributions Report
Sample
Survey Items Course Level
Variable Names Count
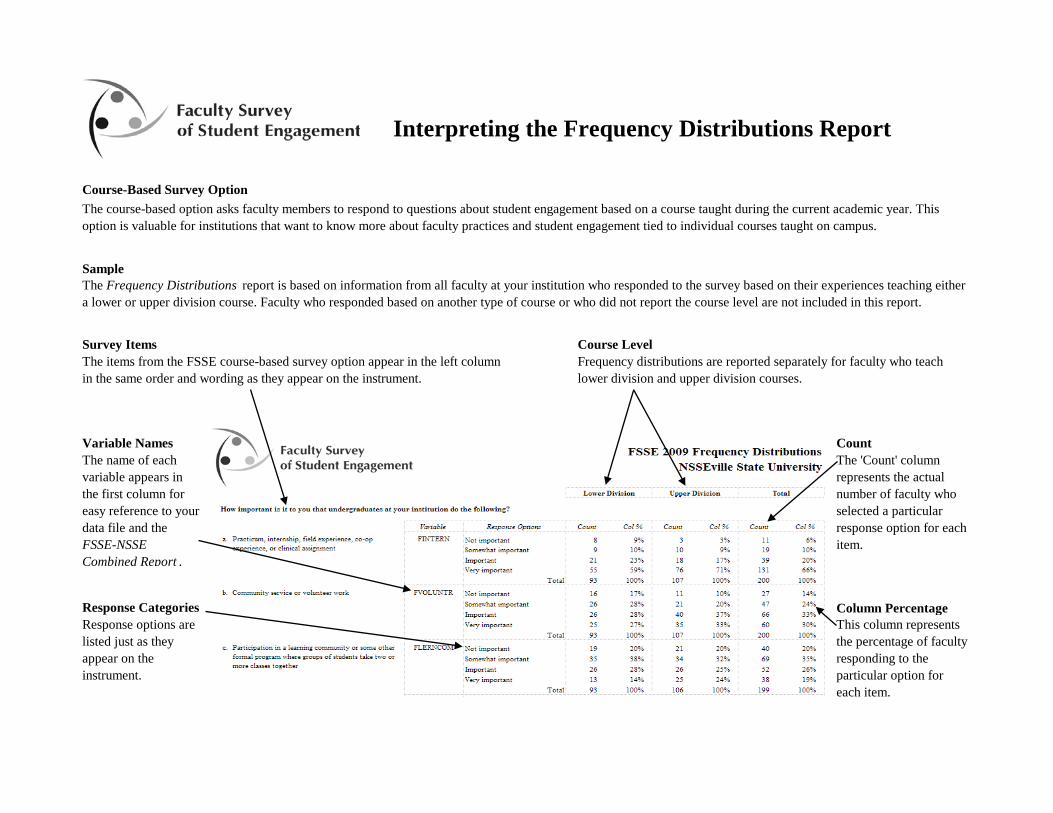
Response Categories Column Percentage Response options are listed just as they appear on the instrument.
This column represents the percentage of faculty responding to the particular option for each item.
Course-Based Survey OptionThe course-based option asks faculty members to respond to questions about student engagement based on a course taught during the current academic year. This option is valuable for institutions that want to know more about faculty practices and student engagement tied to individual courses taught on campus.
The Frequency Distributions report is based on information from all faculty at your institution who responded to the survey based on their experiences teaching either a lower or upper division course. Faculty who responded based on another type of course or who did not report the course level are not included in this report.
The items from the FSSE course-based survey option appear in the left column in the same order and wording as they appear on the instrument.
Frequency distributions are reported separately for faculty who teach lower division and upper division courses.
The name of each variable appears in the first column for easy reference to your data file and the FSSE-NSSE Combined Report .
The 'Count' column represents the actual number of faculty who selected a particular response option for each item.
1
Variable Response Options Count Col % Count Col % Count Col %
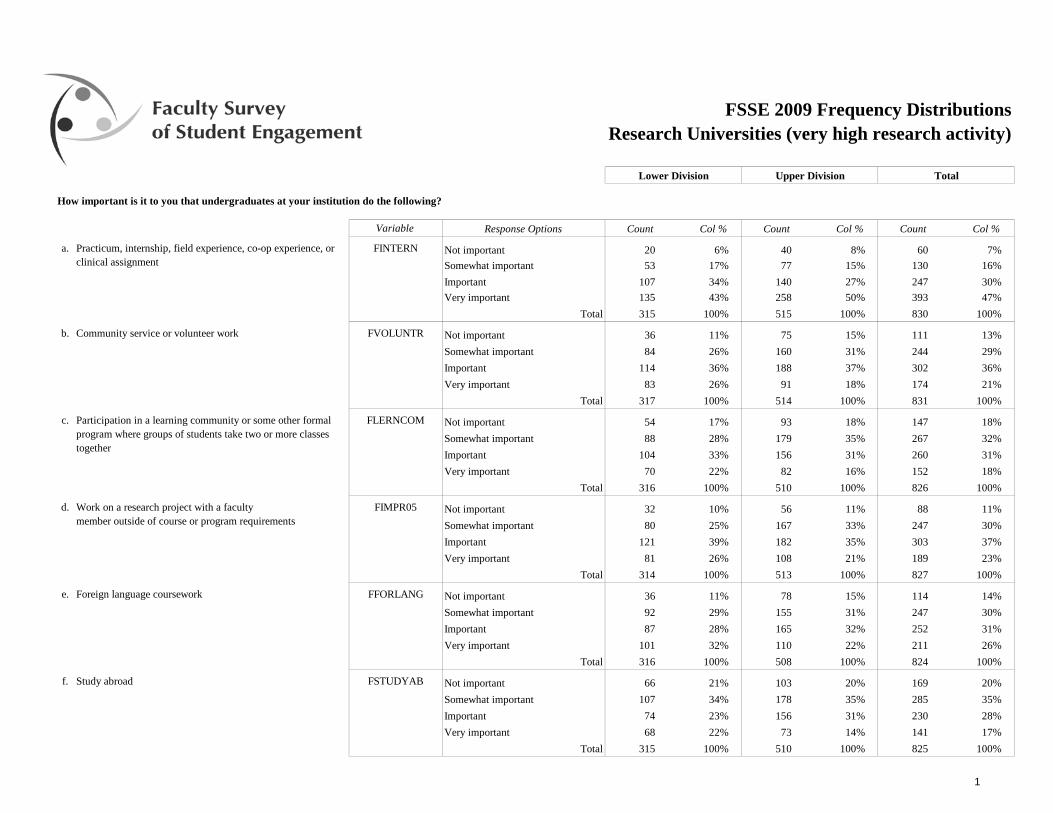
a. FINTERN Not important 20 6% 40 8% 60 7%Somewhat important 53 17% 77 15% 130 16%Important 107 34% 140 27% 247 30%Very important 135 43% 258 50% 393 47%
Total 315 100% 515 100% 830 100%
b. FVOLUNTR Not important 36 11% 75 15% 111 13%Somewhat important 84 26% 160 31% 244 29%Important 114 36% 188 37% 302 36%Very important 83 26% 91 18% 174 21%
Total 317 100% 514 100% 831 100%
c. FLERNCOM Not important 54 17% 93 18% 147 18%Somewhat important 88 28% 179 35% 267 32%Important 104 33% 156 31% 260 31%Very important 70 22% 82 16% 152 18%
Total 316 100% 510 100% 826 100%
d. FIMPR05 Not important 32 10% 56 11% 88 11%Somewhat important 80 25% 167 33% 247 30%Important 121 39% 182 35% 303 37%Very important 81 26% 108 21% 189 23%
Total 314 100% 513 100% 827 100%
e. FFORLANG Not important 36 11% 78 15% 114 14%Somewhat important 92 29% 155 31% 247 30%Important 87 28% 165 32% 252 31%Very important 101 32% 110 22% 211 26%
Total 316 100% 508 100% 824 100%
f. FSTUDYAB Not important 66 21% 103 20% 169 20%Somewhat important 107 34% 178 35% 285 35%Important 74 23% 156 31% 230 28%Very important 68 22% 73 14% 141 17%
Total 315 100% 510 100% 825 100%
FSSE 2009 Frequency Distributions
Upper DivisionLower Division Total
Study abroad
How important is it to you that undergraduates at your institution do the following?
Work on a research project with a facultymember outside of course or program requirements
Participation in a learning community or some other formal program where groups of students take two or more classes together
Practicum, internship, field experience, co-op experience, or clinical assignment
Community service or volunteer work
Foreign language coursework
Research Universities (very high research activity)
2
FSSE 2009 Frequency Distributions
Upper DivisionLower Division Total
Research Universities (very high research activity)
Variable Response Options Count Col % Count Col % Count Col %
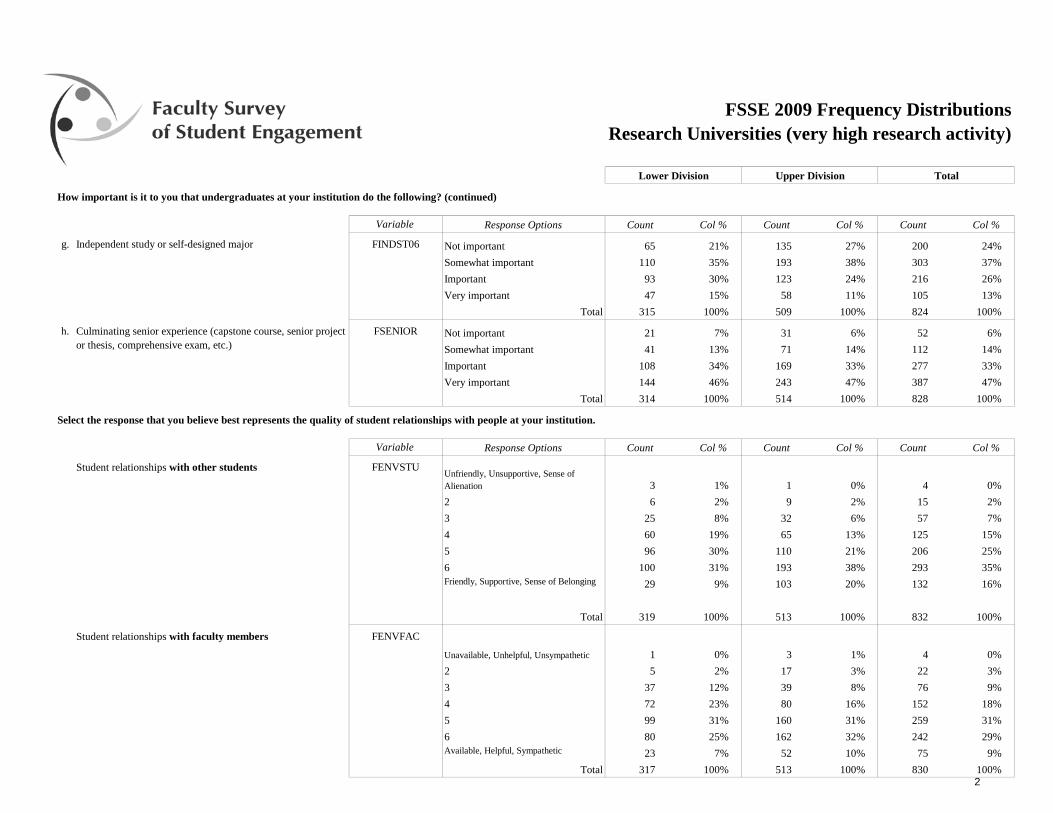
g. FINDST06 Not important 65 21% 135 27% 200 24%Somewhat important 110 35% 193 38% 303 37%Important 93 30% 123 24% 216 26%Very important 47 15% 58 11% 105 13%
Total 315 100% 509 100% 824 100%
h. FSENIOR Not important 21 7% 31 6% 52 6%Somewhat important 41 13% 71 14% 112 14%Important 108 34% 169 33% 277 33%Very important 144 46% 243 47% 387 47%
Total 314 100% 514 100% 828 100%
Variable Response Options Count Col % Count Col % Count Col %
FENVSTU
3 1% 1 0% 4 0%2 6 2% 9 2% 15 2%3 25 8% 32 6% 57 7%4 60 19% 65 13% 125 15%5 96 30% 110 21% 206 25%6 100 31% 193 38% 293 35%
29 9% 103 20% 132 16%
Total 319 100% 513 100% 832 100%
FENVFAC
1 0% 3 1% 4 0%2 5 2% 17 3% 22 3%3 37 12% 39 8% 76 9%4 72 23% 80 16% 152 18%5 99 31% 160 31% 259 31%6 80 25% 162 32% 242 29%Available, Helpful, Sympathetic 23 7% 52 10% 75 9%
Total 317 100% 513 100% 830 100%
Independent study or self-designed major
Friendly, Supportive, Sense of Belonging
Student relationships with other students
Culminating senior experience (capstone course, senior project or thesis, comprehensive exam, etc.)
How important is it to you that undergraduates at your institution do the following? (continued)
Student relationships with faculty members
Unavailable, Unhelpful, Unsympathetic
Select the response that you believe best represents the quality of student relationships with people at your institution.
Unfriendly, Unsupportive, Sense of Alienation
3
FSSE 2009 Frequency Distributions
Upper DivisionLower Division Total
Research Universities (very high research activity)
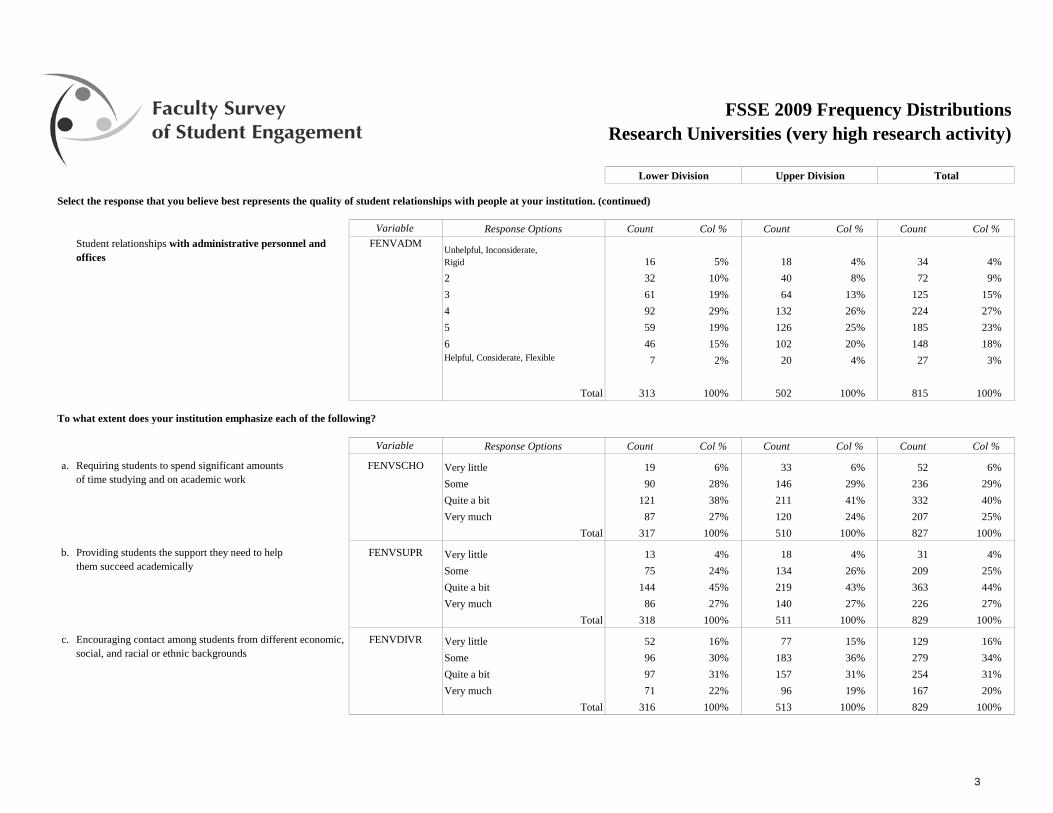
Variable Response Options Count Col % Count Col % Count Col %FENVADM
16 5% 18 4% 34 4%2 32 10% 40 8% 72 9%3 61 19% 64 13% 125 15%4 92 29% 132 26% 224 27%5 59 19% 126 25% 185 23%6 46 15% 102 20% 148 18%
7 2% 20 4% 27 3%
Total 313 100% 502 100% 815 100%
Variable Response Options Count Col % Count Col % Count Col %
a. FENVSCHO Very little 19 6% 33 6% 52 6%Some 90 28% 146 29% 236 29%Quite a bit 121 38% 211 41% 332 40%Very much 87 27% 120 24% 207 25%
Total 317 100% 510 100% 827 100%
b. FENVSUPR Very little 13 4% 18 4% 31 4%Some 75 24% 134 26% 209 25%Quite a bit 144 45% 219 43% 363 44%Very much 86 27% 140 27% 226 27%
Total 318 100% 511 100% 829 100%
c. FENVDIVR Very little 52 16% 77 15% 129 16%Some 96 30% 183 36% 279 34%Quite a bit 97 31% 157 31% 254 31%Very much 71 22% 96 19% 167 20%
Total 316 100% 513 100% 829 100%
Requiring students to spend significant amountsof time studying and on academic work
Providing students the support they need to helpthem succeed academically
Encouraging contact among students from different economic, social, and racial or ethnic backgrounds
To what extent does your institution emphasize each of the following?
Select the response that you believe best represents the quality of student relationships with people at your institution. (continued)
Unhelpful, Inconsiderate, Rigid
Helpful, Considerate, Flexible
Student relationships with administrative personnel and offices
4
FSSE 2009 Frequency Distributions
Upper DivisionLower Division Total
Research Universities (very high research activity)
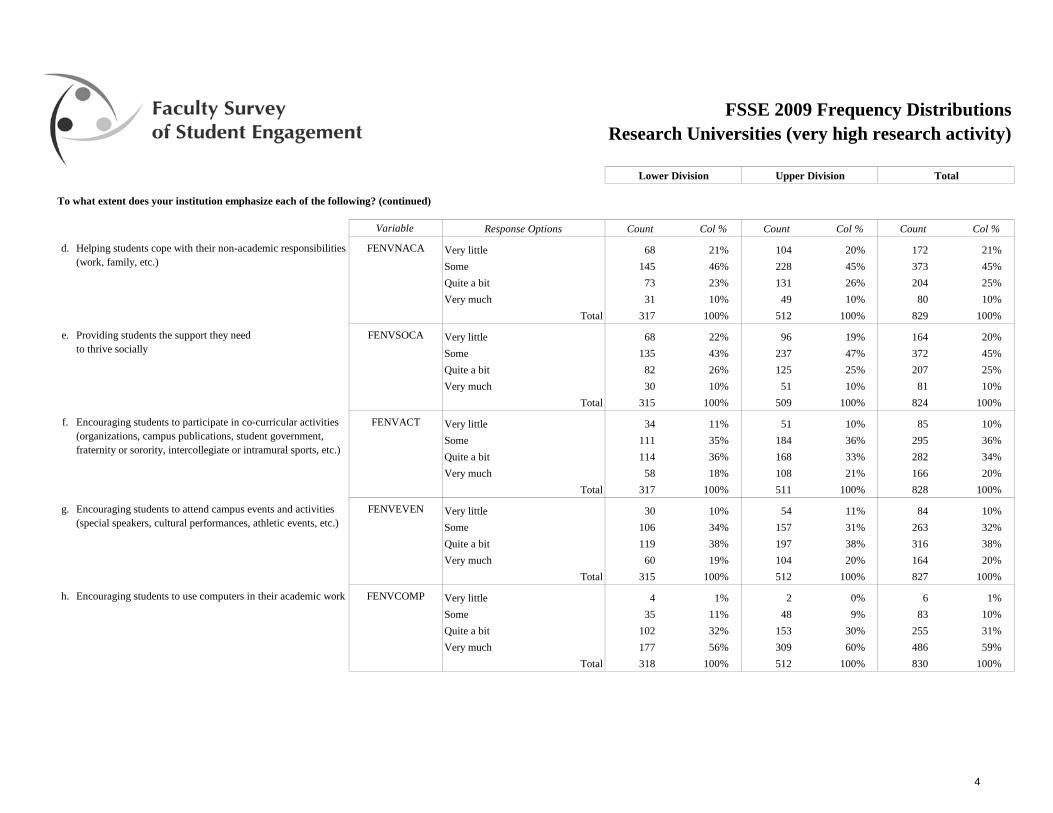
Variable Response Options Count Col % Count Col % Count Col %
d. FENVNACA Very little 68 21% 104 20% 172 21%Some 145 46% 228 45% 373 45%Quite a bit 73 23% 131 26% 204 25%Very much 31 10% 49 10% 80 10%
Total 317 100% 512 100% 829 100%
e. FENVSOCA Very little 68 22% 96 19% 164 20%Some 135 43% 237 47% 372 45%Quite a bit 82 26% 125 25% 207 25%Very much 30 10% 51 10% 81 10%
Total 315 100% 509 100% 824 100%
f. FENVACT Very little 34 11% 51 10% 85 10%Some 111 35% 184 36% 295 36%Quite a bit 114 36% 168 33% 282 34%Very much 58 18% 108 21% 166 20%
Total 317 100% 511 100% 828 100%
g. FENVEVEN Very little 30 10% 54 11% 84 10%Some 106 34% 157 31% 263 32%Quite a bit 119 38% 197 38% 316 38%Very much 60 19% 104 20% 164 20%
Total 315 100% 512 100% 827 100%
h. FENVCOMP Very little 4 1% 2 0% 6 1%Some 35 11% 48 9% 83 10%Quite a bit 102 32% 153 30% 255 31%Very much 177 56% 309 60% 486 59%
Total 318 100% 512 100% 830 100%
Helping students cope with their non-academic responsibilities (work, family, etc.)
To what extent does your institution emphasize each of the following? (continued)
Providing students the support they needto thrive socially
Encouraging students to attend campus events and activities (special speakers, cultural performances, athletic events, etc.)
Encouraging students to use computers in their academic work
Encouraging students to participate in co-curricular activities (organizations, campus publications, student government, fraternity or sorority, intercollegiate or intramural sports, etc.)
5
FSSE 2009 Frequency Distributions
Upper DivisionLower Division Total
Research Universities (very high research activity)
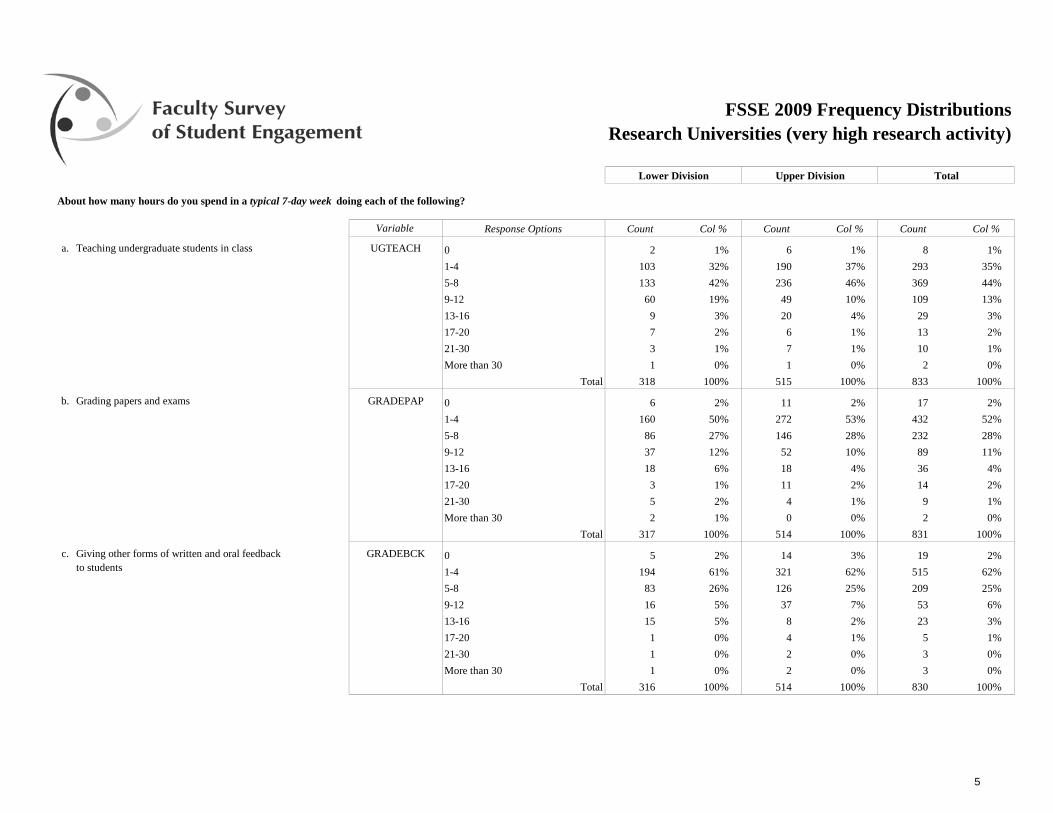
Variable Response Options Count Col % Count Col % Count Col %
a. UGTEACH 0 2 1% 6 1% 8 1%1-4 103 32% 190 37% 293 35%5-8 133 42% 236 46% 369 44%9-12 60 19% 49 10% 109 13%13-16 9 3% 20 4% 29 3%17-20 7 2% 6 1% 13 2%21-30 3 1% 7 1% 10 1%More than 30 1 0% 1 0% 2 0%
Total 318 100% 515 100% 833 100%
b. GRADEPAP 0 6 2% 11 2% 17 2%1-4 160 50% 272 53% 432 52%5-8 86 27% 146 28% 232 28%9-12 37 12% 52 10% 89 11%13-16 18 6% 18 4% 36 4%17-20 3 1% 11 2% 14 2%21-30 5 2% 4 1% 9 1%More than 30 2 1% 0 0% 2 0%
Total 317 100% 514 100% 831 100%
c. GRADEBCK 0 5 2% 14 3% 19 2%1-4 194 61% 321 62% 515 62%5-8 83 26% 126 25% 209 25%9-12 16 5% 37 7% 53 6%13-16 15 5% 8 2% 23 3%17-20 1 0% 4 1% 5 1%21-30 1 0% 2 0% 3 0%More than 30 1 0% 2 0% 3 0%
Total 316 100% 514 100% 830 100%
Grading papers and exams
Teaching undergraduate students in class
About how many hours do you spend in a typical 7-day week doing each of the following?
Giving other forms of written and oral feedbackto students

6
FSSE 2009 Frequency Distributions
Upper DivisionLower Division Total
Research Universities (very high research activity)
Variable Response Options Count Col % Count Col % Count Col %
d. CLASSPRP 0 2 1% 3 1% 5 1%1-4 114 36% 167 32% 281 34%5-8 120 38% 199 39% 319 38%9-12 45 14% 92 18% 137 16%13-16 25 8% 30 6% 55 7%17-20 6 2% 17 3% 23 3%21-30 2 1% 5 1% 7 1%More than 30 3 1% 1 0% 4 0%
Total 317 100% 514 100% 831 100%
e. REFLECT 0 7 2% 16 3% 23 3%1-4 222 70% 368 72% 590 71%5-8 63 20% 85 17% 148 18%9-12 17 5% 24 5% 41 5%13-16 3 1% 11 2% 14 2%17-20 3 1% 5 1% 8 1%21-30 1 0% 0 0% 1 0%More than 30 1 0% 3 1% 4 0%
Total 317 100% 512 100% 829 100%
f. SCHOLAR 0 31 10% 18 4% 49 6%1-4 78 25% 101 20% 179 22%5-8 53 17% 74 14% 127 15%9-12 46 15% 70 14% 116 14%13-16 20 6% 56 11% 76 9%17-20 22 7% 54 11% 76 9%21-30 30 10% 74 14% 104 13%More than 30 34 11% 66 13% 100 12%
Total 314 100% 513 100% 827 100%
Reflecting on ways to improve my teaching
About how many hours do you spend in a typical 7-day week doing each of the following? (continued)
Research and scholarly activities
Preparing for class
7
FSSE 2009 Frequency Distributions
Upper DivisionLower Division Total
Research Universities (very high research activity)
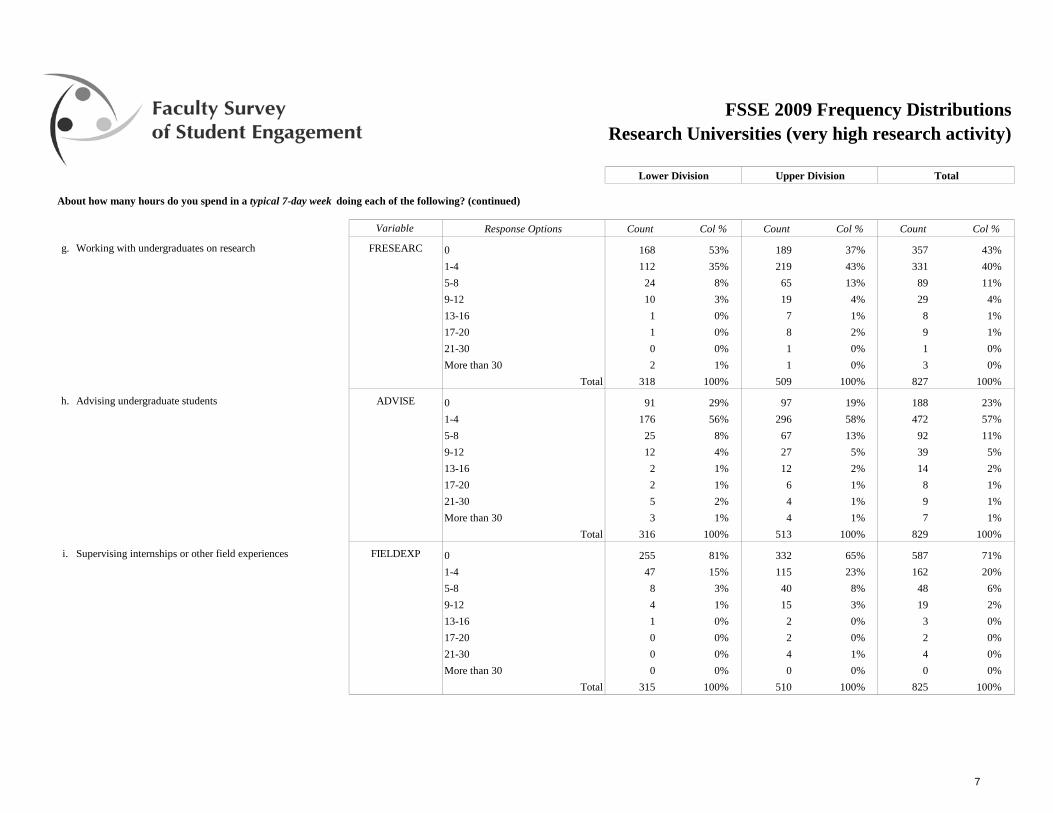
Variable Response Options Count Col % Count Col % Count Col %
g. FRESEARC 0 168 53% 189 37% 357 43%1-4 112 35% 219 43% 331 40%5-8 24 8% 65 13% 89 11%9-12 10 3% 19 4% 29 4%13-16 1 0% 7 1% 8 1%17-20 1 0% 8 2% 9 1%21-30 0 0% 1 0% 1 0%More than 30 2 1% 1 0% 3 0%
Total 318 100% 509 100% 827 100%
h. ADVISE 0 91 29% 97 19% 188 23%1-4 176 56% 296 58% 472 57%5-8 25 8% 67 13% 92 11%9-12 12 4% 27 5% 39 5%13-16 2 1% 12 2% 14 2%17-20 2 1% 6 1% 8 1%21-30 5 2% 4 1% 9 1%More than 30 3 1% 4 1% 7 1%
Total 316 100% 513 100% 829 100%
i. FIELDEXP 0 255 81% 332 65% 587 71%1-4 47 15% 115 23% 162 20%5-8 8 3% 40 8% 48 6%9-12 4 1% 15 3% 19 2%13-16 1 0% 2 0% 3 0%17-20 0 0% 2 0% 2 0%21-30 0 0% 4 1% 4 0%More than 30 0 0% 0 0% 0 0%
Total 315 100% 510 100% 825 100%
Advising undergraduate students
About how many hours do you spend in a typical 7-day week doing each of the following? (continued)
Working with undergraduates on research
Supervising internships or other field experiences
8
FSSE 2009 Frequency Distributions
Upper DivisionLower Division Total
Research Universities (very high research activity)
Variable Response Options Count Col % Count Col % Count Col %
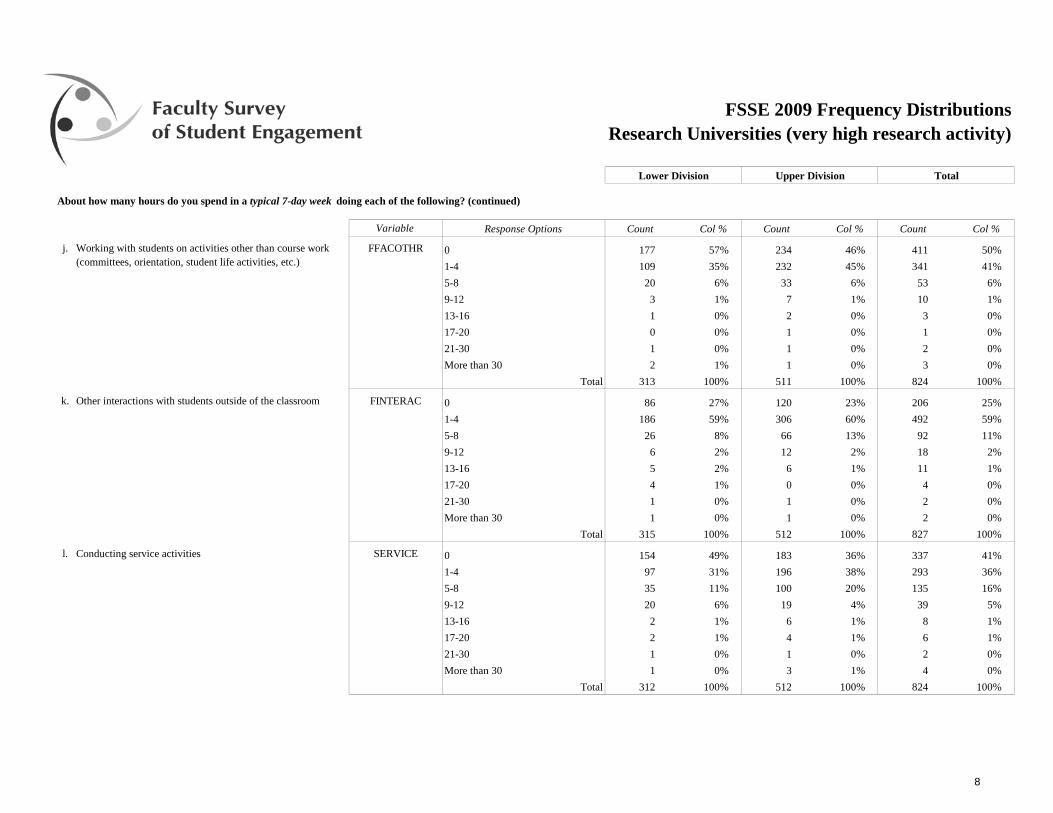
j. FFACOTHR 0 177 57% 234 46% 411 50%1-4 109 35% 232 45% 341 41%5-8 20 6% 33 6% 53 6%9-12 3 1% 7 1% 10 1%13-16 1 0% 2 0% 3 0%17-20 0 0% 1 0% 1 0%21-30 1 0% 1 0% 2 0%More than 30 2 1% 1 0% 3 0%
Total 313 100% 511 100% 824 100%
k. FINTERAC 0 86 27% 120 23% 206 25%1-4 186 59% 306 60% 492 59%5-8 26 8% 66 13% 92 11%9-12 6 2% 12 2% 18 2%13-16 5 2% 6 1% 11 1%17-20 4 1% 0 0% 4 0%21-30 1 0% 1 0% 2 0%More than 30 1 0% 1 0% 2 0%
Total 315 100% 512 100% 827 100%
l. SERVICE 0 154 49% 183 36% 337 41%1-4 97 31% 196 38% 293 36%5-8 35 11% 100 20% 135 16%9-12 20 6% 19 4% 39 5%13-16 2 1% 6 1% 8 1%17-20 2 1% 4 1% 6 1%21-30 1 0% 1 0% 2 0%More than 30 1 0% 3 1% 4 0%
Total 312 100% 512 100% 824 100%
About how many hours do you spend in a typical 7-day week doing each of the following? (continued)
Other interactions with students outside of the classroom
Working with students on activities other than course work (committees, orientation, student life activities, etc.)
Conducting service activities
9
FSSE 2009 Frequency Distributions
Upper DivisionLower Division Total
Research Universities (very high research activity)
Variable Response Options Count Col % Count Col % Count Col %
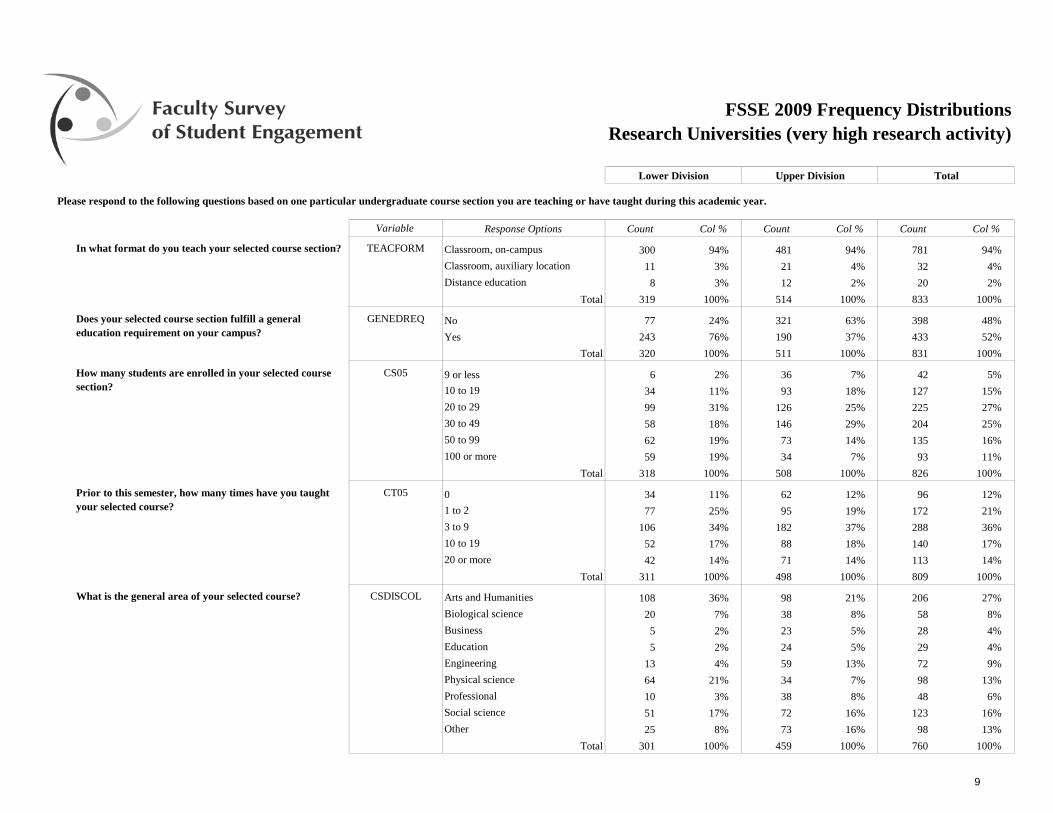
TEACFORM Classroom, on-campus 300 94% 481 94% 781 94%Classroom, auxiliary location 11 3% 21 4% 32 4%Distance education 8 3% 12 2% 20 2%
Total 319 100% 514 100% 833 100%
GENEDREQ No 77 24% 321 63% 398 48%Yes 243 76% 190 37% 433 52%
Total 320 100% 511 100% 831 100%
CS05 9 or less 6 2% 36 7% 42 5%10 to 19 34 11% 93 18% 127 15%20 to 29 99 31% 126 25% 225 27%30 to 49 58 18% 146 29% 204 25%50 to 99 62 19% 73 14% 135 16%100 or more 59 19% 34 7% 93 11%
Total 318 100% 508 100% 826 100%
CT05 0 34 11% 62 12% 96 12%1 to 2 77 25% 95 19% 172 21%3 to 9 106 34% 182 37% 288 36%10 to 19 52 17% 88 18% 140 17%20 or more 42 14% 71 14% 113 14%
Total 311 100% 498 100% 809 100%
CSDISCOL Arts and Humanities 108 36% 98 21% 206 27%Biological science 20 7% 38 8% 58 8%Business 5 2% 23 5% 28 4%Education 5 2% 24 5% 29 4%Engineering 13 4% 59 13% 72 9%Physical science 64 21% 34 7% 98 13%Professional 10 3% 38 8% 48 6%Social science 51 17% 72 16% 123 16%Other 25 8% 73 16% 98 13%
Total 301 100% 459 100% 760 100%
In what format do you teach your selected course section?
How many students are enrolled in your selected course section?
Prior to this semester, how many times have you taught your selected course?
What is the general area of your selected course?
Please respond to the following questions based on one particular undergraduate course section you are teaching or have taught during this academic year.
Does your selected course section fulfill a general education requirement on your campus?
10
FSSE 2009 Frequency Distributions
Upper DivisionLower Division Total
Research Universities (very high research activity)
Variable Response Options Count Col % Count Col % Count Col %
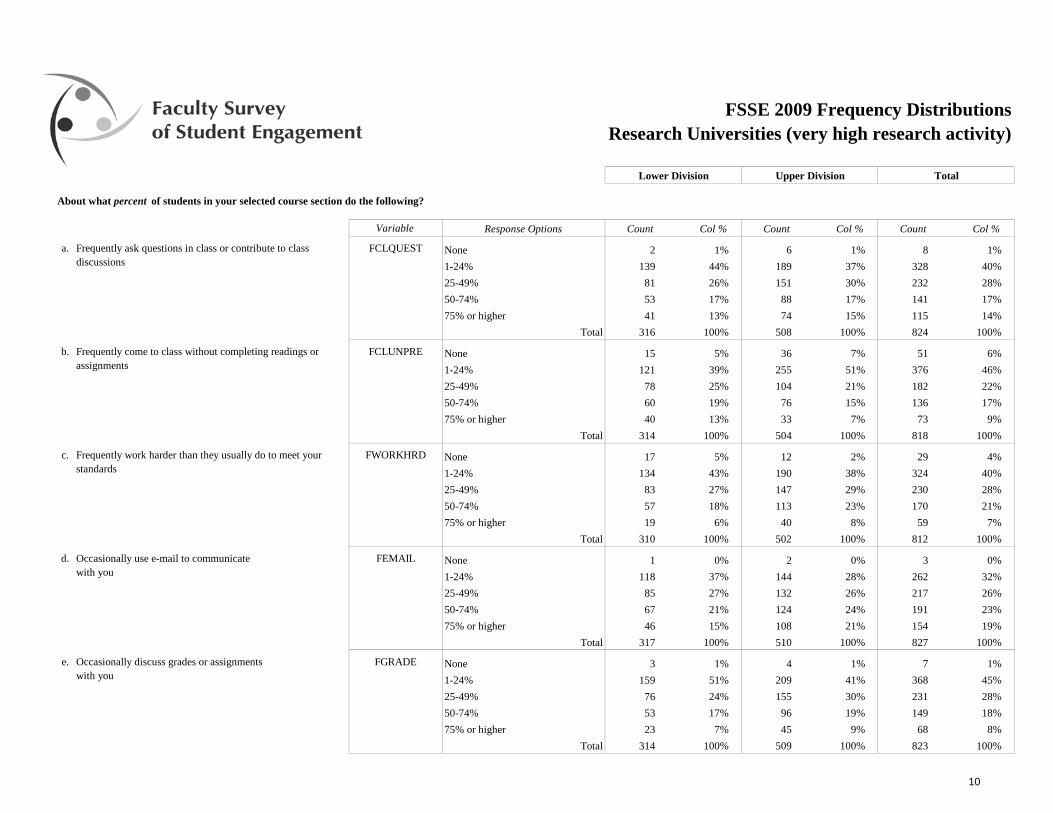
a. FCLQUEST None 2 1% 6 1% 8 1%1-24% 139 44% 189 37% 328 40%25-49% 81 26% 151 30% 232 28%50-74% 53 17% 88 17% 141 17%75% or higher 41 13% 74 15% 115 14%
Total 316 100% 508 100% 824 100%
b. FCLUNPRE None 15 5% 36 7% 51 6%1-24% 121 39% 255 51% 376 46%25-49% 78 25% 104 21% 182 22%50-74% 60 19% 76 15% 136 17%75% or higher 40 13% 33 7% 73 9%
Total 314 100% 504 100% 818 100%
c. FWORKHRD None 17 5% 12 2% 29 4%1-24% 134 43% 190 38% 324 40%25-49% 83 27% 147 29% 230 28%50-74% 57 18% 113 23% 170 21%75% or higher 19 6% 40 8% 59 7%
Total 310 100% 502 100% 812 100%
d. FEMAIL None 1 0% 2 0% 3 0%1-24% 118 37% 144 28% 262 32%25-49% 85 27% 132 26% 217 26%50-74% 67 21% 124 24% 191 23%75% or higher 46 15% 108 21% 154 19%
Total 317 100% 510 100% 827 100%
e. FGRADE None 3 1% 4 1% 7 1%1-24% 159 51% 209 41% 368 45%25-49% 76 24% 155 30% 231 28%50-74% 53 17% 96 19% 149 18%75% or higher 23 7% 45 9% 68 8%
Total 314 100% 509 100% 823 100%
Frequently come to class without completing readings or assignments
Occasionally discuss grades or assignmentswith you
Frequently work harder than they usually do to meet your standards
Frequently ask questions in class or contribute to class discussions
Occasionally use e-mail to communicatewith you
About what percent of students in your selected course section do the following?
11
FSSE 2009 Frequency Distributions
Upper DivisionLower Division Total
Research Universities (very high research activity)
Variable Response Options Count Col % Count Col % Count Col %
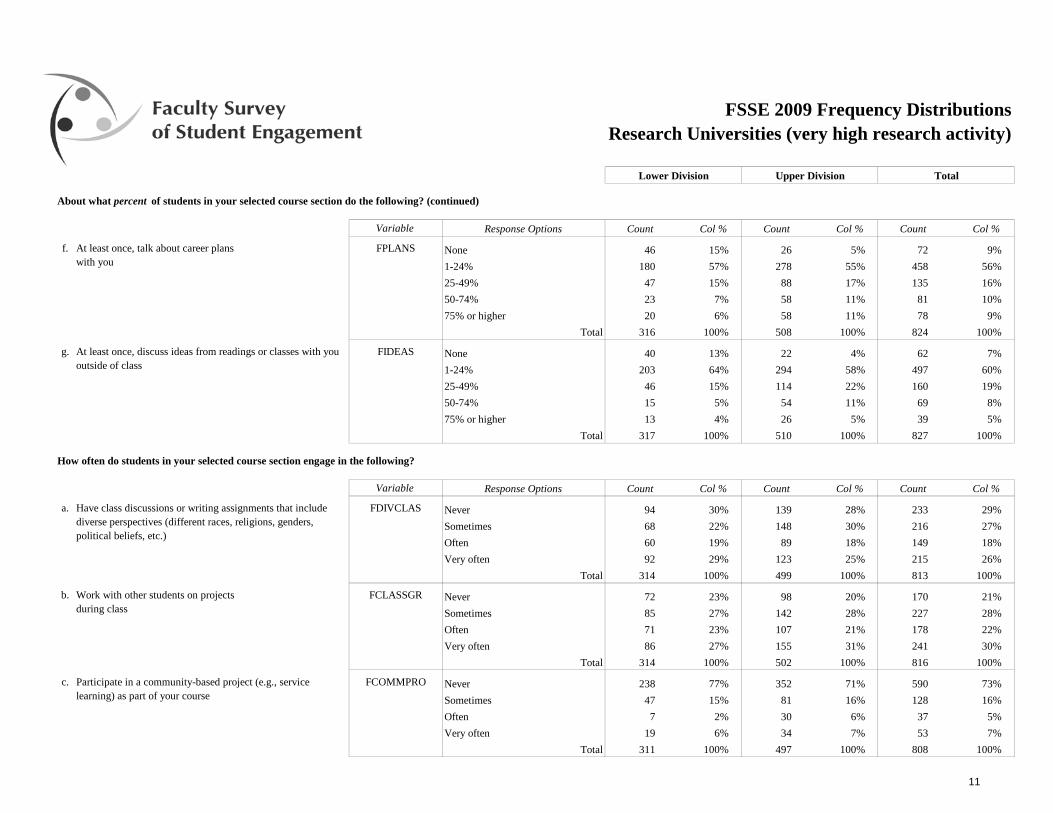
f. FPLANS None 46 15% 26 5% 72 9%1-24% 180 57% 278 55% 458 56%25-49% 47 15% 88 17% 135 16%50-74% 23 7% 58 11% 81 10%75% or higher 20 6% 58 11% 78 9%
Total 316 100% 508 100% 824 100%
g. FIDEAS None 40 13% 22 4% 62 7%1-24% 203 64% 294 58% 497 60%25-49% 46 15% 114 22% 160 19%50-74% 15 5% 54 11% 69 8%75% or higher 13 4% 26 5% 39 5%
Total 317 100% 510 100% 827 100%
Variable Response Options Count Col % Count Col % Count Col %
a. FDIVCLAS Never 94 30% 139 28% 233 29%Sometimes 68 22% 148 30% 216 27%Often 60 19% 89 18% 149 18%Very often 92 29% 123 25% 215 26%
Total 314 100% 499 100% 813 100%
b. FCLASSGR Never 72 23% 98 20% 170 21%Sometimes 85 27% 142 28% 227 28%Often 71 23% 107 21% 178 22%Very often 86 27% 155 31% 241 30%
Total 314 100% 502 100% 816 100%
c. FCOMMPRO Never 238 77% 352 71% 590 73%Sometimes 47 15% 81 16% 128 16%Often 7 2% 30 6% 37 5%Very often 19 6% 34 7% 53 7%
Total 311 100% 497 100% 808 100%
At least once, talk about career planswith you
At least once, discuss ideas from readings or classes with you outside of class
About what percent of students in your selected course section do the following? (continued)
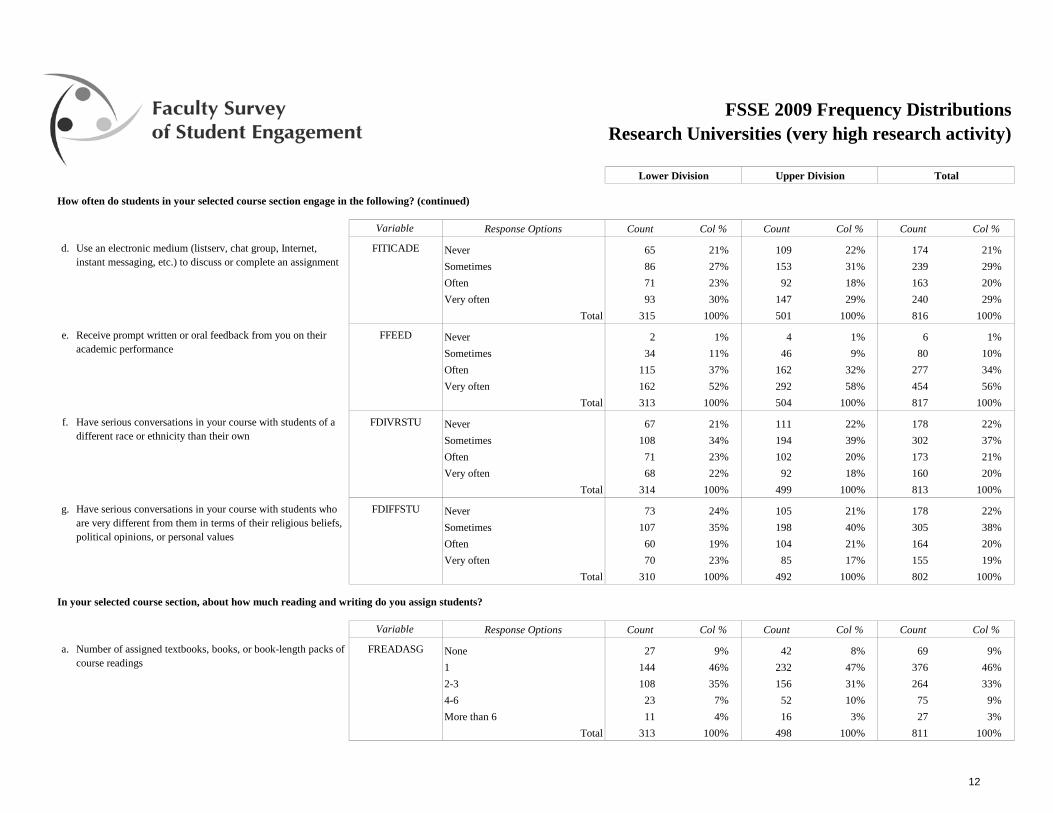
How often do students in your selected course section engage in the following?
Have class discussions or writing assignments that include diverse perspectives (different races, religions, genders, political beliefs, etc.)
Work with other students on projectsduring class
Participate in a community-based project (e.g., service learning) as part of your course
12
FSSE 2009 Frequency Distributions
Upper DivisionLower Division Total
Research Universities (very high research activity)
Variable Response Options Count Col % Count Col % Count Col %
d. FITICADE Never 65 21% 109 22% 174 21%Sometimes 86 27% 153 31% 239 29%Often 71 23% 92 18% 163 20%Very often 93 30% 147 29% 240 29%
Total 315 100% 501 100% 816 100%
e. FFEED Never 2 1% 4 1% 6 1%Sometimes 34 11% 46 9% 80 10%Often 115 37% 162 32% 277 34%Very often 162 52% 292 58% 454 56%
Total 313 100% 504 100% 817 100%
f. FDIVRSTU Never 67 21% 111 22% 178 22%Sometimes 108 34% 194 39% 302 37%Often 71 23% 102 20% 173 21%Very often 68 22% 92 18% 160 20%
Total 314 100% 499 100% 813 100%
g. FDIFFSTU Never 73 24% 105 21% 178 22%Sometimes 107 35% 198 40% 305 38%Often 60 19% 104 21% 164 20%Very often 70 23% 85 17% 155 19%
Total 310 100% 492 100% 802 100%
Variable Response Options Count Col % Count Col % Count Col %
a. FREADASG None 27 9% 42 8% 69 9%1 144 46% 232 47% 376 46%2-3 108 35% 156 31% 264 33%4-6 23 7% 52 10% 75 9%More than 6 11 4% 16 3% 27 3%
Total 313 100% 498 100% 811 100%
How often do students in your selected course section engage in the following? (continued)
In your selected course section, about how much reading and writing do you assign students?
Number of assigned textbooks, books, or book-length packs of course readings
Have serious conversations in your course with students who are very different from them in terms of their religious beliefs, political opinions, or personal values
Use an electronic medium (listserv, chat group, Internet, instant messaging, etc.) to discuss or complete an assignment
Receive prompt written or oral feedback from you on their academic performance
Have serious conversations in your course with students of a different race or ethnicity than their own
13
FSSE 2009 Frequency Distributions
Upper DivisionLower Division Total
Research Universities (very high research activity)
Variable Response Options Count Col % Count Col % Count Col %
b. FWRTMR05 None 283 91% 360 73% 643 80%1 10 3% 91 18% 101 13%2-3 10 3% 28 6% 38 5%4-6 2 1% 10 2% 12 1%More than 6 6 2% 4 1% 10 1%
Total 311 100% 493 100% 804 100%
c. FWRTMD05 None 168 55% 165 34% 333 42%1 53 17% 149 31% 202 26%2-3 53 17% 128 26% 181 23%4-6 20 7% 34 7% 54 7%More than 6 10 3% 12 2% 22 3%
Total 304 100% 488 100% 792 100%
d. FWRITSML None 106 34% 127 26% 233 29%1 34 11% 74 15% 108 13%2-3 62 20% 117 24% 179 22%4-6 54 17% 83 17% 137 17%More than 6 54 17% 91 18% 145 18%
Total 310 100% 492 100% 802 100%
Variable Response Options Count Col % Count Col % Count Col %
a. FPROBSTA None 144 47% 204 42% 348 44%1-2 95 31% 166 34% 261 33%3-4 29 9% 46 9% 75 9%5-6 6 2% 20 4% 26 3%More than 6 35 11% 52 11% 87 11%
Total 309 100% 488 100% 797 100%
b. FPROBSTB None 168 54% 297 61% 465 58%1-2 80 26% 123 25% 203 25%3-4 22 7% 39 8% 61 8%5-6 15 5% 14 3% 29 4%More than 6 25 8% 15 3% 40 5%
Total 310 100% 488 100% 798 100%
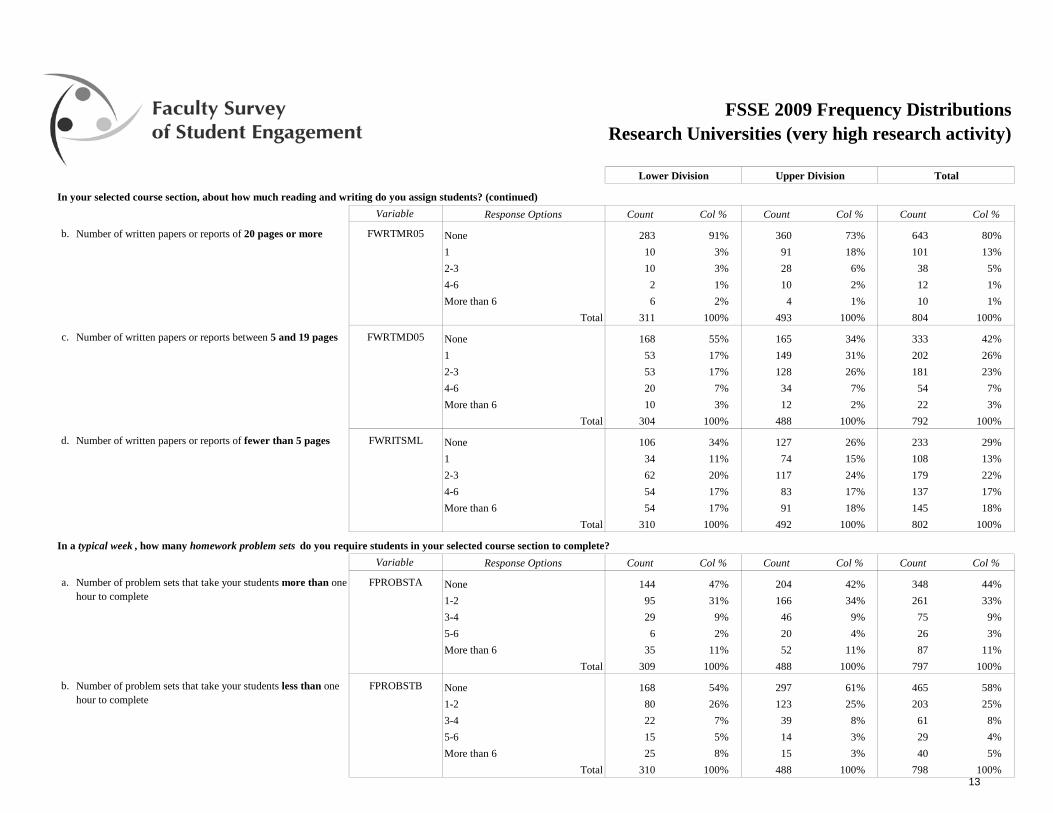
Number of problem sets that take your students less than one hour to complete
Number of problem sets that take your students more than one hour to complete
Number of written papers or reports of 20 pages or more
In your selected course section, about how much reading and writing do you assign students? (continued)
Number of written papers or reports of fewer than 5 pages
In a typical week , how many homework problem sets do you require students in your selected course section to complete?
Number of written papers or reports between 5 and 19 pages
14
FSSE 2009 Frequency Distributions
Upper DivisionLower Division Total
Research Universities (very high research activity)
Variable Response Options Count Col % Count Col % Count Col %
a. FEXPREP 0 0 0% 3 1% 3 0%1-2 29 9% 38 8% 67 8%3-4 99 32% 161 32% 260 32%5-6 78 25% 140 28% 218 27%7-8 69 22% 82 16% 151 19%9-10 26 8% 58 12% 84 10%11-12 9 3% 6 1% 15 2%More than 12 3 1% 11 2% 14 2%
Total 313 100% 499 100% 812 100%
b. FACTPREP 0 15 5% 20 4% 35 4%1-2 166 53% 237 47% 403 50%3-4 93 30% 146 29% 239 29%5-6 21 7% 67 13% 88 11%7-8 12 4% 19 4% 31 4%9-10 3 1% 5 1% 8 1%11-12 2 1% 0 0% 2 0%More than 12 1 0% 5 1% 6 1%
Total 313 100% 499 100% 812 100%
Variable Response Options Count Col % Count Col % Count Col %
a. FREWROPA Not important 98 33% 134 28% 232 30%Somewhat important 58 19% 104 21% 162 21%Important 69 23% 110 23% 179 23%Very important 74 25% 139 29% 213 27%
Total 299 100% 487 100% 786 100%
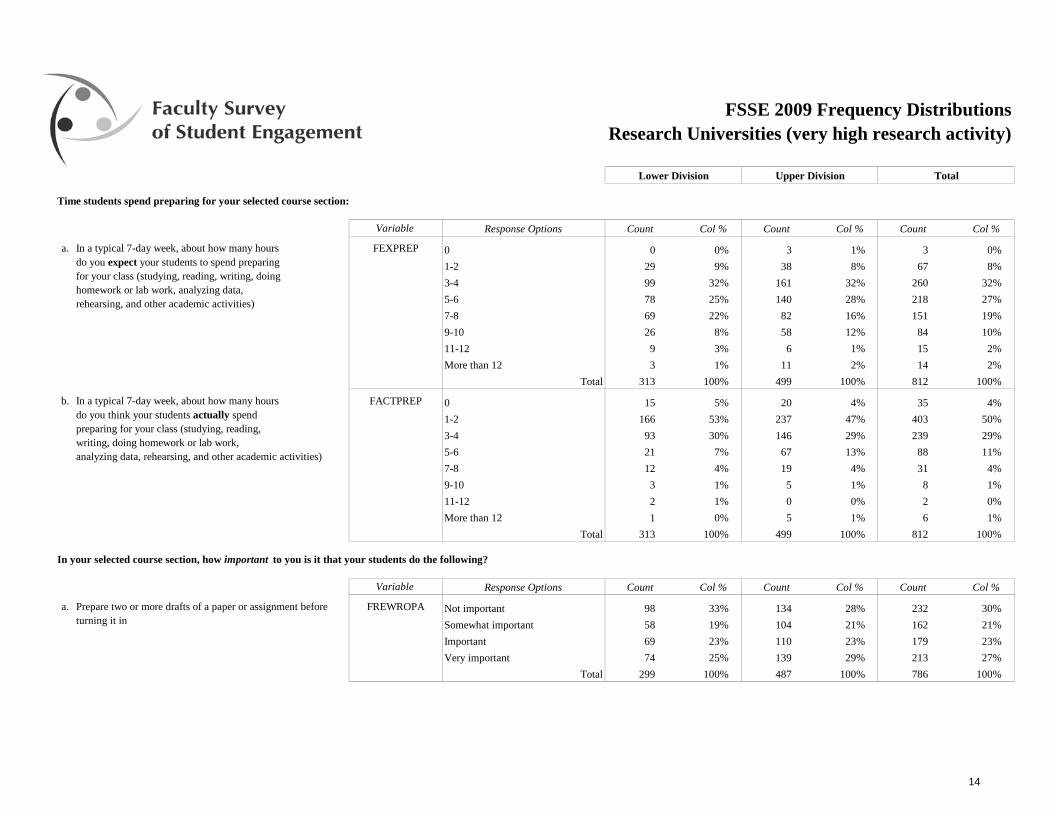
In your selected course section, how important to you is it that your students do the following?
In a typical 7-day week, about how many hoursdo you think your students actually spendpreparing for your class (studying, reading,writing, doing homework or lab work,analyzing data, rehearsing, and other academic activities)
Prepare two or more drafts of a paper or assignment before turning it in
Time students spend preparing for your selected course section:
In a typical 7-day week, about how many hoursdo you expect your students to spend preparingfor your class (studying, reading, writing, doinghomework or lab work, analyzing data,rehearsing, and other academic activities)
15
FSSE 2009 Frequency Distributions
Upper DivisionLower Division Total
Research Universities (very high research activity)
Variable Response Options Count Col % Count Col % Count Col %
b. FINTEGRA Not important 60 20% 47 10% 107 14%Somewhat important 29 10% 44 9% 73 9%Important 66 22% 117 24% 183 23%Very important 140 47% 280 57% 420 54%
Total 295 100% 488 100% 783 100%
c. FOCCGRP Not important 75 25% 134 27% 209 26%Somewhat important 80 27% 107 22% 187 24%Important 79 27% 143 29% 222 28%Very important 64 21% 108 22% 172 22%
Total 298 100% 492 100% 790 100%
d. FINTIDEA Not important 63 21% 51 10% 114 14%Somewhat important 80 26% 125 26% 205 26%Important 90 30% 155 32% 245 31%Very important 69 23% 158 32% 227 29%
Total 302 100% 489 100% 791 100%
e. FOOCID05 Not important 51 17% 82 17% 133 17%Somewhat important 79 26% 151 31% 230 29%Important 104 35% 143 29% 247 31%Very important 67 22% 111 23% 178 23%
Total 301 100% 487 100% 788 100%
f. FTUTOR Not important 116 38% 212 43% 328 41%Somewhat important 93 31% 157 32% 250 32%Important 57 19% 93 19% 150 19%Very important 37 12% 28 6% 65 8%
Total 303 100% 490 100% 793 100%
g. FOWNVIEW Not important 44 15% 47 10% 91 12%Somewhat important 43 14% 82 17% 125 16%Important 88 29% 154 32% 242 31%Very important 127 42% 202 42% 329 42%
Total 302 100% 485 100% 787 100%
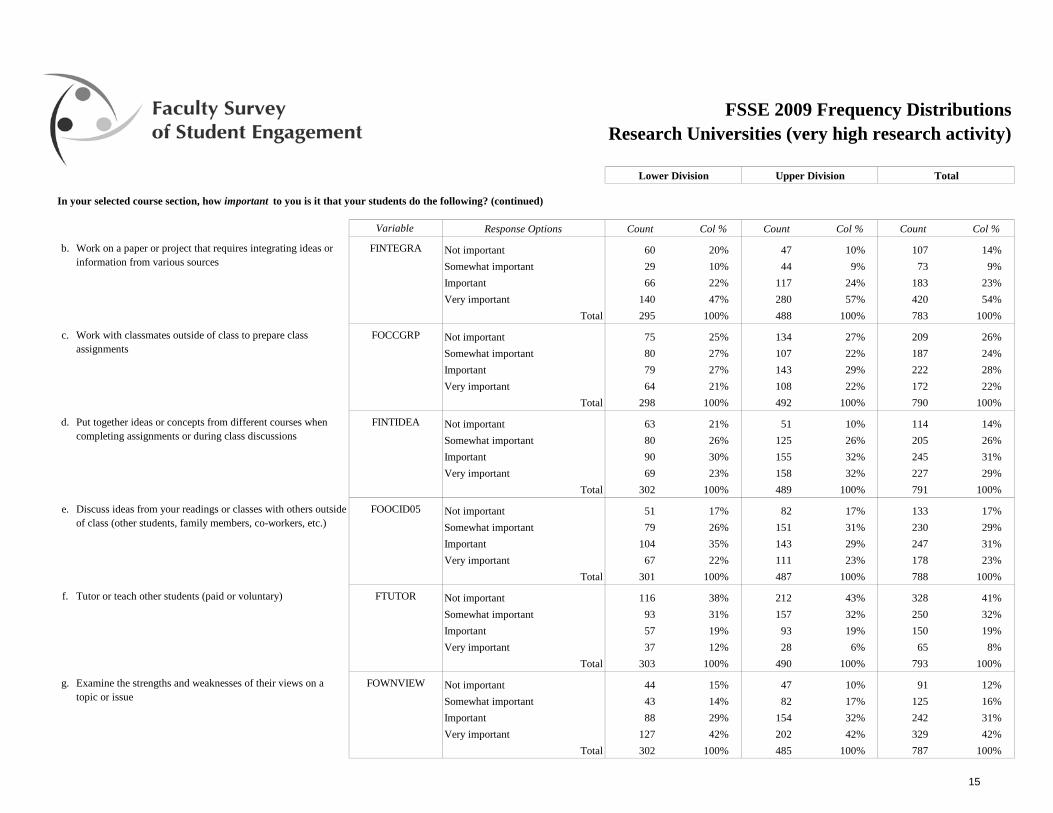
Tutor or teach other students (paid or voluntary)
Examine the strengths and weaknesses of their views on a topic or issue
Work with classmates outside of class to prepare class assignments
Discuss ideas from your readings or classes with others outside of class (other students, family members, co-workers, etc.)
In your selected course section, how important to you is it that your students do the following? (continued)
Put together ideas or concepts from different courses when completing assignments or during class discussions
Work on a paper or project that requires integrating ideas or information from various sources
16
FSSE 2009 Frequency Distributions
Upper DivisionLower Division Total
Research Universities (very high research activity)
Variable Response Options Count Col % Count Col % Count Col %
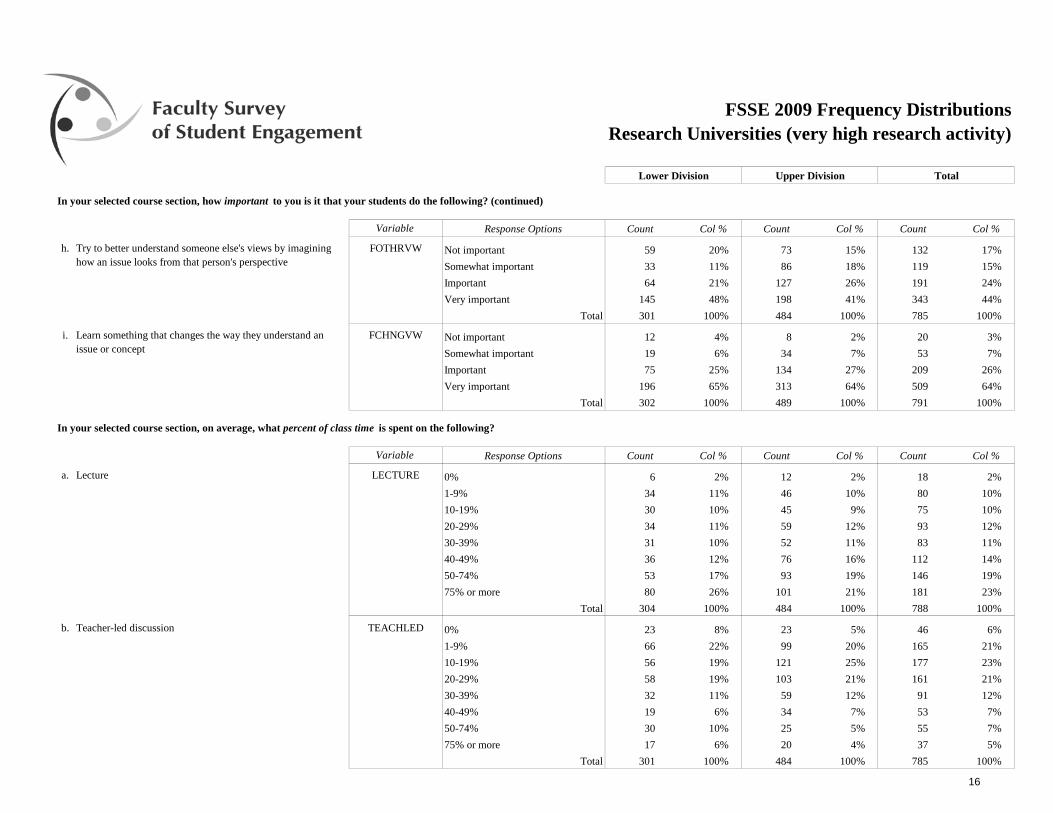
h. FOTHRVW Not important 59 20% 73 15% 132 17%Somewhat important 33 11% 86 18% 119 15%Important 64 21% 127 26% 191 24%Very important 145 48% 198 41% 343 44%
Total 301 100% 484 100% 785 100%
i. FCHNGVW Not important 12 4% 8 2% 20 3%Somewhat important 19 6% 34 7% 53 7%Important 75 25% 134 27% 209 26%Very important 196 65% 313 64% 509 64%
Total 302 100% 489 100% 791 100%
Variable Response Options Count Col % Count Col % Count Col %
a. Lecture LECTURE 0% 6 2% 12 2% 18 2%1-9% 34 11% 46 10% 80 10%10-19% 30 10% 45 9% 75 10%20-29% 34 11% 59 12% 93 12%30-39% 31 10% 52 11% 83 11%40-49% 36 12% 76 16% 112 14%50-74% 53 17% 93 19% 146 19%75% or more 80 26% 101 21% 181 23%
Total 304 100% 484 100% 788 100%
b. Teacher-led discussion TEACHLED 0% 23 8% 23 5% 46 6%1-9% 66 22% 99 20% 165 21%10-19% 56 19% 121 25% 177 23%20-29% 58 19% 103 21% 161 21%30-39% 32 11% 59 12% 91 12%40-49% 19 6% 34 7% 53 7%50-74% 30 10% 25 5% 55 7%75% or more 17 6% 20 4% 37 5%
Total 301 100% 484 100% 785 100%
In your selected course section, on average, what percent of class time is spent on the following?
Try to better understand someone else's views by imagining how an issue looks from that person's perspective
Learn something that changes the way they understand an issue or concept
In your selected course section, how important to you is it that your students do the following? (continued)
17
FSSE 2009 Frequency Distributions
Upper DivisionLower Division Total
Research Universities (very high research activity)
Variable Response Options Count Col % Count Col % Count Col %
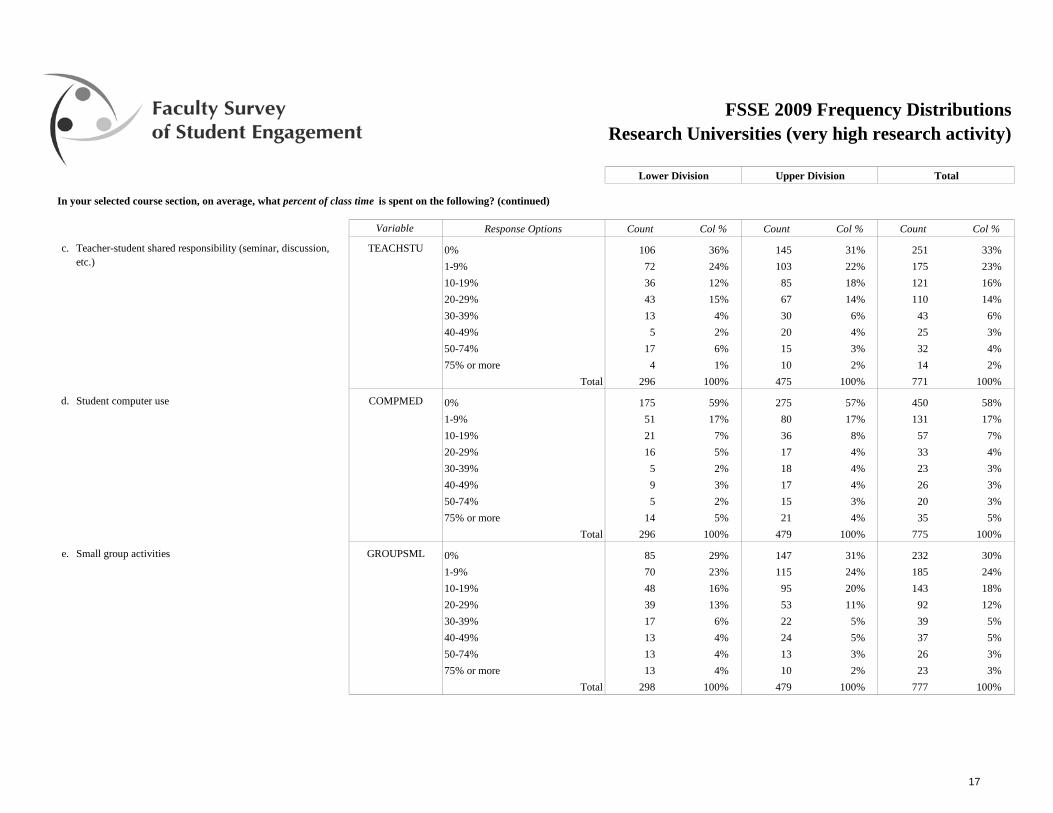
c. TEACHSTU 0% 106 36% 145 31% 251 33%1-9% 72 24% 103 22% 175 23%10-19% 36 12% 85 18% 121 16%20-29% 43 15% 67 14% 110 14%30-39% 13 4% 30 6% 43 6%40-49% 5 2% 20 4% 25 3%50-74% 17 6% 15 3% 32 4%75% or more 4 1% 10 2% 14 2%
Total 296 100% 475 100% 771 100%
d. Student computer use COMPMED 0% 175 59% 275 57% 450 58%1-9% 51 17% 80 17% 131 17%10-19% 21 7% 36 8% 57 7%20-29% 16 5% 17 4% 33 4%30-39% 5 2% 18 4% 23 3%40-49% 9 3% 17 4% 26 3%50-74% 5 2% 15 3% 20 3%75% or more 14 5% 21 4% 35 5%
Total 296 100% 479 100% 775 100%
e. Small group activities GROUPSML 0% 85 29% 147 31% 232 30%1-9% 70 23% 115 24% 185 24%10-19% 48 16% 95 20% 143 18%20-29% 39 13% 53 11% 92 12%30-39% 17 6% 22 5% 39 5%40-49% 13 4% 24 5% 37 5%50-74% 13 4% 13 3% 26 3%75% or more 13 4% 10 2% 23 3%
Total 298 100% 479 100% 777 100%
Teacher-student shared responsibility (seminar, discussion, etc.)
In your selected course section, on average, what percent of class time is spent on the following? (continued)
18
FSSE 2009 Frequency Distributions
Upper DivisionLower Division Total
Research Universities (very high research activity)
Variable Response Options Count Col % Count Col % Count Col %
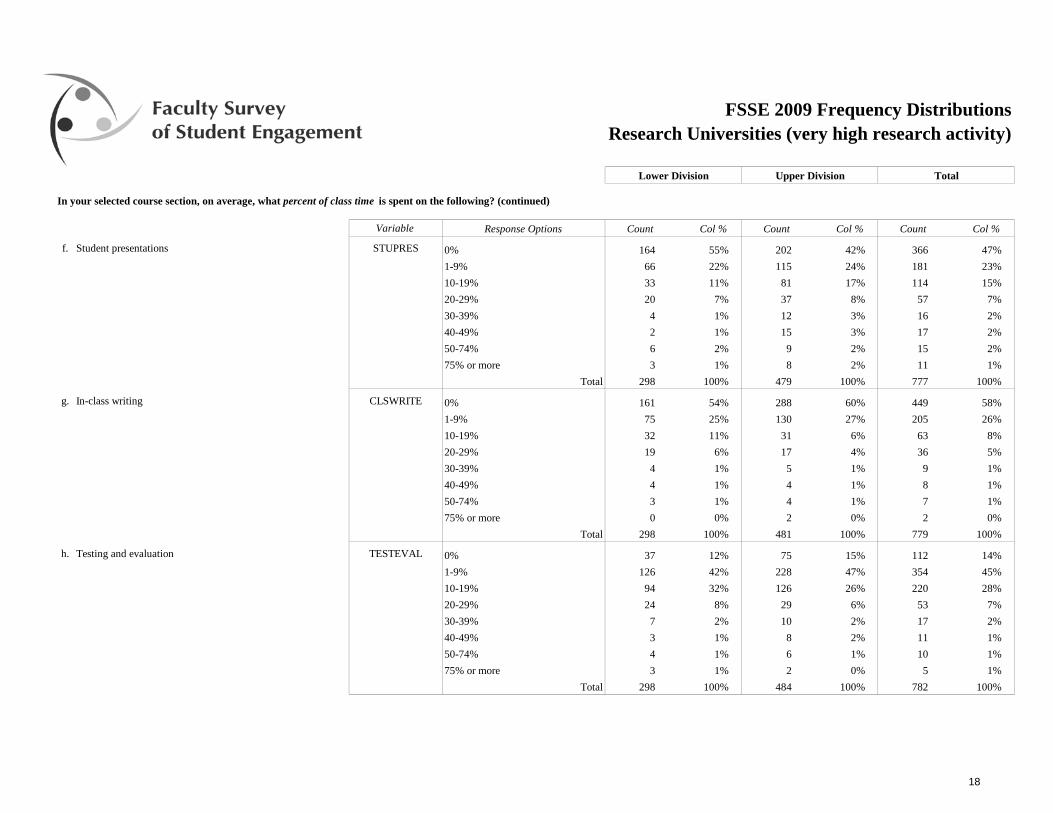
f. Student presentations STUPRES 0% 164 55% 202 42% 366 47%1-9% 66 22% 115 24% 181 23%10-19% 33 11% 81 17% 114 15%20-29% 20 7% 37 8% 57 7%30-39% 4 1% 12 3% 16 2%40-49% 2 1% 15 3% 17 2%50-74% 6 2% 9 2% 15 2%75% or more 3 1% 8 2% 11 1%
Total 298 100% 479 100% 777 100%
g. In-class writing CLSWRITE 0% 161 54% 288 60% 449 58%1-9% 75 25% 130 27% 205 26%10-19% 32 11% 31 6% 63 8%20-29% 19 6% 17 4% 36 5%30-39% 4 1% 5 1% 9 1%40-49% 4 1% 4 1% 8 1%50-74% 3 1% 4 1% 7 1%75% or more 0 0% 2 0% 2 0%
Total 298 100% 481 100% 779 100%
h. Testing and evaluation TESTEVAL 0% 37 12% 75 15% 112 14%1-9% 126 42% 228 47% 354 45%10-19% 94 32% 126 26% 220 28%20-29% 24 8% 29 6% 53 7%30-39% 7 2% 10 2% 17 2%40-49% 3 1% 8 2% 11 1%50-74% 4 1% 6 1% 10 1%75% or more 3 1% 2 0% 5 1%
Total 298 100% 484 100% 782 100%
In your selected course section, on average, what percent of class time is spent on the following? (continued)
19
FSSE 2009 Frequency Distributions
Upper DivisionLower Division Total
Research Universities (very high research activity)
Variable Response Options Count Col % Count Col % Count Col %
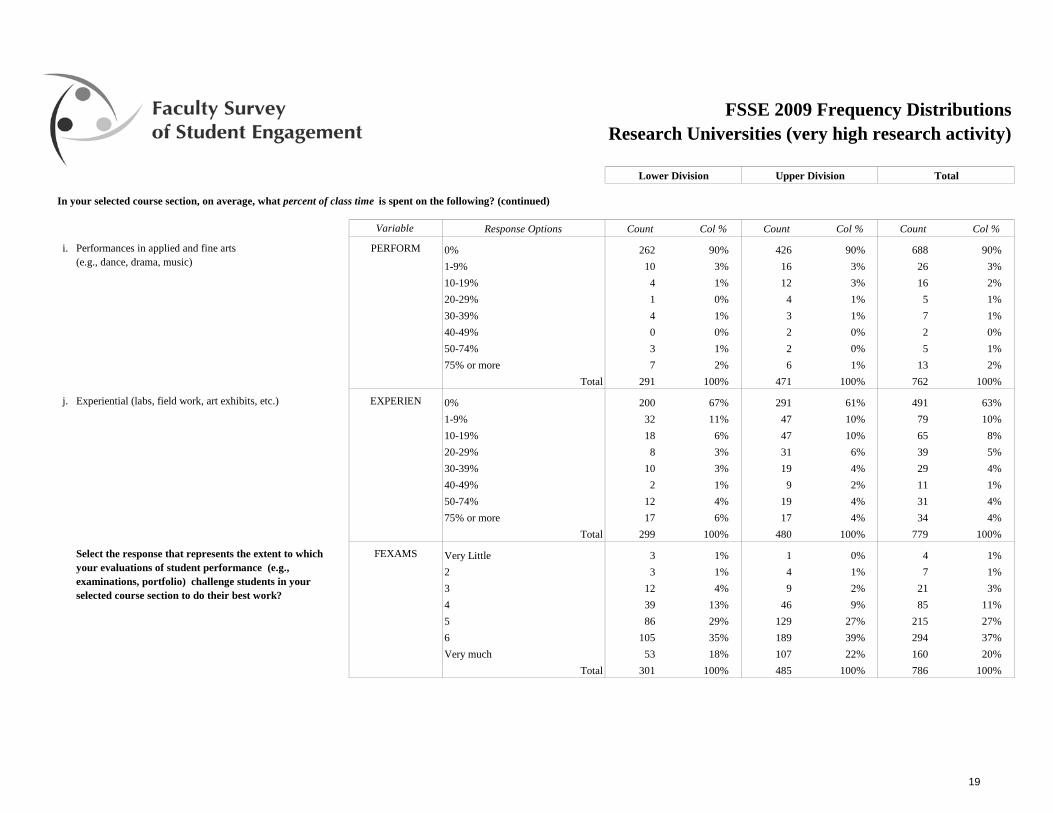
i. PERFORM 0% 262 90% 426 90% 688 90%1-9% 10 3% 16 3% 26 3%10-19% 4 1% 12 3% 16 2%20-29% 1 0% 4 1% 5 1%30-39% 4 1% 3 1% 7 1%40-49% 0 0% 2 0% 2 0%50-74% 3 1% 2 0% 5 1%75% or more 7 2% 6 1% 13 2%
Total 291 100% 471 100% 762 100%
j. Experiential (labs, field work, art exhibits, etc.) EXPERIEN 0% 200 67% 291 61% 491 63%1-9% 32 11% 47 10% 79 10%10-19% 18 6% 47 10% 65 8%20-29% 8 3% 31 6% 39 5%30-39% 10 3% 19 4% 29 4%40-49% 2 1% 9 2% 11 1%50-74% 12 4% 19 4% 31 4%75% or more 17 6% 17 4% 34 4%
Total 299 100% 480 100% 779 100%
FEXAMS Very Little 3 1% 1 0% 4 1%2 3 1% 4 1% 7 1%3 12 4% 9 2% 21 3%4 39 13% 46 9% 85 11%5 86 29% 129 27% 215 27%6 105 35% 189 39% 294 37%Very much 53 18% 107 22% 160 20%
Total 301 100% 485 100% 786 100%
Performances in applied and fine arts(e.g., dance, drama, music)
Select the response that represents the extent to which your evaluations of student performance (e.g., examinations, portfolio) challenge students in your selected course section to do their best work?
In your selected course section, on average, what percent of class time is spent on the following? (continued)
20
FSSE 2009 Frequency Distributions
Upper DivisionLower Division Total
Research Universities (very high research activity)
Variable Response Options Count Col % Count Col % Count Col %
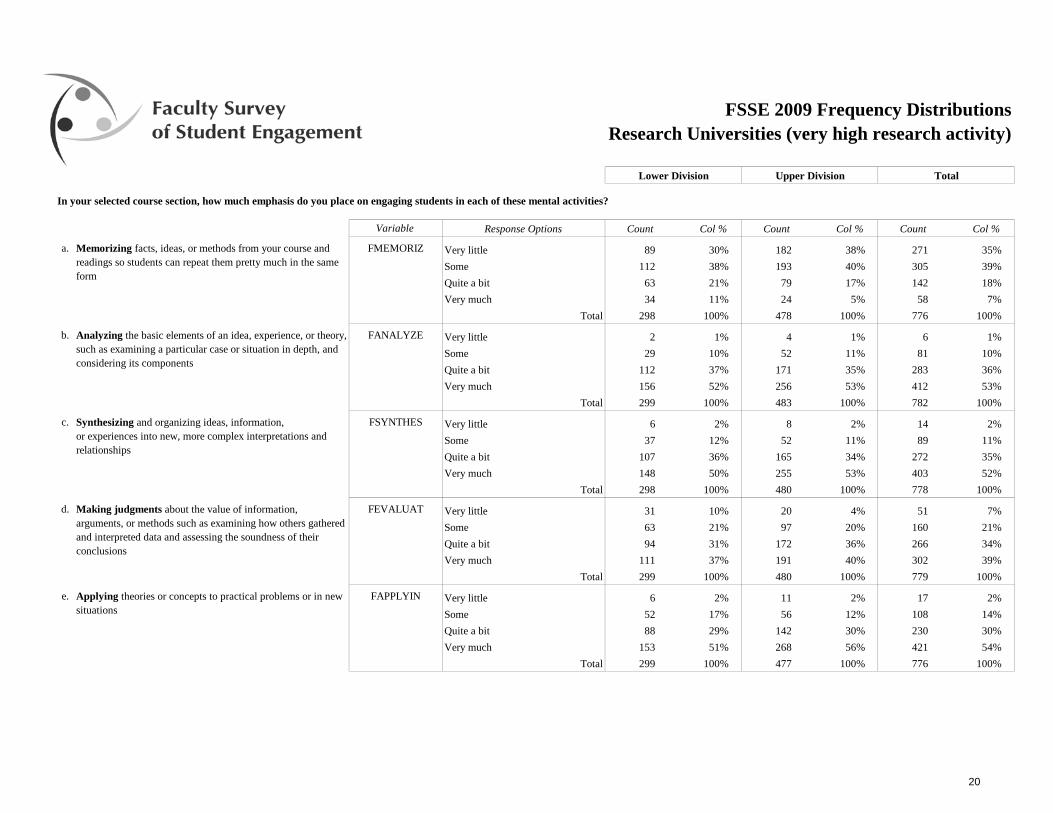
a. FMEMORIZ Very little 89 30% 182 38% 271 35%Some 112 38% 193 40% 305 39%Quite a bit 63 21% 79 17% 142 18%Very much 34 11% 24 5% 58 7%
Total 298 100% 478 100% 776 100%
b. FANALYZE Very little 2 1% 4 1% 6 1%Some 29 10% 52 11% 81 10%Quite a bit 112 37% 171 35% 283 36%Very much 156 52% 256 53% 412 53%
Total 299 100% 483 100% 782 100%
c. FSYNTHES Very little 6 2% 8 2% 14 2%Some 37 12% 52 11% 89 11%Quite a bit 107 36% 165 34% 272 35%Very much 148 50% 255 53% 403 52%
Total 298 100% 480 100% 778 100%
d. FEVALUAT Very little 31 10% 20 4% 51 7%Some 63 21% 97 20% 160 21%Quite a bit 94 31% 172 36% 266 34%Very much 111 37% 191 40% 302 39%
Total 299 100% 480 100% 779 100%
e. FAPPLYIN Very little 6 2% 11 2% 17 2%Some 52 17% 56 12% 108 14%Quite a bit 88 29% 142 30% 230 30%Very much 153 51% 268 56% 421 54%
Total 299 100% 477 100% 776 100%
In your selected course section, how much emphasis do you place on engaging students in each of these mental activities?
Memorizing facts, ideas, or methods from your course and readings so students can repeat them pretty much in the same form
Analyzing the basic elements of an idea, experience, or theory, such as examining a particular case or situation in depth, and considering its components
Synthesizing and organizing ideas, information,or experiences into new, more complex interpretations and relationships
Applying theories or concepts to practical problems or in new situations
Making judgments about the value of information, arguments, or methods such as examining how others gathered and interpreted data and assessing the soundness of their conclusions
21
FSSE 2009 Frequency Distributions
Upper DivisionLower Division Total
Research Universities (very high research activity)
Variable Response Options Count Col % Count Col % Count Col %
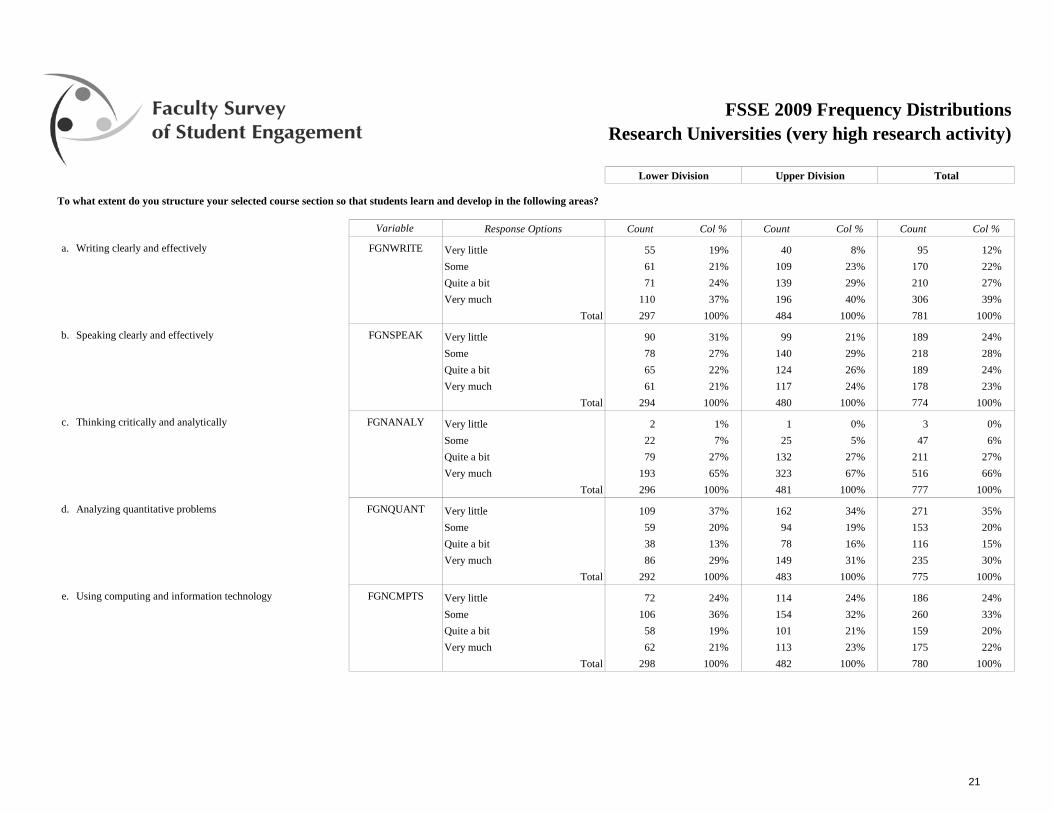
a. FGNWRITE Very little 55 19% 40 8% 95 12%Some 61 21% 109 23% 170 22%Quite a bit 71 24% 139 29% 210 27%Very much 110 37% 196 40% 306 39%
Total 297 100% 484 100% 781 100%
b. FGNSPEAK Very little 90 31% 99 21% 189 24%Some 78 27% 140 29% 218 28%Quite a bit 65 22% 124 26% 189 24%Very much 61 21% 117 24% 178 23%
Total 294 100% 480 100% 774 100%
c. FGNANALY Very little 2 1% 1 0% 3 0%Some 22 7% 25 5% 47 6%Quite a bit 79 27% 132 27% 211 27%Very much 193 65% 323 67% 516 66%
Total 296 100% 481 100% 777 100%
d. FGNQUANT Very little 109 37% 162 34% 271 35%Some 59 20% 94 19% 153 20%Quite a bit 38 13% 78 16% 116 15%Very much 86 29% 149 31% 235 30%
Total 292 100% 483 100% 775 100%
e. FGNCMPTS Very little 72 24% 114 24% 186 24%Some 106 36% 154 32% 260 33%Quite a bit 58 19% 101 21% 159 20%Very much 62 21% 113 23% 175 22%
Total 298 100% 482 100% 780 100%
Writing clearly and effectively
Speaking clearly and effectively
To what extent do you structure your selected course section so that students learn and develop in the following areas?
Analyzing quantitative problems
Using computing and information technology
Thinking critically and analytically
22
FSSE 2009 Frequency Distributions
Upper DivisionLower Division Total
Research Universities (very high research activity)
Variable Response Options Count Col % Count Col % Count Col %
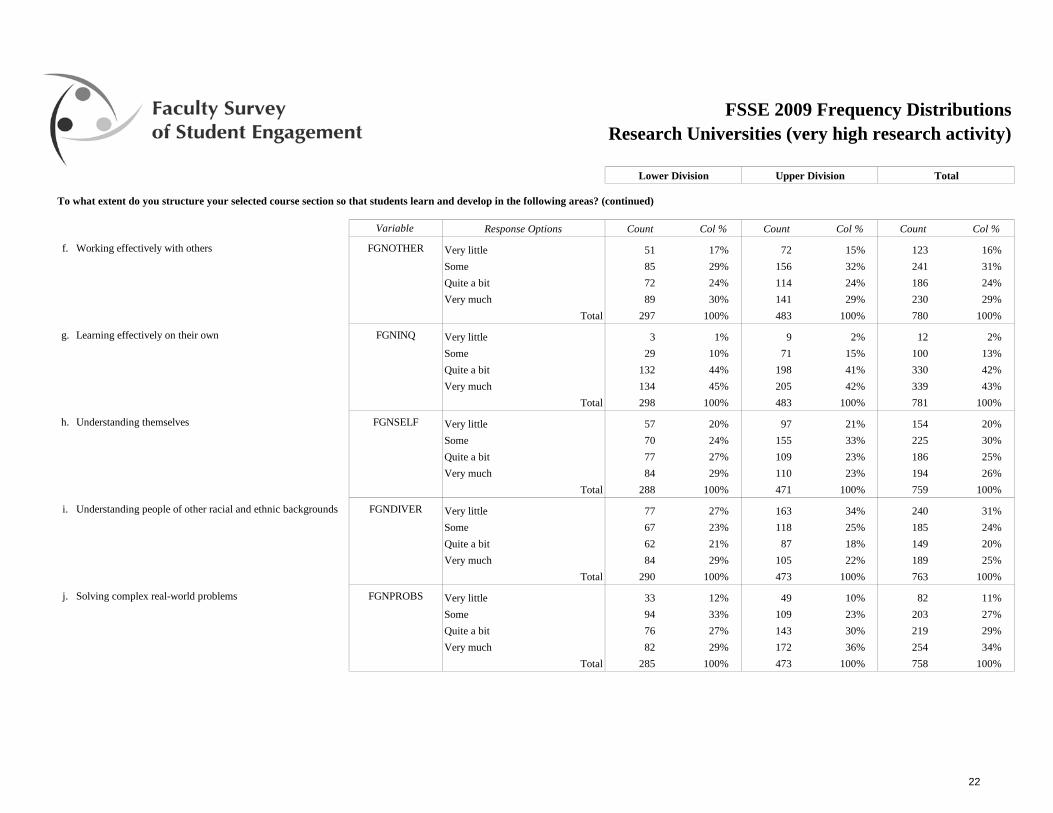
f. FGNOTHER Very little 51 17% 72 15% 123 16%Some 85 29% 156 32% 241 31%Quite a bit 72 24% 114 24% 186 24%Very much 89 30% 141 29% 230 29%
Total 297 100% 483 100% 780 100%
g. FGNINQ Very little 3 1% 9 2% 12 2%Some 29 10% 71 15% 100 13%Quite a bit 132 44% 198 41% 330 42%Very much 134 45% 205 42% 339 43%
Total 298 100% 483 100% 781 100%
h. FGNSELF Very little 57 20% 97 21% 154 20%Some 70 24% 155 33% 225 30%Quite a bit 77 27% 109 23% 186 25%Very much 84 29% 110 23% 194 26%
Total 288 100% 471 100% 759 100%
i. FGNDIVER Very little 77 27% 163 34% 240 31%Some 67 23% 118 25% 185 24%Quite a bit 62 21% 87 18% 149 20%Very much 84 29% 105 22% 189 25%
Total 290 100% 473 100% 763 100%
j. FGNPROBS Very little 33 12% 49 10% 82 11%Some 94 33% 109 23% 203 27%Quite a bit 76 27% 143 30% 219 29%Very much 82 29% 172 36% 254 34%
Total 285 100% 473 100% 758 100%
Solving complex real-world problems
Learning effectively on their own
Understanding people of other racial and ethnic backgrounds
To what extent do you structure your selected course section so that students learn and develop in the following areas? (continued)
Understanding themselves
Working effectively with others
23
FSSE 2009 Frequency Distributions
Upper DivisionLower Division Total
Research Universities (very high research activity)
Variable Response Options Count Col % Count Col % Count Col %
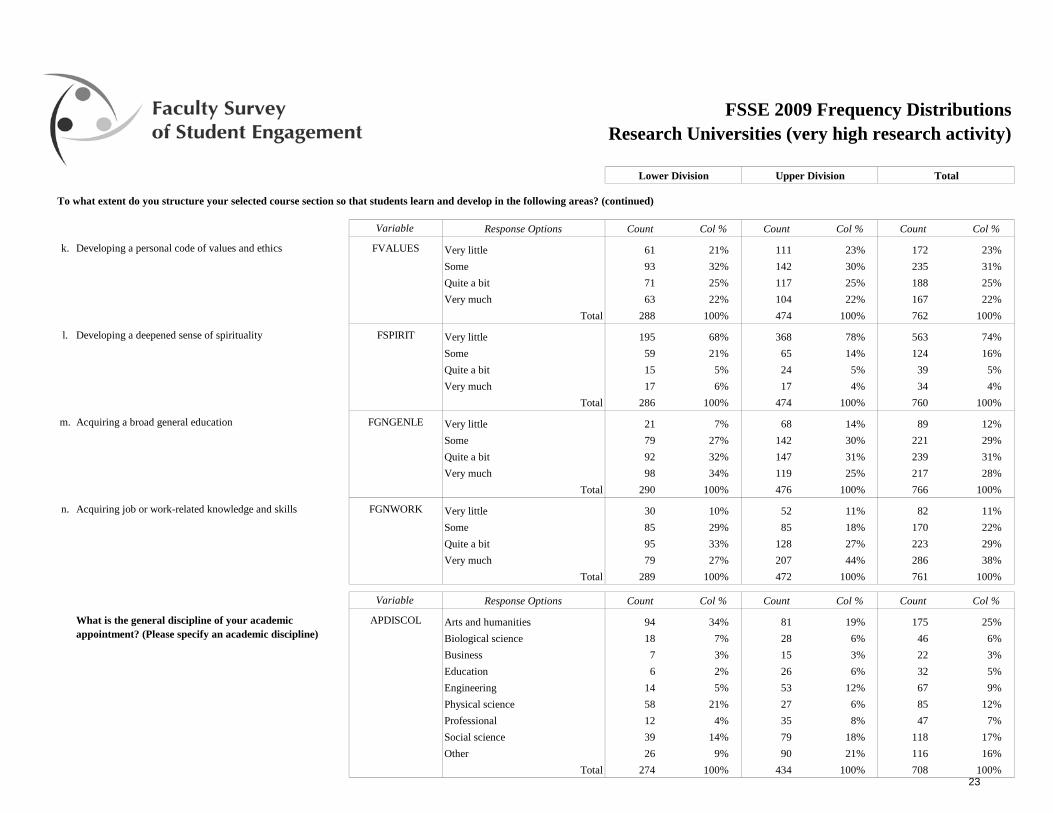
k. FVALUES Very little 61 21% 111 23% 172 23%Some 93 32% 142 30% 235 31%Quite a bit 71 25% 117 25% 188 25%Very much 63 22% 104 22% 167 22%
Total 288 100% 474 100% 762 100%
l. FSPIRIT Very little 195 68% 368 78% 563 74%Some 59 21% 65 14% 124 16%Quite a bit 15 5% 24 5% 39 5%Very much 17 6% 17 4% 34 4%
Total 286 100% 474 100% 760 100%
m. Acquiring a broad general education FGNGENLE Very little 21 7% 68 14% 89 12%Some 79 27% 142 30% 221 29%Quite a bit 92 32% 147 31% 239 31%Very much 98 34% 119 25% 217 28%
Total 290 100% 476 100% 766 100%
n. FGNWORK Very little 30 10% 52 11% 82 11%Some 85 29% 85 18% 170 22%Quite a bit 95 33% 128 27% 223 29%Very much 79 27% 207 44% 286 38%
Total 289 100% 472 100% 761 100%
Variable Response Options Count Col % Count Col % Count Col %
APDISCOL Arts and humanities 94 34% 81 19% 175 25%Biological science 18 7% 28 6% 46 6%Business 7 3% 15 3% 22 3%Education 6 2% 26 6% 32 5%Engineering 14 5% 53 12% 67 9%Physical science 58 21% 27 6% 85 12%Professional 12 4% 35 8% 47 7%Social science 39 14% 79 18% 118 17%Other 26 9% 90 21% 116 16%
Total 274 100% 434 100% 708 100%
What is the general discipline of your academic appointment? (Please specify an academic discipline)
To what extent do you structure your selected course section so that students learn and develop in the following areas? (continued)
Developing a personal code of values and ethics
Developing a deepened sense of spirituality
Acquiring job or work-related knowledge and skills