research uptake management: a strategic framework …
TRANSCRIPT
RESEARCH UPTAKE MANAGEMENT: A STRATEGIC
FRAMEWORK FOR INSTITUTIONALISING RESEARCH UPTAKE
AT THE KWAME NKRUMAH UNIVERSITY OF SCIENCE AND
TECHNOLOGY, KUMASI
Dissertation presented in partial fulfilment of the requirements for the degree of PhD in Science and Technology Studies in the Faculty of Arts
and Social Sciences at Stellenbosch University
Supervisor: Prof Johann Mouton Co-supervisor: Prof. Sara (Saartjie) Grobbelaar
December 2019
byDr Vincent Anum Ankamah-Lomotey

i
DECLARATION
By submitting this dissertation electronically, I declare that the entirety of the work contained
therein is my own, original work, that I am the sole author thereof (save to the extent explicitly
otherwise stated), that reproduction and publication thereof by Stellenbosch University will not
infringe any third party rights and that I have not previously in its entirety or in part submitted it for
obtaining any qualification.
Date: December 2019
Copyright © 2019 Stellenbosch University
All rights reserved
Stellenbosch University https://scholar.sun.ac.za
iii
Abstract This study examined the issue of research uptake and research uptake management with particular
reference to how these can be institutionalised within an organisation. The focus was to propose a
strategic framework that identifies pathways and activities necessary for research uptake suitable for
the Kwame Nkrumah University of Science and Technology (KNUST), Ghana. The broader impact of
the study is its implication to the management of research.
Generally, research is aimed at advancing knowledge, influencing policy, improving practice and
resolving socio-economic problems. The expectation that knowledge produced by universities and
research institutes should affect human life has led to the increasing demand for knowledge
utilisation. Ghana’s foremost technological institution, KNUST, was set up to provide the necessary
technological manpower and knowledge for the labour market. Essentially, its mandate is to provide
higher education, undertake research, disseminate knowledge and foster relationships with
stakeholders. Undertaking research and disseminating knowledge imply taking research beyond the
confines of the laboratory and publication in refereed journals to society. Developmental research for
which KNUST is noted has to reach other major stakeholders, such as small and medium-scale
industry, farmers and policymakers. The management of research in the university ought to make this
a priority.
The aim of the study was to address the problem of research uptake and utilisation by examining the
need for a policy framework to institutionalise research uptake at KNUST. The proposed framework
takes a critical look at the planning and generation of developmental research at KNUST and the
mechanisms and activities necessary for research uptake.
The study, which employed a survey and interviews with researchers at KNUST, established that the
expected areas of research impact are solving environment and social problems, influencing policy,
influencing practice and solving immediate and technical problems. However, the extent to which
researchers have been successful in these areas was found to be below expectation compared to
advancement of knowledge and solving theoretical problems, which seemed to be the main focus of
researchers. It was found that, although there are several areas where the university can play a role
in local and national development, the research agenda and focus of researchers at KNUST as well as
of faculties and colleges are aimed at advancement of knowledge and solving theoretical problems.
There were however, a few examples of research that had influenced national policy and practice. A
policy shift is therefore necessary to correct this if the university is to make an appreciable impact on
society.
Stellenbosch University https://scholar.sun.ac.za
iv
It was observed that, as far as engagement with stakeholders is concerned, researchers engage mostly
with scientists and researchers from other universities and research institutes. The mechanisms and
channels of engagement varied from stakeholder to stakeholder and from faculty to faculty. Generally,
it seems researchers at KNUST mostly engage through conferences, workshops and seminars.
Researchers generally consider it very beneficial if their research provides opportunities for further
research, opens avenues for collaboration and funding, their research is used, and if it influences
practice. In order for acceptance, adoption and possible use of research findings, researchers largely
agree that stakeholders should be involved in the research process at the research formulation and
proposal stages. The most common reason given for stakeholders not using research findings that
could be beneficial to them was attributed to financial constraints on the side of researchers and
stakeholders for dissemination and implementation of research findings.
From the findings, a policy framework for institutionalising research uptake is proposed. This
framework incorporates pathways, mechanisms and channels of engagement that facilitate research
uptake.
Stellenbosch University https://scholar.sun.ac.za
v
Opsomming Hierdie studie het die kwessie van navorsingsopname en navorsingsopnamebestuur ondersoek, met
spesifieke verwysing na hoe dit binne 'n organisasie geïnstitusionaliseer kan word. Die fokus was om
'n strategiese raamwerk voor te stel wat roetes en aktiwiteite identifiseer wat nodig is vir
navorsingsopname wat geskik is vir die Kwame Nkrumah Universiteit van Wetenskap en Tegnologie
(KNUST), Ghana. Die breër impak van die studie is die implikasie daarvan op die bestuur van navorsing.
Oor die algemeen is navorsing daarop gemik om kennis te bevorder, beleid te beïnvloed, praktyk te
verbeter en sosio-ekonomiese probleme op te los. Die verwagting dat kennis wat deur universiteite
en navorsingsinstitute gelewer word, die mens se lewe moet verbeter, het gelei tot die toenemende
vraag na kennisbenutting. Ghana se voorste tegnologiese instelling, KNUST, is gestig om die nodige
tegnologiese mannekrag en kennis vir die arbeidsmark te verskaf. In wese is sy mandaat om hoër
onderwys te lewer, navorsing te onderneem, kennis te versprei en verhoudings met belanghebbendes
te bevorder. Die onderneming van navorsing en verspreiding van kennis impliseer dat navorsing oor
die grense van die laboratorium en publikasie in referentydskrifte na die samelewing plaasvind.
Ontwikkelingsnavorsing waarvoor KNUST erken word, moet belangrike belanghebbendes bereik, soos
klein en middelgrote bedrywe, boere en beleidmakers. Die bestuur van navorsing in die universiteit
moet dit dus 'n prioriteit maak.
Die doel van die studie was om die probleem van navorsingsopname en -benutting aan te spreek deur
die behoefte aan 'n beleidsraamwerk te ondersoek om navorsingsopname by KNUST te
institusionaliseer. Die voorgestelde raamwerk neem 'n kritiese blik op die beplanning en onderneming
van ontwikkelingsnavorsing by KNUST en die meganismes en aktiwiteite wat nodig is vir
navorsingsopname.
Die studie, waardeur 'n opname en onderhoude met navorsers by KNUST voltooi is, het bepaal dat die
verwagte navorsingsinvloede die oplossing is van omgewings- en sosiale probleme, beleid
beïnvloeding, praktyk beïnvloeding en om onmiddellike en tegniese probleme op te los. Die mate
waarin navorsers daarin geslaag het, was egter laer as die verwagte vertoning in vergelyking met die
bevordering van kennis en die oplos van teoretiese probleme, wat oor die algemeen navorsers se hoof
fokus blyk te wees. Daar is bevind dat die navorsingsagenda en fokus van navorsers by KNUST sowel
as fakulteite en kolleges op verskeie gebiede waar die universiteit 'n rol kan speel in plaaslike en
nasionale ontwikkeling, gemik is op die bevordering van kennis en die oplos van teoretiese probleme.
Daar was egter enkele voorbeelde van navorsing wat nasionale beleid en praktyk beïnvloed het. 'n
Beleidsverskuiwing is dus nodig om dit reg te stel indien die universiteit 'n merkbare impak op die
samelewing sou wou maak.
Stellenbosch University https://scholar.sun.ac.za
vi
Wat betref betrokkenheid by belanghebbendes, is daar gevind dat navorsers veral betrokke is by
projekte saam met wetenskaplikes en navorsers van ander universiteite en navorsingsinrigtings. Die
meganismes en kanale van betrokkenheid wissel van belanghebbende tot belanghebbende en van
fakulteit tot fakulteit. Oor die algemeen lyk dit of navorsers by KNUST meestal betrokke is by
konferensies, werkswinkels en seminare. Navorsers beskou dit oor die algemeen as baie voordelig
indien hul navorsing geleenthede bied vir verdere navorsing, “oop” maniere vir samewerking en
befondsing, navorsingsbenutting, en om praktyk te beïnvloed. Ten einde die gebruik van
navorsingsbevindings, stem navorsers grootliks saam dat belanghebbendes by die navorsingsproses
betrokke moet wees in navorsingsformulerings en -voorstelle. Die mees algemene rede vir
belanghebbendes wat nie navorsingsbevindings gebruik wat voordelig vir hulle sou wees nie, is
toegeskryf aan finansiële beperkings en die verspreiding en implementering van
navorsingsbevindings.
Uit die bogenoemde bevindings word 'n beleidsraamwerk vir die institusionalisering van
navorsingsopname voorgestel. Hierdie raamwerk bevat roetes, meganismes en kanale van
betrokkenheid wat navorsingsopname sou kon fasiliteer.
Stellenbosch University https://scholar.sun.ac.za
vii
Acknowledgements This study is dedicated to the glory of God, the source of all wisdom and life, and to all who contributed
in diverse ways to make the study a success. The contributions of the following people to the outcome
of this study are very much appreciated:
• Professor Johann Mouton, my supervisor, Professor Sara (Saartjie) Grobbelaar, my co-supervisor,
for constructive, insightful inputs and guidance.
• Professor William O. Ellis the immediate past vice-chancellor, KNUST, Professor Peter Donkor,
former pro vice-chancellor, the late Mr Kobby Yebo-Okrah, former registrar, KNUST, Professor
Kwasi Obiri-Danso, vice-chancellor and DRUSSA leader, KNUST and Mr Andrews Kwasi Boateng,
registrar, for all their support.
• DFID-DRUSSA, for sponsoring the studies
• Dr J. O. Darko for the encouragement and initial editing.
• Miss Linda Esi Aduku, research assistant and all the field assistants
• Ms Marthie van Niekerk, Bernia and Rolene of CREST, for all the administrative support.
• CREST, for all the academic and administrative support.
• My wife Alberta Y. Lomotey, children (Naa Adoley, Naa Adorkor and Emmanuel Nii Adokwei), and
my brother-law Mr Nii Tetteh Oko-Odoi (Uncle Oshishi) for their love and support.
• All leaders and members of Pentecost International Worship Centre (PIWC) Asokwa, for the
encouragement.
•
•
•
•
Stellenbosch University https://scholar.sun.ac.za
viii
Table of Contents
RESEARCH UPTAKE MANAGEMENT: A STRATEGIC FRAMEWORK FOR INSTITUTIONALISING RESEARCH
UPTAKE AT THE KWAME NKRUMAH UNIVERSITY OF SCIENCE AND TECHNOLOGY, KUMASI ................ 1
List of abbreviations and acronyms ...................................................................................................... xix
CHAPTER 1: INTRODUCTION ......................................................................................................... 24
1.1 Some historical perspectives and knowledge utilisation in retrospect ........................................ 24
1.2 Research uptake management ..................................................................................................... 25
1.3 Brief history of KNUST .............................................................................................................. 28
1.4 Rationale for study ...................................................................................................................... 31
1.5 Structure of thesis ....................................................................................................................... 33
CHAPTER 2 – LITERATURE REVIEW: THE CLASSIC WORKS OF THE FIELD OF
KNOWLEDGE UTILISATION ........................................................................................................... 36
2.1 Introduction: The history of research utilisation ......................................................................... 36
2.1.1 The waves of knowledge utilisation ..................................................................................... 36
2.2 Defining the field ........................................................................................................................ 38
2.2.1. Technology transfer ............................................................................................................ 38
2.2.2 Knowledge adoption ............................................................................................................ 39
2.2.3 Knowledge transfer and exchange ....................................................................................... 39
2.2.4 Knowledge utilisation .......................................................................................................... 39
2.2.5 Knowledge translation ......................................................................................................... 39
2.2.6 Diffusion of innovation ........................................................................................................ 40
2.2.7 Dissemination and communication ...................................................................................... 40
2.3 Uses of knowledge ...................................................................................................................... 41
2.3.1 Types of research ................................................................................................................. 41
2.3.2 Instrumental use ................................................................................................................... 42
2.3.3 Conceptual use ..................................................................................................................... 42
2.3.4 Symbolic use ........................................................................................................................ 43
2.4 The most influential classic models of knowledge utilisation .................................................... 43
2.4.1 Everett M Rogers – The diffusion of innovation ................................................................. 44
2.4.2 Ronald G Havelock – Understanding the process of dissemination and utilisation ............ 44
2.4.3 Carol Weiss – The many meanings of research utilisation .................................................. 45
Stellenbosch University https://scholar.sun.ac.za
ix
2.4.4 Robert F Rich – Perspectives of knowledge utilisation ....................................................... 46
2.4.5 Nathan Caplan – The two communities’ perspective .......................................................... 46
2.4.6 Huberman – Theory-to-practice model of KU ..................................................................... 47
2.4.7 Landry et al. –Models of knowledge utilisation .................................................................. 47
2.4.8 Conclusion of this sub-section ............................................................................................. 48
2.5 Frameworks for research uptake ................................................................................................. 48
2.5.1 Bozeman’s research utilisation framework .......................................................................... 49
2.5.2 Jacobson et al.’s framework for RU ..................................................................................... 51
2.5.3 Sudsawad’s framework for RU ............................................................................................ 52
2.5.4 Graham and Logan’s framework ......................................................................................... 55
2.5.5 Landry et al. and Lavis et al.’s frameworks ......................................................................... 57
2.5.6 Becheikh and Ziam’s framework for RU ............................................................................. 58
2.5.7 Wilson and Petticrew’s framework for RU .......................................................................... 59
2.5.8 Ellen et al.’s framework ....................................................................................................... 60
2.5.9 Cherney et al.’s framework .................................................................................................. 61
2.5.10 Grobbelaar and Harber’s framework ................................................................................. 62
2.5.11 Mouton’s principles ........................................................................................................... 66
2.5.12 Conclusion of this section .................................................................................................. 67
CHAPTER 3 – UNIVERSITIES AND RESEARCH UPTAKE .......................................................... 68
3.1 The role of universities in society ............................................................................................... 68
3.1.1 The importance of knowledge utilisation ............................................................................. 70
3.1.2 Developmental university and the African context .............................................................. 71
3.1.3 The entrepreneurial paradigm .............................................................................................. 76
3.1.4 The triple helix, quadruple helix and quintuple helix .......................................................... 78
3.1.6 Conclusion of this sub-section ............................................................................................. 80
3.2. Pathways to research uptake ...................................................................................................... 80
3.2.1 Pathways to the developmental role of the university.......................................................... 80
3.2.2 DRUSSA statements of good practice ................................................................................. 83
3.3 Barriers and facilitators to research utilisation............................................................................ 85
3.3.1 Barriers to research uptake ................................................................................................... 86
3.3.2 Facilitators to research utilisation ........................................................................................ 89
Stellenbosch University https://scholar.sun.ac.za
x
3.4 Strategies for research utilisation ................................................................................................ 94
3.4.1 Research uptake strategies at institutional level ................................................................... 94
3.4.2 Examples of institutional level RU strategy ....................................................................... 105
3.4.3 Key elements of research uptake........................................................................................ 107
3.5 Conclusion ................................................................................................................................ 109
CHAPTER 4 – RESEARCH EFFORTS AT KNUST ........................................................................ 110
4.1 Introduction ............................................................................................................................... 110
4.2 Background on the research system in Ghana .......................................................................... 110
4.3 Research trends at KNUST ....................................................................................................... 114
4.3.1 Research profile of KNUST ............................................................................................... 115
4.3.2 Staff publication ratio for the colleges of KNUST ............................................................ 119
4.3.3 Five-year trend analysis of research output (2011/2012 to 2015/2016) ............................. 121
4.3.4 Publication trends from 2009 to 2015 ................................................................................ 125
4.4 Research funding at KNUST .................................................................................................... 126
4.5 Conclusion ................................................................................................................................ 130
CHAPTER 5 – RESEARCH DESIGN AND METHODS ................................................................. 130
5.1 Justification ............................................................................................................................... 130
5.2 Key issues and focus ................................................................................................................. 131
5.3 Conceptual framework .............................................................................................................. 133
5.4 Analytical framework ............................................................................................................... 134
5.5 Overarching research design mapping exercise ........................................................................ 137
5.6 Survey instrument framework ................................................................................................... 139
5.6.1 Document analysis ............................................................................................................. 139
5.6.1.1 Source 1: Document analysis .......................................................................................... 142
5.6.2 Survey ................................................................................................................................ 143
5.6.2.1 Ethical considerations ..................................................................................................... 147
5.6.2.2 Source 2: Survey framework ........................................................................................... 147
5.6.2.3 Sources of options to survey instruments........................................................................ 150
5.6.3 Interviews ........................................................................................................................... 159
5.6.3.1 Source 3: Interviews framework ..................................................................................... 159
5.6.4 Data analysis ...................................................................................................................... 161
Stellenbosch University https://scholar.sun.ac.za
xi
5.7 Administration of survey and interviews .................................................................................. 161
5.7.1 Analysis of the survey ........................................................................................................ 163
5.7.2 Analysis of interviews ........................................................................................................ 163
5.8 Conclusion ................................................................................................................................ 166
CHAPTER 6 – NATIONAL AND LOCAL DEVELOPMENTAL FOCUS WHERE THE
UNIVERSITY CAN PLAY A ROLE ................................................................................................ 168
6.1 National development planning ................................................................................................ 168
6.1.1 The national development planning commission ............................................................... 168
6.1.2 The national development focus ........................................................................................ 169
6.1.3 The agricultural sector and the role of the university ........................................................ 171
6.2 The role of the university in local industrial growth ................................................................. 175
6.3 The role of the university in education ..................................................................................... 176
6.4 The role of the university in healthcare .................................................................................... 183
6.5 Conclusion ................................................................................................................................ 185
CHAPTER 7 – SURVEY RESULTS AND ANALYSIS ................................................................... 187
7.1 Introduction ............................................................................................................................... 187
7.2 Distribution of researchers by faculties .................................................................................... 187
7.3 Demographics and their correlation to research outputs ........................................................... 190
7.3.1 Research outputs over last three years ............................................................................... 190
7.3.2 Other research outputs ....................................................................................................... 195
7.3.3 Number of respondents by position ................................................................................... 196
7.3.4 Number of respondents by academic qualification ............................................................ 197
7.3.5 Gender and research output ................................................................................................ 198
7.3.6 Age and research output ..................................................................................................... 202
7.3.7 Departments or faculties and research output .................................................................... 207
7.3.8 Position and research output .............................................................................................. 215
7.3.9 Qualification and research output ...................................................................................... 218
7.4 Research development focus and impact .................................................................................. 219
7.4.1 Rate of success in research impact ..................................................................................... 219
7.4.2 Research success of different faculties .............................................................................. 222
7.4.3 Overall research success of faculties.................................................................................. 227
Stellenbosch University https://scholar.sun.ac.za
xii
7.4.4 Conclusion ......................................................................................................................... 232
CHAPTER 8 – CHANNELS AND MECHANISMS OF STAKEHOLDER ENGAGEMENT ........ 233
8.1 Introduction ............................................................................................................................... 233
8.2 Stakeholders mostly engaged by researchers ............................................................................ 234
8.3 Engagement with communities ................................................................................................. 236
8.3.1 Typical engagement with communities ............................................................................. 236
Every month .................................................................................................................................... 237
8.3.2 Benefits of engagements with communities ...................................................................... 243
8.3.3 Stages of involvement of communities in research ............................................................ 247
8.3.4 Reasons why communities do not use research findings ................................................... 249
8.4 Engagement with private sector ................................................................................................ 252
8.4.1 Typical engagement with private sector ............................................................................ 252
8.4.2 Benefits of engagement with the private sector ................................................................. 257
8.4.3 Stages of involvement with the private sector ................................................................... 259
8.4.4 Reasons why the private sector does not use research findings ......................................... 261
8.5 Engagements with governments and parastatals ....................................................................... 264
8.5.1 Typical engagement with governments and parastatals ..................................................... 264
8.5.2 Benefits of engagement with governments and parastatals ............................................... 269
8.5.3 Stages of involvement of governments and parastatals ..................................................... 271
8.5.4 Reasons why governments and parastatals do not use research findings........................... 273
8.6 Engagements with scientists and researchers ............................................................................ 276
8.6.1 Typical engagement with scientists and researchers from other universities and institutes
.................................................................................................................................................... 276
8.6.2 Benefits of engagement with scientists and researchers from other universities and
institutes ...................................................................................................................................... 282
8.6.3 Stages of involvement of scientists and researchers from other universities and institutes
.................................................................................................................................................... 284
8.6.4 Reasons why scientists and researchers do not make use of research findings ................. 285
8.7 Engagements with non-governmental organisations ................................................................ 288
8.7.1 Typical engagement with non-governmental organisations............................................... 288
8.7.2 Benefits of engagement with NGOs .................................................................................. 293
8.7.3 Stages of involvement of NGOs ........................................................................................ 295
Stellenbosch University https://scholar.sun.ac.za
xiii
8.7.4 Reasons why NGOs do not use research findings ............................................................. 297
8.8 Conclusion ................................................................................................................................ 299
CHAPTER 9 – CONCLUSIONS AND RECOMMENDATIONS .................................................... 303
9.1 Introduction ............................................................................................................................... 303
9.2 Proposed framework for research uptake .................................................................................. 303
9.3 Demographic deductions .......................................................................................................... 308
9.3.1 Research outputs ................................................................................................................ 308
9.3.2 Gender and research output (articles published) ................................................................ 308
9.3.3 Age and research output ..................................................................................................... 308
9.3.4 Age and academic qualification ......................................................................................... 308
9.4 Towards a framework for research uptake ................................................................................ 308
9.4.1 Mechanisms and channels of engagement ......................................................................... 308
9.4.2 Facilitators and barriers to research uptake ........................................................................ 312
9.4.3 University actions to facilitate research uptake ................................................................. 314
9.4.4 Pathways to research uptake .............................................................................................. 316
9.5 Conclusions of the study ........................................................................................................... 318
9.6 Recommendations ..................................................................................................................... 319
9.7 Challenges to the study ............................................................................................................. 321
9.8 Future studies ............................................................................................................................ 321
LIST OF REFERENCES .................................................................................................................... 322
APPENDICES .................................................................................................................................... 336
1. SAMPLE OF SURVEY INSTRUMENT ........................................................................... 336
2. PhD Graduates from 2009-2017 ......................................................................................... 355
3. Responses by Position ......................................................................................................... 356
4. Age Distribution of Respondents ........................................................................................ 357
5. Faculty versus research output (articles published or accepted) ......................................... 357
6. Overall research performance for KNUST 2013-2017 ....................................................... 358
7. Summary of cross-tabulation of engagement in terms of position and stakeholders three or
four times a year .......................................................................................................................... 359
8. Summary of overall engagement of faculties with stakeholders three or four times a year 359
B.1 Summary of literature sources for stakeholders engaged with ............................................. 360
Stellenbosch University https://scholar.sun.ac.za
xiv
C.1 Summary of channels of engagement with communities ..................................................... 361
C.2 Summary of benefits of engagement with communities ...................................................... 362
C.3 Summary of stages of involvement of communities in research process ............................. 362
D.1 Summary of channels of engagement with industry ............................................................ 364
D.2 Summary of benefits of engagement with private sector ..................................................... 365
D.3 Summary of stages of involving private sector in the research process ............................... 365
D.4 Summary of barriers to research uptake when engaging with the private sector ................. 365
E.1 Summary of channels of engagement with government and parastatals .............................. 366
E.2 Summary of benefits of engagement with government and parastatals ............................... 367
E.3 Summary of stages of involving government and parastatals in the research process ......... 368
E.4 Summary of barriers to research uptake when engaging with government and parastatals . 368
F.1 Summary of channels of engagement with scientists and researchers from other universities
and research institutes ................................................................................................................. 369
F.2 Summary of benefits of engagement with scientists and researchers from other universities
and research institutes ................................................................................................................. 370
F.3 Summary of stages of involving scientists and researchers from other universities and
research institutes in the research process ................................................................................... 371
F.4 Summary of barriers to research uptake as far as scientists and researchers from other
universities and research institutes are concerned ...................................................................... 371
List of Figures Figure 2.1 Derived from knowledge-to-action framework ................................................................... 55
Figure 2.2. Ottawa model of research use ............................................................................................ 57
Figure 2.3. Steps to the knowledge transfer process ........................................................................... 59
Figure 3.1: A strategic approach for research uptake ........................................................................ 104
Figure 4.1 Research publications for KNUST. ...................................................................................... 116
Figure 4.4 Publication output by colleges ........................................................................................... 119
Figure 4.5 Staff publication ratios for colleges. .................................................................................. 120
Figure 4.6: Staff publication ratio for the year 2015/2016. ................................................................ 121
Figure 4.7: Five-year trend analysis of research output in refereed journals (2012-2016). ............... 122
Figure 4.8: Five-year publication trend analysis published/unpublished conference papers for
research output (2012–2016). ............................................................................................................ 123
Figure 4.9: Publication trends by colleges (2009–2015) ..................................................................... 126
Stellenbosch University https://scholar.sun.ac.za

xv
Figure 4.10 Funding sources for KNUST. Source: KNUST budget (2017) ............................................ 127
Figure 5.1 Conceptual framework for institutionalising RU ............................................................... 133
Figure 5.2: Framework for the analysis of the transformation pathway of the university environment.
Copied from Grobbelaar and De Wet (2013:7)................................................................................... 134
Figure 6.1a Trend analysis of JUST publications (2004–2017) ............................................................ 173
Figure 6.1b Summary of JUST publications (2004–2017) ................................................................... 174
Figure 6.2 Gross enrolment ratio by gender for pre-primary education. ........................................... 178
Figure 6.3 Gross enrolment ratios for pre-primary education. .......................................................... 178
Figure 6.4 Gross enrolment ratio by gender for primary education. ................................................. 179
Figure 6.5 Gross enrolment ratios for primary education. ................................................................. 179
Figure 6.6 Gross enrolment ratios by gender for secondary education. ............................................ 180
Figure 6.7 Gross enrolment ratios for secondary education. ............................................................. 180
Figure 6.8 Gross enrolment ratios by gender for tertiary education. ................................................ 181
Figure 6.9 Gross enrolment ratios for tertiary education. .................................................................. 181
Figure 6.10 Enrolment trends for KNUST 2007–2017 ......................................................................... 182
Figure 7.1 Number of faculty members across 6 colleges of KNUST .................................................. 188
Figure 7.2 Research outputs for the last three years (ordered 1–5) N=202 ....................................... 191
Figure 7.3 Research output of staff over the last three years ............................................................ 194
Figure 7.4 Other research outputs ...................................................................................................... 196
Figure 7.5 Responses by position ........................................................................................................ 197
Figure 7.6 Highest qualifications of respondents ............................................................................... 198
Figure 7.7 Number of respondents by gender .................................................................................... 199
Figure 7.8a Gender versus articles published or accepted (including co-authored) .......................... 200
Figure 7.8b Gender versus articles published or accepted (including co-authored) .......................... 201
Figure 7.9 Gender versus research reports......................................................................................... 202
Figure 7.10 Number of respondents by age ....................................................................................... 204
Figure 7.11a Age bracket and research output in terms of articles published or accepted (including
co-authored) ....................................................................................................................................... 204
Figure 7.11b Age bracket and research output in terms of articles published or accepted (including
co-authored) ....................................................................................................................................... 205
Figure 7.12 Age versus academic position .......................................................................................... 206
Figure 7.13: Responses by departments ............................................................................................. 208
Stellenbosch University https://scholar.sun.ac.za
xvi
Figure 7.14 Responses by faculties ..................................................................................................... 209
Figure 7.15 Researchers by faculties versus research output (articles published or accepted (including
co-authored) ....................................................................................................................................... 210
Figure 7.16 Researchers by colleges versus research output (articles published or accepted) ......... 212
Figure 7.17 Colleges versus research output (conference papers published in proceedings) ........... 214
Figure 7.18 Position versus research output (articles published or accepted) .................................. 217
Figure 7.19 Qualification versus articles published or accepted (including co-authored) ................. 218
Figure 7.20 Extent of success with research output (N=202) ............................................................. 221
Figure 7.21 Faculties and extent of success with respect to advancement of knowledge (p-
value=0.155) ....................................................................................................................................... 224
Figure 7.22 Faculties and extent of success with respect to solving immediate technical and applied
problems (p-value=0.083) ................................................................................................................... 225
Figure 7.23 Faculties and extent of success with respect to solving environmental and social
problems (p-value=0.62) ..................................................................................................................... 226
Figure 7.24 Overall research success by faculties ............................................................................... 231
Figure 8.1 Stakeholders mostly engaged by researchers ................................................................... 235
Figure 8.2 Mechanisms of engagement with communities (ordered for monthly engagement) N=202
............................................................................................................................................................ 238
Figure 8.3 Position versus engagement with communities outside the university ............................ 240
Figure 8.4 Breakdown of the number of respondents by faculties .................................................... 241
Figure 8.5 Faculties and engagement with communities outside the university ............................... 242
Figure 8.6 Frequencies of benefits of engagement with communities .............................................. 245
Figure 8.6b Benefits of engagement with communities ..................................................................... 246
Figure 8.7 Stages of involving communities in the research process ................................................. 248
Figure 8.8 Most common reasons why communities do no use research findings ........................... 251
Figure 8.9 Mechanisms of engagement with the private sector ........................................................ 254
Figure 8.10 Position and engagement with private sector (including industry) ................................. 255
Figure 8.11 Faculties and extent of Engagement with the private sector .......................................... 256
Figure 8.12 Perceived benefits of engagement with the private sector ............................................ 259
Figure 8.13 Stages of involving the private sector in the research process ....................................... 260
Figure 8.14 Most common reasons why the private sector does not use research findings ............. 263
Figure 8.15 Mechanisms of engagement with governments (MDAs) and parastatals ...................... 266
Figure 8.16 Position and extent of engagement with governments (MDAs) and parastatals ........... 267
Stellenbosch University https://scholar.sun.ac.za
xvii
Figure 8.17 Faculties and extent of engagement with governments (MDAs) and parastatals .......... 268
Figure 8.18 Perceived benefits of engagement with governments (MDAs) and parastatals ............. 271
Figure 8.19 Stages of involving government and parastatals in the research process ...................... 272
Figure 8.20 Most common reasons why governments (MDAs) and parastatals do not use research
findings ................................................................................................................................................ 275
Figure 8.21 Engagement with scientists and researchers from other universities and institutes ..... 278
Figure 8.22 Academic position and engagement with scientists and researchers from other
universities and institutes ................................................................................................................... 279
Figure 8.23 Faculties and extent of engagement with scientists and researchers from other
universities and institutes ................................................................................................................... 281
Figure 8.24 Perceived benefits of engagement with scientists and researchers from other universities
and institutes ...................................................................................................................................... 283
Figure 8.25 Stages of involving scientists and researchers from other universities and institutes in the
research process ................................................................................................................................. 285
Figure 8.26 Most common reasons why scientists and researchers from other universities and
institutes do not use research findings ............................................................................................... 287
Figure 8.27 Mechanisms of engagement with NGOs ......................................................................... 290
Figure 8.28 Position and engagement with NGOs .............................................................................. 291
Figure 8.29 Faculties and extent of engagement with NGOs ............................................................. 292
Figure 8.30 Perceived benefits of engagement with NGOs ................................................................ 294
Figure 8.31 Stages of involving NGOs in the research process ........................................................... 296
Figure 8.32 Most common reasons why NGOs do not use research findings .................................... 298
Figure 9.1 Model framework for research uptake .............................................................................. 307
Figure 9.2 Drivers of research uptake ................................................................................................. 317
Stellenbosch University https://scholar.sun.ac.za
xviii
List of Tables Table 1.1 – Structure of thesis: framework analysis phases, issues addressed and in which chapters,
research questions and objectives addressed ........................................................................................ 34
Table 2.1: Backer’s four waves of knowledge utilisation literature ..................................................... 37
Table 2.2 Determinants for effective knowledge transfer ..................................................................... 51
Table 2.3 Framework for establishing interaction with users ............................................................... 53
Table 2.4: Organisational level frameworks for RU ............................................................................. 63
Table 2.5: Conceptual framework for institutionalising research uptake ............................................. 65
Table 3.1. Transformational pathway of the developmental university ................................................ 75
Table 3.2: Barriers and facilitators to research utilisation .................................................................... 94
Table 3.3: Institutional strategies for research uptake: Research uptake management framework ...... 96
Table 4.1: Staff publication ratio for the colleges ............................................................................... 120
Table 4.2: Five-year trend analysis of research output (2011/2012-2015/2016). ............................... 122
Table 4.3 Publication trends by colleges (2009–2015). ...................................................................... 125
Table 4.4 Examples of funded projects for KNUST ........................................................................... 128
Table 5.1: Key capacities to be developed .......................................................................................... 135
Table 5.2: Mapping of research questions and objectives .................................................................. 138
Table 5.3: Summary of analysis of document review ......................................................................... 143
Table 5.4: Survey framework.............................................................................................................. 148
Table 5.5: Framework for interviews .................................................................................................. 160
Table 5.6 Distribution of interviewees ................................................................................................ 165
Table 6.1: Summary of JUST publications (2004 to 2017) KNUST .................................................. 173
Table 6.2: Performance scale for the health system ............................................................................ 185
Table 7.1 Distribution of research staff by faculties or schools and institutes and survey responses . 189
Table 7.2 Research outputs of staff over the last three years .............................................................. 193
Table 7.3 Highest qualification of respondents................................................................................... 197
Table 7.4 Respondents by gender ....................................................................................................... 198
Table 7.5 Cross-tabulation for gender versus articles published or accepted ..................................... 199
Table 7.6 Cross-tabulation for gender versus research reports ........................................................... 201
Table 7.7 Descriptive statistics for age distribution of respondents ................................................... 203
Table 7.8 Colleges versus research output (articles published or accepted) ....................................... 211
Table 7.9 Colleges versus research output (conference papers published in proceedings) ................ 214
Stellenbosch University https://scholar.sun.ac.za
xix
Table 7.10 Position and research output (articles published or accepted) .......................................... 216
Table 7.11 Rate of success with respect to research output ................................................................ 220
Table 7.12 Overall research success of faculties ................................................................................ 228
Table 8.1 Stakeholders mostly engaged with ...................................................................................... 234
Table 8.2 Mechanisms of engagements with communities ................................................................ 237
Table 8.3 Benefits of engagement with communities ......................................................................... 244
Table 8.4 Stages of involving communities in research ..................................................................... 247
Table 8.5 Most common reasons for non-use of research by communities ........................................ 250
Table 8.6 Engagements with private sector ........................................................................................ 252
Table 8.7 Benefits of engagement with private sector ........................................................................ 258
Table 8.8 Stages of involving private sector in research .................................................................... 260
Table 8.9 The most common reasons why the private sector does not use research findings ............ 262
Table 8.10 Engagement with governments and parastatals ................................................................ 265
Table 8.11 Benefits of engagement with governments and parastatals .............................................. 270
Table 8.12 Stages of involving governments and parastatals in research ........................................... 272
Table 8.13 The most common reasons for non-use of research findings by governments and
parastatals ............................................................................................................................................ 274
Table 8.14 Engagements with scientists and researchers from other universities and institutes ........ 277
Table 8.15 Benefits of engagement with scientists and researchers from other universities and
institutes .............................................................................................................................................. 282
Table 8.16 Stages of involving scientists and other researchers in research process .......................... 284
Table 8.17 The most common reasons for non-use of research findings by scientists and researchers
from other universities and institutes. ................................................................................................. 286
Table 8.18 Mechanisms of engagements with NGOs ......................................................................... 289
Table 8.19 Benefits of engagement with NGOs ................................................................................. 294
Table 8.20 Stages of involving NGOs in research process ................................................................. 296
Table 8.21 The most common reasons why NGOs do not use research findings ............................... 297
Table 8.22 Summary of activities with different stakeholders ........................................................... 302
List of abbreviations and acronyms
AGI: Association of Ghana Industries
AgSSIP: Agricultural Services Sub-Sector Investment Programme
Stellenbosch University https://scholar.sun.ac.za
xx
ANDi: African Network for Diagnosis and Drug Discovery Innovation
ARS: Agriculture Research Station
BIRD: Bureau of Integrated Rural Development
BNITM: Ghana, and the Benhard-Nocht Institute for Tropical Medicine
CABE: College of Art and Built Environment
CANR: College of Agriculture and Natural Resources
CeCAST: Centre for Cultural and African Studies
CHS: College of Health Sciences
CHSRF: Canadian Health Services Research Foundation
CHSS: College of Humanities and Social Science
CIHR: Canadian Institute of Health Research
CLS: Centre for Land Studies
COE: College of Engineering
COS: College of Science
CSIR: Council for Scientific and Industrial Research
CSS: Centre for Settlements Studies
DANIDA: Danish International Development Agency
DFID: Department for International Development
DRUSSA: Development Research Uptake in Sub-Saharan Africa
EBM: evidence-based medicine
EU: European Union
GAB: Ghana Association of Bankers
GDP: gross domestic product
GES: Ghana Education Service
GETFund: Ghana Education Trust Fund
Gh: Ghana
GhIE: Ghana Institution of Engineers
Stellenbosch University https://scholar.sun.ac.za
xxi
GIA: Ghana Institution of Architects
GSS: Ghana Statistical Service
HES Higher Education System
HR Human Resource
ICT: information and communication technologies
ICU: Industrial and Commercial Workers Union
IDRC: International Development Research Centre
IFAD: International Fund for Agricultural Development
IGF: internally generated fund
IHSR: Institute of Human Settlements Research
INGO International Non-Governmental Organisations
INRM: integrated natural resource management
IP Intellectual Property
IPOO: input-process–output-outcomes (model)
ISTA: Institute of Science and Technology for Africa
JHS: junior high school
JUST: Journal of Science and Technology
K2A Knowledge to Action
KCCR: Kumasi Centre for Collaborative Research in Tropical Medicine
KIST: Korean Institute of Science and Technology
KNUST: Kwame Nkrumah University of science and Technology
KT: knowledge transfer
KTE: knowledge transfer and exchange
KU: knowledge utilisation
M&E: monitoring and evaluation
MDA: ministries, departments and agencies
MDGs: Millennium Development Goals
Stellenbosch University https://scholar.sun.ac.za
xxii
MoE: Ministry of Education
MoFA: Ministry of Food and Agriculture
MoH Ministry of Health
NCCDPHP: National Centre for Chronic Disease Prevention and Health Promotion
NCDDR: National Centre for the Dissemination of Disability Research
NCTE National Council for Tertiary Education
NDPC: National Development Planning Commission
NGO: non-governmental organisation
NIMS: National Institute for Mathematical Sciences
NUFFIC: Dutch Government and Netherland’s Foundation for International Cooperation
OECD: Organisation for Economic Co-operation and Development
OGR: Office of Grants and Research
OMRU: Ottawa model of research use
QAPU: Quality Assurance and Planning Unit
R&D: research and development
RKI: research knowledge infrastructure
RU: research uptake
RUM: research uptake management
S&T Science and Technology
SCM: supply chain management
SDGs: Sustainable Development Goals
SHS Senior High School
SIDA: Swedish International Development Agency
SMMEs: small, medium and micro-sized enterprises
SMS: School of Medical Sciences
SPR: staff publication ratio
SPSS Statistical Package for the Social Sciences
Stellenbosch University https://scholar.sun.ac.za
xxiii
SU: Stellenbosch University
TCC: Technology Consultancy Centre
UENR University for Energy and Natural Resources
UFH: University of Fort Hare
UITS: University Information Technology Services
UN: United Nations
UNCT: United Nations Country Team
UNCT-GH United Nations Country team-Ghana
UNDP United Nations Development Programme
UNESCO: United Nations Educational Scientific and Cultural Organisation
UNICEF: United Nations Children’s Fund
UoM: University of Mauritius
WAISCL: West African Institute for Supply Chain Leadership
WHO: World Health Organisation
Stellenbosch University https://scholar.sun.ac.za
24
CHAPTER 1: INTRODUCTION
1.1 Some historical perspectives and knowledge utilisation in retrospect
Right from the mid-twentieth century, the issue of science, research or knowledge utilisation
has engaged the minds of various writers and researchers. Even in an attempt to find reasons
for studying science, the issue of knowledge utilisation comes up. Early researchers, such as
Wilhelm von Humboldt (1767–1835), the architect of the Prussian education system, have
argued that science is studied in order to generate new knowledge and create technologies but
also that these technologies must be useful (Gaston & Keniston, 1994). Knowledge is generated
mainly through research, and universities are generally accepted as sources of knowledge
generation. It is also a known fact that some useful knowledge has been generated from other
sources than universities. Examples of such sources are the informal sector (i.e. food processors
and artisan, industry and private organisations and government-owned research centres. All
these sources play a role in knowledge production and perhaps because the universities often
predominantly concentrate on scientific publications the others may consider commercial
activities in addition.
According to Gaston and Keniston (1994), the world today has entered a period of
accountability, in which governments fund research with the expectation that universities will
address the needs of society. They further observe that governments promise to support
research, which they consider worthy of helping in order to achieve national goals, such as
research that will lead to new products, medicines and even weapons. Researchers on their part
have to give government the assurance of performing research that would lead to achieving the
goals set by government (Guston & Keniston, 1994). In other words, the trend has become
‘show us what you can do and its possible uses’ before funding can be provided. If research is
expected to solve problems, there must be ways of measuring the outcome of research. There
must also be a clear distinction between the various kinds of research and the models for their
utilisation.
Between 1945 and 1970, public research and development recognised the autonomy of science,
and the emphasis was on basic research (Auranen, 2005). This was referred to as Mode 1
knowledge, which typically refers to knowledge production in the scientific context, mono-
disciplinarity or sometimes multi-disciplinarity, demand of accountability to peers and other
researchers, and the evaluation of quality inside academic community (Auranen, 2005). From
1970 to the early 1980s, there were calls for relevance in applied science (Auranen, 2005). This
Stellenbosch University https://scholar.sun.ac.za
25
led to more directed science with increased accountability. From the 1980s onward, there was
the emergence of strategic science with increased management culture and focus on
performance indicators. From this time on, knowledge production became transdisciplinary
with a focus on application in response to societal needs and issues bordering on accountability
(Auranen, 2005; Gibbons, 2013; Nieminen, 2005).
1.2 Research uptake management
Evidence from the Development Research Uptake for Sub-Saharan Africa (DRUSSA)
programme indicates that until recently research uptake management seem not to be popular in
sub-Saharan Africa (DRUSSA, 2012). However, a review of available literature indicates that
the broader field of knowledge utilisation has existed for decades. The current study examined
the issue of research uptake management and how it can be institutionalised within a university.
In particular, the study was aimed at designing guidelines for a strategic policy framework,
which identifies pathways and activities necessary for research uptake suitable for the Kwame
Nkrumah University of Science and Technology (KNUST), Kumasi, Ghana. The broader
outcome of the study is that the findings may be applicable to higher education management
of research. The framework was intended to direct activities towards knowledge production,
the concept of research uptake, and the infrastructure and mechanisms necessary for facilitating
dissemination and uptake at the KNUST.
Although an emerging field in the sub-region, a critical look at the research system at KNUST
reveals that there are processes within the university that involve research uptake and
utilisation. There are examples of innovations and research output at the Technology
Consultancy Centre, KNUST, which have been found useful and, in fact, utilised by local
communities, farmers and small firms (QAPU, 2017). It is not out of place to expect
universities to play a role in the development of innovations even though, for some time now,
this seem to be the prerogative of industry and government. Universities, such as the KNUST,
have a mandate to produce and disseminate research and train the labour force needed for
national development. The private sector, including industry, also plays a role and therefore a
partnership between the university and industry could lead to better innovations (Etzkowitz,
Webster, Gebhardt & Terra, 2000).
KNUST is one of the 24 universities that participated in the Development Research Uptake in
sub-Saharan Africa (DRUSSA) programme. DRUSSA was a five-year capacity-building
programme funded by the Department for International Development (DFID) and was
Stellenbosch University https://scholar.sun.ac.za
26
operational between 2011 and 2016. The programme worked with 24 sub-Saharan African
universities to improve capacity to manage the uptake of research. DRUSSA provided direct
support to the universities at individual, institutional and systems level to improve participation
in and influence on policy and practice. The programme was designed to consolidate and
strengthen existing capacity that could be sustained in the long term by the universities
themselves (DRUSSA, 2012). This study aimed to provide benchmarks for institutionalising
research uptake as well as providing guidelines for the management of research.
Research output must not only be well documented and publicised but must also be backed by
an appropriate policy framework to ensure its eventual uptake and utilisation (DRUSSA, 2012).
This will make research uptake and utilisation a sine qua non for any individual researcher and
research team. Until the inception of the DRUSSA programme in 2012, KNUST lacked clear-
cut mechanisms through which considerations for research uptake could be institutionalised.
In 2016, the institution finally completed its research policy, which had been formally approved
by the Academic Board in 2016 and endorsed by the University Council in 2017. The policy
provides the framework and broad guidelines for research in the university. Some aspects of
the results of the initial scoping study by DRUSSA were incorporated in the research policy.
The initial scoping study of DRUSSA conducted in 2010 identified a range of challenges with
regard to Research Uptake (RU) and/or Research Uptake Management (RUM), namely:
• Universities in the sub-region acknowledge the need to manage research but there is a
lack of awareness and deliberate efforts aimed at strategies, channels and mechanisms
to engage in RU strategies (DRUSSA, 2012).
• Universities lacked the capacity to track, record and evaluate dissemination activities.
This is an essential component of RU to ensure that the university reports on its
achievements and impact in order to justify future funding. Central to the issue of
proven accountability is the ability of the university to monitor and assess the level of
effectiveness of its research as well the impact of dissemination (DRUSSA, 2012).
• Stakeholders of the university seem unaware of the existence of research findings that
could be beneficial to them. They are therefore unable to determine the value of
research outputs (DRUSSA, 2012).
The 2012 benchmarking survey conducted by DRUSSA, (2012) revealed that the majority of
the 24 participating universities had great potential for contributing to local societal needs
through research; however, many universities noted constraints in realising this potential. The
Stellenbosch University https://scholar.sun.ac.za

27
common factors according to the DRUSSA benchmarking survey were limited government
funds, under-prioritisation of research and RU at institutional level and donor-driven research
agendas. The survey also underscored the need to build capacity both at institutional as well as
individual level in order to take research beyond the institution into the public domain for
eventual uptake (DRUSSA, 2012).
In 2014, another survey was carried out to map out evidence of change in the various aspects
of research uptake, namely research uptake strategy, research uptake process, research
communication, and stakeholder engagement (Falk, Harber & Roberts, 2014). The key findings
from the survey, which still reveal shortfalls in the various aspects of research uptake, can be
summarised as follows:
• Research uptake strategy: Despite some progress in the area of strategy, there are
concerns about challenges of composing guidance documents and policies to direct
institutions. Furthermore, the institutional machinery with its attendant lack of formal
structures slowed down processes for developing appropriate policies to support
research uptake (Falk et al., 2014).
• Research uptake process: The survey revealed that, despite some interest across
university offices, communication and cooperation between these offices still need
improvement. In addition, there is a need for university-wide coordination of RU and
strengthening of the role of offices responsible for RU (Falk et al., 2014).
• Stakeholder engagement: Research record keeping remains a hurdle and a hindrance to
research management. Another challenge that universities face in this area is how to
develop a lasting relationship with stakeholders that will lead to sustained research
uptake (Falk et al., 2014).
• Dissemination of research: Research communication strategy is still in its infant stages
making it difficult to reach target audiences (Falk et al., 2014).
KNUST was part of the benchmarking survey and therefore the above findings equally applies.
Building the needed research capacity is thus a key university action to make the university
effective in the delivery of its mandate as a scientific institution. It has been argued, that
universities in Africa lack the requisite capacity to make them scientifically vibrant (Mouton,
2008). According to Mouton, the dissemination and uptake of scientific research is a process
that requires its own dedicated scientific institutions.
Stellenbosch University https://scholar.sun.ac.za

28
The research database repository of KNUST is stocked with many researches from both
academics and graduate students, and yet not much is seen by way of utilisation. This may be
due to the fact that research is not disseminated to user groups. This might not be peculiar to
KNUST. It can be confirmed elsewhere that, despite the large amounts of knowledge generated
or research evidence available in universities in general, relatively little is disseminated and
taken up or applied in practice (Becheikh, Ziam, Idrissi, Castonguay & Landry, 2010; Waddell,
2001). This means that available research evidence, which is not taken through the subsequent
knowledge transfer processes, will end up not being used (Becheikh et al., 2010).
1.3 Brief history of KNUST
KNUST started as the Kumasi College of Technology by a government ordinance on 6 October
1951. An Act of Parliament converted it into a full-fledged university on 22 August 1961. The
Act establishing the university defines its mandate, which essentially is to provide HE,
undertake research, disseminate knowledge and foster relationships with outside persons and
bodies. The strategic mandate of the university is derived from the reference to Science and
Technology in its name. The university started with relatively few students, well-equipped
departments and laboratories and well-trained academic and research staff who were mostly
trained abroad. KNUST was well placed to achieve its vision of advancing knowledge in
Science and Technology through its research activities in order to contribute to the sustainable
development in Africa (KNUST Corporate Strategic Plan 2005-2014 (PLAN2K14), 2005).
In a bid to allow some autonomy in the administration of the university to make it more
effective, it was reorganised into six colleges in January 2005. Under this system, the existing
faculties were appropriately put together to form six colleges, namely:
▪ College of Agriculture and Natural Resources (CANR);
▪ College of Art and Built Environment (CABE);
▪ College of Humanities and Social Science (CHSS);
▪ College of Engineering (COE);
▪ College of Health Sciences (CHS); and
▪ College of Science (COS).
In June 2012, the Faculty of Forest Resource Technology at Sunyani, which used to be part of
the College of Agriculture and Natural Resources, became a full-fledged university known as
University of Energy and Natural Resources (UENR) and therefore became autonomous.
Stellenbosch University https://scholar.sun.ac.za
29
The university has research centres attached to each of its six colleges. Research centres, such
as the Kumasi Centre for Collaborative Research into tropical medicine (KCCR), the Bureau
of Integrated Rural Development (BIRD), and the Technology Consultancy Centre (TCC), and
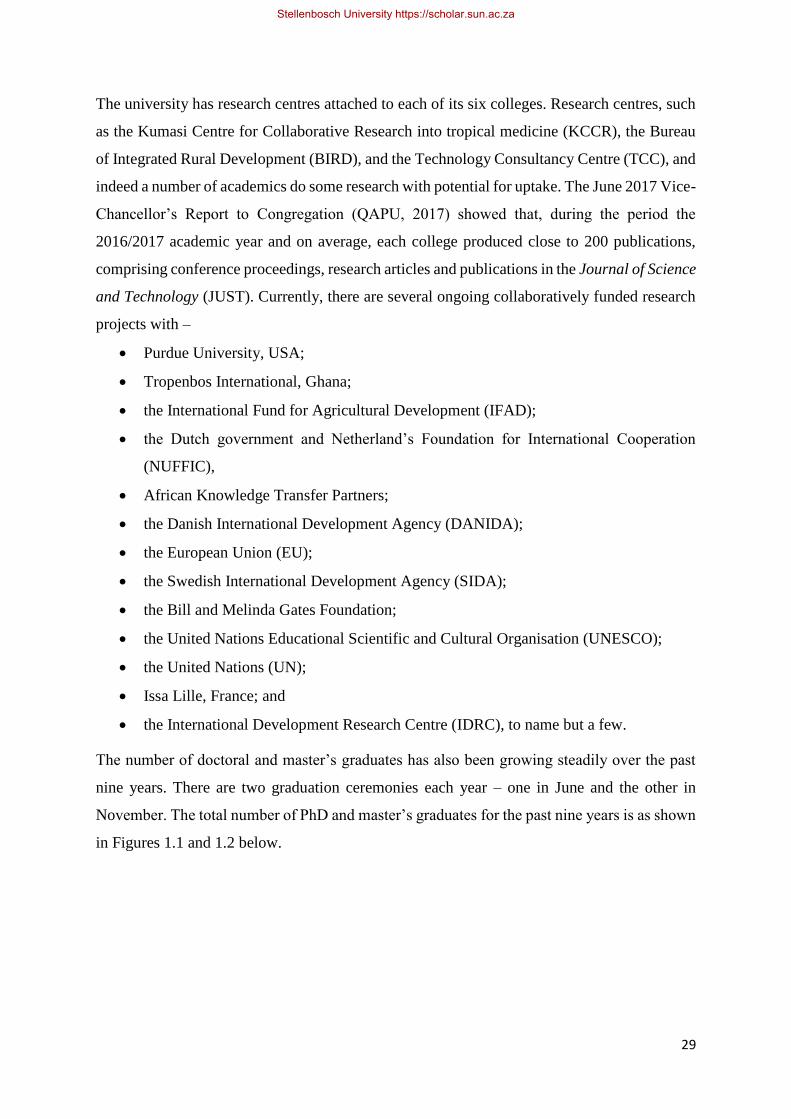
indeed a number of academics do some research with potential for uptake. The June 2017 Vice-
Chancellor’s Report to Congregation (QAPU, 2017) showed that, during the period the
2016/2017 academic year and on average, each college produced close to 200 publications,
comprising conference proceedings, research articles and publications in the Journal of Science
and Technology (JUST). Currently, there are several ongoing collaboratively funded research
projects with –
• Purdue University, USA;
• Tropenbos International, Ghana;
• the International Fund for Agricultural Development (IFAD);
• the Dutch government and Netherland’s Foundation for International Cooperation
(NUFFIC),
• African Knowledge Transfer Partners;
• the Danish International Development Agency (DANIDA);
• the European Union (EU);
• the Swedish International Development Agency (SIDA);
• the Bill and Melinda Gates Foundation;
• the United Nations Educational Scientific and Cultural Organisation (UNESCO);
• the United Nations (UN);
• Issa Lille, France; and
• the International Development Research Centre (IDRC), to name but a few.
The number of doctoral and master’s graduates has also been growing steadily over the past
nine years. There are two graduation ceremonies each year – one in June and the other in
November. The total number of PhD and master’s graduates for the past nine years is as shown
in Figures 1.1 and 1.2 below.
Stellenbosch University https://scholar.sun.ac.za
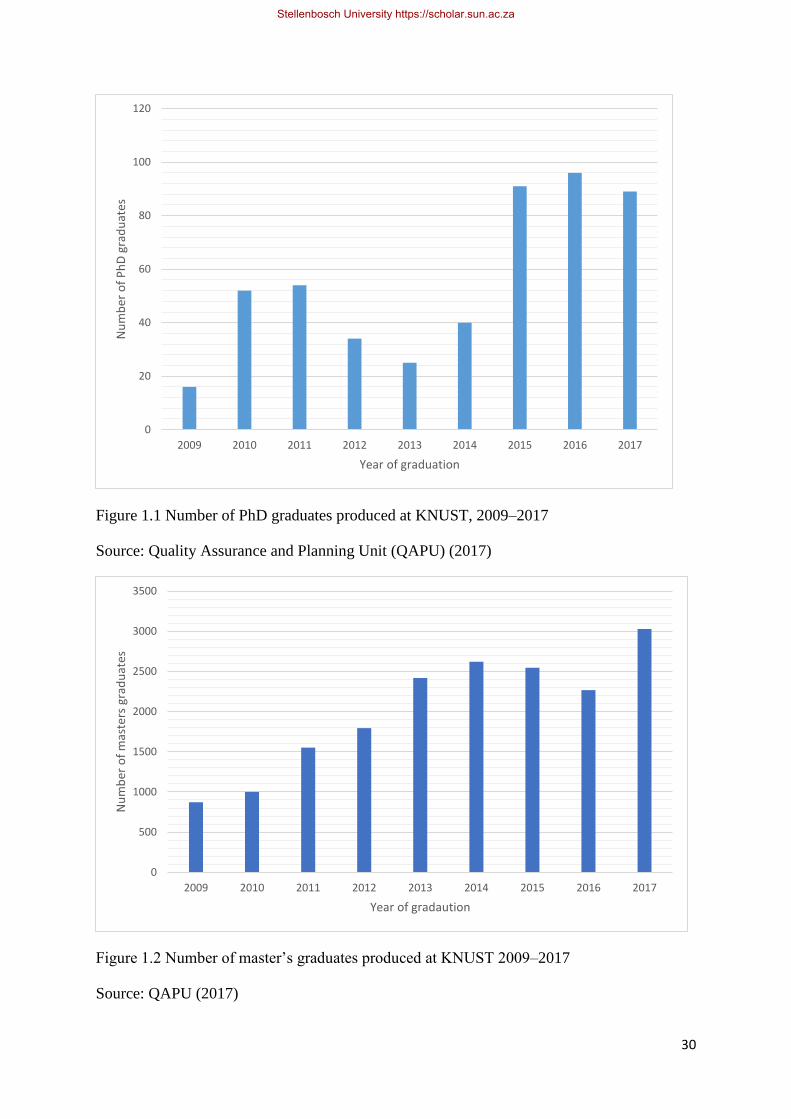
30
Figure 1.1 Number of PhD graduates produced at KNUST, 2009–2017
Source: Quality Assurance and Planning Unit (QAPU) (2017)
Figure 1.2 Number of master’s graduates produced at KNUST 2009–2017
Source: QAPU (2017)
0
20
40
60
80
100
120
2009 2010 2011 2012 2013 2014 2015 2016 2017
Nu
mb
er o
f P
hD
gra
du
ates
Year of graduation
0
500
1000
1500
2000
2500
3000
3500
2009 2010 2011 2012 2013 2014 2015 2016 2017
Nu
mb
er o
f m
aste
rs g
rad
uat
es
Year of gradaution
Stellenbosch University https://scholar.sun.ac.za
31
The author is of the firm belief that these efforts still need an institutional framework to guide
and ensure optimum research uptake. Given the needed environment, these are major pathways
through which research uptake could be facilitated. The environmental scans conducted at
KNUST for DRUSSA in 2012 revealed that no significant provision was made for
dissemination in the Mission Statement of the university (DRUSSA, 2012). This brings to the
fore the need for a framework with policy direction to ensure the uptake and utilisation of
research by individual researchers and teams within the university.
1.4 Rationale for study
This section provides a brief background to existing provisions for research uptake at KNUST,
which informed the rationale for the current study, the objectives and research questions.
The general expectation is that universities are sites for knowledge production. In certain
jurisdictions, they have been known as centres for discoveries, new technologies and
innovations, some of which have great commercial value (Kitson, 2009). KNUST, as a
knowledge-producing institution, has two categories of knowledge producers. The first
category refers to researchers and academics, and the second category to postgraduate students.
Research produced by these categories should be aimed at advancing knowledge, influencing
policy, improving practice and, resolving socio-economic problems. It is therefore not out of
place to expect KNUST to produce knowledge to affect human life. KNUST is a technological
institution and by its mandate was set up to provide the needed technological manpower and
knowledge for the labour market.
KNUST has a mandate, which essentially is to provide HE, undertake research, disseminate
knowledge and foster relationships with outside persons and organisations (QAPU, 2017).
Undertaking research and disseminating knowledge imply taking research into the public
domain by publishing results in theses and refereed journals to the broader society. Knowledge
production, which is mostly reflected in publications, largely benefits academia and elite
society. In order to influence practice and address the needs of society, KNUST must ensure
that its research, with the potential to influence policy and practice, reaches other major
stakeholders, such as small and medium-sized enterprises (SMMEs), farmers and
policymakers. Current developments and existing structures do not promote effective
dissemination and uptake of research. Despite efforts at encouraging community service,
teaching and research are still given more attention than community service (Grobbelaar &
Kirkland, 2013). As asserted, community service is established as a significant presence
Stellenbosch University https://scholar.sun.ac.za
32
alongside teaching and research but in many cases, universities still place a premium on
teaching and research rather than on extension and outreach (Grobbelaar & Kirkland, 2013).
This situation is somehow still prevailing. In order to address this anomaly as part of the
university’s research policy, RU is being given special consideration (QAPU, 2017).
The overarching aim of the current study was to address the problem of research uptake and
utilisation by examining the need for a policy framework to institutionalise research uptake at
Kwame Nkrumah University of Science and Technology (KNUST), Ghana. A framework that
seeks to provide guidelines for a policy direction to improve production of research,
dissemination and uptake was necessary. Such a framework would provide for appropriate
mechanisms or channels and activities necessary for research uptake. Various pathways,
concepts and elements for research uptake have been identified in order to design the
conceptual framework. As argued, a useful conceptual framework should draw on existing
models which have common elements to promote research uptake and utilisation (Nath &
Europe, 2007). Rather than being prescriptive, the framework had to stimulate discussion and
solicit ideas on the various options within KNUST that promote research uptake and utilisation.
As suggested by Nath and Europe (2007), it is not feasible to identify a ‘generic pathway’ or
steps to ensure research utilisation, but rather to identify common factors (facilitating and
impeding) that influence research utilisation.
In order to achieve the aim of the study to propose a strategic framework for institutionalising
research uptake, the following objectives were set:
1. to review current scholarship on research uptake and utilisation in order to identify the
different forms and modalities thereof;
2. to review existing plans for research uptake at KNUST in order to identify the essential
elements for a research uptake strategy and to determine which areas need attention;
3. to identify the strengths, weaknesses and opportunities for knowledge utilisation at
KNUST;
4. to identify possible pathways within KNUST through which research uptake could be
facilitated;
5. to propose a strategic policy framework for KNUST to implement and institutionalise
mechanisms and activities for research uptake; and
The current study also sought to answer, among others, the following core research questions
aimed at addressing the problems identified above:
Stellenbosch University https://scholar.sun.ac.za
33
1. What are the areas of local, national and general development focus and objectives
where KNUST could play a role? This constitutes some of the external drivers of focus
that propels the research agenda of the university.
2. What are the current modes and pathways of research utilisation at KNUST? Here we
identified existing as well as non-existing knowledge production and dissemination
activities and their implications for research utilisation strategy.
3. What are the barriers and constraints (institutional or systemic) for optimal research
uptake and utilisation?
4. How is research (uptake) currently managed at KNUST? Here, we focused on the extent
and levels of engagement with the external environment.
5. What are the essential elements to be incorporated into a strategic research uptake
framework for KNUST, researchers and policymakers? This is in relation to the above
questions, including the form and focus of knowledge production and dissemination,
internal drivers, governance and control of the university.
6. What are the key institutional and individual capacity gaps, i.e. human and financial
resources (at both management and operational levels), that need to be addressed in
order to equip staff at KNUST to maximise the uptake, utilisation and impact of
developmental and applied research?
The broader outcome of the study was to provide general guidelines that address the issue of
research uptake management and how this can be institutionalised.
1.5 Structure of thesis
This section provides an outline of the structure of the study. The table below gives a summary
of the focus areas and processes that were adopted.
Stellenbosch University https://scholar.sun.ac.za
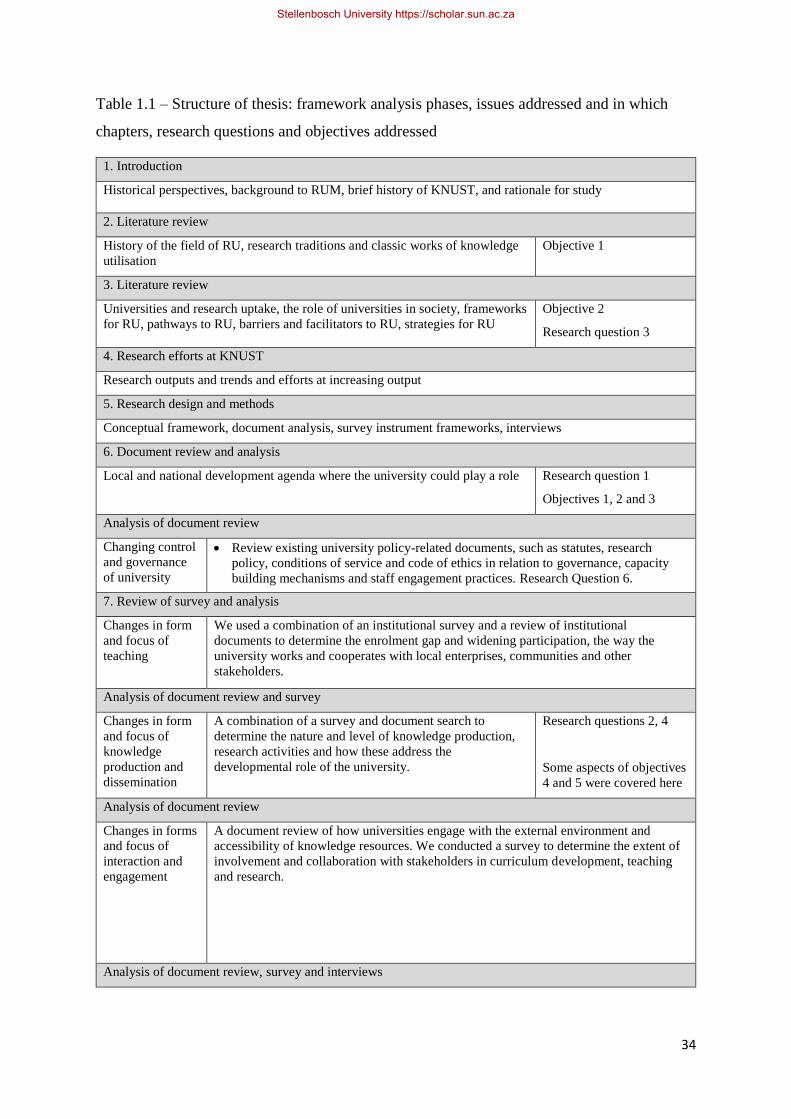
34
Table 1.1 – Structure of thesis: framework analysis phases, issues addressed and in which
chapters, research questions and objectives addressed
1. Introduction
Historical perspectives, background to RUM, brief history of KNUST, and rationale for study
2. Literature review
History of the field of RU, research traditions and classic works of knowledge
utilisation
Objective 1
3. Literature review
Universities and research uptake, the role of universities in society, frameworks
for RU, pathways to RU, barriers and facilitators to RU, strategies for RU
Objective 2
Research question 3
4. Research efforts at KNUST
Research outputs and trends and efforts at increasing output
5. Research design and methods
Conceptual framework, document analysis, survey instrument frameworks, interviews
6. Document review and analysis
Local and national development agenda where the university could play a role Research question 1
Objectives 1, 2 and 3
Analysis of document review
Changing control
and governance
of university
• Review existing university policy-related documents, such as statutes, research
policy, conditions of service and code of ethics in relation to governance, capacity
building mechanisms and staff engagement practices. Research Question 6.
7. Review of survey and analysis
Changes in form
and focus of
teaching
We used a combination of an institutional survey and a review of institutional
documents to determine the enrolment gap and widening participation, the way the
university works and cooperates with local enterprises, communities and other
stakeholders.
Analysis of document review and survey
Changes in form
and focus of
knowledge
production and
dissemination
A combination of a survey and document search to
determine the nature and level of knowledge production,
research activities and how these address the
developmental role of the university.
Research questions 2, 4
Some aspects of objectives
4 and 5 were covered here
Analysis of document review
Changes in forms
and focus of
interaction and
engagement
A document review of how universities engage with the external environment and
accessibility of knowledge resources. We conducted a survey to determine the extent of
involvement and collaboration with stakeholders in curriculum development, teaching
and research.
Analysis of document review, survey and interviews
Stellenbosch University https://scholar.sun.ac.za
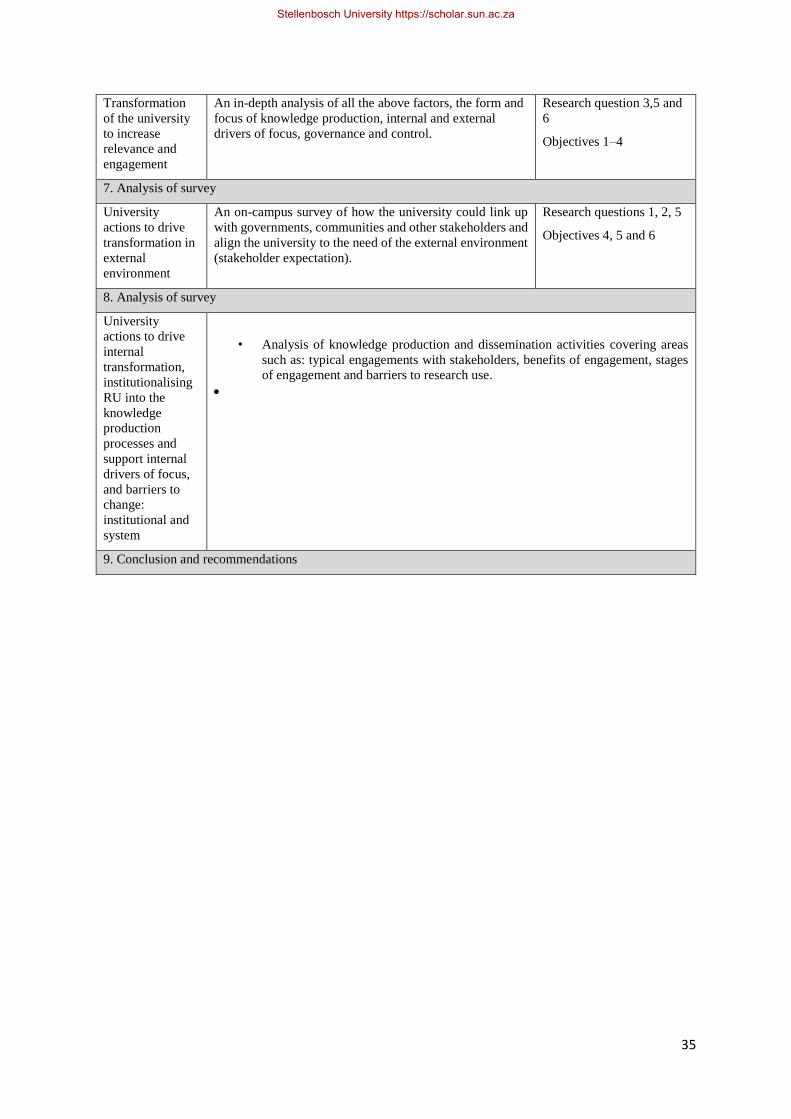
35
Transformation
of the university
to increase
relevance and
engagement
An in-depth analysis of all the above factors, the form and
focus of knowledge production, internal and external
drivers of focus, governance and control.
Research question 3,5 and
6
Objectives 1–4
7. Analysis of survey
University
actions to drive
transformation in
external
environment
An on-campus survey of how the university could link up
with governments, communities and other stakeholders and
align the university to the need of the external environment
(stakeholder expectation).
Research questions 1, 2, 5
Objectives 4, 5 and 6
8. Analysis of survey
University
actions to drive
internal
transformation,
institutionalising
RU into the
knowledge
production
processes and
support internal
drivers of focus,
and barriers to
change:
institutional and
system
• Analysis of knowledge production and dissemination activities covering areas
such as: typical engagements with stakeholders, benefits of engagement, stages
of engagement and barriers to research use.
•
9. Conclusion and recommendations
Stellenbosch University https://scholar.sun.ac.za
36
CHAPTER 2 – LITERATURE REVIEW: THE CLASSIC WORKS OF THE FIELD
OF KNOWLEDGE UTILISATION
2.1 Introduction: The history of research utilisation
This chapter focuses on the classic works of the field of knowledge utilisation as discussed in
the literature. A look at these models and authors in the field of knowledge utilisation was
deemed necessary since it has been argued that recent developments in the filed have been
based on the older models. It can therefore be observed that this researcher’s proposed
framework, discussed in Chapter 9, shows indications of influence by these earlier works. The
sections below consider key authors and models in the field of knowledge utilisation and the
developments in the different research traditions.
2.1.1 The waves of knowledge utilisation
There have been various waves in the domain of science utilisation and, for that matter,
knowledge utilisation. Backer (1991), in his review of the history of knowledge utilisation
argues that the field has moved through three waves. He also provides pointers that suggest a
possible fourth wave. The first wave (Wave 1), which spanned the period 1920–1960 focused
on the adoption and practice of technological innovations (Backer, 1991). The period
characterised research into the diffusion of agricultural innovations when agricultural extension
officers were used to propagate new knowledge in agricultural practices (Rogers, 2003).
In the second wave (Wave 2), spanning the period 1960s–1980s, there was a shift in focus to
dissemination and utilisation of innovations at the time of what was known as the knowledge
utilisation movement (Backer, 1991). During this wave, there was a broadening of knowledge
utilisation to include the usefulness of social science and health research. Carol Weiss’s (1979;
1980) insight into the use of social science research and Robert Rich’s (1991) perspectives of
knowledge utilisation fall within this period. It was during this period that there was advocacy
for individuals and organisations to consider the adoption of innovations (Jacobson, 2007).
This suggests how far back the issue of knowledge utilisation dates and provides justification
not only for the production of knowledge but also for ensuring that benefits are derived from
such knowledge.
Backer’s (1991) proposed third wave (Wave 3) started in the 1990s. He describes it as a period
where the understanding of knowledge was complex. Policymakers and government agencies
had to think through and rationalise their methods of dissemination and utilisation of research
(Backer, 1991; Jacobson, 2007). The period saw a renewed interest in knowledge utilisation
Stellenbosch University https://scholar.sun.ac.za

37
with the emergence of evidence-based medicine (EBM). According to Lavis and Robertson
(2003), it was during this period that knowledge use emerged as a process by which research
messages were ‘pushed’ by producers of research to the users of research (Lavis & Robertson,
2003).
Backer provides pointers and trends that suggest a possible fourth wave (Wave 4). These trends
include increased attention to the issues of quality assurance and accountability. Publicly
funded research should be reported and funds accounted for (Backer, 1991). From the above
discussion, it can be concluded that the field of knowledge utilisation has evolved over a long
period, from the 1920s until the present day. As presented in Backer’s (1991) account, four
waves of knowledge utilisation have been identified:
Table 2.1: Backer’s four waves of knowledge utilisation literature
Period Subtopics of knowledge utilisation
First wave: 1920–1960 Diffusion of innovations
Second wave: 1960–1980 Technology transfer and knowledge utilisation in social
sciences
Third wave: 1990s–early 2000s Evidence-based medicine
Fourth wave – A systems intervention to knowledge utilisation:
knowledge translation
The above waves may have contributed to later development of models of knowledge
utilisation. As reviewed by Baker, the field of knowledge utilisation also deals with knowledge
production, dissemination and utilisation. These issues have been handled by many authors
who proposed different frameworks that sought to outline measures by which knowledge can
effectively be transferred to end users. Sub-section 2.4 discussed some of the most influential
models in the field. There are various means by which knowledge can be transferred from the
producers to the users. These means are varied in their approach depending the type of
knowledge being transferred. The next sub-section thus provides definitions for some of the
terms associated with knowledge utilisation.
Stellenbosch University https://scholar.sun.ac.za
38
2.2 Defining the field
Research uptake (RU) is –
[A] term used to describe a method of conducting research that includes stakeholder
identification, engagement, communication and dissemination which results in evidence
to influence outcomes that can have impact on the lives of poor people (DRUSSA, 2012:3).
Various terminologies with implications for the use of knowledge have emerged over the years.
According to Estabrooks et al., (2008), among the several meanings and terminologies are
‘knowledge utilisation’, ‘knowledge translation’, ‘knowledge exchange’, ‘innovation
diffusion’, ‘knowledge communication and dissemination’, ‘knowledge transfer’, ‘technology
transfer’, ‘knowledge application and uptake’. Estabrooks et al. (2008) confirm that these
domains are substantively similar on the basis that they all address the idea of solving social
problems with knowledge. These authors argue that the difference in meanings are as a result
of the core problems of concern, knowledge used, audiences of relevance, and sometimes
modes of transfer (Estabrooks & Derksen, 2008). The following sections provide insight into
some of the terminologies associated with research uptake. These brief definitions have become
necessary in order to avoid using some of these terms interchangeably and also to ensure that
wherever they appear in the current study they are used in the right sense of the word. This
current study focused on research uptake and utilisation for which reason the term research
uptake is mostly used in the generic sense to represent knowledge utilisation.
2.2.1. Technology transfer
Bozeman (2000) describes ‘technology transfer’ as the process by which ideas, proof-of-
concept, and prototypes move from research-related to production-related phases of product
development. He says the knowledge upon which technology is composed, is diffused
alongside the technology, and that without the knowledge base, the physical entity cannot be
put to use. This is perhaps the reasoning for equating technology transfer to knowledge transfer.
The distinction, according to Bozeman (2000), however, is that, whereas knowledge transfer
is furthers scientific work using existing scientific knowledge, technology transfer leads to
innovations and new product development by others (Bozeman, 2000).
The meaning of technology transfer has been seen to be complicated (Bozeman, 2000). The
technology transfer process may simply involve transferring technology from one source to
another for the purposes of being used or for further development. Bozeman (2000), however,
Stellenbosch University https://scholar.sun.ac.za
39
argues that it is not easy to define a boundary of technology transfer and that in his view it is
impossible to outline the technology transfer process due to many other concurrent processes.
2.2.2 Knowledge adoption
According to Andrews (2012) the term knowledge adoption may be used to imply the uptake
of information, concepts, tools or practices (innovations) that have been generated
predominantly through research. Knowledge transfer involves stakeholder engagement as well
as provision of information (Andrews, 2012). Andrews further argues that managing
knowledge for adoption is fundamentally different in approach to technology transfer because
knowledge adoption is part of a larger process of change and development, which concerns
itself with how to create and share knowledge (Andrews, 2012). He contends that the word
‘transfer’ implies a one-way transaction whereas managing knowledge for adoption is
interactive, not linear and active, rather than passive. He argues further that knowledge
adoption is driven by need rather than curiosity or push and pull factors (Andrews, 2012).
2.2.3 Knowledge transfer and exchange
Knowledge transfer and exchange (KTE) refers to an interactive interchange of knowledge
between research users and research producers (Kiefer, Frank & Ruggiero, 2005). The primary
concern of KTE is to promote the incorporation of research evidence into policy and practice
(Kiefer, et al., 2005).
2.2.4 Knowledge utilisation
According to Larsen (1980), knowledge utilisation is a complex process involving political,
organisational, socioeconomic and attitudinal components in addition to the specific
information or knowledge. Knowledge transfer must lead to recognisable changes in order to
determine whether a transfer has taken place or not. The assumption is that knowledge
utilisation has “occurred when an entire set of recommendations was implemented in the form
suggested by the researcher” (Larsen, 1980:421). Davis and Salasin (1975) as well as Larsen
(1980) state that utilisation of knowledge may be occurring frequently but researchers may not
recognise it if it does not fit into a narrowly predetermined variable and if it does not occur
within a specific period (Davis & Salasin, 1975; Larsen, 1980).
2.2.5 Knowledge translation
Grimshaw and Eccles define knowledge translation in relation to healthcare. According to them
it is a process of ensuring that research findings get to stakeholders for use in their healthcare
Stellenbosch University https://scholar.sun.ac.za
40
decisions. This definition bears in mind the wide range of stakeholders or the target audience
for knowledge translation, including policymakers, professionals (practitioners), consumers,
researchers and industry (Grimshaw & Eccles, 2012).
2.2.6 Diffusion of innovation
‘Diffusion innovation’ is another term associated with the spread and adoption of knowledge.
An innovation is said to have been diffused if an intervention, a new idea or a method is adopted
(Rogers, 2003). Diffusion begins with the initial sending out of innovations, and then continues
to examine the spread and adoption of the innovation. Bowen and Zwi (2005) assert that
fundamental to the transfer of evidence into practice is diffusion. The process of diffusion is
concerned with the spread and adoption (or rejection) of products, practices, programmes,
policies or ideas (Bowen & Zwi, 2005). The key components of the process are: the social
system through which the innovation moves, the channels of communication, the time it takes
for the innovation to spread, and its adoption by stakeholders (Ashley, 2009). Rogers describes
‘innovation diffusion’ as the process by which an innovation is communicated through certain
channels over time to members of a social system (Rogers, 2003).
The relevance of the innovation and its adoptability is dependent on the perception of newness
and characteristics. An innovation, which has been altered or modified, can also be said to have
been adopted (Rogers, 2003). This is supported by diffusion theory, proposed by Ashley (2009)
which calls for contextual adaption of innovations.
2.2.7 Dissemination and communication
Dissemination is seen as a generic term for all knowledge transfer or communication activities
(Hood, 2002). It is –
[A] process requiring a match among originated knowledge, the needs, contexts, prior
experiences, values and beliefs of intended users, and the content, media, formats, and
language used in getting the outcomes into the hands, minds, and activities of users. The
goal of dissemination is utilisation-the critical element is that the research outcome must
be understood and the individual or organisation must incorporate the new information
within prior understandings and experiences (Hood, 2002:25).
According to Ashley (2009), dissemination is conceptually preoccupied with the process of
sending out innovations. Compared to dissemination “diffusion refers to passive spread, while
dissemination is relevant to active and planned efforts to persuade target groups to adopt an
innovation” (Ashley, 2009:41). Diffusion is considered to be a broad category representing the
Stellenbosch University https://scholar.sun.ac.za
41
spread of a range of innovations; however, when that innovation is knowledge or research, the
spread process becomes dissemination (Ashley, 2009; Graham & Logan, 2006).
These definitions are necessary for us to understand the terms that are associated with research
utilisation and the distinctions among them in order to use them appropriately. It also provides
an explanation why some of these are sometimes used interchangeably
2.3 Uses of knowledge
Different types of knowledge utilisation have been identified, namely instrumental, conceptual
and symbolic (Amara, Quimet & Landry, 2004; Bailey & Mouton, 2005; Landry, Amara &
Lamari,, 2001; Larsen, 1980; Nelson, 2006; Weiss, 1980). This section presents a brief
discussion of the types of research and the three main uses of knowledge, namely instrumental,
conceptual and symbolic use. The type of research has implications for the mode of its transfer.
As discovered in Chapter 8 of this study it seems that many researchers at KNUST focus more
on basic research rather than applied research. This may have contributed to the situation where
majority of research findings end up as publications in refereed journals. As discovered in the
closing chapters there were some researchers who indicated that their research findings have
led to solving environmental problems, influence in practice and changes in policy. Though
the current study did not go further to find out what type research was being undertaken by
researchers one could deduce that it takes more than fundamental or basic research to solve
environmental or immediate technical problems.
2.3.1 Types of research
This sub-section provides brief definitions for the types of research. Basically, we restrict
ourselves to three types of research, namely pure research, applied research and evidence-based
research with the view to understanding the types of research that staff at KNUST engage in.
Pure research or basic research could also be referred to as fundamental research (Bailey &
Mouton, 2005) This type refers to “research carried out for the purposes of understanding some
fundamental concepts within the scientific field, rather than in search of a particular
commercial goal” (DRUSSA, 2012:7). In general, pure research is basically exploratory and
does not produce marketable results, but may serve as the foundation or building block for
future research, which may be more specific and could have more profitable application.
Curiosity and gut feeling are some of the driving forces of pure research (university of
Southampton, 2014)
Stellenbosch University https://scholar.sun.ac.za
42
Applied research, on the other hand, refers to further investigation of fundamental research in
order to determine whether it might lead to new products, innovations, technologies, processes
or services. Applied research also refers to research intended to solve specific problems or to
find answers to specific questions. Our interest was in the kind of research that has the potential
for uptake and utilisation. This type is usually intended to solve practical problems and find
solutions to everyday challenges.
Evidence-based research implies that researchers base their judgement or further research on
proven information that can be verified by others (Grand Canyon University, 2014) This type
of research has implications for the complexity of the knowledge transfer process.
2.3.2 Instrumental use
Weiss (1980) provides insight into the term ‘instrumental use’ of knowledge. Instrumental use
refers to situations where specific research or knowledge influences decision-makers or
practitioners to make decisions which hitherto would not have been made had that knowledge
not existed (Weiss, 1980). According to Larsen (1980:431), “instrumental utilisation refers to
cases in which respondents could cite and document the specific ways in which knowledge was
being used for decision-making or problem-solving purposes”. Instrumental use involves the
use of hard data by the end user to improve operations or impact policy, in which case it may
be possible to link a particular research to a specific intervention (Larsen, 1980; Amara et al.,
2004).
Wilson (2003) explains further that instrumental use is direct use which results in changes in
practice (Landry et al., 2001:336). Operationally, the measurement of utilisation has centred
almost exclusively on the instrumental use of knowledge, that is, the contribution of knowledge
to the decisions of practitioners and decision-makers (Landry et al., 2001, Amara et al., 2004).
2.3.3 Conceptual use
When a policymaker’s thinking about an issue is influenced by some knowledge which is not
specific or documented, conceptual use is said to occur (Landry et al.,2001). “Conceptual use
refers to situations where knowledge provides new ideas, new theories and new hypotheses
conducting to new interpretations about the issue and facts surrounding the decision-making
contexts without inducing changes in decisions” (Landry et al., 2001:333). Conceptual
utilisation interventions can be credited to research information but it is normally not possible
to link these interventions to specific knowledge sources (Menon & Varadarajan, 1992).
Stellenbosch University https://scholar.sun.ac.za
43
Where there is application of knowledge information, it is said to have provided
‘enlightenment’ for a decision (Landry et al.,2001). Landry et al. (2001) used the term
‘enlightenment’ to refer to situations where concepts from social science research sift into the
policymaking process. The enlightenment model according to Landry et al., (2001) suggests
that decision-makers believe it is a good thing to have all kinds of research that make them
reflect on their thoughts and assumptions in the course of time (Amara et al., 2004; Landry et
al., 2001). This is an example of the conceptual use of knowledge.
2.3.4 Symbolic use
The third type of knowledge utilisation refers to situations where policy makers and other
stakeholders or users already hold some view but then use research findings to support these
views (Amara et al., 2004; Boshoff, 2013; Estabrooks, Squires, Cummings, Teare & Norton,
2009; Menon & Varadarajan, 1992). This implies that policymakers use research findings to
support their standpoint and also as proof of their responsiveness (Boshoff, 2013). It is also
possible that policymakers may use academic research as a source of information and ideas,
but hardly as straightforward information necessary in the formulation of policies (Boshoff,
2013). Estabrookes and Derksen (2008) indicate that symbolic use of knowledge involves the
use of research as a persuasive or political tool to legitimate a position or practice.
It is necessary to understand clearly what we mean by knowledge use since there are many uses
as outlined above. The extent of knowledge use also depends on the type of research and
intended users. By ‘knowledge use’, therefore, we are not only referring to putting into practice
or applying an idea or theory that has been reported on, which is instrumental, but also, we
have in mind conceptual as well as symbolic uses (Estabrooks & Derksen, 2008).
2.4 The most influential classic models of knowledge utilisation
According to Rogers (2003), a research tradition comprises a series of investigations on a topic
where the following studies are influenced by preceding studies (Rogers, 2003). The current
review provides a short overview of the key concepts for each classic research model in the
sections below. These models provide an understanding and background to recent
developments and have implications for this study. The main goal of this study is to propose a
framework suitable for research uptake at KNUST and therefore a general look at the most
influential models was necessary. The proposed framework in Chapter 9 therefore has
semblances of existing frameworks.
Stellenbosch University https://scholar.sun.ac.za

44
2.4.1 Everett M Rogers – The diffusion of innovation
In the 1960s, Rogers investigated the diffusion of innovations in relation to agriculture by
observing how farmers make use of new ideas (Rogers, 2003). He outlines how diffusion of
innovations cuts across many fields of endeavour. Rogers defines innovation as any idea
(including new knowledge and new product), practice or object that is perceived as new
(Rogers, 2003). It has been argued by Rogers, (2003) that the period of ‘knowledge explosion’
and the expectation that knowledge must be put to use led to the evolution of knowledge
utilisation as a field of study in the 1960s.
Rogers’s (2003) description of diffusion as a process involves innovations and communication
through certain channels over time within a social system. The characteristics of innovation,
according to him, play a key role in the innovation diffusion process as well as its adoption.
The characteristics of the innovation should include the compatibility, simplicity, and
experimentally feasible to try (Rogers, 2003).
According to Rogers, the main criticisms of diffusion of innovations are that of bias since it
assumes that the diffusion process is good for everyone to adopt. The process is also
individually focused without due recognition of the effect the social system might have on the
individual. The diffusion process can again be criticised for possible inaccuracies in reporting
the time of adoption (Rogers, 2003).
2.4.2 Ronald G Havelock – Understanding the process of dissemination and utilisation
Havelock conducted a review on knowledge dissemination and utilisation using important
features of existing models to develop new ones (Havelock, 1973).
Havelock (1973) identified three models, namely –
• the problem-solving model (focuses on the need of the user);
• the research, development and diffusion model (focuses on the research and the
research product); and
• the social interaction model (focuses on how the innovation moves between users and
systems).
A fourth model, the linkage model was developed as a two-way interaction process between
potential users and producers of knowledge (Havelock, 1973). It is argued that Havelock’s
models (Havelock, 1973) of knowledge utilisation served as the foundation for most of the
recent models in the field (Becheikh, Ziam, Idrissi, Castonguay & Landry (2010). Becheikh et
Stellenbosch University https://scholar.sun.ac.za
45
al., (2010) thus supported the argument that recent models have been based on Havelock’s
frameworks as listed above.
2.4.3 Carol Weiss – The many meanings of research utilisation
In the 1970s, Weiss provided insight into what constituted research utilisation at the time when
there was general agreement that social research had little or no influence on policy decisions
(Weiss, 1979). What really constituted research utilisation presented a paradox (Boshoff,
2013). Weiss interpreted utilisation within the social policy domain by outlining seven models
of research utilisation (Weiss, 1979). The seven models of Weiss are:
• The knowledge-driven mode: this is made up of sequentially arranged events, namely
basic research, applied research, development research and application (Weiss, 1979).
• The problem-solving model: Weiss also refers to this model as the “policy-driven
model” (Weiss, 1979:429). In this model, conclusions are supposed to be based on
empirical evidence that could help solve policy problems (Weiss, 1979). Research here
is driven by the decision to solve existing problems (Weiss, 1979). This is an example
of instrumental use of knowledge.
• The interactive model: in this case and based on an interactive search for knowledge
from stakeholders, research is able to enter the policy arena (Weiss, 1979).
• The political model: here the selection of specific research is based on the interest of a
particular policy predetermined by policymakers. In this case, research findings can be
used to strengthen a predetermined standpoint (Weiss, 1979). This is an example of
symbolic use.
• The tactical model refers to situations where the research used has not much bearing on
the content of the findings but is used tactfully for political expedience (Weiss, 1979).
This is another example of symbolic use.
• The enlightenment model, associated with “knowledge creep” (Weiss, 1980:381), is an
example of the conceptual model, and refers to cases where research is used to sensitise
decision-makers and to draw their attention to new issues, which hitherto were not
problems but which are subsequently regarded as policy problems (Weiss, 1979). In
this case, decision-makers are not able to point to any direct research that has influenced
their decision but agree that research has contributed to their decisions.
Stellenbosch University https://scholar.sun.ac.za
46
• Finally, Weiss (1979) asserts that where society regards research as intellectual pursuit,
it becomes part of an intellectual enterprise of society.
2.4.4 Robert F Rich – Perspectives of knowledge utilisation
Rich (1991) provides information about the historical roots as well some perspectives of
knowledge utilisation as a field of study. He argues on the basis that the field of knowledge
utilisation has existed since the 17th century irrespective of the fact that the filed seems to be
relatively new (Rich, 1991).
Rich (1991) offers significant insight into what constitutes knowledge utilisation and how it
can be measured and further argues that knowledge utilisation is a process comprising many
events. According to him, KU involves receiving information and processing it before applying
it (Rich, 1991). This was emphasised by Knott and Wildavsky’s (1980) standards of knowledge
utilisation, comprising knowledge reception, cognition, reference, effort, adoption,
implementation and impact. Some of these arguments have been confirmed from the results of
the survey discussed in Chapter 8 of this study.
2.4.5 Nathan Caplan – The two communities’ perspective
Caplan’s (1979) ‘two communities’ theory seeks to explain the differences between producers
of knowledge and users and the differences in utilisation on the basis of differences in culture
(Caplan, 1979). The ‘two communities’ is explained “in terms of the relationship of the
researcher and the research system to the policy maker and the policy-making system” (Caplan,
1979:459). The distinction between cultures among researchers and knowledge users or
practitioners leads to a gap in the knowledge to policy interface (Caplan, 1979). This divide
has engaged the attention of both researchers and policymakers. What Caplan (1979) refers to
as the ‘two communities’ theory remains the main concern for the science–policy interface
(Caplan, 1979). The problem is the divergence between the two communities, which has led to
a cultural and behavioural gap (different values, languages, reward systems) (Caplan, 1979).
The reason for this gap has been attributed mainly to the disconnect between researchers and
policy makers or users. The two communities do not collaborate effectively to increase the
chances of the usage of research findings. The lack of intermediary institutions to carry research
to policymakers also contributes to the gap between the two communities. In order to overcome
this shortcoming, there is the need to strengthen interactions between the two communities.
Linkage agents are needed as intermediary actors (third community) between researchers and
users (Becheikh et al., 2010).
Stellenbosch University https://scholar.sun.ac.za
47
2.4.6 Huberman – Theory-to-practice model of KU
In his theory-to-practice model, Huberman (1994) established a relationship between ‘diffuser’
and ‘user’. In this classic paradigm, the researcher ‘produces’ knowledge, then ‘transfers’ it to
a ‘user’ who ‘uses’ it. Huberman (1994) then established a ‘communication of needs’ links
between the producers of knowledge and the users of knowledge. This is to ensure that the
needs of the user are taken into consideration before the knowledge production (Huberman,
1994). The implication is that the needs and priorities of users of knowledge are taken from the
field into the laboratory or place of research. Huberman (1994) asserts that users of knowledge
should not be regarded as illiterates, novices or non-specialists, and hence used as mere targets
for use of knowledge or dissemination.
Huberman’s (1994:13) model –
[P]redicts that where there are intermediaries (people active both in research and
professional settings), where formal and informal contacts are made during the study,
where there is interim feedback on findings and when users are involved during the data
collection phase (as informants, in an action research cycle), there will be a stronger push
towards use of the findings.
This, Huberman refers to as linkage mechanisms. Furthermore, he proposes what is called
‘dissemination competence’ (see Huberman, 1994), which involves putting out different
products for distinct audiences, multiple channels (visual, in print), redundancy of the
important messages that the researchers want to get across, in-person contacts, follow-through
on those contacts, and actual involvement in the setting beyond the study (Huberman, 1994).
2.4.7 Landry et al. –Models of knowledge utilisation
Landry et al. (2001) propose four models for knowledge utilisation. These are the science push
(on the supply side), demand pull (on the demand side), dissemination, and interactive models.
The science push model follows a linear sequence from supply of research advances to
utilisation by decision-makers and practitioners (Landry et al., 2001) where research advances
are assumed to find their way into application automatically. The science push model views
scientific research and its associated processes and products as the key determinants of
knowledge utilisation. The emphasis here is on the supply of advances in research or research
outputs. The knowledge producer, mainly the researcher, becomes the central actor in the
knowledge production, diffusion and utilisation process (Hargreaves, 1999). In this case, users
Stellenbosch University https://scholar.sun.ac.za
48
are regarded as passive receptors of the findings. The supply of research then becomes the
major determinant for utilisation.
The science push model has led to studies that focus on the extent to which knowledge
utilisation is determined by the type of research and the researcher’s context, be it basic,
applied, quantitative or qualitative research (Landry et al., 2001).
Landry et al. (2001) also propose a demand-pull model of knowledge utilisation, which starts
with the identification of the research problem by the end users, in which case knowledge
utilisation is defined only by the needs of the users. They argue –
[U]se of knowledge is increased when researchers focus their projects on the needs of users
instead of focusing them only on the advancement of scholarly knowledge. Knowledge
transfer must not be assumed to be automatic but must be incorporated as part of the
research process by fashioning out dissemination mechanisms to identify useful
knowledge and transfer it to stakeholders (Landry et al., 2001:340).
Dissemination mechanisms involves the selection of appropriate mechanisms to bring research
findings of interest to stakeholders to their doorsteps. The level of interaction between
researchers and stakeholders determines the level of acceptance and the extent of use. Landry
and colleagues thus proposed an interaction model as a means to enhance the use of knowledge.
The interactive model of knowledge utilisation emphasises the intensity of the relationship
between the producers of knowledge and the end users of knowledge. The interaction model
suggests giving more attention to the relationships between researchers, users of research,
decision-makers or practitioners at all the different stages of the knowledge generation process,
dissemination and utilisation (Landry et al., 2001).
2.4.8 Conclusion of this sub-section
The above provided a list of key authors in the field of knowledge utilisation, and briefly
discussed the models developed by them. It has been argued that current developments in the
field of knowledge utilisation seem to be based on the above models. It was the hope that the
findings from this study will be in line with these developments and further propose a suitable
model within the context of the study.
2.5 Frameworks for research uptake
Many authors have proposed various means by which knowledge can be utilised (Gagliardi &
Brouwers, 2011, Lavis & Robertson, 2003). This section discusses some of these frameworks
and the domains that seek to promote the use of research. The domains necessary to promote
Stellenbosch University https://scholar.sun.ac.za
49
the use of research are usability, adaptability, validity, applicability, communicability,
accommodation, implementation and evaluation (Gagliardi & Brouwers, 2011). With reference
to organising KTE, some five elements have been identified, namely message, target audience,
messenger, knowledge transfer process and support system, and evaluation strategy (Lavis &
Robertson, 2003). These elements seek to answer the questions posed by Lavis and Robertson
(2003):
• What should be transferred?
• To whom should it be transferred?
• By whom should research knowledge be transferred?
• How should research knowledge be transferred?
• With what effect should research knowledge be translated?
There are frameworks by Andrews (2012), Gagliardi et al. (2011), Becheikh et al. (2010),
Wilson and Petticrew (2010), Mitton, Adiar and McKenzie (2007), Sudsawad (2007), Graham
and Logan (2006), Eager, Cromwell and Owen (2003), Jacobson, Buterill and Goering (2007)
and Bozeman (2000) which emphasise the use of active interactions with stakeholders for KU.
Andrews (2012), for instance, asserts that in order for research to be utilised, the research
process, stakeholder involvement, communication and micro contextual factors (such as
budgeting and capacity building) should be considered (Andrews, 2012).
In addition, evaluation has been suggested in most of the frameworks due to its significance.
The use of evaluation as suggested by Pyra (2003) is to refine the knowledge transfer process.
Evaluations are based on whether and how knowledge is transferred rather than on the extent
to which knowledge was utilised (Eagar, Cromwell & Owen, 2003; Lavis & Robertson, 2003;
Mitton, Adair & McKenzie, 2007). The evaluation aspect of the framework also enables
researchers to learn about the challenges and environment in which decision-makers operate
and determine how to present the information in a manner appropriate to the real-world
environment (Rogers, 2003).
The following sections consider some selected KU frameworks and project or individual and
organisational or institutional-level frameworks for research utilisation as proposed by various
authors.
2.5.1 Bozeman’s research utilisation framework
This sub-section attempts to adapt Bozeman’s contingent effective model to the design of
frameworks for KU. The discussion also focuses on some principles for research uptake by
Stellenbosch University https://scholar.sun.ac.za
50
identifying the various actors, actions and conditions necessary to provide a guide for the
design of strategies that could be employed.
Bozeman (2000) argues that knowledge transfer is an integral part of technology transfer. This
is because when technology transfer takes place, the knowledge on which the technology is
based is also diffused or transferred alongside the technology (Bozeman, 2000). Bozeman’s
approach acknowledges that there are certain characteristics that affect the process of
knowledge transfer with implications for its effectiveness (Bozeman, 2000).
As already discussed earlier in this chapter (literature review), a number of determinants for
an effective knowledge transfer have been outlined, namely the characteristics of the transfer
agent, transfer medium, transfer object, transfer recipient and demand environment (Bozeman,
2000). Table 2.2 below provides a summary of the various characteristics. The implication is
that, for institutional change and effective research uptake, a framework that takes cognisance
of these factors is necessary.
Stellenbosch University https://scholar.sun.ac.za
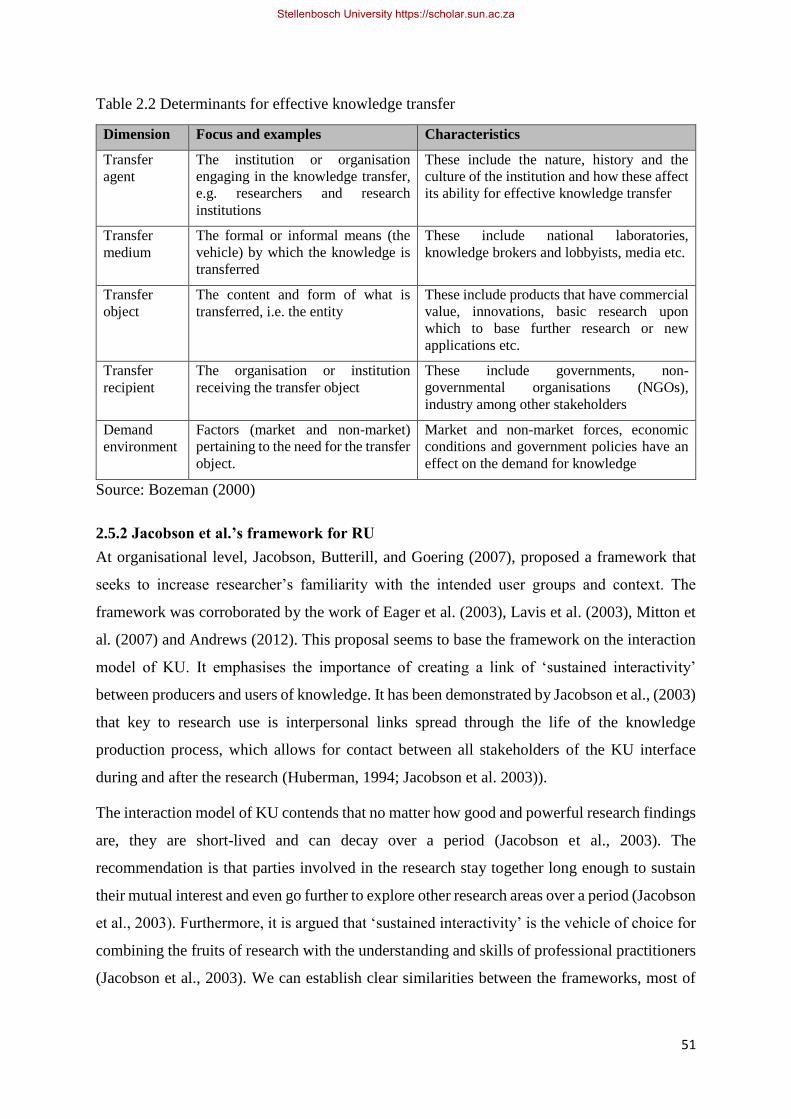
51
Table 2.2 Determinants for effective knowledge transfer
Dimension Focus and examples Characteristics
Transfer
agent
The institution or organisation
engaging in the knowledge transfer,
e.g. researchers and research
institutions
These include the nature, history and the
culture of the institution and how these affect
its ability for effective knowledge transfer
Transfer
medium
The formal or informal means (the
vehicle) by which the knowledge is
transferred
These include national laboratories,
knowledge brokers and lobbyists, media etc.
Transfer
object
The content and form of what is
transferred, i.e. the entity
These include products that have commercial
value, innovations, basic research upon
which to base further research or new
applications etc.
Transfer
recipient
The organisation or institution
receiving the transfer object
These include governments, non-
governmental organisations (NGOs),
industry among other stakeholders
Demand
environment
Factors (market and non-market)
pertaining to the need for the transfer
object.
Market and non-market forces, economic
conditions and government policies have an
effect on the demand for knowledge
Source: Bozeman (2000)
2.5.2 Jacobson et al.’s framework for RU
At organisational level, Jacobson, Butterill, and Goering (2007), proposed a framework that
seeks to increase researcher’s familiarity with the intended user groups and context. The
framework was corroborated by the work of Eager et al. (2003), Lavis et al. (2003), Mitton et
al. (2007) and Andrews (2012). This proposal seems to base the framework on the interaction
model of KU. It emphasises the importance of creating a link of ‘sustained interactivity’
between producers and users of knowledge. It has been demonstrated by Jacobson et al., (2003)
that key to research use is interpersonal links spread through the life of the knowledge
production process, which allows for contact between all stakeholders of the KU interface
during and after the research (Huberman, 1994; Jacobson et al. 2003)).
The interaction model of KU contends that no matter how good and powerful research findings
are, they are short-lived and can decay over a period (Jacobson et al., 2003). The
recommendation is that parties involved in the research stay together long enough to sustain
their mutual interest and even go further to explore other research areas over a period (Jacobson
et al., 2003). Furthermore, it is argued that ‘sustained interactivity’ is the vehicle of choice for
combining the fruits of research with the understanding and skills of professional practitioners
(Jacobson et al., 2003). We can establish clear similarities between the frameworks, most of
Stellenbosch University https://scholar.sun.ac.za
52
which emphasise the need for effective interaction between knowledge producers and potential
users of knowledge.
These interventions have been applied in some specific contexts, programmes and projects.
Many health-related projects have adapted some of these frameworks for specific health care
interventions while others have been generally applied (Wilson, Brady & Lesesne, 2011). The
National Centre for Chronic Disease Prevention and Health Promotion (NCCDPHP)’s
knowledge to action (K2A) framework was designed to be applicable generally by scientists,
administrators, policymakers and support systems (Wilson, Brady & Lesesne, 2011). The
framework comprises a three-phase process involving:
• research (this includes developing and testing scientific advances to determine their
suitability);
• translation (involves the process needed to ensure widespread implementation of
evidence-based programmes); and
• institutionalisation (involves the maintenance of the intervention programmes, policy
and practice as an established activity or norm within an organisation).
According to Wilson, Brady and Lesesne (2011), these phases allow for decision making to set
up relevant infrastructure for dissemination of research findings and to transform research into
products that stakeholders can use. The implementation is facilitated when communities,
organisations and practitioners making the decision to adopt have sufficient supporting
structures and resources to move effectively towards action (Wilson et al., 2011). Wilson et al.
(2011) framework, designed for public health researchers and practitioners as well as other
professionals, holds some lessons of good practice for the African context.
2.5.3 Sudsawad’s framework for RU
Sudsawad (2007) provides some additional insight into the context within which knowledge is
applied. He describes the process of knowledge transfer to include “knowledge dissemination,
communication, technology transfer, ethical context, knowledge management, knowledge
utilisation, two-way exchange between researchers and those who apply knowledge,
implementation research, technology assessment, synthesis of results with global context, and
development of consensus guidelines” (Sudsawad, 2007:2). His framework for KU is based on
this broad understanding of the KU process. It provides various characteristics of knowledge
transfer, which cover almost all the steps to knowledge translation as outlined by Becheikh et
Stellenbosch University https://scholar.sun.ac.za
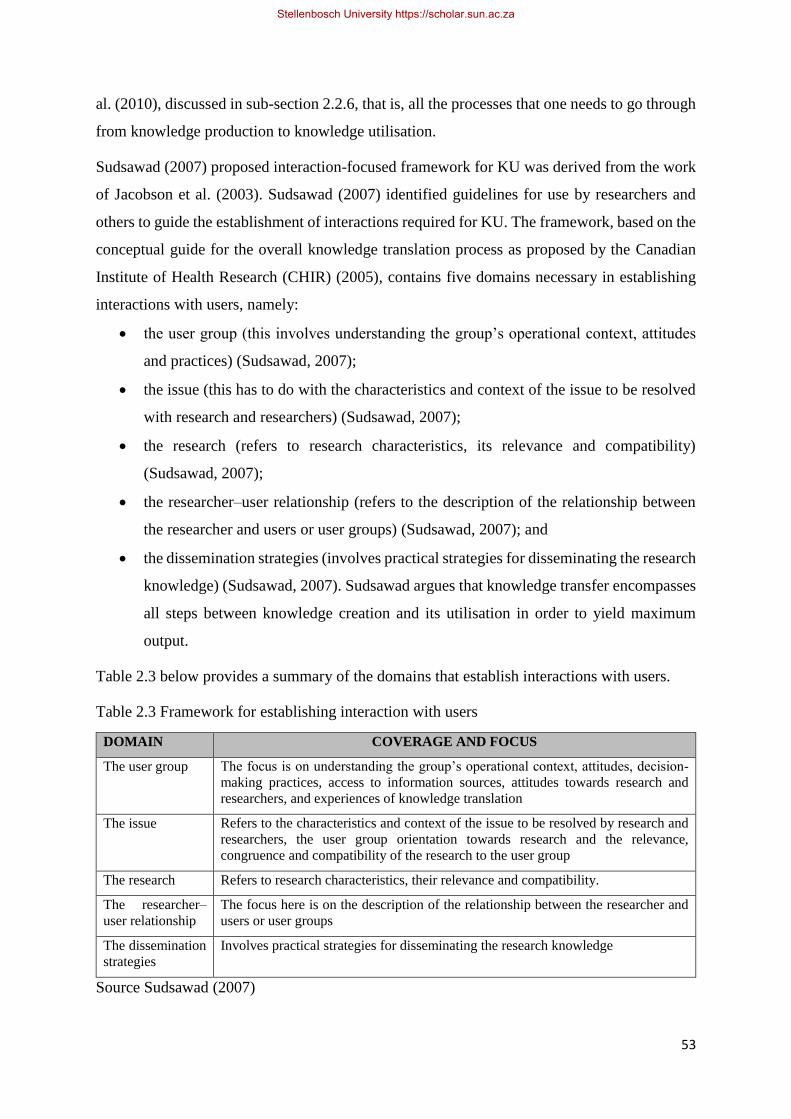
53
al. (2010), discussed in sub-section 2.2.6, that is, all the processes that one needs to go through
from knowledge production to knowledge utilisation.
Sudsawad (2007) proposed interaction-focused framework for KU was derived from the work
of Jacobson et al. (2003). Sudsawad (2007) identified guidelines for use by researchers and
others to guide the establishment of interactions required for KU. The framework, based on the
conceptual guide for the overall knowledge translation process as proposed by the Canadian
Institute of Health Research (CHIR) (2005), contains five domains necessary in establishing
interactions with users, namely:
• the user group (this involves understanding the group’s operational context, attitudes
and practices) (Sudsawad, 2007);
• the issue (this has to do with the characteristics and context of the issue to be resolved
with research and researchers) (Sudsawad, 2007);
• the research (refers to research characteristics, its relevance and compatibility)
(Sudsawad, 2007);
• the researcher–user relationship (refers to the description of the relationship between
the researcher and users or user groups) (Sudsawad, 2007); and
• the dissemination strategies (involves practical strategies for disseminating the research
knowledge) (Sudsawad, 2007). Sudsawad argues that knowledge transfer encompasses
all steps between knowledge creation and its utilisation in order to yield maximum
output.
Table 2.3 below provides a summary of the domains that establish interactions with users.
Table 2.3 Framework for establishing interaction with users
DOMAIN COVERAGE AND FOCUS
The user group The focus is on understanding the group’s operational context, attitudes, decision-
making practices, access to information sources, attitudes towards research and
researchers, and experiences of knowledge translation
The issue Refers to the characteristics and context of the issue to be resolved by research and
researchers, the user group orientation towards research and the relevance,
congruence and compatibility of the research to the user group
The research Refers to research characteristics, their relevance and compatibility.
The researcher–
user relationship
The focus here is on the description of the relationship between the researcher and
users or user groups
The dissemination
strategies
Involves practical strategies for disseminating the research knowledge
Source Sudsawad (2007)
Stellenbosch University https://scholar.sun.ac.za
54
The above interaction-focused framework for knowledge translation was proposed to serve as
a guide for establishing interactions between some six opportunities identified within the
research cycle for which interactions, communications, and partnership that help to facilitate
knowledge translation can occur (Sudsawad, 2007). The six opportunities are:
• defining your research questions and methodology;
• conducting the research;
• publishing the research findings in plain language and accessible formats;
• placing research findings in the context of other knowledge and socio-cultural norms;
• making decisions and taking action informed by research findings; and
• influencing subsequent rounds of research based on inputs of knowledge use
(Sudsawad, 2007).
Within the research cycle, due cognisance should be given to the interactions and
interconnections between the above opportunities that present themselves for an effective
knowledge translation. Sudsawad, 2007) The interconnections are such that KU can be flexibly
facilitated using the proposed framework. In the context of this study, we examined existing
characteristics of knowledge translation and their suitability for possible adaptation of the
proposed framework. Some of the characteristics outlined in the literature were that KT should
–
• involve multidirectional communicators;
• be an interactive process;
• seek ongoing collaborations among relevant parties;
• include multiple activities;
• be a nonlinear process;
• emphasise the use of research-generated knowledge;
• involve diverse knowledge user groups;
• be user- and context-specific;
• be impact-oriented; and
• be an interdisciplinary process (Sudsawad, 2007).
These characteristics seem to fall in line with the two main components proposed by Graham
and colleagues, namely, knowledge translation and suitability for adoption.
Stellenbosch University https://scholar.sun.ac.za

55
2.5.4 Graham and Logan’s framework
Within the context of evidence-based medicine (EBM), Graham, Logan, Harrison, Straus,
Tetroe, Caswell and Robinson, (2006) also proposed a knowledge-to-action framework at
individual level. This framework emphasises the collaboration between producers of
knowledge and users of knowledge. The two main components of the framework are
‘knowledge creation’ and ‘action’ with each component having several phases (Graham et al.,
2006). The knowledge creation component involves knowledge inquiry, knowledge synthesis
and knowledge tools/products (Graham et al., 2006). The assumption is that, by the time the
knowledge goes through these processes, it would have been refined and made more useful to
stakeholders (Graham & Logan, 2006). The action component of the KU framework refers to
activities required for applying the knowledge (Graham et al., 2006). This begins with problem
identification and ends with appraisal of knowledge in terms of its usefulness, validity and
whether or not it fits the local context as illustrated in Figure 3.1 below (Graham et al., 2006).
Figure 2.1 Derived from knowledge-to-action framework
Source: Graham et al. (2006)
Stellenbosch University https://scholar.sun.ac.za

56
From Figure 2.1 above, we observe the interconnection between the various components. At
the knowledge creation phase, inquiry feeds into synthesis, which leads to knowledge tools,
which are then moved into the action phase. At this phase, the knowledge or research becomes
useful and fit for context only if it is considered useful and valid by potential users.
Another framework developed by Graham and colleagues view research s an interconnected
process of individuals taking actions which are motivated by decisions (Graham et al., 2006).
This is an interactive framework referred to as the Ottawa model of research use (OMRU).
This framework was designed mainly to address issues of implementation of research
knowledge. The modified framework consists of six elements, namely:
• evidence-based innovation;
• potential adopters;
• the practice environment;
• implementation of interventions;
• adoption of innovation; and
• outcomes resulting from implementation of innovation (Graham et al., 2006;
Sudsawad, 2007).
Each of these components is subject to monitoring and evaluation at every stage of the KU
process (Sudsawad, 2007). After the monitoring and evaluation of the innovation, barrier
assessment is carried out to ensure all barriers are at least addressed before the innovation is
passed on to potential adopters and the practice environment (Sudsawad, 2007). At this point,
another M&E takes place before the selection of the implementation plan and introduction of
implementation. The M&E process continuous to the outcomes of implementation for a final
M&E (Sudsawad, 2007). The periodic M&E component at each of the stages ensures effective
implementation (Sudsawad, 2007). It should be noted that the six elements of the framework
are closely linked and interconnected. The interconnection is demonstrated in Figure 2.2 below
as produced by Graham et al. (2006).
Stellenbosch University https://scholar.sun.ac.za
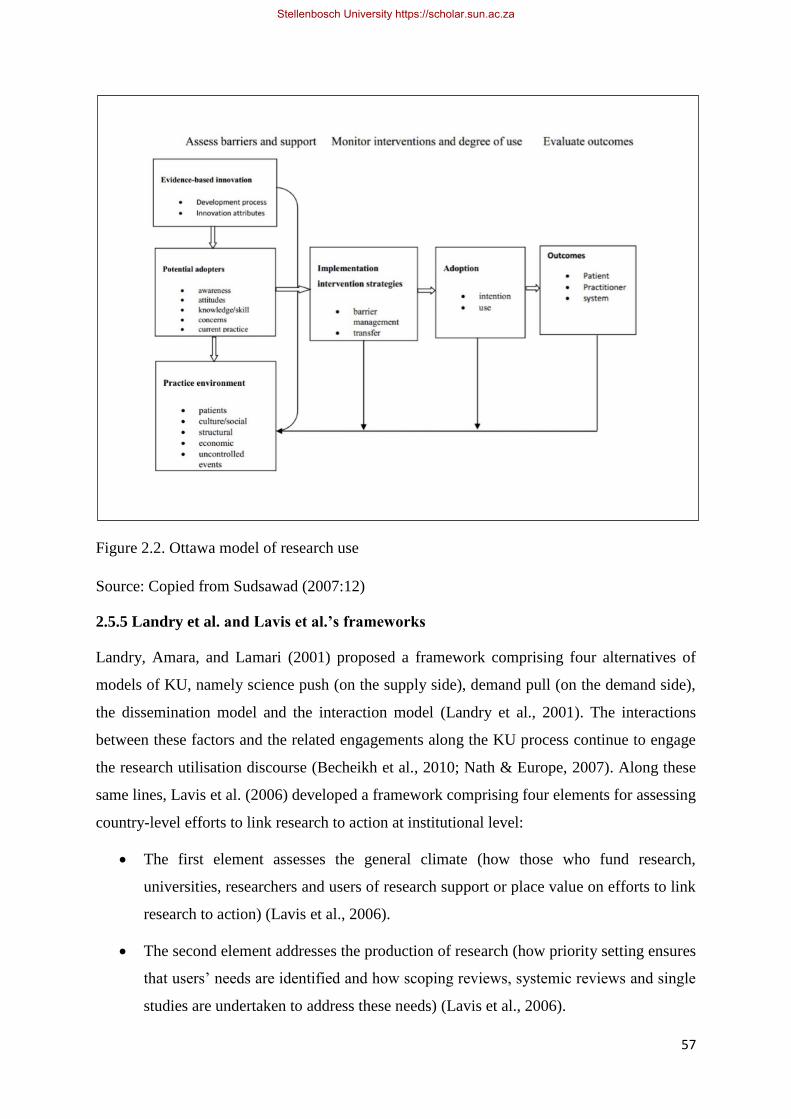
57
Figure 2.2. Ottawa model of research use
Source: Copied from Sudsawad (2007:12)
2.5.5 Landry et al. and Lavis et al.’s frameworks
Landry, Amara, and Lamari (2001) proposed a framework comprising four alternatives of
models of KU, namely science push (on the supply side), demand pull (on the demand side),
the dissemination model and the interaction model (Landry et al., 2001). The interactions
between these factors and the related engagements along the KU process continue to engage
the research utilisation discourse (Becheikh et al., 2010; Nath & Europe, 2007). Along these
same lines, Lavis et al. (2006) developed a framework comprising four elements for assessing
country-level efforts to link research to action at institutional level:
• The first element assesses the general climate (how those who fund research,
universities, researchers and users of research support or place value on efforts to link
research to action) (Lavis et al., 2006).
• The second element addresses the production of research (how priority setting ensures
that users’ needs are identified and how scoping reviews, systemic reviews and single
studies are undertaken to address these needs) (Lavis et al., 2006).
Stellenbosch University https://scholar.sun.ac.za

58
• The third element addresses the mix of four clusters of activities used to link research
to action. These are: push efforts, efforts to facilitate ‘user pull’, ‘user pull’ efforts and
exchange efforts (Lavis et al., 2006).
• The fourth element addresses approaches to evaluation (how support is provided for
rigorous evaluations of efforts to link research to action) (Lavis et al., 2006).
2.5.6 Becheikh and Ziam’s framework for RU
Organisational level reviews have been carried out in education to examine the determinants
of the knowledge transfer process (Becheikh & Ziam, 2010). More specifically, it has been
determined, within the European context, that among the central actors, linkage agents, such
as lobbyists, play a very critical role in the knowledge transfer process (Becheikh & Ziam,
2010). These linkage agents help to adapt the knowledge produced or research output in order
to make it easier for its adoption and utilisation by stakeholders. They therefore play an integral
role in the effectiveness of the research uptake process. Becheikh and Ziam (2010) argue that
the effectiveness of the knowledge transfer process hinges on several factors, which they have
grouped into three main categories, namely determinants related to the transferred-knowledge
attribute; determinants related to actors involved in the knowledge transfer process; and
determinants related to transfer mechanisms (Becheikh et al., 2010). These are not detached
from Bozeman’s framework as discussed in sub-section 3.2.1 and Mouton’s principles
(Mouton, 2012).
A six-step framework for the knowledge transfer process has been proposed by Becheikh et al.
(2010), comprising knowledge generation, knowledge adaptation, knowledge dissemination,
knowledge reception, knowledge adoption, and KU. The first three are attributed to researchers
whilst the last three are attributed to users.
Figure 2.3 below provides a summary of the linkages between the various components. The
process begins with knowledge generation, which consists of the creation of knowledge by
researchers. This is followed by the knowledge adaption stage where research results are made
accessible and put in a way that can be understood by potential users. The knowledge
dissemination stage is associated with the transfer of research results to communities of practice
(Becheikh et al., 2010). This is followed by the knowledge reception stage where users first
come into contact with the knowledge generated, adapted and disseminated by the researcher.
Becheikh et al. (2010) proposed that knowledge adoption – which refers to the path used to
pass through the process of creating awareness, forming an attitude, making a decision,
Stellenbosch University https://scholar.sun.ac.za
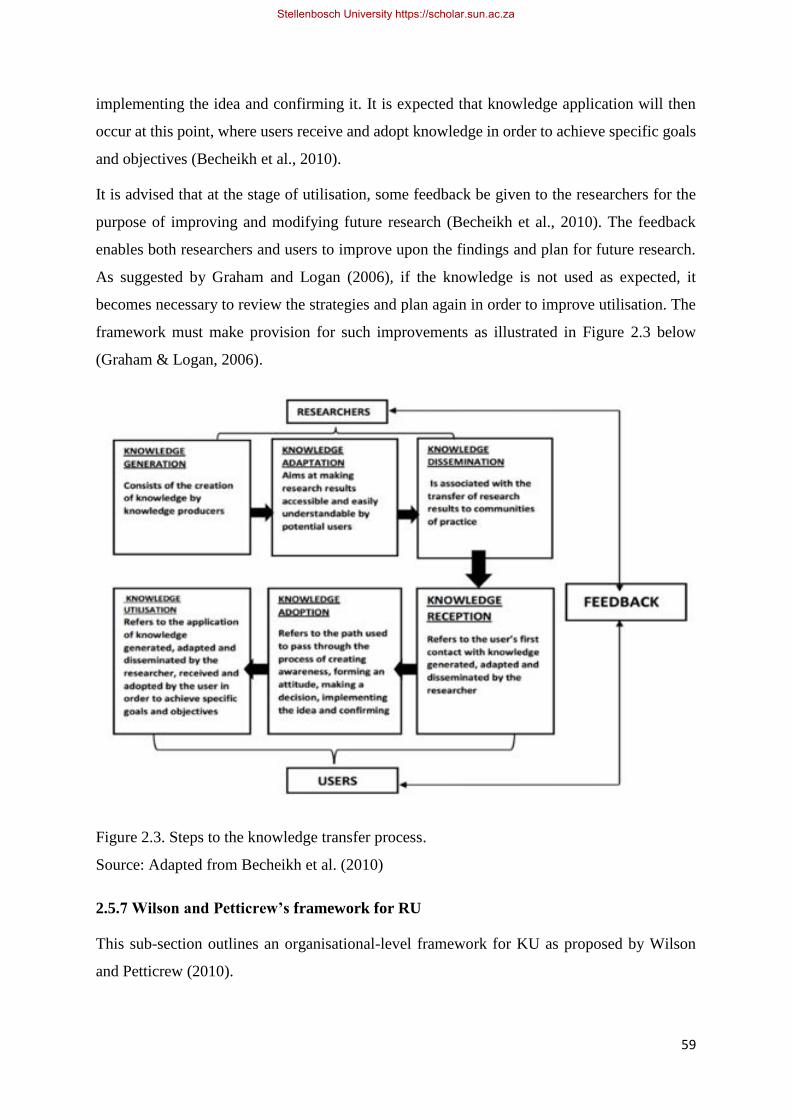
59
implementing the idea and confirming it. It is expected that knowledge application will then
occur at this point, where users receive and adopt knowledge in order to achieve specific goals
and objectives (Becheikh et al., 2010).
It is advised that at the stage of utilisation, some feedback be given to the researchers for the
purpose of improving and modifying future research (Becheikh et al., 2010). The feedback
enables both researchers and users to improve upon the findings and plan for future research.
As suggested by Graham and Logan (2006), if the knowledge is not used as expected, it
becomes necessary to review the strategies and plan again in order to improve utilisation. The
framework must make provision for such improvements as illustrated in Figure 2.3 below
(Graham & Logan, 2006).
Figure 2.3. Steps to the knowledge transfer process.
Source: Adapted from Becheikh et al. (2010)
2.5.7 Wilson and Petticrew’s framework for RU
This sub-section outlines an organisational-level framework for KU as proposed by Wilson
and Petticrew (2010).
Stellenbosch University https://scholar.sun.ac.za
60
Systematic reviews have been carried out by Wilson and Petticrew to identify and describe
conceptual or organising frameworks designed to be used by researchers to guide their
dissemination activities and to identify and describe any conceptual or organising frameworks
relating to the knowledge translation continuum (Wilson and Petticrew, 2010) (see also sub-
sections 2.2.1 to 2.2.6 above) that provide enough detail on the dissemination elements that
researchers could use to guide their dissemination activities (Wilson & Petticrew, 2010).
Wilson and Petticrew (2010) propose that there are intrinsic characteristics of research that
determine the rate of uptake arguing that research uptake takes through phases from knowledge
production through adoption to confirmation (Wilson & Petticrew, 2010). The authors also
identified some theoretical foundations on which to establish frameworks for the dissemination
of knowledge. These are; persuasive communication, diffusion innovation and social
marketing. These domains notwithstanding, systemic and institutional dynamics have a
considerable influence in whether or not these can be workable within the context of the current
study. In the context from where this framework was derived (i.e. the health sector), it has been
proved to yield positive results. The current study explored various options that were suitable
within the context of the study.
2.5.8 Ellen et al.’s framework
In a qualitative study of determining research knowledge infrastructure (RKI) for healthcare
systems, Ellen, Lavis, Ouimet, Grimshaw and Bédard (2011) proposed possible organisational-
level components of an RKI. This was developed to outline components that a health system
would require to support its RKI. Although specific to healthcare systems, the framework may
be applicable in many ways to our particular circumstances. Four components of the RKI
identified are:
• climate for research use;
• research production;
• activities to link research to action; and
• evaluation efforts (Ellen et al., 2011).
Acknowledging challenges within the health sector, Ellen et al. (2011) argue that knowledge
transfer approaches and activities ought to keep pace with constant evolutions occurring within
the sector. Drawing on the work of Lavis et al. (2006), three approaches to knowledge transfer
that target health system managers and policymakers were identified (Ellen et al., 2011). These
approaches are in line with the four categories identified above. The three approaches are:
Stellenbosch University https://scholar.sun.ac.za

61
• ‘Push’ activities – “activities undertaken by researchers to package and disseminate
research evidence outside the scholarly community” (Ellen et al., 2011:2);
• ‘Pull’ activities – efforts by users of knowledge and policymakers to access and use
research evidence (Ellen et al., 2011; Lavis et al., 2006); and
• ‘Exchange activities’ – focuses on “building and maintaining relationships between
researchers and managers and policy-makers” (Ellen et al., 2011:2).
According to Ellen et al. (2011), these are the key components of the activities used to link
research to action, which happened partly to be the aim of this study but beyond that, we sought
to design a strategic policy framework for research utilisation and management.
2.5.9 Cherney et al.’s framework
Similar to the framework of Lavis et al. (2006), Cherney, Povey, Head, Boreham and Ferguson
(2012) categorised the independent variables influencing research use under supply-side and
demand-pull factors as well as dissemination and interaction variables. The science push model
(supply side) follows a linear sequence from supply of research advances to utilisation by
decision-makers and practitioners (Landry et al., 2001), one where research advances are
assumed to find their way into application automatically. Cherney, Povey, Head, Boreham,
Ferguson (2012) view scientific research and its associated processes and products as the key
determinant of KU (Cherney et al., 2012). The emphasis here is on the supply of advances in
research or research outputs. The knowledge producer, i.e. the researcher, becomes the central
actor in the knowledge production, diffusion and utilisation process (Hargreaves, 1999).
Researchers research into topics that originate with them and which are considered in terms of
available evidence (Cherney et al., 2012). Users, in this case, are regarded as passive receptors
of the findings.
Demand pull also follows a linear sequence but here the users are the ones who identify the
research problem according to their needs (Cherney et al., 2012). Demand pull concerns itself
with whether the end user sees the research as being credible, important and capable of meeting
needs and being delivered timely. This model seeks to improve on the criticisms of the science
push model by focusing attention on the users of knowledge rather than on the producers and
their research advances. Researchers merely respond to the needs of users by turning their
scholarly attention towards providing the requested knowledge (Cherney et al., 2012). The
initiative shifts from researchers to decision-makers or practitioners who then become the main
source of ideas for directing research (Cherney et al., 2012; Rich, 1991). Landry et al. (2001)
Stellenbosch University https://scholar.sun.ac.za
62
assert that the approach generates a customer–contractor relationship where the practitioners
and decision-makers behave like customers who define which research they want, and where
the researchers behave like contractors in exchange of payments (Cherney et al., 2012). Here,
knowledge is produced on demand, and for this reason, there is a high certainty for its use. The
criticism, however, is that there is a possibility that, although research is produced on demand,
it may not necessarily be compatible with the organisational interest of the user (Cherney et
al., 2012).
From the above, four broad categories, covering both linear and interactive models, can be
identified as follows:
• science push (supply side);
• demand pull (on demand side);
• dissemination; and
• interactive models.
2.5.10 Grobbelaar and Harber’s framework
From the above, we can so far identify the following components from the literature as
necessary ingredients for the framework of research utilisation:
• the university’s mission and vision (Lavis & Robertson, 2003);
• research policy (Lavis & Robertson, 2003);
• research stakeholders or users (Jacobson et al., 2007; Mitton et al., 2007);
• capacity building (Andrews, 2012);
• communicating research or accessibility of research (Andrews, 2012);
• budget (Andrews, 2012); and
• M&E of uptake (Eagar et al., 2003; Lavis & Robertson, 2003; Mitton et al., 2007).
These components are discussed in detail in section 3.4 (the section on developing strategy for
research utilisation). In the development of a strategic research uptake framework, all
contextual factors need to be considered at both project and organisational level.
Table 2.4 below provides a summary of the organisational level frameworks for KU as
discussed above.
Stellenbosch University https://scholar.sun.ac.za

63
Table 2.4: Organisational level frameworks for RU
Lavis et al.
(2003)
Jacobson et
al. (2003);
Mitton et al.
(2007)
Wilson et al. (2010) Gagliardi et al.
(2011)
Andrews (2012)
Organising
KTE via the
message,
target,
audience, the
messenger,
knowledge
transfer
process and
support
system, and
evaluation
Sustained
interactivity
between
producer and
users of
knowledge
Systemic reviews to
guide dissemination
activities via five-
phase innovation
process:
• knowledge,
• persuasion,
• decision,
• implementation
and
• confirmation
Domains for
implementation:
• usability,
• adaptability,
• validity,
• applicability,
• communicability
• accommodation,
• implementation;
and
• evaluation
Stakeholder
involvement,
communication,
budgeting and
capacity building
The above frameworks have been given a further impetus by the work of Ellen et al. (2011)
and more recent works by Grobbelaar & Haber (2014). Along these lines, Grobbelaar and
Haber (2014) proposed a framework based on the work of Ellen et al. (2011), aimed at
conceptualising systems based on institutionalisation of research uptake within sub-Saharan
Africa. They developed five focus areas necessary for strengthening research uptake capacity,
namely:
• Climate for RU and the institutional research context (referring to the organisational
processes, such as mission, vision and goals that support RU, culture, context, policy,
capacity, incentives) (Grobbelaar & Haber 2014). In line with the mission, vision and
goals, a review of existing RU plans and identification of pathways for RU helped with
the determination of the right climate conducive enough to withstand existing
institutional barriers and constraints.
• Institutionalising RU into the knowledge production processes and support
(referring to the integration of research uptake activities into the institutional research
cycle, including the process of knowledge production and dissemination (Grobbelaar
& Haber, 2014). A survey was conducted to identify various pathways to RU alongside
the strengths and opportunities for RU within KNUST to provide direction for an
appropriate research production and dissemination strategy.
• Facilitating push factors through exchange (referring to factors leading to engaging
policymakers and governments) (Grobbelaar & Harber, 2014). Through stakeholder
Stellenbosch University https://scholar.sun.ac.za
64
engagement, we are able to plan to some extent a suitable research dissemination
approach and the essential elements to be incorporated in the RU strategy.
• Facilitating pull factors through exchange (this refers to factors that promote the
demand for research) (Grobbelaar & Harber, 2014). Here again, there is the need for
stakeholder engagement in order to determine their specific research needs.
• M&E efforts (referring to initiatives at institutional level to evaluate the effectiveness
of RU activities) (Grobbelaar & Harber 2014). Due consideration is given to the
differences in the mode of knowledge production as a result of the different fields
(Mouton, 2012).
In pursuance of developing an appropriate policy framework for institutionalising RU, there
was a need to –
• incorporate the creation of the necessary climate for RU at organisational level;
• examine possible ways of institutionalising RU into the knowledge production
processes and support; and
• find ways to facilitate push factors through exchange as suggested by Grobbelaar and
Harber (2014).
The above suggested a scheme for reviewing the state of RU at KNUST and providing some
guidelines for the development of the institutional framework. Table 2.5 below provides a
summary of the key focus areas as discussed above.
Stellenbosch University https://scholar.sun.ac.za
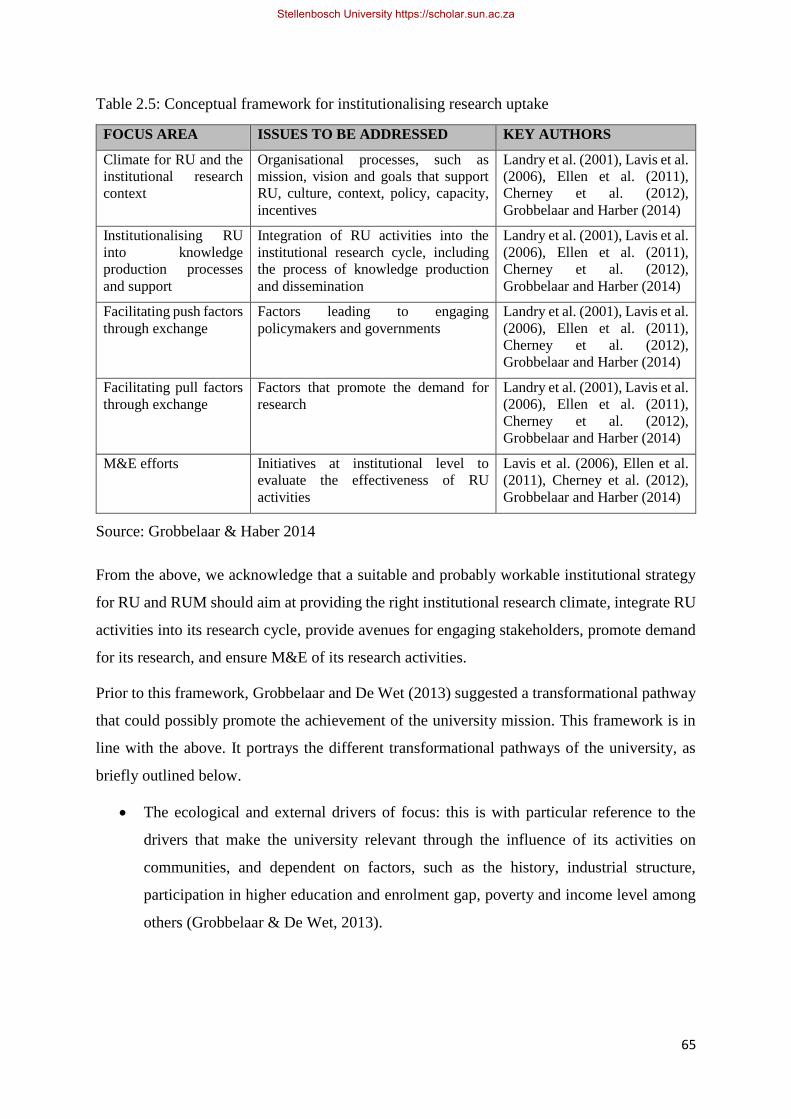
65
Table 2.5: Conceptual framework for institutionalising research uptake
FOCUS AREA ISSUES TO BE ADDRESSED KEY AUTHORS
Climate for RU and the
institutional research
context
Organisational processes, such as
mission, vision and goals that support
RU, culture, context, policy, capacity,
incentives
Landry et al. (2001), Lavis et al.
(2006), Ellen et al. (2011),
Cherney et al. (2012),
Grobbelaar and Harber (2014)
Institutionalising RU
into knowledge
production processes
and support
Integration of RU activities into the
institutional research cycle, including
the process of knowledge production
and dissemination
Landry et al. (2001), Lavis et al.
(2006), Ellen et al. (2011),
Cherney et al. (2012),
Grobbelaar and Harber (2014)
Facilitating push factors
through exchange
Factors leading to engaging
policymakers and governments
Landry et al. (2001), Lavis et al.
(2006), Ellen et al. (2011),
Cherney et al. (2012),
Grobbelaar and Harber (2014)
Facilitating pull factors
through exchange
Factors that promote the demand for
research
Landry et al. (2001), Lavis et al.
(2006), Ellen et al. (2011),
Cherney et al. (2012),
Grobbelaar and Harber (2014)
M&E efforts Initiatives at institutional level to
evaluate the effectiveness of RU
activities
Lavis et al. (2006), Ellen et al.
(2011), Cherney et al. (2012),
Grobbelaar and Harber (2014)
Source: Grobbelaar & Haber 2014
From the above, we acknowledge that a suitable and probably workable institutional strategy
for RU and RUM should aim at providing the right institutional research climate, integrate RU
activities into its research cycle, provide avenues for engaging stakeholders, promote demand
for its research, and ensure M&E of its research activities.
Prior to this framework, Grobbelaar and De Wet (2013) suggested a transformational pathway
that could possibly promote the achievement of the university mission. This framework is in
line with the above. It portrays the different transformational pathways of the university, as
briefly outlined below.
• The ecological and external drivers of focus: this is with particular reference to the
drivers that make the university relevant through the influence of its activities on
communities, and dependent on factors, such as the history, industrial structure,
participation in higher education and enrolment gap, poverty and income level among
others (Grobbelaar & De Wet, 2013).
Stellenbosch University https://scholar.sun.ac.za
66
• Barriers and changes in control: has to do with extrinsic and intrinsic barriers (i.e.
internal organisational and external barriers). There are cultural- and funding-related
barriers that inhibit the university from performing its developmental role.
• Governance of higher education: policy-related changes, structure, infrastructure and
engagement activities are listed here as some of the factors that influence the
governance system of higher education (Grobbelaar & De Wet, 2013).
• The form and focus of teaching and knowledge production: this informs how the
university works with local enterprise and communities for the training and acquisition
of relevant skills. It addresses the issue of participation and enrolment gaps (Grobbelaar
& De Wet, 2013).
• Form and focus of knowledge production and dissemination: the strengthening of this
aspect enhances the developmental role of the university. It focuses on the nature and
level of knowledge production, research activities and how these address the
developmental role of the university (Grobbelaar & De Wet, 2013). This is the central
theme of the current study.
• Change in form and focus of industry and community engagement: the university’s
engagement with the external environment and particularly its stakeholders is
dependent upon the availability of knowledge resources, networks and extension
activities. The changes in form and focus of the university as far as engagement is
concerned, have implications for the way in which the university engages with the
external environment and the accessibility of knowledge resources in the university to
outside players. Such considerations may include having a wide view of extension,
using not only staff to the maximum, but also students and community members
(Arocena & Sutz, 2007). These transformational pathways formed the basis for the
conceptual framework of the current study.
2.5.11 Mouton’s principles
At project level, the focus and characteristics of the dimensions provided above with
implications for effective KU have been explored further. Following on from the work of
Bozeman (2000), there are some principles (Mouton’s principles) to follow to ensure optimum
utilisation of research. Mouton’s principles acknowledge the differences in the various
scientific fields in the design of frameworks. In his review of the work of Bozeman (2000),
Stellenbosch University https://scholar.sun.ac.za
67
Mouton (2012) derived some principles that are likely to be encountered by researchers in the
process of research utilisation, namely:
• Considering the differences in the modes (Mode 1 and Mode 2) of knowledge
production (see Mouton, 2012). Here, the researcher needs to decide where to put
emphasis regarding the type of research, be it basic, applied or developmental or
strategic that will help fulfil its vision (Mouton, 2012). Research active staff need to
identify with their stakeholders in order to determine the type of research suitable to
them.
• Mouton’s second principle calls for epistemological considerations in the design of
strategy due to its implications. There is a need to consider factors such as the various
disciplines, the purpose of research, and whether or not other actors will be needed in
the knowledge production and utilisation process.
• The pathways to RU will depend on the modes of knowledge production (Mouton,
2012). For example, basic research will be especially applicable to the academic
community and fellow researchers, whereas developmental research will be relevant to
external stakeholders (Mouton, 2012). Mouton therefore recommends that RU planning
should acknowledge the different adoption pathways in order to ensure proper
alignment of uptake support mechanisms to the nature of the research.
• In the various scientific fields, RU activities will differ and the context within which
the research is applied, will also differ (Mouton, 2012). Mouton argues that, since there
are different research projects, different models of research, disciplinary differences,
and pathways, the way they are evaluated must take into consideration these differences
(Mouton, 2012). In view of these peculiarities of disciplines, the RU strategy must be
clear about the context, purpose, intended use and impact expected.
Researchers and research teams interested in the uptake of their research need a strategy that
takes these principles into consideration. As indicated by Mouton (2012), subject peculiarities,
modes of research and adoption pathways should all be taken into consideration in the strategy
for RU and RUM.
2.5.12 Conclusion of this section
Although most of the existing frameworks and strategies were developed in the Euro-American
context, they could serve as guides or good practice since there are some similarities in the
Stellenbosch University https://scholar.sun.ac.za
68
educational and socio-cultural systems. Once we identify these similarities, it places us in a
situation where we can contextualise some of Mouton’s (2012) principles. Hemsley-Brown
and Oplatka, (2005) have argued that in order to cross fertilise ideas and clarify problems it is
necessary to identify similarities and differences between systems (Hemsley-Brown &
Oplatka, 2005).
It must be pointed out that wholesale adoption of these frameworks was not likely to be useful
within the context of the current study. In view of this, the study solicited ideas from the
university community, most especially academic staff and research staff, leading to the design
of the most appropriate framework necessary for use within our context. The framework, which
encompasses the most appropriate processes for KU, drew on some of the best practices applied
in the above frameworks. The more applicable of these frameworks are those that address
issues of active interactions between the producers of knowledge and users of knowledge.
Frameworks that seek to address capacity gaps in the knowledge production and utilisation
process seemed more appropriate for the current study. This is because at organisational level,
it has been identified, within the research utilisation process, that universities within sub-
Saharan Africa lack capacity in internal management (Kirkland, Mouton & Coates, 2010).
CHAPTER 3 – UNIVERSITIES AND RESEARCH UPTAKE
Current trends give indications that more and more universities are becoming developmental
by contributing to national economic, environmental and social developments, in their quest to
fulfil their mission and vision. Societal expectations of universities require adaptations and
conformities to global trends in order to become more relevant. This chapter continues the
literature review on the paradigms and role of universities in society, pathways to research
utilisation as well as project and organisational-level frameworks for research utilisation. The
barriers and facilitators to research uptake (the processes leading to how research is put to use
by user groups or stakeholders), approaches to developing strategy and examples institutional
level strategies are also considered.
3.1 The role of universities in society
This sub-section looks at societal expectations of the university, and what the university is
capable of doing for society. Over time, there has been increased pressure by governments,
funders and society for universities to play more meaningful roles. The relevance of the
university in addressing societal needs was becoming an issue of public concern leading to a
Stellenbosch University https://scholar.sun.ac.za
69
series of adjustments by universities in an effort to address the economic and developmental
needs of society.
Universities the world over have mission and vision statements, which spell out their mandates.
In most cases, the mission is to fulfil national as well as local needs. Cloete, Maasssen and
Bailey (2015) summarise the historical and indigenous roles of the developmental university
as follows:
• Universities reflect the ideological apparatus, which provides values and ‘social
legitimation’. According to Cloete et al. (2015) universities in Africa were modelled
after the European tradition of church-based theology schools. Apart from this, there
were also non-church-based universities that also concentrated on the production of
social and ethical values.
• Universities were set up for the selection of the dominant elite, who sought to establish
codes of ethics between them in order to distinguish them from the rest of society.
• Universities existed to provide in the need for manpower by training the labour force
of society.
• Universities existed to provide scientific knowledge.
Apart from these roles, universities seek to achieve their developmental role through the
transformation of society and the production of new knowledge. They are said to play a political
role through large-scale training of people as well as engaging in knowledge production for
economic influence (Castells, 1994). Furthermore, there are functions related to consumption,
namely general education, community life and a holding operation (Castells, 1994). Issues
about citizenship, such as socialisation, critical evaluations and democratisation, are all seen as
part of the functions of universities (Cloete et al., 2015). Similarly, Castells (1994) argues that
universities contribute to social equality as well. Apart from their contribution to economic
growth, universities bring about cultural renewal and cultural innovation. Universities are
therefore expected to lead the way in the production of knowledge for the benefit of society.
Public universities, especially, are under obligation to respond to national needs through their
activities. There are various reasons why the university is important to national economic and
social advancement.
With globalisation, economic competitiveness is increasingly dependent on innovation, and
therefore universities are expected to produce market-relevant innovations that address specific
Stellenbosch University https://scholar.sun.ac.za
70
human needs (Etzkowitz, 2004). According to Etzkowitz, Webster., Gebhardt & Terra (2000),
innovation draws upon technological and scientific knowledge, and universities, as primary
sources of new scientific knowledge, have an opportunity to play a more central role in
contributing to innovation and hence competitiveness and economic development. The
university, as a knowledge-producing and knowledge-disseminating institution (Etzkowitz et
al., (2000), is expected to play a role in industrial innovation, which hitherto has been the
preserve of either industry or government, or, depending upon the social system, it may have
been a bilateral interaction between these two spheres (Etzkowitz et al., 2000). Florida argues
that the shift towards “knowledge-based capitalism makes the university ever more critical as
a provider of critical resources such as talent, knowledge and innovation” (Florida, 1999:5).
The next sub-section discusses the importance of putting research to use as a means to
emphasise the importance of the university in development.
3.1.1 The importance of knowledge utilisation
Estabrooks and Derksen (2008) assert that society is becoming increasingly dependent on
knowledge and the way it can be used to improve human lives. A major source of knowledge
can be found within universities, which have two main actors in the process of knowledge
production, namely researchers or academics and post-graduate students. Generally, research
is aimed at advancing knowledge, influencing policy, improving practice and, to some extent,
resolving socio-economic problems. Knowledge production arising out of research is therefore
expected to solve problems or influence decisions, hence the increasing demand for KU
(Estabrooks & Derksen, 2008). The demand for KU has led to many economies in the world
looking up to universities to provide holistic solutions to societal challenges ranging from food
security to the provision of portable drinking water (Estabrooks & Derksen, 2008). Similarly,
governments are putting measures and policies in place to maximise social impact. Some of
these measures demand efficiencies in higher education (HE) systems (Wood, 2013). Wood
argues that, despite being labelled ‘ivory towers’, the walls around university campuses are
coming down as they engage more closely with local civil society.
Faust (2010), in her paper on the role of universities in a changing world, argues that
“knowledge is replacing other resources as the main driver of economic growth, and education
has increasingly become the foundation for individual prosperity and social mobility” (Faust,
2010:1). She thus, emphasises the vital role of universities and for that matter the importance
Stellenbosch University https://scholar.sun.ac.za
71
of knowledge to society and economies. Her views on the role of universities may be
summarised as follows (Faust, 2010):
− broader economic growth;
− individual success;
− solving challenges that cross borders;
− unlocking and harnessing new knowledge;
− building cultural and political understanding; and
− modelling environments that promote dialogue and debate.
This view of society about the university can be seen in a positive light should universities play
their developmental roles more effectively. Adopting a developmental approach to research is
thus essential. The next sub-section considers the role of the developmental university,
specifically within the African HE system.
3.1.2 Developmental university and the African context
The pressure for relevance of universities has contributed largely to the eventual evolvement
of developmental and entrepreneurial universities (Etzkowitz et al., 2000). Whereas the
developmental university plays a direct instrumental role in the national developmental agenda
(Etzkowitz et al., 2000), but not necessarily through the production of knowledge, the
entrepreneurial university (Etzkowitz et al., 2000) on the other hand focuses on knowledge
production as well as innovation and technology, and how it can best be put to commercial use.
This sub-section is intended to discuss the developmental role of universities and how this has
evolved within the African context.
It may be deduced that universities have evolved as a result of efforts at seeking to address
specific national, developmental or social problems. According to Ajayi, Goma and Johnson
(1996), evidence shows that, before the establishment of formal institutions, some form of
traditional knowledge systems existed in Africa (Ajayi et al., 1996). With the introduction of
formal education, the role of universities in sub-Saharan Africa started focusing predominantly
on teaching and research. Current developments, however, give an indication of an expansion
in the role. A check on the mission statements of many universities in Africa gives an indication
that ‘community service’ has been made part of the mission statements of African universities.
Current developments are such that community service is gaining more recognition though to
a large extent more time is dedicated to teaching (Grobbelaar & Kirkland, 2013). True as this
assertion may be, community service is yet to make that significant impact for society to
Stellenbosch University https://scholar.sun.ac.za
72
acknowledge the role of the university. In our particular case (KNUST), this is expected of
every academic staff as a matter of duty. What constitutes community service and the academic
staff’s perception and understanding of it, is a matter of further investigation.
The role of higher education in Africa has seen changes from pre-colonial through colonial to
the post-colonial era. Many universities in sub-Saharan Africa have a research history based
on a colonial heritage. In Ghana, for instance, due to colonial domination, research was carried
out by British scientists basically to address the problems of settlers and to facilitate the smooth
running of the colonial administration, hence emphasis was put on research in tropical medicine
and agriculture (Chatelin, Gaillard & Keller, 1997). This was because, at the time, there were
tropical diseases which were inhibiting the work of the colonial settlers and so there was a need
for research to find ways of controlling these diseases (Chatelin et al., 1997). In the case of
agriculture, the aim was to improve land use and cultivation, and primarily develop better
cropping systems and high yielding varieties of cash crops (Chatelin et al., 1997). The post-
independent era has seen no significant change in the research focus of the country. According
to Woldegiorgis and Doevenspeck (2013), African universities have been performing various
roles but at the same time continue to execute foreign roles, largely a product of European
colonial frameworks, which have not been owned by African societies.
The history of the developmental university started after independence in Africa in the 1960s
when universities in Africa were expected to play key roles in the human development in the
countries where they are located (Cloete, Bailey, Pillay, Bunting & Maassen, 2011; Cloete et
al., 2015). This was to cater for human resource shortfalls after the colonial era and the
subsequent departure of colonial expertise. Since then, there have been moves for African
universities to be developmental with calls on governments as well as academics to lead the
developmental agenda (Cloete et al., 2011). Steps by African governments to promote the
developmental role of the university have led to some modest gains.
The developmental role of the university in Africa, after independence, was expected to cut
across all spheres of life, including Africanisation, nation-building, engines of knowledge
economy, economic development, social and environmental development (Cloete et al., 2011;
Woldegiorgis & Doevenspeck, 2013). The need for universities to pursue a developmental
agenda was underscored (Cloete et al., 2015:7). That notwithstanding, it has been recorded that
African governments did little by way of promoting the declaration due to a lack of a coherent
developmental model, inadequate funding for institutions, power struggles and external politics
(Cloete et al., 2015).
Stellenbosch University https://scholar.sun.ac.za
73
It is argued that, “in Africa few issues are more important than environment-related problems
of food, security, poverty, disease, land degradation, water security, climate change, conflicts,
deforestation, natural disasters, and urbanisation” (Lulat, 2007:245). HE systems exist
primarily not only for knowledge creation but also to address practical issues of life. Especially,
for public-funded HE set-ups, the national developmental agenda is a top priority.
Governments therefore have a say in the programmes of study as well as curriculum
development. The role of the developmental university has therefore been argued to be
informed by the core mission of HE systems, namely teaching research and service to
community, which have the potential of influencing society leading to sustainable development
(Mbabane, 2010).
African universities have been advised to play active and meaningful roles in the production
of national manpower in their communities by contributing to building ‘social capital’ (Cloete
et al., 2011). Communities in the vicinity of universities can only feel the effect of higher
education if it plays a meaningful role in the community. Universities should be able to address
challenges that communities face. It should be possible to hold community-based fora, and
community-based research should appeal to the people within the communities.
It was the hope that African universities would increase their relevance by contributing to the
continent’s developmental needs through innovations and strategies. They should further seek
to inculcate moral and ethical values, leading to lifestyle and behavioural changes necessary
for the socio-economic development and positive societal transformation (Lulat, 2007). One
strategy adopted by African universities for social transformation is to raise the level of literacy
(Lulat, 2007). Universities could raise literacy levels through activities of their learning centres;
thus, increasing employability skills, which would lead to higher productivity, higher salaries
and technological advancements (Bloom, Canning & Chan, 2006). Bloom and colleagues
reviewed evidence that sub-Saharan African tertiary education could have an influence on
economic growth and reduction in poverty levels. They confirm the existence of the potential
within African HE to influence socioeconomic development granted that the needed structures
are put in place (Bloom et al., 2006).
A major challenge to the developmental role of African universities is that of funding. Africa
has seen a gradual erosion of funding for higher education. The reduction in funding is such
that academic research output in the region is said to be among the world’s lowest and that
many African countries struggle to maintain even low enrolment levels (Bloom et al., 2006).
At some point, there was a shift in focus towards primary education due the cost of tertiary
Stellenbosch University https://scholar.sun.ac.za
74
education and the argument that the returns on primary education are higher. Funding was
therefore, re-aligned to primary education, which contributed to the reduction of funding for
higher education (World Bank, 2009) .There is some level of improvement in funding higher
education but this is not significant (UNESCO, 2018). The dwindling resources to tertiary
education, and for that matter to universities, may be attributed to the shift in focus towards
primary education. The World Bank, however, supports funding for higher education to cater
for a limited number of skills required by the market. There is therefore some level of
government funding for higher education and encouragement for private sector participation
(UNESCO, 2018). UNESCO had actually issued a statement calling on governments in African
to play a leading role to enable universities to become developmental (Cloete et al., 2011). In
Ghana, the government provides funding for public universities, which covers all fees and some
administrative costs. Research is funded mainly through internally generated funds, including
school fees.
The need for a massive capital injection into higher education in Africa cannot be
overemphasised. Universities across Africa have gained recognition as potential vehicles for
economic and political development and therefore require the needed funding to maximise their
ability for economic growth and poverty alleviation (Bloom et al., 2006).
Another factor hampering the developmental role of higher education in Africa has to do with
the cultural setting within which the institution operates. Among the cultural issues that lead to
underperformance of higher education in Africa are a lack of focus and academic leadership
resulting in misdirected research that have no direct bearing on the social needs of the
community (Cloete et al.,2015). The underperformance of the developmental role of African
higher education has been attributed by Cloete et al., (2015) to a lack of generation of new
knowledge or research. Harnessing academic capabilities to the advantage of development has
therefore been a barrier to the developmental role of universities in Africa (Cloete et al.,2015).
There is the need to prompt researchers occasionally on the need to be nationalistic and
concerned about developmental needs and the way their expertise could be used to address
those issues. Individualism, a lack of teamwork and a lack of collaboration with other
researchers could hamper the effective developmental role of higher education (Cloete et al.,
2015).
As already mentioned, the weak research infrastructure has contributed to the lack of show by
African HE systems. Cloete and Maassen (2015) assert that institutional and structural reasons,
such as a lack of funds and a lack of centres of excellence for specialised research have
Stellenbosch University https://scholar.sun.ac.za
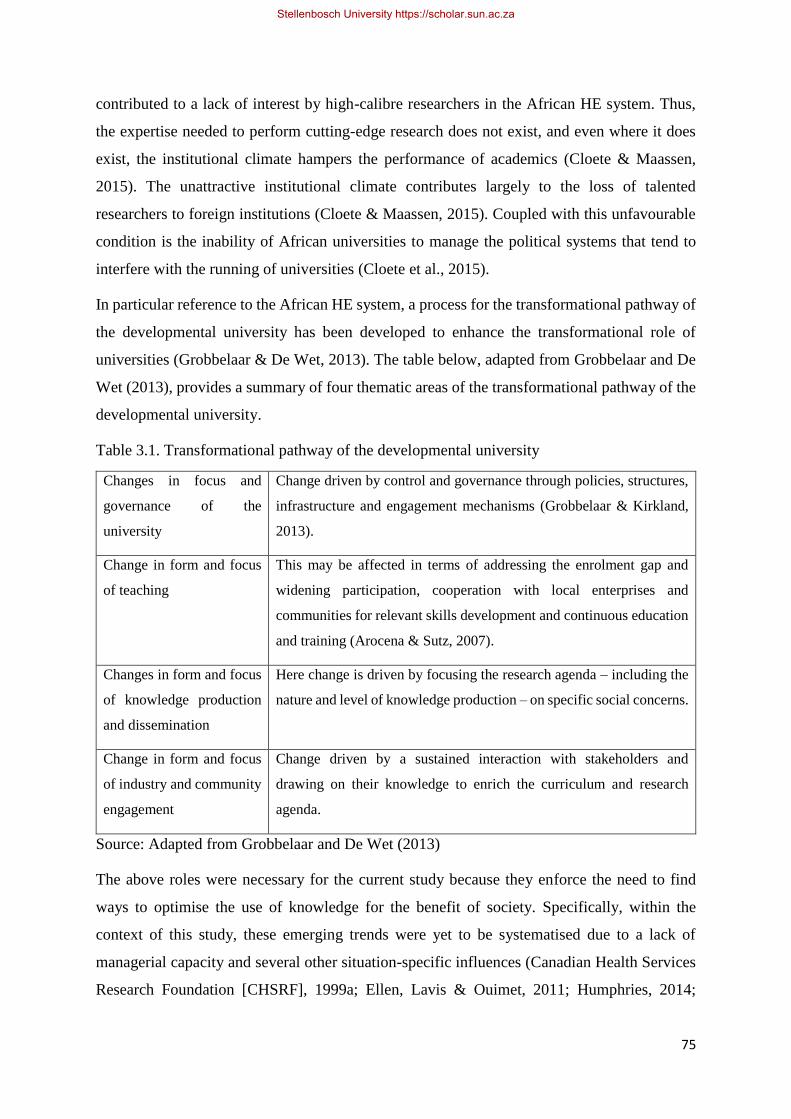
75
contributed to a lack of interest by high-calibre researchers in the African HE system. Thus,
the expertise needed to perform cutting-edge research does not exist, and even where it does
exist, the institutional climate hampers the performance of academics (Cloete & Maassen,
2015). The unattractive institutional climate contributes largely to the loss of talented
researchers to foreign institutions (Cloete & Maassen, 2015). Coupled with this unfavourable
condition is the inability of African universities to manage the political systems that tend to
interfere with the running of universities (Cloete et al., 2015).
In particular reference to the African HE system, a process for the transformational pathway of
the developmental university has been developed to enhance the transformational role of
universities (Grobbelaar & De Wet, 2013). The table below, adapted from Grobbelaar and De
Wet (2013), provides a summary of four thematic areas of the transformational pathway of the
developmental university.
Table 3.1. Transformational pathway of the developmental university
Changes in focus and
governance of the
university
Change driven by control and governance through policies, structures,
infrastructure and engagement mechanisms (Grobbelaar & Kirkland,
2013).
Change in form and focus
of teaching
This may be affected in terms of addressing the enrolment gap and
widening participation, cooperation with local enterprises and
communities for relevant skills development and continuous education
and training (Arocena & Sutz, 2007).
Changes in form and focus
of knowledge production
and dissemination
Here change is driven by focusing the research agenda – including the
nature and level of knowledge production – on specific social concerns.
Change in form and focus
of industry and community
engagement
Change driven by a sustained interaction with stakeholders and
drawing on their knowledge to enrich the curriculum and research
agenda.
Source: Adapted from Grobbelaar and De Wet (2013)
The above roles were necessary for the current study because they enforce the need to find
ways to optimise the use of knowledge for the benefit of society. Specifically, within the
context of this study, these emerging trends were yet to be systematised due to a lack of
managerial capacity and several other situation-specific influences (Canadian Health Services
Research Foundation [CHSRF], 1999a; Ellen, Lavis & Ouimet, 2011; Humphries, 2014;
Stellenbosch University https://scholar.sun.ac.za
76
Larsen, 1980; Oliver & Innvar, 2014). Closely related to the developmental university is the
emergence of the entrepreneurial paradigm, which seeks to enhance the role of the university
through entrepreneurship. Castells provides a range of objectives for the developmental
university, namely producing values and social legitimation, selection of the elite, training of
the labour force, production of scientific knowledge and providing degrees for the labour
market (Castells, 1994). Universities fulfil their roles through the different categories of
universities, namely ancillary, self-governing, as an instrument and as an engine of growth
(Castells, 2009). Another way by which universities could fulfil their roles is society is through
the entrepreneurial approach. The next sub-section discusses this entrepreneurial paradigm.
3.1.3 The entrepreneurial paradigm
This sub-section discusses the entrepreneurial university as a strategic means to KU. The
entrepreneurial paradigm, a conceptual framework on organisational level, has emerged as a
strategic approach to KU, thus enhancing the role of universities. Apart from emphasising the
role of universities in society, in considering a strategic framework for KU, universities may
consider the entrepreneurial approach to enhance their push, pull and exchange efforts towards
KU (Etzkowitz et al., 2000)
Over the centuries, there have been various paradigms in the university system, which have
engaged the minds of scholars. Authors such as Etzkowitz et al., (2000) have discussed issues
arising from the academic revolutions that have taken place over the centuries. Prominent
among these are the transition from teaching universities to research universities and from
research universities to entrepreneurial universities (Etzkowitz et al., 2000). This section
considers the transition from teaching universities to research universities, a range of currents
trends in HE, and then introduces the entrepreneurial university, which has implications for
various research utilisation strategies being adopted by universities in Africa.
Grobbelaar, (2013) argued that universities begun as teaching institutions, but with the first
academic revolution (Grobbelaar, 2013) it became necessary to incorporate research into the
mission of the university (Grobbelaar, 2013). The classification of universities into three
categories, namely teaching universities, research universities and technical or professional
universities is with the view to fulfilling their mandates not only through production of
knowledge but also through technological innovations. Etzkowitz et al. (2000) explain the
emergence of the entrepreneurial university as a response to the increasing importance of
knowledge in national and regional innovation systems, and the recognition that the university
is a cost-effective and creative inventor and transfer agent of both knowledge and technology
Stellenbosch University https://scholar.sun.ac.za
77
(Etzkowitz et al., 2000). According to Etzkowitz (2004), the third mission of the university i.e.
economic and social development, has been added to the traditional role of teaching and
research since the second half of the 20th century. This confirms the assertion that, within the
context of broader economic transformation, universities have become economic and social
institutions (Florida, 1999). They are now seen as innovation hubs and ‘knowledge factories’
(Florida, 1999) with a potential to generating wealth due to their entrepreneurial nature (Gibb,
Haskins & Robertson, 2009).
According to Etzkowitz (2004), this shift became necessary because of a need to preserve
knowledge and conduct further research on existing knowledge. The philosophical and
ideological underpinnings implied that the introduction of research into the university system
raised issues relating to time needed to do research and at which levels. It was thought that
academics or professors devoted much of their time to research at the expense of teaching
(Etzkowitz et al., 2000). In order to make time for their core business, graduate students were
used for most research to allow the professors adequate time for teaching. As a result, more
emphasis was placed on postgraduate studies leading to less emphasis on undergraduate
teaching (Etzkowitz et al., 2000). This seeming error of over-emphasis on postgraduate studies
has since been addressed to bring a balance between postgraduate and undergraduate studies
(Etzkowitz et al., 2000).
By a systematic approach using the input–process–output–outcomes model (IPOO model),
Salamzadeh, Salamzadeh and Daraei (2011) explain that the entrepreneurial university is a –
[A] dynamic system, which includes inputs (Resources, Culture, Rules and Regulations,
Structure, Mission, Entrepreneurial Capabilities, and Expectations of Society, industry,
government and market), process (Teaching, Research, Managerial Processes, Logistical
Processes, Commercialisation, Selection, Funding and Financial Processes, Networking,
Multilateral Interaction, and Innovation, research and development activities), outputs
(Entrepreneurial human resources, Effective researches in line with the market needs,
Innovations and Inventions, Entrepreneurial networks, and Entrepreneurial Centres) and
aims to mobilise all its resources, abilities and capabilities in order to fulfil its ‘Third
Mission’ (Salamzadeh et al., 2011).
This approach to KU requires that universities plan and follow specific strategic pathways in
order to achieve the goals set out in their research policies, including the commercialisation of
results (Gibbons, 2013).
Stellenbosch University https://scholar.sun.ac.za
78
In an entrepreneurial university, research groups become business-oriented, leading to the
creation of liaison offices, technology transfer offices, business incubators in order for research
results to be transferred through various organisational structures to the stage of
commercialisation (Etzkowitz et al., 2000). The introduction of entrepreneurship into the
academic scene affects the educational and research missions of all institutions of higher
learning to a greater or lesser degree (Etzkowitz et al., 2000). It has become a strategic issue, a
source of funding for university research and a policy tool for economic development (Geuna
& Muscio, 2009). Knowledge transfer is enhanced through university–industry relationships
(Geuna & Muscio, 2009). It is reported among university scientists that interacting with
industry brings about better basic research, and gives opportunity for a different perspective,
which could sometimes be an inspiration for innovative research (Geuna & Muscio, 2009;
Siegel, Waldman, Atwater & Link, 2003). To determine the importance of this argument,
respondents to the survey used in the current study needed to provide feedback on the benefits
of engagement with various stakeholders, including industry.
Many universities in developed countries have plans to engage industry in their research,
innovation, technology transfer and dissemination efforts (Gibb & Hannon, 2006; Mowery,
Nelson, Sampat & Ziedonis, 2004). With an improved university–industry relationship, it is
believed that KU will be enhanced as well as improvement in the quality of knowledge
produced (Gibb & Hannon, 2006). The emergence of the ‘entrepreneurial university’ is aimed
at fostering university–industry relationships (Etzkowitz et al., 2000) with the likelihood of the
products of research being utilised more often. This study therefore examined the extent to
which researchers at KNUST engage with stakeholders, including industry, and the effect of
those engagements on research output and utilisation. The way these various stakeholders
interact with researchers also has implications on the extent to which research can be used. The
next sub-section discusses evolving interaction processes needed for the enhancement of
research use.
3.1.4 The triple helix, quadruple helix and quintuple helix
The ‘triple-helix’ refers to a highly interactive process of engagement between university,
industry and government that could lead to successful innovations (Etzkowitz et al., 2000).
According to the triple-helix model (Etxkowitz et al., 2000), the relationship between
universities, industry and government becomes increasingly intertwined, creating activities of
collaboration where the different rationalities of university, industry and government are
Stellenbosch University https://scholar.sun.ac.za
79
bridged and merged (Gjerding, Wilderom, Cameron, Taylor & Scheunert, 2006). These
relationships have led to the enhanced use of research (Gjerding et al.,2006).
There is a paradigm, which seeks to bring together institutional bodies, researchers, businesses
or entrepreneurs and citizens in order to derive greater economic impact. This paradigm is
based on the quadruple helix (Carayannis & Campbell, 2010) where government, industry,
academia and civil participants team up to bring about economic and social development,
which surpasses what they could hitherto have done individually (European Union [EU],
2015). By employing the principle of shared expertise, the participants are able to network,
collaborate and corporate among themselves. There is thus cross-fertilisation of ideas with a
better outcome. The quadruple helix blends in the perspective of a media-based and culture-
based public (Carayannis & Campbell, 2010).
Another emerging paradigm, which seeks to frame knowledge and innovation in the context of
the natural environment for sustainable development and social ecology, is the quintuple helix
(Carayannis & Campbell, 2010). It builds upon the quadruple helix by bringing in the
dimension of the natural environment (Carayannis & Campbell, 2010). These paradigms
although proposed and applied in developed contexts have the potential of being
conceptualised for the African context.
Research institutions, with a focus on impact, could strengthen their relationships with industry
and governments in order to ensure that research is not only produced but also used. The
criticism is that in an environment of low industrial capacity, universities are unable to foster
a good relationship that will inure to the benefit of both parties (Gjerding et al., 2006). Indeed,
Ghana does not have a strong industrial base for this kind of relationship. KNUST has had
some level of collaboration with government and industry but this relationship was not
developed fully to the level of being expressed by the helixes (QAPU, 2017).
Elsewhere in Europe and America, it can be said that there is increased reliance on knowledge
giving universities opportunities to transfer knowledge into productive and economic ventures
(Geuna & Muscio, 2009). To engage in commercialising research, is to make the issue of
research uptake and KU an integral part of the university’s internal organisational system. It is
advised that universities making such efforts should not feel that they are deviating from their
core mandates by entering into commercial ventures (Guena & Muscio, 2009). It is argued that
the products of knowledge or creative innovative products have commercial value and that they
have become intellectual property of the university (Marlin-Bennett, 2004). Considering
Stellenbosch University https://scholar.sun.ac.za
80
constraints on resources, research commercialisation is one means of generating income for
further research, infrastructural development and administrative support.
3.1.6 Conclusion of this sub-section
In concluding this section, we find that there is growing expectation of universities to play
meaningful roles in society. It is trusted that they will fulfil the mandate for which they have
been set up. It has been suggested that universities could achieve their mission by focusing on
their developmental role and learning from recent paradigms by becoming entrepreneurial. The
entrepreneurial science paradigm, although yet to take root within sub-Saharan Africa and for
that matter KNUST, holds some prospects worth considering. KNUST can weigh its options
to see which paradigm is more applicable to follow as pathway to fulfil its mission. The
introduction of entrepreneurship into university systems has been tried elsewhere and has
proved worthwhile. Whether or not one chooses to be developmental or entrepreneurial, the
caution is that universities must be careful not to focus too much on economic gains to the
detriment of their core mandate of teaching, research and community service. This
notwithstanding, learning from best practice is worth pursuing despite possible challenges.
3.2. Pathways to research uptake
The frameworks discussed in section 2.5 provided some key focus areas needed to form the
basis for a structural plan and guide for our strategic RU framework. These are a means to an
end, which require that the university employs certain strategies in order to achieve its goal. In
addition to these, there are a series of events necessary for the university to achieve its
developmental role in society. The role of the university in national development is discussed
in chapter 6. The following sub-sections however, discuss some pathways necessary for
research use. In addition, some statements of good practice that could enhance the use of
research are outlined.
3.2.1 Pathways to the developmental role of the university
In order to achieve their developmental role, universities use research for societal impact
through community engagement (Carden, 2009). Research is targeted at improving the quality
of life of immediate communities and society in general. Various mechanisms are employed
by universities to achieve their aim of societal influence (Carden, 2009). These roles of
universities in society cannot be achieved fully without adopting the appropriate pathways and
frameworks. This sub-section discusses some pathways to research utilisation that can be
identified in the literature. In discussing pathways to KU, we are specifically looking at the
Stellenbosch University https://scholar.sun.ac.za
81
series of events by which research can contribute to policy, socioeconomic development and
human endeavours in general. Carden (2009) identified three key areas by which research can
contribute specifically to policy. He therefore proposes the following steps:
• encouraging open inquiry and debate;
• empowering people with the knowledge to hold governments accountable; and
• enlarging the array of policy options and solutions available to the policy process.
According to Gibb et al. (2009), the universal approach to KU has been through knowledge
transfer institutions and pathways. such as:
• the creation of science and technology parks adjacent to and sometimes owned by
universities;
• the development of the role of intermediaries, such as industrial liaison offices (Gibb et
al., 2009);
• the opening of technology transfer and information offices (Chapple, Lockett, Siegel &
Wright, 2005);
• the development of student and staff incubators (Ylinenpää, 2001);
• the launching of new venture programmes for staff and students;
• the development of clearer intellectual property (IP) policies and arrangements for
licensing and patenting university know-how (Baldini, Grimaldi & Sobrero, 2006);
• the organisation of spin-off activities, such as small firms or companies and
entrepreneurs and
• the creation of venture and loan funds.
Hitherto, these were foreign to the African context but now we see traces of the same within
the sub-Saharan African region. It is argued, however, that evidence has proved that this is not
enough, and that the key to successful knowledge transfer is a process of continuous dialogue,
building up social networks (Nicolaou & Birley, 2003), development of strong personal as
opposed to institutional relationships over time leading to the creation of trust.
Two approaches have been identified from the literature with regard to identification of
pathways for KU. The first approach, referred to as the ‘connection approach’ ( Mitton et al.,
2007:734) seeks to promote KU by focusing on intermediary institutions who take knowledge
out to enhance policy and practice (Mitton et al., 2007). Vingilis, Hartford and Schrecker
(2003) and Mitton et al. (2007) refer to people who help potential knowledge users determine
their knowledge needs and help researchers translate, influence and initiate KTE as
Stellenbosch University https://scholar.sun.ac.za
82
‘connectors’. These intermediaries, also referred to as knowledge brokers, boundary-spanners,
gatekeepers or translators are trained in information management and exchange (Mitton et al.,
2007; Vingilis et al., 2003). Intermediaries are lobbyists, think tanks, advisory boards,
platforms, associations, research institutes, the media and university departments among others
(Mitton et al., 2007). These knowledge brokers function as channels or conductors by
transferring knowledge and insights to decision-makers or practitioners and rechannelling the
needs of decision-makers to researchers. They have contact with both researchers and users of
knowledge and have the ability to build bridges, thus enhancing the interaction between them.
This approach aims at connecting research to policy issues by active flow of information before
the decision-making and implementation phase. Clearly, this approach ties in directly with the
interactive frameworks discussed in the earlier sections (see sections 2.2.7, 2.2.8 and 2.2.9),
where emphasis was placed on active engagement and interaction with possible users of
knowledge.
The second approach, referred to as ‘collaboration approach’ (see Mitton et al., 2007:735),
similarly involves active interaction and interpersonal contacts between researchers,
policymakers and practitioners with the aim of producing knowledge that is relevant to all
parties (Thompson, Estabrooks & Degner, 2006). Gibbons (2013) argues that users or potential
beneficiaries of research may also hold relevant knowledge, and so need to be involved in the
innovation process from the outset (Gibbons, 2013). There is evidence to support the fact that
when academic researchers and policymakers interact closely in the formulation and execution
of research projects, the likelihood of influence on policy is high (Cherney et al., 2012;
Cordingley, 2008; Cousins & Simon, 1996; Huberman, 1990; Nutley, Walter & Davies, 2007).
However, collaboration alone is not sufficient for uptake and use of research due to the
influence of a range of variables (Landry et al., 2001). Despite those influences, in the field of
KU, the collaborative approach is seen as the most flexible. There is dynamism in the
relationship between all stakeholders. Each party leaves behind its individual boundaries in
order to establish new ones (Cherney et al., 2012). The limitation to this approach, it is argued
(Cherney et al., 2012)., is that the need for relevant knowledge could be based on other factors
and not necessarily on experience.
These pathways are necessary in tracking the developmental role of the university and in the
development of frameworks and strategies for KU. How research is used to influence society
needs to be an integral part of any RU strategy. We noted that many of these series of events
were largely applicable in foreign contexts but they still hold some key principles, which may
Stellenbosch University https://scholar.sun.ac.za
83
be applicable in the African context. Since the overarching aim of this current study was to
develop a strategic framework for research utilisation it was needful to identify the most
appropriate pathways necessary for the formulation of a framework that is of relevance to
KNUST. We endeavoured to sift out and determine which pathways for KU existed in our
context and were applicable in the context of the study. The next section looks at some
strategies, which have originated within some universities in sub-Saharan African as a result
of the DRUSSA programme.
3.2.2 DRUSSA statements of good practice
As part of a strategic approach to research utilisation, DRUSSA outlined a number of strategic
statements. These ‘Statements of Good Practice’ (DRUSSA, 2012) are meant for participating
universities to consider in the design of their research strategies, especially in the area of
capacity building. The statements take into consideration the climate for RU and the
institutional research context within 24 sub-Saharan African universities. The statements as
outlined below provide support for research utilisation on the institutional level (DRUSSA,
2012:62).
3.2.2.1 Strategy and mission
The statements for strategy and mission are as follows:
• The overall mission and strategy of the university must reflect the need to produce
research findings for stakeholders within and outside the university community.
• The university must have a clear research strategy, which recognises the importance of
research for social, economic and development needs.
• The university’s research strategy must explicitly recognise the need to support RU
activity.
• There should be in place a high-level committee to monitor research strategy at regular
intervals.
• Progress towards research strategy, including RU, should be coordinated by a senior
university official (at the level of pro-vice-chancellor).
• Research strategy (including RU) must be actively communicated to staff.
• There is the need for a distinct policy document bringing together different strands of
RU support and policy, which could be involved in the process.
• Clear policies should exist for the ownership and management of intellectual property
and publications generated by university staff.
Stellenbosch University https://scholar.sun.ac.za

84
• Policies must be in place to ensure that ethical issues in RU are covered, including any
conflict of interest for university staff.
• The institution should collect sufficient information on RU activity to inform future
policy.
• Research strategy and RU policy documents must be in place and taken into account in
allocating internal resources.
3.2.2.2 Staffing for research uptake
The statements of good practice in terms of staffing for RU are as follows:
• RU and related activities must be clearly included in the job descriptions of academic
staff at the university.
• Clearly designated professional staff in the university should have the responsibility for
promoting RU amongst staff.
• Staff with responsibility for RU must have access to designated budgets.
• Staff with responsibility for RU should report at a senior level in the university.
• Staff with RU responsibility must be at a sufficiently senior level to communicate
effectively with academic staff.
• Where professional staff with RU responsibilities are based in different offices, clear
mechanisms should exist for them to meet with each other.
• Each college must have at least one person with professional expertise in research
management.
3.2.2.3 Internal organisation and promotion of research uptake
The statements of good practice for the above are as follows;
• The university should have a mechanism in place to identify research with uptake
potential at an early stage.
• The university should maintain an active database of research activities and the research
specialisations of academic staff.
• Academic staff must have access to training in RU issues.
• RU should be included in relevant staff induction or postgraduate training programmes.
• Mechanisms should be in place to ensure that academic staff have time to engage in RU
where appropriate.
• Clear processes must exist for decisions to be taken about the level of support available
for RU in specific cases.
Stellenbosch University https://scholar.sun.ac.za
85
• Clear processes must exist to determine where responsibility lies for RU, between the
academic/research team, the university and any external sponsor.
• Clear processes must exist for determining the nature of research activity in specific
cases (for example, the possibility of commercial protection through patents) and the
extent to which such decisions are delegated to academic staff.
• Clear and accessible budgets must be made available for RU activity.
• Academic staff must have appropriate incentives to engage in RU activity.
• Activity on RU should be included in criteria for the promotion and re-grading of
academic staff (this will mean redefining what constitutes service to community).
• Central mechanisms must exist to record successful RU activity, and to learn from the
lessons of previous projects.
• Where professional support is available for RU activity, these services must be actively
publicised to staff.
3.2.3 Conclusion of this section
In concluding this discussion on pathways to research utilisation we need to emphasise the
point that while it is worth considering the existing relationships and interactions within the
institutional set-up, teaching, knowledge production and dissemination, the barriers and
facilitators to KU, it is essential to define and identify context-relevant pathways to research
utilisation. It was trusted that this study could define, from its survey, the most suitable and
context-relevant pathways. Doing so will make it necessary to consider the systemic and
institutional barriers and facilitators that could influence the effectiveness of the framework.
The next section considers barriers and facilitators to research utilisation.
3.3 Barriers and facilitators to research utilisation
Barriers and facilitators to research utilisation have been identified mostly in higher education
in general, the agricultural sector, and healthcare system among others. These have
implications to the type of framework and strategy necessary for research utilisation at both
project and organisational level. This section discusses the most prominent barriers and
facilitators identified in the literature within specific contexts and their implications for
research utilisation.
Stellenbosch University https://scholar.sun.ac.za
86
3.3.1 Barriers to research uptake
Humphries (2014) conducted a study to identify potential barriers and facilitators experienced
by managers to the use of evidence in programme management within the healthcare system.
Five categories of barriers and facilitators identified from the literature are as follows:
• Information (related barriers include research without relevance or clarity,
misunderstanding and wrong perceptions of research, limited access to research
information or availability, and timely delivery of research) (Humphries, 2014; Oliver,
Innvar, Lorenc, Woodman and Thomas, 2014).
• Organisational structure and process (related barriers include a lack of resources to
support research and cost, a lack of human resource capacity, financial constraints, a
lack of data, inadequate and sometimes an absence of planning processes, a lack of
support from management, and poor communication) (Humphries, 2014; Oliver et al.,
2014; Sedlacko, Pisano, Berger & Lepuschitz, 2013).
• Organisational culture (related barriers include decision-making culture, crises
management culture, resistance to change, political influence on decisions)
(Humphries, 2014; Sedlacko et al., 2013).
• Individual (barriers identified include inadequate skills and experience of policymakers
in research literacy, and a lack of formal training in research management) (Humphries,
2014; Oliver et al., 2014).
• Interaction (barriers identified relate to interactions between decision-makers and
researchers, and the gap between them due to a lack of contact and mutual
understanding) (Humphries, 2014).
These barriers, related to the use of evidence in health sector management, have far-reaching
consequences in the broader sense across many policy areas. As clearly outlined, some of these
barriers occur at project level while others cover organisational levels.
According to Ellen et al. (2011), a common challenge or barrier in terms of knowledge
translation that all decision-makers face, relates to a lack of knowledge management skills and
infrastructure (i.e. the sheer volume of research evidence currently produced; access to research
evidence; time to read evidence sources; and skills to appraise, understand and apply research
evidence). This is corroborated by Grimshaw and Eccles (2012). These authors argue further
that better knowledge management is necessary but perhaps not sufficient to ensure knowledge
Stellenbosch University https://scholar.sun.ac.za
87
translation given other challenges that may operate at different levels (Grimshaw & Eccles,
2012). The challenges to knowledge translation include a lack of facilities; financial
disincentives; inappropriate knowledge, skills and attitudes; poor oversight of research
applicability; declining, non-existent, and unreliable sources of research funds; weak policy
designs; absence of M&E procedures and administrative and management shortfalls (Carden,
2009; CHSRF, 1999a; 1999b; Grimshaw & Eccles, 2012; Mitton et al., 2007).
The CHSRF (1999a), Carden (2009) and Mitton et al. (2007) have re-enforced the above
arguments when they asserted that KU challenges arise in situations where –
• policy designs are weak;
• there is a lack of knowledge in the research process;
• in appropriate academic format of communication;
• research is not relevant to practice-based issues;
• there is a lack of timely results; and
• there is inadequate administrative, legal or management capacity in execution and an
absence of monitoring and accountability procedures.
Other factors contributing to the implementation challenges are a lack of confidence in
researchers by policymakers, a lack of hard data to support policy, a lack of demand for
research, and also a lack of skills or limited competencies (Hemsley-Brown & Oplatka, 2005),
the capacity to use knowledge, and resistance of practitioners to adopt new knowledge (Kirst,
2000), among others.
Hemsley-Brown and Oplatka (2005) as well as Becheikh et al. (2010) suggest, one of the key
barriers to the non-use of research findings is that findings are not applicable to the users.
Hemsley-Brown and Oplatka (2005) also support the idea that transferred knowledge should
be relevant, credible, interesting, timely and applicable to the context for which it is intended
in terms of values, practices and needs. The time allowed for knowledge transfer activities is
seen by some authors as a critical factor in the success of the transfer (Becheikh et al., 2010).
It has been proved that a lack of time for linkage agents to read, understand, adapt and
disseminate results is one of the factors hindering the KU process. In a study conducted by
Koivula, Tarkka and Simonen (2011), aimed at describing how nursing teachers utilise research
on nursing education and its connections to teachers’ background, further education and
research activity variables, it was found that effective use of technology, education level,
Stellenbosch University https://scholar.sun.ac.za
88
adequate access and time for information exploring and difficulties in understanding statistical
analysis were among the barriers to research utilisation (Koivula et al., 2011).
From the field of EBM, methodological barriers have been identified with implications for the
implementation of science efforts. Two of these barriers have been identified as being a lack
of agreement regarding constructs hypothesised to affect implementation success, and
identifiable measures of these constructs (Chaudoir, Dugan & Barr, 2013). A systematic review
to identify measures designed to assess constructs representing a five-factor framework
affecting the implementation of evidence-based innovations has been conducted (see Chaudoir
et al., 2013). The framework by Chaudoir et al. (2013) suggests five broad types of factors
representing structural-, organisational-, provider-, patient- and innovation-level
characteristics.
• Structural: constructs that assess aspects of the larger socio-cultural context or
community in which the specific organisation is nested (e.g. political norms, policies,
relative resources/socioeconomic status).
• Organisational: constructs that assess aspects of the organisation(s) in which the
innovation is being implemented (e.g. culture, norms, organisational endorsement).
• Provider: constructs that assess aspects of the individual provider who will be
implementing the innovation (e.g. attitudes, self-efficacy, experience).
• Patient: constructs that assess aspects of the individual patient(s) who will receive the
innovation directly or indirectly (e.g. perceived utility, feasibility of innovation).
• Innovation: constructs that assess aspects of the innovation that will be implemented
(e.g. adaptability, quality of evidence).
The search by Chaudoir et al. (2013) identified 33 scales that assess one or more of these
factors. Organisational-, provider- and innovation-level characteristics have the largest
numbers of measures available for use, whereas structural- and patient-level characteristics
have the least (Chaudoir et al., 2013). The onus is then on researchers to select the most reliable
predictors of implementation outcomes. Critically, it is suggested that there is a need to increase
capacity of researchers to conceptualise and measure constructs that could influence
dissemination and implementation outcomes.
Other significant concerns that need attention, according to Sumner, Crichton, Theobald, Zulu
and Parkhurst (2011), are that research is too theoretical and that researchers easily assume that
users will buy into their findings once the results are ready
Stellenbosch University https://scholar.sun.ac.za

89
In this case, there will be no agreement and acceptance, and the research could face an outright
rejection (Summer et al., 2011). There should be a departure from theory with more emphasis
on developmental and applied research that is appealing to stakeholders (Summer et al., 2011).
Concluding on this aspect, we notice that at institutional level, barriers exist because
organisations are heterogeneous, non-hierarchical and dynamic (Auranen, 2005; Gibbons,
Limoges, Nowotny, Schwatzmann, Scott & Trow, 1994; Nieminen, 2005); hence, their
influence on the KU process. The organisational climate and setup affect the pathways to KU
and subsequently the framework. Bowen and Zwi (2005) as well as Greer (1997) recommend
a system of KU, which helps to understand –
• how individuals in an organisation receive, adopt and adapt evidence;
• the factors of the organisation that constrain or facilitate the adoption or implementation
of the evidence; and
• the interests and values at play within organisations that influence responses to the
evidence/policy issue (Bowen & Zwi, 2005; Greer, 1977).
The above barriers notwithstanding, there are activities that facilitate the use of research.
The next sub-section discusses some of these facilitators to research utilisation.
3.3.2 Facilitators to research utilisation
In their systematic review, Oliver, Innvar, Lorenc, Woodman and Thomas (2014) provide
direct antidotes to the above barriers in terms of facilitators to RU. Key among the facilitators
are:
• making research accessible and available with improved dissemination (Oliver et al.,
2014);
• enhancing joint or collaborative research (Oliver et al., 2014; Sedlacko et al., 2013);
• providing reliable and relevant research findings with clarity (Oliver et al., 2014);
• building a strong relationship between researchers and policymakers (Oliver et al.,
2014);
• providing managerial support and capacity (Oliver et al., 2014); and
• making material and financial resources available to support RU activities (Oliver et
al., 2014).
Participation in research by all stakeholders adds relevance to the research and creates
ownership and better appreciation of the research outcome with a greater likelihood of
utilisation. Post-normal science encourages public participation in the sense that stakeholders
Stellenbosch University https://scholar.sun.ac.za
90
are engaged in the decision-making process or in the quality assessment of scientific knowledge
production (Hessels & Van Lente, 2008).
A series of interactive processes have been identified to facilitate knowledge production and
utilisation. One such process is to put knowledge production into context. Policymakers and
users of knowledge are to be made active participants in determining which kind of knowledge
is needed and suitable. Researchers should not shy away from actively engaging decision-
makers, politicians and the policy community (Carden, 2009). The process endorses the use of
dialogue, contacts and interaction between the two communities to derive knowledge that fits
into the context of the world of policy and practice. Porter and Hicks (1995) argue that this
interaction takes science to the public domain and makes the product of science more
meaningful and usable to stakeholders. The gap between knowledge creation and knowledge
use may be reduced significantly if an active relationship between researchers and practitioners
is encouraged and promoted.
Shaxton (2013) describes three products of research that in themselves could facilitate use.
• The first is: whether it is theoretical, policy-focused or based on policy implementation.
• The second is whether the topic is currently necessary for policy issues.
• The third is whether the research is well set in the institutional context and whether
there is a coherent group of people and processes that will be able to take up the results
and use them (Shaxton, 2013).
Carden (2009) argues that developmental research is more likely to find use and action if the
intent to influence is expressly included in the objectives. By ‘intent’, Carden is referring to
the method used, which includes vocabulary, how the results will be reported, and the intended
policy arena. Carden further argues that, creating a network of researchers with a shared
purpose, could help address some of the common challenges, because these networks can assist
each other through pooling resources, sharing experiences and discoveries in order to increase
the chances of utilisation. Researchers have to cultivate extensive relationships despite the
bureaucracies to broaden their network (Carden, 2009). Researchers must train themselves to
simplify complex research into a form that the ordinary person can understand (e.g. using lay
language) to attract the attention of decision-makers (Carden, 2009). There is value in
establishing good relationships between knowledge producers and policymakers based on trust
and confidence in order to speed up the movement of research into the policy domain (Carden,
2009).
Stellenbosch University https://scholar.sun.ac.za
91
There is furthermore a dynamic interaction between knowledge and policy where the
possibility of political influence on research exists (Carden, 2009). Research can shape the
political environment by generating interesting solutions to policy problems in which case there
is a win-win situation once the research is utilised (Liverani, Hawkins and. Parkhurst (2013).
Researchers derive more advantage when policymakers who have authority to influence change
see the need for new knowledge, in which case utilisation is given priority (Liverani et al.,
2013) (Liverani et al., 2013). The researcher is accorded the due audience, trust and respect,
provided the results are coherent and contextually appropriate (Liverani et al., 2013).
Credibility issues have also been raised regarding the type of research and who is best fit to
transfer research knowledge (Liverani et al., 2013). Stakeholders and beneficiaries of research
have the right to question the types of knowledge being transferred and by whom (Oliver et al.,
2014). Researchers therefore need to build credibility over time to enhance knowledge
translation (Oliver et al., 2014). Knowledge translation should be carefully planned in such a
way that the issues of credibility and trust are addressed. These issues may not be completely
eliminated by the design and implementation process but could be minimised (Oliver et al.,
2014). Views have been expressed to the effect that design and implementation can never fully
anticipate all contingencies (Carden, 2009), implying that, despite efforts to address the issues
raised at the design stage, one can still expect to have some challenges (Oliver et al., 2014).
Shaxton (2013) outlines related facilitators to KU in the area of policy as follows:
• research must be geared towards decision-making and should be policy-based, focused
and directed;
• users of research must show interest and willingness to adapt change;
• researchers and policymakers should not live in separate worlds but should have
connections and must collaborate;
• the quality of research and users’ expectations must be considered; and
• the research must be set within the institutional context.
Management skills are needed to improve understanding and utilisation of knowledge by
creating awareness of the existence of research knowledge and to close the existing gap
between researchers and users of knowledge by fostering a better atmosphere for cooperation
(Oliver et al., 2014). The management system must meet the requirements of both internal and
external stakeholders. Internal stakeholders include researchers, research teams and
Stellenbosch University https://scholar.sun.ac.za
92
management within the institution. External stakeholders include funders and beneficiaries of
research.
Andrews (2012) outlines processes that facilitate KU ranging from engagement to provision of
information, encouraging practices such as participatory research methodologies, tailored
workshops for targeted stakeholder groups, media releases and websites. He argues that
barriers related to lack of trust in the research outcome may be minimised if these processes
are applied (Andrews, 2012).
The effectiveness of knowledge transfer and utilisation is determined by factors such as the
accessibility of research findings. Research information must be easily accessible (both
physically and intellectually) to practitioners to enable its use. Accessibility is a major is
therefore a necessary ingredient for research use. An effective RU management (RUM) system
must ensure that research findings are accessible by communicating and disseminating
knowledge through appropriate means to users. In addition to making knowledge accessible, it
must be packaged in a form that is easy to understand by the user. It should be appropriate,
simple and precise and captured in clear language with examples that are familiar to the user
(Becheikh et al., 2010; Kilgore & Pendleton, 1993; Kirst, 2000).
Peter Weingart, (2013) argues that universities need autonomy to operate effectively in the
education market place. This can be possible if political interference in the operations of the
university and its KU process is avoided or limited as much as possible (Weingart, 2013). The
fundamental principle is that the best people to decide on the operations of a university and its
strategies are those responsible for its success (Weingart, 2013). He believes that universities
should be free to decide on their policies, design pathways and frameworks for research
utilisation, manage budget and strategies. However, with freedom comes responsibilities
(Weingart, 2013). Government support is needful but university management should be held
accountable for use of public funds and adherence to set performance metrics (Weingart, 2013).
The question is whether universities are prepared for complete autonomy and ready to shoulder
the huge financial challenge that comes with university governance Weingart, 2013).
Some of these barriers and facilitators identified mainly outside the African context, hold
relevant implications within the context of the current study. The question is whether we are
aware of their existence and which efforts and measures can be put in place to address them.
The current study attempted to uncover the level of awareness of the existence of barriers and
facilitators to research utilisation among academic and research staff of KNUST. This had to
Stellenbosch University https://scholar.sun.ac.za
93
help in the design of the most appropriate strategic framework for research utilisation at the
institutional level.
Finally, any conceptual framework for research utilisation must be contextualised taking into
consideration indigenous knowledge, practices and experiences in order to make it more
acceptable. As observed by Okolie (2003:235),
Development policies and programs in Africa have been shaped by knowledge and
knowledge production that is primarily Euro-American centered, and as a result tends to
be exclusionary and often contemptuous of other knowledge and ways of knowing,
including the lived experiences of the targets of development.
The consequence, Okolie (2003) argues, is that local communities that are expected to benefit
from such policies and programmes fail to derive the needed benefit leading to negative effects.
Involving the local people in the generation of knowledge and tapping into their experiences
are more likely to lead to acceptance of interventions (Okolie, 2003). It is therefore, imperative
that in order for research to be acceptable and applicable, stakeholder involvement in the entire
research cycle is necessary for acceptance.
Table 3.2 below provides a summary of the barriers and facilitators to RU as outlined by
Andrews (2012), Carden (2009), Humphries (2014), Oliver et al. (2014), Sedlacko et al. (2013)
and Shaxton (2013.
Stellenbosch University https://scholar.sun.ac.za

94
Table 3.2: Barriers and facilitators to research utilisation
PROCESS BARRIERS TO RU FACILITATORS TO RU
INFORMATION-
RELATED
Research without relevance/clarity,
misunderstanding and wrong perceptions
of research, limited access to research
information, non-availability, and timely
delivery of research
Making research available,
providing reliable and relevant
research findings, quality of
research must meet users’
expectations
ORGANISATIONAL
STRUCTURE AND
PROCESS-
RELATED
A lack of resources to support research
and cost, a lack of human resource
capacity, financial constraints, a lack of
data, inadequate and sometimes an
absence of planning processes, a lack of
support from management, and poor
communication
Research must be policy-based,
provision of managerial
support and capacity, making
material and financial
resources available, websites,
media releases
ORGANISATIONAL
CULTURE
Decision-making culture, crisis
management culture, resistance to
change, political influence on decisions
Research must be set within
institutional context
INDIVIDUAL Inadequate skills and experience of
policymakers in research literacy, and a
lack of formal training in research
management
Users of research must show
interest, tailored workshops
INTERACTION Interactions between decision-makers
and researchers, and a gap between them
due to a lack of contact and mutual
understanding
Enhancing joint collaboration;
researchers and policymakers
must connect and collaborate
Building a strong relationship
between researchers and
policymakers
Source: Compiled from Andrews (2012), Carden (2009), Humphries (2014), Oliver et al.
(2014), Sedlacko et al. (2013) and Shaxton (2013)
3.4 Strategies for research utilisation
This section discusses various strategies that may be adopted in the quest to ensure research
utilisation. This is against the backdrop of the barriers and facilitators identified in the previous
section, and the DRUSSA Statements of Good Practice. The discussion focuses mainly on
organisational-level strategies for research utilisation.
3.4.1 Research uptake strategies at institutional level
This section is intended to cite a few examples of institutional-level strategies for RU. Jenkins
and Healey (2005) outlined some institutional-level strategies expected to enhance the use of
research. The proposed strategies cover four broad areas, namely:
• developing institutional awareness and institutional mission;
• developing research policies and strategies;
• developing pedagogy and curricula; and
Stellenbosch University https://scholar.sun.ac.za
95
• developing staff and university structures (Jenkins & Healey, 2005).
Table 3.3 provides a summary of what may constitute an institutional-level strategy for RU and
RUM. The concept was developed from Jenkins and Healey (2005) institutional strategies to
link teaching and research. Jenkins and Healey (2005) focus on the teaching–research nexus
and provides an analytical framework to bring teaching and research together (Jenkins &
Healey, 2005). The adaptation of the framework is with the view to incorporate some of the
ideas to enhance the research–RU or utilisation interconnection. One can observe common
strands between the research–research utilisation and the teaching–research nexus proposed by
Jenkins and Healey (2005) as they focus on policy, planning, dissemination and M&E (Jenkins
& Healey, 2005). These ideas may be adapted and contextualised to make them more
applicable to our particular system. Table 3.3 below summarises the strategies for RU as
proposed by Jenkins and Healey (2005).
Stellenbosch University https://scholar.sun.ac.za
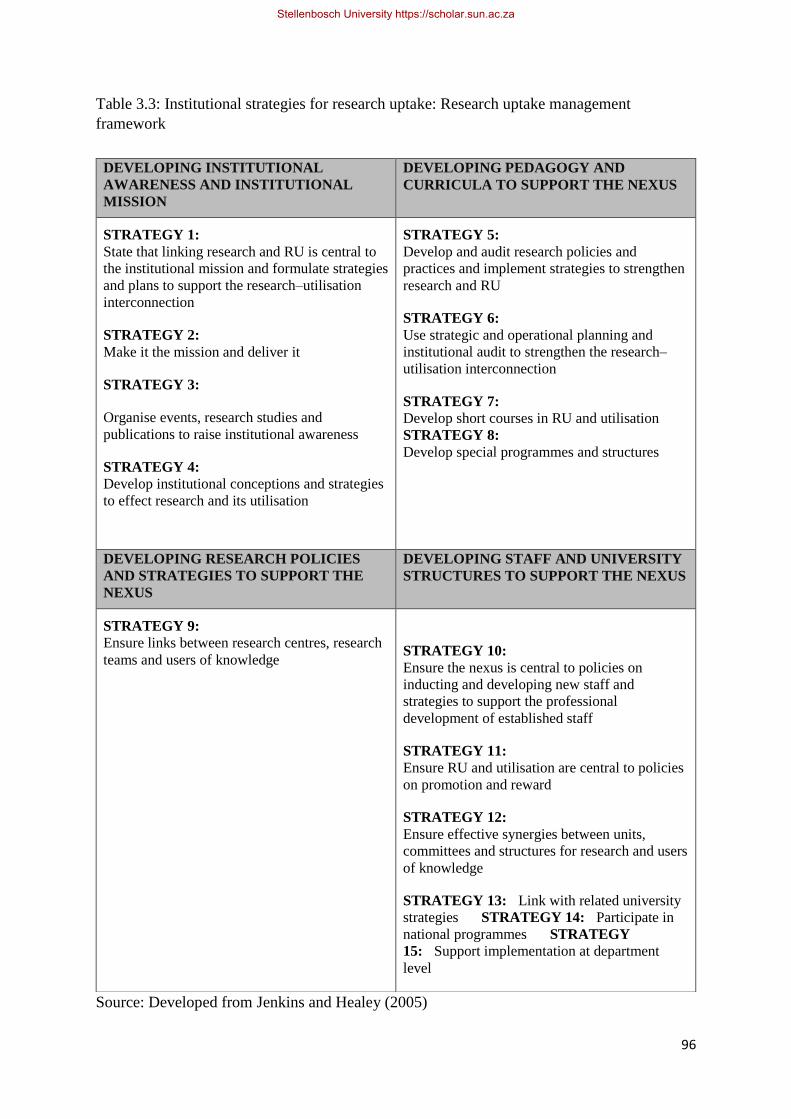
96
Table 3.3: Institutional strategies for research uptake: Research uptake management
framework
Source: Developed from Jenkins and Healey (2005)
DEVELOPING INSTITUTIONAL
AWARENESS AND INSTITUTIONAL
MISSION
DEVELOPING PEDAGOGY AND
CURRICULA TO SUPPORT THE NEXUS
STRATEGY 1:
State that linking research and RU is central to
the institutional mission and formulate strategies
and plans to support the research–utilisation
interconnection
STRATEGY 2:
Make it the mission and deliver it
STRATEGY 3:
Organise events, research studies and
publications to raise institutional awareness
STRATEGY 4:
Develop institutional conceptions and strategies
to effect research and its utilisation
STRATEGY 5:
Develop and audit research policies and
practices and implement strategies to strengthen
research and RU
STRATEGY 6:
Use strategic and operational planning and
institutional audit to strengthen the research–
utilisation interconnection
STRATEGY 7:
Develop short courses in RU and utilisation
STRATEGY 8:
Develop special programmes and structures
DEVELOPING RESEARCH POLICIES
AND STRATEGIES TO SUPPORT THE
NEXUS
DEVELOPING STAFF AND UNIVERSITY
STRUCTURES TO SUPPORT THE NEXUS
STRATEGY 9:
Ensure links between research centres, research
teams and users of knowledge
STRATEGY 10:
Ensure the nexus is central to policies on
inducting and developing new staff and
strategies to support the professional
development of established staff
STRATEGY 11:
Ensure RU and utilisation are central to policies
on promotion and reward
STRATEGY 12:
Ensure effective synergies between units,
committees and structures for research and users
of knowledge
STRATEGY 13: Link with related university
strategies STRATEGY 14: Participate in
national programmes STRATEGY
15: Support implementation at department
level
Stellenbosch University https://scholar.sun.ac.za
97
As derived from Jenkins and Healey’s framework (2005:22), there are some key factors that
should be considered in the design of strategy at organisational level. Moreover, in agreement
with the DRUSSA Statements of Good Practice, the literature (DRUSSA, 2012; DRUSSA,
2015) confirms strategic focal areas necessary for the facilitation of research utilisation. The
Research Utilisation Tool Kit (K4Health, 2015b) also outlines similar strategies, which may
be applicable in different contexts. The RU Tool Kit suggests that in some cases, a combination
of many strategies may be more effective. Again, it is advised that different phases of KU may
require different strategies. Key among the strategic focal areas are:
• the university’s mission and vision (Jenkins & Healey, 2005; Lavis & Robertson,
2003);
• research policy (Jenkins & Healey, 2005; Lavis & Robertson, 2003);
• research stakeholders and users (Jacobson et al., 2007; Mitton et al., 2007);
• capacity building (Andrews, 2012);
• communicating research (Andrews, 2012);
• accessibility of research (Andrews, 2012);
• budget (Andrews, 2012); and
• M&E of uptake (Eagar et al., 2003; Lavis & Robertson, 2003; Mitton et al., 2007).
In the following sections, the researcher reflects on the above-mentioned areas and relates these
to the insight drawn from the literature review.
Mission and vision of the university
According to the literature, university mission and vision should be summed up in its approach
and commitment to generate knowledge that will meet societal needs (Lavis & Robertson,
2003). As already indicated in this review (see section 3.1) most universities’ missions refer to
teaching, research and service to the community. However, in the African context, the research
component seems not to receive adequate attention and remains under-resourced (Robertson,
2003). Furthermore, the mission and vision regarding research utilisation are not adequately
supported. The specific focus of getting research into use is missing in pursuit of the mission
(DRUSSA, 2014). The 2014 DRUSSA Benchmarking Report (DRUSSA, 2014) indicates that
teaching has remained the topmost priority of most sub-Saharan African universities to the
detriment of clear strategies to get research into use.
It has been proposed ((Grobbelaar & De Wet, 2013) that a strategic framework for RU should
be guided by an analysis of the institutional dynamics with a critical examination of the
Stellenbosch University https://scholar.sun.ac.za
98
mechanisms and activities that are necessary to facilitate the achievement of the university’s
mission. Grobbelaar and De Wet (2013:22) in a case study to explore pathways towards the
integrated development role of the university emphasise, “the conditions under which
universities attempt to accomplish their three missions of teaching and learning, research and
community engagement in a coherent manner, have significant impact on the institutional form,
structure and character of universities”. These authors then call for the creation of the right
climate and institutional culture to facilitate and promote the achievement of the institutional
mission.
Policy of the university
As advocated, university policies must seek to operationalise their mission and
vision.(Grobbelaar & De Wet, 2013) The mission and vision must spell out the conditions and
relevance for RU (Lavis & Robertson, 2003). The institutional policy should cover areas such
as communication, human resources, public engagement, intellectual property, patents and
copyright, which are part of the RU and management process (DRUSSA, 2014).
In 2012, KNUST set out to develop an institutional research policy (DRUSSA 2012) which
was completed in 2016 and approved by the University Council in 2017 (QAPU, 2017). The
current research policy (QAPU, 2017) as it stands now incorporates plans for RU. The policy
states that the university will ensure it develops a research culture “that encourages and rewards
excellence in Research Innovation and Development, builds research capacity that will
encourage and empower staff to manage, conduct, disseminate and report research results”
(KNUST, 2012). The intention for RU and RUM may be implied in the statement. The
existence of a research policy provides support to the mission, vision and goals of the
institution. It provides guidelines for an appropriate reward system and promotes the
institutional research culture (DRUSSA, 2014).
The introduction of the 2012 draft research policy of the KNUST (see KNUST Research
Policy, 2012:8)
[T]he University and researchers employed by the University acknowledge that research
has to take place within a particular academic value system. The generation of resources
and the establishment of procedures to manage and use research resources effectively,
efficiently and fairly will form part of the research culture. The University also
acknowledges the need to increase graduate research activity. Again, it is expected that the
existence of a rich research culture will go a long way to build knowledge which enhances
Stellenbosch University https://scholar.sun.ac.za
99
and encourages the research-teaching nexus and other external/outreach activities and
leads the University towards the realisation of its Vision and Mission.
This statement seems to pave the way for the right climate for RU to take place. Other issues
raised in the research policy document to facilitate research activities seek to achieve the
following:
• aid decision-making in the conduct of research;
• help in setting goals and strategies for research;
• provide a framework for assuring quality standards, regulation and, accountability
in the conduct of research;
• provide strategic direction for research activities at KNUST; and
• guide any related research activity that will promote research at KNUST (KNUST,
2012).
These statements set the research agenda for the institution. The potential to create the climate
for RU (right culture and context) exists, although it is not explicitly stated as such
(Grobbelaaar & Haber, 2014). Activities towards institutionalising RU into the knowledge
production process and support as well as facilitating push factors through exchange are not
cogently stated. This leaves a gap that ought to be considered in the design of the strategic
framework for institutionalising RU (Grobbelaar & Haber, 2014).
Research stakeholders
Establishing a good relationship through stakeholder engagement and collaborative research is
said to have proved to be an effective means of KU (K4Health, 2015b). This includes
identifying the appropriate persons to be involved in the KU process. KNUST and indeed all
other research and academic institutions have stakeholders who may have an interest in the
research that takes place within the institution. Stakeholders must have a say in the research
process, from conception to dissemination, so that the products of research would be more
acceptable and applicable to them (Jacobson et al., 2007; K4Health, 2015b; Mitton et al., 2007).
This approach promotes the utilisation of research since stakeholders are involved in problem
identification as well as in sharing and disseminating of research results (Mitton et al., 2007).
Key among the stakeholders are peers, students, government, policymakers, industry, users of
technology, small and medium-sized enterprises, NGOs, the health sector, the agricultural
sector, entrepreneurs, chiefs, opinion leaders and professionals among others (DRUSSA,
2014). It has been suggested in the RU Tool Kit (K4Health, 2015) that it is necessary to identify
Stellenbosch University https://scholar.sun.ac.za
100
a key person (champion) within the society of implementation. According to the research
utilisation tool kit (K4Health, 2015a:25), the term ‘champion’ refers to “a charismatic,
influential, or respected individual who visibly and vocally supports evidence and promotes its
application among his or her peers”.
Another group of stakeholders are knowledge brokers, and these also fit into the category of
champions. (K4Health, 2015a)
Among the stakeholders of KNUST are the Association of Ghana Industries (AGI), Ghana
Institution of Engineers (GhIE), Ghana Institution of Architects (GIA), Ghana Association of
Bankers (GAB), Industrial and Commercial Workers Union (ICU), the business community,
small and medium-sized enterprises, and surrounding communities.
Communication and advocacy
Communication, which is a means to make research information accessible to stakeholders,
should be a key integral part of the institutional research strategy (Andrews, 2012). Evidence-
based practices and research results when identified need to be communicated to stakeholders
(Andrews, 2012). Priority areas for advocacy can be identified when stakeholders are fully
engaged by researchers (K4Health, 2015b). This should provide avenues for public
engagement and promotion of the image of the university. The social media and other modern
technologies exist to make communication more effective. Research institutions may consider
the use of radio, television, libraries, digital repositories, journals, technical reports, newspaper-
sponsored advertisements of research, websites, podcasts, documentaries, science cafes,
newsletters, institutional repositories, open days, exhibitions, science and technology fairs,
technology transfer centres, incubation centres, science parks, information centres among
others (Andrews, 2012; DRUSSA, 2014).
Capacity building
In order to design an appropriate RU strategy, there is the need to identify capacity gaps.
Capacity shortfalls have accounted for the lack of RU activities in sub-Saharan Africa
(DRUSSA, 2012). It has been strongly proposed that capacity shortfalls ought to be addressed
to demonstrate practically and tangibly that natural and social challenges facing communities
can be addressed through research (Andrews, 2012). Training programmes for the needed skills
should be organised to build sufficient capacity to manage research (DRUSSA, 2014). Skills
and human capacity development is key in the management process (Oliver et al., 2014).
Stellenbosch University https://scholar.sun.ac.za
101
University managers are advised to develop both their competence as well as character. (Oliver
et al., 2014)
According to the DFID (2013:8), “internal capacity for research uptake includes the
knowledge, skills and attitudes needed to access, use, create and communicate research
information”. Moreover, a lack of absorptive capacity has been identified as a major challenge
in the facilitation of pull factors through exchange (Becheikh & Ziam, 2010; Ellen et al.,
2011;.Grobbelaar and & Harber, 2014).
Some of the key capacity requirements outlined by the DFID include:
• information literacy (i.e. skills in finding and appraising academic literature);
• knowledge of research methodologies;
• internal communication (including effective use of email);
• internal knowledge management;
• academic writing and summarising skills; and
• skills in communicating with non-specialists.
According to the DFID (2013:9) –
[External capacity for RU] includes the knowledge, skills and attitudes needed to
understand and use research information. If your key stakeholders lack the capacity to
make use of your research results, then you are unlikely to have impact no matter how
good your research is. Some key areas to consider include: Understanding of research and
skills in finding and appraising evidence; thematic topic knowledge; and incentives (or
disincentives) to consider evidence.
Budgeting
Funding for RU is another important ingredient in the research utilisation process and requires
particular attention as far as the strategy for research utilisation is concerned. Landry et al.
(2001) argue that sources of funding influence the use of knowledge, and predict that projects
based on university internal funding are less likely to be utilised compared to projects that are
externally funded. This implies that universities must make conscious efforts to attract the
needed external funding to produce the kind of research that can be utilised to the benefit of
society and industry (Andrews, 2012). This does not mean that universities should not strive to
raise funds from within to promote their research agenda (Andrews, 2012).
Human resources and scientific services or research facilities (libraries, media services, specific
scientific services, technological and knowledge transfer) should be budgeted for (Santalo,
Stellenbosch University https://scholar.sun.ac.za
102
2004). There must be guidelines on how to mobilise funds to support these. Apart from
government’s direct subvention and support from industry and others, academic and residential
facility user fees are seen as a major source of funding. It has been argued (see Wood, 2013;
Robinson, 2014) that there is so much political and social pressure on senior university
managers that they have to expand significantly, either in terms of student numbers or by
increasing their so-called ‘relevance’ in areas such as research and innovation, or by making a
greater ‘social impact’ through community and industry engagement (Wood, 2013; Robinson,
2014). True as this assertion may be, the question arises whether the quality of teaching will
not be compromised with increased student numbers.
Care must also be taken that the university does not exploit its already limited resources just
for the sake of uptake. Research dissemination aimed at utilisation and uptake is one way in
which the university, through its research activities, reaches out to the rest of society; however,
there is a need for administrative oversight to be developed to ensure that these activities do
not merely exploit the resources of the university but that they also add value (Jacob, 2001).
By adding value, more resources will be generated to support more research.
It is becoming increasingly competitive to source external funds (Jacob & Jones, 2007). In
order to compete successfully for funding, institutions need to show they are accountable and
that their research has influence. Accountability is necessary because donors want to see active
results for their work, partly because there is an increased requirement to be accountable for
the way in which money is spent (Jacobs & Jones, 2007; Weigart, 2013). This will require
improved capacity in universities to manage and facilitate the RUM process, to demonstrate
the influence of research effectively and to ensure that it is effectively utilised to increase
available funding for research.
Monitoring and evaluation
M&E is a strategic issue and must be encouraged right from the outset of the research process
for optimum utilisation (Eagar et al., 2003; Lavis & Robertson, 2003; Mitton et al., 2007). One
tool that can be used for M&E, is a logframe and this must be embedded with research
utilisation indicators (Eagar et al., 2003; Lavis & Robertson, 2003; Mitton et al., 2007) There
is evidence from our local science journal (Journal of Science and Technology ,JUST) and
other publications where KNUST sometimes reports activity relevant to RU but this is mostly
done on an ad hoc basis with a lack of capacity to track, record and evaluate dissemination
activities.
Stellenbosch University https://scholar.sun.ac.za
103
From the above discussion, we can conclude that policy plays a key role and can play a pivotal
role in terms of the development of strategy for research utilisation. We acknowledge the
implications for neglecting the other factors but that notwithstanding, one may conclude that it
takes policy to give direction and expression to strategy.
Phipps, Jensen and Myers (2012) refer to an example of an existing strategic approach to
research utilisation, which emphasises policy. The key components of this strategic approach
are planning, dissemination, execution and M&E. These are however, encapsulated in a strong
institutional policy (Phipps, Jensen & Myers, 2012). Policy then serves as the engine, which
drives the other factors within the research cycle.
The planning phase of the research should include aspects of consultation, fostering
partnerships and creation of avenues for user input through a research forum (Phipps et al.,
2012). Dissemination is inclusive of institutional publications and repositories, media and
policy fairs. Execution is carried out through intervention studies, industries, technology hubs
and spinoff firms, among others. Another important aspect factored into the research cycle is
that of M&E, carried out through surveys, expert panels and case studies. All these aspects are
directed by the institutional policy. Figure 3.1 below provides a summary of a strategic
approach to RU built around the institutional policy.
Stellenbosch University https://scholar.sun.ac.za
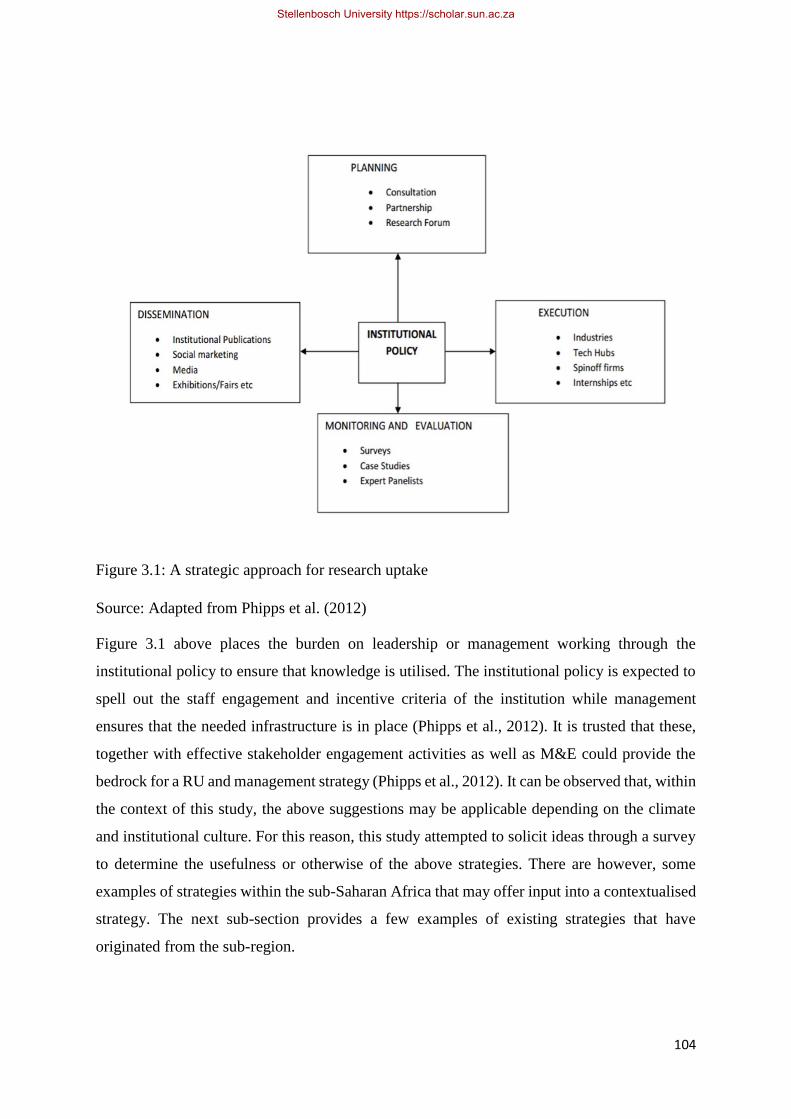
104
Figure 3.1: A strategic approach for research uptake
Source: Adapted from Phipps et al. (2012)
Figure 3.1 above places the burden on leadership or management working through the
institutional policy to ensure that knowledge is utilised. The institutional policy is expected to
spell out the staff engagement and incentive criteria of the institution while management
ensures that the needed infrastructure is in place (Phipps et al., 2012). It is trusted that these,
together with effective stakeholder engagement activities as well as M&E could provide the
bedrock for a RU and management strategy (Phipps et al., 2012). It can be observed that, within
the context of this study, the above suggestions may be applicable depending on the climate
and institutional culture. For this reason, this study attempted to solicit ideas through a survey
to determine the usefulness or otherwise of the above strategies. There are however, some
examples of strategies within the sub-Saharan Africa that may offer input into a contextualised
strategy. The next sub-section provides a few examples of existing strategies that have
originated from the sub-region.
Stellenbosch University https://scholar.sun.ac.za
105
3.4.2 Examples of institutional level RU strategy
This sub-section looks at practical examples of institutional-level strategies aimed at achieving
institutional goals of getting research into use.
The above strategies (see sub-section 3.4.1) notwithstanding, there is a need to find out what
exists on the ground in order to assess the practice situation. A few examples of institution-
level strategies being adopted by some universities within sub-Saharan Africa are discussed
here. Three DRUSSA universities (University of Fort Hare, University of Mauritius and
University of Ghana), which developed their strategies as a result of the programme, are being
cited as examples to illustrate the fact that there are indications of efforts to make research
accessible to stakeholders and also to tailor research towards national developmental needs
(DRUSSA, 2015).
Recent efforts and suggestions seem to set the tone for the right climate for an institutional
strategy as far as KU is concerned. As part of recommendations towards the development of
strategy for research, Effah and Addae-Mensah (2013:23) suggested –
[C]omprehensive national research policies should be developed as a matter of urgency to
guide research. Collaboration of all stakeholders is necessary in this regard. Universities,
industry, research councils and civil society should play their respective roles, with
government taking the leadership position. Research policies should reflect national
development priorities.
To Effah & Addae-Mensah (2013) research policies are top priority approach to research
strategy. Effah and Addae-Mensah’s experience at top level management of higher education,
as executive secretary to the National Council for Tertiary Education and vice-chancellor
respectively, makes this suggestion most likely to be acceptable and contextually focused. Here
again, the focus is on policy and how it directs the research agenda for HEIs.
As proposed by Phipps et al. (2012), developing strategy from the angle of policy enhances
application and use. It is after the policy issues have been taken care of that an individual
university can dovetail and align its strategies to that of national priorities. The researcher
suggests that if these strategies are developed in the right socio-economic environment, they
will be feasible in the Ghanaian HEIs and the principles are likely to be applicable to higher
education in sub-Saharan Africa. Some universities within the sub-region are making efforts to
outline some of these strategic approaches to enhance the utilisation of their research.
Stellenbosch University https://scholar.sun.ac.za

106
As part of its RU strategic mission, the University of Fort Hare (UFH) seeks to promote among
others:
• meaningful and critical participation in the social, economic and political development
of society;
• contributing to the enhancement of knowledge that is socially and ethically relevant;
and
• applying knowledge that contributes to the scientific technological and socio-economic
development of the nation and the wider world (UFH, 2009).
Clearly, activities towards RU, such as communication and stakeholder engagement, are
outlined in the university’s strategic RU policy. The researcher believes that for research to
have any influence, it must be culturally relevant, meaningful and acceptable to users. There
are efforts at UFH at aligning research with national developmental needs. The UFH example
seems to follow a transformational path of assisting the state to achieve its developmental
agenda with implications for economic development (Cloete et al., 2011).
The 2009–2015 Operational Plan for the Research Strategy of the University of Mauritius
(UoM) (UoM, 2009) has a national focus. Its research goal is “to foster research to sustain
economic development and growth” (UoM, 2009:1) with the hope of conducting research that
is aligned with national priorities. Although the issue of RU is not explicitly stated in the
strategic plan, it may be inferred that once research is aimed at addressing national priorities,
uptake and utilisation may be incorporated in the planning and execution of the research
findings. UoM has made it a matter of policy to engage in research geared towards achieving
national priorities.
The University of Ghana, located in Legon, Accra, has also initiated some strategic moves to
ensure that research is utilised in the long run (University of Ghana (UoG), 2014). Therefore,
as part of its strategic research priority outlined in the Strategic Plan 2014-2024, the university
hopes to create “a vibrant intellectual climate that stimulates relevant cutting edge research and
community engagement ” (UoG, 2014:12). Moreover, the UoG have sought to provide
guidelines to ensure that research meets the national development priorities (UoG, 2014).
Similarly, KNUST was also set up to ensure that the scientific and technological needs of the
nation are met as spelt out in its strategic mandate, mission and vision (QAPU, 2017). Similar
priority targets exist in all the public universities in Ghana set up by successive governments
with the aim of meeting specific national priority needs (QAPU, 2017). It is clear that there is
Stellenbosch University https://scholar.sun.ac.za
107
a national expectation that ought to be met for which reason universities are to plan their
activities to meet these expectations. Whether or not research institutions or universities are
meeting these expectations is an issue to be investigated. This study sought to establish whether
researchers and indeed senior academic and non-academic staff are aware of existing national
priority needs. Again, we sought to investigate the institutional culture and climate and how
this has informed current RU strategies. There are however, some essential elements that
needed to be emphasised and these are discussed in the next section.
3.4.3 Key elements of research uptake
This sub-section examines the essential elements of KU. The processes through which research
use can be operationalised and the elements of research are closely linked and interdependent
(Cherney et al., 2012). The interactions between these elements have the potential to affect the
extent of usage.
According to Cherney et al. (2012), research use can be operationalised through a cumulative
process that progresses through stages, including –
• transmission (the research is transmitted to end users);
• cognition (the research is understood by end users);
• reference (the research is cited in reports and strategies by the end user);
• effort (efforts have been made to use the research);
• influence (the research has influenced decisions and choices of end users); and
• application (the research has been applied by end users).
In our quest to design a framework for KU, there was a need to understand the processes
through which research use can be operationalised in order to identify which parameters to
look out for in measuring the influence of research.
The above stages form part of the variables to look out for in determining knowledge use
(Cherney et al., 2012). However, the way KU and influence are measured is still a big issue
due to its definition as a process and sometimes as outcome (Belkhodja & Amara, 2007; Lester,
2005). Another issue has to with specifying the variables needed to define the use of knowledge
(Belkhodja & Amara, 2007; Lester, 2005). The way knowledge influences policy or solves
problems is said to be “more of process than product”, a current of activities and relationships
interacting with each other (Carden, 2009:8). In order to determine the extent of usage, there
are some essential elements in the knowledge transfer process for which one ought to look out
(Cherney et al., 2012).
Stellenbosch University https://scholar.sun.ac.za

108
The National Centre for the Dissemination of Disability Research (NCDDR) (1995) identified
four key elements in knowledge transfer, namely source, content, medium and users.
• Source refers to the academic, researcher or the person(s) generating knowledge that is
focused, credible and acceptable.
• Content refers to the message of information being transferred. The content must be
clear, unambiguous, applicable, valuable, uncontested, simple and not complicated.
• Medium is the way the knowledge is transferred. This must be suitable to users of
knowledge. It can be written documents, such as scientific journals, information reports
and best practice guides. Modern trends seem to shift towards the use of information
and communication technologies, such as emails and blogs.
• The target audience or users of knowledge who may have been part of the knowledge
generation process are referred to as ‘users’. This includes decision-makers and
practitioners (NCDDR,, 1995).
Bozeman’s contingent effectiveness technology transfer model (Bozeman, 2000) with
implications for KU spells out five broad dimensions of effectiveness:
• characteristics of the transfer agent;
• characteristics of the transfer media;
• characteristics of the transfer object;
• characteristics of the demand environment; and
• characteristics of the technology transfer recipient (Bozeman, 2000).
These characteristics, although not exhaustive, are in direct agreement with the elements
enumerated above, that is, the source, the content, the way in which the knowledge is
transferred and the target audience or users of the knowledge (NCDDR, 1995).
Larsen (1980) provides related characteristics as follows:
• organisational characteristics;
• characteristics of knowledge or information;
• characteristics of potential users;
• characteristics of the knowledge producer or knowledge source;
• strategies for dissemination;
• linkages between the knowledge and the user; and
• the relationship of all these to multiple utilisation indicators (Larsen, 1980).
Stellenbosch University https://scholar.sun.ac.za
109
Personal contact between researchers and policymakers, clear summaries of research findings
with recommendations for action, good-quality research, and research that includes
effectiveness data are some of the facilitators of knowledge transfer (Innvaer & Vist, 2002).
A summary of elements necessary in the RU process is provided as follows:
• characteristics of transfer agents (Bozeman, 2000);
• characteristics of media (Bozeman, 2000; NCDDR, 1995);
• characteristics of object, knowledge and/or content (Bozeman, 2000; NCDDR, 1995);
• characteristics of producer and/or source (Bozeman, 2000; Larsen, 1980; NCDDR,
1995);
• characteristics of recipient and/or users (Bozeman, 2000; Larsen, 1980; NCDDR,
1995);
• characteristics of demand environment (Bozeman, 2000).
These elements are essential within the RU process and may be necessary for integration into
the KU framework. The dynamics at organisational or institutional level within which KU
occurs have implications for any strategy aimed at achieving optimum use of knowledge. For
instance, in an environment of lack of funding, low morale, lack of experience, low level of
education, lack of interest, no budgetary allocation for RU, low commitment to RU practices,
KU is not optimised (Andrews, 2012; Bozeman, 2000). It is therefore necessary to understand
the characteristics of the agents and/or essential elements of the knowledge production and
utilisation process to inform strategy (Andrews, 2012; Bozeman, 2000).
3.5 Conclusion
In conclusion, mainstreaming RU and its management requires a policy framework with
leadership showing commitment to any strategic mission. Leadership and management
structures of the institution play significant roles in fostering a congenial atmosphere for
researchers to engage in activities leading to utilisation of research outcomes (Andrews, 2012).
Staff engagement strategies and knowledge management skills are necessary ingredients to the
management of the KU processes (Ellen et al., 2011). Institutional strategies to create
awareness about RU must be in place. Carefully designed incentives and award schemes that
recognise research and research activities should be instituted (DFID, 2013). Furthermore,
through promotion and acknowledgement of achievements, it should be possible to bring RU
into the mainstream of the activities of the university. Academics and researchers should also
be made aware of the requirements for effective RU while their needs, for example, funding
Stellenbosch University https://scholar.sun.ac.za
110
and support, are taken into consideration. Budgetary allocation should be made for RU during
the planning for dissemination and uptake (Andrews, 2012). All the above sections have been
discussed to help us determine the best strategy for RU and RUM.
CHAPTER 4 – RESEARCH EFFORTS AT KNUST
4.1 Introduction
Since its establishment, the Kwame Nkrumah University of Science and Technology
(KNUST), in Kumasi, Ghana, has had teaching, research and service to the community as its
mandate (QAPU, 2017). Every academic staff member employed by the university is therefore
expected to perform the three core functions of teaching, research and service. The reality,
however, is that prevailing conditions have forced academics to allocate time
disproportionately to these functions. Teaching seems to take most of the time leaving little
time to do meaningful research let alone extending efforts to communities in need (DRUSSA,
2014). That notwithstanding, academics are also under pressure to carry out research with the
aim of publishing in peer-reviewed journals to be eligible for promotion and career progression.
This chapter is intended to report on an examination of the research profile of the university
and efforts to date to increase the research output of the university, which has direct
implications for RU and utilisation efforts.
4.2 Background on the research system in Ghana
This sub-section provides a background to the research system in Ghana. Since independence
in 1957 the research system in Ghana has been dominated by a focus on health and agriculture
((UNESCO, 2009b). This is largely attributed to the continuing colonial legacy (UNESCO,
2009b). Many of the research institutes were established during the colonial era with a clear
indication of the colonial approach (Chatelin et al., 1997). Across Africa, one can see a
replication of institutes such as the Crops Research Institute, in many previously colonial
territories. The Cocoa Research Institute in Ghana is one of the oldest research institutes in the
country (Council for Scientific and Industrial Research [CSIR], 2017). The Aburi Botanical
Garden in Accra, Ghana, one of many sites, which used to conduct research into plant and other
related research, still exists today. These institutions encouraged research, which principally
focused on agriculture and other practically oriented scientific fields. They are largely
influenced by the colonial model of science (Cloete et al., 2011). Scientific councils were set
up in those days to ensure that science and technology followed a colonial regional approach
Stellenbosch University https://scholar.sun.ac.za
111
(Chatelin et al., 1997). These were in charge of policy formulation and allocation of funds for
research.
Research in tropical medicine and agriculture has been the main focus during the colonial era
(Chatelin et al., 1997). This emphasis was due to the mission of the settlers at the time as there
were tropical diseases, which were inhibiting their work; hence, the need to direct research to
find a solution to these diseases (Chatelin et al., 1997). Emphasis on agriculture was focused
on improving the use of land and cultivation, and also to develop better farming systems that
would lead to higher yields of a variety of cash crops (Chatelin et al., 1997; Eisemon & Davis,
1991). Priority was given to export crops, such as cocoa, rice, maize and oil palm (Eisemon &
Davis, 1991).
The post-independence era did not witness any major shifts in research and development in
general across Africa, despite efforts to revitalise research (Cloete & Maassen, 2014) and so
was the case of research in agriculture. There was emphasis on the production of food crops
but export crops like cocoa were still dominant. The colonial authorities, having been the main
sponsors of research activities, and ultimate beneficiaries, still had influence on post-colonial
research (Chatelin et al., 1997). Funders are regarded as the core of the research process and
its findings because they provide research funding, scientific equipment and skilled human
resources (Chatelin et al., 1997). The local researcher then remains at the periphery by
depending on the donors or funders who ultimately benefit due to their advance capacity to
disseminate, absorb and act upon the knowledge produced (Boshoff, 2009). Boshoff (2009)
refers to this as the dependency theory and the interdependency theory in the field of
international economic relations. According to the author, dependency theory emphasises the
unequal aspect of the scientific relationship between the core and periphery (Boshoff, 2009)
With the existence of many research institutions in Ghana, one may expect interconnectivity,
linkages and strong collaboration between the various research centres, but this is not the case.
Although some are known to make use of each other’s facilities, such as laboratories for
research activities, there are few interconnections and linkages between sector ministries;
hence, the possibility of duplication and overlapping roles. For instance, one may expect formal
linkages and strong collaboration activities between the public universities and the Council for
Scientific and Industrial Research (CSIR). In reality, this is not officially the case, save for
some collaboration that exists between individual scientists and research teams. A classic
example is the Crops Research Institute and the Cocoa Research Institute where facilities are
shared between individual scientists. Whereas funding and oversight responsibility for crop
Stellenbosch University https://scholar.sun.ac.za

112
research is channelled through the CSIR of the Ministry of Environment, Science and
Technology, that for cocoa research is administered directly through the Ghana Cocoa Board
by the office of the president. One wonders why cocoa research is not integrated into crops
research. There may be good reasons though why cocoa is given such high priority, being the
nation’s number one foreign exchange earner (Ghana Statistical Service [GSS], 2017b, 2017a).
There is a possibility of duplication of roles, which calls for an effective collaborative and
coordinative approach to research for a more productive output. It is good to know that
partnerships exist between the public universities in Ghana to make use government hospitals
for the teaching of nurses, medical doctors and other paramedics, hence the adopted name
teaching hospitals. The University of Ghana makes use of the Korle Bu Teaching Hospital in
Accra for clinical training of medical doctors, dentists, nurses and other paramedics. Similarly,
KNUST also makes use of facilities at the Komfo Anokye Teaching Hospital in Kumasi. The
University for Development Studies uses the Tamale Hospital in the Northern Region of Ghana
for clinical training. These hospitals are fast becoming good sites for research. Many of the
specialist doctors in charge of doctors in training are staff of the universities and hence under
obligation to carry out research. Granted that these research outputs are towards solving health
related problems or for specific knowledge and skills, uptake and utilisation can be guaranteed
to some extent. The hospitals have research and development funds that provide some minimal
support for research. In the past, the central government provided funding for research at the
teaching hospitals but this has dwindled over the years. Hospitals have to rely on internally
generated funds to support research activities.
A research system with a national character is most likely to have semblance or traces of
colonial elements. A departure from this will require a paradigm shift with a focus on national
priorities. Research must not only aim at knowledge creation but also KU that must be geared
towards the national developmental agenda. The nation’s public universities are currently the
main producers of research. A few years after independence, Ghana set out to develop a science
governance framework with policy statements. A ‘seven year plan for national reconstruction
and development’ was published in 1964 (UNESCO, 2009a), which sought to give priority to
national science and technology developments (UNESCO, 2009a). This initial effort has
undergone several policy shifts and reorganisations with science and technology coming under
different ministries over the years. In the 2009 UNESCO report (UNESCO, 2009a) on recent
trends in governance and policy development in science and technology, Ghana was named as
one of the countries that have gone through two waves of science and policy development.
Stellenbosch University https://scholar.sun.ac.za

113
During the first wave (not too long after independence, in 1960) a first science and technology
(S&T) policy was developed but during the subsequent years was allowed to become dormant
and ineffectual (UNESCO, 2009a). A second wave of policy revision in recent times was aimed
at capturing the essence of the science policy goals (UNESCO, 2009a). The country was not
able to revise its policies effectively; hence, the creation of a policy and funding vacuum
(UNESCO, 2009a). In February 2010, the Ministry of Environment, Science and Technology
(MEST) published the National Science, Technology and Innovation Policy. This was backed
by a February 2011 Strategic Actions for Implementing the national science, technology and
innovation (STI) policy 2011–2015 (MEST, 2011).
The UNESCO (2009a) regional report on sub-Saharan Africa observed that the national mode
of scientific production in some African countries has certain characteristics. Firstly, that
science is for the public good. In fact, science must seek to address the specific and most
pressing needs of the country and hence have the ability to appeal to society. Secondly, that the
state assumes a major responsibility for financing research and development activities
(UNESCO, 2009a). Thirdly, the characteristic of a national science mode is that research
scientists – and particularly the scientific elite – are mostly civil servants with the right to
pursue careers. These professionals are imbued with national values as well as professional
ones. Lastly, that besides the peer community, the recipients of the products of research are
principally the public authorities. The direct users of the product are hardly involved. On paper,
one can testify to the existence of a national policy on S&T but also a lack of resources and the
political will to give expression to the laudable goals and objectives have rendered these
documents less effective (UNESCO, 2009a).
A strong research system or well-functioning national research system is expected to have
certain characteristics. In the first place, there must be the requisite human capital for research
and development, which must consist of trained researchers and professors. Human resource
(HR) development in science and technology has been a daunting task due to poor pay and
worsening conditions of service (Stellenbosch University [SU], 2016). It is a well-known fact
that public and private sector workers and indeed academics and researchers will look
elsewhere for jobs that have better conditions of service. There must be adequate research
infrastructure consisting of functional laboratories to support research and development. Poor
research infrastructure with obsolete laboratories and equipment seems to be the lot of our
institutions; hence, the current state of research and development (R&D). Science
communication infrastructure including Internet access, publications or publishing houses, and
Stellenbosch University https://scholar.sun.ac.za
114
journals are all very necessary to support R&D (Cloete et al., 2015). Long-term financial
support from all stakeholders, government, the private sector and industry is one of the pillars
for a viable national research system (Cloete et al., 2015). There is a need for support for R&D
by robing in government functionaries and policy makers to fashion out relevant policies and
build capacity to facilitate R&D in order to achieve set research targets (Cloete et al., 2015).
With limited resources, it is prudent for research institutes and researchers within the public
universities to collaborate extensively in the use of facilities and shared experiences in order to
maximise R&D. The next sub-section focuses on research trends at KNUST and the
implications for national development.
4.3 Research trends at KNUST
KNUST has research units and/or centres established in each of its six colleges. These were
established with the view to undertaking research to generate information and produce
technologies that will affect the socio-economic well-being of stakeholders. The research units
and centres are:
• Technology Consultancy Centre (TCC);
• The West African Institute for Supply Chain Leadership (WAISCL) – KNUST: this is
a supply chain management (SCM) unit focused on education, research and training
within the KNUST Business School;
• Kumasi Centre for Collaborative Research in Tropical Medicine (KCCR);
• Bureau of Integrated Rural Development (BIRD);
• The Agriculture Research Station (ARS);
• Dairy/Beef Cattle Research Station;
• Integrated Natural Resource Management (INRM);
• Centre for Settlements Studies (CSS);
• Centre for Land Studies (CLS);
• Institute of Human Settlements Research;
• The Energy Centre;
• Institute of Science and Technology for Africa (ISTA);
• National Institute for Mathematical Sciences; and
• Centre for Cultural and African Studies (CeCASt).
Current trends have necessitated gradual increases in research output from the various colleges.
Many of the research centres work in collaboration with other research institutes both locally
Stellenbosch University https://scholar.sun.ac.za
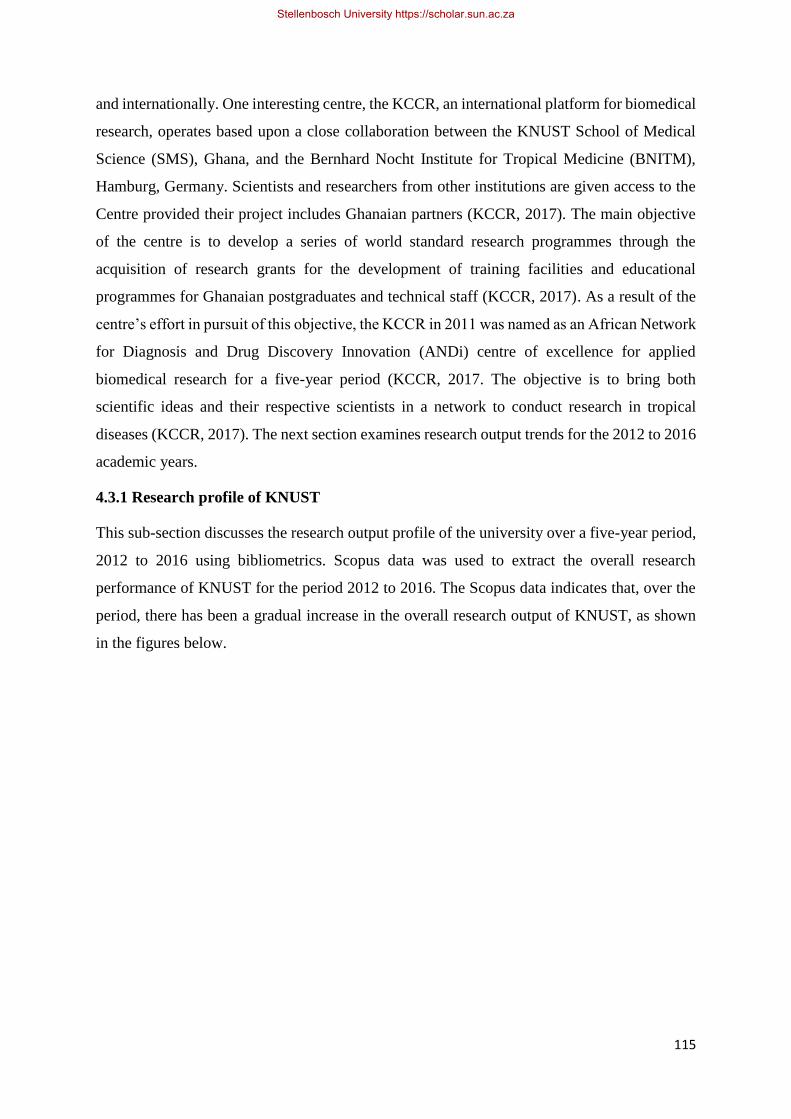
115
and internationally. One interesting centre, the KCCR, an international platform for biomedical
research, operates based upon a close collaboration between the KNUST School of Medical
Science (SMS), Ghana, and the Bernhard Nocht Institute for Tropical Medicine (BNITM),
Hamburg, Germany. Scientists and researchers from other institutions are given access to the
Centre provided their project includes Ghanaian partners (KCCR, 2017). The main objective
of the centre is to develop a series of world standard research programmes through the
acquisition of research grants for the development of training facilities and educational
programmes for Ghanaian postgraduates and technical staff (KCCR, 2017). As a result of the
centre’s effort in pursuit of this objective, the KCCR in 2011 was named as an African Network
for Diagnosis and Drug Discovery Innovation (ANDi) centre of excellence for applied
biomedical research for a five-year period (KCCR, 2017. The objective is to bring both
scientific ideas and their respective scientists in a network to conduct research in tropical
diseases (KCCR, 2017). The next section examines research output trends for the 2012 to 2016
academic years.
4.3.1 Research profile of KNUST
This sub-section discusses the research output profile of the university over a five-year period,
2012 to 2016 using bibliometrics. Scopus data was used to extract the overall research
performance of KNUST for the period 2012 to 2016. The Scopus data indicates that, over the
period, there has been a gradual increase in the overall research output of KNUST, as shown
in the figures below.
Stellenbosch University https://scholar.sun.ac.za
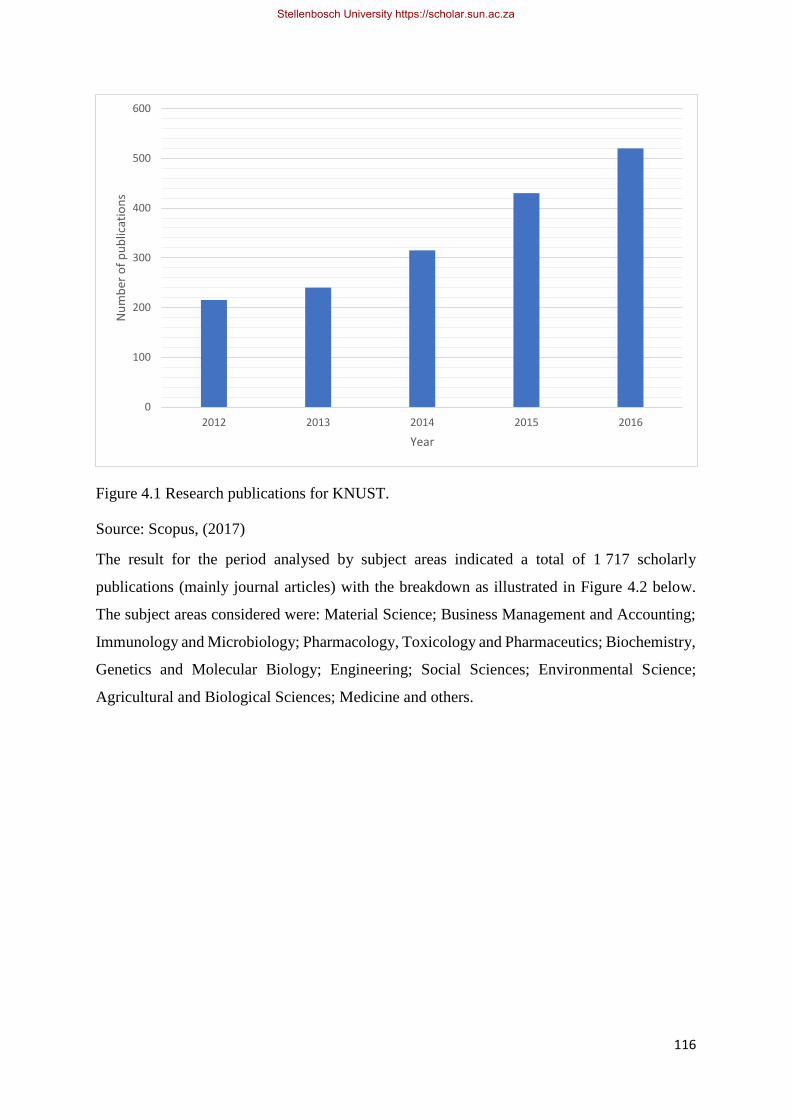
116
Figure 4.1 Research publications for KNUST.
Source: Scopus, (2017)
The result for the period analysed by subject areas indicated a total of 1 717 scholarly
publications (mainly journal articles) with the breakdown as illustrated in Figure 4.2 below.
The subject areas considered were: Material Science; Business Management and Accounting;
Immunology and Microbiology; Pharmacology, Toxicology and Pharmaceutics; Biochemistry,
Genetics and Molecular Biology; Engineering; Social Sciences; Environmental Science;
Agricultural and Biological Sciences; Medicine and others.
0
100
200
300
400
500
600
2012 2013 2014 2015 2016
Nu
mb
er o
f p
ub
licat
ion
s
Year
Stellenbosch University https://scholar.sun.ac.za

117
Figure 4.2 Research publications for KNUST.
Source: Scopus (2017)
The dominant departments in terms of publications are Medicine 40.8%, Agriculture and
Biological Sciences 17.4%, Environmental Science having 15% and Social Sciences 14%. A
look at Scopus (2017) database gives an indication that the CiteScore for the period has been
growing steadily. These results from Scopus compare favourably with similar analysis obtained
from SciVal (Scopus, 2017). For the period 2012 to 2016, there were 1 827 scholarly outputs
from 1 478 authors with a citation count of 25 162 and citation per publication being 13.8. The
overall research performance is as provided in Figure 4.3 below.
Stellenbosch University https://scholar.sun.ac.za
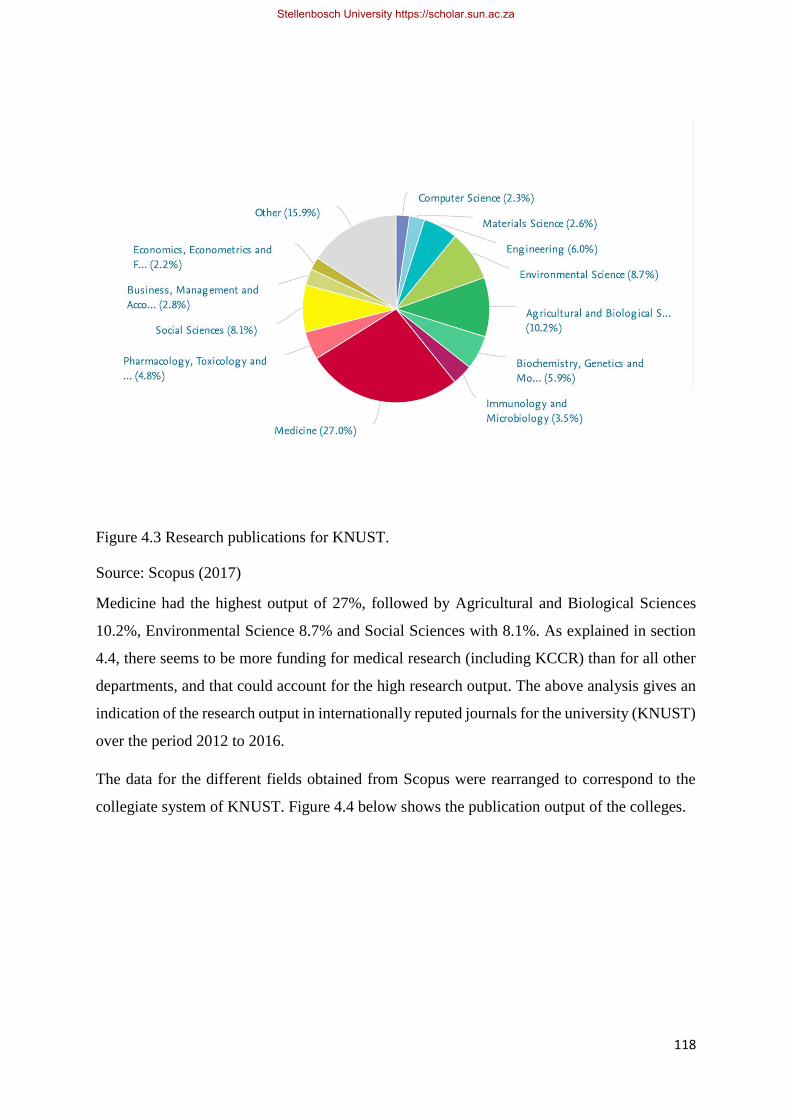
118
Figure 4.3 Research publications for KNUST.
Source: Scopus (2017)
Medicine had the highest output of 27%, followed by Agricultural and Biological Sciences
10.2%, Environmental Science 8.7% and Social Sciences with 8.1%. As explained in section
4.4, there seems to be more funding for medical research (including KCCR) than for all other
departments, and that could account for the high research output. The above analysis gives an
indication of the research output in internationally reputed journals for the university (KNUST)
over the period 2012 to 2016.
The data for the different fields obtained from Scopus were rearranged to correspond to the
collegiate system of KNUST. Figure 4.4 below shows the publication output of the colleges.
Stellenbosch University https://scholar.sun.ac.za
119
Figure 4.4 Publication output by colleges
Source: Compiled from Scopus, 2017
The figure indicates that 37% of KNUST’s publication output came from the College of Health
Sciences (CHS), followed by the College of Science (COS) with 21% and Agriculture and
Natural Resources (CANR) with 15% (Scopus, 2017). As explained in section 4.4 there seems
to be more funding from government and donor partners for the natural and applied sciences
than for the other fields.
The next sections discuss the research output data available in the university as provided by
the Quality Assurance and Planning Unit (QAPU).
4.3.2 Staff publication ratio for the colleges of KNUST
This sub-section provides an analysis of the staff publication ratios from the six colleges of for
the 2015/2016 academic year. The research outputs are with particular reference to publications
in refereed journals, published conference papers, unpublished conference papers, books and
CHS37%
COS21%
COHS16%
COE15%
CABE0%
CANR15%
Stellenbosch University https://scholar.sun.ac.za
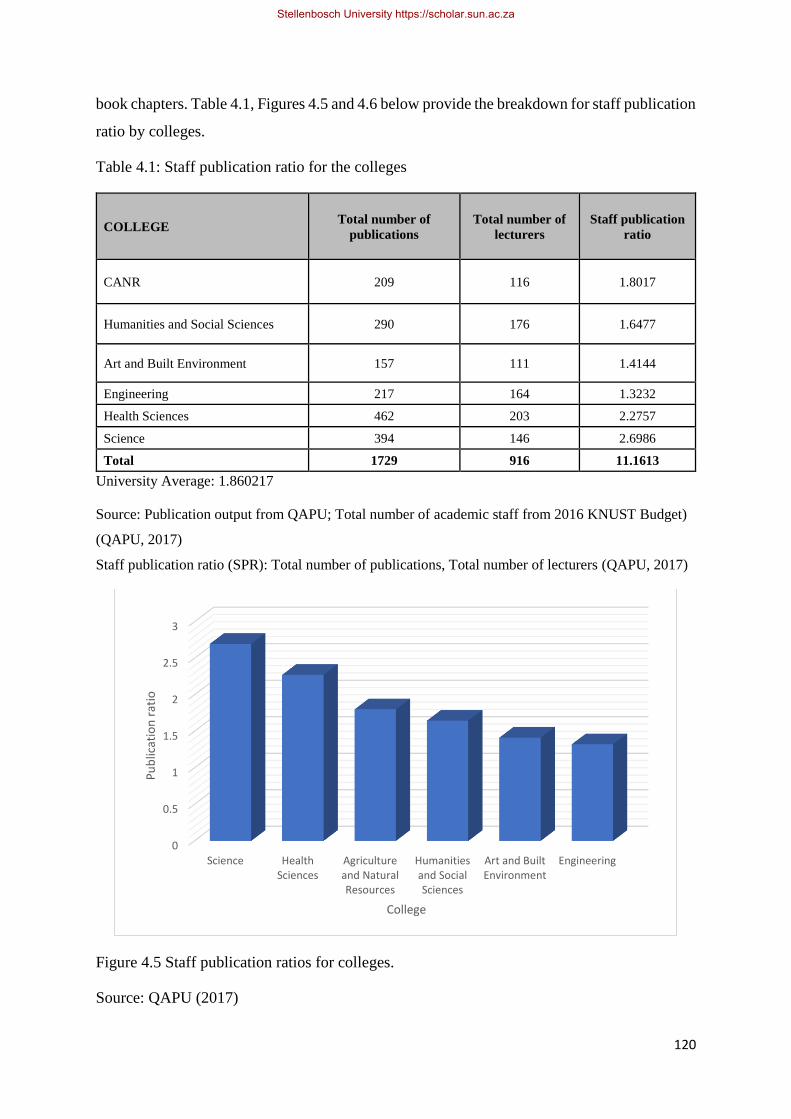
120
book chapters. Table 4.1, Figures 4.5 and 4.6 below provide the breakdown for staff publication
ratio by colleges.
Table 4.1: Staff publication ratio for the colleges
COLLEGE Total number of
publications
Total number of
lecturers
Staff publication
ratio
CANR 209 116 1.8017
Humanities and Social Sciences 290 176 1.6477
Art and Built Environment 157 111 1.4144
Engineering 217 164 1.3232
Health Sciences 462 203 2.2757
Science 394 146 2.6986
Total 1729 916 11.1613
University Average: 1.860217
Source: Publication output from QAPU; Total number of academic staff from 2016 KNUST Budget)
(QAPU, 2017)
Staff publication ratio (SPR): Total number of publications, Total number of lecturers (QAPU, 2017)
Figure 4.5 Staff publication ratios for colleges.
Source: QAPU (2017)
0
0.5
1
1.5
2
2.5
3
Science HealthSciences
Agricultureand NaturalResources
Humanitiesand SocialSciences
Art and BuiltEnvironment
Engineering
Pu
blic
atio
n r
atio
College
Stellenbosch University https://scholar.sun.ac.za
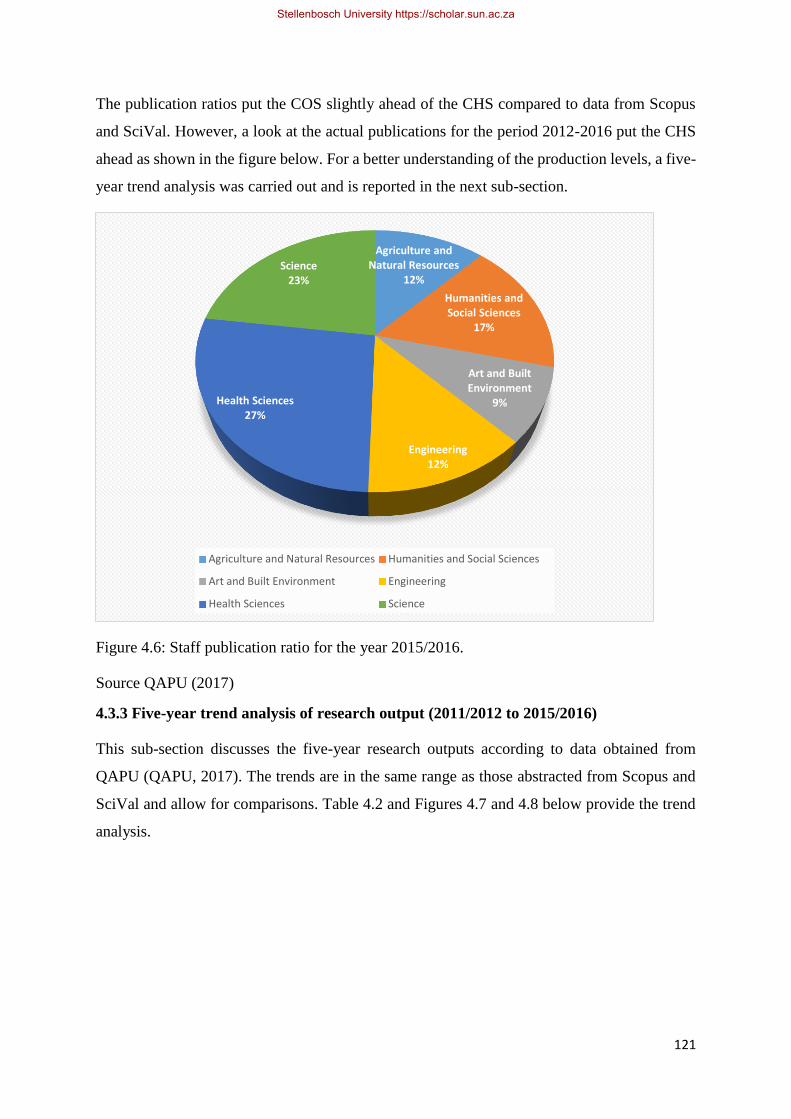
121
The publication ratios put the COS slightly ahead of the CHS compared to data from Scopus
and SciVal. However, a look at the actual publications for the period 2012-2016 put the CHS
ahead as shown in the figure below. For a better understanding of the production levels, a five-
year trend analysis was carried out and is reported in the next sub-section.
Figure 4.6: Staff publication ratio for the year 2015/2016.
Source QAPU (2017)
4.3.3 Five-year trend analysis of research output (2011/2012 to 2015/2016)
This sub-section discusses the five-year research outputs according to data obtained from
QAPU (QAPU, 2017). The trends are in the same range as those abstracted from Scopus and
SciVal and allow for comparisons. Table 4.2 and Figures 4.7 and 4.8 below provide the trend
analysis.
Agriculture and Natural Resources
12%
Humanities and Social Sciences
17%
Art and Built Environment
9%
Engineering12%
Health Sciences27%
Science23%
Agriculture and Natural Resources Humanities and Social Sciences
Art and Built Environment Engineering
Health Sciences Science
Stellenbosch University https://scholar.sun.ac.za
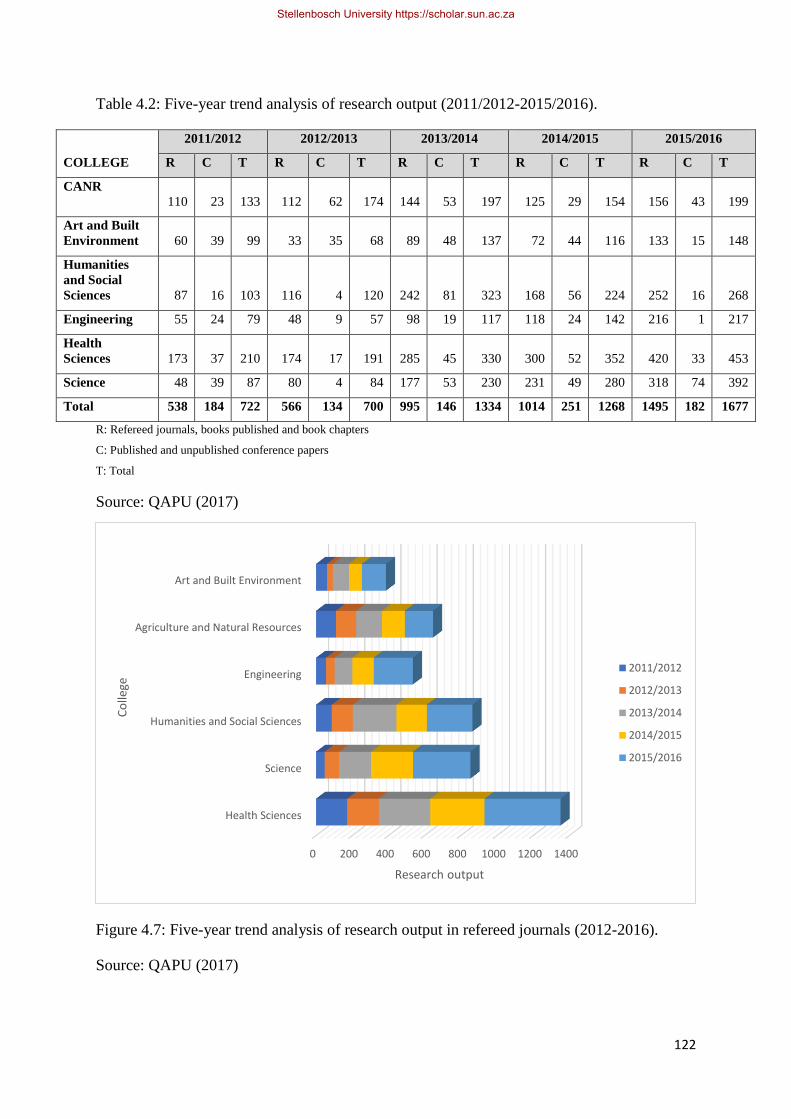
122
Table 4.2: Five-year trend analysis of research output (2011/2012-2015/2016).
2011/2012 2012/2013 2013/2014 2014/2015 2015/2016
COLLEGE R C T R C T R C T R C T R C T
CANR
110 23 133 112 62 174 144 53 197 125 29 154 156 43 199
Art and Built
Environment 60 39 99 33 35 68 89 48 137 72 44 116 133 15 148
Humanities
and Social
Sciences 87 16 103 116 4 120 242 81 323 168 56 224 252 16 268
Engineering 55 24 79 48 9 57 98 19 117 118 24 142 216 1 217
Health
Sciences 173 37 210 174 17 191 285 45 330 300 52 352 420 33 453
Science 48 39 87 80 4 84 177 53 230 231 49 280 318 74 392
Total 538 184 722 566 134 700 995 146 1334 1014 251 1268 1495 182 1677
R: Refereed journals, books published and book chapters
C: Published and unpublished conference papers
T: Total
Source: QAPU (2017)
Figure 4.7: Five-year trend analysis of research output in refereed journals (2012-2016).
Source: QAPU (2017)
0 200 400 600 800 1000 1200 1400
Health Sciences
Science
Humanities and Social Sciences
Engineering
Agriculture and Natural Resources
Art and Built Environment
Research output
Co
llege
2011/2012
2012/2013
2013/2014
2014/2015
2015/2016
Stellenbosch University https://scholar.sun.ac.za
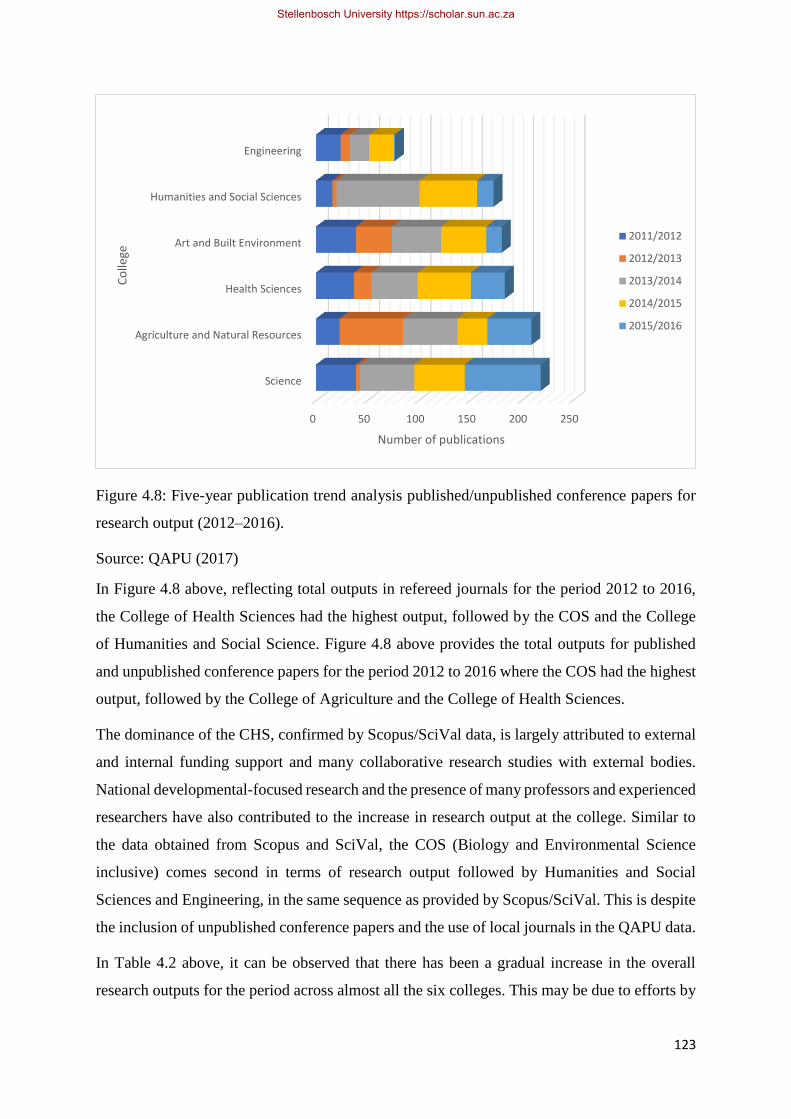
123
Figure 4.8: Five-year publication trend analysis published/unpublished conference papers for
research output (2012–2016).
Source: QAPU (2017)
In Figure 4.8 above, reflecting total outputs in refereed journals for the period 2012 to 2016,
the College of Health Sciences had the highest output, followed by the COS and the College
of Humanities and Social Science. Figure 4.8 above provides the total outputs for published
and unpublished conference papers for the period 2012 to 2016 where the COS had the highest
output, followed by the College of Agriculture and the College of Health Sciences.
The dominance of the CHS, confirmed by Scopus/SciVal data, is largely attributed to external
and internal funding support and many collaborative research studies with external bodies.
National developmental-focused research and the presence of many professors and experienced
researchers have also contributed to the increase in research output at the college. Similar to
the data obtained from Scopus and SciVal, the COS (Biology and Environmental Science
inclusive) comes second in terms of research output followed by Humanities and Social
Sciences and Engineering, in the same sequence as provided by Scopus/SciVal. This is despite
the inclusion of unpublished conference papers and the use of local journals in the QAPU data.
In Table 4.2 above, it can be observed that there has been a gradual increase in the overall
research outputs for the period across almost all the six colleges. This may be due to efforts by
0 50 100 150 200 250
Science
Agriculture and Natural Resources
Health Sciences
Art and Built Environment
Humanities and Social Sciences
Engineering
Number of publications
Co
llege
2011/2012
2012/2013
2013/2014
2014/2015
2015/2016
Stellenbosch University https://scholar.sun.ac.za
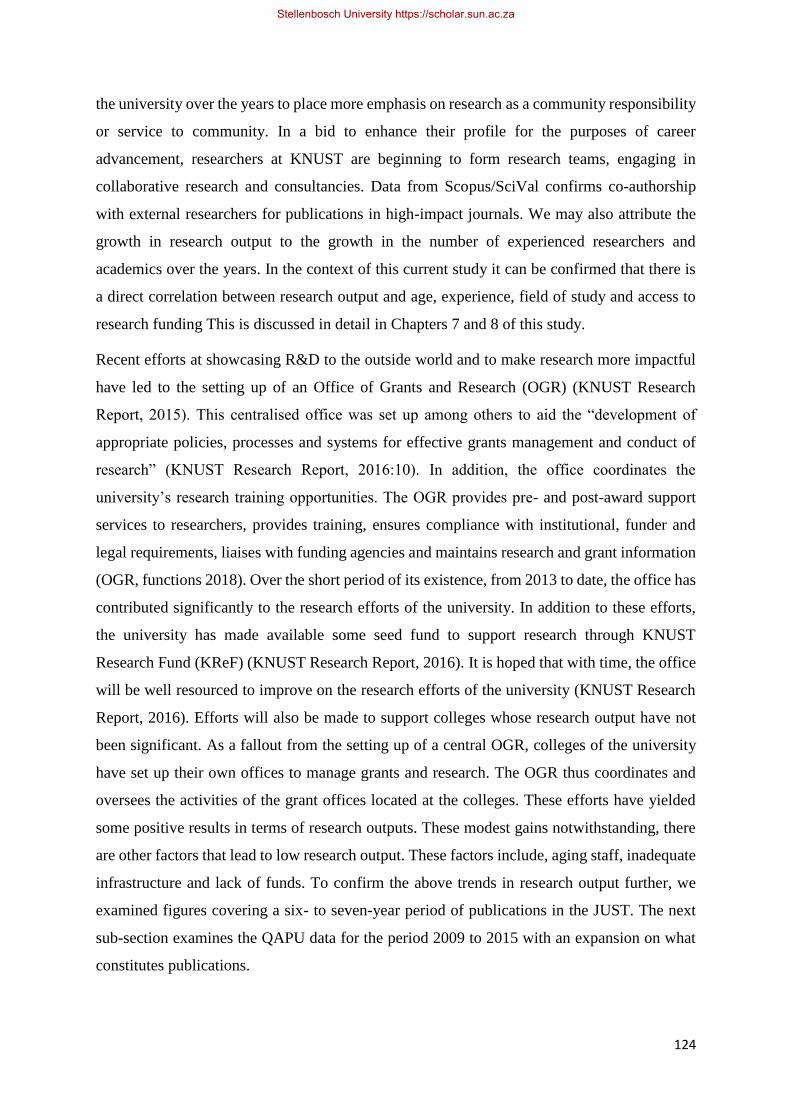
124
the university over the years to place more emphasis on research as a community responsibility
or service to community. In a bid to enhance their profile for the purposes of career
advancement, researchers at KNUST are beginning to form research teams, engaging in
collaborative research and consultancies. Data from Scopus/SciVal confirms co-authorship
with external researchers for publications in high-impact journals. We may also attribute the
growth in research output to the growth in the number of experienced researchers and
academics over the years. In the context of this current study it can be confirmed that there is
a direct correlation between research output and age, experience, field of study and access to
research funding This is discussed in detail in Chapters 7 and 8 of this study.
Recent efforts at showcasing R&D to the outside world and to make research more impactful
have led to the setting up of an Office of Grants and Research (OGR) (KNUST Research
Report, 2015). This centralised office was set up among others to aid the “development of
appropriate policies, processes and systems for effective grants management and conduct of
research” (KNUST Research Report, 2016:10). In addition, the office coordinates the
university’s research training opportunities. The OGR provides pre- and post-award support
services to researchers, provides training, ensures compliance with institutional, funder and
legal requirements, liaises with funding agencies and maintains research and grant information
(OGR, functions 2018). Over the short period of its existence, from 2013 to date, the office has
contributed significantly to the research efforts of the university. In addition to these efforts,
the university has made available some seed fund to support research through KNUST
Research Fund (KReF) (KNUST Research Report, 2016). It is hoped that with time, the office
will be well resourced to improve on the research efforts of the university (KNUST Research
Report, 2016). Efforts will also be made to support colleges whose research output have not
been significant. As a fallout from the setting up of a central OGR, colleges of the university
have set up their own offices to manage grants and research. The OGR thus coordinates and
oversees the activities of the grant offices located at the colleges. These efforts have yielded
some positive results in terms of research outputs. These modest gains notwithstanding, there
are other factors that lead to low research output. These factors include, aging staff, inadequate
infrastructure and lack of funds. To confirm the above trends in research output further, we
examined figures covering a six- to seven-year period of publications in the JUST. The next
sub-section examines the QAPU data for the period 2009 to 2015 with an expansion on what
constitutes publications.
Stellenbosch University https://scholar.sun.ac.za
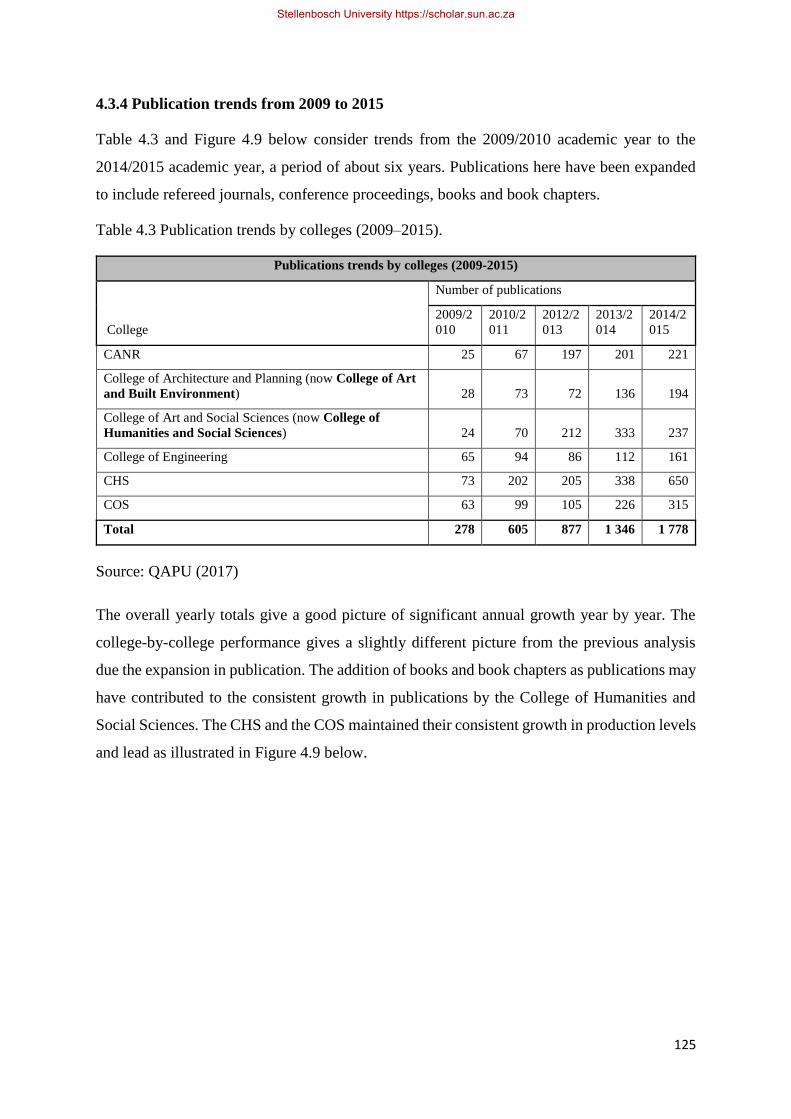
125
4.3.4 Publication trends from 2009 to 2015
Table 4.3 and Figure 4.9 below consider trends from the 2009/2010 academic year to the
2014/2015 academic year, a period of about six years. Publications here have been expanded
to include refereed journals, conference proceedings, books and book chapters.
Table 4.3 Publication trends by colleges (2009–2015).
Publications trends by colleges (2009-2015)
College
Number of publications
2009/2
010
2010/2
011
2012/2
013
2013/2
014
2014/2
015
CANR 25 67 197 201 221
College of Architecture and Planning (now College of Art
and Built Environment) 28 73 72 136 194
College of Art and Social Sciences (now College of
Humanities and Social Sciences) 24 70 212 333 237
College of Engineering 65 94 86 112 161
CHS 73 202 205 338 650
COS 63 99 105 226 315
Total 278 605 877 1 346 1 778
Source: QAPU (2017)
The overall yearly totals give a good picture of significant annual growth year by year. The
college-by-college performance gives a slightly different picture from the previous analysis
due the expansion in publication. The addition of books and book chapters as publications may
have contributed to the consistent growth in publications by the College of Humanities and
Social Sciences. The CHS and the COS maintained their consistent growth in production levels
and lead as illustrated in Figure 4.9 below.
Stellenbosch University https://scholar.sun.ac.za
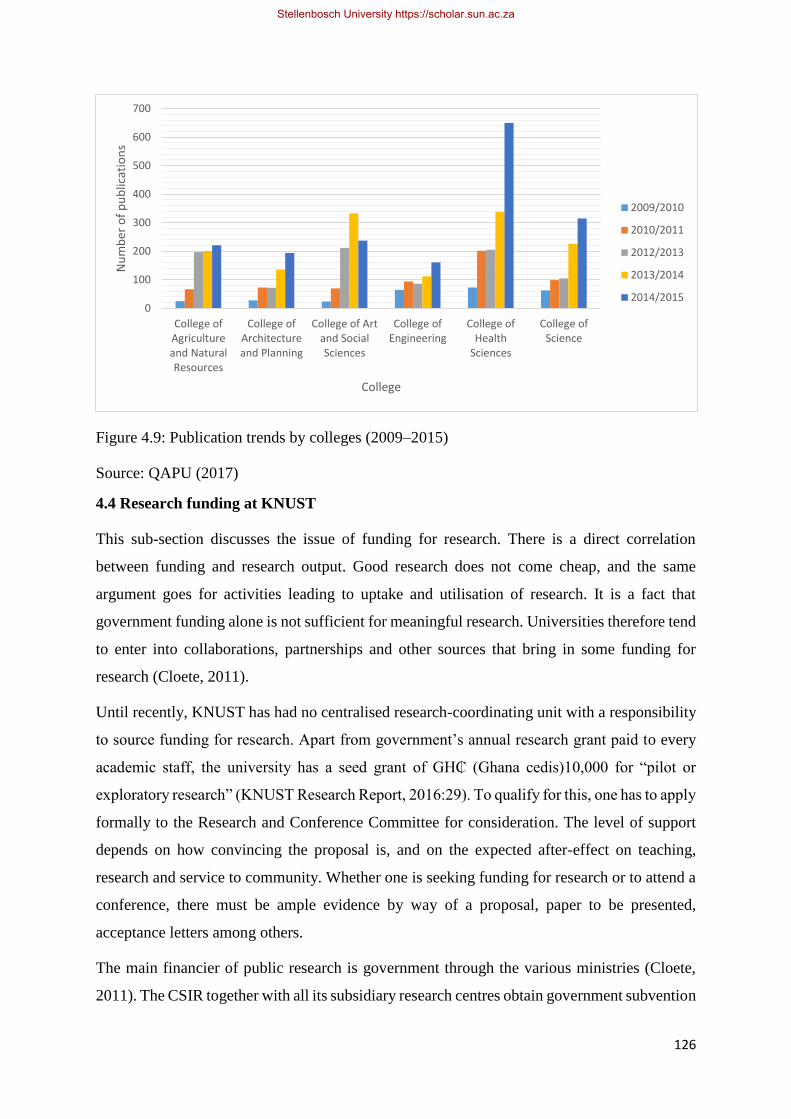
126
Figure 4.9: Publication trends by colleges (2009–2015)
Source: QAPU (2017)
4.4 Research funding at KNUST
This sub-section discusses the issue of funding for research. There is a direct correlation
between funding and research output. Good research does not come cheap, and the same
argument goes for activities leading to uptake and utilisation of research. It is a fact that
government funding alone is not sufficient for meaningful research. Universities therefore tend
to enter into collaborations, partnerships and other sources that bring in some funding for
research (Cloete, 2011).
Until recently, KNUST has had no centralised research-coordinating unit with a responsibility
to source funding for research. Apart from government’s annual research grant paid to every
academic staff, the university has a seed grant of GH₵ (Ghana cedis)10,000 for “pilot or
exploratory research” (KNUST Research Report, 2016:29). To qualify for this, one has to apply
formally to the Research and Conference Committee for consideration. The level of support
depends on how convincing the proposal is, and on the expected after-effect on teaching,
research and service to community. Whether one is seeking funding for research or to attend a
conference, there must be ample evidence by way of a proposal, paper to be presented,
acceptance letters among others.
The main financier of public research is government through the various ministries (Cloete,
2011). The CSIR together with all its subsidiary research centres obtain government subvention
0
100
200
300
400
500
600
700
College ofAgricultureand NaturalResources
College ofArchitectureand Planning
College of Artand SocialSciences
College ofEngineering
College ofHealth
Sciences
College ofScience
Nu
mb
er o
f p
ub
licat
ion
s
College
2009/2010
2010/2011
2012/2013
2013/2014
2014/2015
Stellenbosch University https://scholar.sun.ac.za
127
through the Ministry of Environment, Science and Technology. The activities of the Centre for
Scientific Research into Plant Medicine are supported through the Ministry of Health whereas
the public universities, including KNUST, obtain funding through the Ghana Education
Service (GES) and the Ghana Education Trust Fund (GETFund) facilitated by the National
Council for Tertiary Education (NCTE).
Government subvention for the public universities covers mainly emoluments, administration
and service, staff development and training with little left for research. Universities therefore
have to depend heavily on internally generated funds (IGFs) and strategic partners to obtain
the needed funding for R&D. KNUST, for instance, has benefitted from several such
collaborative efforts and research support from corporate organisations and foreign donors.
IGFs are made up of school fees, income from semi-commercialised units, such as the
University Printing Press, university hospital, photocopy unit, guesthouses and shuttle services.
The breakdown of the university’s sources of income in terms percentages are as follows:
• Public funding from government subvention = 55.56%
• Private funding = 37.85%
• Investments = 06.59% (KNUST budget, 2017)
Figure 4.10 Funding sources for KNUST. Source: KNUST budget (2017)
55%38%
7%
Public Funding from governmentsubvention
Private Funding
Investments
Stellenbosch University https://scholar.sun.ac.za
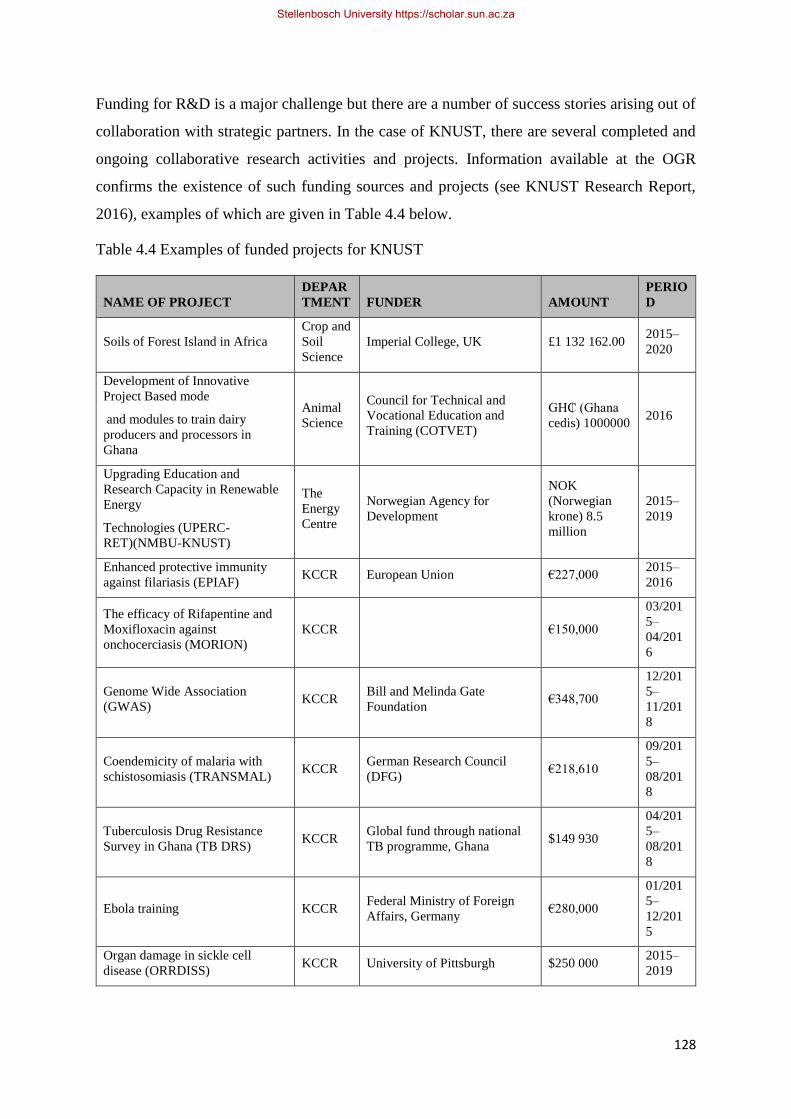
128
Funding for R&D is a major challenge but there are a number of success stories arising out of
collaboration with strategic partners. In the case of KNUST, there are several completed and
ongoing collaborative research activities and projects. Information available at the OGR
confirms the existence of such funding sources and projects (see KNUST Research Report,
2016), examples of which are given in Table 4.4 below.
Table 4.4 Examples of funded projects for KNUST
NAME OF PROJECT
DEPAR
TMENT FUNDER AMOUNT
PERIO
D
Soils of Forest Island in Africa
Crop and
Soil
Science
Imperial College, UK £1 132 162.00 2015–
2020
Development of Innovative
Project Based mode
and modules to train dairy
producers and processors in
Ghana
Animal
Science
Council for Technical and
Vocational Education and
Training (COTVET)
GH₵ (Ghana
cedis) 1000000 2016
Upgrading Education and
Research Capacity in Renewable
Energy
Technologies (UPERC-
RET)(NMBU-KNUST)
The
Energy
Centre
Norwegian Agency for
Development
NOK
(Norwegian
krone) 8.5
million
2015–
2019
Enhanced protective immunity
against filariasis (EPIAF) KCCR European Union €227,000
2015–
2016
The efficacy of Rifapentine and
Moxifloxacin against
onchocerciasis (MORION)
KCCR €150,000
03/201
5–
04/201
6
Genome Wide Association
(GWAS) KCCR
Bill and Melinda Gate
Foundation €348,700
12/201
5–
11/201
8
Coendemicity of malaria with
schistosomiasis (TRANSMAL) KCCR
German Research Council
(DFG) €218,610
09/201
5–
08/201
8
Tuberculosis Drug Resistance
Survey in Ghana (TB DRS) KCCR
Global fund through national
TB programme, Ghana $149 930
04/201
5–
08/201
8
Ebola training KCCR Federal Ministry of Foreign
Affairs, Germany €280,000
01/201
5–
12/201
5
Organ damage in sickle cell
disease (ORRDISS) KCCR University of Pittsburgh $250 000
2015–
2019
Stellenbosch University https://scholar.sun.ac.za
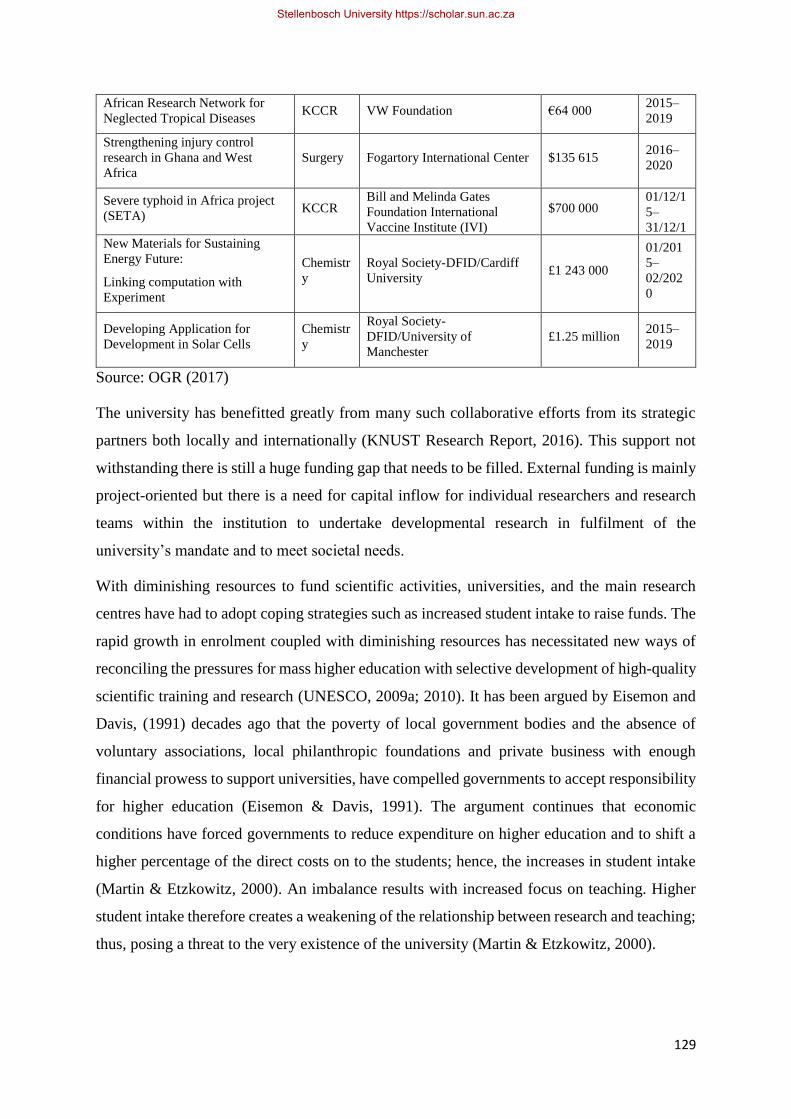
129
African Research Network for
Neglected Tropical Diseases KCCR VW Foundation €64 000
2015–
2019
Strengthening injury control
research in Ghana and West
Africa
Surgery Fogartory International Center $135 615 2016–
2020
Severe typhoid in Africa project
(SETA) KCCR
Bill and Melinda Gates
Foundation International
Vaccine Institute (IVI)
$700 000 01/12/1
5–
31/12/1
7 New Materials for Sustaining
Energy Future:
Linking computation with
Experiment
Chemistr
y
Royal Society-DFID/Cardiff
University £1 243 000
01/201
5–
02/202
0
Developing Application for
Development in Solar Cells
Chemistr
y
Royal Society-
DFID/University of
Manchester
£1.25 million 2015–
2019
Source: OGR (2017)
The university has benefitted greatly from many such collaborative efforts from its strategic
partners both locally and internationally (KNUST Research Report, 2016). This support not
withstanding there is still a huge funding gap that needs to be filled. External funding is mainly
project-oriented but there is a need for capital inflow for individual researchers and research
teams within the institution to undertake developmental research in fulfilment of the
university’s mandate and to meet societal needs.
With diminishing resources to fund scientific activities, universities, and the main research
centres have had to adopt coping strategies such as increased student intake to raise funds. The
rapid growth in enrolment coupled with diminishing resources has necessitated new ways of
reconciling the pressures for mass higher education with selective development of high-quality
scientific training and research (UNESCO, 2009a; 2010). It has been argued by Eisemon and
Davis, (1991) decades ago that the poverty of local government bodies and the absence of
voluntary associations, local philanthropic foundations and private business with enough
financial prowess to support universities, have compelled governments to accept responsibility
for higher education (Eisemon & Davis, 1991). The argument continues that economic
conditions have forced governments to reduce expenditure on higher education and to shift a
higher percentage of the direct costs on to the students; hence, the increases in student intake
(Martin & Etzkowitz, 2000). An imbalance results with increased focus on teaching. Higher
student intake therefore creates a weakening of the relationship between research and teaching;
thus, posing a threat to the very existence of the university (Martin & Etzkowitz, 2000).
Stellenbosch University https://scholar.sun.ac.za
130
4.5 Conclusion
The demand on universities for relevance and accountability, the quest by researchers for career
progressing, and, to some extent, the need to solve societal challenges and influence policy
have led to some significant increases in the research output of KNUST over the past five years
(2013 - 2017). Despite some indication of a drop in the production of knowledge across the
colleges at certain times, the overall picture shows a gradual increase in research production in
the past five to six years (2013-2017). Data from the QAPU was corroborated to some extent
by bibliometric analysis using Scopus and SciVAl.
Research must be available in the first place before thinking about how uptake and utilisation
can take place. With the availability of some research in the university, the next step is to
examine the issue of uptake and utilisation and the activities that lead to that. From Scopus and
SciVal, we noticed some level of citation of publications, which to some extent is an indication
of research use. The essence of the study was to look at the mechanisms in place and those
absent, and then to then fashion a framework for institutionalising RU. KNUST researchers
engage in varied fields of research, so it was envisaged that there would be varied modes of
knowledge production as well as extent of utilisation.
From the foregoing discussion, the availability of research was clear, but many questions
remain unanswered regarding which kind of research, the focus, whether the research findings
have the potential for uptake, whether the research findings are targeted at any specific external
audiences or stakeholders, and what the levels of engagement are. These questions are
addressed in Chapters 7 and 8.
CHAPTER 5 – RESEARCH DESIGN AND METHODS
5.1 Justification
Recent developments in sub-Saharan Africa have necessitated surveys leading to efforts at
building capacity for RU and RUM at individual and institutional level. We have outlined
findings from surveys conducted under the DRUSSA programme to help identify how
universities in sub-Saharan Africa currently approach or manage RU. The surveys sought to
identify any current structures and processes that may be in place, both formally or informally,
highlighting examples of good practice and noting any areas that the university feels could be
strengthened (DRUSSA, 2012). Beyond what was discovered by DRUSSA, this current
Stellenbosch University https://scholar.sun.ac.za
131
research set out to explore best practice, theories, frameworks and strategies from the literature
in order to adapt an analytical framework that had to form the basis for a survey that will enable
the design of a strategic framework for institutionalising RU. This chapter provides justification
for the conceptual framework, outlines the key issues and focus areas, and provides for the
research design in three phases, including adaption of a framework for the analysis.
In order to achieve the overarching aim of this study a conceptual framework which addresses
the question of how an organisation could transfer its knowledge more effectively to users and
stakeholders is necessary. The framework defines its objective in terms of its research focus,
its users, by whom and how its knowledge is transferred, and the expected outcome (Lavis &
Robertson, 2003). Taking these into consideration, the conceptual framework paves the way
for an organisational strategic framework for an RU and RUM strategy that may also be
relevant and applicable to the broader HE setting and other research institutions.
A selected research utilisation conceptual framework was intended to provide an opportunity
for comparing what already exists against what is proposed by various authors in order to tailor-
make one that is contextually applicable. Already existing knowledge in the field of KU can
be tested and validated against views sampled from academics and research staff as well as
top-level management staff. In order to achieve objective 5 of this study (see sub-section 1.4)
a validation process in this context had to involve both internal and external stakeholders of
KNUST.
The conceptual framework is the starting point for reflecting on the content of the study,
providing understanding of RU and RUM within the KNUST context and how it can be
communicated effectively. Accordingly, the reflections can be reviewed and reformed for
further investigation. The next section reports on the key issues and areas of focus as discussed
in the literature (sub-section 3.5.3) which enabled the design of an appropriate research method
and the development of the primary data gathering survey instrument, to direct the collection
and analysis of relevant data, which in turn, directed the proposed final strategic framework.
5.2 Key issues and focus
This section considers a range of areas and key issues raised in the previous chapters that
needed to be considered during the design of the conceptual framework.
The way the author arrived at answers to the research questions have been addressed with the
research objectives in mind. This author believes that, in determining the type of research
suitable for local, national and general development, one needs to review national development
Stellenbosch University https://scholar.sun.ac.za
132
plans. Following that, we could determine our research focus and purpose as well as the kind
of stakeholders with whom to engage. Mouton’s (2012) recommendation to acknowledge the
different adoption pathways provided pointers to the possible modes and pathways for research
utilisation and also how the planning of an RU strategy for KNUST had to be done. RU
activities and the context of application differ depending on the scientific field, and these have
implications to the essential elements for uptake (Mouton, 2012). The survey therefore had to
cover researchers from various fields across the six colleges of the university. These colleges
engage in different modes of research in various disciplines.
Knowledge production and dissemination activities ought to be evaluated, but how they are
evaluated is affected by the differences in modes of production and the discipline (Mouton’s)
(2012) principles. A critical look at the different approaches to RU for different fields was
therefore necessary. The current research was designed to consider the key capacity gaps,
barriers and facilitators to RU, and how these influence research activities.
From the literature (see Chapter 2), it was established that RU and RUM can be carried out
effectively if it is made an integral part of the institutional culture. In order to create this culture,
one needs an RU framework that encompasses processes, such as knowledge generation,
knowledge adaptation, knowledge dissemination, knowledge reception, knowledge adoption
and then finally knowledge utilisation (Becheikh et al., 2010). From these, we identify
opportunities that define the research question, conducting the research and publishing the
results. These processes take us through some pathways and approaches to knowledge
production and utilisation. In line with objectives 1 and 3 (see sub-section 1.4), we reviewed
existing plans for RU at KNUST and also sought to identify existing modes and pathways for
which RU can be facilitated. An appropriate survey instrument designed for research active
staff would seek to establish which of the common approaches in the KU process, namely the
interactive or connection approach and the collaborative approach (Landry et al., 2001;
Sudsawad, 2007) are being practiced or have the potential for adoption (Sudsawad, 2007). A
documentary review was therefore necessary to solicit answers to questions that seek to
determine areas of local and national and national needs where KNUST could play a role.
It has been established that, apart from facilitators to KU, there are certain barriers that needed
to be considered in the strategic approach to KU (Humphries, 2014; Oliver et al., 2014). These
barriers and facilitators had implications for the intended strategic approach of this current
study. Some strategic approaches found from the literature included: effective planning,
dissemination, execution and M&E. An institutional strategy had to be facilitated through the
Stellenbosch University https://scholar.sun.ac.za
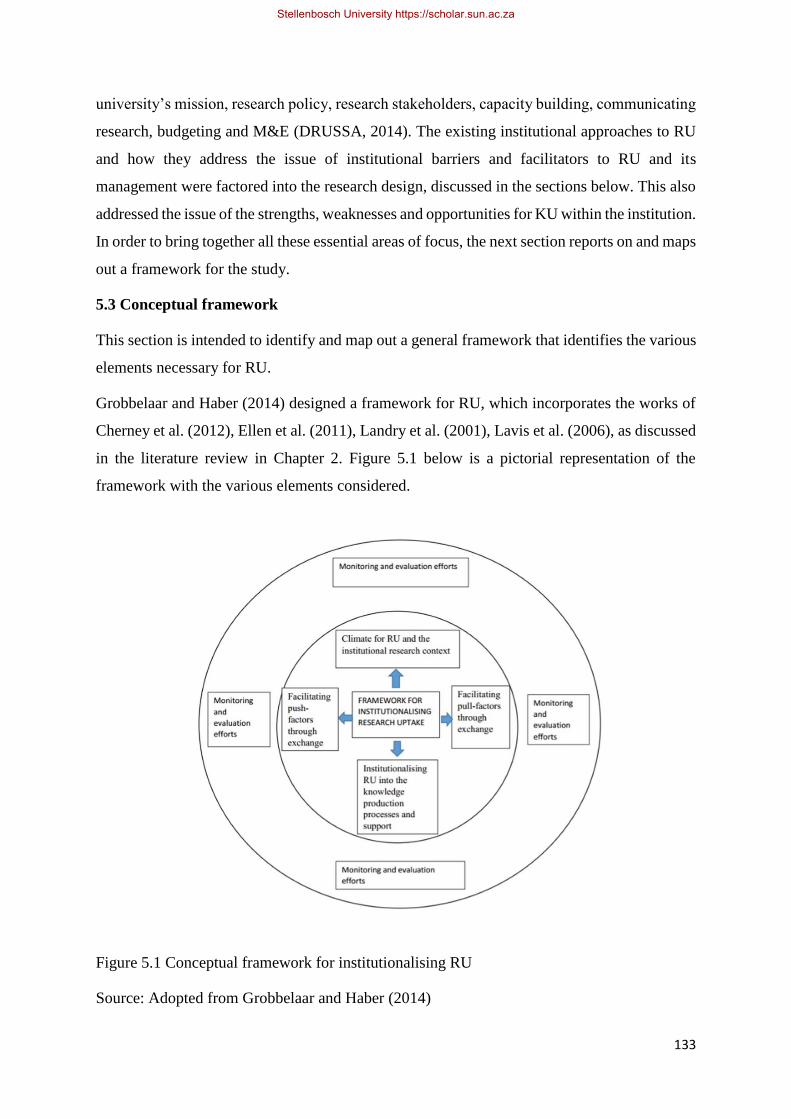
133
university’s mission, research policy, research stakeholders, capacity building, communicating
research, budgeting and M&E (DRUSSA, 2014). The existing institutional approaches to RU
and how they address the issue of institutional barriers and facilitators to RU and its
management were factored into the research design, discussed in the sections below. This also
addressed the issue of the strengths, weaknesses and opportunities for KU within the institution.
In order to bring together all these essential areas of focus, the next section reports on and maps
out a framework for the study.
5.3 Conceptual framework
This section is intended to identify and map out a general framework that identifies the various
elements necessary for RU.
Grobbelaar and Haber (2014) designed a framework for RU, which incorporates the works of
Cherney et al. (2012), Ellen et al. (2011), Landry et al. (2001), Lavis et al. (2006), as discussed
in the literature review in Chapter 2. Figure 5.1 below is a pictorial representation of the
framework with the various elements considered.
Figure 5.1 Conceptual framework for institutionalising RU
Source: Adopted from Grobbelaar and Haber (2014)
Stellenbosch University https://scholar.sun.ac.za

134
This framework covers important areas that need attention as far as the issue of RU and its
management is concerned. It is worth noting that M&E efforts, as portrayed in the diagram, are
necessary for each element and should be carried out at each stage of the RU process. For the
purposes of this study it was necessary to adapt an analytical framework suitable for the
university environment to guide the analysis of data obtained from the survey and subsequent
interviews.
Along the lines of the above conceptual framework a similar framework for analysing the
transformational pathway of the university environment was developed by Grobbelaar and De
Wet (2013). This analytical framework provides a scheme towards the analysis of institutional
change aimed at achieving the university’s mission. The range of areas includes the choice of
mechanisms, facilitators to change in addition to the form and focus of specific activities, as
discussed in section 2.5.10. The visual aid, presented in Figure 5.2, which summarises the
change process for the university was adopted as the analytical framework for this study.
5.4 Analytical framework
For the purposes of our survey, we adopted the framework below.
Figure 5.2: Framework for the analysis of the transformation pathway of the university
environment. Copied from Grobbelaar and De Wet (2013:7)
Stellenbosch University https://scholar.sun.ac.za

135
The above analytical framework illustrated in Figure 5.2 served as the main framework for
analysis in this study in other to propose a framework suitable for RU within the context of the
study. This current study however, established connections between the two frameworks,
Figure 5.1 and Figure 5.2, that broadened the scope of the survey and therefore the analysis.
The climate for RU and the institutional context examined along the lines of the ecology and
external drivers of focus defines and outlines activities aimed at making the university relevant.
This includes the university having a strategic vision with set goals to pursue its mission. The
needed culture, context and policies that govern the operations of the university should also be
in place since they have implications for its relevance. Provision should be made in any
strategic framework towards addressing barriers, such as a lack of appropriate policies and
capacity for RU. The various capacities that needed to be developed along the lines of the above
elements of the analytical framework are listed in Table 5.1 below.
Table 5.1: Key capacities to be developed
Framework
component
Capacity To be developed
1 External environment – the
ecology and external drivers of
focus
Build capacity for a liaison with the requisite
skills to serve as an intermediary between the
university, industry and government.
2 Internal drivers of focus Build capacity in knowledge dissemination and
lobbying for funding.
3 Barriers to change: institutional
capacity
Development of leadership capabilities to link
academic activities
4 Changing control and
governance of university
Training leaders or academics in governance
mechanisms to build synergy between teaching,
research and engagement. Training M&E
specialists to carry out M&E.
5 Changes in form and focus of
teaching
Development of relevant skills, continuous
education and multi- and trans-disciplinary
training
6 Changes in form and focus of
knowledge production and
dissemination
Training in trans-disciplinary research
approaches including dissemination, policy,
advocacy and management
7 Changes in forms and focus of
interaction and engagement
Skills training in multi-stakeholder initiatives for
effective public engagement
Stellenbosch University https://scholar.sun.ac.za

136
The control and governance of the university, the form and focus of teaching, the form and
focus of knowledge production and dissemination and the changes in form and focus of
interaction and engagement all have significant influence on the climate for research utilisation
(Grobbelaar & De Wet, 2013). In line with objective 1, the review of scholarly works lent
credence and provided support for these elements of the frameworks.
Institutionalising RU into the knowledge production process and support is aimed at promoting
internal drivers of change (Grobbelaar & De Wet, 2013). The organisational processes within
the university should aim at institutionalising RU activities into the institution’s research cycle.
The likely barriers to the knowledge production process and dissemination include policy-
related changes, the institutional structure and engagement activities (Carden, 2009; CHSRF,
1999a; 1999b; Grimshaw & Eccles, 2012; Mitton et al., 2007). When RU is integrated into the
institutional research cycle, it will affect the training and acquisition of skills (form and focus
of teaching) (Grobbelaar & De Wet, 2013). The university’s engagement practices with its
stakeholders would also be influenced positively if the processes for knowledge production
and dissemination are well integrated into the institutional processes. The plans for RU and
pathways as sought by objectives 2 and 4, the need to identify the current modes and pathways
for RU in answer to research question 2, and the way RU is currently managed according to
research question 4, could be addressed considering these particular elements.
Among the factors that make the university relevant are the push factors, how the university
engages policymakers and government (Grobbelaar & De Wet, 2013). This adds to the
relevance of the university. All policy-related changes and engagement practices must be in
place to facilitate this. Training and acquisition of relevant skills, engagement with the
community and other stakeholders are all push factors that must be taken into consideration
(Grobbelaar & De Wet, 2013). A survey was necessary to ascertain these facts and also to
identify any possible barriers to the push factors. Objective 4 and research question 5 on how
best to facilitate RU and the essential elements needed for any RU strategy were considered
among the push factors necessary for optimal RU.
Conditions that promote demand for research (pull factors) in effect promote drivers for change
and relevance (Landry et al., 2001). These are also policy-dependent and they require structural
changes. The governance of the institution is therefore a critical issue. In addition, how the
university positions itself to market its research is also essential. The form and focus of industry
as a major stakeholder have the potential of influencing the demand for research and therefore
the need for the university to determine the possible barriers and work towards overcoming
Stellenbosch University https://scholar.sun.ac.za
137
them. Further exploration of the strengths and opportunities for KU along with the key capacity
gaps at both individual and institutional level needed attention in achieving objective 3 and in
answer to research question 6.
Finally, there was the need for M&E of all these processes to ensure a possible modification
and adjustment of the RU processes. The internal and external drivers of change, the
governance of higher education, the form and focus of teaching, the form and focus of industry
and community engagement require regular reviews at institutional level in order to evaluate
the effectiveness of the RU activities (Grobbelaar & De Wet, 2013). At the stage of M&E, one
is able to validate any strategic framework according to its effectiveness in achieving maximum
impact. Again, the barriers and facilitators of RU and utilisation were examined critically and
necessary remedial measures suggested. This last section provided an answer to research
question 3.
In concluding this section, we note that these elements are an essential component of a
framework for an RU strategy. The analysis provided benchmarks and pointers for the survey
to explore further and arrive at concrete conclusions within the context of the study. What to
look out for and the appropriate questions to be asked all depended on the analytical framework.
In the end, we arrived at answers to the research questions and hence the main objectives of
the study.
5.5 Overarching research design mapping exercise
This section maps out the overarching plan for the research. Here we link the research questions
to the framework components as given in Table 5.2 below.
Stellenbosch University https://scholar.sun.ac.za
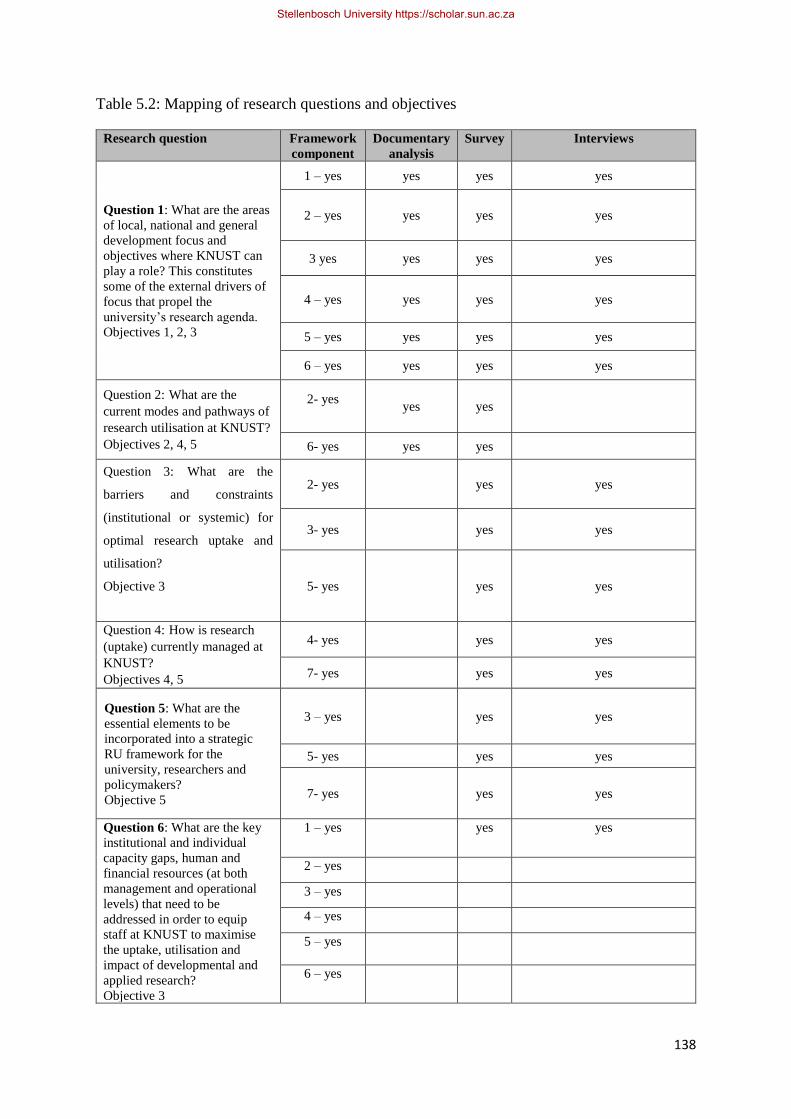
138
Table 5.2: Mapping of research questions and objectives
Research question Framework
component
Documentary
analysis
Survey Interviews
Question 1: What are the areas
of local, national and general
development focus and
objectives where KNUST can
play a role? This constitutes
some of the external drivers of
focus that propel the
university’s research agenda.
Objectives 1, 2, 3
1 – yes yes yes yes
2 – yes yes yes yes
3 yes yes yes yes
4 – yes yes yes yes
5 – yes yes yes yes
6 – yes yes yes yes
Question 2: What are the
current modes and pathways of
research utilisation at KNUST?
Objectives 2, 4, 5
2- yes
yes yes
6- yes yes yes
Question 3: What are the
barriers and constraints
(institutional or systemic) for
optimal research uptake and
utilisation?
Objective 3
2- yes yes yes
3- yes yes yes
5- yes yes yes
Question 4: How is research
(uptake) currently managed at
KNUST?
Objectives 4, 5
4- yes yes yes
7- yes yes yes
Question 5: What are the
essential elements to be
incorporated into a strategic
RU framework for the
university, researchers and
policymakers?
Objective 5
3 – yes yes yes
5- yes yes yes
7- yes yes yes
Question 6: What are the key
institutional and individual
capacity gaps, human and
financial resources (at both
management and operational
levels) that need to be
addressed in order to equip
staff at KNUST to maximise
the uptake, utilisation and
impact of developmental and
applied research?
Objective 3
1 – yes yes yes
2 – yes
3 – yes
4 – yes
5 – yes
6 – yes
Stellenbosch University https://scholar.sun.ac.za
139
5.6 Survey instrument framework
As a follow-up to the above mapping exercise, this section outlines how the framework was
applied in the document analysis, developing the survey questions and carrying out the
interviews. The interviews were intended to clarify and give further feedback obtained from
the survey. It was therefore targeted at the same people who took part in the survey and it was
intended to be a face-to-face activity. Details of how the analysis of the document review,
survey and interviews was carried are described in the sub-sections below.
5.6.1 Document analysis
This sub-section outlines how the document review was carried in order to arrive at answers to
some of the research questions. It also explains how we teased out information to direct the
focus in analysing the content of existing documents necessary for the scheme of work.
We first outline the criteria for the selection of documents; second, justify the choice of
document; and third, discuss the scientific method behind the document review, how the
information was obtained and provided justification for the information. Existing documents
and Internet sources were consulted for relevant information.
Documentary review was carried out on official university documents such as recorders
(official policy and/or decision documents of the university published from time to time),
reports, policy documents and journals. Also available for review were government records in
the form of projections, plans and reports, which were not classified and were available in print
and online. This was with the view to examine external drivers of focus as far as policies,
mission and vision were concerned. These external drivers of focus have implications for the
university’s research activities. The document review helped to identify the changes in focus
and governance of the university. The aspects of change driven by control and governance
through policies (Grobbelaar & Kirkland, 2013) could also be identified. The appropriate
climate for RU and the right institutional culture demanded that organisational processes such
as mission, vision, goals and policies that support RU be in place (Grobbelaar & Harber, 2014).
Moreover, the existence of M&E efforts aimed at ensuring the effectiveness of any existing
RU activities could be ascertained through a document review.
To increase the level of accuracy the documentary review was carried out using the data
triangulation method (Lauri, 2011). With this, information is cross-verified from other sources
in order to ascertain its veracity. For example, in order to consider how the university could
play a role in national development, it was necessary to look at what the university had set out
Stellenbosch University https://scholar.sun.ac.za

140
to do as far as its aims and objectives were concerned. These objectives were then compared
to national projections and policies regarding developmental projects in order to match them
up. These pieces of information could then be compared with existing trends.
It was fairly easy to quantify the data and information obtained, and this could be used to
contrast this research with other research. The analysis of such quantitative data was more
specific in helping to create new theories and test existing hypotheses.
The university has three main sources of information as far as research publication is
concerned, namely the Journal of Science and Technology (JUST), the Technocrat Magazine
and the quality Assurance bulletins. These are the main sources available for staff to publish
their research internally. JUST aims primarily to publish articles resulting from original
research – pure or applied – in the various aspects of academic endeavour, broadly classified
as science (physical or biological), technology and the humanities. JUST also publishes
technical notes and reviews. Technical notes give opportunity to present preliminary but
meaningful results on how certain problems are solved. Reviews give opportunity to experts to
provide readers with a thorough review and analysis of issues in a subject area of relevance.
Publications in JUST are not restricted to any particular college but covers all research
submitted by researchers across the colleges of the university. For an article to be published,
only those that are shortlisted and sent for external review end up being selected. To ensure
good-quality publication, the primary criterion is that these articles must contribute to the
advancement of knowledge in the respective fields. Articles submitted to other publishing
houses are not accepted although manuscripts published in un-refereed magazines, proceedings
or elsewhere may be accepted subject to satisfying the requirements for publishing in JUST
(Books and Publications Committee, 2015).
The Quality Assurance Bulletin of the Vice-Chancellor’s Office (QAPU, 2017) is an annual
compilation of all research that has taken place within the six colleges of the university. It does
not publish the details neither the abstracts of the research but merely provides a reference list
of all research titles carried out during the year under review. Therefore, to ascertain the quality
and details with reference to research in the Quality Assurance Bulletin there was a need to
refer to other documents either within or outside the university. The Technocrat Magazine, a
science and technology magazine, on the other hand, features some research works of staff of
the university but does not feature full academic articles. The criteria for selecting articles for
publication in the Technocrat Magazine are not as rigorous as those of JUST.
Stellenbosch University https://scholar.sun.ac.za
141
In order to validate the data and information from any of these three publications a cross-
verification was done from other sources. For example, data taken from the Quality assurance
basic statistics booklet (QAPU, Basic Statistics, 2017) was verified from the source, that is,
the college or department from where it originated. This was done with the view to strengthen
the current study and give more credibility and validity to the data. The data triangulation
method used in this case was therefore that of data source triangulation, in which case we used
data or information from different documents within the university. To validate some of the
information obtained from these documents further, the author carried out interviews involving
key personalities and researchers who had been involved directly with the data or information
gathering for the publication.
The adaptation of the data source triangulation method (Lauri, 2011) put the author in a position
to gain more insight into the information being gathered. This helped to reduce the margin of
error or the level of inadequacies as against using one data source. This method gave more
complementary, comprehensive, valid and verifiable data and information with fewer
inconsistencies.
The university documents that were used in this study were approved by the Academic Board
of the university and are published here by authority of the university. They therefore have the
necessary legal backing and thus can be relied upon as authentic data. That notwithstanding,
efforts were made to verify and authenticate all information used from these sources.
The element of the ecology and external drivers of focus comprise analysis of the extent of
involvement of the university in the national development planning and implementation
process, discussed in Chapter 6 of the study. This informed what to look out for in the
documents that were reviewed providing answers to the research questions and objectives as
outlined in the framework. The first research question (see sub-section 1.4) had to do with
national and local development plans where the university could play a role. In the document
review, we looked out for sector-specific research areas within the university and matched
those with national and local research objectives. In the case of the university, the Quality
Assurance Bulletin and JUST were good sources of information. Nationally, the National
Development Planning Commission (NDPC) had documented plans and reports that contained
the national and local developmental needs and goals (NDPC, 2006; NDPC, 2014). For
example, in the agricultural sector, pest-resistant crops are a problem to local farmers as well
as at national level. The Ministry of Agriculture hopes to resolve such challenges among others.
We therefore considered the preparedness of the university to help resolve this challenge by
Stellenbosch University https://scholar.sun.ac.za
142
looking out for agriculture-related research within the university that are applicable to national
needs. We also considered research publications with the potential for uptake at national and
local level. In effect, we hoped to find answers to what the local and national research needs
are and what the university is currently doing or is capable of doing to address these national
needs.
The table below presents a summary of how the document review was carried out with
particular reference to the research questions, areas of focus, what we looked out for and how
these contributed to the study.
5.6.1.1 Source 1: Document analysis
Table 5.3 below provides a summary of document review necessary for research questions 1,
2 and 4.
Stellenbosch University https://scholar.sun.ac.za
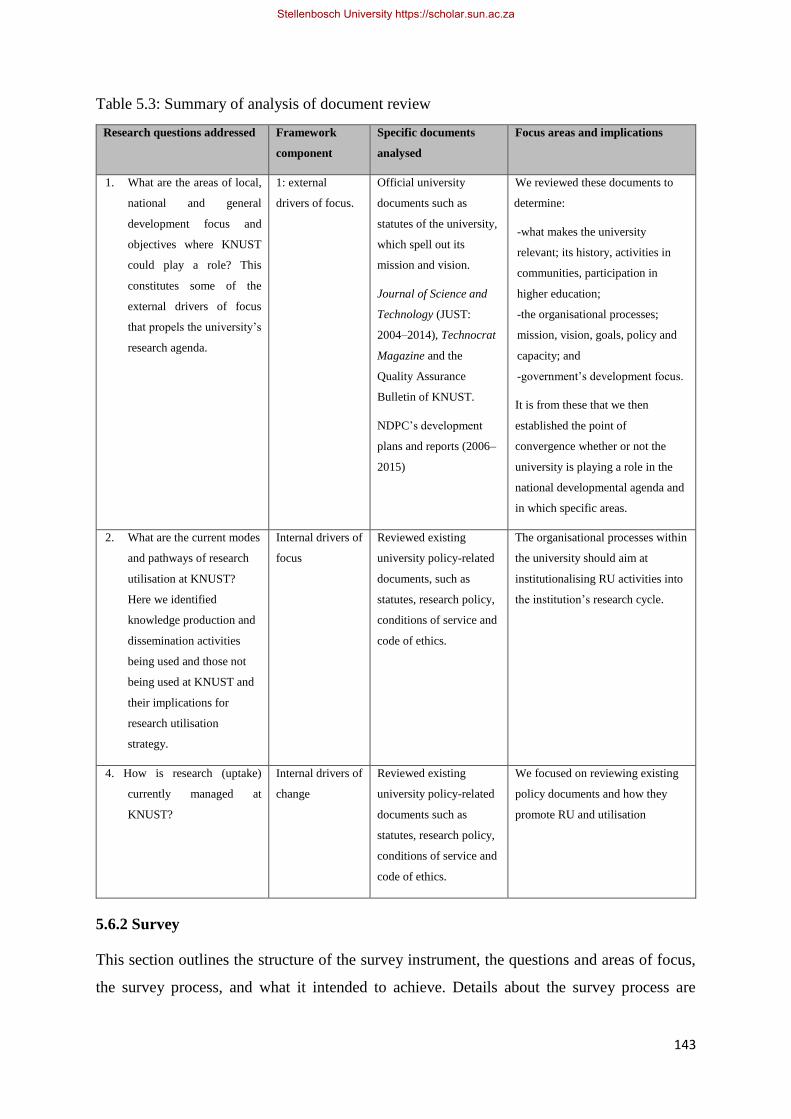
143
Table 5.3: Summary of analysis of document review
Research questions addressed Framework
component
Specific documents
analysed
Focus areas and implications
1. What are the areas of local,
national and general
development focus and
objectives where KNUST
could play a role? This
constitutes some of the
external drivers of focus
that propels the university’s
research agenda.
1: external
drivers of focus.
Official university
documents such as
statutes of the university,
which spell out its
mission and vision.
Journal of Science and
Technology (JUST:
2004–2014), Technocrat
Magazine and the
Quality Assurance
Bulletin of KNUST.
NDPC’s development
plans and reports (2006–
2015)
We reviewed these documents to
determine:
-what makes the university
relevant; its history, activities in
communities, participation in
higher education;
-the organisational processes;
mission, vision, goals, policy and
capacity; and
-government’s development focus.
It is from these that we then
established the point of
convergence whether or not the
university is playing a role in the
national developmental agenda and
in which specific areas.
2. What are the current modes
and pathways of research
utilisation at KNUST?
Here we identified
knowledge production and
dissemination activities
being used and those not
being used at KNUST and
their implications for
research utilisation
strategy.
Internal drivers of
focus
Reviewed existing
university policy-related
documents, such as
statutes, research policy,
conditions of service and
code of ethics.
The organisational processes within
the university should aim at
institutionalising RU activities into
the institution’s research cycle.
4. How is research (uptake)
currently managed at
KNUST?
Internal drivers of
change
Reviewed existing
university policy-related
documents such as
statutes, research policy,
conditions of service and
code of ethics.
We focused on reviewing existing
policy documents and how they
promote RU and utilisation
5.6.2 Survey
This section outlines the structure of the survey instrument, the questions and areas of focus,
the survey process, and what it intended to achieve. Details about the survey process are
Stellenbosch University https://scholar.sun.ac.za
144
provided as well as the target audience and questions asked. A structured campus survey, which
involved the administration of questionnaires and structured interviews involving academic
staff (lecturers and research fellows), was carried out at KNUST.
There were three categories of staff, comprising:
• senior members (lecturers or research fellows, senior lecturers, professors and their
equivalents of administrative and professional staff);
• senior staff (mainly first-degree holders who serve as administrative assistants and
junior technicians); and
• junior staff. (made up of secondary school leavers and below)
Our focus was on those who were expected or required to undertake research. The survey
sought to solicit the input of staff to ascertain the mechanisms and activities necessary for RU.
Structured questionnaires were used to solicit inputs from academic and research staff. As a
follow-up to the survey, interviews were conducted for selected categories of research staff in
order to validate the inputs from the survey.
Pilot testing of the questionnaires was carried out to ascertain possible misconceptions. In terms
of data coverage, only a sample of the staff of the university was covered. All information
about this target population was available and could be accessed with permission.
Electronically designed questionnaires were therefore administered to over 600 staff
comprising academics and research fellows. The design of the questionnaire focused on
stakeholder identification and engagement, channels and mechanisms of engagement,
importance and benefits of engagement, and the barriers and facilitators to RU.
From the research questions, the survey instrument teased out existing knowledge production
and dissemination activities within KNUST and also identified some knowledge production
practices outlined in the literature but not being used at KNUST. This was with the view to
establish existing modes and pathways to research utilisation. Besides, the instrument was also
intended to establish and confirm the barriers, constraints and facilitators for optimal research
utilisation and how these can be addressed.
In view of the above, respondents to the survey had to address questions like:
• What kind of stakeholders or audiences do you engage with? In order words which
stakeholders directly or indirectly do you involve in your research activities?
• What are your channels or mechanisms of engagement with these stakeholders? At
what stage of your research do you involve your stakeholders?
Stellenbosch University https://scholar.sun.ac.za

145
• What are the benefits of stakeholder engagement?
• What do you consider as the major constraints to research uptake?
These were some of the questions that were asked and, in most cases, follow-up questions were
added in order to obtain unambiguous answers. These questions helped unearth, among others,
the nature and scope of knowledge production, different approaches to RU in different fields
of study, the barriers, constraints and facilitators to RU, and how these influence research
activities.
The nature and level of knowledge production, research activities and the form and focus of
teaching were uncovered through this structured survey covering academics expected or
required to engage in research activities. Appropriate questions to elicit responses unearthed
how academics and researchers go about research activities, including determination of the
content of academic programmes. The ecology as well as external and internal drivers of focus
was addressed by looking at the university’s community engagement programmes along the
lines of its vision and mission. This researcher conducted an interview with the operators of
the Vice-Chancellor’s Community Impact Programme to obtain some insight into its activities.
The university’s engagement with the external environment, particularly communities and
stakeholders, was examined at this point. Other issues relating to history, participation in higher
education, enrolment gap, poverty and income levels were extracted from existing documents.
As indicated, the university statutes, policy documents and journals were good sources of
information because they are legally approved and published by authority of the university.
Policy-related changes and structure were also considered here.
The element of the form and focus of teaching and knowledge production led us to establish
how the university works with local enterprises and communities. Once we had determined
this through our survey, we arrived at an answer to the question on the pathways of RU and
knowledge production activities at the time of this research. The form and focus of knowledge
production and dissemination enhances the developmental role of the university and thus
provided pointers to the essential elements to be incorporated into the RU strategy framework.
These two elements moreover led us to determine how RU was managed at the university at
the time of this research. With regard to the systemic and institutional barriers to RU, we looked
at the element of barriers and changes in control of governance of the university. Here, the
appropriate survey questions as outlined above had to tease out existing barriers or constraints
to RU as well as the institutional capacity gaps that needed to be addressed. One constraint was
the availability of knowledge resources and extension activities for which a solution had to be
Stellenbosch University https://scholar.sun.ac.za

146
found. These have implications for the university’s engagement with the external environment
and stakeholders and thus the need to consider the element of the form and focus of industry
and community engagement.
The survey process comprised a combination of web-based and personal interviews covering
all six colleges of the university, namely CANR; College of Art and Built Environment,
College of Engineering, CHS, College of Humanities and Social Science, and COS. Together
these colleges run a total of 79 academic programmes across several fields. Since each college
runs programmes in different disciplines, the pathways to RU are likely to be different.
Capacities at institutional and individual level also vary from college to college. The main
focus however was on three out of the six colleges, namely CHS, CANR and COS. These
colleges have been at the forefront of most research with the potential for uptake. The Faculty
of Agriculture, for instance, has had significant influence on the nation’s economy through the
training of extension officers, development of crop varieties and advocacy for good agricultural
practices. Similarly, the CHS and COS through their graduates and research activities have also
had some impact on society. A survey across these colleges provided us the benefit of assessing
the context of application for knowledge production and RU activities in the various fields.
Academic and research staff in the colleges by the terms of their appointment have a
responsibility towards teaching, research and service to community. In addition, there are
research fellows, whose core mandate is research, working in the research centres attached to
each of the colleges. At the time of this research, there was a total of 1 121 senior members in
the university, comprising 987 academic senior members and 134 administrative and
professional senior members. The main target of the survey was to reach research-active
academic staff but a sample of the administrative and professional staff was necessary to
validate the outcome of the academic survey. The sampling plan involved targeting at least 300
research-active staff. A quota sample of at least 50 was selected from each of the six colleges,
with a proportionate sample picked from each department within the college. A response rate
of over 60% was expected due to the procedure adopted.
The main procedure for the survey was a web-based administration of a questionnaire.
However, in order to increase the response rate, eight carefully trained field assistants
(postgraduate students) went from college to colleges to administer the questionnaire. These
were adequately informed about the objectives of the survey so they could appreciate issues
relating to the respondent’s understanding of the questions. Equipped with a laptop and Internet
access, the field assistants could enter the responses directly into an Internet-based programme.
Stellenbosch University https://scholar.sun.ac.za
147
In most cases, the interview dates and meeting times were prearranged for the convenience of
the respondents. Questions ranging from stakeholder engagement, channels and mechanisms
of engagement, barriers and constraints to research activities and how these can be addressed
had to be responded to. It was required that respondents be given enough time to think through
their answers while follow-up questions were asked in order to determine the respondents’
understanding and interpretation of questions (Organisation for Economic Co-operation and
Development [OECD], 2012). An early pretesting of the survey, i.e. piloting, was carried out
with a small sample of 20 for identification of any possible weakness in the survey, and
subsequent refining of the instrument was done as proposed by OECD (2012) and Shelley
(2001). Table 5.5 below reflects a summary of the survey framework.
5.6.2.1 Ethical considerations
As is typical of such surveys, the necessary permission and approval was obtained from the
institution (Koivula et al., 2011). As already indicated, the samples used comprised mainly
university staff who have email addresses; hence, they were informed about the survey
electronically. The sensitivities of staff were taken into consideration and the survey was
carried out in accordance with laid-down principles of conduct. An effort was made to
guarantee and protect anonymity in administering the questionnaires and carrying out the
interviews. Participation in the survey was voluntary.
5.6.2.2 Source 2: Survey framework
The survey framework is as given in Table 5.4 below.
Stellenbosch University https://scholar.sun.ac.za
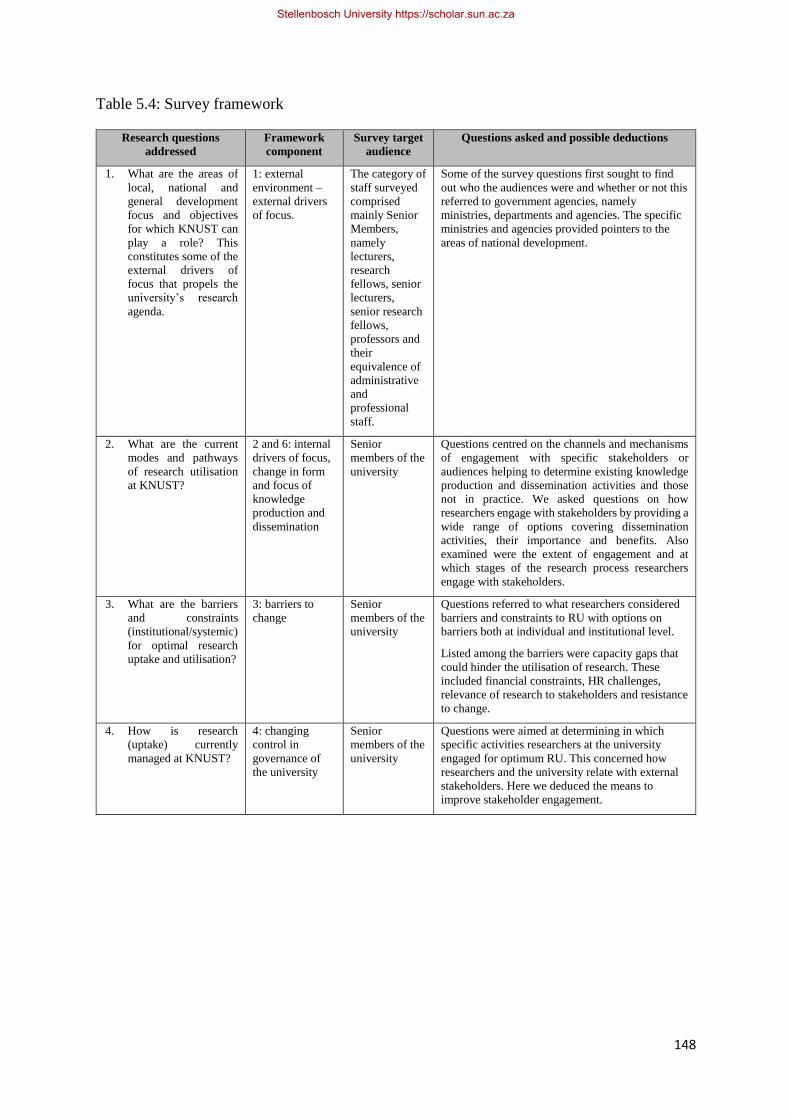
148
Table 5.4: Survey framework
Research questions
addressed
Framework
component
Survey target
audience
Questions asked and possible deductions
1. What are the areas of
local, national and
general development
focus and objectives
for which KNUST can
play a role? This
constitutes some of the
external drivers of
focus that propels the
university’s research
agenda.
1: external
environment –
external drivers
of focus.
The category of
staff surveyed
comprised
mainly Senior
Members,
namely
lecturers,
research
fellows, senior
lecturers,
senior research
fellows,
professors and
their
equivalence of
administrative
and
professional
staff.
Some of the survey questions first sought to find
out who the audiences were and whether or not this
referred to government agencies, namely
ministries, departments and agencies. The specific
ministries and agencies provided pointers to the
areas of national development.
2. What are the current
modes and pathways
of research utilisation
at KNUST?
2 and 6: internal
drivers of focus,
change in form
and focus of
knowledge
production and
dissemination
Senior
members of the
university
Questions centred on the channels and mechanisms
of engagement with specific stakeholders or
audiences helping to determine existing knowledge
production and dissemination activities and those
not in practice. We asked questions on how
researchers engage with stakeholders by providing a
wide range of options covering dissemination
activities, their importance and benefits. Also
examined were the extent of engagement and at
which stages of the research process researchers
engage with stakeholders.
3. What are the barriers
and constraints
(institutional/systemic)
for optimal research
uptake and utilisation?
3: barriers to
change
Senior
members of the
university
Questions referred to what researchers considered
barriers and constraints to RU with options on
barriers both at individual and institutional level.
Listed among the barriers were capacity gaps that
could hinder the utilisation of research. These
included financial constraints, HR challenges,
relevance of research to stakeholders and resistance
to change.
4. How is research
(uptake) currently
managed at KNUST?
4: changing
control in
governance of
the university
Senior
members of the
university
Questions were aimed at determining in which
specific activities researchers at the university
engaged for optimum RU. This concerned how
researchers and the university relate with external
stakeholders. Here we deduced the means to
improve stakeholder engagement.
Stellenbosch University https://scholar.sun.ac.za
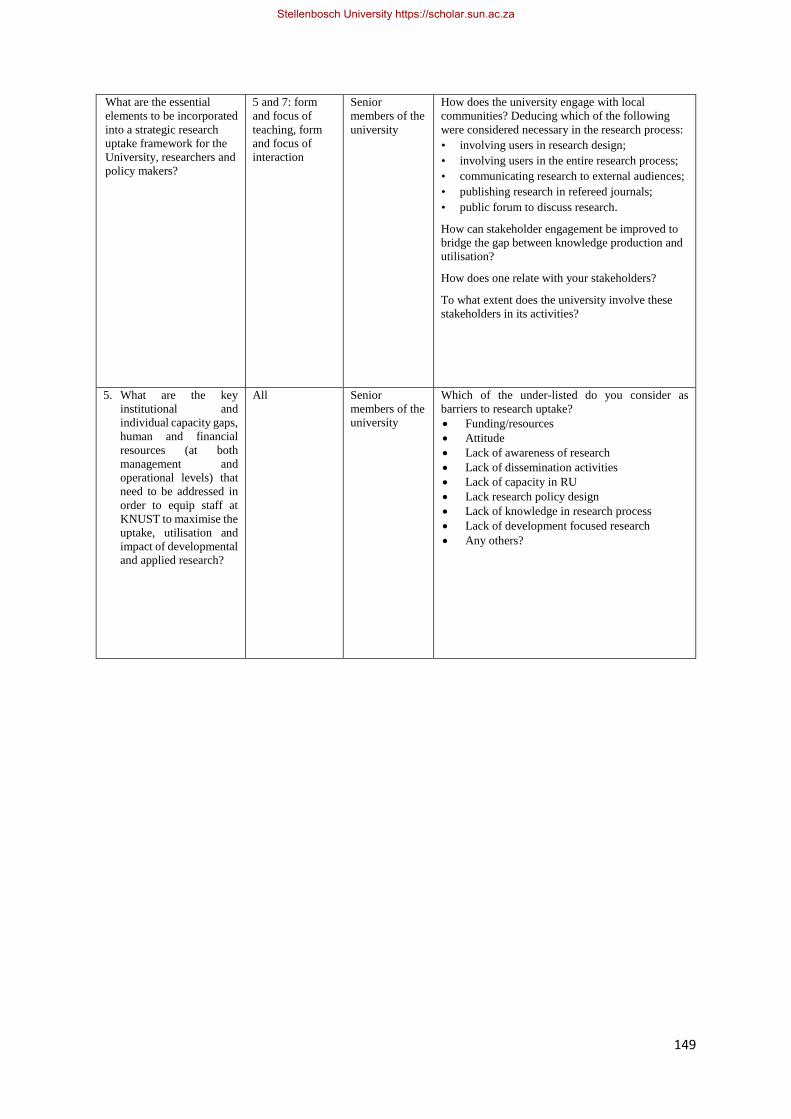
149
What are the essential
elements to be incorporated
into a strategic research
uptake framework for the
University, researchers and
policy makers?
5 and 7: form
and focus of
teaching, form
and focus of
interaction
Senior
members of the
university
How does the university engage with local
communities? Deducing which of the following
were considered necessary in the research process:
• involving users in research design;
• involving users in the entire research process;
• communicating research to external audiences;
• publishing research in refereed journals;
• public forum to discuss research.
How can stakeholder engagement be improved to
bridge the gap between knowledge production and
utilisation?
How does one relate with your stakeholders?
To what extent does the university involve these
stakeholders in its activities?
5. What are the key
institutional and
individual capacity gaps,
human and financial
resources (at both
management and
operational levels) that
need to be addressed in
order to equip staff at
KNUST to maximise the
uptake, utilisation and
impact of developmental
and applied research?
All Senior
members of the
university
Which of the under-listed do you consider as
barriers to research uptake?
• Funding/resources
• Attitude
• Lack of awareness of research
• Lack of dissemination activities
• Lack of capacity in RU
• Lack research policy design
• Lack of knowledge in research process
• Lack of development focused research
• Any others?
Stellenbosch University https://scholar.sun.ac.za
150
5.6.2.3 Sources of options to survey instruments
The sub-headings, A to F below provide a brief review of the literature sources for the various
options provided for in the questions of the survey instrument. Specifically, we list the
references from which the various options were derived as response categories for the survey
questions. As outlined in the literature review and other sections of the study, respondents were
provided with various options to questions in order to deduce specific aspects of research
activities in relation to specific audiences. The survey instrument was divided into six main
sections, details of which are discussed below.
A. Demographics
This first sub-section of the survey instrument consisted of nine demographic questions, which
sought to determine the title of researcher, his or her gender, year of birth, department, position,
highest educational qualification, where obtained and year obtained. These had direct
implications for knowledge production and dissemination activities, necessary for the purposes
of analysis. The gender of the respondent was necessary for us know the extent of involvement
by male and female academics. The year of birth gave us the age profile to determine active
age group and whether or not age has a role to play in research activities. The department of
the person gave the subject area of specialisation and this helped us know which subject area
had more research active academics than other at the time of this research, and which was
making more impact. In terms of position or status, it could be expected, for example, that a
professor, due to his or her experience would have a higher level of stakeholder engagement
than an inexperienced young or early career researcher. Academic qualifications determine the
area of specialisation, skills and focus of research and effectiveness in engagement activities.
This sub-section comprised questions 1–9, designed to give respondents the opportunity to
provide their background information.
B. Stakeholders of research
The second sub-section had just one component, which examined the kinds of stakeholders
with whom researchers interact or involve in their research and dissemination activities. The
specific question was, “What kind of stakeholders or audiences do you engage with? In other
words, which stakeholders directly or indirectly do you involve in your research activities?” A
five-point scale of responses (Always, Usually, Sometimes, Rarely and Never) was provided
for the options as derived from Sudsawad (2007), namely:
• communities (both within and outside the university);
Stellenbosch University https://scholar.sun.ac.za
151
• private sector (this included industry or large firms and SMMEs);
• government (ministries, departments and agencies [MDA]) and parastatals;
• researchers and scientists (this included other universities and research institutes); and
• non-governmental organisations (NGOs), such as charities and funders. Sudsawad
(2007) refers to these stakeholders as ‘user groups’ whose operational contexts,
attitudes and practices have implications for the extent of KU (Sudsawad, 2007).
Similarly, Grimshaw and Eccles (2012) in examining stakeholder awareness and use of
research evidence listed the following as users or stakeholders:
• policymakers;
• professionals;
• consumers;
• industry; and
• researchers (Grimshaw & Eccles, 2012).
We noted that these options fall directly in line with those of Sudsawad (2007) as the main
stakeholders with whom researchers have to do business.
The DRUSSA Benchmarking Survey reports 2014 and 2016 listed the following among the
stakeholders with whom universities frequently engage:
• government, ministries, departments and councils;
• research funders and donors;
• enterprise and industry;
• media agents;
• teachers and educators;
• farmers and agriculturists;
• health and medical professionals;
• publishers;
• Non-governmental organisations (NGOs), international non-governmental organisation
(INGOs) and international associations;
• other universities (domestically and internationally);
• informal sector; and
• environmental groups and agencies (DRUSSA, 2014; 2015).
It must, however, be noted that the extent of stakeholder relationships for each of the above
varies according to research type and areas of specialisation, as can be deduced from Section
Stellenbosch University https://scholar.sun.ac.za

152
A, on demographics. The survey question on the extent of stakeholder engagement was
intended to prioritise stakeholder relationships. Question 10 of the survey instrument therefore
sought to identify the key stakeholders of researchers and how often they interact with them.
The summary of the literature sources is provided in Appendix B.1.
C. Channels and mechanisms of engagement with communities
This third sub-section was intended to look at channels and mechanisms of engagement with
communities. The sub-section was divided into four components, namely channels of
engagement with communities, benefits of engagement with communities, stages of involving
communities, and barriers associated with RU as far as communities are concerned.
The first component required of respondents the channels and mechanisms through which they
engaged with communities around the university. A five-point scale of responses (Always,
Usually, Sometimes, Rarely and Never) was provided for the options adapted from Hood
(2002), Becheikh and Ziam (2010), Cherney et al. (2012) and DRUSSA (2014; 2015).
According to Cherney et al. (2012), research use is operationalised through a cumulated
process, progressing through stages, namely:
• Transmission – refers to means by which research is transmitted to various stakeholders
or audiences, for example social media, publication in journals, exhibitions, research
fairs, conferences and workshops (Becheikh & Ziam, 2010; Cherney et al., 2012; Hood,
2002).
• Cognition – refers to the stage where the research is understood by the stakeholder
groups to whom it was intended and therefore the likelihood of the research being used
is high (Cherney et al., 2012).
• Reference – refers to situations where the research is cited in reports and strategies.
• Effect – refers to where there are efforts to utilise the research.
• Influence – refers to where the research has influenced decisions and choices of end
users
• Application – refers to when the research is applied (Cherney et al., 2012)
Similarly, Hood (2002) argues that there are channels and mechanisms of dissemination with
the aim of getting research into use. These involve processes that consider the following:
• needs;
• context;
• prior experiences;
Stellenbosch University https://scholar.sun.ac.za
153
• values;
• beliefs of intended users;
• content;
• media;
• formats;
• language used; and
• activities of users (Hood, 2002).
Some of the specific channels and mechanisms include:
• exhibitions;
• publications in refereed journals;
• public forum;
• curriculum development;
• community-based research;
• community-based networks;
• adopting communities for research;
• use of social media; and
• drama or theatre.
Becheikh and Ziam (2010) also emphasise the determinants for knowledge use as attributes of
the transferred knowledge, actors in the knowledge transfer process and the transfer
mechanisms as outlined above.
The DRUSSA Benchmarking Report of 2014 outlined the priority mechanisms listed below to
engage with external stakeholders:
• collaborative research with other universities;
• industry or private sector representation on research boards and/or councils;
• government or public sector representation on research boards and/or councils;
• stakeholder consultations in setting the research agenda; and
• stakeholder consultations at the research dissemination stage (DRUSSA, 2014).
Broadly speaking, these priority mechanisms can be adapted to suit community-based
engagements. Specifically, we adapted the above mechanisms as follows:
• collaborative research with communities;
• community representation on research advisory boards and councils;
Stellenbosch University https://scholar.sun.ac.za

154
• involving communities in setting research the agenda; and
• consulting with or involving communities in research dissemination.
Research question 11 of the survey instrument therefore sought to determine which of the
above means researchers use in their engagement with communities around the university. The
summary is provided in Appendix C.1.
The second component of the survey sought to determine from respondents the benefits that
can be derived from engagement with communities. Here again, a five-point scale of responses
(Very beneficial, Somewhat beneficial, Of little benefit, Of no benefit and Not applicable) was
provided for the options as derived from Bozeman (2000), Jacobson et al. (2007), Sudsawad
(2007) and Cherney et al. (2012).
According to these authors, the operational context within which knowledge is transferred is
should be conducive enough to obtain positive results. Among the operational context were
attitudes, decision-making practices, access to information sources, stakeholder’s attitudes
towards researchers, experiences of researchers towards knowledge transmission,
compatibility of research to user groups or stakeholders, relationships between researchers and
user groups ( DRUSSA, 2014).
The expected benefits accruing from the above included chances that the research will be used
to solve problems, for modification of research, as opportunities for further research, to
influence policies and decisions of policymakers, to open avenues for collaboration, provide
opportunities for innovations and justification for funding as part of fulfilling their contract
agreement (Bozeman, 2000; Jacobson et al., 2007; Sudsawad, 2007). Question 12 of the survey
instrument sought to emphasise benefits that arise from engagement with communities. The
summary is provided in Appendix C.2.
The third component of the channels and mechanisms of engagement required of respondents
to indicate the stages at which they involve communities in their research process. A five-point
scale of responses (Always to Never) was provided for the various options. Researchers are
expected to involve stakeholders in their research process for the needed acceptance and
subsequent research use (Nicholson-Cole & Whitmarsh, 2008). The stages at which this is
done, vary from researcher to researcher. There is also the possibility that some researchers
and research types do not involve stakeholders at all. The question here is to determine the
stages of involvement of stakeholders if any. The DRUSSA Benchmarking Report 2014 and
2016 listed some stages of stakeholder involvement in the research process as follows:
Stellenbosch University https://scholar.sun.ac.za
155
• involvement in setting the research agenda, research design stage and research
dissemination stage;
• the research proposal or development stage;
• data collection and analysis stage;
• during the research process, during the research report drafting stage, during the final
report and dissemination stage; and
• at all stages of the research process (Bozeman, 2000; NCDDR, 1995; Nicholson-Cole
and Whitmarsh, 2008).
Question 13 of the survey instrument was designed to find the stages of involvement. Appendix
C.3 presents a summary of the sources.
The fourth and last component of channels and mechanisms of engagement with communities
considers individual and institutional barriers that are associated with RU and utilisation at
community level. Question 14 of the survey was intended to identify some of the common
barriers. Here again, a five-point scale of responses was used, and some options adopted from
Humphries (2014), Sedlacko et al. (2013), Oliver et al., (2014) are provided with ‘Other’ as the
last option.
Humphries (2014), Sedlacko et al. (2013), Oliver et al., (2014) outline the following barriers
to the use of evidence in management within the healthcare system:
• information (related barriers as far as communities are concerned include research
without relevance or clarity, misunderstanding and wrong perceptions of research)
(Humphries, 2014; Oliver et al., 2014);
• organisational structure and process (related barriers include a lack of resources to
support research and cost, a lack of HR capacity, financial constraints, inadequate
planning processes and sometimes even an absence of such processes, a lack of support
from management, and poor communication) (Humphries, 2014; Oliver et al., 2014;
Sedlacko et al., 2013);
• organisational culture (related barrier here is mainly resistance to change by
communities, which may be due to the cultural influences) (Humphries, 2014; Sedlacko
et al., 2013);
• individual (related barriers include inadequate skills and experience on the part of
researchers to disseminate research, a lack of personal motivation on the part of
researchers to disseminate research) (Humphries, 2014; Oliver et al., 2014);
Stellenbosch University https://scholar.sun.ac.za
156
• interaction (barrier identified relates to the gap between researchers and users due to a
lack of contact and mutual understanding among them) (Humphries, 2014). Appendix
C.4 provides a summary.
D. Channels and mechanisms of engagement with private sector
This sub-section looks at the channels and mechanisms of engagement with the private sector
which includes industry, large firms, and SMEs. Similar to Section C above, this section
comprises four components, namely channels of engagement with the private sector, benefits
of engagement with the private sector, stages of involving the private sector, and the barriers
associated with RU.
These components require respondents to indicate on a five-point response scale their channels
and mechanisms of engagement with the private sector, the benefits and stages of involvement
and the barriers to research use. The options available are adapted from the same literature
sources as in the case of communities but with some additions.
As already discussed, (see sub-section 3.2), the NCDDR (1995) and Bozeman (2000) expanded
on some elements of the knowledge transfer process that need attention in considering the
channels and mechanisms of engagement with stakeholders. Key to this is the fact that the
researcher must provide knowledge that –
• is credible and acceptable to the user or stakeholder;
• addresses specific issues; and
• of which the content must be clear, applicable, unambiguous, simple and non-
complicated.
When there is an effective collaboration between researchers and users, the possibility of
research use is high. According to Cherney et al. (2012), one needs to look out for the following
in the knowledge production and dissemination process: research is transmitted to end users,
understood by users, cited in reports, used in strategies, there are efforts to use research,
research has influenced policy, decisions or choices, conferences, workshops, technical reports
(Cherney et al., 2012). These may be seen as advantages or benefits to an effective translation
of research.
Research ought to be transferred through means that will make it reach the stakeholders. The
mode of transfer includes conferences, publications or journals, written documents, social
media, joint research, commissioned research, serving on boards and councils (Becheikh et al.,
2010). Due consideration must be given to the characteristics and attributes of the transferred
Stellenbosch University https://scholar.sun.ac.za
157
knowledge, actors in the knowledge transfer process (researchers, users, knowledge brokers,
lobbyists, linkage agents), and the transfer mechanisms as already outlined above.
Huberman (1994) expounded on the “linkage mechanisms” to knowledge translation
(Huberman, 1994:13). Huberman (1994) argues that, for research to be utilised, there is a need
to determine knowledge needs of users, introduce “intermediaries” and “informants” to help
researchers collect data and provide feedback (Huberman, 1994:13). Such intermediaries
include lobbyists, think tanks, advisory boards, platforms, associations, the media, research
institutes and university departments (Mitton et al., 2007). Much earlier, Larsen (1980) argued
that effective transfer of knowledge is influenced by the organisational characteristics, the
characteristics of the knowledge produced, the characteristics of the stakeholders and users, the
characteristics of the source, strategies for dissemination, linkages between the researcher and
users among others. These have been corroborated by Innvaer and Vist (2002). The strategies
for dissemination include joint research, collaborations, contract and commissioned research,
workshops, conferences as well as serving on boards and councils (Innvaer & Vist, 2002).
In terms of the stages of involvement, it is argued that stakeholders ought to be involved at all
stages of the research process, from conception, through to the research process, including data
collection, dissemination and final report writing (Bozeman, 2000; NCDDR, 1995). Similar
arguments are advanced by Nicholson-Cole and Whitmarsh (2008) and the DRUSSA
Benchmarking Reports 2014 and 2016 as already explained in the precious section.
In addition to the points elaborated on in C above, information-related barriers include limited
access to research information or availability and timely delivery of research results.
Organisational structure-related barriers here would include a lack of data, organisational
culture-related barriers such as decision-making culture, crisis management culture and
political influence on decisions; individual barriers include a lack of formal training in research
management; and interaction barriers (Humphries 2014, Sedlacko et al. 2013, Oliver et al.,
2014). It is further argued that there are barriers associated with the research, the extent of
stakeholder involvement, communication and other factors, such as a lack of capacity to
disseminate and use research and a lack of budget lines for research activities (Andrews, 2012).
Questions 15–18 of the survey instrument examined the channels of engagement with industry,
the benefits of engagement, stages at which stakeholders are involved in the research process,
and the barriers to RU as far as the private sector is concerned. A summary of the options
adapted from the literature for all the components are presented in Appendices D.1–D.4.
Stellenbosch University https://scholar.sun.ac.za
158
E. Channels and mechanisms of engagement with government and parastatals
This sub-section discusses the channels and mechanisms of engagement with government
(MDA). As in the case of sub-section D above, this sub-section is divided into four
components:
• channels of engagement with government measured with a five-point response scale
(Always to Never);
• benefits of engagement with government measured with a five-point response scale
(Very beneficial to Not applicable);
• stages of involving government in the research process measured with a five-point
response scale (Always to Never); and
• barriers to RU as far as government is concerned also measured with a five-point
response scale (Always to Never).
As expounded in the sections A-D above, the options for the four components were adapted
from the same authors with further expansion on the individual and interaction barriers.
Additional barriers in this case were inadequate skills and experience of policymakers in
research literacy, a lack of formal training in research management and a lack of interactions
between decision-makers and researchers (Humphries 2014; Sedlacko et al. 2013; Oliver et al.,
2014). Appendices E.1–E.4 reflect the summaries. Questions 19–22 of the survey instrument
addressed these issues. An option for ‘Other’ was listed at the end of each of the components
to enable respondents to state other options if any.
F. Channels and mechanisms of engagement with scientists and researchers of
other universities and institutes
Similar to the previous sub-sections, this sub-section discusses the sources of the options in the
survey instrument. Specifically, we consider channels and mechanisms of engagement with
scientists and researchers of other universities and research institutes. Similar arguments are
advanced here in terms of the literature on the options provided for the questions in the survey
instrument. We therefore adapted the options from the literature to suit the purposes of the
discussion.
As in the case of sub-section E above, this sub-section is also divided into four components,
namely:
• Channels of engagement with scientists and researchers from other universities and
research institutes. A five-point response scale (Always to Never) was used.
Stellenbosch University https://scholar.sun.ac.za

159
• Benefits of engagement with scientists and researchers from other universities and
research institutes, using a five-point response scale (Very beneficial to Not applicable).
• Stages of involving scientists and researchers from other universities and research
institutes in the research process, measured using a five-point response scale (Always
to Never).
• The barriers to RU as far as scientists and researchers from other universities and
research institutes are concerned. Again, a five-point response scale (Always to Never)
was used with an option for ‘Other’ for respondents to add if any. Questions 23 to 26
of the survey instrument addressed these issues. The summaries of the options are
provided in Appendices F.1–F.4.
In concluding this sub-section, it must be stated that these literature sources are not exhaustive
in themselves. Several other authors in the KU field (Cordingley, 2008; Ellen et al.; Andrews,
2012; Boshoff, 2013; Grobbelaar, 2013; DRUSSA, 2012, 2014, 2016) discussed issues about
stakeholder mapping, stakeholder engagement and dissemination practices with implications
for RU. The above options notwithstanding, the researcher envisaged that respondents may
have other options. For this reason, options for ‘Other’ were provided for in all the sub-sections
in the survey instrument. It was trusted that the five-point response scale would provide
sufficient feedback for the analysis.
5.6.3 Interviews
In order to confirm some of the views articulated during the survey further, interview sessions
were conducted for selected researchers who had given their consent during the survey. This
sub-section provides some description on the interview procedure and the line of questioning.
Face-to-face interviews: To validate and elaborate the findings of the survey, face-to-face
interviews were conducted with 20 of the respondents to the survey questionnaire. The
interviews were recorded in order to enhance the flow of discussion and to reduce the risk of
subjectivity during note-taking. Face-to-face interviews are necessary because during the
analysis there is opportunity to refresh one’s memory by going over the recorded material (Yin,
2009; Shelley, 2001; Lauri, 2011). Table 5.5 below provides a summary of the interview
framework.
5.6.3.1 Source 3: Interviews framework
A summary of the interview framework is given in Table 5.5 below.
Stellenbosch University https://scholar.sun.ac.za
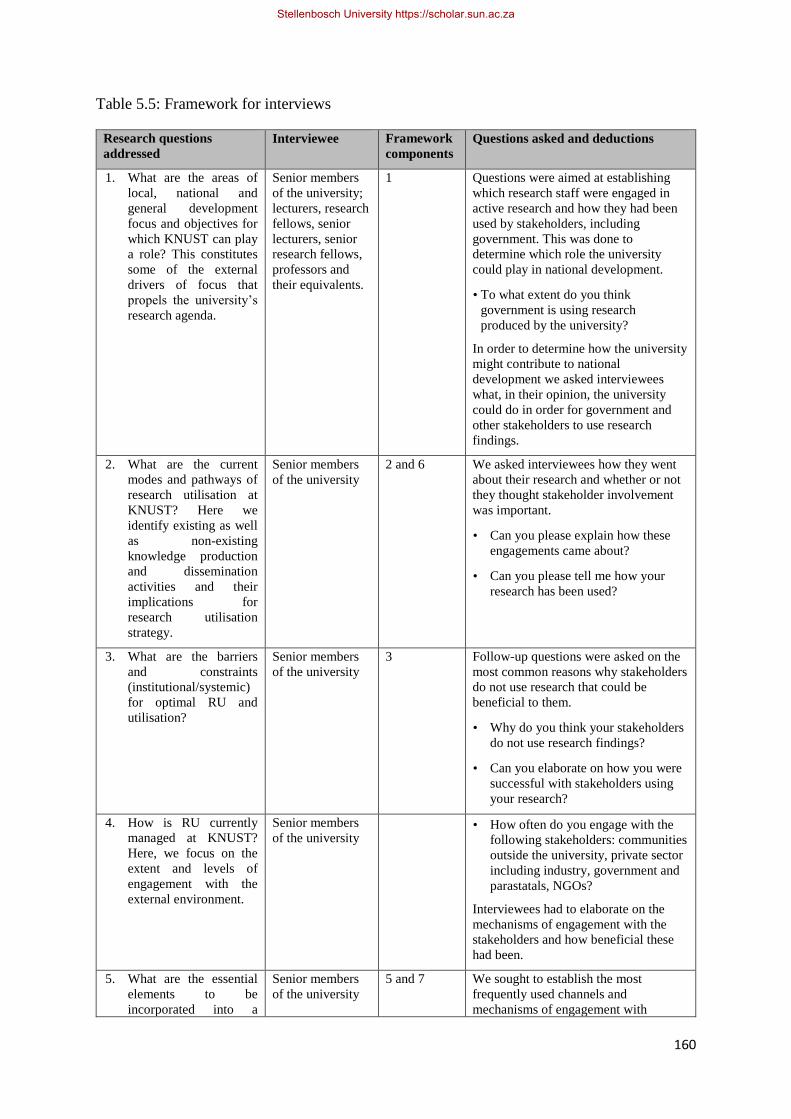
160
Table 5.5: Framework for interviews
Research questions
addressed
Interviewee Framework
components
Questions asked and deductions
1. What are the areas of
local, national and
general development
focus and objectives for
which KNUST can play
a role? This constitutes
some of the external
drivers of focus that
propels the university’s
research agenda.
Senior members
of the university;
lecturers, research
fellows, senior
lecturers, senior
research fellows,
professors and
their equivalents.
1 Questions were aimed at establishing
which research staff were engaged in
active research and how they had been
used by stakeholders, including
government. This was done to
determine which role the university
could play in national development.
• To what extent do you think
government is using research
produced by the university?
In order to determine how the university
might contribute to national
development we asked interviewees
what, in their opinion, the university
could do in order for government and
other stakeholders to use research
findings.
2. What are the current
modes and pathways of
research utilisation at
KNUST? Here we
identify existing as well
as non-existing
knowledge production
and dissemination
activities and their
implications for
research utilisation
strategy.
Senior members
of the university
2 and 6 We asked interviewees how they went
about their research and whether or not
they thought stakeholder involvement
was important.
• Can you please explain how these
engagements came about?
• Can you please tell me how your
research has been used?
3. What are the barriers
and constraints
(institutional/systemic)
for optimal RU and
utilisation?
Senior members
of the university
3 Follow-up questions were asked on the
most common reasons why stakeholders
do not use research that could be
beneficial to them.
• Why do you think your stakeholders
do not use research findings?
• Can you elaborate on how you were
successful with stakeholders using
your research?
4. How is RU currently
managed at KNUST?
Here, we focus on the
extent and levels of
engagement with the
external environment.
Senior members
of the university
• How often do you engage with the
following stakeholders: communities
outside the university, private sector
including industry, government and
parastatals, NGOs?
Interviewees had to elaborate on the
mechanisms of engagement with the
stakeholders and how beneficial these
had been.
5. What are the essential
elements to be
incorporated into a
Senior members
of the university
5 and 7 We sought to establish the most
frequently used channels and
mechanisms of engagement with
Stellenbosch University https://scholar.sun.ac.za
161
strategic RU framework
for the university,
researchers and
policymakers? This is in
relation to the above
questions, including, the
form and focus of
knowledge production
and dissemination,
internal drivers,
governance and control
of the university.
stakeholders, the extent of research use
and what the facilitators of research use
were. The following elements were
considered among the options:
policy, governance, financial resources,
dissemination activities, stakeholder
engagement, capacity building, M&E
and any other issues considered
relevant.
6. What are the key
institutional and
individual capacity
gaps, human and
financial resources (at
both management and
operational levels) that
need to be addressed in
order to equip staff at
KNUST to maximise the
uptake, utilisation and
impact of
developmental and
applied research?
Senior members
of the university
All • What are the key institutional and
individual capacity gaps, human and
financial resources (at both
management and operational levels)
that need to be addressed in order to
equip staff at KNUST to maximise
the uptake, utilisation and impact of
developmental and applied research?
Follow up questions arose from the
responses provided.
5.6.4 Data analysis
The data obtained from the above approaches, i.e. document search, questionnaires and
interviews were individually analysed and integrated into the overall analysis. Data
triangulation was used for the verification of information gathered from documents during the
document review while interviews were carried to validate the responses obtained from the
survey. The statistical analysis and evaluation of the information from the survey was carried
using Statistical Package for Social Sciences (SPSS) also known as Predictive Analytics
Software (PASW), a standard statistical package for quantitative analysis. ATLAS.ti, a
qualitative analysis software, was used for the analysis of the interviews. This includes all
coding and derivation of themes, examination of trends, expectations and emerging networks
and relativities.
5.7 Administration of survey and interviews
The administration of the survey took about seven weeks. The survey instrument
(questionnaire) was converted into an online web-based questionnaire by a qualified survey
administrator. The web-based questionnaire, administered through SurveyMonkey, used
software that was able to convert all responses into an Excel file, which could be downloaded.
Stellenbosch University https://scholar.sun.ac.za
162
The system was pre-tested and piloted with ten academic staff and was validated to be an
effective means to reach the target audience. Thereafter, an email was sent to the target
audience explaining the objectives of the survey. The university has a directory, which contains
the names, designation, email addresses and telephone numbers of all staff. At the time of the
survey, this was being revised to update and capture the details of all new staff who had joined
the university since the last publication in 2014. At the time of this research, the University
Information Technology Services (UITS) unit was host to the mailing list for staff and this was
available for use with permission.
The first batch of emails were sent via the university mailing system (those using knust.edu.gh
addresses) and was expected to reach about 600 academic staff. However, it was found that
some staff did not receive the mails due to system failure, official email addresses being
redundant and inactive email addresses. We therefore had to resort to the use of private email
addresses such as Yahoo mail, Gmail and Hotmail. These proved to be a bit more effective
with many receiving their invitations. The emails included a hyperlink for respondents to click
on in order to access the survey.
Participation in the survey was voluntary and anonymous, and respondents could opt out at any
time should they wish to do so. Respondents were also assured that the information they
provide would be confidential. The survey offered the option for respondents to provide their
names and email addresses for the purposes of possible follow-up interviews of those who
willingly wish to grant further interviews. Respondents who were not comfortable with
providing their names, year of birth and addresses were allowed to do so although these were
only 4.5% of the valid sample.
The first batch of emails was sent out in the middle of May 2017 and the last batch in the first
week of July 2017, a period of about seven weeks. These mails were expected to reach about
600 academic staff taking into consideration the number of inactive email addresses and about
15% that bounced back. During the period of administering the survey, three reminders were
sent while there were one-on-one contacts for those who wished to complete hard copies, which
were later entered into the web-based system. The one-on-one contacts and selective phone
calls gave an indication that, although many received the invitations via email, they could not
find time to complete them online. This might have been due to the timing of the survey. At
the initial launch of the survey, examinations were in progress and academic staff were
occupied with examinations. Shortly thereafter, there were demands for examination scores to
enable final-year students’ graduation in about two months after completion of the
Stellenbosch University https://scholar.sun.ac.za
163
examinations. The situation brought an enormous pressure on academic staff. This, apart from
general apathy, may have contributed to the initial slow inflow of responses but eventually
ending up with a fairly good response rate.
5.7.1 Analysis of the survey
Out of 228 responses received from the survey, there was some duplication of names and
similar email addresses, which had to be cleaned up. The remaining 202 responses were found
to be sound and valid. The 202 valid responses, out of the mailing list of 669, therefore,
constituted a 30.2% response rate. The respondents were fairly evenly distributed across the
six colleges and specialisation areas. Of the respondents, 100% provided their department or
faculty, position, highest qualification, the year the highest qualification was received and the
institution from which the highest qualification was obtained.
The Excel file with the cleaned data obtained from the survey was imported into SPSS Version
16.0, a software program for the analysis of quantitative data. Univariate analysis, involving
frequency tables and summary statistics, was carried out as discussed in the subsequent sections
of this chapter. In addition, bivariate analysis, involving cross-tabulations, was carried to
examine the relationships between variables. The correlations between variables are discussed
in section 7.4.
5.7.2 Analysis of interviews
As already discussed in detail earlier in this chapter, interviews had to be conducted after the
survey. In order to validate and seek further clarifications on some of the responses from the
survey, 20 respondents were selected for interviews based on the following criteria:
1. interviewees had to be respondents to the survey;
2. they had to indicate willingness to be interviewed;
3. they had to be research active and should have had research outputs ranging from at
least 1–5 (determined by question 10 of the survey);
4. the overall value of their research should be at least beneficial to some extent (question
11);
5. they should have engaged sufficiently with their selected stakeholders at least annually
(question 12 &13);
6. there had to be an indication of their mechanisms of engagement with stakeholders
being somewhat beneficial (question 14);
Stellenbosch University https://scholar.sun.ac.za

164
7. they had to show an indication of having involved their stakeholders at some point in
their research process (question 15); and
8. they should have identified the most common barriers and constraints to the use of
research by their stakeholders (question 16).
Those who met the above criteria were selected and spread across the various positions,
namely:
• lecturer/research fellow;
• senior lecturer/senior research fellow;
• associate professor and equivalents; and
• full professor.
Another important consideration in the selection of interviewees was the different fields of
research, and this was given due attention during the selection process since the different fields
had different forms of engagement. Respondents were therefore selected from the different
fields and as much as possible for different positions and gender. Table 5.6 below gives the
distribution of selected interviewees.
Stellenbosch University https://scholar.sun.ac.za
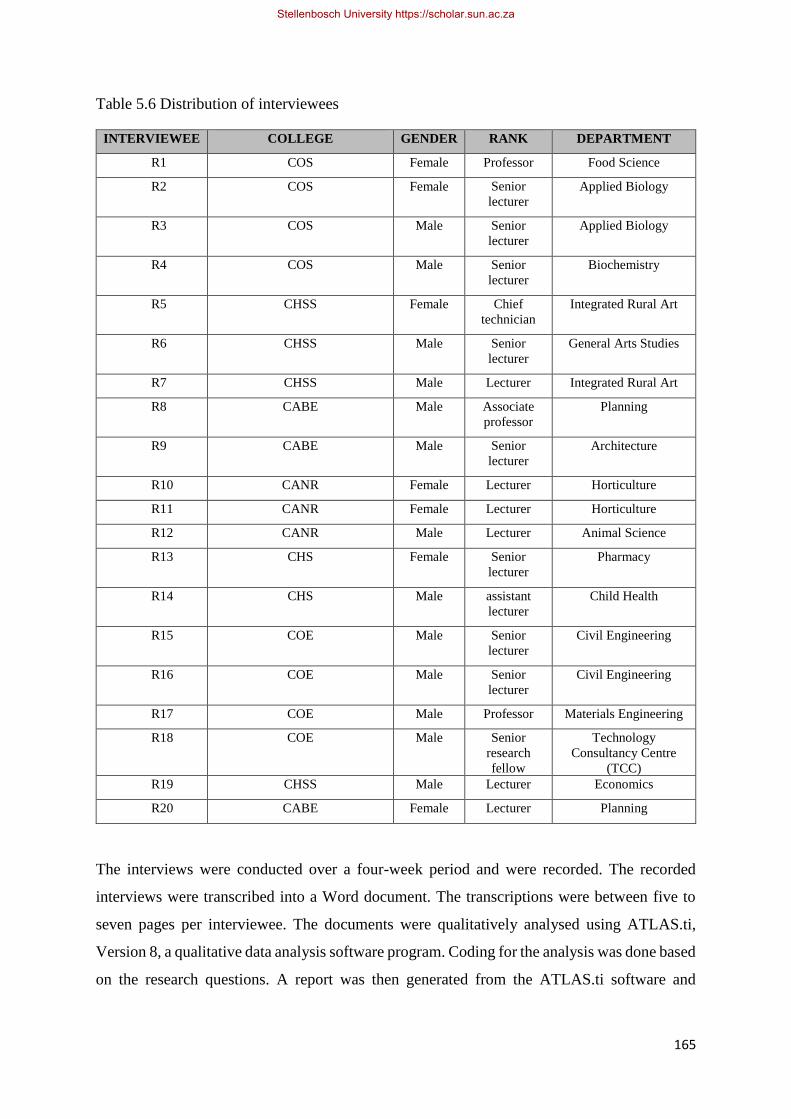
165
Table 5.6 Distribution of interviewees
INTERVIEWEE COLLEGE GENDER RANK DEPARTMENT
R1 COS Female Professor Food Science
R2 COS Female Senior
lecturer
Applied Biology
R3 COS Male Senior
lecturer
Applied Biology
R4 COS Male Senior
lecturer
Biochemistry
R5 CHSS Female Chief
technician
Integrated Rural Art
R6 CHSS Male Senior
lecturer
General Arts Studies
R7 CHSS Male Lecturer Integrated Rural Art
R8 CABE Male Associate
professor
Planning
R9 CABE Male Senior
lecturer
Architecture
R10 CANR Female Lecturer Horticulture
R11 CANR Female Lecturer Horticulture
R12 CANR Male Lecturer Animal Science
R13 CHS Female Senior
lecturer
Pharmacy
R14 CHS Male assistant
lecturer
Child Health
R15 COE Male Senior
lecturer
Civil Engineering
R16 COE Male Senior
lecturer
Civil Engineering
R17 COE Male Professor Materials Engineering
R18 COE Male Senior
research
fellow
Technology
Consultancy Centre
(TCC)
R19 CHSS Male Lecturer Economics
R20 CABE Female Lecturer Planning
The interviews were conducted over a four-week period and were recorded. The recorded
interviews were transcribed into a Word document. The transcriptions were between five to
seven pages per interviewee. The documents were qualitatively analysed using ATLAS.ti,
Version 8, a qualitative data analysis software program. Coding for the analysis was done based
on the research questions. A report was then generated from the ATLAS.ti software and
Stellenbosch University https://scholar.sun.ac.za
166
transferred into an MS Word document. Relevant portions of the report were used in the
analysis that follows.
5.8 Conclusion
This concluding section of the chapter summarises the scheme related to how information or
data was gathered as far as the framework elements were concerned. The study was essentially
a case study of RU practices at KNUST. As is typical in case studies (Yin, 2009), a multiple-
method approach was used for the data collection. As envisaged and outlined in the forgoing
discussions (see sub- sections 5.6.1, 5.6.2, 5.6.3), the following methods have been found to be
the most appropriate: document analysis, survey and interviews, as recommended by Shelley
(2001), Yin (2009) and Lauri (2011).
The study followed a quantitative research design and required that data be gathered on site.
The data collection took place by means of a survey conducted among university teachers and
researchers. The survey was based on activities towards RU, barriers and facilitators to RU.
Specific areas considered along the lines of the analytical framework were:
• identification of stakeholders;
• channels and mechanisms of engagement to identify the existing pathways for RU;
• stages at which stakeholders are involved in the research process;
• the importance and benefits of engagement; and
• the individual and institutional barriers and constraints to RU.
The administration of the survey and interviews was on the campus of KNUST involving those
with the responsibility to teach and conduct research. Considering the fact that there are six
colleges, the survey took about seven weeks to collect the data. At least six field assistants were
involved in the data collection. The field assistants scheduled visits with staff and visited them
in their offices to administer the survey for those who preferred hard copies.
Essentially, the answers to research questions 2 and 3 were provided for by the survey, which
was conducted within the university covering over 600 academic and research staff, many of
whom were research-active at the time of this study. These questions partly covered objectives
2, 3 and 4. Objective 1 was catered for in Chapters 2 and 3 of the thesis.
The issue of key institutional and individual capacity gaps (at both management and operational
level) was dealt with in Table 5.1. These capacity gaps were addressed with the aim to equip
staff at KNUST to maximise the uptake, utilisation and outcome of developmental and applied
research. For the purposes of our analysis, the framework for the analysis of the
Stellenbosch University https://scholar.sun.ac.za
167
transformational pathway of the university environment was adapted, as proposed by
Grobbelaar and De Wet (2013).
In conclusion, we have sought to link the research objectives and questions to the literature in
order to adopt the most appropriate conceptual framework as far as the aim of the study was
concerned. We noticed however that much of what had been proposed and reviewed in terms
of frameworks had been developed outside sub-Saharan Africa, except for those of Grobbelaar
and De Wet (2013) Ellen et al., (2011) and Grobbelaar and Haber (2014), who adapted existing
frameworks to suit the African context. Besides, the literature has not been explicit in terms of
RU strategy for HE systems in sub-Saharan Africa. We acknowledge, also that some of the
principles discussed could be relevant and applicable within the context of the study. In order
to propose a culturally relevant RU strategy framework for the African HE system, and in
particular Ghana, the survey went beyond just establishing and confirming what already existed
by seeking to design a strategy for RU and RUM suitable for KNUST and for that matter higher
education in Ghana. This primary phase provided a guide to the development of the data
collection instrument and also provided answers to the research questions, leading to the
attainment of the stated objectives. The data sample was obtained from academics and
administrators at the KNUST in the hope that the analysis would lead to context-relevant
conclusions.
It is acknowledged that different fields of study would have varying modes of research
production and dissemination processes; therefore, the current design took these into
consideration (Mouton, 2012). KNUST runs several academic programmes ranging from
humanities to science, agriculture, medicine and engineering. Researchers are spread across six
colleges running these different programmes, which afforded us the opportunity to analyse the
different modes of knowledge production in different fields. In the end, we sought to adopt and
adapt some aspects of existing knowledge in the field of knowledge production to propose a
policy framework for RU and RUM applicable for HE institutions within sub-Saharan Africa.
It is trusted that with this policy framework, knowledge generation will go beyond the
boundaries of its producers into the corridors of society for impact.
Stellenbosch University https://scholar.sun.ac.za
168
CHAPTER 6 – NATIONAL AND LOCAL DEVELOPMENTAL FOCUS WHERE
THE UNIVERSITY CAN PLAY A ROLE
6.1 National development planning
This section aims to answer the research question on the local and national developmental focus
where the university can play a role. It discusses the establishment, role and objectives of the
Ghanaian National Development Commission (NDPC), which has the responsibility for
planning and execution of national development plans. Also discussed are the specific national
goals and objectives where universities, in particular KNUST, could play a role in order to
address the element of the external environment, the ecology and the external drivers of focus.
6.1.1 The national development planning commission
The National Development Planning Commission (NDPC) in Ghana was established as part of
the government under Articles 86 and 87 of the 1992 Constitution (NDPC (System) Act, 480
of 1994). The legal framework for its establishment and the performance of its functions are
enshrined in the NDPC Act, 479 of 1994 and the NDPC Act, 480 of 1994 (NDPC, 2014). Under
these provisions, the NDPC is mandated to advise the President of the Republic of Ghana on
the developmental strategies of the country and their planning. In this wise, the NDPC is
mandated to carry out the following functions:
• study and make strategic analyses of macro-economic and structural reform options;
• make proposals for the development of multi-year rolling plans taking into
consideration the resource potential and comparative advantage of the different districts
of Ghana;
• make proposals for the protection of the natural and physical environment;
• make proposals for ensuring the even development of the districts of Ghana by the
effective utilisation of available resources; and
• monitor, evaluate and coordinate development policies, programmes and projects
(NDPC, 2014).
In addition to the above mandates the President could assign any other roles as deemed fit
(NDPC, 2014). One most recently assigned responsibility of the NDPC is to coordinate and
report on issues relating to the sustainable development goals (SDGs). The NDPC is expected
to operate along the lines of the African Union’s Agenda 2063 to build and expand an African
knowledge society through transformation and investments in universities, science,
technology, research and innovation; and through the harmonization of education standards
Stellenbosch University https://scholar.sun.ac.za

169
and mutual recognition of academic and professional qualifications” (ACU, 2015:15). The next
sub-section discusses the national focus as far as national development is concerned.
6.1.2 The national development focus
In its quest to achieve the national strategic developmental goals, the government of Ghana
through the National Development Planning Commission (NDPC) sought to place all its
developmental endeavours within a long-term development framework, having in mind the
Millennium Development Goals (MFGs) (NDPC, 2006). The NDPC then set out to develop
the 2007–2015 development plan (NDPC, 2006). It was with the expectation that this plan
would provide direction to the path of national development along the expectations of
government.
Over the past few years since independence in 1957, it has been noted that Ghana’s economic
growth has been relatively slow with an economy largely dependent on the export of a small
number of commodities, such as cocoa, gold and timber (UNCT, 2017). The economy has not
been robust enough to withstand international trends and shocks (UNCT, 2017). National
resource distribution has also not been uniform; thus, depriving many sectors of the needed
development. To date, some regions remain economically and socially challenged (UNCT,
2017). There have been efforts by previous governmental development plans to bring equity
into national development but these have not been successful. The aim of the 2007–2015
development plan was to influence socio-economic development broadly across the country
within the shorter term (NDPC, 2006). Accordingly, it was expected that the plan would
achieve rapid and sustained socio-economic growth across the country by 2015 when the
country would have met the respective MDGs. The final report published by the United Nations
Development Programme (UNDP) in September 2015 indicated –
[O]nly slow progress was made on full and productive employment (MDG 1B), equal
share of women in non-agriculture wage employment and women’s involvement in
governance (MDG 3), reducing under-5 and child mortality (MDG 4), reducing maternal
mortality (MDG 5), reversing environmental resource loss and improving sanitation
(MDG 7) (UNDP, 2015:vi).
The unattained MDGs have since been dovetailed into the SDGs and are to be addressed in the
context of the SDGs (UNCT-GH, 2017).
The 10-year development plan (UNCT-GH, 2017) of the NDPC (2006). focused on the
following four areas;
Stellenbosch University https://scholar.sun.ac.za
170
1. industrial development for a small open economy;
2. modernising agriculture;
3. human capital development for structural transformation of Ghana’s economy; and
4. human settlement for a changing economy (NDPC, 2006).
In all four focal areas, the current researcher is of the view that the KNUST can play a
meaningful role if the necessary collaborative efforts are put in place. The research arm of
government, the CSIR, established by government in August 1958, has a mandate to coordinate
scientific research in Ghana (CSIR, 2017). It has 13 affiliated research institutions that provide
the necessary national research requirements. The mandates of the CSIR are well spelt out.
Notable among these are the fact that the Council is expected –
[T]o encourage the national interest and scientific and industrial research of importance
for development of agriculture, health, medicine, environment, technology and other
service sectors and to this end to encourage close linkage with the productive sectors of
the economy (CSIR, 2017:2).
In addition, the Council has the mandate to coordinate “all aspects of scientific research in the
country and to ensure that the Council, the research institutes of the Council and other
organisations engaged in research in Ghana, coordinate and cooperate in their research effort”
(CSIR, 2017:2). This researcher believes that these are well-thought-out mandates with a
potential for national development, should all the arms, which include the university, play their
respective roles effectively.
The national development agenda comes into sharp focus with the current SDGs (UNCT,
2017:3). Notable areas among the 17 SDGs where the university could play a role are:
• Good Health and Well-Being (SDG 3) (UNCT, 2017:3),
• Quality Education (SDG 4) (UNCT, 2017:3),
• Clean Water and Sanitation (SDG 6) (UNCT, 2017:3),
• Affordable Clean Energy (SDG 7) (UNCT, 2017:3),
• Industry, Innovation and Infrastructure (SDG 9) (UNCT, 2017:3) and
• Climate Action (SDG 13) (UNCT, 2017:3).
A science and technology-based university, such as KNUST, could play a significant role in
achieving these goals. This is corroborated by the United Nations Country Team (UNCT),
which says –
Stellenbosch University https://scholar.sun.ac.za
171
[S]cience provides the foundation for new and sustainable approaches, solutions and
technologies to tackle the challenges of reducing poverty and achieving sustainable
development. For example, it has enable access to safe drinking water, reduced deaths
caused by water borne diseases and improved hygiene to reduce health risks related to
unsafe drinking water and lack of sanitation (UNCT, 2017:5).
KNUST has assisted in various communities in this respect with the sinking of boreholes for
safe drinking water. In addition, the TCC produced an energy-efficient cookstove intended to
cut down on smoke emission and the use of fuel wood (see KNUST Research, 2016). The stove
is currently being used by many second-cycle schools in the Kumasi metropolis and beyond.
To cut down on food wastages, the Department of Food Science and Technology at the
university has been training various groups in postharvest practices (KNUST Research Report
2016). The Department of Agriculture, Crop Science and Horticulture have also been engaging
various stakeholders on issues relating to good planting and harvesting practices (KNUST
Research Report 2016).
These examples are some indications that the university – by its establishment and mandate –
could play a role in the improvement of life. The university can reposition itself and partner
with stakeholders, including the CSIR, to pursue the 17 SDGs (UNCT, 2017).
6.1.3 The agricultural sector and the role of the university
This sub-section reports specifically on the agricultural sector, its national focus and the role
the university could play. As far as the agricultural sector is concerned, the 10-year
development plan (UNDP, 2015) the MDGs and the SDGs have outlined agriculture-specific
goals to tackle hunger and poverty. These goals can be summarised as follows:
1. facilitate swift accumulation of technological capabilities in industry and agriculture;
2. mechanisation and irrigation as key factors in modernising Ghana’s agricultural sector;
3. enhance the productivity of human capital as a means of generating higher income and
reducing the incidence of poverty;
4. facilitate the development of a human settlement pattern that facilitates access to
national, regional and international markets for agricultural and industrial development
as well as agro-industry development; and
5. support private sector development to invest actively in agriculture, industry and agro-
industry (UNCT, 2017; UNDP, 2015)
Stellenbosch University https://scholar.sun.ac.za
172
The above strategies are expected to depend on strengthening partnerships between the
public and private sectors, including the universities.
The university is a key development partner in the triple-helix, quadruple and quintuple
helixes (Etzkowitz, 2004) and therefore should not be underrated in the growth of any sub-
sector of the country. The agricultural sector, expected to propel economic growth, is one
sector where the university could play a major role, especially, in the area of mechanised
agriculture and irrigation (UNDP, 2015). A recent innovation by researchers at KNUST is
the fabrication and production of a mechanised cassava harvester (KNUST Research
Report, 2016) This was designed to support large-scale commercial harvesting of cassava,
especially during the dry season. It has the ability to harvest a cassava plant per second
compared to the 5 to 10 minutes by manual labour (KNUST Research Report, 2016).
Several other research results in effective cropping, varieties of pest-resistant crops and
high-yielding varieties among others have been developed. The national development plan
2007–2015 (NDPC, 2004) and the SDGs acknowledge the need for an improved variety of
seeds, fertiliser and machinery, areas where the university could adequately assist (UNCT,
2017). Recent efforts have led to some slight improvement in the agricultural sector. The
year-on-year gross domestic product (GDP) growth rate for agriculture was 10.0% for the
third quarter of 2017 as against the previous year’s performance of under 10% growth
(Ghana Statistical Service [GSS], 2017b).
This researcher is convinced that an effective collaboration between the university and the
Ministry of Agriculture will most likely yield more economic dividends. The research units
of the university have done much over the past few years but due to a disconnect between
the sector ministries and the research units not much has been utilised. A review of research
articles in JUST, published by the university, over the past ten years provided us with areas
of research covering government priority areas. Table 6.1 below shows the number of
published research articles in JUST from 2004 -2017 and the specific areas where they can
be applied to national development.
Stellenbosch University https://scholar.sun.ac.za
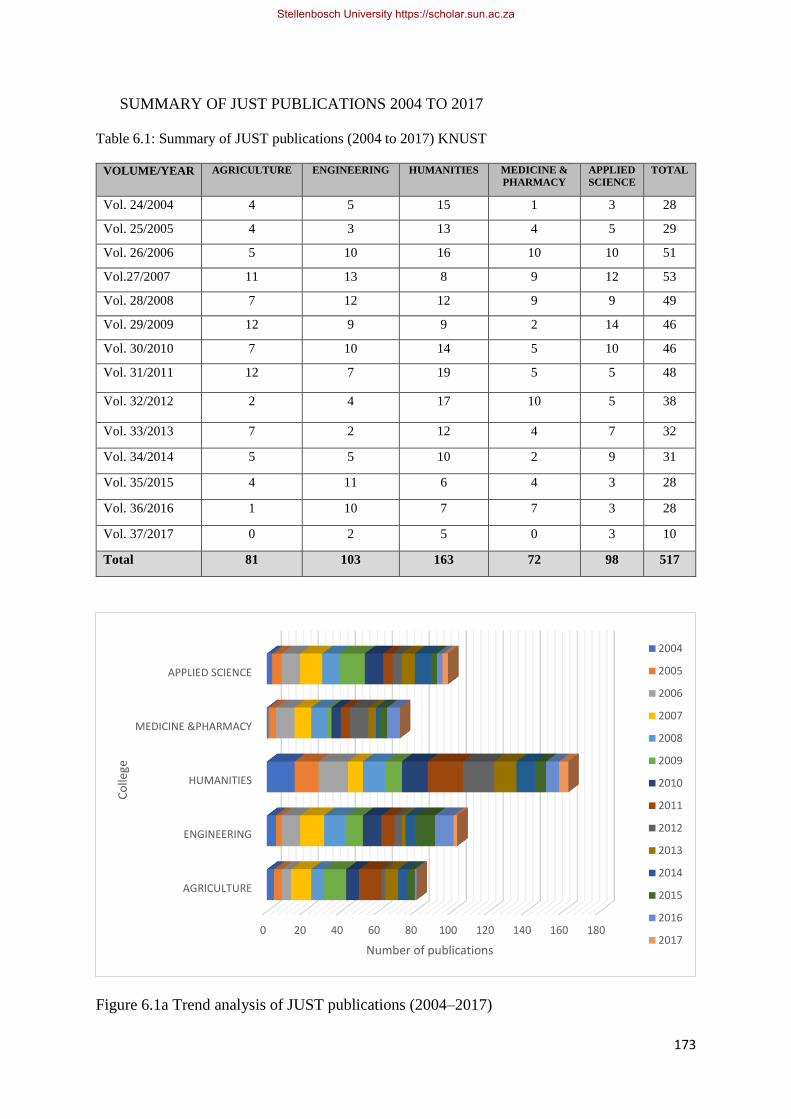
173
SUMMARY OF JUST PUBLICATIONS 2004 TO 2017
Table 6.1: Summary of JUST publications (2004 to 2017) KNUST
VOLUME/YEAR AGRICULTURE ENGINEERING HUMANITIES MEDICINE &
PHARMACY
APPLIED
SCIENCE
TOTAL
Vol. 24/2004 4 5 15 1 3 28
Vol. 25/2005 4 3 13 4 5 29
Vol. 26/2006 5 10 16 10 10 51
Vol.27/2007 11 13 8 9 12 53
Vol. 28/2008 7 12 12 9 9 49
Vol. 29/2009 12 9 9 2 14 46
Vol. 30/2010 7 10 14 5 10 46
Vol. 31/2011 12 7 19 5 5 48
Vol. 32/2012 2 4 17 10 5 38
Vol. 33/2013 7 2 12 4 7 32
Vol. 34/2014 5 5 10 2 9 31
Vol. 35/2015 4 11 6 4 3 28
Vol. 36/2016 1 10 7 7 3 28
Vol. 37/2017 0 2 5 0 3 10
Total 81 103 163 72 98 517
Figure 6.1a Trend analysis of JUST publications (2004–2017)
0 20 40 60 80 100 120 140 160 180
AGRICULTURE
ENGINEERING
HUMANITIES
MEDICINE &PHARMACY
APPLIED SCIENCE
Number of publications
Co
llege
2004
2005
2006
2007
2008
2009
2010
2011
2012
2013
2014
2015
2016
2017
Stellenbosch University https://scholar.sun.ac.za
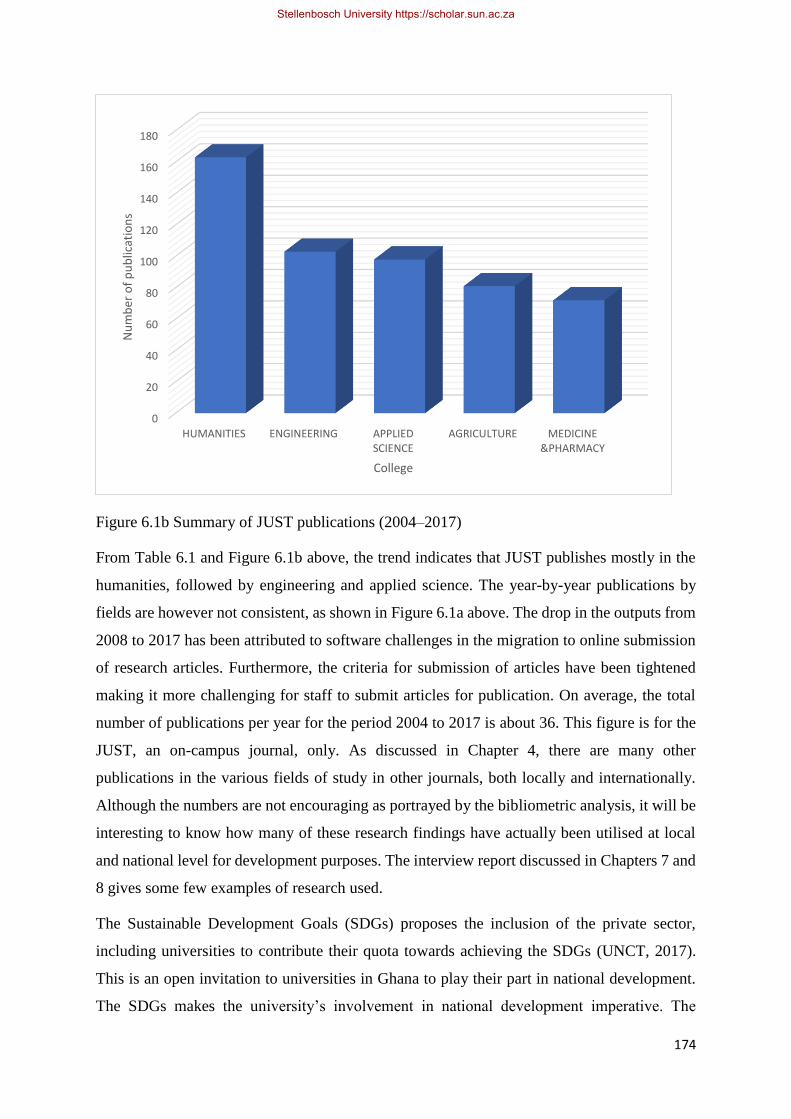
174
Figure 6.1b Summary of JUST publications (2004–2017)
From Table 6.1 and Figure 6.1b above, the trend indicates that JUST publishes mostly in the
humanities, followed by engineering and applied science. The year-by-year publications by
fields are however not consistent, as shown in Figure 6.1a above. The drop in the outputs from
2008 to 2017 has been attributed to software challenges in the migration to online submission
of research articles. Furthermore, the criteria for submission of articles have been tightened
making it more challenging for staff to submit articles for publication. On average, the total
number of publications per year for the period 2004 to 2017 is about 36. This figure is for the
JUST, an on-campus journal, only. As discussed in Chapter 4, there are many other
publications in the various fields of study in other journals, both locally and internationally.
Although the numbers are not encouraging as portrayed by the bibliometric analysis, it will be
interesting to know how many of these research findings have actually been utilised at local
and national level for development purposes. The interview report discussed in Chapters 7 and
8 gives some few examples of research used.
The Sustainable Development Goals (SDGs) proposes the inclusion of the private sector,
including universities to contribute their quota towards achieving the SDGs (UNCT, 2017).
This is an open invitation to universities in Ghana to play their part in national development.
The SDGs makes the university’s involvement in national development imperative. The
0
20
40
60
80
100
120
140
160
180
HUMANITIES ENGINEERING APPLIEDSCIENCE
AGRICULTURE MEDICINE&PHARMACY
Nu
mb
er o
f p
ub
licat
ion
s
College
Stellenbosch University https://scholar.sun.ac.za

175
KNUST should therefore update itself with the sector specific needs for the country, and
channel its research and choices towards national goals. These efforts ought to be conscious
and sustained. The public sector, including the university, must translate into reality the
expectation to provide the private sector with economic and social infrastructure, such as land
reform and research support. As a public sector entity, the university’s role in providing support
for the informal sector ought to be clearly outlined in the national development plan. The
projection for a change from the dominance of subsistence agriculture to that of an industrially
linked entrepreneurial business, spearheaded by the private sector, is believed to be a recipe for
structural change and economic development (NDPC, 2014). This may not necessarily be the
case looking at the current infrastructural defects of the private sector. That notwithstanding,
the industrial sector of the country is reported to have experienced some marginal growth
between 2003 and 2005, with an increase of between 5.1% and 5.6% (NDPC, 2014) but during
the first quarter of 2017, the GDP for the industrial sector stood at 16.6% (GSS, 2017a; 2017b).
The next section discusses in detail the role that the university could play to contribute to the
local industrial sector. Even with its current infrastructural challenges, the university is in a
position to contribute towards improved modern and cost-effective inputs for better economic
growth.
6.2 The role of the university in local industrial growth
In this section, we consider the industrial goals of Ghana and the role and place of the
university. There is no doubt that much research resources exist in the university. An
industrialised economy requires a strong research backbone as well as HR capacity. This
implies that, for greater industrial growth, there should be a concerted effort from industry,
government, the university and other stakeholders to provide the needed research infrastructure
and human resource required for industrial development (NDPC, 2014). This demands a
strategic plan and policy regime that provide the various interventions with a well-coordinated
approach to sustained economic development and growth.
The university has been contributing to the industrial sector through the building of HR
capacity for the sector. Over the years, KNUST has trained several graduates and post-graduate
students who can be found in most industries in Ghana. The university can still do a bit more
in training individuals to be entrepreneurs who can start small businesses and industries with
the potential for expansion. At a recently held higher education conference in South Africa,
Stellenbosch University https://scholar.sun.ac.za
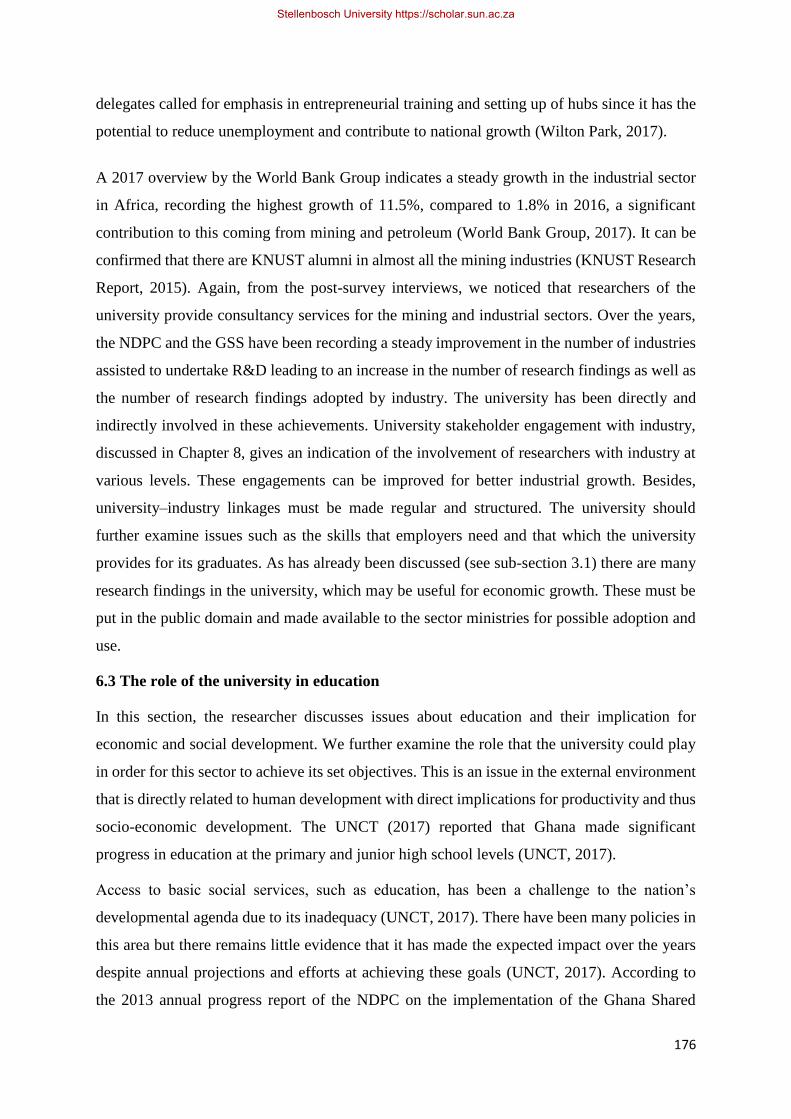
176
delegates called for emphasis in entrepreneurial training and setting up of hubs since it has the
potential to reduce unemployment and contribute to national growth (Wilton Park, 2017).
A 2017 overview by the World Bank Group indicates a steady growth in the industrial sector
in Africa, recording the highest growth of 11.5%, compared to 1.8% in 2016, a significant
contribution to this coming from mining and petroleum (World Bank Group, 2017). It can be
confirmed that there are KNUST alumni in almost all the mining industries (KNUST Research
Report, 2015). Again, from the post-survey interviews, we noticed that researchers of the
university provide consultancy services for the mining and industrial sectors. Over the years,
the NDPC and the GSS have been recording a steady improvement in the number of industries
assisted to undertake R&D leading to an increase in the number of research findings as well as
the number of research findings adopted by industry. The university has been directly and
indirectly involved in these achievements. University stakeholder engagement with industry,
discussed in Chapter 8, gives an indication of the involvement of researchers with industry at
various levels. These engagements can be improved for better industrial growth. Besides,
university–industry linkages must be made regular and structured. The university should
further examine issues such as the skills that employers need and that which the university
provides for its graduates. As has already been discussed (see sub-section 3.1) there are many
research findings in the university, which may be useful for economic growth. These must be
put in the public domain and made available to the sector ministries for possible adoption and
use.
6.3 The role of the university in education
In this section, the researcher discusses issues about education and their implication for
economic and social development. We further examine the role that the university could play
in order for this sector to achieve its set objectives. This is an issue in the external environment
that is directly related to human development with direct implications for productivity and thus
socio-economic development. The UNCT (2017) reported that Ghana made significant
progress in education at the primary and junior high school levels (UNCT, 2017).
Access to basic social services, such as education, has been a challenge to the nation’s
developmental agenda due to its inadequacy (UNCT, 2017). There have been many policies in
this area but there remains little evidence that it has made the expected impact over the years
despite annual projections and efforts at achieving these goals (UNCT, 2017). According to
the 2013 annual progress report of the NDPC on the implementation of the Ghana Shared
Stellenbosch University https://scholar.sun.ac.za
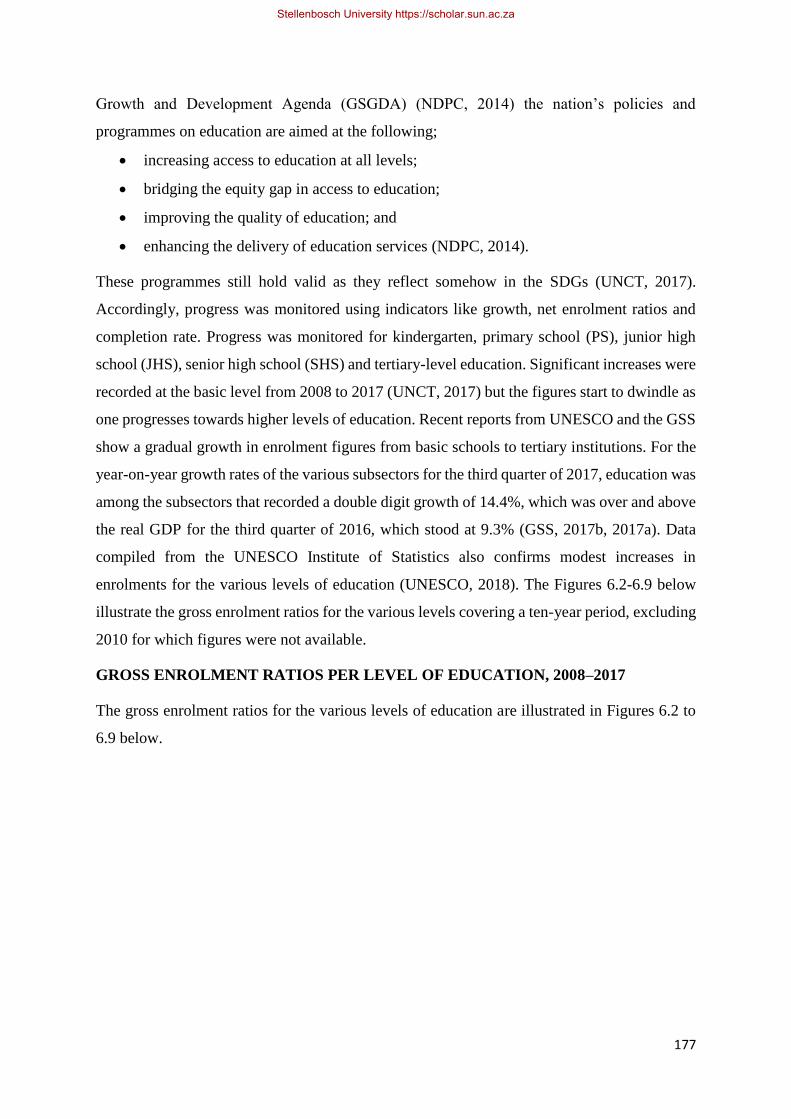
177
Growth and Development Agenda (GSGDA) (NDPC, 2014) the nation’s policies and
programmes on education are aimed at the following;
• increasing access to education at all levels;
• bridging the equity gap in access to education;
• improving the quality of education; and
• enhancing the delivery of education services (NDPC, 2014).
These programmes still hold valid as they reflect somehow in the SDGs (UNCT, 2017).
Accordingly, progress was monitored using indicators like growth, net enrolment ratios and
completion rate. Progress was monitored for kindergarten, primary school (PS), junior high
school (JHS), senior high school (SHS) and tertiary-level education. Significant increases were
recorded at the basic level from 2008 to 2017 (UNCT, 2017) but the figures start to dwindle as
one progresses towards higher levels of education. Recent reports from UNESCO and the GSS
show a gradual growth in enrolment figures from basic schools to tertiary institutions. For the
year-on-year growth rates of the various subsectors for the third quarter of 2017, education was
among the subsectors that recorded a double digit growth of 14.4%, which was over and above
the real GDP for the third quarter of 2016, which stood at 9.3% (GSS, 2017b, 2017a). Data
compiled from the UNESCO Institute of Statistics also confirms modest increases in
enrolments for the various levels of education (UNESCO, 2018). The Figures 6.2-6.9 below
illustrate the gross enrolment ratios for the various levels covering a ten-year period, excluding
2010 for which figures were not available.
GROSS ENROLMENT RATIOS PER LEVEL OF EDUCATION, 2008–2017
The gross enrolment ratios for the various levels of education are illustrated in Figures 6.2 to
6.9 below.
Stellenbosch University https://scholar.sun.ac.za
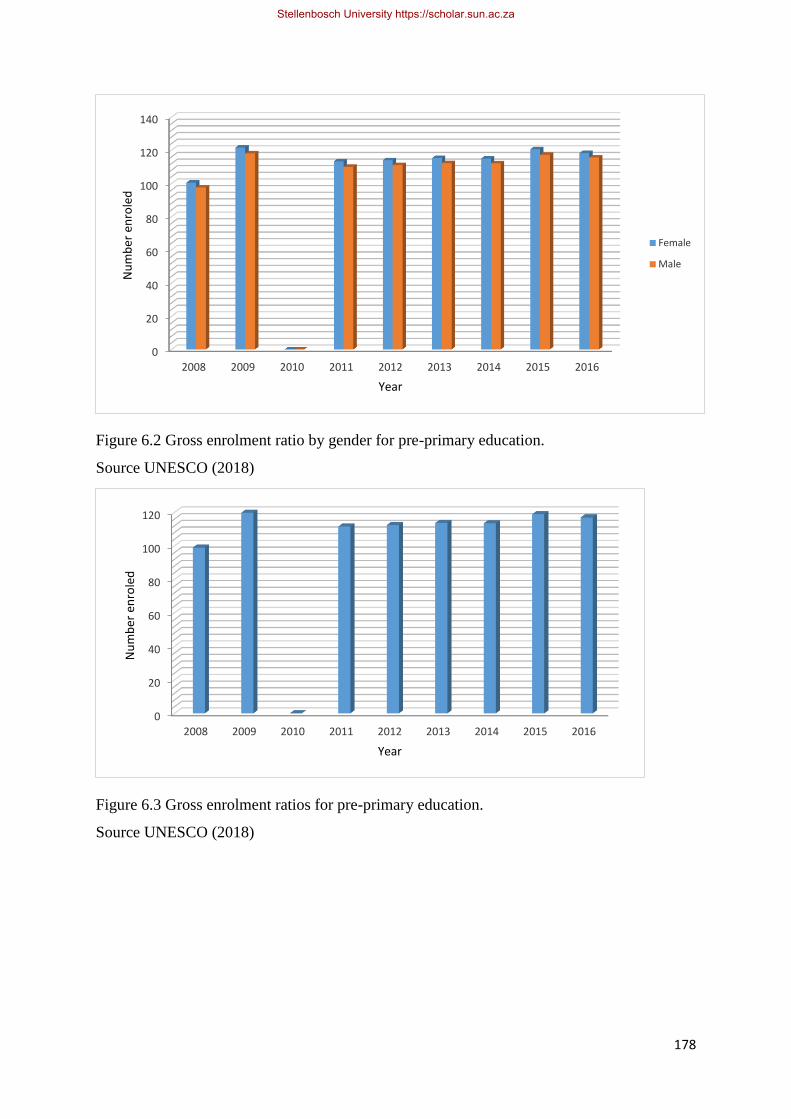
178
Figure 6.2 Gross enrolment ratio by gender for pre-primary education.
Source UNESCO (2018)
Figure 6.3 Gross enrolment ratios for pre-primary education.
Source UNESCO (2018)
0
20
40
60
80
100
120
140
2008 2009 2010 2011 2012 2013 2014 2015 2016
Nu
mb
er e
nro
led
Year
Female
Male
0
20
40
60
80
100
120
2008 2009 2010 2011 2012 2013 2014 2015 2016
Nu
mb
er e
nro
led
Year
Stellenbosch University https://scholar.sun.ac.za
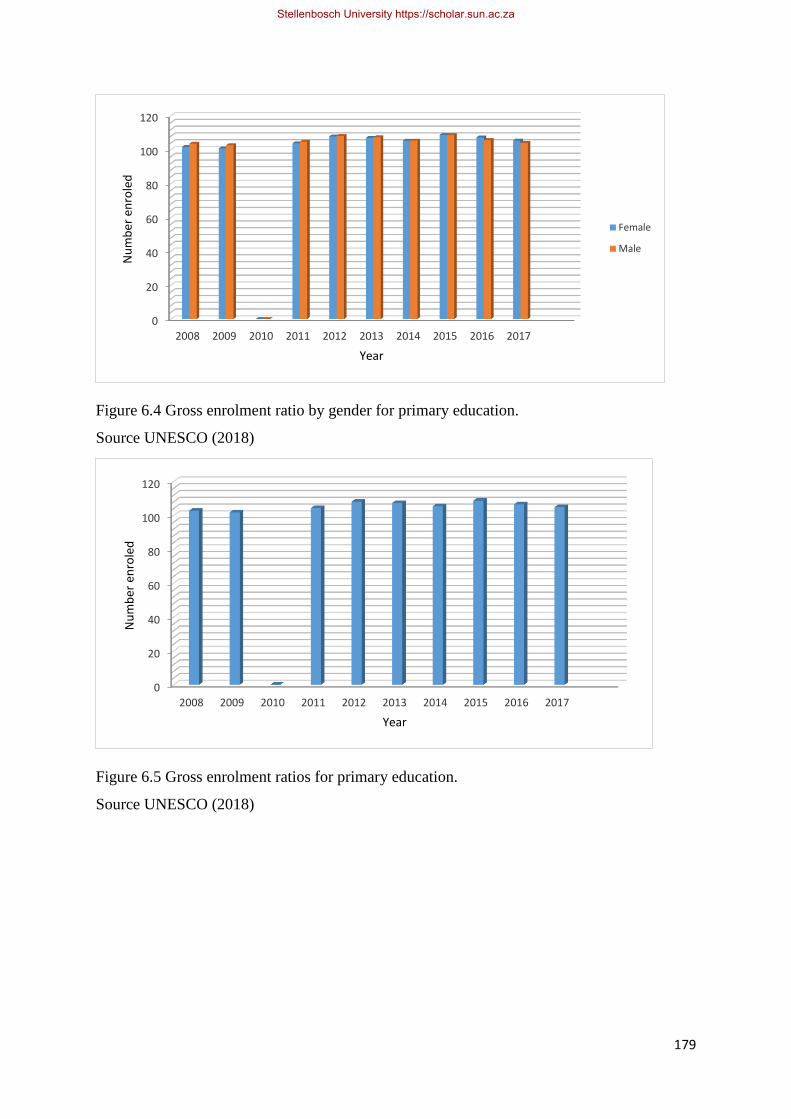
179
Figure 6.4 Gross enrolment ratio by gender for primary education.
Source UNESCO (2018)
Figure 6.5 Gross enrolment ratios for primary education.
Source UNESCO (2018)
0
20
40
60
80
100
120
2008 2009 2010 2011 2012 2013 2014 2015 2016 2017
Nu
mb
er e
nro
led
Year
Female
Male
0
20
40
60
80
100
120
2008 2009 2010 2011 2012 2013 2014 2015 2016 2017
Nu
mb
er e
nro
led
Year
Stellenbosch University https://scholar.sun.ac.za
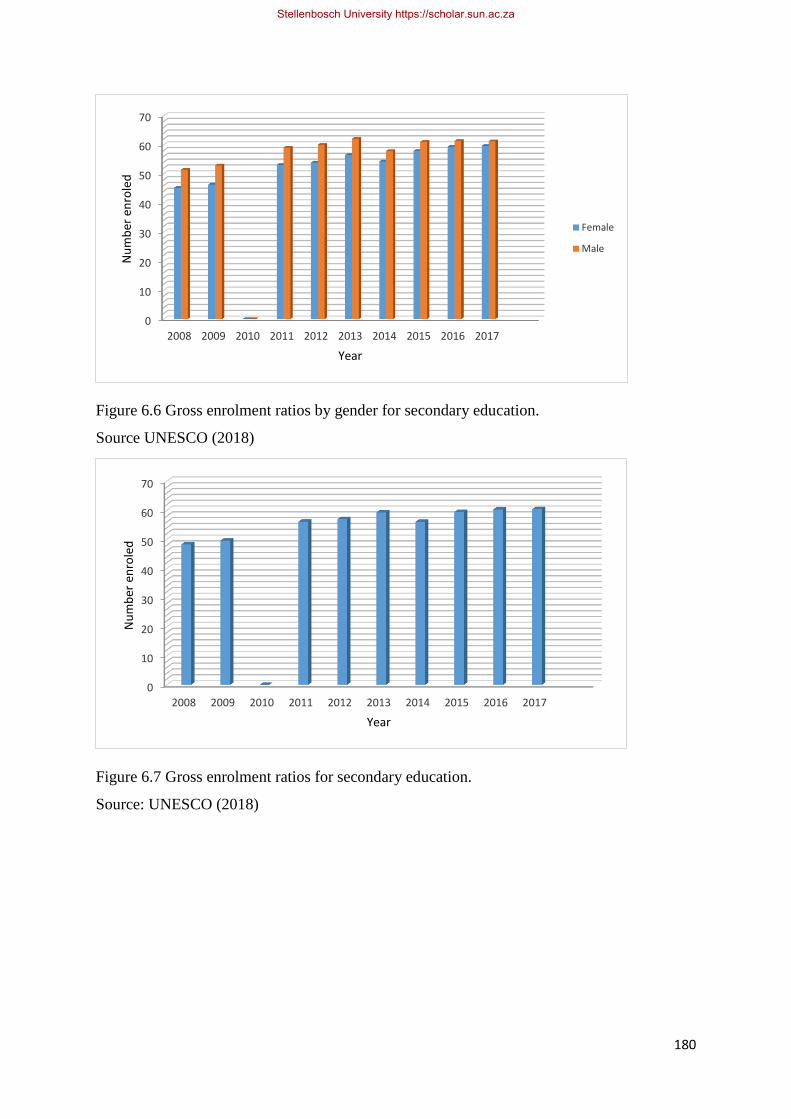
180
Figure 6.6 Gross enrolment ratios by gender for secondary education.
Source UNESCO (2018)
Figure 6.7 Gross enrolment ratios for secondary education.
Source: UNESCO (2018)
0
10
20
30
40
50
60
70
2008 2009 2010 2011 2012 2013 2014 2015 2016 2017
Nu
mb
er e
nro
led
Year
Female
Male
0
10
20
30
40
50
60
70
2008 2009 2010 2011 2012 2013 2014 2015 2016 2017
Nu
mb
er e
nro
led
Year
Stellenbosch University https://scholar.sun.ac.za
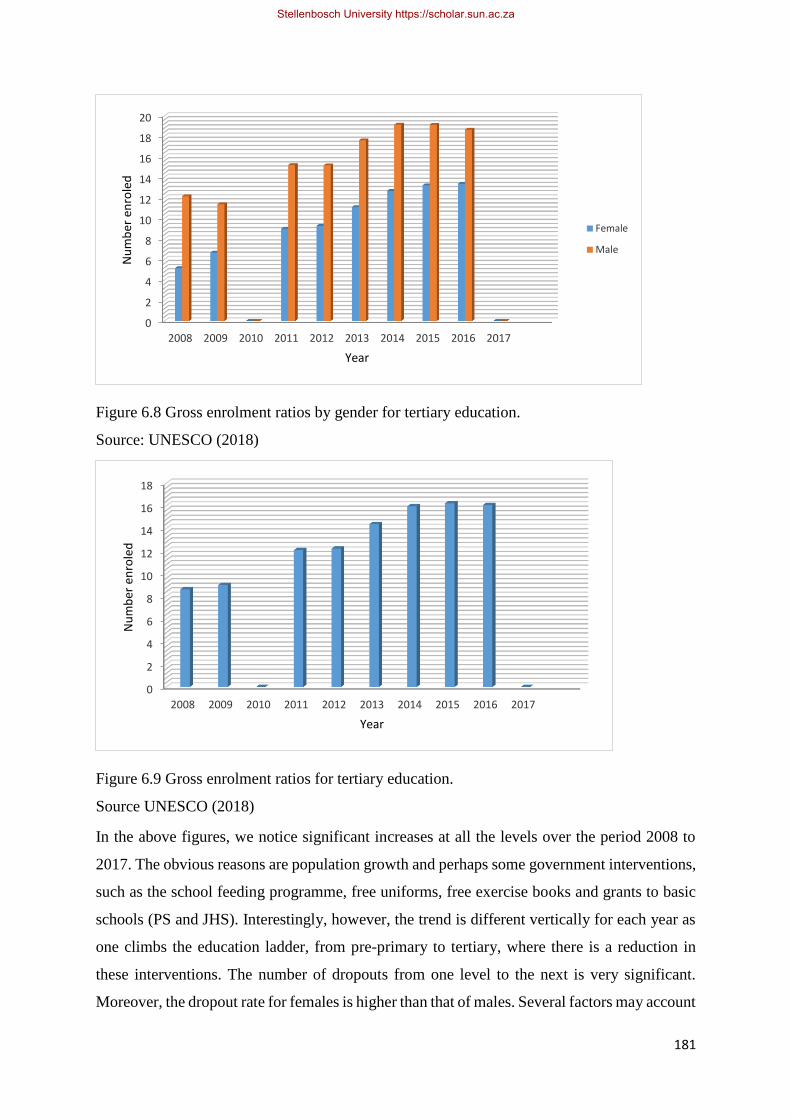
181
Figure 6.8 Gross enrolment ratios by gender for tertiary education.
Source: UNESCO (2018)
Figure 6.9 Gross enrolment ratios for tertiary education.
Source UNESCO (2018)
In the above figures, we notice significant increases at all the levels over the period 2008 to
2017. The obvious reasons are population growth and perhaps some government interventions,
such as the school feeding programme, free uniforms, free exercise books and grants to basic
schools (PS and JHS). Interestingly, however, the trend is different vertically for each year as
one climbs the education ladder, from pre-primary to tertiary, where there is a reduction in
these interventions. The number of dropouts from one level to the next is very significant.
Moreover, the dropout rate for females is higher than that of males. Several factors may account
0
2
4
6
8
10
12
14
16
18
20
2008 2009 2010 2011 2012 2013 2014 2015 2016 2017
Nu
mb
er e
nro
led
Year
Female
Male
0
2
4
6
8
10
12
14
16
18
2008 2009 2010 2011 2012 2013 2014 2015 2016 2017
Nu
mb
er e
nro
led
Year
Stellenbosch University https://scholar.sun.ac.za

182
for this dropout rates, including cost of higher education and other social factors affecting both
sexes but disadvantaging females more than males.
Of interest to us however, is tertiary education where the increases have been consistent over
the years. The role of the university in this sense has been to determine how to accommodate
these increases without compromising on quality. As already indicated in sub-section 6.2, the
university through its training of manpower, contributes directly to national development by
the kind of graduates it produces. The massification of higher education must therefore be an
issue of concern for HE managers in order not to water down the training of the skilled labour
needed for the world of work and by implication social and economic development. The fact
remains that, with various interventions – both nationally and globally – the number of school
enrolments at basic level will continue to grow and feed into the tertiary education sector.
Over the years, KNUST has not been able to admit all qualified applicants who apply for
admission. The same goes for all the other public universities in Ghana. Figure 6.10 below
illustrates the trends for KNUST over the past ten years. Clearly, the university has not been
able to admit all qualified applicants, and hence, there remains a considerable enrolment gap.
Besides, it is not all those who are admitted who actually enrol and register for the programmes
offered to them. Between 2012 and 2014, the intake into universities in Ghana were doubled
to absorb a backlog created as a result of changing the number of years for SHSs from four to
three years. This came with its own challenges of overcrowding of lecture halls and halls of
residence.
Figure 6.10 Enrolment trends for KNUST 2007–2017
0
5000
10000
15000
20000
25000
30000
35000
40000
Nu
mb
er
qu
alif
ied
/ad
mit
ted
Academic year
Qualified Applicants
Admitted Applicants
Stellenbosch University https://scholar.sun.ac.za
183
The author believes that some of the productive workforce needed for economic and social
development can be provided by tertiary education sector. From the above trends, we notice an
enrolment gap from the pre-tertiary level to the tertiary level despite efforts by the university
to increase its intake. This may be attributed to inadequate government subsidies and other
interventions at pre-tertiary level. Besides, the challenge of inadequate staff and space caused
by inadequate infrastructure, such as lecture rooms, laboratories and other teaching and
learning materials, accounts for the restricted numbers of students admitted into tertiary
programmes (QAPU, 2017). Manpower development in Ghana, directly linked to socio-
economic development, is suffering as a result of a non-expanding economy, which is unable
to absorb even the small numbers of graduates from our tertiary institutions. Having said that,
the growth and expansion of the economy are factors that ought to be given serious attention
because evidence exists to show that there is a high level of graduate unemployment in the
country (UNCT, 2017). All the same, tertiary education, especially at post-graduate level,
produces part of the skill set and research infrastructure necessary for national development.
6.4 The role of the university in healthcare
This section examines the health sub-sector and the role the university could play to help
achieve its set objectives of providing adequate healthcare for all Ghanaians. In 2017 the health
and social work sub-sector recorded the highest year-on-year quarterly GDP growth rate of
24% (GSS, 2017b). In Ghana, the health sector is no different from the educational sector in
terms of the existence of pragmatic interventions but less than expected returns [GSS], 2017b).
This sector has not fully utilised the expertise that exist within the university [GSS], 2017b).
The existence of health research in the university is in no doubt but the question still remains
about the awareness of research findings and how and where they can be applied. It is on record
([GSS], 2017b), though, that the health sector, unlike the agricultural and educational sectors,
has benefited from research carried out by the university. A case in point is the Kumasi Centre
for Collaborative Research (KCCR) of the School of Medical Sciences (SMS) at KNUST.
KCCR is an international platform for biomedical research, which brings together a network
of researchers and scientists to conduct research in tropical diseases. As part of its objectives,
the centre develops world-standard research programmes for post-graduates and technical staff
(KCCR, 2017). Its operations are based on close collaboration between KNUST SMS and the
German Benhard-Nocht Institute for Tropical Medicine (BNITM). Scientists and researchers
from other institutions are given access to the Centre to carry out research which in the long
run benefits the nation (KCCR, 2017).
Stellenbosch University https://scholar.sun.ac.za
184
The Ghana National Healthcare Policy Strategy 2017–2021 reflects a healthcare strategy which
calls for improved healthcare at all levels through coordinated health related activities
(Ministry of Health [MoH], 2016). Accordingly, one of the key areas to address in improving
quality healthcare initiatives is to involve the private sector and teaching hospitals to implement
some health initiatives. The Ghana Health Service, responsible for the provision of healthcare
delivery, has been working hand in hand with the nation’s teaching hospitals, namely Korle-
Bu Teaching Hospital in Accra, Komfo Anokye Teaching Hospital in Kumasi, and the Tamale
Teaching Hospital in the northern part of the country. These hospitals have academics and
researchers responsible for the training of medical doctors, pharmacists, nurses and other
paramedics. Research carried out by these researchers goes directly into teaching and practice,
and therefore goes a long way to improve the health delivery system of the nation. The
university and its researchers who work with these teaching hospitals, make significant
contributions towards healthcare delivery and thus national development in the long run.
The Ministry of Health’s 2014 holistic assessment of the health sector programme of work
indicated modest and mixed performance of the health sector (MoH, 2014). For example, there
was improvement in child mortality ((MoH, 2014). Infant mortality was said to have reduced
from 50 to 41 per 1 000 live births (MoH, 2014)), and under-5 mortality dropped from 80 per
1000 to 60 per 1 000 live births (MoH, 2014). One reason that was cited for the mixed
performance of the health sector was financial challenges leading to poor implementation of
key milestone activities. The MoH in 2014 recorded a performance Scale ranging from 0–5,
i.e. from severely underperforming (0–1), underperforming (1–2), stagnant (2–3), moderately
performing (3–4) to highly performing (4–5), which is below expectation (MoH, 2014). The
overall score of the sector for 2104 was 3, representing a moderately performing health system
(MoH, 2014). Applying the same scale to the six objectives of the ministry gave mixed
assessment scores. In its 2016 annual report, the Ghana Health Service, the largest public sector
agency, under the MoH, responsible for the provision of healthcare in the country, indicated an
overall slight improvement in the delivery of healthcare (Ghana Health Service, 2017). Targets
were met for some services (such as neonatal mortality) while others (such as immunisations)
fell short of expectation. The MoH fell short of its projected reduction of the mortality rate
from 19.6% in 2015 to 18% with neonatal mortality instead increasing by 18%. It however,
achieved 90.6% coverage in national immunisation in 2016 (Ghana Health Service, 2017).
Table 6.2 below gives the performance scale for the health system in Ghana for 2014.
Stellenbosch University https://scholar.sun.ac.za
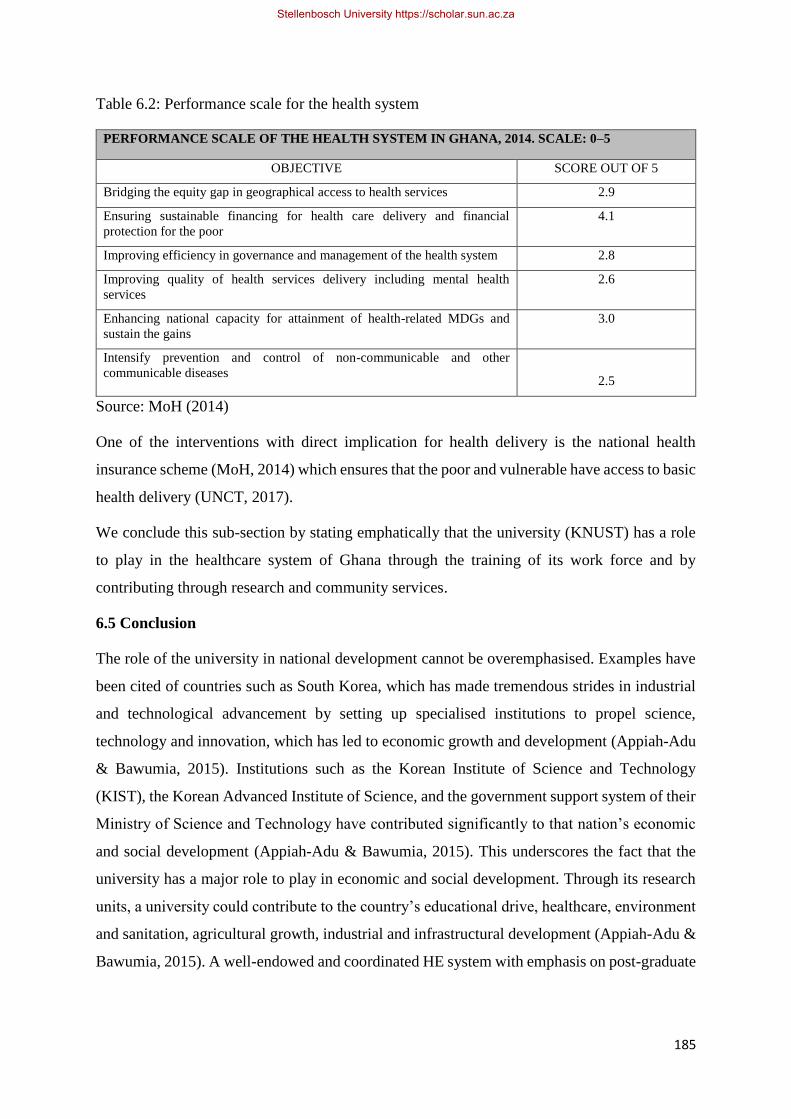
185
Table 6.2: Performance scale for the health system
PERFORMANCE SCALE OF THE HEALTH SYSTEM IN GHANA, 2014. SCALE: 0–5
OBJECTIVE SCORE OUT OF 5
Bridging the equity gap in geographical access to health services 2.9
Ensuring sustainable financing for health care delivery and financial
protection for the poor
4.1
Improving efficiency in governance and management of the health system 2.8
Improving quality of health services delivery including mental health
services
2.6
Enhancing national capacity for attainment of health-related MDGs and
sustain the gains
3.0
Intensify prevention and control of non-communicable and other
communicable diseases
2.5
Source: MoH (2014)
One of the interventions with direct implication for health delivery is the national health
insurance scheme (MoH, 2014) which ensures that the poor and vulnerable have access to basic
health delivery (UNCT, 2017).
We conclude this sub-section by stating emphatically that the university (KNUST) has a role
to play in the healthcare system of Ghana through the training of its work force and by
contributing through research and community services.
6.5 Conclusion
The role of the university in national development cannot be overemphasised. Examples have
been cited of countries such as South Korea, which has made tremendous strides in industrial
and technological advancement by setting up specialised institutions to propel science,
technology and innovation, which has led to economic growth and development (Appiah-Adu
& Bawumia, 2015). Institutions such as the Korean Institute of Science and Technology
(KIST), the Korean Advanced Institute of Science, and the government support system of their
Ministry of Science and Technology have contributed significantly to that nation’s economic
and social development (Appiah-Adu & Bawumia, 2015). This underscores the fact that the
university has a major role to play in economic and social development. Through its research
units, a university could contribute to the country’s educational drive, healthcare, environment
and sanitation, agricultural growth, industrial and infrastructural development (Appiah-Adu &
Bawumia, 2015). A well-endowed and coordinated HE system with emphasis on post-graduate
Stellenbosch University https://scholar.sun.ac.za
186
training and research can be a strong backbone for sustainable national development (Appiah-
Adu & Bawumia, 2015).
Another classic example of how the university could contribute to national development is seen
in the recent DRUSSA Policy Fellowship scheme which assigned researchers from the
university to specific ministries to facilitate the inclusion of academic research into policy
making (DRUSSA, 2015).
From the above discussions of the various national priority areas, we can conclude that the
university has a meaningful role to play in almost all sectors of national development. In terms
of research output, the university can boast of some modest achievements in the Faculties of
Agriculture, Engineering, Humanities, Science, Medicine and Pharmacy. Other areas of
research within the university have led to innovations such as water filters, fuel efficient cook
stoves and ovens. By synchronising local and national research needs to those of the university,
greater benefits will be derived from research and innovations. For example, the installation of
the biomass cookstove in some secondary schools in the Ashanti Region of Ghana has led to a
significant reduction in the dependence of fuel wood; thus, the forest is protected from being
over-exploited for fire wood.
There is the need for better synergy in scientific collaboration among universities and
government ministries. The university’s strategic goals aim at socio-economic development
much the same way as the strategic goals set by government but there is a disconnect between
the two. What remains to be done, is the harnessing of the rich resources that already exist in
the nation’s tertiary institutions. Clear-cut policy regimes and the political will are needed to
tap these potentials. Universities in Ghana – and indeed KNUST – could play meaningful roles
in all areas of national development. This will however depend on the extent of the levels of
engagement between the university and development partners. As discussed in the previous
chapters, there is the need to strengthen the triple helix to ensure proper synergy and effective
collaboration, which will lead to achieving mutual goals. Again, the channels and mechanisms
of stakeholder engagement, discussed in Chapter 8, are worth considering.
Stellenbosch University https://scholar.sun.ac.za
187
CHAPTER 7 – SURVEY RESULTS AND ANALYSIS
7.1 Introduction
This chapter discusses the demographic responses of the survey, and incorporates relevant
portions of the follow-up interviews that support and confirm the outcome of the survey. It
provides an analysis of the correlation between the demographics, research outputs and the
success of researchers in their research by establishing the relationships between gender, year
of birth (age), departments and/or faculties, position and academic qualification versus research
output of respondents over the previous three years. We also consider the implications of these
outputs for knowledge production, dissemination and uptake along the lines of the study
framework. In addition, we report on the research focus of the different faculties of the
university and how successful they have been in terms specific outcomes.
7.2 Distribution of researchers by faculties
Available statistics at the QAPU of the Vice-Chancellor’s Office indicated that there were
1 018 academic senior members in the university (KNUST 2017) The summary is as provided
in Figure 7.1 below:
Stellenbosch University https://scholar.sun.ac.za
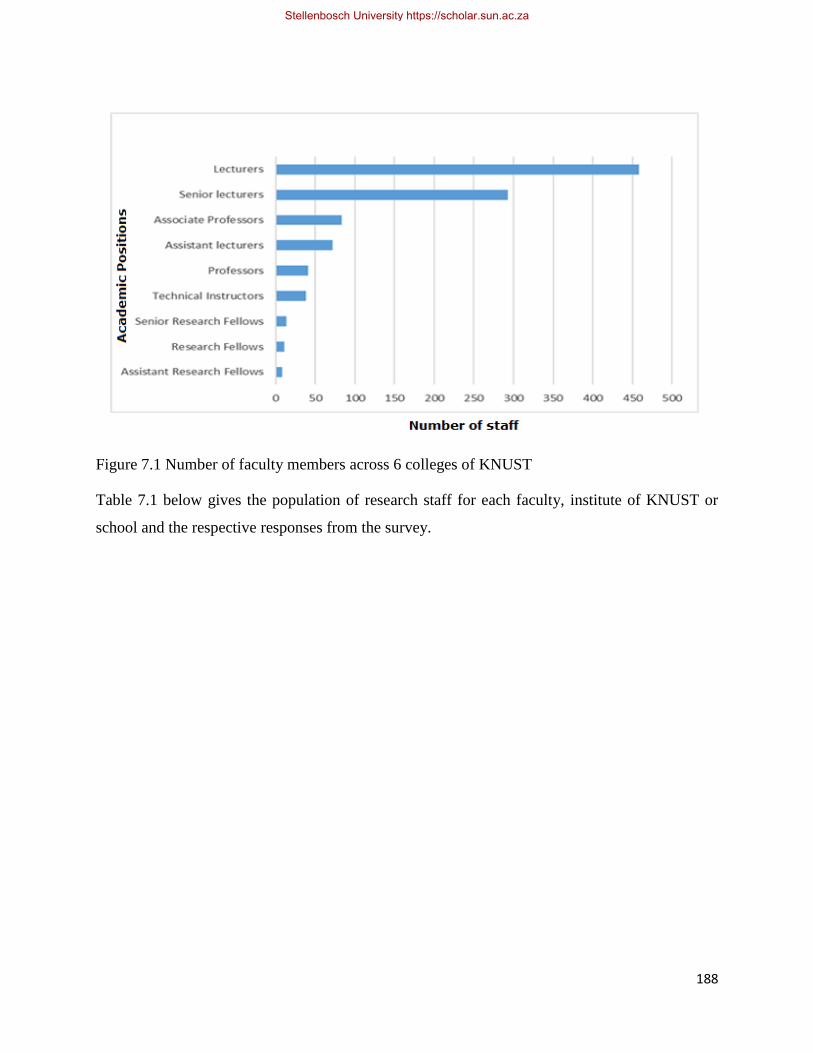
188
Figure 7.1 Number of faculty members across 6 colleges of KNUST
Table 7.1 below gives the population of research staff for each faculty, institute of KNUST or
school and the respective responses from the survey.
Stellenbosch University https://scholar.sun.ac.za

189
Table 7.1 Distribution of research staff by faculties or schools and institutes and survey
responses
COLLEGE FACULTIES POPULATION
Count
RESPONDENTS
Frequency and
percentage
College of Art and Built
Environment
(CABE)
Art 82 16 =19.5%
Built Environment 77 22 = 28.6%
Institute of Land Management and
Administration 7 **
SUB-TOTAL 166 -----
College of Agriculture and
Natural Resources
(CANR)
Agriculture 68 11 = 16.2%
Forest Resources Technology 13 1 = 7.7%
Renewable Natural Resources 48 8 = 16.7%
Bureau of Integrated Rural
Development 7 **
SUB-TOTAL 136 -----
College of Engineering
(COE)
Civil and Geo-Engineering 59 9 = 15.3%
Electrical and Computer Engineering 30 2 = 6.7%
Mechanical and Chemical
Engineering 69 10 = 14.5%
Technology Consultancy Centre 4 **
SUB-TOTAL 162 -----
College of Health Sciences
(CHS)
Allied Health Sciences 29 5 = 17.2%
Dental School 9 4 = 44.4%
Pharmacy and Pharmaceutical
Sciences 49 6 = 12.2%
School of Medical Sciences 136 20 = 14.7%
School of Public Health 2 1 = 50%
School of Veterinary Medicine 17 1 = 5.9%
SUB-TOTAL 242 -----
COLLEGE OF
HUMANITIES AND SOCIAL
SCIENCES (CHSS)
Law 18 No respondents
School of Business 43 11 = 25.6%
Social Sciences 115 15 = 13.0%
Stellenbosch University https://scholar.sun.ac.za
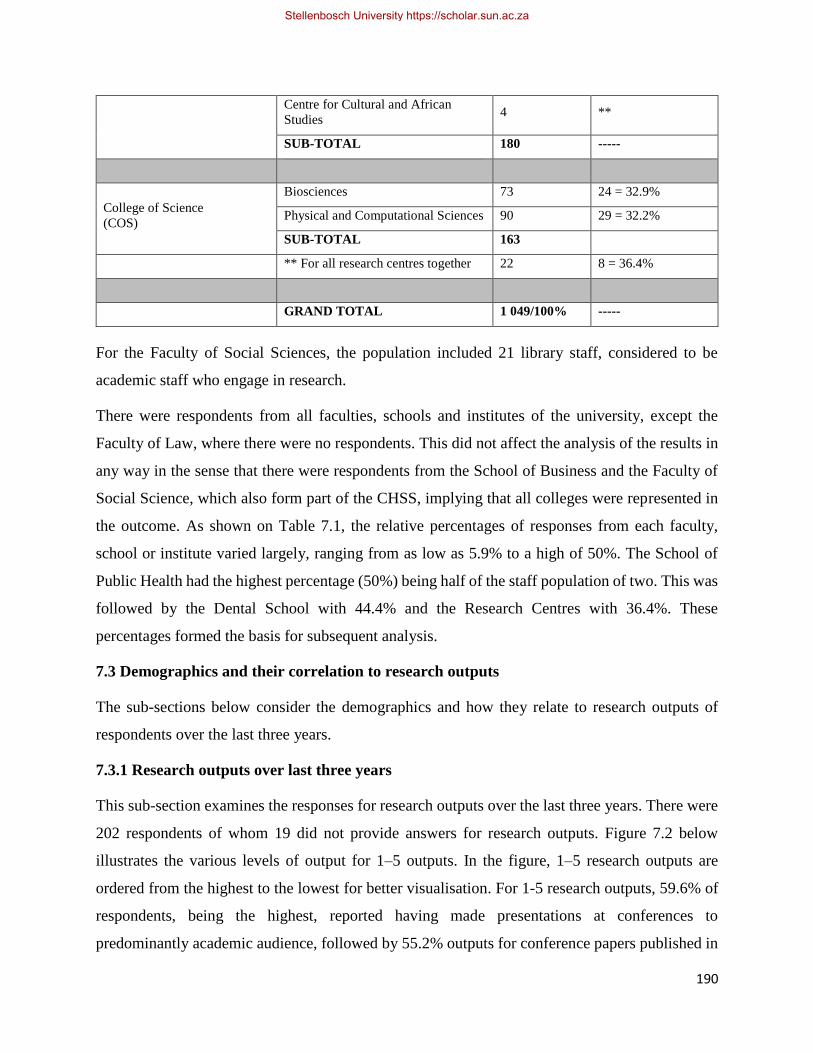
190
Centre for Cultural and African
Studies 4 **
SUB-TOTAL 180 -----
College of Science
(COS)
Biosciences 73 24 = 32.9%
Physical and Computational Sciences 90 29 = 32.2%
SUB-TOTAL 163
** For all research centres together 22 8 = 36.4%
GRAND TOTAL 1 049/100% -----
For the Faculty of Social Sciences, the population included 21 library staff, considered to be
academic staff who engage in research.
There were respondents from all faculties, schools and institutes of the university, except the
Faculty of Law, where there were no respondents. This did not affect the analysis of the results in
any way in the sense that there were respondents from the School of Business and the Faculty of
Social Science, which also form part of the CHSS, implying that all colleges were represented in
the outcome. As shown on Table 7.1, the relative percentages of responses from each faculty,
school or institute varied largely, ranging from as low as 5.9% to a high of 50%. The School of
Public Health had the highest percentage (50%) being half of the staff population of two. This was
followed by the Dental School with 44.4% and the Research Centres with 36.4%. These
percentages formed the basis for subsequent analysis.
7.3 Demographics and their correlation to research outputs
The sub-sections below consider the demographics and how they relate to research outputs of
respondents over the last three years.
7.3.1 Research outputs over last three years
This sub-section examines the responses for research outputs over the last three years. There were
202 respondents of whom 19 did not provide answers for research outputs. Figure 7.2 below
illustrates the various levels of output for 1–5 outputs. In the figure, 1–5 research outputs are
ordered from the highest to the lowest for better visualisation. For 1-5 research outputs, 59.6% of
respondents, being the highest, reported having made presentations at conferences to
predominantly academic audience, followed by 55.2% outputs for conference papers published in
Stellenbosch University https://scholar.sun.ac.za
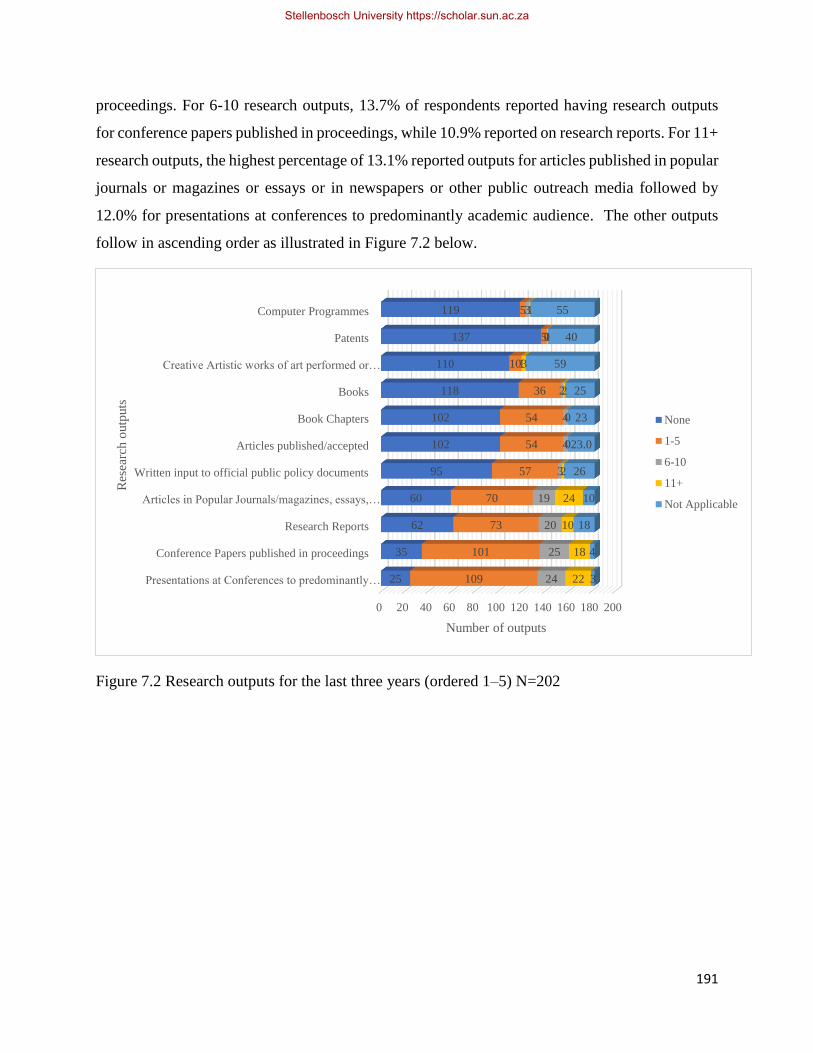
191
proceedings. For 6-10 research outputs, 13.7% of respondents reported having research outputs
for conference papers published in proceedings, while 10.9% reported on research reports. For 11+
research outputs, the highest percentage of 13.1% reported outputs for articles published in popular
journals or magazines or essays or in newspapers or other public outreach media followed by
12.0% for presentations at conferences to predominantly academic audience. The other outputs
follow in ascending order as illustrated in Figure 7.2 below.
Figure 7.2 Research outputs for the last three years (ordered 1–5) N=202
0 20 40 60 80 100 120 140 160 180 200
Presentations at Conferences to predominantly…
Conference Papers published in proceedings
Research Reports
Articles in Popular Journals/magazines, essays,…
Written input to official public policy documents
Articles published/accepted
Book Chapters
Books
Creative Artistic works of art performed or…
Patents
Computer Programmes
25
35
62
60
95
102
102
118
110
137
119
109
101
73
70
57
54
54
36
10
5
5
24
25
20
19
3
4
4
2
1
0
3
22
18
10
24
2
0
0
2
3
1
1
3
4
18
10
26
23.0
23
25
59
40
55
Number of outputs
Res
earc
h o
utp
uts
None
1-5
6-10
11+
Not Applicable
Stellenbosch University https://scholar.sun.ac.za
192
In Table 7.2 below and the illustration in Figure 7.2 above, it can be observed that in terms of
percentages, the highest number of research outputs over the last three years for 11+ outputs
comprised articles in popular journals or magazines, essays or in newspapers or other public
outreach media. The second highest was presentations at conferences to predominantly academic
audiences. In the first two instances, that is 1–5 and 6–10 research outputs, the top three output
areas included articles published or accepted, presentations at conferences to predominantly
academic audiences and conference papers published in proceedings. These areas of research
output also feature prominently for 11+ outputs in addition to articles in popular journals or
magazines, essays or in newspapers or other public outreach media. These results provide the main
areas of research focus by researchers and academics of the university.
Table 7.2 and Figure 7.3 below provide the results for research output areas for the most productive
to the least productive areas.
Stellenbosch University https://scholar.sun.ac.za
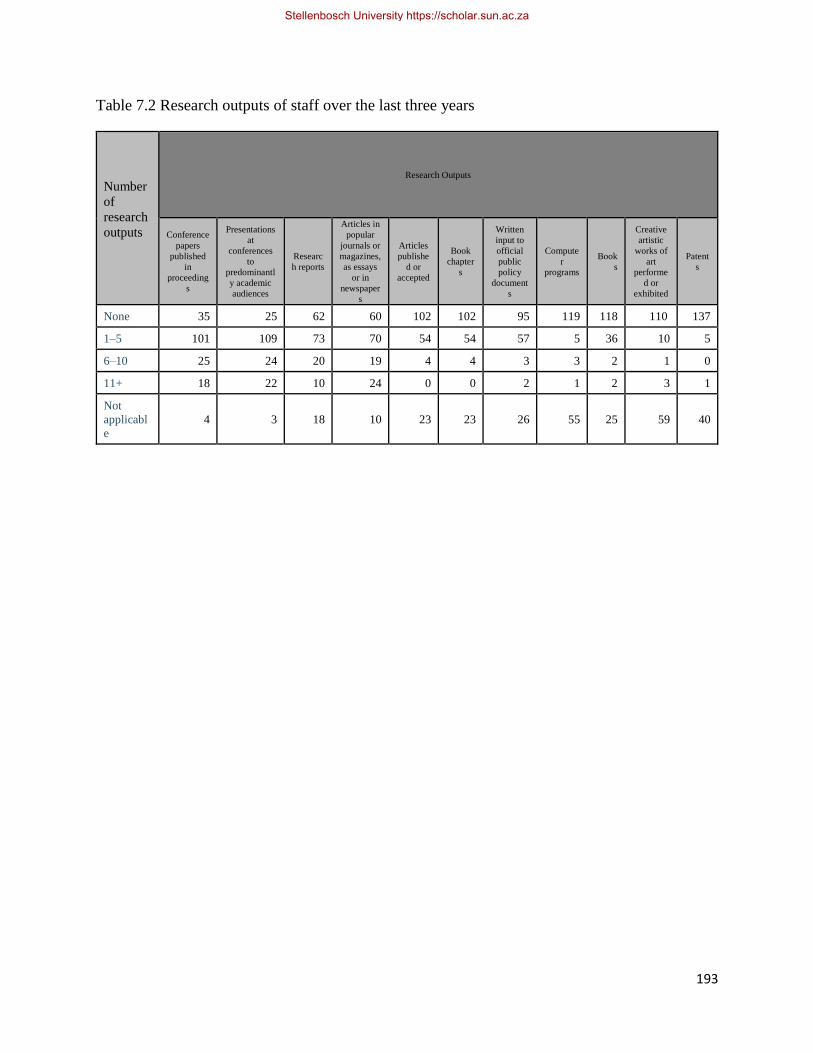
193
Table 7.2 Research outputs of staff over the last three years
Number
of
research
outputs
Research Outputs
Conference
papers
published
in
proceeding
s
Presentations
at
conferences
to
predominantl
y academic
audiences
Researc
h reports
Articles in
popular
journals or
magazines,
as essays
or in
newspaper
s
Articles
publishe
d or
accepted
Book
chapter
s
Written
input to
official
public
policy
document
s
Compute
r
programs
Book
s
Creative
artistic
works of
art
performe
d or
exhibited
Patent
s
None 35 25 62 60 102 102 95 119 118 110 137
1–5 101 109 73 70 54 54 57 5 36 10 5
6–10 25 24 20 19 4 4 3 3 2 1 0
11+ 18 22 10 24 0 0 2 1 2 3 1
Not
applicabl
e
4 3 18 10 23 23 26 55 25 59 40
Stellenbosch University https://scholar.sun.ac.za
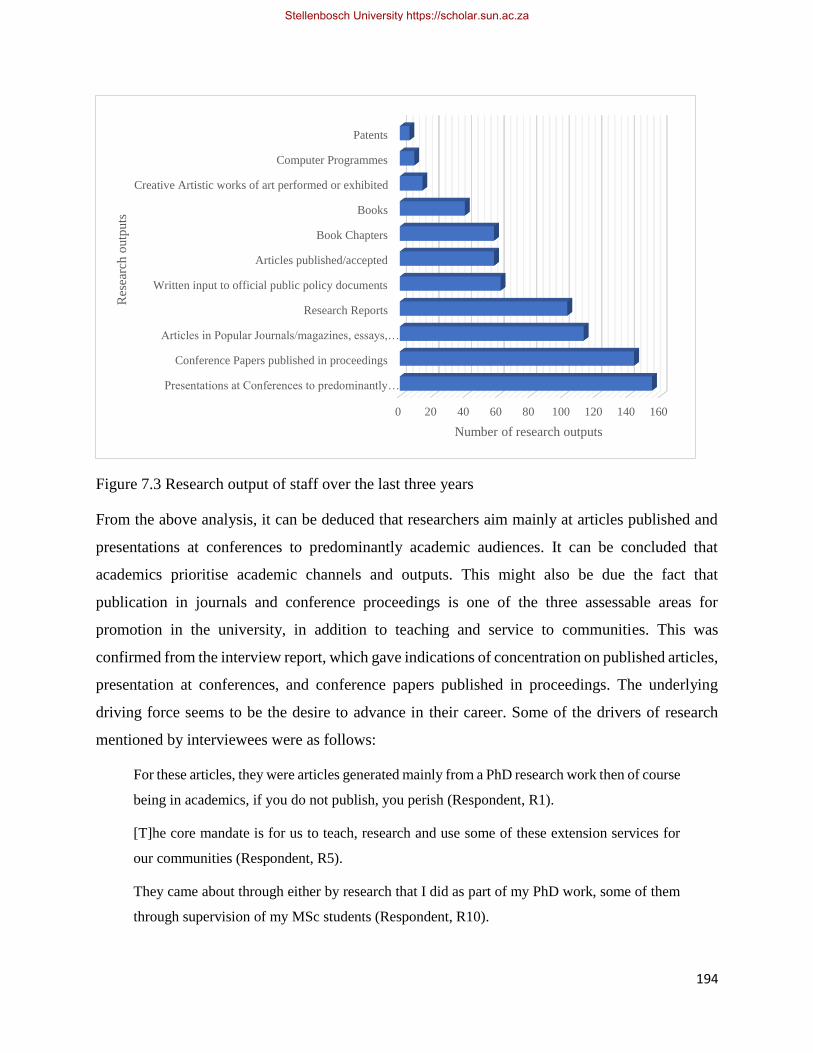
194
Figure 7.3 Research output of staff over the last three years
From the above analysis, it can be deduced that researchers aim mainly at articles published and
presentations at conferences to predominantly academic audiences. It can be concluded that
academics prioritise academic channels and outputs. This might also be due the fact that
publication in journals and conference proceedings is one of the three assessable areas for
promotion in the university, in addition to teaching and service to communities. This was
confirmed from the interview report, which gave indications of concentration on published articles,
presentation at conferences, and conference papers published in proceedings. The underlying
driving force seems to be the desire to advance in their career. Some of the drivers of research
mentioned by interviewees were as follows:
For these articles, they were articles generated mainly from a PhD research work then of course
being in academics, if you do not publish, you perish (Respondent, R1).
[T]he core mandate is for us to teach, research and use some of these extension services for
our communities (Respondent, R5).
They came about through either by research that I did as part of my PhD work, some of them
through supervision of my MSc students (Respondent, R10).
0 20 40 60 80 100 120 140 160
Presentations at Conferences to predominantly…
Conference Papers published in proceedings
Articles in Popular Journals/magazines, essays,…
Research Reports
Written input to official public policy documents
Articles published/accepted
Book Chapters
Books
Creative Artistic works of art performed or exhibited
Computer Programmes
Patents
Number of research outputs
Res
earc
h o
utp
uts
Stellenbosch University https://scholar.sun.ac.za
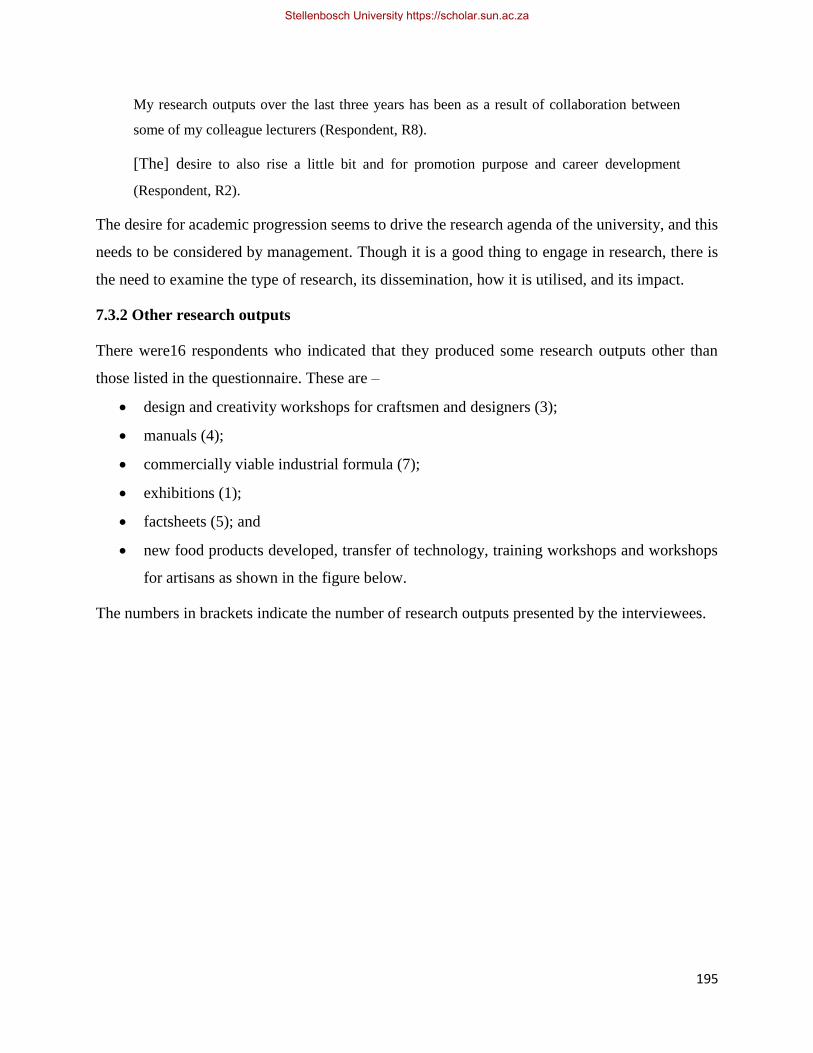
195
My research outputs over the last three years has been as a result of collaboration between
some of my colleague lecturers (Respondent, R8).
[The] desire to also rise a little bit and for promotion purpose and career development
(Respondent, R2).
The desire for academic progression seems to drive the research agenda of the university, and this
needs to be considered by management. Though it is a good thing to engage in research, there is
the need to examine the type of research, its dissemination, how it is utilised, and its impact.
7.3.2 Other research outputs
There were16 respondents who indicated that they produced some research outputs other than
those listed in the questionnaire. These are –
• design and creativity workshops for craftsmen and designers (3);
• manuals (4);
• commercially viable industrial formula (7);
• exhibitions (1);
• factsheets (5); and
• new food products developed, transfer of technology, training workshops and workshops
for artisans as shown in the figure below.
The numbers in brackets indicate the number of research outputs presented by the interviewees.
Stellenbosch University https://scholar.sun.ac.za

196
Figure 7.4 Other research outputs
It must be noted that some researchers from the Faculty of Art and the Technology Consultancy
Centre (TCC) engage their stakeholders through design and creativity workshops, which seem
more interactive and involve the stakeholders throughout the research process. In such instances,
the stakeholders feel part of the entire process and there is joint ownership of the results leading to
utilisation and uptake.
7.3.3 Number of respondents by position
The number of respondents by position reduces towards the higher ranks with the number of full
professors being the lowest. The junior ranks, being the majority, occupied the base of the pyramid.
This is to be expected since there are more members of staff within the junior ranks than in senior
positions. The responses by position are given in Figure 7.5 below.
0
1
2
3
4
5
6
7N
um
ber
of
outp
uts
Other research outputs
Stellenbosch University https://scholar.sun.ac.za
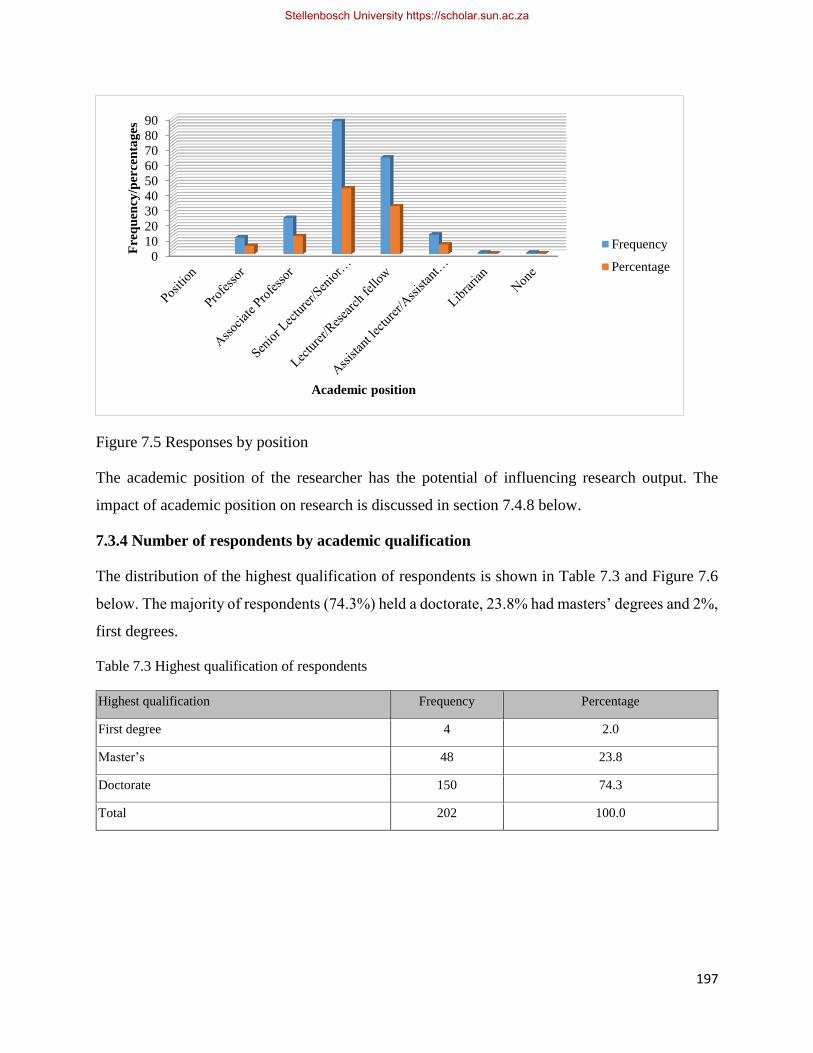
197
Figure 7.5 Responses by position
The academic position of the researcher has the potential of influencing research output. The
impact of academic position on research is discussed in section 7.4.8 below.
7.3.4 Number of respondents by academic qualification
The distribution of the highest qualification of respondents is shown in Table 7.3 and Figure 7.6
below. The majority of respondents (74.3%) held a doctorate, 23.8% had masters’ degrees and 2%,
first degrees.
Table 7.3 Highest qualification of respondents
Highest qualification Frequency Percentage
First degree 4 2.0
Master’s 48 23.8
Doctorate 150 74.3
Total 202 100.0
0
10
20
30
40
50
60
70
80
90F
req
uen
cy/p
erce
nta
ges
Academic position
Frequency
Percentage
Stellenbosch University https://scholar.sun.ac.za
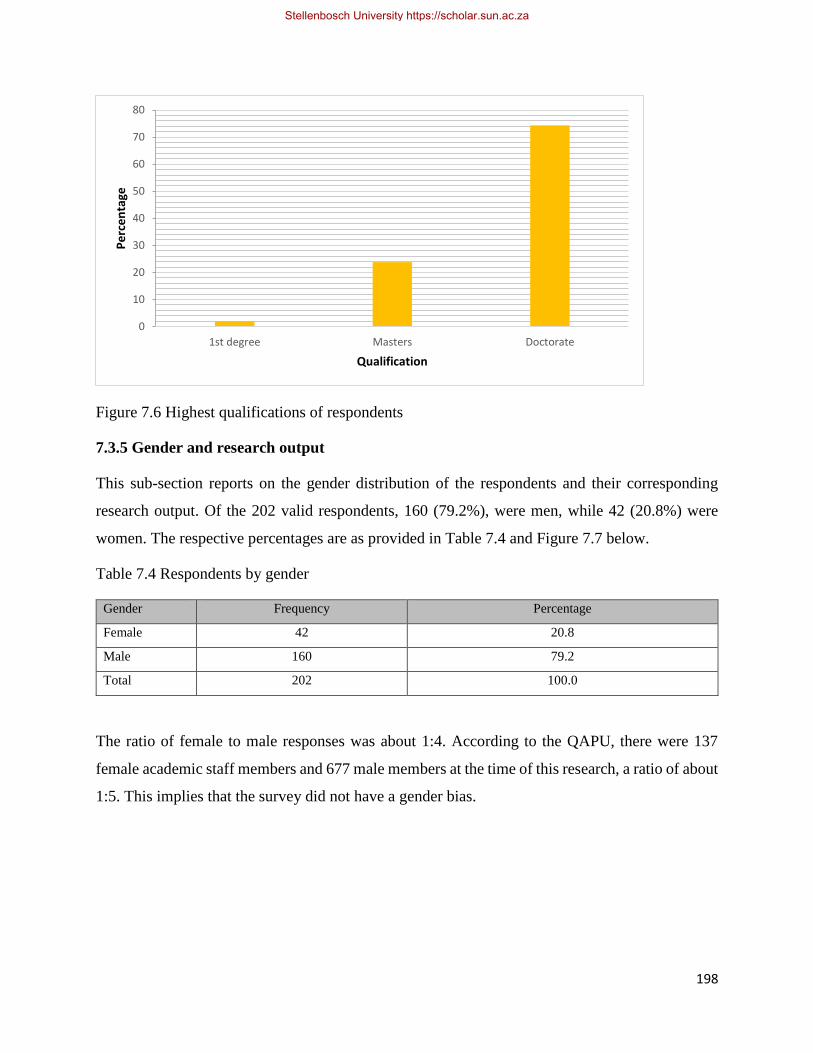
198
Figure 7.6 Highest qualifications of respondents
7.3.5 Gender and research output
This sub-section reports on the gender distribution of the respondents and their corresponding
research output. Of the 202 valid respondents, 160 (79.2%), were men, while 42 (20.8%) were
women. The respective percentages are as provided in Table 7.4 and Figure 7.7 below.
Table 7.4 Respondents by gender
Gender Frequency Percentage
Female 42 20.8
Male 160 79.2
Total 202 100.0
The ratio of female to male responses was about 1:4. According to the QAPU, there were 137
female academic staff members and 677 male members at the time of this research, a ratio of about
1:5. This implies that the survey did not have a gender bias.
0
10
20
30
40
50
60
70
80
1st degree Masters Doctorate
Pe
rce
nta
ge
Qualification
Stellenbosch University https://scholar.sun.ac.za
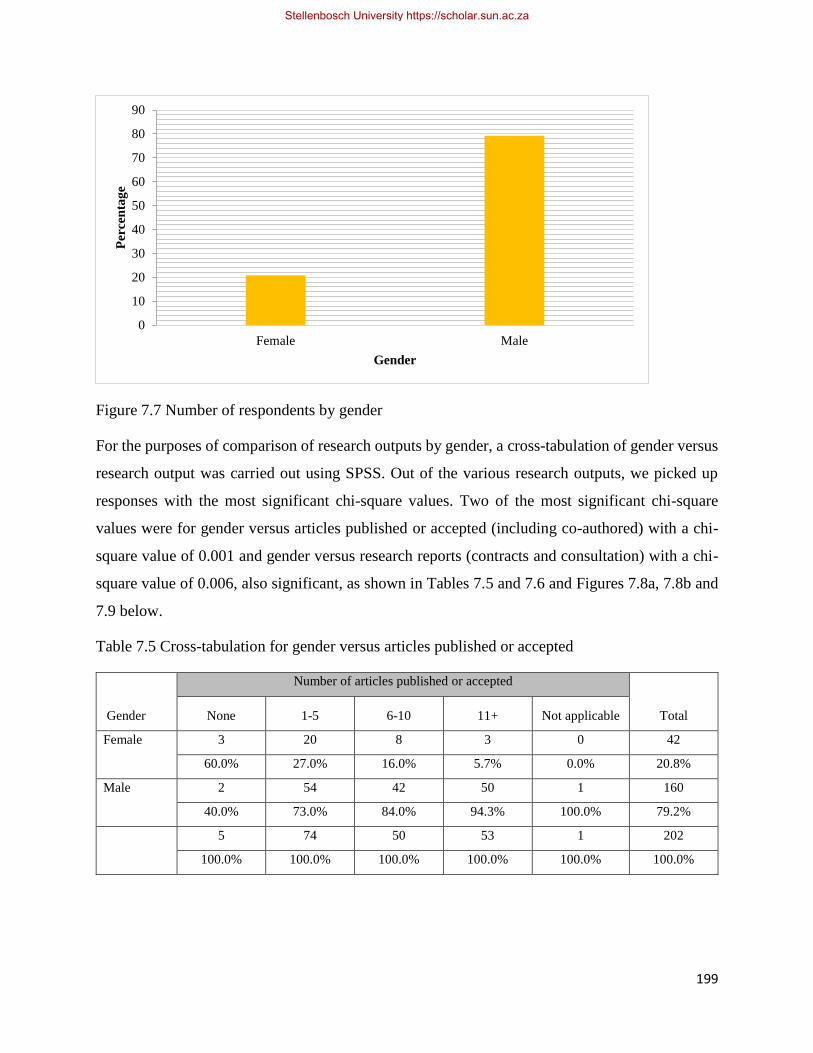
199
Figure 7.7 Number of respondents by gender
For the purposes of comparison of research outputs by gender, a cross-tabulation of gender versus
research output was carried out using SPSS. Out of the various research outputs, we picked up
responses with the most significant chi-square values. Two of the most significant chi-square
values were for gender versus articles published or accepted (including co-authored) with a chi-
square value of 0.001 and gender versus research reports (contracts and consultation) with a chi-
square value of 0.006, also significant, as shown in Tables 7.5 and 7.6 and Figures 7.8a, 7.8b and
7.9 below.
Table 7.5 Cross-tabulation for gender versus articles published or accepted
Gender
Number of articles published or accepted
Total None 1-5 6-10 11+ Not applicable
Female 3 20 8 3 0 42
60.0% 27.0% 16.0% 5.7% 0.0% 20.8%
Male 2 54 42 50 1 160
40.0% 73.0% 84.0% 94.3% 100.0% 79.2%
5 74 50 53 1 202
100.0% 100.0% 100.0% 100.0% 100.0% 100.0%
0
10
20
30
40
50
60
70
80
90
Female Male
Per
cen
tag
e
Gender
Stellenbosch University https://scholar.sun.ac.za
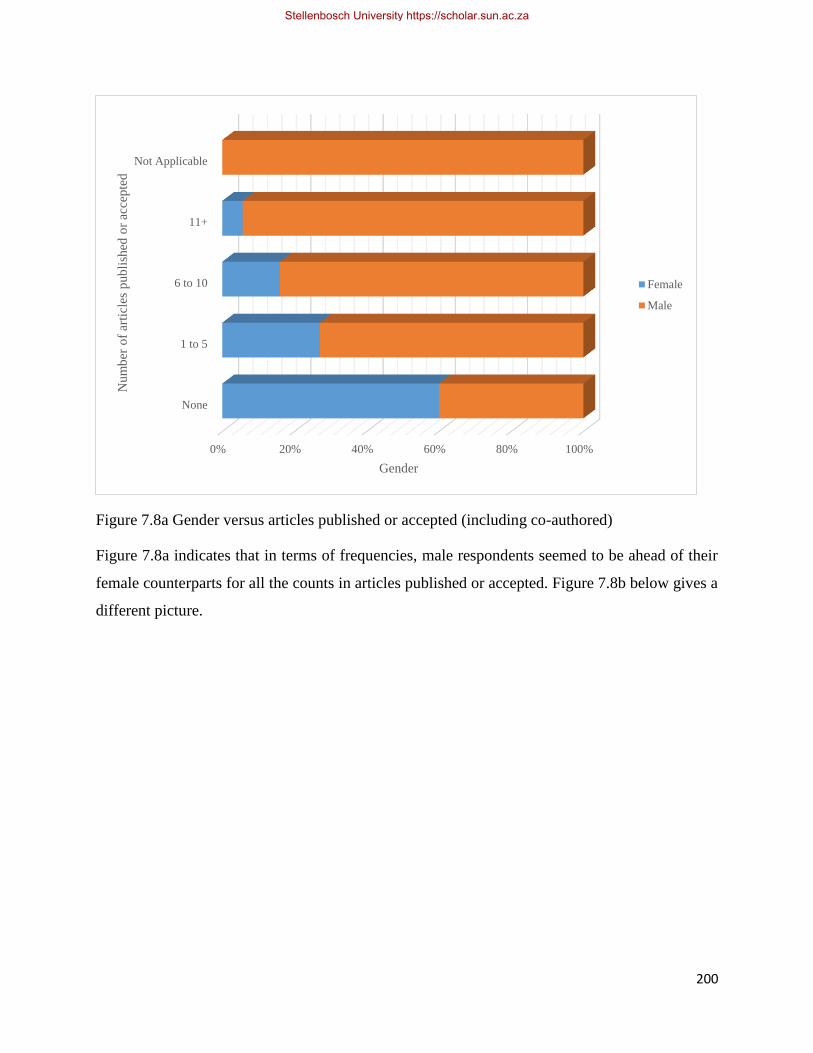
200
Figure 7.8a Gender versus articles published or accepted (including co-authored)
Figure 7.8a indicates that in terms of frequencies, male respondents seemed to be ahead of their
female counterparts for all the counts in articles published or accepted. Figure 7.8b below gives a
different picture.
0% 20% 40% 60% 80% 100%
None
1 to 5
6 to 10
11+
Not Applicable
Gender
Num
ber
of
arti
cles
pub
lish
ed o
r ac
cep
ted
Female
Male
Stellenbosch University https://scholar.sun.ac.za
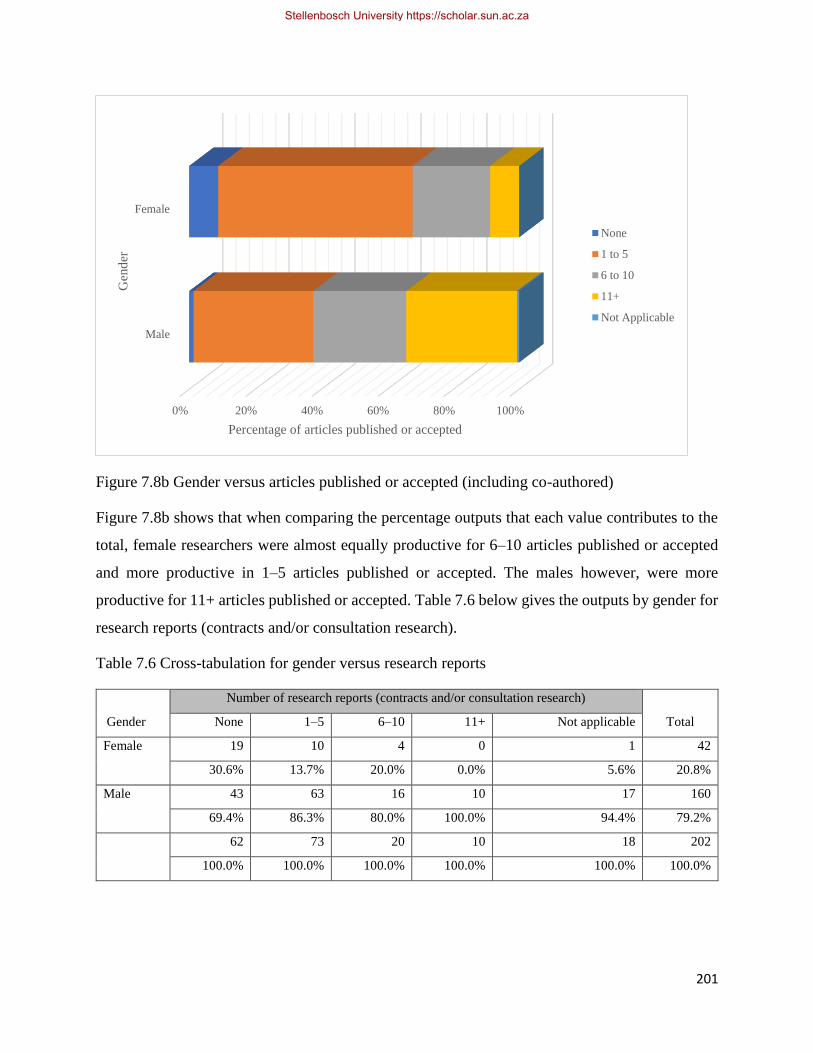
201
Figure 7.8b Gender versus articles published or accepted (including co-authored)
Figure 7.8b shows that when comparing the percentage outputs that each value contributes to the
total, female researchers were almost equally productive for 6–10 articles published or accepted
and more productive in 1–5 articles published or accepted. The males however, were more
productive for 11+ articles published or accepted. Table 7.6 below gives the outputs by gender for
research reports (contracts and/or consultation research).
Table 7.6 Cross-tabulation for gender versus research reports
Gender
Number of research reports (contracts and/or consultation research)
Total None 1–5 6–10 11+ Not applicable
Female 19 10 4 0 1 42
30.6% 13.7% 20.0% 0.0% 5.6% 20.8%
Male 43 63 16 10 17 160
69.4% 86.3% 80.0% 100.0% 94.4% 79.2%
62 73 20 10 18 202
100.0% 100.0% 100.0% 100.0% 100.0% 100.0%
0% 20% 40% 60% 80% 100%
Male
Female
Percentage of articles published or accepted
Gen
der
None
1 to 5
6 to 10
11+
Not Applicable
Stellenbosch University https://scholar.sun.ac.za
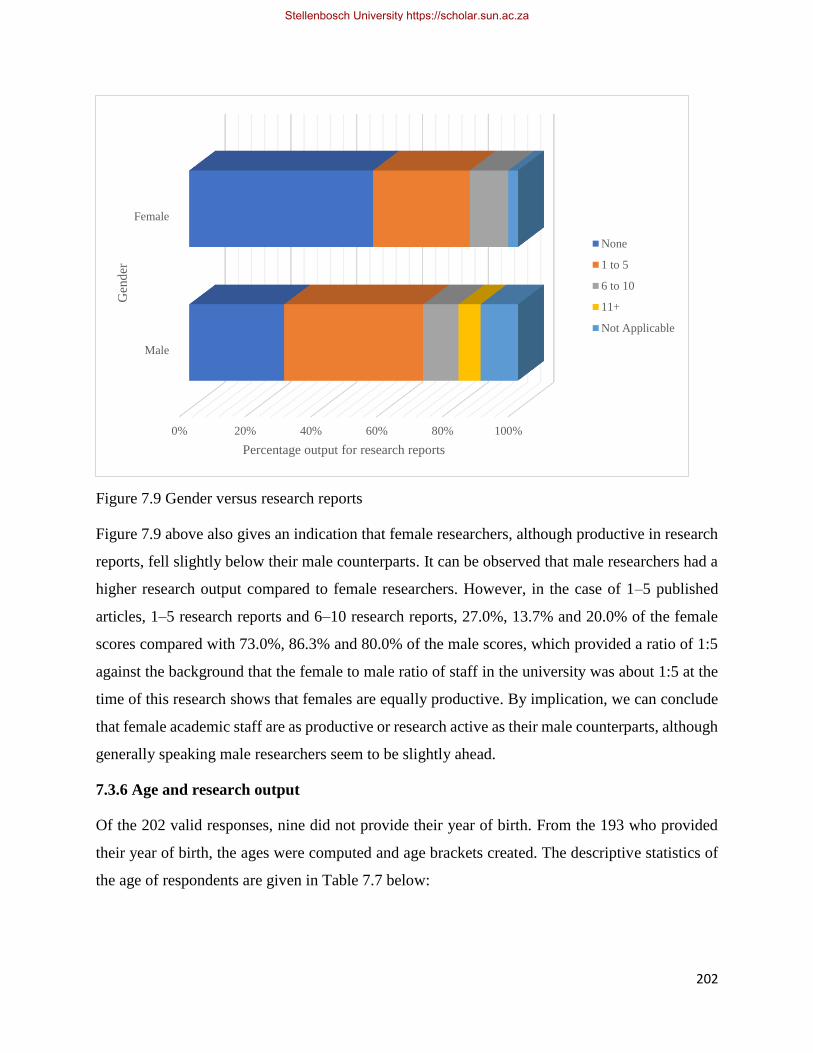
202
Figure 7.9 Gender versus research reports
Figure 7.9 above also gives an indication that female researchers, although productive in research
reports, fell slightly below their male counterparts. It can be observed that male researchers had a
higher research output compared to female researchers. However, in the case of 1–5 published
articles, 1–5 research reports and 6–10 research reports, 27.0%, 13.7% and 20.0% of the female
scores compared with 73.0%, 86.3% and 80.0% of the male scores, which provided a ratio of 1:5
against the background that the female to male ratio of staff in the university was about 1:5 at the
time of this research shows that females are equally productive. By implication, we can conclude
that female academic staff are as productive or research active as their male counterparts, although
generally speaking male researchers seem to be slightly ahead.
7.3.6 Age and research output
Of the 202 valid responses, nine did not provide their year of birth. From the 193 who provided
their year of birth, the ages were computed and age brackets created. The descriptive statistics of
the age of respondents are given in Table 7.7 below:
0% 20% 40% 60% 80% 100%
Male
Female
Percentage output for research reports
Gen
der
None
1 to 5
6 to 10
11+
Not Applicable
Stellenbosch University https://scholar.sun.ac.za
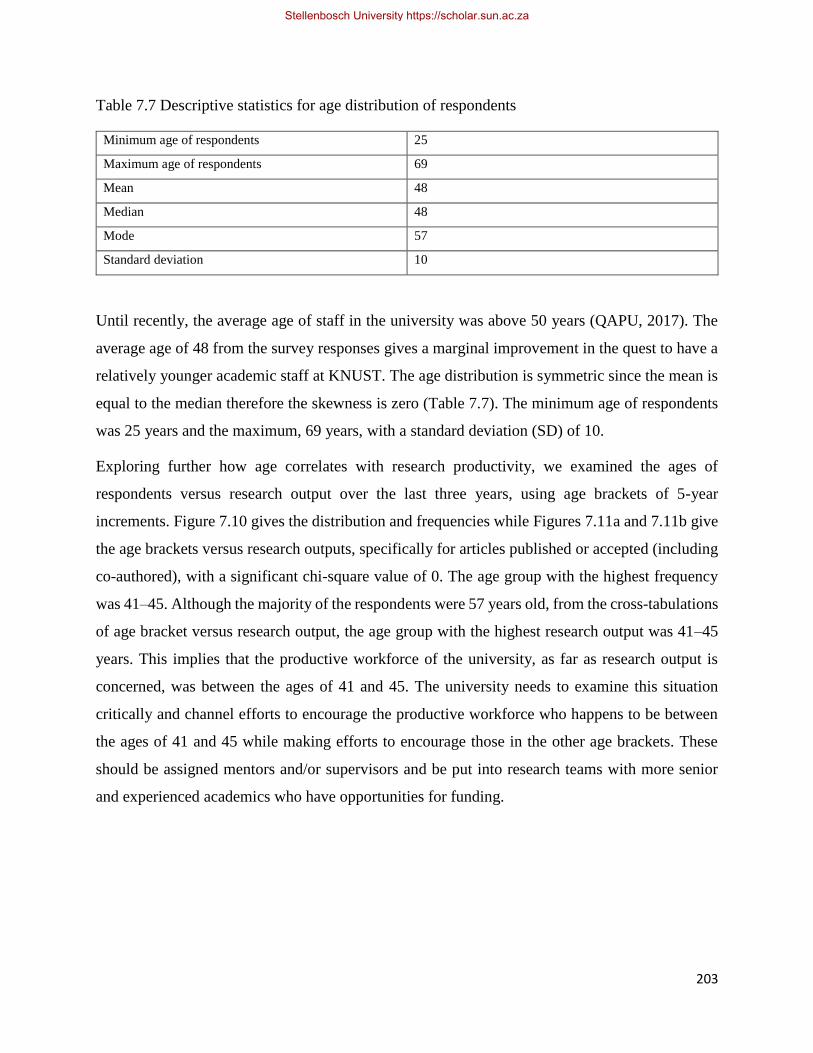
203
Table 7.7 Descriptive statistics for age distribution of respondents
Minimum age of respondents 25
Maximum age of respondents 69
Mean 48
Median 48
Mode 57
Standard deviation 10
Until recently, the average age of staff in the university was above 50 years (QAPU, 2017). The
average age of 48 from the survey responses gives a marginal improvement in the quest to have a
relatively younger academic staff at KNUST. The age distribution is symmetric since the mean is
equal to the median therefore the skewness is zero (Table 7.7). The minimum age of respondents
was 25 years and the maximum, 69 years, with a standard deviation (SD) of 10.
Exploring further how age correlates with research productivity, we examined the ages of
respondents versus research output over the last three years, using age brackets of 5-year
increments. Figure 7.10 gives the distribution and frequencies while Figures 7.11a and 7.11b give
the age brackets versus research outputs, specifically for articles published or accepted (including
co-authored), with a significant chi-square value of 0. The age group with the highest frequency
was 41–45. Although the majority of the respondents were 57 years old, from the cross-tabulations
of age bracket versus research output, the age group with the highest research output was 41–45
years. This implies that the productive workforce of the university, as far as research output is
concerned, was between the ages of 41 and 45. The university needs to examine this situation
critically and channel efforts to encourage the productive workforce who happens to be between
the ages of 41 and 45 while making efforts to encourage those in the other age brackets. These
should be assigned mentors and/or supervisors and be put into research teams with more senior
and experienced academics who have opportunities for funding.
Stellenbosch University https://scholar.sun.ac.za

204
Figure 7.10 Number of respondents by age
Figure 7.11a Age bracket and research output in terms of articles published or accepted (including
co-authored)
0
5
10
15
20
25
30
35
21-25 26-30 31-35 36-40 41-45 46-50 51-55 56-60 61-65 66-70
Fre
quen
cy/p
erce
nta
ge
Age bracket
Frequency
Percent
0% 20% 40% 60% 80% 100%
21-25
26-30
31-35
36-40
41-45
46-50
51-55
56-60
61-65
66-70
Age Bracket
Number of articles published or accepted
None
1 to 5
6 to 10
11+
Not Applicable
Stellenbosch University https://scholar.sun.ac.za
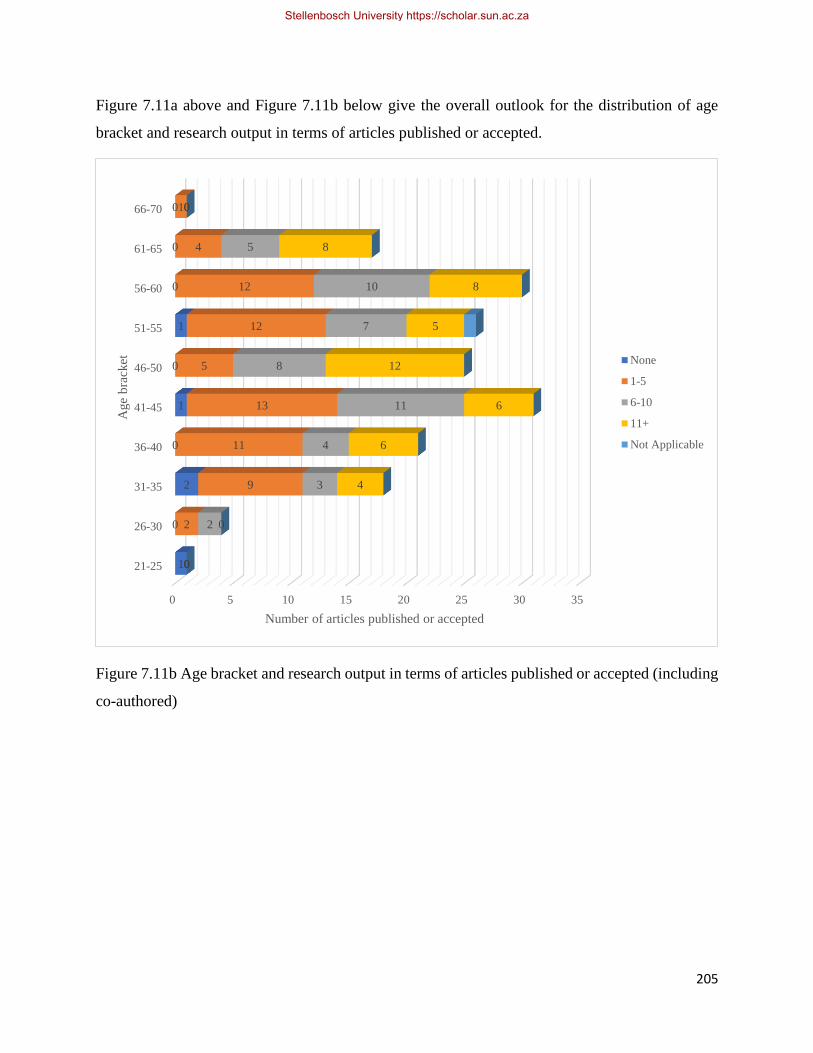
205
Figure 7.11a above and Figure 7.11b below give the overall outlook for the distribution of age
bracket and research output in terms of articles published or accepted.
Figure 7.11b Age bracket and research output in terms of articles published or accepted (including
co-authored)
0 5 10 15 20 25 30 35
21-25
26-30
31-35
36-40
41-45
46-50
51-55
56-60
61-65
66-70
1
0
2
0
1
0
1
0
0
0
0
2
9
11
13
5
12
12
4
1
0
2
3
4
11
8
7
10
5
0
0
0
4
6
6
12
5
8
8
0
Number of articles published or accepted
Age
bra
cket None
1-5
6-10
11+
Not Applicable
Stellenbosch University https://scholar.sun.ac.za
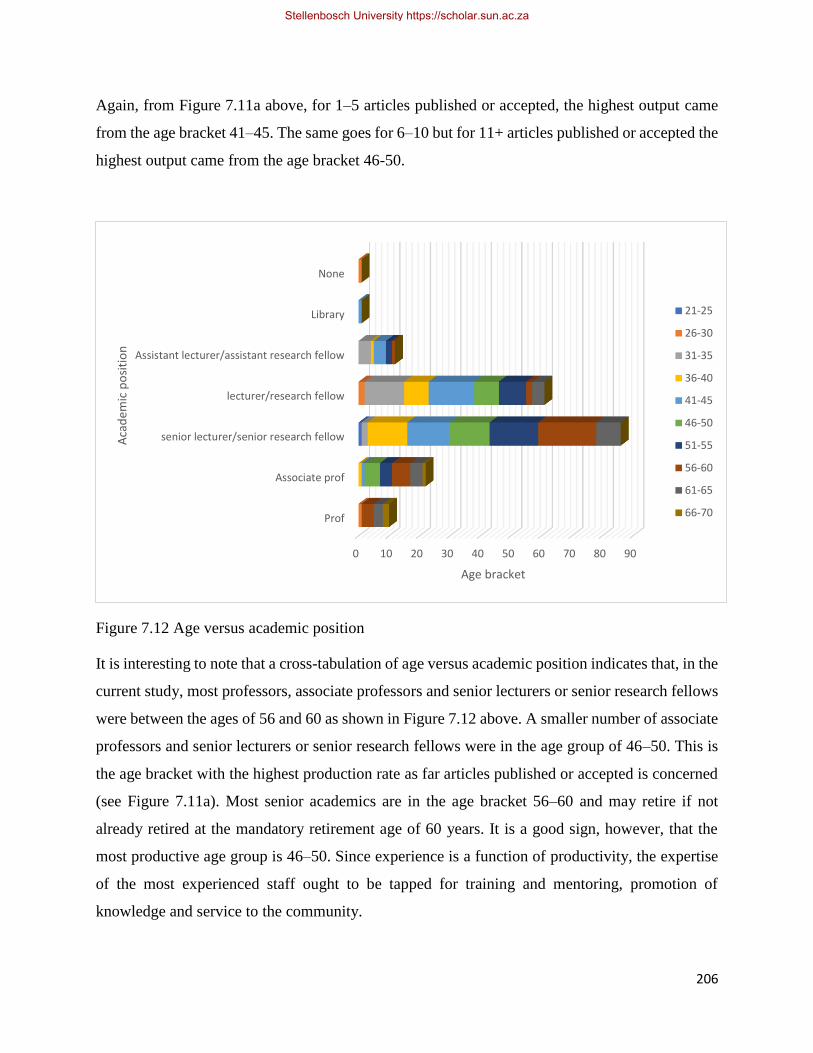
206
Again, from Figure 7.11a above, for 1–5 articles published or accepted, the highest output came
from the age bracket 41–45. The same goes for 6–10 but for 11+ articles published or accepted the
highest output came from the age bracket 46-50.
Figure 7.12 Age versus academic position
It is interesting to note that a cross-tabulation of age versus academic position indicates that, in the
current study, most professors, associate professors and senior lecturers or senior research fellows
were between the ages of 56 and 60 as shown in Figure 7.12 above. A smaller number of associate
professors and senior lecturers or senior research fellows were in the age group of 46–50. This is
the age bracket with the highest production rate as far articles published or accepted is concerned
(see Figure 7.11a). Most senior academics are in the age bracket 56–60 and may retire if not
already retired at the mandatory retirement age of 60 years. It is a good sign, however, that the
most productive age group is 46–50. Since experience is a function of productivity, the expertise
of the most experienced staff ought to be tapped for training and mentoring, promotion of
knowledge and service to the community.
0 10 20 30 40 50 60 70 80 90
Prof
Associate prof
senior lecturer/senior research fellow
lecturer/research fellow
Assistant lecturer/assistant research fellow
Library
None
Age bracket
Aca
dem
ic p
osi
tio
n
21-25
26-30
31-35
36-40
41-45
46-50
51-55
56-60
61-65
66-70
Stellenbosch University https://scholar.sun.ac.za
207
7.3.7 Departments or faculties and research output
This subsection reports on research outputs from the various departments and faculties. There were
responses from 67 departments and from 22 of the 23 faculties, schools or institutes of KNUST
across the six colleges of the university. This afforded us the grounds on which to examine the
productivity levels of the various departments and faculties and for that matter, the different fields
of specialisation. It has been observed from the literature that different fields of study have
different modes of engagement with implications for RU and utilisation (Mouton, 2012) and this
will be discussed in the next chapter. This sub-section however, concentrates on the research
output of the various faculties. The distribution of responses by departments is given in Figure
7.13 below.
Stellenbosch University https://scholar.sun.ac.za
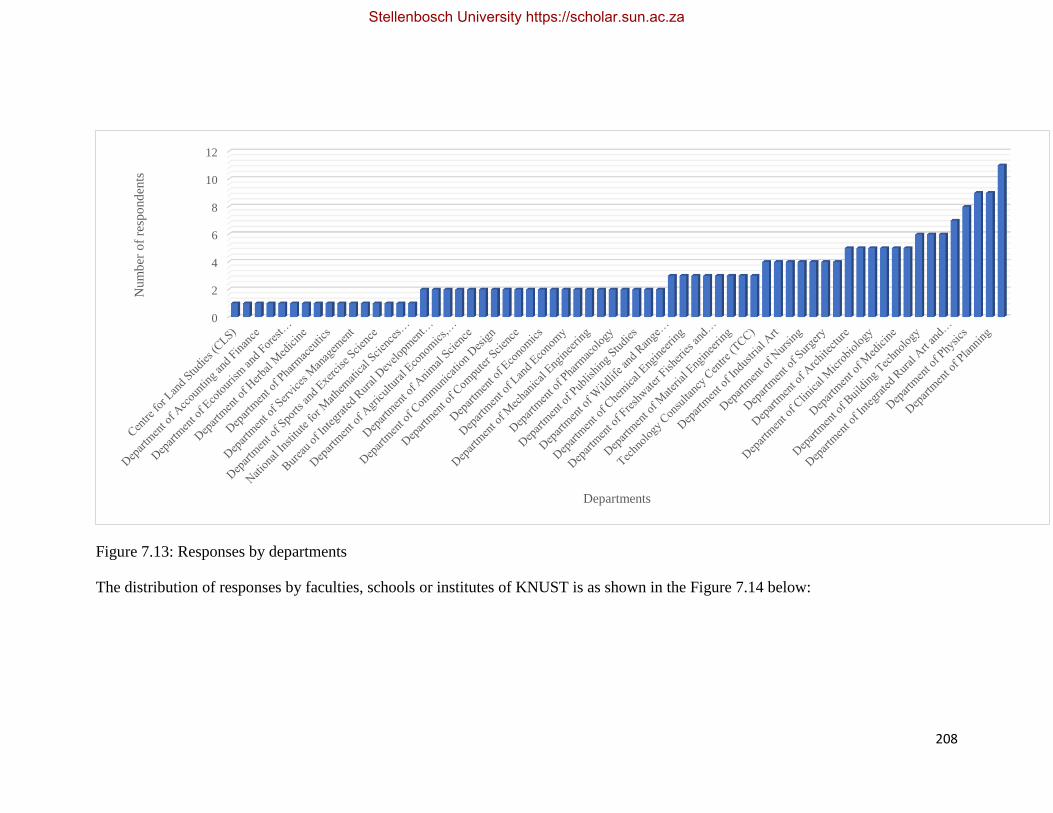
208
Figure 7.13: Responses by departments
The distribution of responses by faculties, schools or institutes of KNUST is as shown in the Figure 7.14 below:
0
2
4
6
8
10
12
Num
ber
of
resp
ond
ents
Departments
Stellenbosch University https://scholar.sun.ac.za
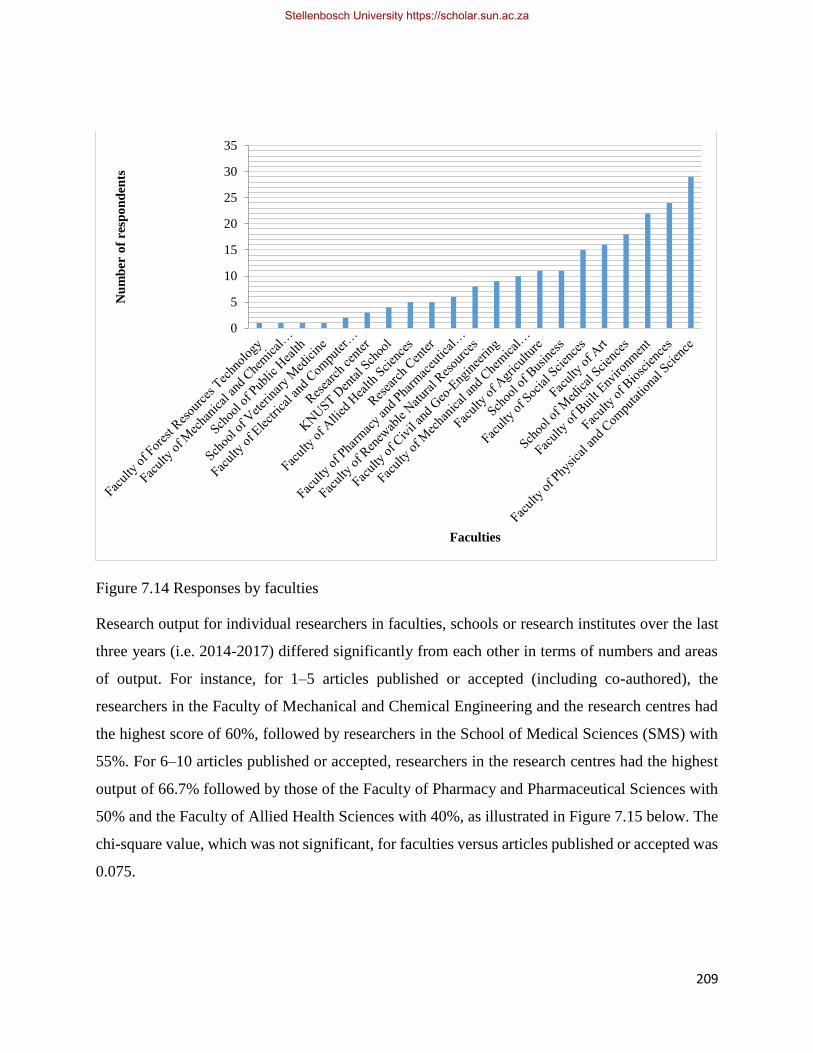
209
Figure 7.14 Responses by faculties
Research output for individual researchers in faculties, schools or research institutes over the last
three years (i.e. 2014-2017) differed significantly from each other in terms of numbers and areas
of output. For instance, for 1–5 articles published or accepted (including co-authored), the
researchers in the Faculty of Mechanical and Chemical Engineering and the research centres had
the highest score of 60%, followed by researchers in the School of Medical Sciences (SMS) with
55%. For 6–10 articles published or accepted, researchers in the research centres had the highest
output of 66.7% followed by those of the Faculty of Pharmacy and Pharmaceutical Sciences with
50% and the Faculty of Allied Health Sciences with 40%, as illustrated in Figure 7.15 below. The
chi-square value, which was not significant, for faculties versus articles published or accepted was
0.075.
0
5
10
15
20
25
30
35
Nu
mb
er o
f re
spo
nd
ents
Faculties
Stellenbosch University https://scholar.sun.ac.za

210
Figure 7.15 Researchers by faculties versus research output (articles published or accepted
(including co-authored)
Figure 7.15 above indicates that for 1–5 articles published or accepted, the SMS had the highest
score, followed by the Faculty of Biosciences and the Faculty of Art in that order.
0% 10% 20% 30% 40% 50% 60% 70% 80% 90%100%
Faculty of Physical and Computational Science
Faculty of Built Environment
Faculty of Biosciences
School of Medical Sciences
Faculty of Agriculture
Faculty of Art
Faculty of Civil and Geo-Engineering
Faculty of Renewable Natural Resources
Faculty of Social Sciences
School of Business
Faculty of Allied Health Sciences
Faculty of Mechanical and Chemical Engineering
Faculty of Mechanical and Chemical Engineering
KNUST Dental School
Research Center
School of Public Health
School of Veterinary Medicine
Faculty of Electrical and Computer Engineering
Faculty of Forest Resources Technology
Faculty of Pharmacy and Pharmaceutical Sciences
Research center
0
0
0
1
0
0
0
1
1
1
0
0
0
1
0
0
0
0
0
0
0
6
6
8
10
2
8
3
4
6
4
2
0
6
1
3
0
0
2
0
2
1
11
8
6
2
2
4
2
0
2
2
2
0
2
1
0
0
0
0
1
3
2
12
7
6
4
3
3
3
3
3
2
1
1
1
1
1
1
1
0
0
0
0
Articles published or accepted
Fac
ult
ies none
1-5
6-10
11+
not applicable
Stellenbosch University https://scholar.sun.ac.za
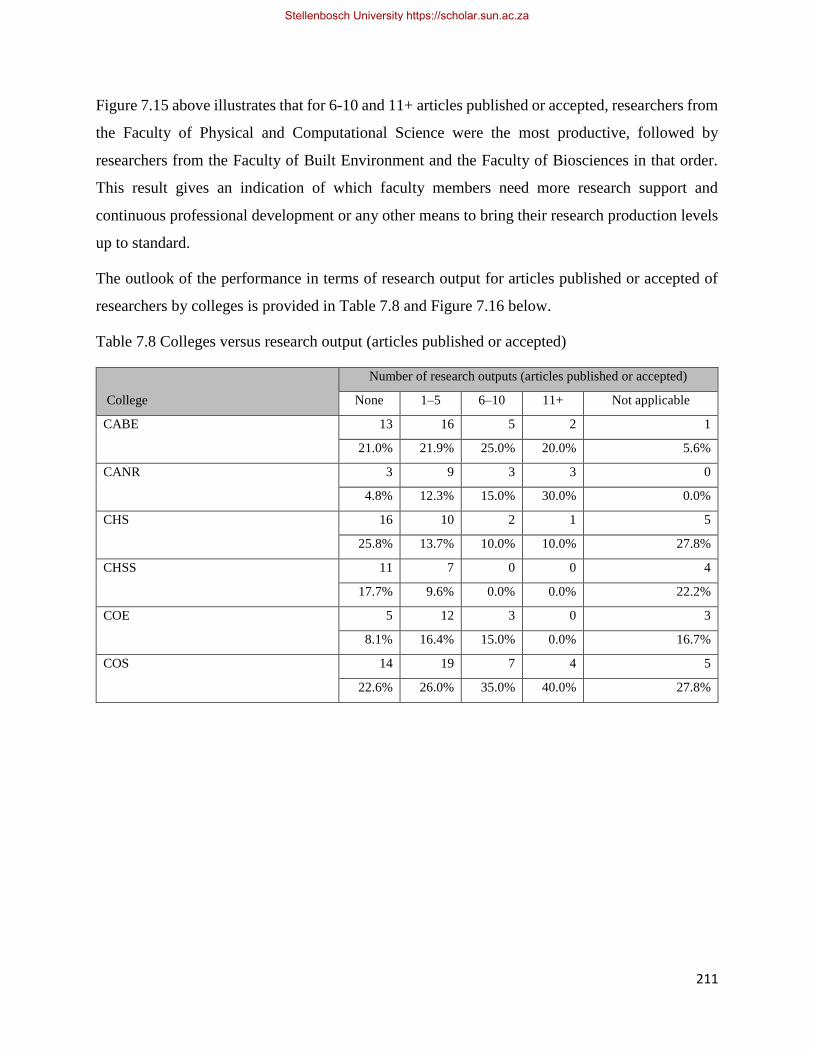
211
Figure 7.15 above illustrates that for 6-10 and 11+ articles published or accepted, researchers from
the Faculty of Physical and Computational Science were the most productive, followed by
researchers from the Faculty of Built Environment and the Faculty of Biosciences in that order.
This result gives an indication of which faculty members need more research support and
continuous professional development or any other means to bring their research production levels
up to standard.
The outlook of the performance in terms of research output for articles published or accepted of
researchers by colleges is provided in Table 7.8 and Figure 7.16 below.
Table 7.8 Colleges versus research output (articles published or accepted)
College
Number of research outputs (articles published or accepted)
None 1–5 6–10 11+ Not applicable
CABE 13 16 5 2 1
21.0% 21.9% 25.0% 20.0% 5.6%
CANR 3 9 3 3 0
4.8% 12.3% 15.0% 30.0% 0.0%
CHS 16 10 2 1 5
25.8% 13.7% 10.0% 10.0% 27.8%
CHSS 11 7 0 0 4
17.7% 9.6% 0.0% 0.0% 22.2%
COE 5 12 3 0 3
8.1% 16.4% 15.0% 0.0% 16.7%
COS 14 19 7 4 5
22.6% 26.0% 35.0% 40.0% 27.8%
Stellenbosch University https://scholar.sun.ac.za
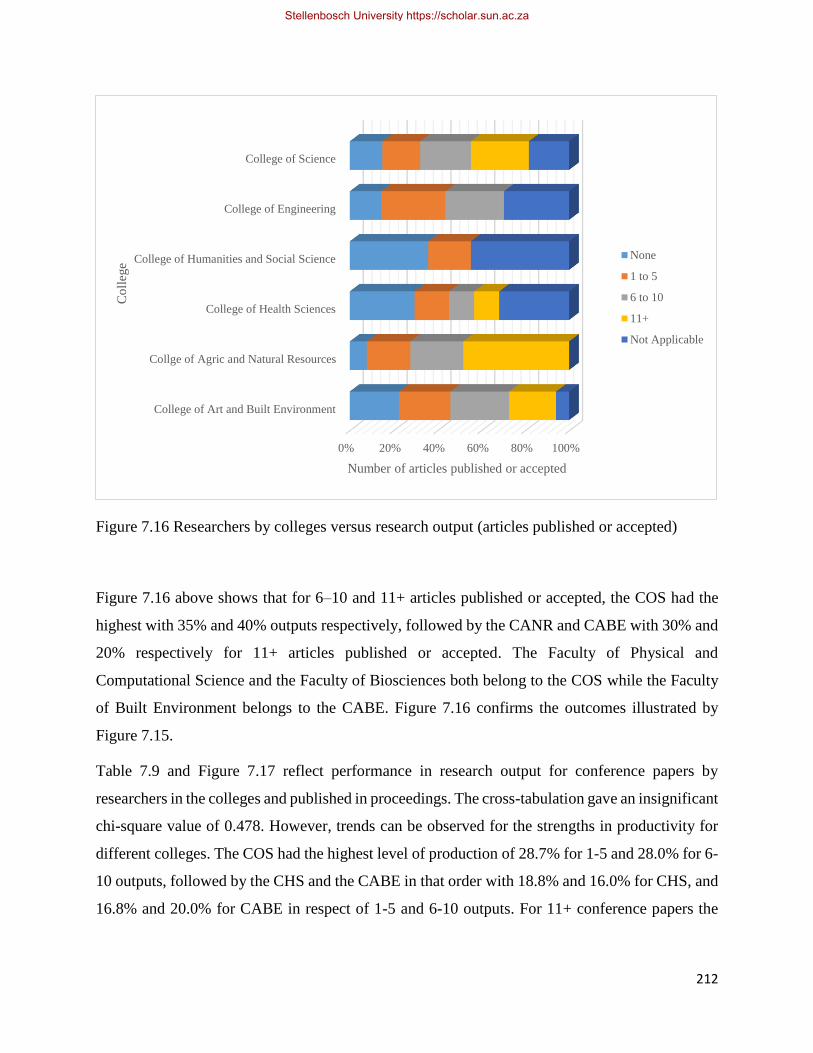
212
Figure 7.16 Researchers by colleges versus research output (articles published or accepted)
Figure 7.16 above shows that for 6–10 and 11+ articles published or accepted, the COS had the
highest with 35% and 40% outputs respectively, followed by the CANR and CABE with 30% and
20% respectively for 11+ articles published or accepted. The Faculty of Physical and
Computational Science and the Faculty of Biosciences both belong to the COS while the Faculty
of Built Environment belongs to the CABE. Figure 7.16 confirms the outcomes illustrated by
Figure 7.15.
Table 7.9 and Figure 7.17 reflect performance in research output for conference papers by
researchers in the colleges and published in proceedings. The cross-tabulation gave an insignificant
chi-square value of 0.478. However, trends can be observed for the strengths in productivity for
different colleges. The COS had the highest level of production of 28.7% for 1-5 and 28.0% for 6-
10 outputs, followed by the CHS and the CABE in that order with 18.8% and 16.0% for CHS, and
16.8% and 20.0% for CABE in respect of 1-5 and 6-10 outputs. For 11+ conference papers the
0% 20% 40% 60% 80% 100%
College of Art and Built Environment
Collge of Agric and Natural Resources
College of Health Sciences
College of Humanities and Social Science
College of Engineering
College of Science
Number of articles published or accepted
Co
lleg
e
None
1 to 5
6 to 10
11+
Not Applicable
Stellenbosch University https://scholar.sun.ac.za

213
CABE and CHS topped with 27.8% followed by the COS and COE with 11.1% each. This trend
is similar to that of research output for articles published or accepted (including co-authored).
Stellenbosch University https://scholar.sun.ac.za
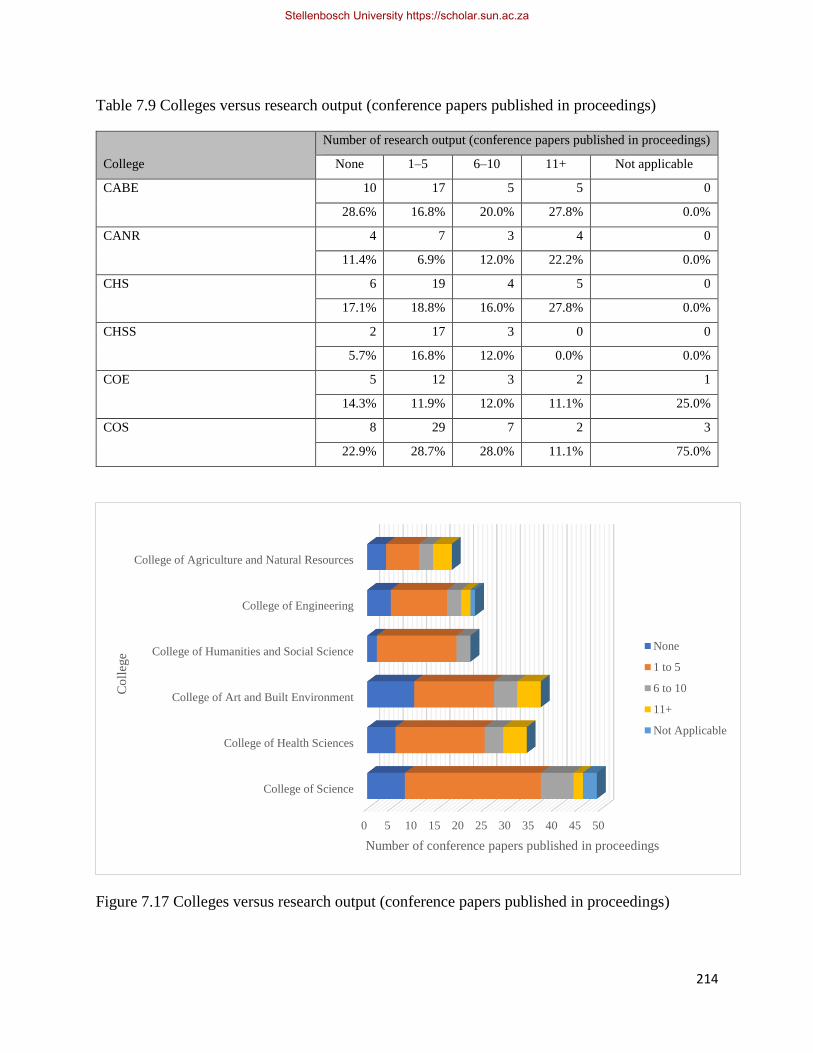
214
Table 7.9 Colleges versus research output (conference papers published in proceedings)
College
Number of research output (conference papers published in proceedings)
None 1–5 6–10 11+ Not applicable
CABE 10 17 5 5 0
28.6% 16.8% 20.0% 27.8% 0.0%
CANR 4 7 3 4 0
11.4% 6.9% 12.0% 22.2% 0.0%
CHS 6 19 4 5 0
17.1% 18.8% 16.0% 27.8% 0.0%
CHSS 2 17 3 0 0
5.7% 16.8% 12.0% 0.0% 0.0%
COE 5 12 3 2 1
14.3% 11.9% 12.0% 11.1% 25.0%
COS 8 29 7 2 3
22.9% 28.7% 28.0% 11.1% 75.0%
Figure 7.17 Colleges versus research output (conference papers published in proceedings)
0 5 10 15 20 25 30 35 40 45 50
College of Science
College of Health Sciences
College of Art and Built Environment
College of Humanities and Social Science
College of Engineering
College of Agriculture and Natural Resources
Number of conference papers published in proceedings
Co
lleg
e
None
1 to 5
6 to 10
11+
Not Applicable
Stellenbosch University https://scholar.sun.ac.za
215
Figure 7.17 above shows that for 1–5 research outputs, the COS had the highest score of
approximately 29% followed by the CHS and the CABE with approximately 19% and 17% in that
order. However, for 6–10, outputs the CHS and the CABE swapped positions while the COS
maintained its lead as illustrated in Figure 7.17.
In terms of conference papers published in proceedings, for 11+ research outputs, the CABE and
the CHS obtained the highest scores, followed by the CANR.
The performances by faculties and colleges in other research output areas, such as book chapters,
books, official public documents, articles in journals and popular journals, research reports,
computer programs, patents and creative art works, all gave varied performance levels for the
different faculties and colleges. Some faculties or colleges showed dominance in specific areas, as
discussed above for articles published or accepted and conference papers published in proceedings,
while slacking in other areas. It is not surprising that the Faculty of Art had the highest score in
terms of percentages, in creative art works while the Faculty of Electrical and Computer
Engineering led in the production of computer programs. These are directly related to their core
business as well as their areas of specialisation. The above result gives an indication of the areas
of focus of the various faculties in terms of research output, and also confirms the fact that different
faculties have different focuses. This reiterates the need to have tailor-made strategies and
incentives for RU for the different areas of study.
7.3.8 Position and research output
This sub-section examines the relationship between position and research output. In order to
determine research productivity levels by position, a cross-tabulation of position versus research
output was carried out. The research outputs with significant chi-square values of 0.013 and 0.001
were those of articles published or accepted (including co-authored) and computer programs
respectively. The Pearson chi-square values gave us a level of significance, which implies that
there was an even distribution of articles published and computer programs within the group of
official positions in articles published and computer programs over the three-year period (2015-
2017). Table 7.10 presents the responses for articles published or accepted generated from the
SPSS dataset. Figure 7.18 below illustrates the production levels for articles published or accepted
(including co-authored) and those of computer programs.
Stellenbosch University https://scholar.sun.ac.za
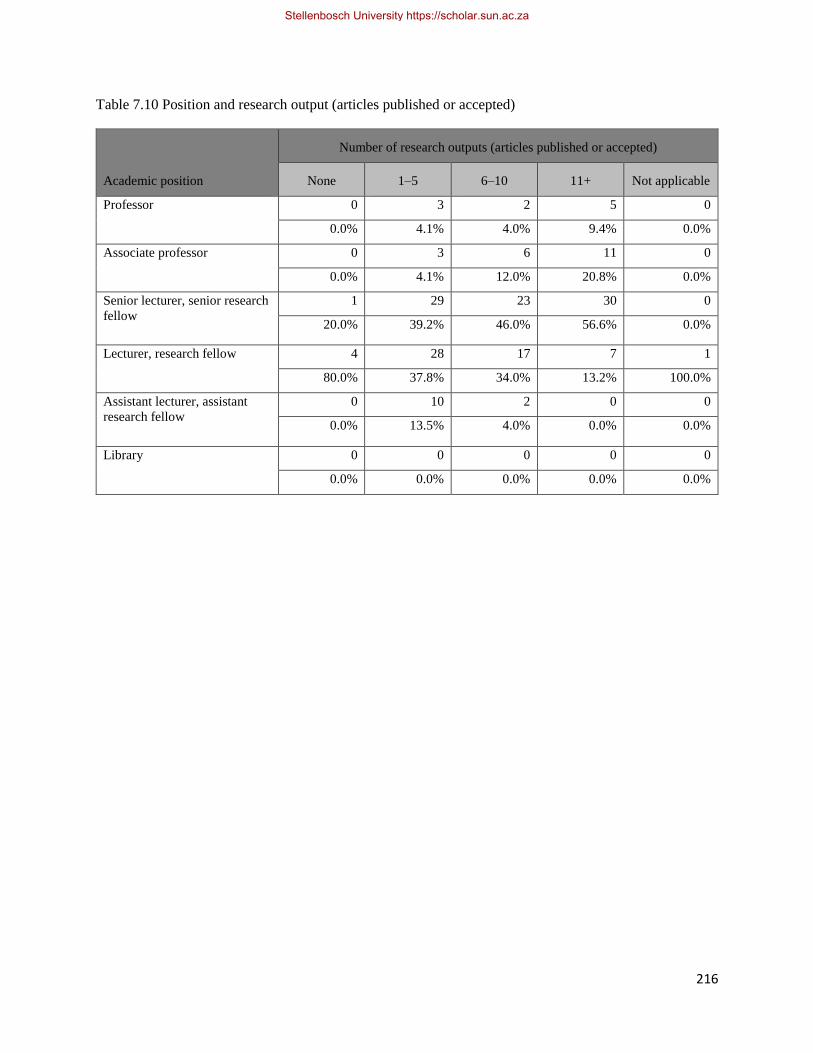
216
Table 7.10 Position and research output (articles published or accepted)
Academic position
Number of research outputs (articles published or accepted)
None 1–5 6–10 11+ Not applicable
Professor 0 3 2 5 0
0.0% 4.1% 4.0% 9.4% 0.0%
Associate professor 0 3 6 11 0
0.0% 4.1% 12.0% 20.8% 0.0%
Senior lecturer, senior research
fellow
1 29 23 30 0
20.0% 39.2% 46.0% 56.6% 0.0%
Lecturer, research fellow 4 28 17 7 1
80.0% 37.8% 34.0% 13.2% 100.0%
Assistant lecturer, assistant
research fellow
0 10 2 0 0
0.0% 13.5% 4.0% 0.0% 0.0%
Library 0 0 0 0 0
0.0% 0.0% 0.0% 0.0% 0.0%
Stellenbosch University https://scholar.sun.ac.za
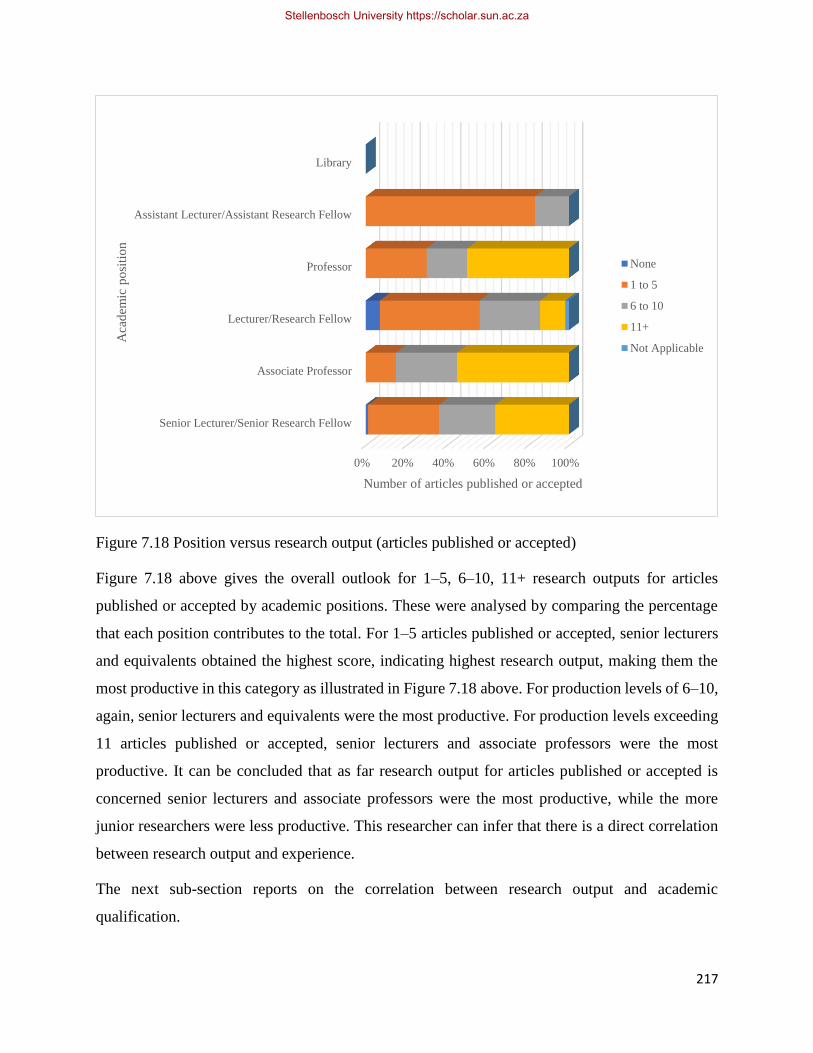
217
Figure 7.18 Position versus research output (articles published or accepted)
Figure 7.18 above gives the overall outlook for 1–5, 6–10, 11+ research outputs for articles
published or accepted by academic positions. These were analysed by comparing the percentage
that each position contributes to the total. For 1–5 articles published or accepted, senior lecturers
and equivalents obtained the highest score, indicating highest research output, making them the
most productive in this category as illustrated in Figure 7.18 above. For production levels of 6–10,
again, senior lecturers and equivalents were the most productive. For production levels exceeding
11 articles published or accepted, senior lecturers and associate professors were the most
productive. It can be concluded that as far research output for articles published or accepted is
concerned senior lecturers and associate professors were the most productive, while the more
junior researchers were less productive. This researcher can infer that there is a direct correlation
between research output and experience.
The next sub-section reports on the correlation between research output and academic
qualification.
0% 20% 40% 60% 80% 100%
Senior Lecturer/Senior Research Fellow
Associate Professor
Lecturer/Research Fellow
Professor
Assistant Lecturer/Assistant Research Fellow
Library
Number of articles published or accepted
Aca
dem
ic p
osi
tio
n
None
1 to 5
6 to 10
11+
Not Applicable
Stellenbosch University https://scholar.sun.ac.za
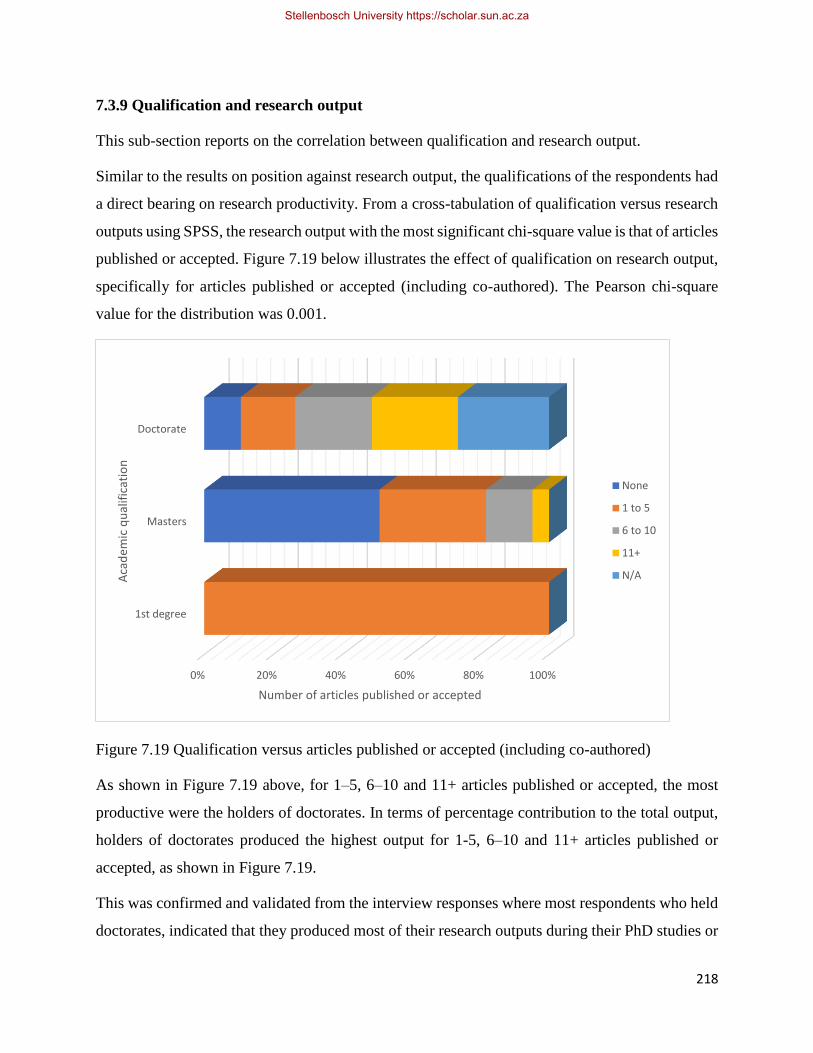
218
7.3.9 Qualification and research output
This sub-section reports on the correlation between qualification and research output.
Similar to the results on position against research output, the qualifications of the respondents had
a direct bearing on research productivity. From a cross-tabulation of qualification versus research
outputs using SPSS, the research output with the most significant chi-square value is that of articles
published or accepted. Figure 7.19 below illustrates the effect of qualification on research output,
specifically for articles published or accepted (including co-authored). The Pearson chi-square
value for the distribution was 0.001.
Figure 7.19 Qualification versus articles published or accepted (including co-authored)
As shown in Figure 7.19 above, for 1–5, 6–10 and 11+ articles published or accepted, the most
productive were the holders of doctorates. In terms of percentage contribution to the total output,
holders of doctorates produced the highest output for 1-5, 6–10 and 11+ articles published or
accepted, as shown in Figure 7.19.
This was confirmed and validated from the interview responses where most respondents who held
doctorates, indicated that they produced most of their research outputs during their PhD studies or
0% 20% 40% 60% 80% 100%
1st degree
Masters
Doctorate
Number of articles published or accepted
Aca
dem
ic q
ual
ific
atio
n
None
1 to 5
6 to 10
11+
N/A
Stellenbosch University https://scholar.sun.ac.za
219
from their PhD thesis. The same trend is observed for presentations at conferences and articles in
popular journals with significant Pearson chi-square values of 0.017 and 0.009 respectively. We
observed the same trend again, where holders of doctorates dominate all the counts, i.e. 1–5, 6–10
and 11+ presentations at conferences and published articles in popular journals. We can conclude
that holders of doctorates are the most research active in terms of the above research outputs. By
implication, there is a possibility that the university could increase its research output through
graduate training.
7.4 Research development focus and impact
This sub-section reflects the impact of research produced by researchers, what the focal areas are,
and how successful researchers have been with the uptake of the knowledge produced. This
provides additional information towards answering the research question, which sought to
determine the research focus of researchers at KNUST and how that contributes to local and
national development. Most importantly, this current study considers the specifics of how
successful researchers have been in their different fields of study in terms of knowledge production
and dissemination activities. To this effect, respondents were asked to rate the extent to which they
believe that they had been successful with their research in addressing specific issues. The details
are discussed in the sub-sections below.
7.4.1 Rate of success in research impact
This sub-section considers the extent to which researchers have been successful as far as their
research is concerned. Table 7.11 below summarises the outcomes for the extent to which
researchers had been successful in terms of research output. Figure 7.20 below illustrates the extent
to which researchers had been successful in terms of the impact of their research with respect to
advancing knowledge, solving theoretical problems, and solving immediate technical or applied
problems.
Stellenbosch University https://scholar.sun.ac.za
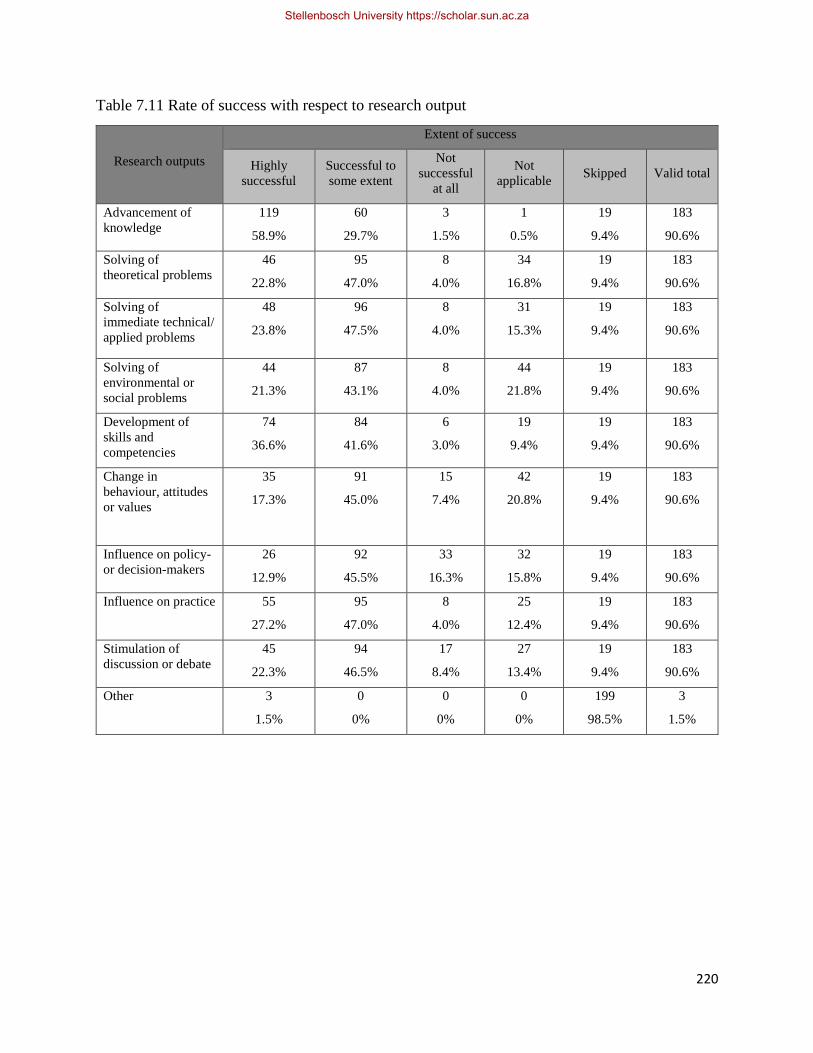
220
Table 7.11 Rate of success with respect to research output
Research outputs
Extent of success
Highly
successful
Successful to
some extent
Not
successful
at all
Not
applicable Skipped Valid total
Advancement of
knowledge
119
58.9%
60
29.7%
3
1.5%
1
0.5%
19
9.4%
183
90.6%
Solving of
theoretical problems
46
22.8%
95
47.0%
8
4.0%
34
16.8%
19
9.4%
183
90.6%
Solving of
immediate technical/
applied problems
48
23.8%
96
47.5%
8
4.0%
31
15.3%
19
9.4%
183
90.6%
Solving of
environmental or
social problems
44
21.3%
87
43.1%
8
4.0%
44
21.8%
19
9.4%
183
90.6%
Development of
skills and
competencies
74
36.6%
84
41.6%
6
3.0%
19
9.4%
19
9.4%
183
90.6%
Change in
behaviour, attitudes
or values
35
17.3%
91
45.0%
15
7.4%
42
20.8%
19
9.4%
183
90.6%
Influence on policy-
or decision-makers
26
12.9%
92
45.5%
33
16.3%
32
15.8%
19
9.4%
183
90.6%
Influence on practice
55
27.2%
95
47.0%
8
4.0%
25
12.4%
19
9.4%
183
90.6%
Stimulation of
discussion or debate
45
22.3%
94
46.5%
17
8.4%
27
13.4%
19
9.4%
183
90.6%
Other
3
1.5%
0
0%
0
0%
0
0%
199
98.5%
3
1.5%
Stellenbosch University https://scholar.sun.ac.za
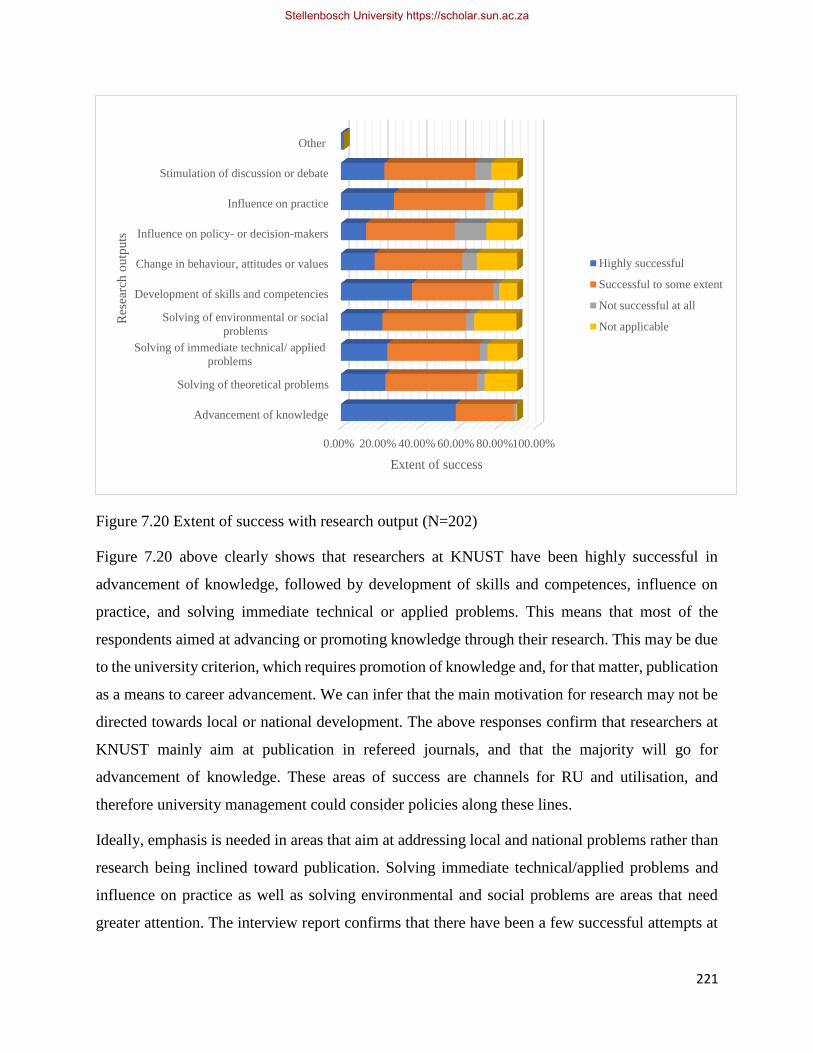
221
Figure 7.20 Extent of success with research output (N=202)
Figure 7.20 above clearly shows that researchers at KNUST have been highly successful in
advancement of knowledge, followed by development of skills and competences, influence on
practice, and solving immediate technical or applied problems. This means that most of the
respondents aimed at advancing or promoting knowledge through their research. This may be due
to the university criterion, which requires promotion of knowledge and, for that matter, publication
as a means to career advancement. We can infer that the main motivation for research may not be
directed towards local or national development. The above responses confirm that researchers at
KNUST mainly aim at publication in refereed journals, and that the majority will go for
advancement of knowledge. These areas of success are channels for RU and utilisation, and
therefore university management could consider policies along these lines.
Ideally, emphasis is needed in areas that aim at addressing local and national problems rather than
research being inclined toward publication. Solving immediate technical/applied problems and
influence on practice as well as solving environmental and social problems are areas that need
greater attention. The interview report confirms that there have been a few successful attempts at
0.00% 20.00% 40.00% 60.00% 80.00%100.00%
Advancement of knowledge
Solving of theoretical problems
Solving of immediate technical/ applied
problems
Solving of environmental or social
problems
Development of skills and competencies
Change in behaviour, attitudes or values
Influence on policy- or decision-makers
Influence on practice
Stimulation of discussion or debate
Other
Extent of success
Res
earc
h o
utp
uts
Highly successful
Successful to some extent
Not successful at all
Not applicable
Stellenbosch University https://scholar.sun.ac.za
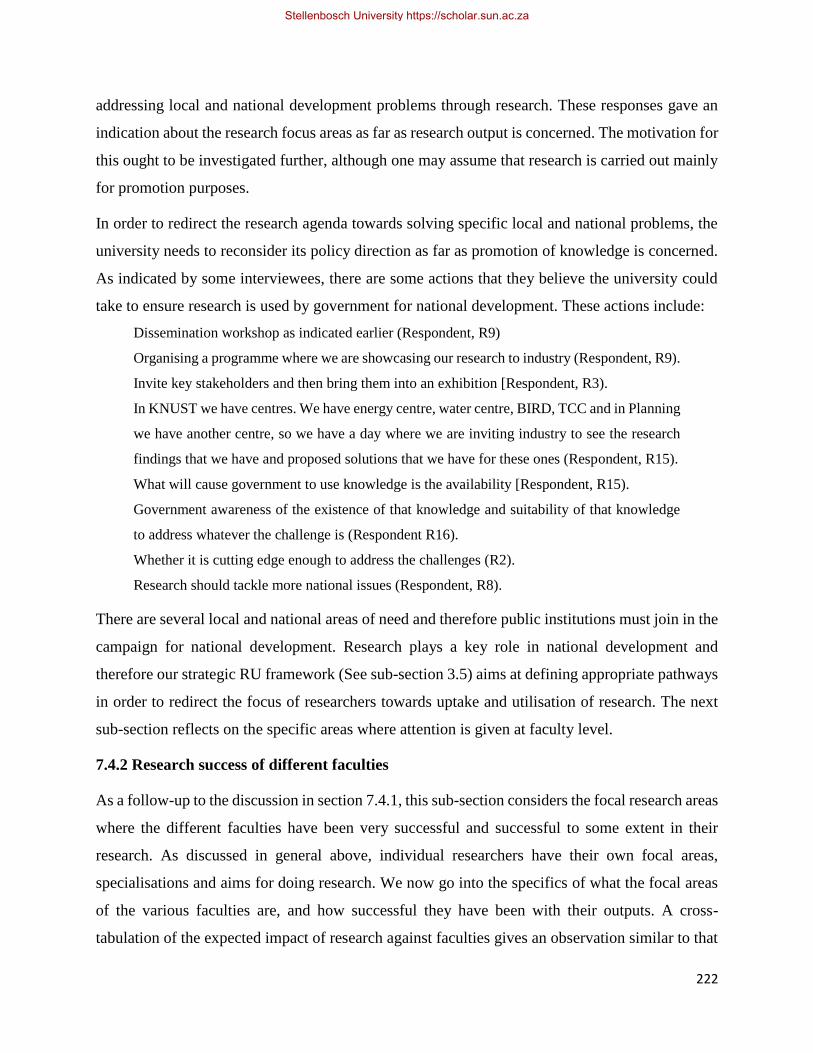
222
addressing local and national development problems through research. These responses gave an
indication about the research focus areas as far as research output is concerned. The motivation for
this ought to be investigated further, although one may assume that research is carried out mainly
for promotion purposes.
In order to redirect the research agenda towards solving specific local and national problems, the
university needs to reconsider its policy direction as far as promotion of knowledge is concerned.
As indicated by some interviewees, there are some actions that they believe the university could
take to ensure research is used by government for national development. These actions include:
Dissemination workshop as indicated earlier (Respondent, R9)
Organising a programme where we are showcasing our research to industry (Respondent, R9).
Invite key stakeholders and then bring them into an exhibition [Respondent, R3).
In KNUST we have centres. We have energy centre, water centre, BIRD, TCC and in Planning
we have another centre, so we have a day where we are inviting industry to see the research
findings that we have and proposed solutions that we have for these ones (Respondent, R15).
What will cause government to use knowledge is the availability [Respondent, R15).
Government awareness of the existence of that knowledge and suitability of that knowledge
to address whatever the challenge is (Respondent R16).
Whether it is cutting edge enough to address the challenges (R2).
Research should tackle more national issues (Respondent, R8).
There are several local and national areas of need and therefore public institutions must join in the
campaign for national development. Research plays a key role in national development and
therefore our strategic RU framework (See sub-section 3.5) aims at defining appropriate pathways
in order to redirect the focus of researchers towards uptake and utilisation of research. The next
sub-section reflects on the specific areas where attention is given at faculty level.
7.4.2 Research success of different faculties
As a follow-up to the discussion in section 7.4.1, this sub-section considers the focal research areas
where the different faculties have been very successful and successful to some extent in their
research. As discussed in general above, individual researchers have their own focal areas,
specialisations and aims for doing research. We now go into the specifics of what the focal areas
of the various faculties are, and how successful they have been with their outputs. A cross-
tabulation of the expected impact of research against faculties gives an observation similar to that
Stellenbosch University https://scholar.sun.ac.za
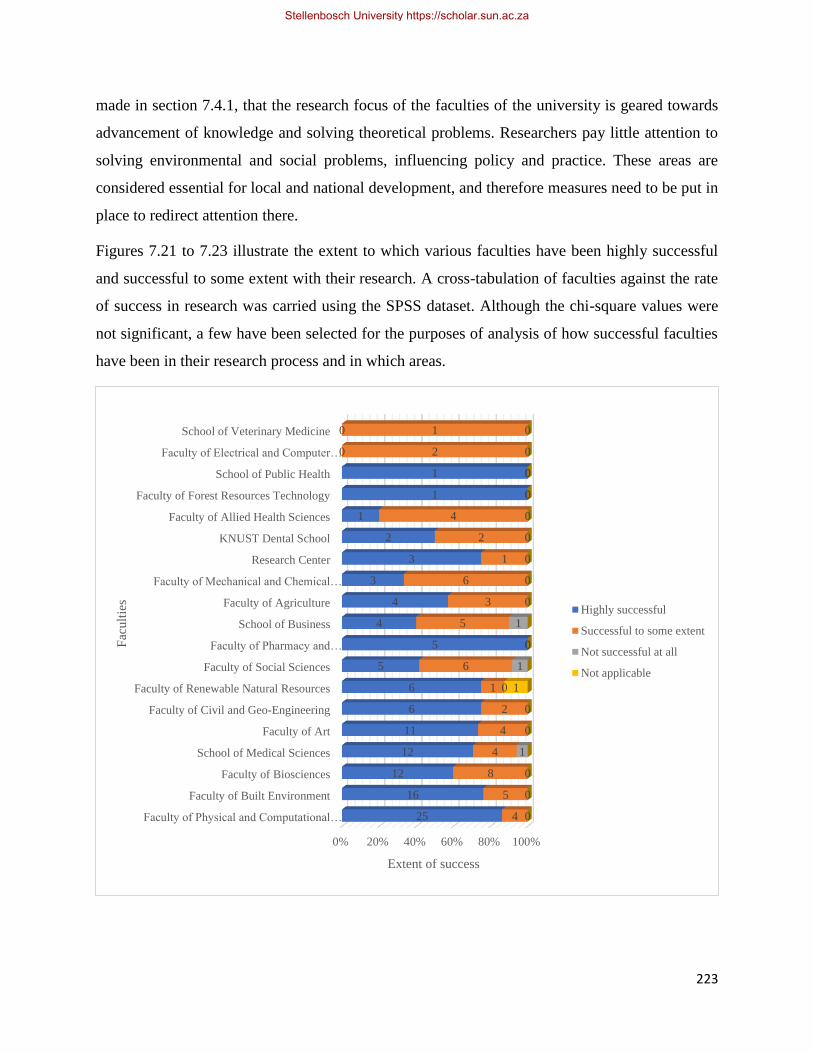
223
made in section 7.4.1, that the research focus of the faculties of the university is geared towards
advancement of knowledge and solving theoretical problems. Researchers pay little attention to
solving environmental and social problems, influencing policy and practice. These areas are
considered essential for local and national development, and therefore measures need to be put in
place to redirect attention there.
Figures 7.21 to 7.23 illustrate the extent to which various faculties have been highly successful
and successful to some extent with their research. A cross-tabulation of faculties against the rate
of success in research was carried using the SPSS dataset. Although the chi-square values were
not significant, a few have been selected for the purposes of analysis of how successful faculties
have been in their research process and in which areas.
0% 20% 40% 60% 80% 100%
Faculty of Physical and Computational…
Faculty of Built Environment
Faculty of Biosciences
School of Medical Sciences
Faculty of Art
Faculty of Civil and Geo-Engineering
Faculty of Renewable Natural Resources
Faculty of Social Sciences
Faculty of Pharmacy and…
School of Business
Faculty of Agriculture
Faculty of Mechanical and Chemical…
Research Center
KNUST Dental School
Faculty of Allied Health Sciences
Faculty of Forest Resources Technology
School of Public Health
Faculty of Electrical and Computer…
School of Veterinary Medicine
25
16
12
12
11
6
6
5
5
4
4
3
3
2
1
1
1
0
0
4
5
8
4
4
2
1
6
0
5
3
6
1
2
4
0
0
2
1
0
0
0
1
0
0
0
1
0
1
0
0
0
0
0
0
0
0
0
1
Extent of success
Fac
ult
ies
Highly successful
Successful to some extent
Not successful at all
Not applicable
Stellenbosch University https://scholar.sun.ac.za
224
Figure 7.21 Faculties and extent of success with respect to advancement of knowledge (p-
value=0.155)
In Figure 7.21 above, we notice that in terms advancement of knowledge, the Faculty of Physical
and Computational Science and the Faculty of Built Environment were the top two that were highly
successful with advancement of knowledge. The main focus of these faculties is therefore
advancement of knowledge as already proved in other sections (see sub-section 7.4.1). It could
well be that researchers in these faculties undertake more of basic research rather than applied or
developmental research.
Figure 7.22 below provides an illustration of how successful faculties have been as far as solving
immediate technical and applied problems is concerned. The Faculty of Art, Faculty of Biosciences
and the Faculty of Built Environment in that order were highly successful. By their very nature
and establishment, researchers in these faculties are most likely to engage in applied or
developmental research which leads to solving practical problems. The impact of their research
can therefore be seen in the area of solving theoretical or applied problems.
Stellenbosch University https://scholar.sun.ac.za
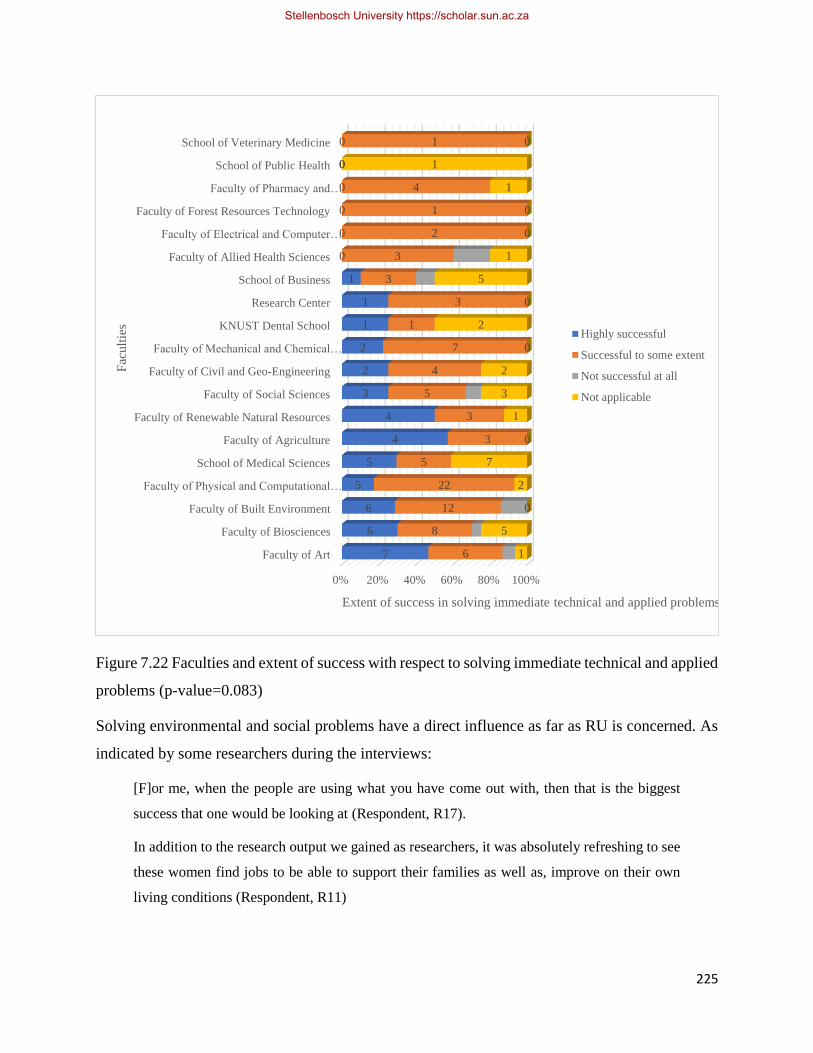
225
Figure 7.22 Faculties and extent of success with respect to solving immediate technical and applied
problems (p-value=0.083)
Solving environmental and social problems have a direct influence as far as RU is concerned. As
indicated by some researchers during the interviews:
[F]or me, when the people are using what you have come out with, then that is the biggest
success that one would be looking at (Respondent, R17).
In addition to the research output we gained as researchers, it was absolutely refreshing to see
these women find jobs to be able to support their families as well as, improve on their own
living conditions (Respondent, R11)
0% 20% 40% 60% 80% 100%
Faculty of Art
Faculty of Biosciences
Faculty of Built Environment
Faculty of Physical and Computational…
School of Medical Sciences
Faculty of Agriculture
Faculty of Renewable Natural Resources
Faculty of Social Sciences
Faculty of Civil and Geo-Engineering
Faculty of Mechanical and Chemical…
KNUST Dental School
Research Center
School of Business
Faculty of Allied Health Sciences
Faculty of Electrical and Computer…
Faculty of Forest Resources Technology
Faculty of Pharmacy and…
School of Public Health
School of Veterinary Medicine
7
6
6
5
5
4
4
3
2
2
1
1
1
0
0
0
0
0
0
6
8
12
22
5
3
3
5
4
7
1
3
3
3
2
1
4
0
1
1
5
0
2
7
0
1
3
2
0
2
0
5
1
0
0
1
1
0
Extent of success in solving immediate technical and applied problems
Fac
ult
ies
Highly successful
Successful to some extent
Not successful at all
Not applicable
Stellenbosch University https://scholar.sun.ac.za

226
Figure 7.23 below indicates that as far as solving environmental problems is concerned, the Faculty
of Built Environment, the Faculty of Physical and Computational Sciences, the Faculty of
Biosciences and the School of Medial Sciences in that order, were highly successful.
Figure 7.23 Faculties and extent of success with respect to solving environmental and social
problems (p-value=0.62)
0% 20% 40% 60% 80% 100%
Faculty of Built Environment
Faculty of Physical and Computational…
Faculty of Biosciences
School of Medical Sciences
Faculty of Art
Faculty of Renewable Natural Resources
Faculty of Social Sciences
Faculty of Civil and Geo-Engineering
Faculty of Mechanical and Chemical…
KNUST Dental School
Faculty of Agriculture
Faculty of Pharmacy and…
Research Center
Faculty of Allied Health Sciences
Faculty of Electrical and Computer…
Faculty of Forest Resources Technology
School of Business
School of Public Health
School of Veterinary Medicine
8
8
4
4
3
3
3
2
2
2
1
1
1
0
0
0
0
0
0
11
11
10
8
9
3
4
4
5
1
4
3
0
5
1
1
5
0
0
1
1
0
0
2
0
0
0
1
0
1
0
1
0
0
0
1
0
0
1
9
6
5
1
2
5
2
1
1
1
1
2
0
1
0
4
1
1
Extent of success in solving environmental problems
Fac
ult
ies
Highly successful
Successful to some extent
Not successful at all
Not applicable
Stellenbosch University https://scholar.sun.ac.za
227
7.4.3 Overall research success of faculties
This sub-section provides a picture of the overall success of the various faculties and the areas
where they appear to be successful. A cross-tabulation of faculties versus areas of focus where
faculties had been highly successful, was carried out. Table 7.12 below provides the summary,
while Figure 7.24 gives an illustration of the problems next to each other and the extent of success
of each faculty.
Stellenbosch University https://scholar.sun.ac.za

228
Table 7.12 Overall research success of faculties
Faculty
Overall research success with outputs
Advancement
of knowledge
Solving
theoretical
problems
Solving
immediate
technical
or applied
problems
Solving
environmental
problems
Development of
skills and
competence
Change of
behaviour,
attitudes
and values
Influencing
policy
Influencing
practice
Stimulation
of discussion
Other
Faculty of
Agriculture
4 1 4 1 3 2 1 3 0 0
3.4% 2.2% 8.3% 2.3% 4.1% 5.7% 3.8% 5.5% 0.0% 0.0%
Faculty of
Allied
Health
Sciences
1 0 0 0 0 0 0 1 1 0
.8% 0.0% 0.0% 0.0% 0.0% 0.0% 0.0% 1.8% 2.2% 0.0%
Faculty of
Art
11 4 7 3 9 4 2 5 2 0
9.2% 8.7% 14.6% 6.8% 12.2% 11.4% 7.7% 9.1% 4.4% 0.0%
Faculty of
Biosciences
12 4 6 4 8 4 0 5 4 0
10.1% 8.7% 12.5% 9.1% 10.8% 11.4% 0.0% 9.1% 8.9% 0.0%
Faculty of
Built
Environment
16 6 6 8 13 6 5 7 7 0
13.4% 13.0% 12.5% 18.2% 17.6% 17.1% 19.2% 12.7% 15.6% 0.0%
Faculty of
Civil and
Geo-
Engineering
6 2 2 2 3 0 1 2 2 0
5.0% 4.3% 4.2% 4.5% 4.1% 0.0% 3.8% 3.6% 4.4% 0.0%
Faculty of
Electrical
and
0 0 0 0 0 0 0 0 0 0
0.0% 0.0% 0.0% 0.0% 0.0% 0.0% 0.0% 0.0% 0.0% 0.0%
Stellenbosch University https://scholar.sun.ac.za

229
Computer
Engineering
Faculty of
Forest
Resources
Technology
1 1 0 0 1 0 0 0 0 0
.8% 2.2% 0.0% 0.0% 1.4% 0.0% 0.0% 0.0% 0.0% 0.0%
Faculty of
Mechanical
and
Chemical
Engineering
0 0 1 0 0 0 0 0 1 0
0.0% 0.0% 2.1% 0.0% 0.0% 0.0% 0.0% 0.0% 2.2% 0.0%
Faculty of
Mechanical
and
Chemical
Engineering
3 1 2 2 1 1 1 1 1 0
2.5% 2.2% 4.2% 4.5% 1.4% 2.9% 3.8% 1.8% 2.2% 0.0%
Faculty of
Pharmacy
and
Pharmaceuti
cal Sciences
5 0 0 1 4 1 0 2 0 0
4.2% 0.0% 0.0% 2.3% 5.4% 2.9% 0.0% 3.6% 0.0% 0.0%
Faculty of
Physical and
Computation
al Science
25 13 5 8 15 6 2 8 7 0
21.0% 28.3% 10.4% 18.2% 20.3% 17.1% 7.7% 14.5% 15.6% 0.0%
Faculty of
Renewable
Natural
Resources
6 4 4 3 0 0 0 2 2 0
5.0% 8.7% 8.3% 6.8% 0.0% 0.0% 0.0% 3.6% 4.4% 0.0%
Faculty of
Social
Sciences
5 2 3 3 2 2 3 2 4 0
4.2% 4.3% 6.3% 6.8% 2.7% 5.7% 11.5% 3.6% 8.9% 0.0%
KNUST
Dental
School
2 2 1 2 2 1 1 2 1 0
1.7% 4.3% 2.1% 4.5% 2.7% 2.9% 3.8% 3.6% 2.2% 0.0%
Stellenbosch University https://scholar.sun.ac.za

230
Research
centre
2 2 0 2 1 1 1 2 2 0
1.7% 4.3% 0.0% 4.5% 1.4% 2.9% 3.8% 3.6% 4.4% 0.0%
School of
Business
4 1 1 0 2 1 3 2 1 1
3.4% 2.2% 2.1% 0.0% 2.7% 2.9% 11.5% 3.6% 2.2% 100.0
%
SMS 12 3 5 4 8 4 6 9 8 0
10.1% 6.5% 10.4% 9.1% 10.8% 11.4% 23.1% 16.4% 17.8% 0.0%
School of
Public
Health
1 0 0 0 0 0 0 1 1 0
.8% 0.0% 0.0% 0.0% 0.0% 0.0% 0.0% 1.8% 2.2% 0.0%
School of
Veterinary
Medicine
0 0 0 0 0 0 0 0 0 0
0.0% 0.0% 0.0% 0.0% 0.0% 0.0% 0.0% 0.0% 0.0% 0.0%
Stellenbosch University https://scholar.sun.ac.za
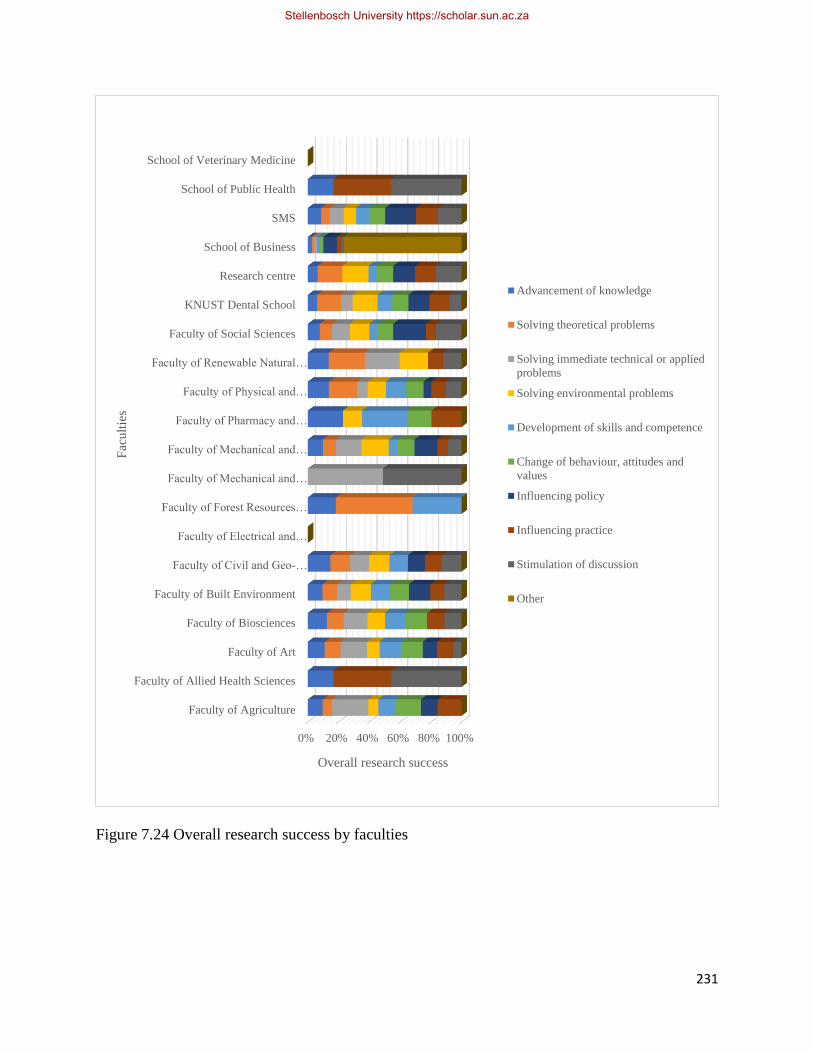
231
Figure 7.24 Overall research success by faculties
0% 20% 40% 60% 80% 100%
Faculty of Agriculture
Faculty of Allied Health Sciences
Faculty of Art
Faculty of Biosciences
Faculty of Built Environment
Faculty of Civil and Geo-…
Faculty of Electrical and…
Faculty of Forest Resources…
Faculty of Mechanical and…
Faculty of Mechanical and…
Faculty of Pharmacy and…
Faculty of Physical and…
Faculty of Renewable Natural…
Faculty of Social Sciences
KNUST Dental School
Research centre
School of Business
SMS
School of Public Health
School of Veterinary Medicine
Overall research success
Fac
ult
ies
Advancement of knowledge
Solving theoretical problems
Solving immediate technical or applied
problems
Solving environmental problems
Development of skills and competence
Change of behaviour, attitudes and
values
Influencing policy
Influencing practice
Stimulation of discussion
Other
Stellenbosch University https://scholar.sun.ac.za
232
As illustrated in Figure 7.24 above, overall, most faculties and for that matter colleges mainly
focus on advancement of knowledge as far as their research is concerned. We can conclude
however that, researchers in different faculties focus on different things due to the nature of their
establishment, approaches and activities. This can be deduced from the analysis in Figure 7.24
above which shows that when it comes to solving environmental problems the Faculty of Physical
and Computational Sciences and the Faculty of Built Environment are the topmost performers.
The SMS focuses on influencing policy and practices. The research success of these faculties
therefore depends on the nature of their approaches and nature of their activities.
7.4.4 Conclusion
The expected areas of research impact as confirmed by respondents were solving environmental
and social problems, influencing policy, influencing practice and solving immediate and technical
problems. However, the extent to which researchers had been successful in these areas provided
results below expectation compared to advancement of knowledge and solving theoretical
problems, which seemed to be the main focus of researchers. It is worth noting that only 9 out of
the 22 faculties seemed to be very active in terms of research activities with the potential to bring
about some social change. From the interview report, however, there are a few examples of
research impact. The following are some quotations from interviewees regarding research use at
national level:
MoFA [the Ministry of Food and Agriculture] is implementing a flagship programme, Planting
for Food and Jobs, which commits them to employing 2 000 more extension officers in 2018
to provide dedicated extension services across the country. The ministry has recently launched
the E-Agriculture portal to bridge the gap between agricultural extension officers and farmers
in Ghana online by providing, among other things, articles, videos, handbooks, and flyers
(Respondent, R10)
And another aspect too has to do with the formulation of soilless media so that we don’t always
go removing topsoil in other to pot plants, because its’ not an environmentally friendly practice
and that one we came up with some good mixes and we even named the best of the mix we
named it as AgSSIP [Agricultural Services Sub-Sector Investment Programme] mix
(Respondent, R10)
Another one was the EU that wanted to give support for water and sanitation around the
country and they contracted us to do the research. We did it and then we even came up with a
Stellenbosch University https://scholar.sun.ac.za

233
training manual and they used it and they have since been using it for their training of district
assemblies” [Respondent, R2).
In conclusion, it can be confirmed that, although there are several areas where the university can
play a role in local and national development, the research agenda and focus of researchers at
KNUST and in faculties and colleges are towards advancement of knowledge and solving
theoretical problems. There are, however, a few examples of research that have led to solving
environmental problems, solving immediate technical/applied problems and influenced national
policy and practice (KNUST Research Report, 2015, 2016). A policy shift is necessary to correct
this if the university is to make an appreciable impact on society and help solve social and national
problems.
The next chapter considers how researchers engage with various stakeholders and how these
mechanisms and channels of engagement influence their research and dissemination activities,
including uptake and related challenges.
CHAPTER 8 – CHANNELS AND MECHANISMS OF STAKEHOLDER ENGAGEMENT
8.1 Introduction
This chapter further discusses the findings from the survey and incorporates information from the
report of the interviews. Essentially, the survey looked at research activities in relation to
communities outside the university, the private sector, government, researchers and scientists from
other universities and research institutions, and, NGOs. The main questions, aimed at addressing
the research questions, centred on how researchers involve stakeholders in their research activities,
the channels and mechanisms of engagement and their importance, and finally the individual or
institutional barriers experienced with research utilisation. The chapter thus aims at answering the
broad questions listed below.
• With which kind of stakeholders do researchers at KNUST engage, and what are the
mechanisms or modes of engagement with these stakeholders?
• How beneficial are the engagements with various stakeholders and to what extent are these
stakeholders involved in the research process?
• What are the most common barriers to research uptake?
Stellenbosch University https://scholar.sun.ac.za
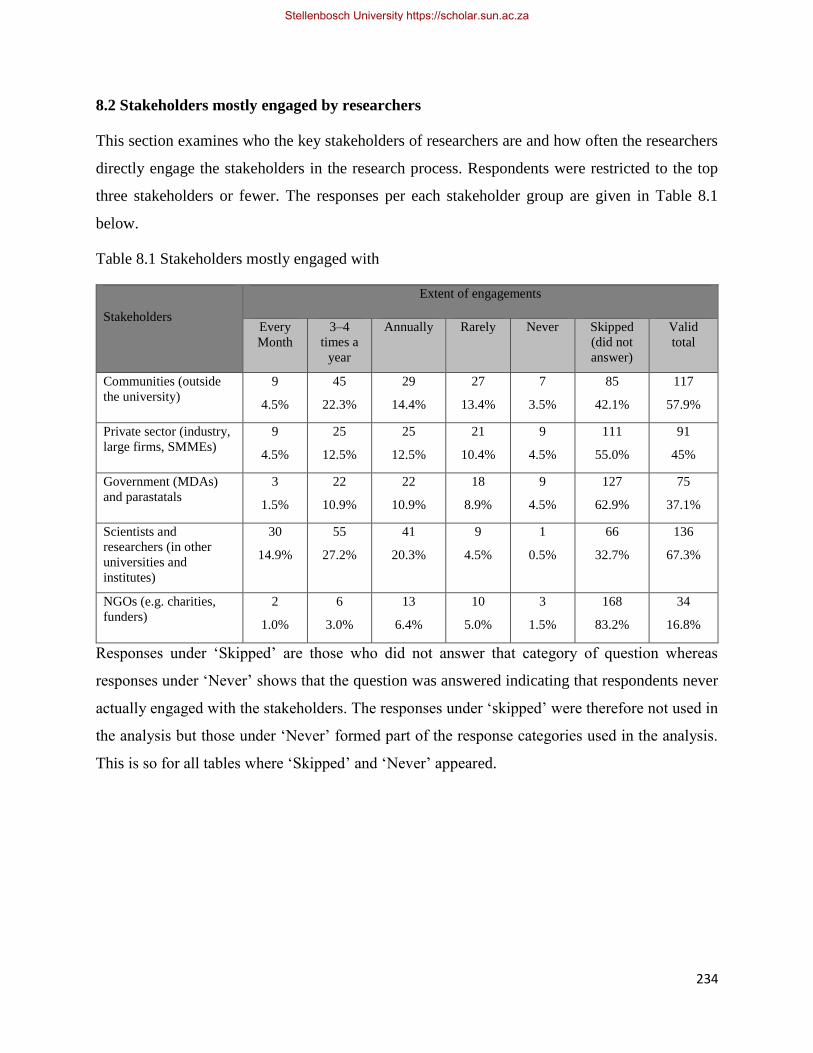
234
8.2 Stakeholders mostly engaged by researchers
This section examines who the key stakeholders of researchers are and how often the researchers
directly engage the stakeholders in the research process. Respondents were restricted to the top
three stakeholders or fewer. The responses per each stakeholder group are given in Table 8.1
below.
Table 8.1 Stakeholders mostly engaged with
Stakeholders
Extent of engagements
Every
Month
3–4
times a
year
Annually Rarely Never Skipped
(did not
answer)
Valid
total
Communities (outside
the university)
9
4.5%
45
22.3%
29
14.4%
27
13.4%
7
3.5%
85
42.1%
117
57.9%
Private sector (industry,
large firms, SMMEs)
9
4.5%
25
12.5%
25
12.5%
21
10.4%
9
4.5%
111
55.0%
91
45%
Government (MDAs)
and parastatals
3
1.5%
22
10.9%
22
10.9%
18
8.9%
9
4.5%
127
62.9%
75
37.1%
Scientists and
researchers (in other
universities and
institutes)
30
14.9%
55
27.2%
41
20.3%
9
4.5%
1
0.5%
66
32.7%
136
67.3%
NGOs (e.g. charities,
funders)
2
1.0%
6
3.0%
13
6.4%
10
5.0%
3
1.5%
168
83.2%
34
16.8%
Responses under ‘Skipped’ are those who did not answer that category of question whereas
responses under ‘Never’ shows that the question was answered indicating that respondents never
actually engaged with the stakeholders. The responses under ‘skipped’ were therefore not used in
the analysis but those under ‘Never’ formed part of the response categories used in the analysis.
This is so for all tables where ‘Skipped’ and ‘Never’ appeared.
Stellenbosch University https://scholar.sun.ac.za
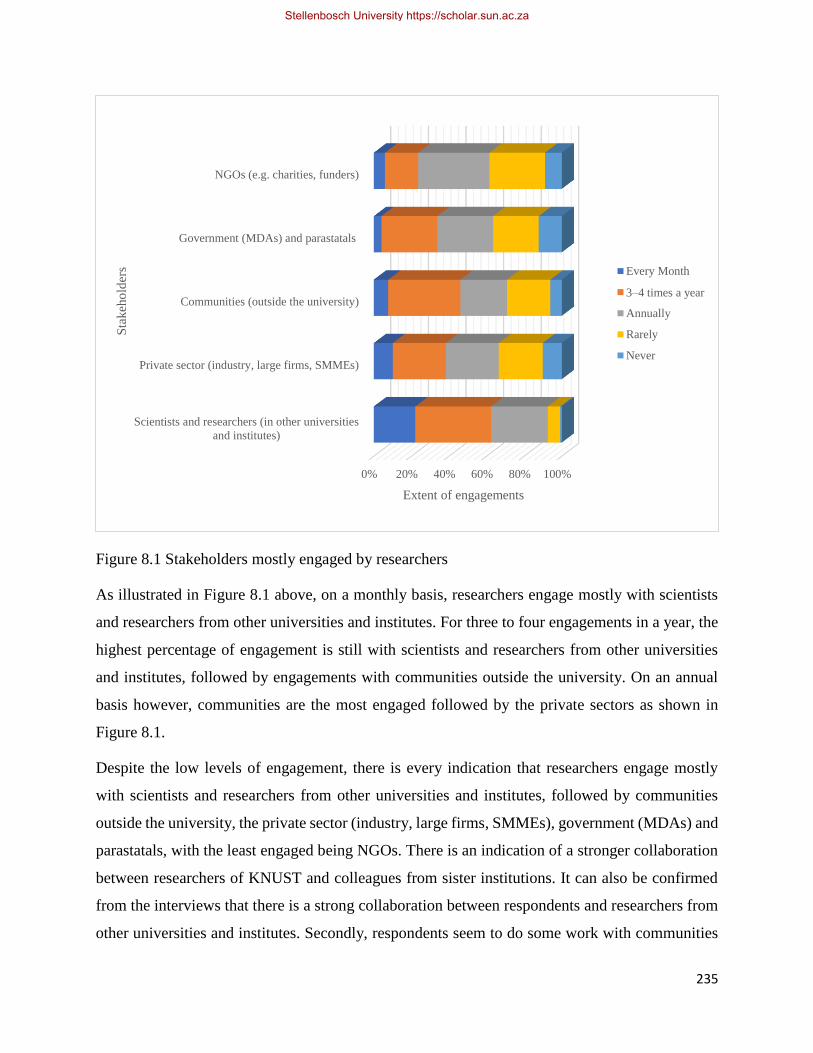
235
Figure 8.1 Stakeholders mostly engaged by researchers
As illustrated in Figure 8.1 above, on a monthly basis, researchers engage mostly with scientists
and researchers from other universities and institutes. For three to four engagements in a year, the
highest percentage of engagement is still with scientists and researchers from other universities
and institutes, followed by engagements with communities outside the university. On an annual
basis however, communities are the most engaged followed by the private sectors as shown in
Figure 8.1.
Despite the low levels of engagement, there is every indication that researchers engage mostly
with scientists and researchers from other universities and institutes, followed by communities
outside the university, the private sector (industry, large firms, SMMEs), government (MDAs) and
parastatals, with the least engaged being NGOs. There is an indication of a stronger collaboration
between researchers of KNUST and colleagues from sister institutions. It can also be confirmed
from the interviews that there is a strong collaboration between respondents and researchers from
other universities and institutes. Secondly, respondents seem to do some work with communities
0% 20% 40% 60% 80% 100%
Scientists and researchers (in other universities
and institutes)
Private sector (industry, large firms, SMMEs)
Communities (outside the university)
Government (MDAs) and parastatals
NGOs (e.g. charities, funders)
Extent of engagements
Sta
keh
old
ers Every Month
3–4 times a year
Annually
Rarely
Never
Stellenbosch University https://scholar.sun.ac.za

236
and the private sector. A few of the experienced senior lecturers and professors are the ones who
mostly engage with government, presumably as these interactions often require professional and
academic standing by the individual. Engagement with NGOs happens the least. The sections that
follow discuss in more detail the extent of engagement with these stakeholders generally, and by
academic position and faculties, the benefits of engagement, the extent of involvement in the
research process and the most common reasons why stakeholders do not use research findings that
could be beneficial to them.
8.3 Engagement with communities
This section discusses the following:
• how researchers typically engage with communities through specific engagement
mechanisms, which academic position and faculties engage most;
• how beneficial they perceive stated potential benefits of community engagement to their
own research engagement activities;
• the extent to which they involve communities at various stages in their research process;
and finally
• what in their opinion were the most common reasons why communities do not make use
of research findings that could be beneficial to them.
The summary of the survey responses and discussions are provided in the sub-sections below.
8.3.1 Typical engagement with communities
The literature outlines various mechanisms and channels of engagement with stakeholders.
According to some authors research is disseminated to stakeholders or audiences through, for
example, social media, exhibitions, research fairs, conferences, workshops, publications in
refereed journals, public forums, curriculum development, community-based research,
community-based networks and adopting communities for research (Becheikh & Ziam, 2010;
Cherney et al., 2012; Hood, 2002). This sub-section examines, from the survey and subsequent
interviews, how often researchers typically engage with communities around the university, what
the mechanisms and channels of engagement are and which academic position and faculties engage
most. Table 8.2 below provides the details of the frequency of engagement and the mechanisms of
engagement with communities. Those who did not respond to the questions are captured under
‘skipped’ and these are not included the in the illustrations.
Stellenbosch University https://scholar.sun.ac.za
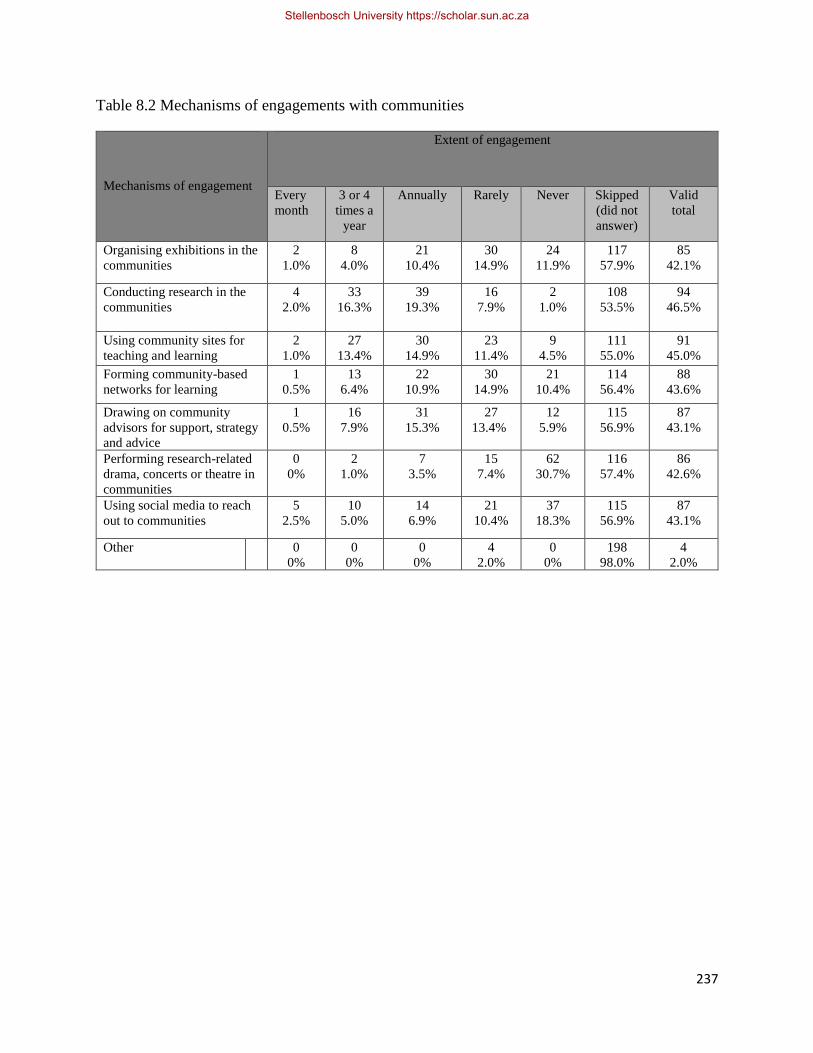
237
Table 8.2 Mechanisms of engagements with communities
Mechanisms of engagement
Extent of engagement
Every
month
3 or 4
times a
year
Annually
Rarely
Never
Skipped
(did not
answer)
Valid
total
Organising exhibitions in the
communities
2
1.0%
8
4.0%
21
10.4%
30
14.9%
24
11.9%
117
57.9%
85
42.1%
Conducting research in the
communities
4
2.0%
33
16.3%
39
19.3%
16
7.9%
2
1.0%
108
53.5%
94
46.5%
Using community sites for
teaching and learning
2
1.0%
27
13.4%
30
14.9%
23
11.4%
9
4.5%
111
55.0%
91
45.0%
Forming community-based
networks for learning
1
0.5%
13
6.4%
22
10.9%
30
14.9%
21
10.4%
114
56.4%
88
43.6%
Drawing on community
advisors for support, strategy
and advice
1
0.5%
16
7.9%
31
15.3%
27
13.4%
12
5.9%
115
56.9%
87
43.1%
Performing research-related
drama, concerts or theatre in
communities
0
0%
2
1.0%
7
3.5%
15
7.4%
62
30.7%
116
57.4%
86
42.6%
Using social media to reach
out to communities
5
2.5%
10
5.0%
14
6.9%
21
10.4%
37
18.3%
115
56.9%
87
43.1%
Other 0
0%
0
0%
0
0%
4
2.0%
0
0%
198
98.0%
4
2.0%
Stellenbosch University https://scholar.sun.ac.za
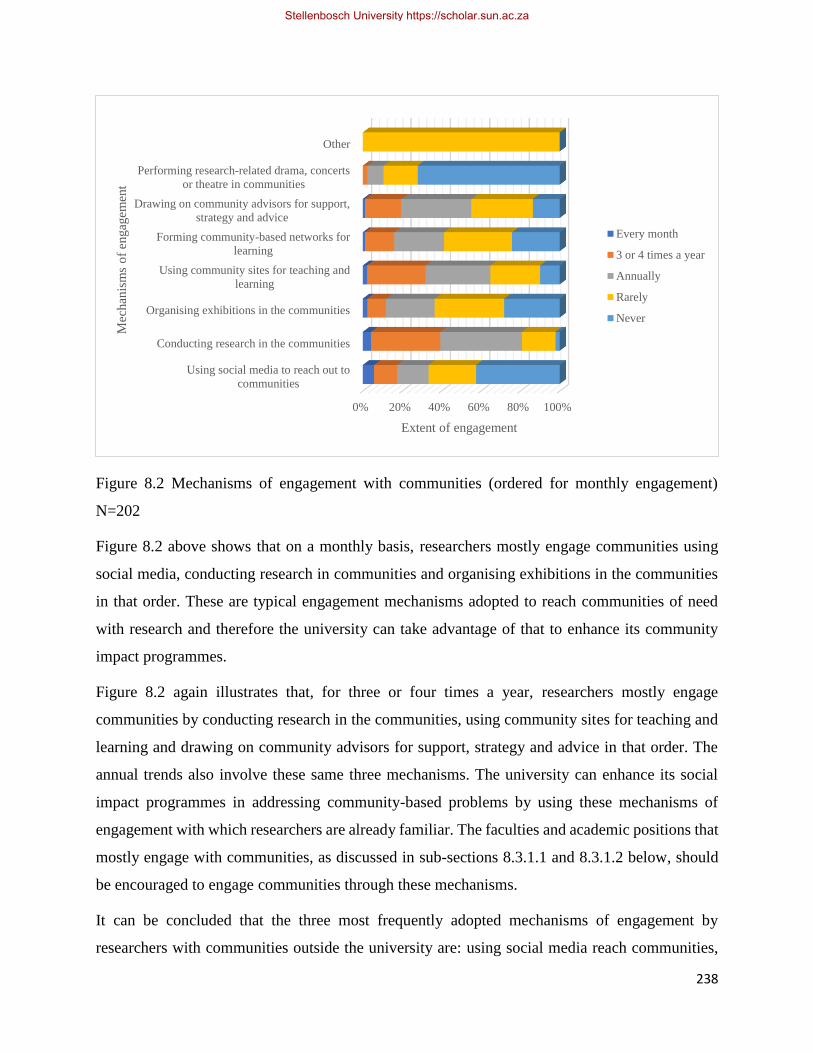
238
Figure 8.2 Mechanisms of engagement with communities (ordered for monthly engagement)
N=202
Figure 8.2 above shows that on a monthly basis, researchers mostly engage communities using
social media, conducting research in communities and organising exhibitions in the communities
in that order. These are typical engagement mechanisms adopted to reach communities of need
with research and therefore the university can take advantage of that to enhance its community
impact programmes.
Figure 8.2 again illustrates that, for three or four times a year, researchers mostly engage
communities by conducting research in the communities, using community sites for teaching and
learning and drawing on community advisors for support, strategy and advice in that order. The
annual trends also involve these same three mechanisms. The university can enhance its social
impact programmes in addressing community-based problems by using these mechanisms of
engagement with which researchers are already familiar. The faculties and academic positions that
mostly engage with communities, as discussed in sub-sections 8.3.1.1 and 8.3.1.2 below, should
be encouraged to engage communities through these mechanisms.
It can be concluded that the three most frequently adopted mechanisms of engagement by
researchers with communities outside the university are: using social media reach communities,
0% 20% 40% 60% 80% 100%
Using social media to reach out to
communities
Conducting research in the communities
Organising exhibitions in the communities
Using community sites for teaching and
learning
Forming community-based networks for
learning
Drawing on community advisors for support,
strategy and advice
Performing research-related drama, concerts
or theatre in communities
Other
Extent of engagement
Mec
han
ism
s o
f en
gag
emen
t
Every month
3 or 4 times a year
Annually
Rarely
Never
Stellenbosch University https://scholar.sun.ac.za
239
conducting research in the communities and organising exhibitions in communities as illustrated
in Figure 8.2 above.
Monthly engagements through the listed mechanisms are on the low side. The highest frequency
of engagement, that is 39%, is through conducting research in the communities on an annual basis
followed by using community sites for teaching and learning with 30% as shown in Figure 8.2
above. There is the need to work towards increasing the frequency of engagements, especially for those
mechanisms used less frequently.
Despite the low level of engagement by researchers with communities around the university, there
is a possibility that these engagements can be enhanced if given the needed impetus. The university
can explore ways to enhance its community engagement by addressing the challenges that
researchers have with the dissemination of research. As indicated by one respondent, some of the
communities they work with in the metropolis are difficult to reach and therefore logistics can be
a challenge. The most common barriers that need to be addressed are discussed in 8.3.4.
8.3.1.1 Academic position and extent of engagement with communities outside the university
In order to ascertain the level of engagement with communities for the various academic positions
a cross-tabulation of position versus communities was carried to establish who engages most
frequently. The figure below illustrates the extent of engagement of different academic positions
with communities outside the university.
Stellenbosch University https://scholar.sun.ac.za
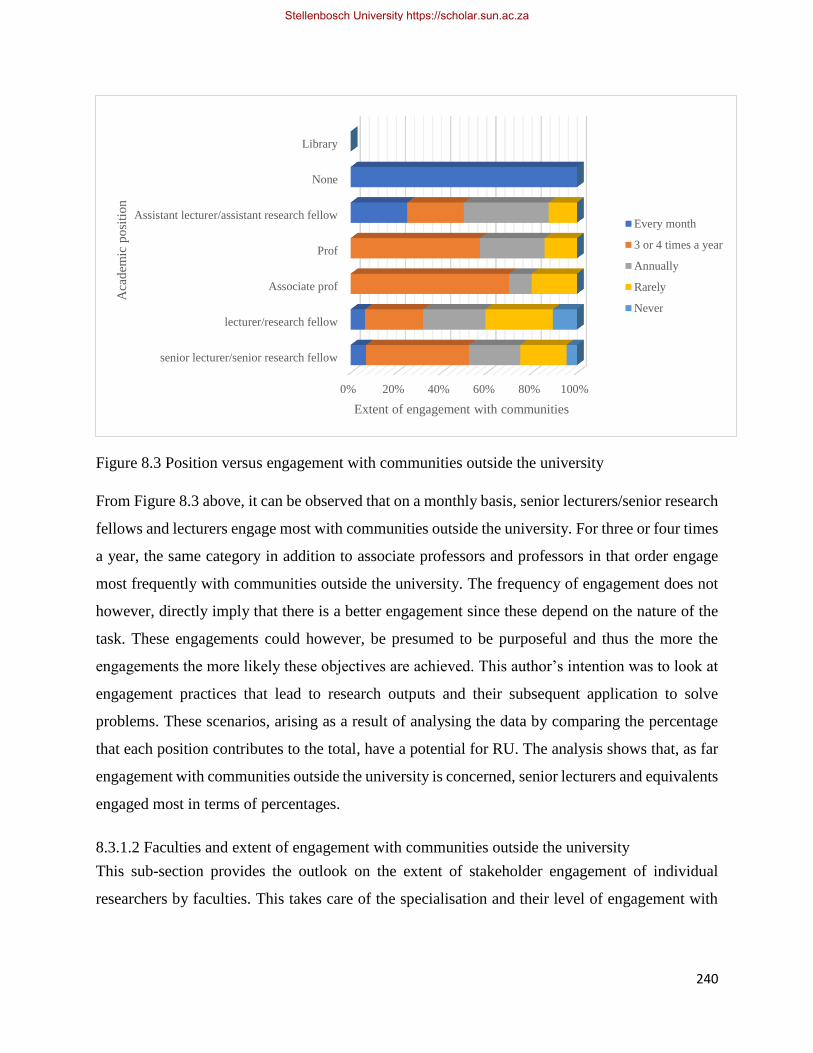
240
Figure 8.3 Position versus engagement with communities outside the university
From Figure 8.3 above, it can be observed that on a monthly basis, senior lecturers/senior research
fellows and lecturers engage most with communities outside the university. For three or four times
a year, the same category in addition to associate professors and professors in that order engage
most frequently with communities outside the university. The frequency of engagement does not
however, directly imply that there is a better engagement since these depend on the nature of the
task. These engagements could however, be presumed to be purposeful and thus the more the
engagements the more likely these objectives are achieved. This author’s intention was to look at
engagement practices that lead to research outputs and their subsequent application to solve
problems. These scenarios, arising as a result of analysing the data by comparing the percentage
that each position contributes to the total, have a potential for RU. The analysis shows that, as far
engagement with communities outside the university is concerned, senior lecturers and equivalents
engaged most in terms of percentages.
8.3.1.2 Faculties and extent of engagement with communities outside the university
This sub-section provides the outlook on the extent of stakeholder engagement of individual
researchers by faculties. This takes care of the specialisation and their level of engagement with
0% 20% 40% 60% 80% 100%
senior lecturer/senior research fellow
lecturer/research fellow
Associate prof
Prof
Assistant lecturer/assistant research fellow
None
Library
Extent of engagement with communities
Aca
dem
ic p
osi
tio
n
Every month
3 or 4 times a year
Annually
Rarely
Never
Stellenbosch University https://scholar.sun.ac.za
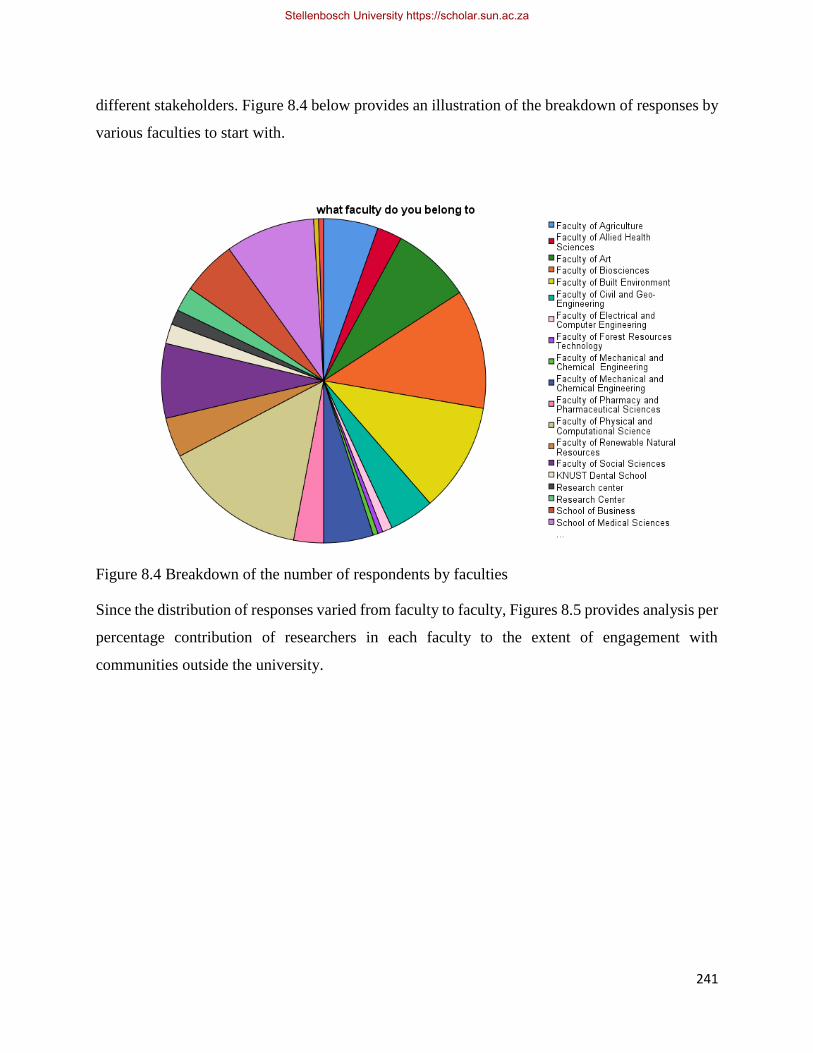
241
different stakeholders. Figure 8.4 below provides an illustration of the breakdown of responses by
various faculties to start with.
Figure 8.4 Breakdown of the number of respondents by faculties
Since the distribution of responses varied from faculty to faculty, Figures 8.5 provides analysis per
percentage contribution of researchers in each faculty to the extent of engagement with
communities outside the university.
Stellenbosch University https://scholar.sun.ac.za
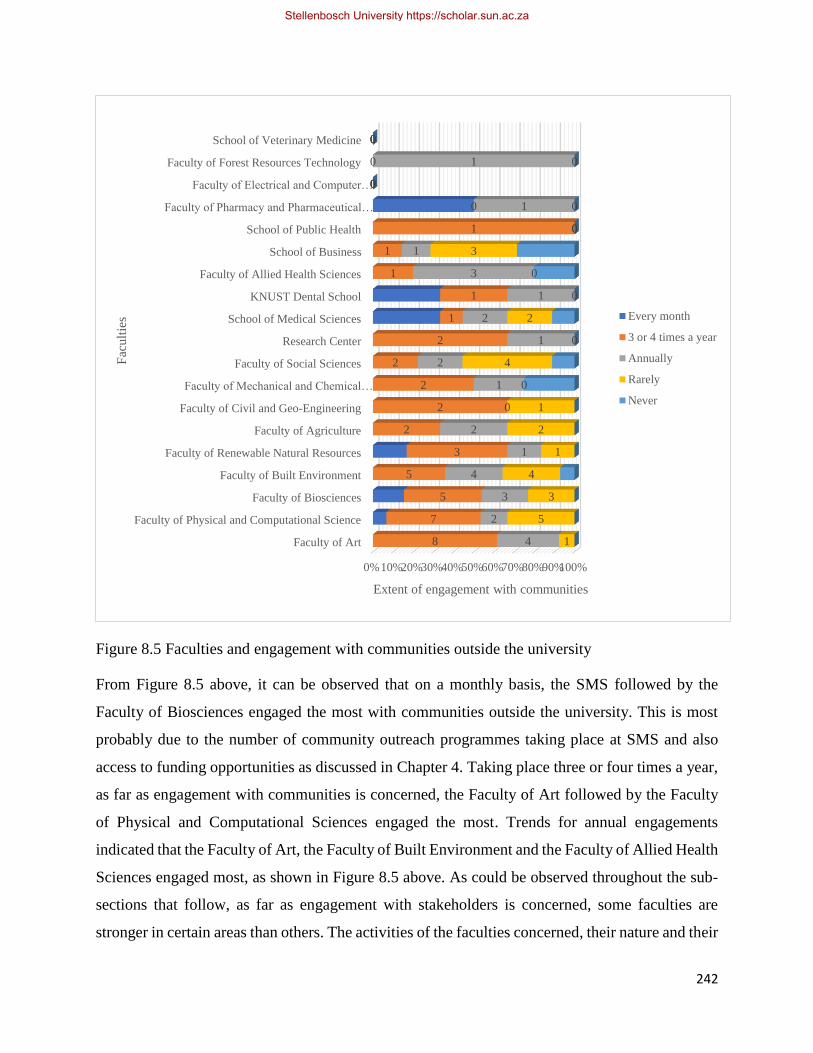
242
Figure 8.5 Faculties and engagement with communities outside the university
From Figure 8.5 above, it can be observed that on a monthly basis, the SMS followed by the
Faculty of Biosciences engaged the most with communities outside the university. This is most
probably due to the number of community outreach programmes taking place at SMS and also
access to funding opportunities as discussed in Chapter 4. Taking place three or four times a year,
as far as engagement with communities is concerned, the Faculty of Art followed by the Faculty
of Physical and Computational Sciences engaged the most. Trends for annual engagements
indicated that the Faculty of Art, the Faculty of Built Environment and the Faculty of Allied Health
Sciences engaged most, as shown in Figure 8.5 above. As could be observed throughout the sub-
sections that follow, as far as engagement with stakeholders is concerned, some faculties are
stronger in certain areas than others. The activities of the faculties concerned, their nature and their
0%10%20%30%40%50%60%70%80%90%100%
Faculty of Art
Faculty of Physical and Computational Science
Faculty of Biosciences
Faculty of Built Environment
Faculty of Renewable Natural Resources
Faculty of Agriculture
Faculty of Civil and Geo-Engineering
Faculty of Mechanical and Chemical…
Faculty of Social Sciences
Research Center
School of Medical Sciences
KNUST Dental School
Faculty of Allied Health Sciences
School of Business
School of Public Health
Faculty of Pharmacy and Pharmaceutical…
Faculty of Electrical and Computer…
Faculty of Forest Resources Technology
School of Veterinary Medicine
8
7
5
5
3
2
2
2
2
2
1
1
1
1
1
0
0
0
0
4
2
3
4
1
2
0
1
2
1
2
1
3
1
0
1
0
1
0
1
5
3
4
1
2
1
0
4
0
2
0
0
3
0
0
0
0
0
Extent of engagement with communities
Fac
ult
ies Every month
3 or 4 times a year
Annually
Rarely
Never
Stellenbosch University https://scholar.sun.ac.za
243
set up contribute to the extent of engagement with the different stakeholders. The Faculty of Art
and the Faculty of Physical and Computational Sciences have many outreach programmes such
art exhibitions and computer literacy schools, thereby making them more prominent in the
immediate communities around the university.
The faculties that excel in community engagement, namely the School of Medical Sciences and
the Faculty of Biosciences ought to be encouraged and incentivised to do more while those lagging
behind are given the needed human and financial resources. The next sub-section looks at the
perceived benefits of engagements with communities.
8.3.2 Benefits of engagements with communities
There are a number of potential benefits of research outlined in the literature. These include
opportunities for further research, funding, collaboration, innovations, transferring research to
practice, influencing decisions and choices (Bozeman, 2000; Cherney et al., 2012; Jacobson, 2007;
Sudsawad, 2007). This sub-section examines the experiences and perceptions of researchers with
some of these benefits in their engagement with communities around the university. Generally,
researchers agree that conducting and disseminating research has some benefits. Table 8.3 below
gives the specific responses as to how beneficial researchers perceive the potential benefits of
community engagement is for their own research engagement activities.
Stellenbosch University https://scholar.sun.ac.za
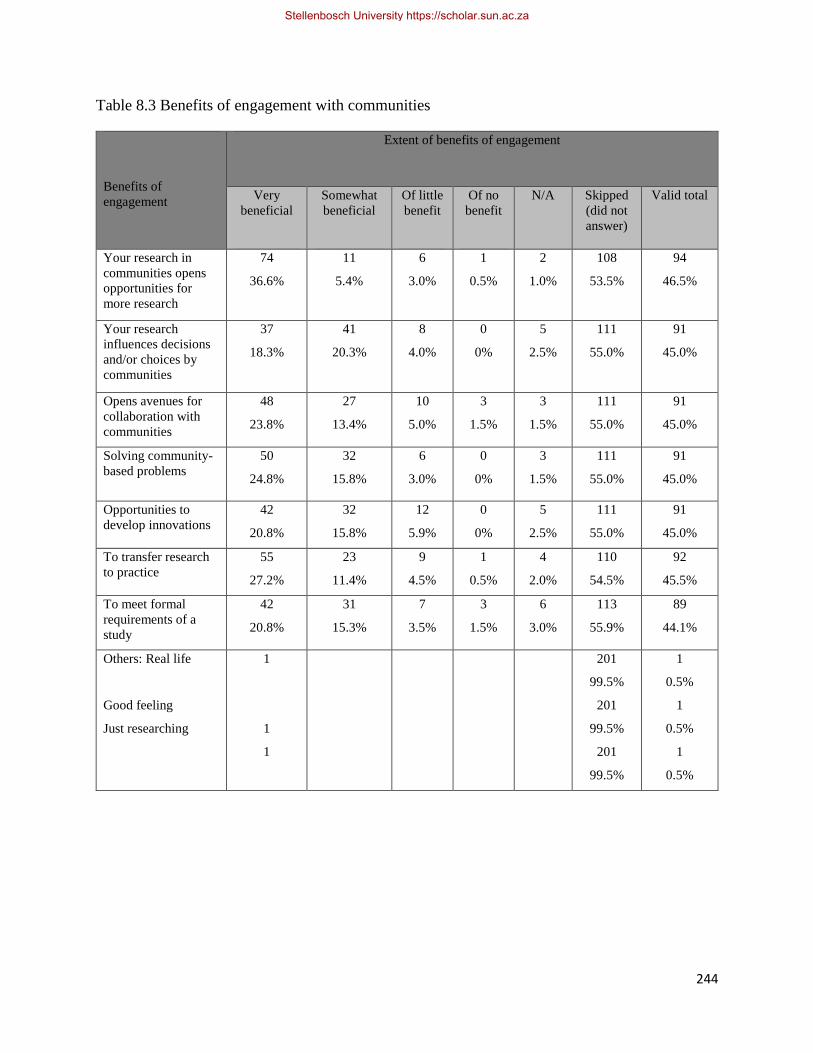
244
Table 8.3 Benefits of engagement with communities
Benefits of
engagement
Extent of benefits of engagement
Very
beneficial
Somewhat
beneficial
Of little
benefit
Of no
benefit
N/A
Skipped
(did not
answer)
Valid total
Your research in
communities opens
opportunities for
more research
74
36.6%
11
5.4%
6
3.0%
1
0.5%
2
1.0%
108
53.5%
94
46.5%
Your research
influences decisions
and/or choices by
communities
37
18.3%
41
20.3%
8
4.0%
0
0%
5
2.5%
111
55.0%
91
45.0%
Opens avenues for
collaboration with
communities
48
23.8%
27
13.4%
10
5.0%
3
1.5%
3
1.5%
111
55.0%
91
45.0%
Solving community-
based problems
50
24.8%
32
15.8%
6
3.0%
0
0%
3
1.5%
111
55.0%
91
45.0%
Opportunities to
develop innovations
42
20.8%
32
15.8%
12
5.9%
0
0%
5
2.5%
111
55.0%
91
45.0%
To transfer research
to practice
55
27.2%
23
11.4%
9
4.5%
1
0.5%
4
2.0%
110
54.5%
92
45.5%
To meet formal
requirements of a
study
42
20.8%
31
15.3%
7
3.5%
3
1.5%
6
3.0%
113
55.9%
89
44.1%
Others: Real life
Good feeling
Just researching
1
1
1
201
99.5%
201
99.5%
201
99.5%
1
0.5%
1
0.5%
1
0.5%
Stellenbosch University https://scholar.sun.ac.za
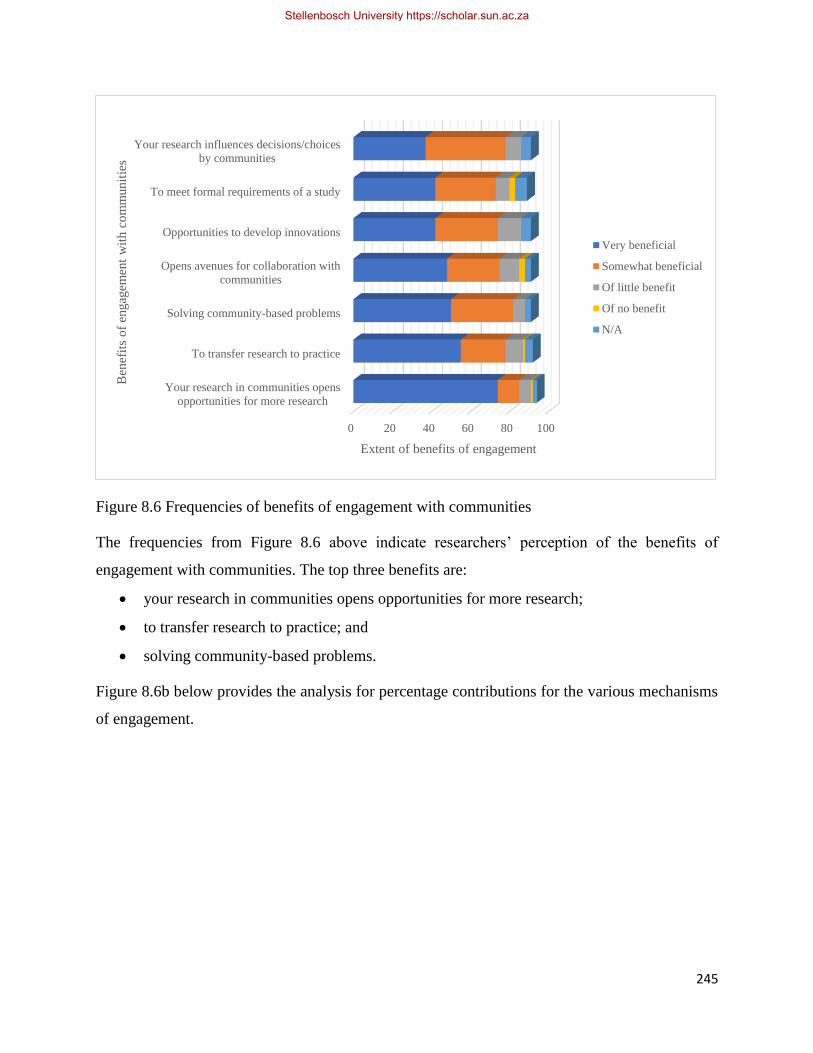
245
Figure 8.6 Frequencies of benefits of engagement with communities
The frequencies from Figure 8.6 above indicate researchers’ perception of the benefits of
engagement with communities. The top three benefits are:
• your research in communities opens opportunities for more research;
• to transfer research to practice; and
• solving community-based problems.
Figure 8.6b below provides the analysis for percentage contributions for the various mechanisms
of engagement.
0 20 40 60 80 100
Your research in communities opens
opportunities for more research
To transfer research to practice
Solving community-based problems
Opens avenues for collaboration with
communities
Opportunities to develop innovations
To meet formal requirements of a study
Your research influences decisions/choices
by communities
Extent of benefits of engagement
Ben
efit
s o
f en
gag
emen
t w
ith c
om
munit
ies
Very beneficial
Somewhat beneficial
Of little benefit
Of no benefit
N/A
Stellenbosch University https://scholar.sun.ac.za
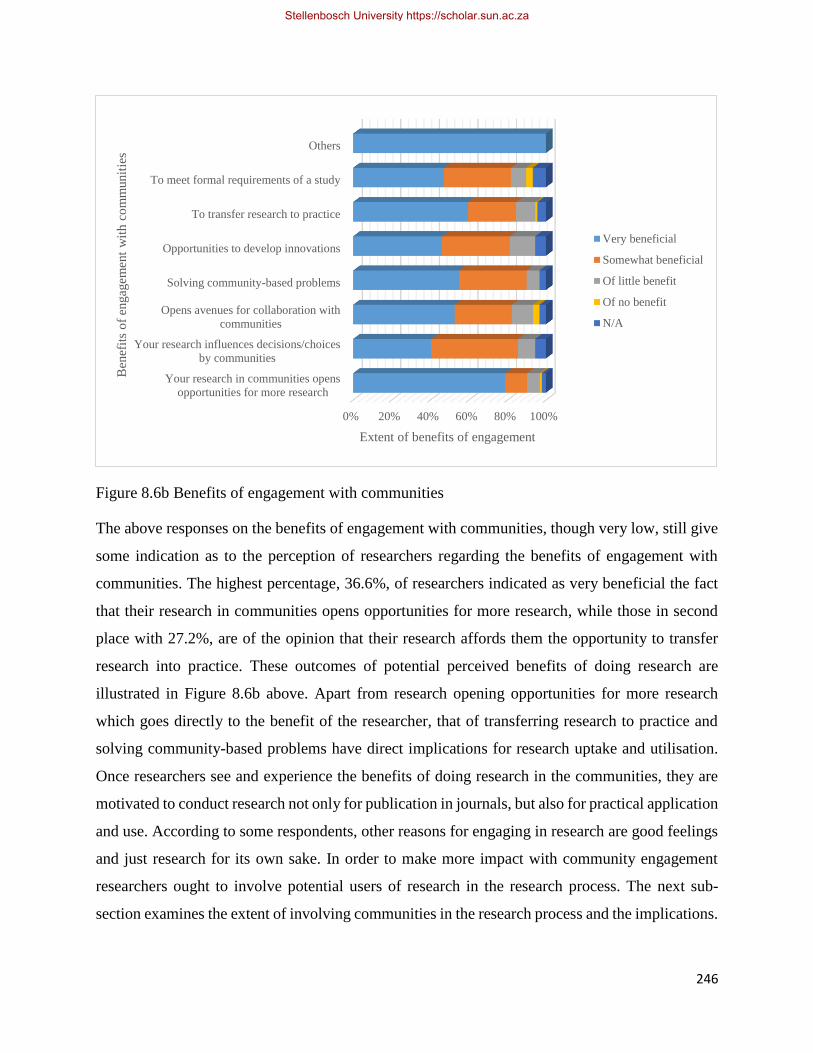
246
Figure 8.6b Benefits of engagement with communities
The above responses on the benefits of engagement with communities, though very low, still give
some indication as to the perception of researchers regarding the benefits of engagement with
communities. The highest percentage, 36.6%, of researchers indicated as very beneficial the fact
that their research in communities opens opportunities for more research, while those in second
place with 27.2%, are of the opinion that their research affords them the opportunity to transfer
research into practice. These outcomes of potential perceived benefits of doing research are
illustrated in Figure 8.6b above. Apart from research opening opportunities for more research
which goes directly to the benefit of the researcher, that of transferring research to practice and
solving community-based problems have direct implications for research uptake and utilisation.
Once researchers see and experience the benefits of doing research in the communities, they are
motivated to conduct research not only for publication in journals, but also for practical application
and use. According to some respondents, other reasons for engaging in research are good feelings
and just research for its own sake. In order to make more impact with community engagement
researchers ought to involve potential users of research in the research process. The next sub-
section examines the extent of involving communities in the research process and the implications.
0% 20% 40% 60% 80% 100%
Your research in communities opens
opportunities for more research
Your research influences decisions/choices
by communities
Opens avenues for collaboration with
communities
Solving community-based problems
Opportunities to develop innovations
To transfer research to practice
To meet formal requirements of a study
Others
Extent of benefits of engagement
Ben
efit
s o
f en
gag
emen
t w
ith c
om
munit
ies
Very beneficial
Somewhat beneficial
Of little benefit
Of no benefit
N/A
Stellenbosch University https://scholar.sun.ac.za

247
8.3.3 Stages of involvement of communities in research
Stakeholder participation in the research process has been argued to be key to acceptance and
adoption of research, and therefore uptake and utilisation. Researchers are therefore expected to
involve their stakeholders and potential users in their research process at appropriate stages. The
stages include the research proposal or development stage, data collection and analysis stage
during the research process, during the research report drafting stage, during the final report and
dissemination stage and at all stages of the research process (Bozeman, 2000; NCDDR, 1995;
Nicholson-Cole & Whitmarsh, 2008). Respondents were required to indicate the extent to which
they involve communities in their research process at some specific stages. The outcomes are as
indicated in Table 8.4 and illustrated in Figure 8.7 below.
Table 8.4 Stages of involving communities in research
Stages of
involvement in
research
Extent of involvement
Always
Usually
Sometimes
Rarely
Never
Skipped
(did not
answer)
Valid
total
At the research
formulation stage
22
10.9%
22
10.9%
25
12.4%
17
8.4%
4
2.0%
112
55.4%
90
44.6%
At the research
proposal stage
18
8.9%
19
9.4%
31
15.3%
12
5.9%
8
4.0%
114
56.4%
88
43.6%
During the report
writing stage
11
5.4%
13
6.4%
28
13.9%
25
12.4%
11
5.4%
114
56.4%
88
43.6%
Throughout the
entire research
process
15
7.4%
20
9.9%
29
14.4%
18
8.9%
8
4.0%
112
55.4%
90
44.6%
Figure 8.7 below shows the distribution of the stages at which researchers involve communities in
their research process. It can be observed that researchers always involve communities first of all
at the research formulation stage. The second preference is at the research proposal stage, third,
throughout the entire research process and finally during the report writing stage. Figure 8.7 below
gives the percentage distribution for the various stages of involvement.
Stellenbosch University https://scholar.sun.ac.za
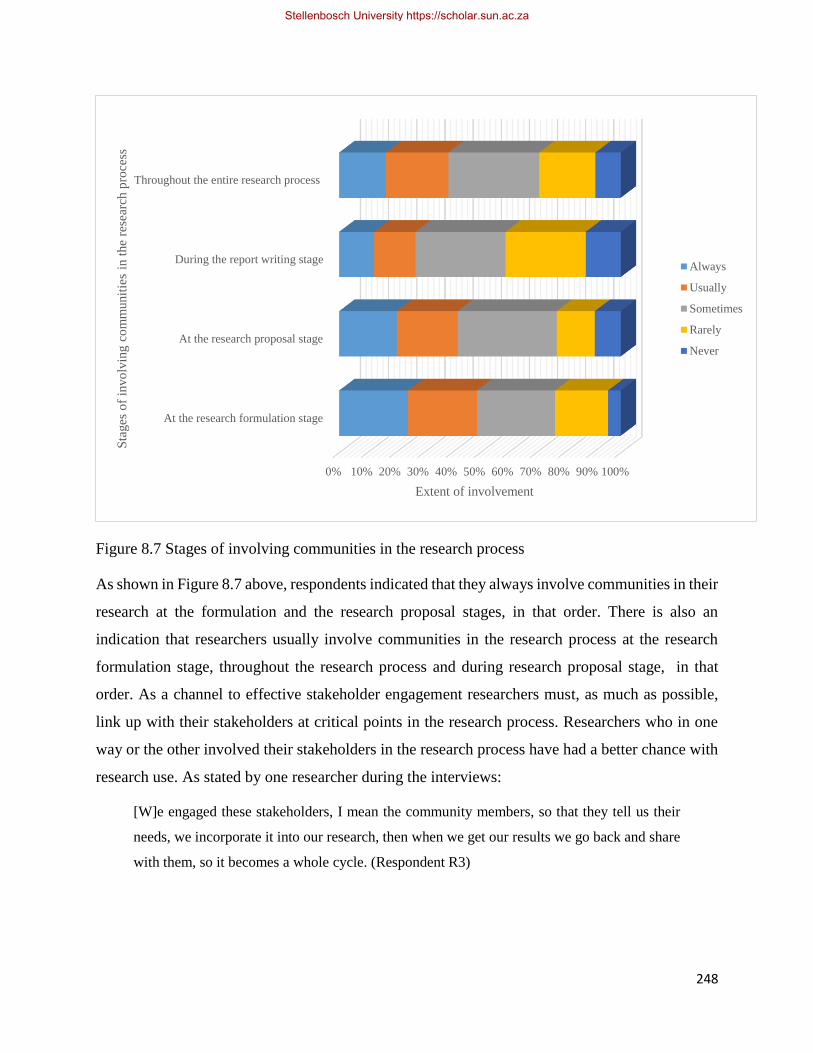
248
Figure 8.7 Stages of involving communities in the research process
As shown in Figure 8.7 above, respondents indicated that they always involve communities in their
research at the formulation and the research proposal stages, in that order. There is also an
indication that researchers usually involve communities in the research process at the research
formulation stage, throughout the research process and during research proposal stage, in that
order. As a channel to effective stakeholder engagement researchers must, as much as possible,
link up with their stakeholders at critical points in the research process. Researchers who in one
way or the other involved their stakeholders in the research process have had a better chance with
research use. As stated by one researcher during the interviews:
[W]e engaged these stakeholders, I mean the community members, so that they tell us their
needs, we incorporate it into our research, then when we get our results we go back and share
with them, so it becomes a whole cycle. (Respondent R3)
0% 10% 20% 30% 40% 50% 60% 70% 80% 90% 100%
At the research formulation stage
At the research proposal stage
During the report writing stage
Throughout the entire research process
Extent of involvement
Sta
ges
of
invo
lvin
g c
om
munit
ies
in t
he
rese
arch
pro
cess
Always
Usually
Sometimes
Rarely
Never
Stellenbosch University https://scholar.sun.ac.za
249
This emphasises the need to consult with stakeholders at one point or the other because they also
have useful ideas to improve the quality of the research. The next sub-section outlines some of the
reasons why communities do not use research findings.
8.3.4 Reasons why communities do not use research findings
This sub-section looks at individual and institutional barriers that are associated with research
uptake and utilisation at the community level. As discussed in the literature, there are information-
related barriers, organisational structure and process barriers, organisational culture, individual
and interaction barriers associated with the use of research (Humphries, 2014; Oliver et al., 2014;
Sedlacko, et al., 2013). Respondents were asked to indicate the most common reasons why
communities do not use research results which could be beneficial to them. The outcomes, ranked
1–3 from highest down are as given in Table 8.5 and illustrated in Figure 8.8 below. Reason 1
represents what respondents considered the foremost and most important common reasons for non-
use of research followed by Reason 2 and Reason 3 in order of priority.
Stellenbosch University https://scholar.sun.ac.za
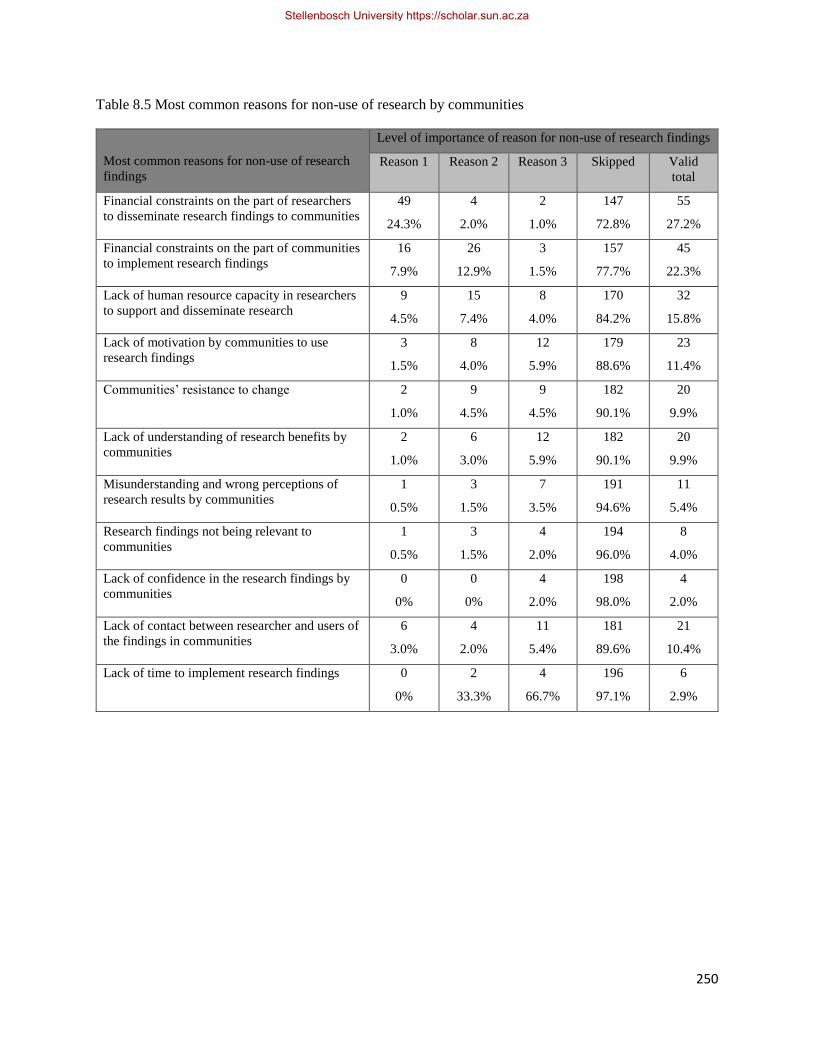
250
Table 8.5 Most common reasons for non-use of research by communities
Most common reasons for non-use of research
findings
Level of importance of reason for non-use of research findings
Reason 1 Reason 2 Reason 3 Skipped Valid
total
Financial constraints on the part of researchers
to disseminate research findings to communities
49
24.3%
4
2.0%
2
1.0%
147
72.8%
55
27.2%
Financial constraints on the part of communities
to implement research findings
16
7.9%
26
12.9%
3
1.5%
157
77.7%
45
22.3%
Lack of human resource capacity in researchers
to support and disseminate research
9
4.5%
15
7.4%
8
4.0%
170
84.2%
32
15.8%
Lack of motivation by communities to use
research findings
3
1.5%
8
4.0%
12
5.9%
179
88.6%
23
11.4%
Communities’ resistance to change 2
1.0%
9
4.5%
9
4.5%
182
90.1%
20
9.9%
Lack of understanding of research benefits by
communities
2
1.0%
6
3.0%
12
5.9%
182
90.1%
20
9.9%
Misunderstanding and wrong perceptions of
research results by communities
1
0.5%
3
1.5%
7
3.5%
191
94.6%
11
5.4%
Research findings not being relevant to
communities
1
0.5%
3
1.5%
4
2.0%
194
96.0%
8
4.0%
Lack of confidence in the research findings by
communities
0
0%
0
0%
4
2.0%
198
98.0%
4
2.0%
Lack of contact between researcher and users of
the findings in communities
6
3.0%
4
2.0%
11
5.4%
181
89.6%
21
10.4%
Lack of time to implement research findings 0
0%
2
33.3%
4
66.7%
196
97.1%
6
2.9%
Stellenbosch University https://scholar.sun.ac.za

251
Figure 8.8 Most common reasons why communities do no use research findings
From Figures 8.8 above, the first most common reason why communities do not use research
findings indicated by researchers was that of financial constraints on the part of researchers to
disseminate research findings to communities. This conforms with the literature and was also
confirmed during the interviews. Researchers need funding to disseminate research, findings
without which researchers will not be able to bring their findings to the doorsteps of stakeholders.
The second most common reason why communities do not use research findings is financial
constraints on the part of communities to implement research findings. It implies that even if
research findings are made available to communities, lack of funding on the part of communities
to implement the findings will be a barrier to the use of the research findings. The third most
common barrier to research use by communities is lack of human resource capacity from
researchers to support and disseminate research. One way around this barrier is to enhance the
level of stakeholder involvement for the necessary confidence and acceptance. This is corroborated
by one respondent who said communities do not use research because of “low community
involvement in the research”. Please note, in this section, all direct quotations by respondents are
provided verbatim and unedited.
0% 10%20%30%40%50%60%70%80%90%100%
Financial constraints on the part of researchers…
Financial constraints on the part of…
Lack of human resource capacity in…
Lack of contact between researcher and users…
Lack of motivation by communities to use…
Communities resistance to change
Lack of understanding of research benefits by…
Misunderstanding and wrong perceptions of…
Research findings not being relevant to…
Lack of confidence in the research findings by…
Lack of time to implement research findings
Level of importance of reason for non-use of research findings
Mo
st c
om
mo
n r
easo
ns
for
no
n-u
se o
f re
sear
ch
find
ings
by c
om
munit
ies
Reason 1
Reason 2
Reason 3
Stellenbosch University https://scholar.sun.ac.za
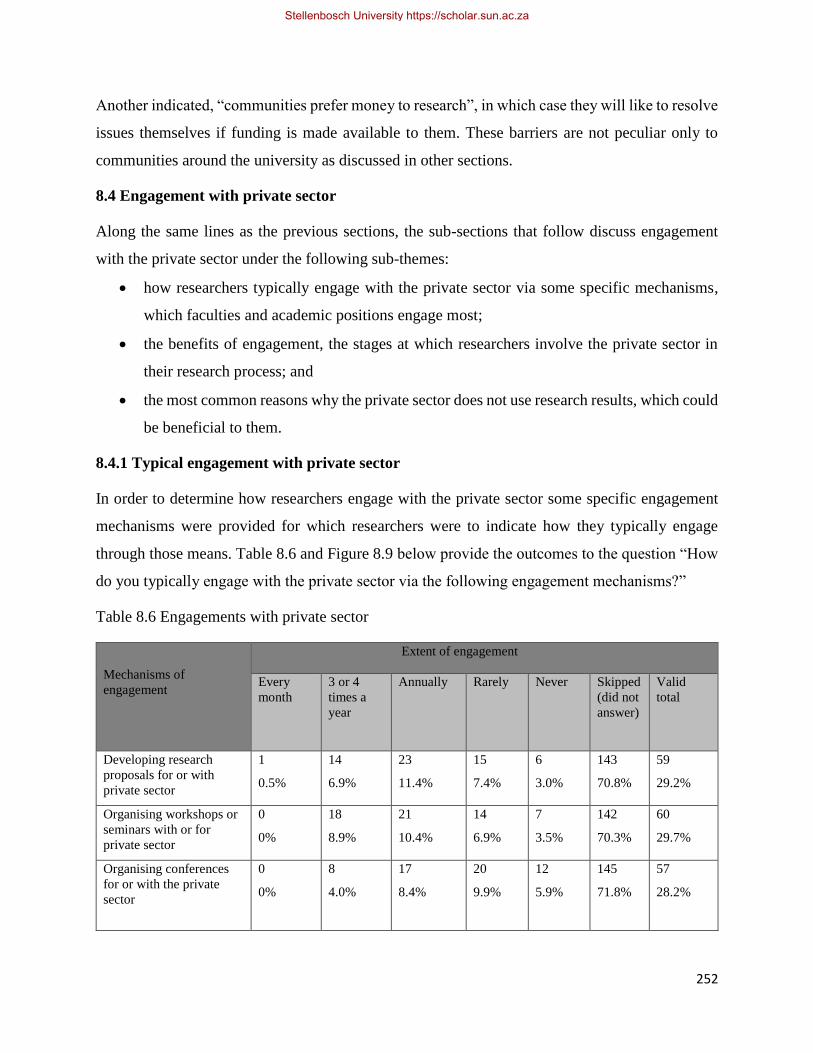
252
Another indicated, “communities prefer money to research”, in which case they will like to resolve
issues themselves if funding is made available to them. These barriers are not peculiar only to
communities around the university as discussed in other sections.
8.4 Engagement with private sector
Along the same lines as the previous sections, the sub-sections that follow discuss engagement
with the private sector under the following sub-themes:
• how researchers typically engage with the private sector via some specific mechanisms,
which faculties and academic positions engage most;
• the benefits of engagement, the stages at which researchers involve the private sector in
their research process; and
• the most common reasons why the private sector does not use research results, which could
be beneficial to them.
8.4.1 Typical engagement with private sector
In order to determine how researchers engage with the private sector some specific engagement
mechanisms were provided for which researchers were to indicate how they typically engage
through those means. Table 8.6 and Figure 8.9 below provide the outcomes to the question “How
do you typically engage with the private sector via the following engagement mechanisms?”
Table 8.6 Engagements with private sector
Mechanisms of
engagement
Extent of engagement
Every
month
3 or 4
times a
year
Annually
Rarely
Never
Skipped
(did not
answer)
Valid
total
Developing research
proposals for or with
private sector
1
0.5%
14
6.9%
23
11.4%
15
7.4%
6
3.0%
143
70.8%
59
29.2%
Organising workshops or
seminars with or for
private sector
0
0%
18
8.9%
21
10.4%
14
6.9%
7
3.5%
142
70.3%
60
29.7%
Organising conferences
for or with the private
sector
0
0%
8
4.0%
17
8.4%
20
9.9%
12
5.9%
145
71.8%
57
28.2%
Stellenbosch University https://scholar.sun.ac.za
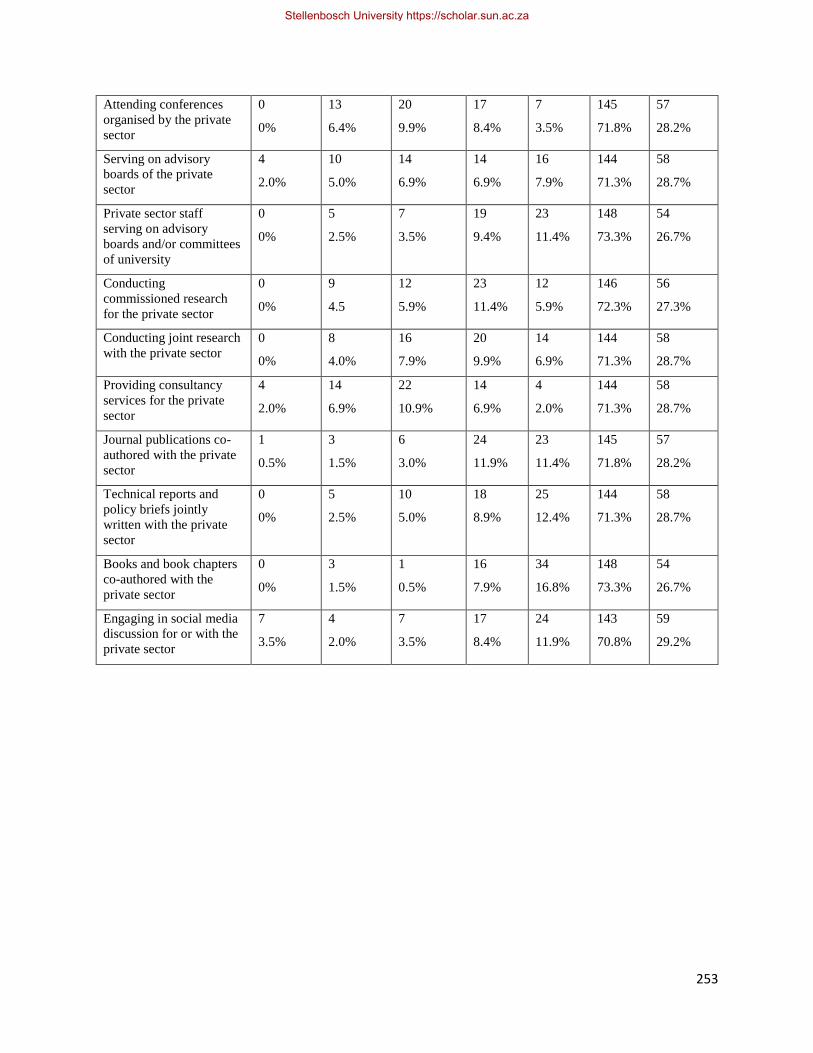
253
Attending conferences
organised by the private
sector
0
0%
13
6.4%
20
9.9%
17
8.4%
7
3.5%
145
71.8%
57
28.2%
Serving on advisory
boards of the private
sector
4
2.0%
10
5.0%
14
6.9%
14
6.9%
16
7.9%
144
71.3%
58
28.7%
Private sector staff
serving on advisory
boards and/or committees
of university
0
0%
5
2.5%
7
3.5%
19
9.4%
23
11.4%
148
73.3%
54
26.7%
Conducting
commissioned research
for the private sector
0
0%
9
4.5
12
5.9%
23
11.4%
12
5.9%
146
72.3%
56
27.3%
Conducting joint research
with the private sector
0
0%
8
4.0%
16
7.9%
20
9.9%
14
6.9%
144
71.3%
58
28.7%
Providing consultancy
services for the private
sector
4
2.0%
14
6.9%
22
10.9%
14
6.9%
4
2.0%
144
71.3%
58
28.7%
Journal publications co-
authored with the private
sector
1
0.5%
3
1.5%
6
3.0%
24
11.9%
23
11.4%
145
71.8%
57
28.2%
Technical reports and
policy briefs jointly
written with the private
sector
0
0%
5
2.5%
10
5.0%
18
8.9%
25
12.4%
144
71.3%
58
28.7%
Books and book chapters
co-authored with the
private sector
0
0%
3
1.5%
1
0.5%
16
7.9%
34
16.8%
148
73.3%
54
26.7%
Engaging in social media
discussion for or with the
private sector
7
3.5%
4
2.0%
7
3.5%
17
8.4%
24
11.9%
143
70.8%
59
29.2%
Stellenbosch University https://scholar.sun.ac.za
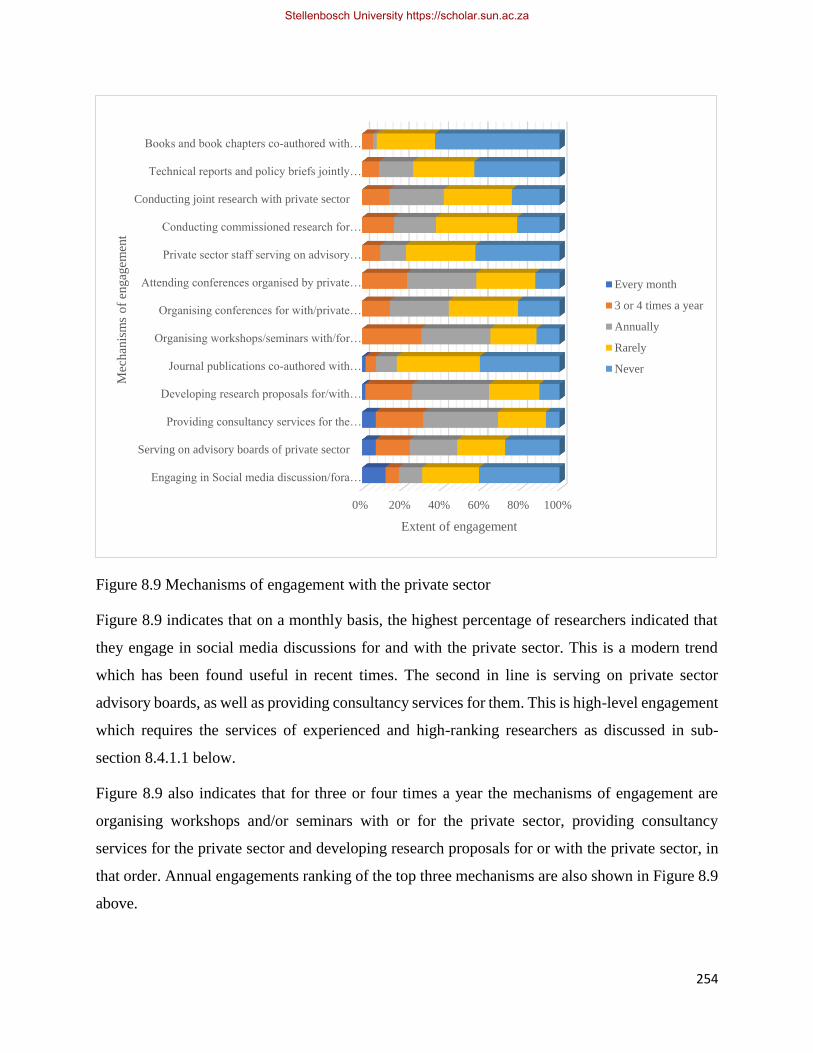
254
Figure 8.9 Mechanisms of engagement with the private sector
Figure 8.9 indicates that on a monthly basis, the highest percentage of researchers indicated that
they engage in social media discussions for and with the private sector. This is a modern trend
which has been found useful in recent times. The second in line is serving on private sector
advisory boards, as well as providing consultancy services for them. This is high-level engagement
which requires the services of experienced and high-ranking researchers as discussed in sub-
section 8.4.1.1 below.
Figure 8.9 also indicates that for three or four times a year the mechanisms of engagement are
organising workshops and/or seminars with or for the private sector, providing consultancy
services for the private sector and developing research proposals for or with the private sector, in
that order. Annual engagements ranking of the top three mechanisms are also shown in Figure 8.9
above.
0% 20% 40% 60% 80% 100%
Engaging in Social media discussion/fora…
Serving on advisory boards of private sector
Providing consultancy services for the…
Developing research proposals for/with…
Journal publications co-authored with…
Organising workshops/seminars with/for…
Organising conferences for with/private…
Attending conferences organised by private…
Private sector staff serving on advisory…
Conducting commissioned research for…
Conducting joint research with private sector
Technical reports and policy briefs jointly…
Books and book chapters co-authored with…
Extent of engagement
Mec
han
ism
s o
f en
gag
emen
t
Every month
3 or 4 times a year
Annually
Rarely
Never
Stellenbosch University https://scholar.sun.ac.za
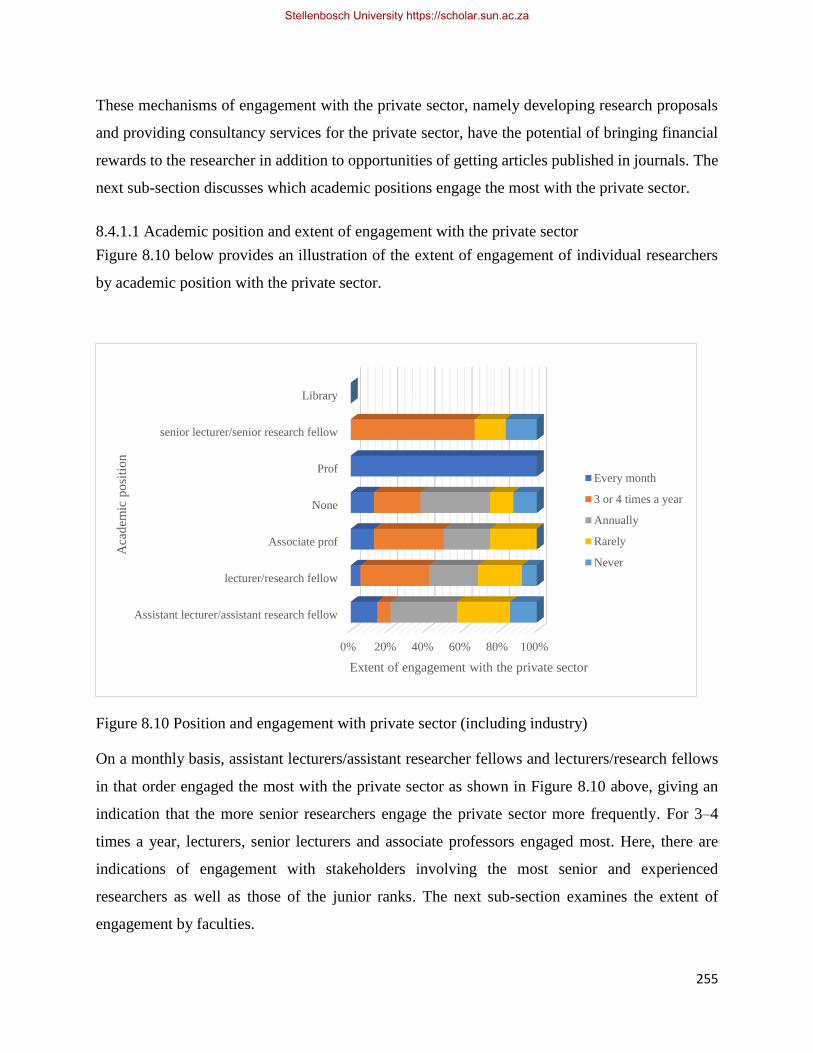
255
These mechanisms of engagement with the private sector, namely developing research proposals
and providing consultancy services for the private sector, have the potential of bringing financial
rewards to the researcher in addition to opportunities of getting articles published in journals. The
next sub-section discusses which academic positions engage the most with the private sector.
8.4.1.1 Academic position and extent of engagement with the private sector
Figure 8.10 below provides an illustration of the extent of engagement of individual researchers
by academic position with the private sector.
Figure 8.10 Position and engagement with private sector (including industry)
On a monthly basis, assistant lecturers/assistant researcher fellows and lecturers/research fellows
in that order engaged the most with the private sector as shown in Figure 8.10 above, giving an
indication that the more senior researchers engage the private sector more frequently. For 3–4
times a year, lecturers, senior lecturers and associate professors engaged most. Here, there are
indications of engagement with stakeholders involving the most senior and experienced
researchers as well as those of the junior ranks. The next sub-section examines the extent of
engagement by faculties.
0% 20% 40% 60% 80% 100%
Assistant lecturer/assistant research fellow
lecturer/research fellow
Associate prof
None
Prof
senior lecturer/senior research fellow
Library
Extent of engagement with the private sector
Aca
dem
ic p
osi
tio
n
Every month
3 or 4 times a year
Annually
Rarely
Never
Stellenbosch University https://scholar.sun.ac.za

256
8.4.1.2 Faculties and extent of engagement with the private sector
The extent of engagement of the various faculties with the private sector are illustrated in Figure
8.11 below.
Figure 8.11 Faculties and extent of Engagement with the private sector
Figure 8.11 above shows that on a monthly basis, the Faculty of Pharmacy and Pharmaceutical
Sciences, the Faculty of Agriculture, the Faculty of Mechanical and Chemical Engineering and the
Faculty of Physical and Computational Sciences in that order, engaged most with the private
sector. These four faculties belong to the College of Health Sciences, College of Agriculture and
Natural Resources and the College of Engineering and the College of Science, respectively. This
implies that the research activities of these four faculties or colleges are such that they favour
engagements with the private sector. These research activities give these faculties or colleges a
relative advantage over the others and thus there is the need to identify what exactly gives them
this edge over the others. The activities of other faculties or colleges could then be tailored to
0% 20% 40% 60% 80% 100%
Faculty of Physical and Computational…
Faculty of Biosciences
Faculty of Art
Faculty of Renewable Natural Resources
Faculty of Mechanical and Chemical…
Faculty of Built Environment
Faculty of Pharmacy and Pharmaceutical…
Faculty of Civil and Geo-Engineering
Faculty of Social Sciences
Research Center
School of Business
School of Medical Sciences
Faculty of Agriculture
Faculty of Allied Health Sciences
Faculty of Electrical and Computer…
Faculty of Forest Resources Technology
KNUST Dental School
School of Public Health
School of Veterinary Medicine
2
1
0
0
2
0
2
0
0
0
0
0
2
0
0
0
0
0
0
5
3
3
3
2
2
1
1
1
1
1
1
0
0
0
0
0
0
0
0
0
5
0
2
5
0
1
0
1
2
2
1
1
1
0
2
0
0
4
1
2
2
2
3
0
0
3
0
3
0
1
0
0
0
0
0
0
1
1
0
0
0
0
1
0
0
0
1
2
1
2
0
0
0
0
0
Extent of engagement with the private sector
Fac
ult
ies Every month
3 or 4 times a year
Annually
Rarely
Never
Stellenbosch University https://scholar.sun.ac.za
257
enhance their engagements with stakeholders. The Faculty of Physical and Computational
Sciences, the Faculty of Biosciences and the of the Faculty of Art engaged the most with the private
sector three or four times a year. Here again, the dominant colleges include the College of Science,
whose set up and research activities favour engagement with the private sector.
The implication for policy development is that faculties or colleges should operate along the lines
of their strengths while those not doing well, are either merged with the stronger ones or resourced
to boost their performance.
The next sub-section examines the perceptions of researchers as far as benefits of engagement with
the private sector are concerned.
8.4.2 Benefits of engagement with the private sector
Along the lines of the literature, this sub-section examines the perceived benefits and experiences
of researchers with engaging the private sector. Table 8.7 below provides feedback from the survey
on how beneficial researchers perceive the potential benefits of engaging the private sector to be
to their own research engagement activities. This is illustrated in Figure 8.12.
Stellenbosch University https://scholar.sun.ac.za
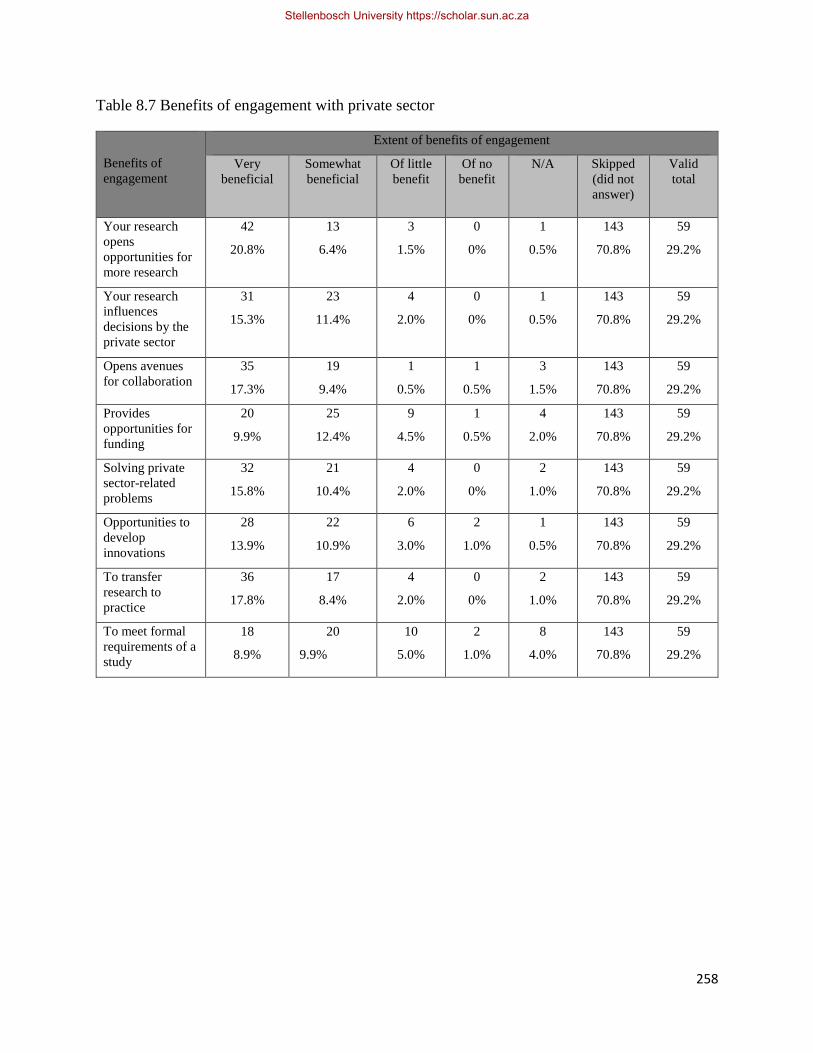
258
Table 8.7 Benefits of engagement with private sector
Benefits of
engagement
Extent of benefits of engagement
Very
beneficial
Somewhat
beneficial
Of little
benefit
Of no
benefit
N/A
Skipped
(did not
answer)
Valid
total
Your research
opens
opportunities for
more research
42
20.8%
13
6.4%
3
1.5%
0
0%
1
0.5%
143
70.8%
59
29.2%
Your research
influences
decisions by the
private sector
31
15.3%
23
11.4%
4
2.0%
0
0%
1
0.5%
143
70.8%
59
29.2%
Opens avenues
for collaboration
35
17.3%
19
9.4%
1
0.5%
1
0.5%
3
1.5%
143
70.8%
59
29.2%
Provides
opportunities for
funding
20
9.9%
25
12.4%
9
4.5%
1
0.5%
4
2.0%
143
70.8%
59
29.2%
Solving private
sector-related
problems
32
15.8%
21
10.4%
4
2.0%
0
0%
2
1.0%
143
70.8%
59
29.2%
Opportunities to
develop
innovations
28
13.9%
22
10.9%
6
3.0%
2
1.0%
1
0.5%
143
70.8%
59
29.2%
To transfer
research to
practice
36
17.8%
17
8.4%
4
2.0%
0
0%
2
1.0%
143
70.8%
59
29.2%
To meet formal
requirements of a
study
18
8.9%
20
9.9%
10
5.0%
2
1.0%
8
4.0%
143
70.8%
59
29.2%
Stellenbosch University https://scholar.sun.ac.za
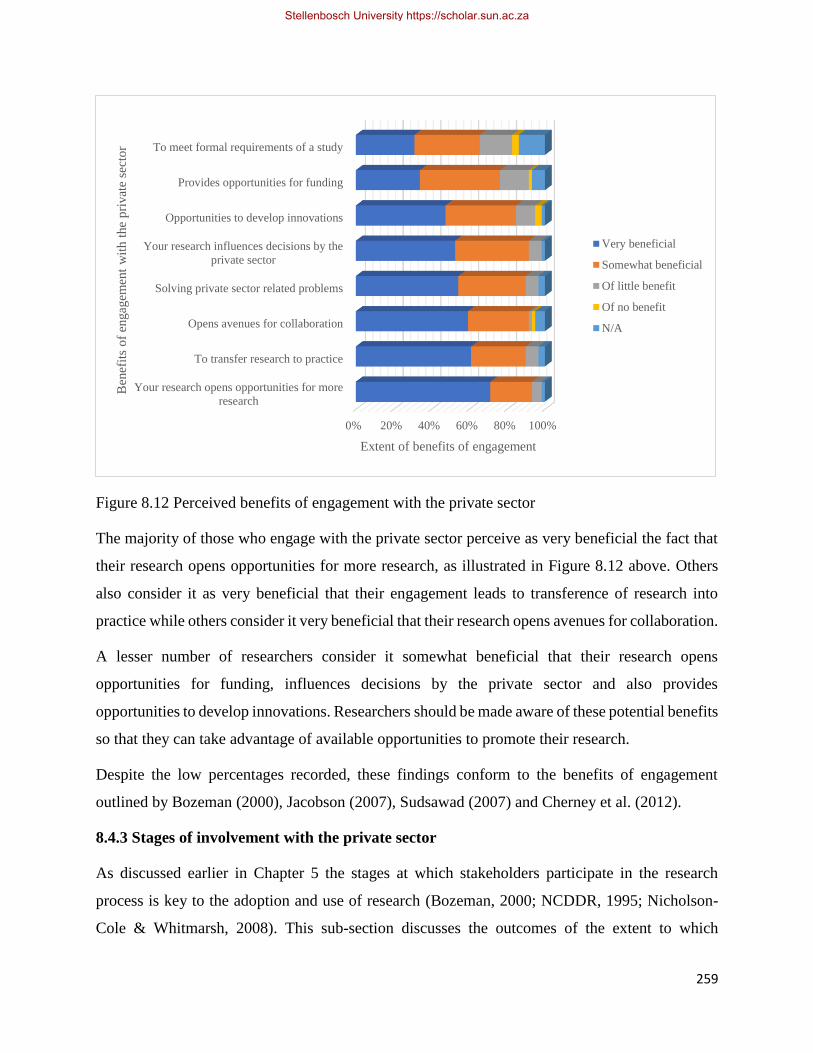
259
Figure 8.12 Perceived benefits of engagement with the private sector
The majority of those who engage with the private sector perceive as very beneficial the fact that
their research opens opportunities for more research, as illustrated in Figure 8.12 above. Others
also consider it as very beneficial that their engagement leads to transference of research into
practice while others consider it very beneficial that their research opens avenues for collaboration.
A lesser number of researchers consider it somewhat beneficial that their research opens
opportunities for funding, influences decisions by the private sector and also provides
opportunities to develop innovations. Researchers should be made aware of these potential benefits
so that they can take advantage of available opportunities to promote their research.
Despite the low percentages recorded, these findings conform to the benefits of engagement
outlined by Bozeman (2000), Jacobson (2007), Sudsawad (2007) and Cherney et al. (2012).
8.4.3 Stages of involvement with the private sector
As discussed earlier in Chapter 5 the stages at which stakeholders participate in the research
process is key to the adoption and use of research (Bozeman, 2000; NCDDR, 1995; Nicholson-
Cole & Whitmarsh, 2008). This sub-section discusses the outcomes of the extent to which
0% 20% 40% 60% 80% 100%
Your research opens opportunities for more
research
To transfer research to practice
Opens avenues for collaboration
Solving private sector related problems
Your research influences decisions by the
private sector
Opportunities to develop innovations
Provides opportunities for funding
To meet formal requirements of a study
Extent of benefits of engagement
Ben
efit
s o
f en
gag
emen
t w
ith t
he
pri
vat
e se
cto
r
Very beneficial
Somewhat beneficial
Of little benefit
Of no benefit
N/A
Stellenbosch University https://scholar.sun.ac.za
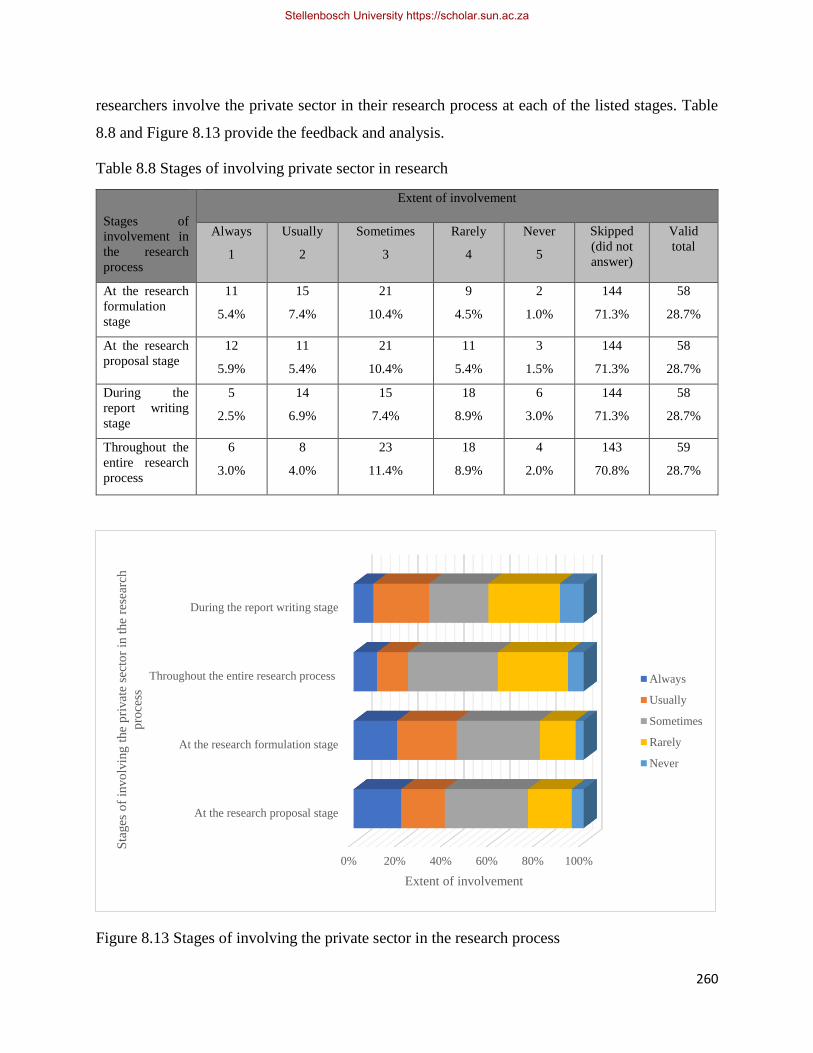
260
researchers involve the private sector in their research process at each of the listed stages. Table
8.8 and Figure 8.13 provide the feedback and analysis.
Table 8.8 Stages of involving private sector in research
Stages of
involvement in
the research
process
Extent of involvement
Always
1
Usually
2
Sometimes
3
Rarely
4
Never
5
Skipped
(did not
answer)
Valid
total
At the research
formulation
stage
11
5.4%
15
7.4%
21
10.4%
9
4.5%
2
1.0%
144
71.3%
58
28.7%
At the research
proposal stage
12
5.9%
11
5.4%
21
10.4%
11
5.4%
3
1.5%
144
71.3%
58
28.7%
During the
report writing
stage
5
2.5%
14
6.9%
15
7.4%
18
8.9%
6
3.0%
144
71.3%
58
28.7%
Throughout the
entire research
process
6
3.0%
8
4.0%
23
11.4%
18
8.9%
4
2.0%
143
70.8%
59
28.7%
Figure 8.13 Stages of involving the private sector in the research process
0% 20% 40% 60% 80% 100%
At the research proposal stage
At the research formulation stage
Throughout the entire research process
During the report writing stage
Extent of involvement
Sta
ges
of
invo
lvin
g t
he
pri
vat
e se
cto
r in
the
rese
arch
pro
cess
Always
Usually
Sometimes
Rarely
Never
Stellenbosch University https://scholar.sun.ac.za
261
Figure 8.13 above indicates that researchers involve the private sector more at the research
proposal stage, research formulation stage, throughout the entire research process, in that order.
Figure 8.13also, indicates that researchers usually involve the private sector first and foremost at
the research formulation stage, ahead of the report writing stage and before the research proposal
stage.
It is worth noting that researchers at least see the need to involve their stakeholders, and in this
case, the private sector, in the research process at one point or the other. As confirmed by some
respondents during the interviews, involving the eventual users of research findings in the research
process makes it easier for adoption and it builds confidence in the research findings. Involving
the eventual users of research findings in the research process is therefore one of the pathways to
research uptake and utilisation. There are however, some barriers to the uptake and utilisation
process and this is discussed in the next sub-section.
8.4.4 Reasons why the private sector does not use research findings
As discussed in previous chapters a number of barriers, both individual and institutional, have been
associated with the dissemination and uptake of research. In engaging with the private sector
researchers gave indications of the most common reasons why the private sector does not use
research which could be beneficial to them. This sub-section examines these barriers and their
implications for research use. Table 8.9 and Figure 8.14 below give the responses (1–3, ranking
from the highest to the lowest)
Stellenbosch University https://scholar.sun.ac.za
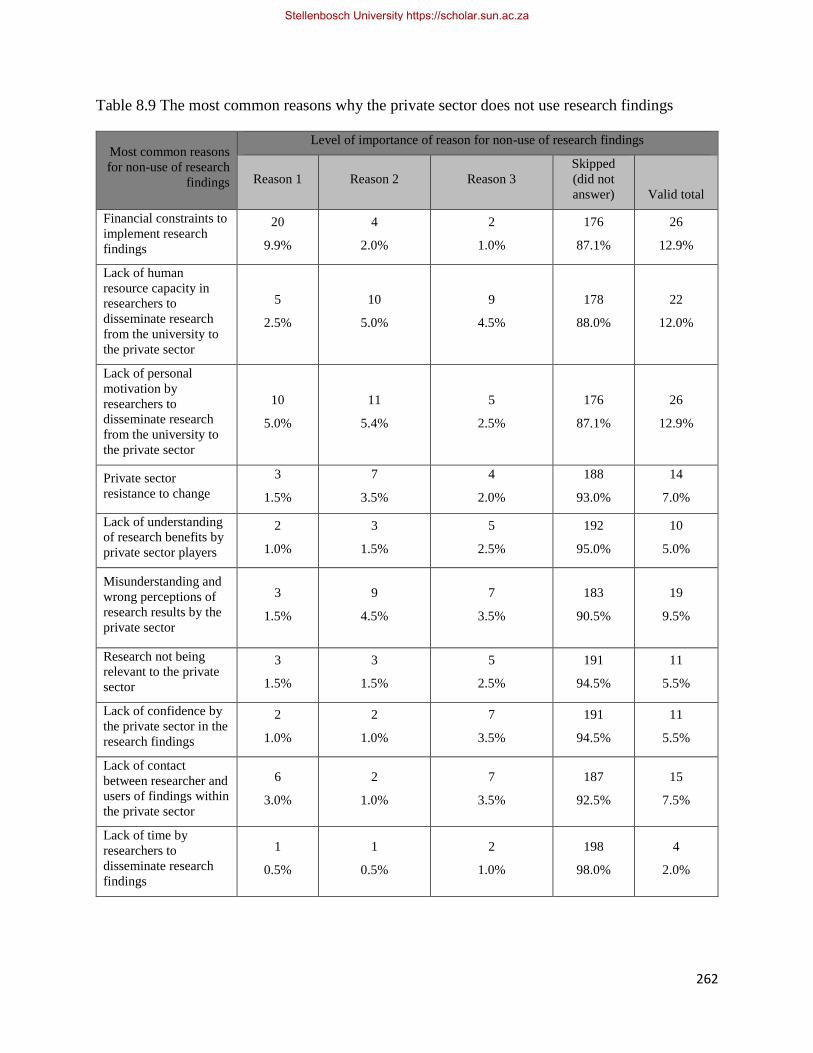
262
Table 8.9 The most common reasons why the private sector does not use research findings
Most common reasons
for non-use of research
findings
Level of importance of reason for non-use of research findings
Reason 1 Reason 2 Reason 3
Skipped
(did not
answer) Valid total
Financial constraints to
implement research
findings
20
9.9%
4
2.0%
2
1.0%
176
87.1%
26
12.9%
Lack of human
resource capacity in
researchers to
disseminate research
from the university to
the private sector
5
2.5%
10
5.0%
9
4.5%
178
88.0%
22
12.0%
Lack of personal
motivation by
researchers to
disseminate research
from the university to
the private sector
10
5.0%
11
5.4%
5
2.5%
176
87.1%
26
12.9%
Private sector
resistance to change
3
1.5%
7
3.5%
4
2.0%
188
93.0%
14
7.0%
Lack of understanding
of research benefits by
private sector players
2
1.0%
3
1.5%
5
2.5%
192
95.0%
10
5.0%
Misunderstanding and
wrong perceptions of
research results by the
private sector
3
1.5%
9
4.5%
7
3.5%
183
90.5%
19
9.5%
Research not being
relevant to the private
sector
3
1.5%
3
1.5%
5
2.5%
191
94.5%
11
5.5%
Lack of confidence by
the private sector in the
research findings
2
1.0%
2
1.0%
7
3.5%
191
94.5%
11
5.5%
Lack of contact
between researcher and
users of findings within
the private sector
6
3.0%
2
1.0%
7
3.5%
187
92.5%
15
7.5%
Lack of time by
researchers to
disseminate research
findings
1
0.5%
1
0.5%
2
1.0%
198
98.0%
4
2.0%
Stellenbosch University https://scholar.sun.ac.za
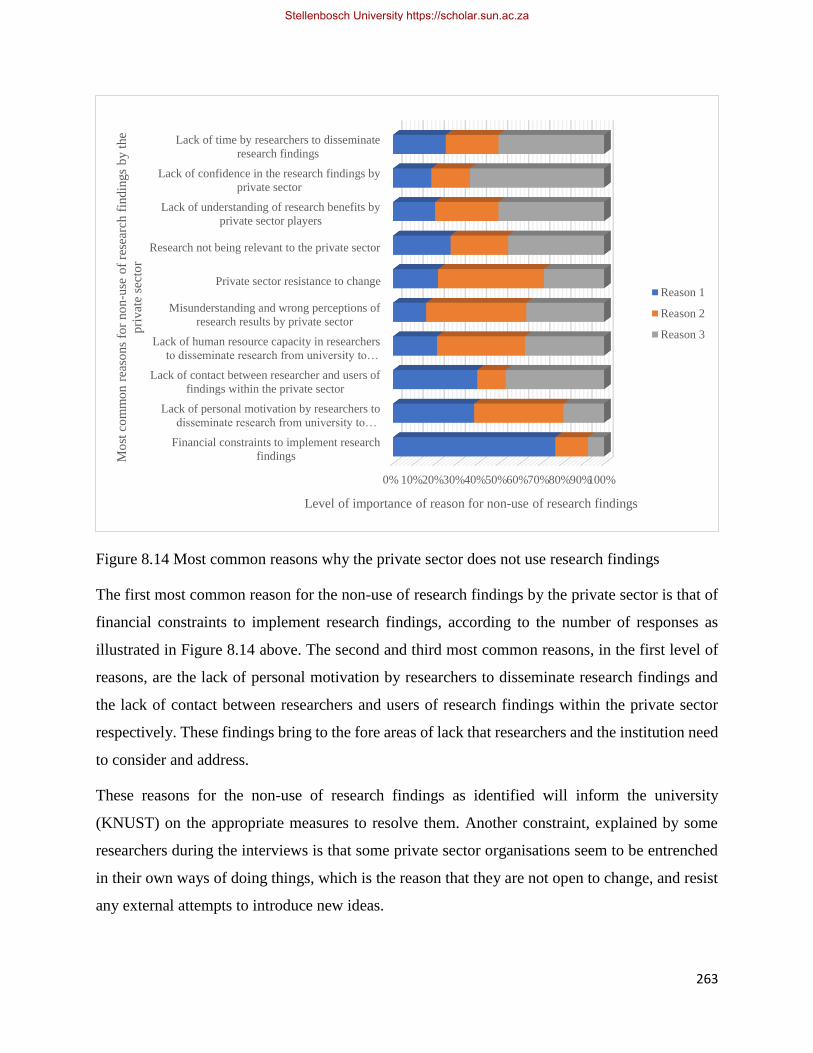
263
Figure 8.14 Most common reasons why the private sector does not use research findings
The first most common reason for the non-use of research findings by the private sector is that of
financial constraints to implement research findings, according to the number of responses as
illustrated in Figure 8.14 above. The second and third most common reasons, in the first level of
reasons, are the lack of personal motivation by researchers to disseminate research findings and
the lack of contact between researchers and users of research findings within the private sector
respectively. These findings bring to the fore areas of lack that researchers and the institution need
to consider and address.
These reasons for the non-use of research findings as identified will inform the university
(KNUST) on the appropriate measures to resolve them. Another constraint, explained by some
researchers during the interviews is that some private sector organisations seem to be entrenched
in their own ways of doing things, which is the reason that they are not open to change, and resist
any external attempts to introduce new ideas.
0% 10%20%30%40%50%60%70%80%90%100%
Financial constraints to implement research
findings
Lack of personal motivation by researchers to
disseminate research from university to…
Lack of contact between researcher and users of
findings within the private sector
Lack of human resource capacity in researchers
to disseminate research from university to…
Misunderstanding and wrong perceptions of
research results by private sector
Private sector resistance to change
Research not being relevant to the private sector
Lack of understanding of research benefits by
private sector players
Lack of confidence in the research findings by
private sector
Lack of time by researchers to disseminate
research findings
Level of importance of reason for non-use of research findings
Mo
st c
om
mo
n r
easo
ns
for
no
n-u
se o
f re
sear
ch f
ind
ings
by t
he
pri
vat
e se
cto
r
Reason 1
Reason 2
Reason 3
Stellenbosch University https://scholar.sun.ac.za

264
In order to build confidence in research findings, it was suggested that researchers look at the
extent of involvement of the private sector in the research process. As suggested by some
respondents, stakeholder involvement, most especially at the research formulation stage, gives a
higher probability of acceptance and use of the research findings. Some ‘other’ reasons given by
respondents for which the private sector does not use research findings are:
• research not in language private sector understands (Respondent R17);
• private sector not seeing researchers as hands-on consultants ((Respondent R17) and
• culture of receiving free research findings for implementation (Respondent R17).
These are issues that can be addressed by researchers in consultation with all other stakeholders.
8.5 Engagements with governments and parastatals
This section discusses the mechanisms of engagement with governments and parastatals, including
MDAs. The sub-sections that follow discuss how researchers typically engage with government,
faculties and academic positions that engage the most, the benefits of engagement, stages at which
researchers involve government in the research process and the perception of researchers of the
most common potential barriers to the use of research findings by government and parastatals. As
expounded in the literature and discussed in Chapter 5, the options for the four sub-sections are
adapted from the same authors with an expansion in the number of reasons why stakeholders do
not use research. The additional reasons included are inadequate skills and experience of
policymakers in research literacy, a lack of formal training in research management and a lack of
interactions between decision makers and researchers (Humphries, 2014; Oliver et al., 2014;
Sedlacko et al., 2013).
8.5.1 Typical engagement with governments and parastatals
This sub-section discusses the engagement mechanisms adopted by researchers in their
engagement with government and parastatals and how often it happens. Also, this author looks at
extent of engagement by academic positions and faculties. Table 8.10 below gives the respective
responses from the survey.
Stellenbosch University https://scholar.sun.ac.za
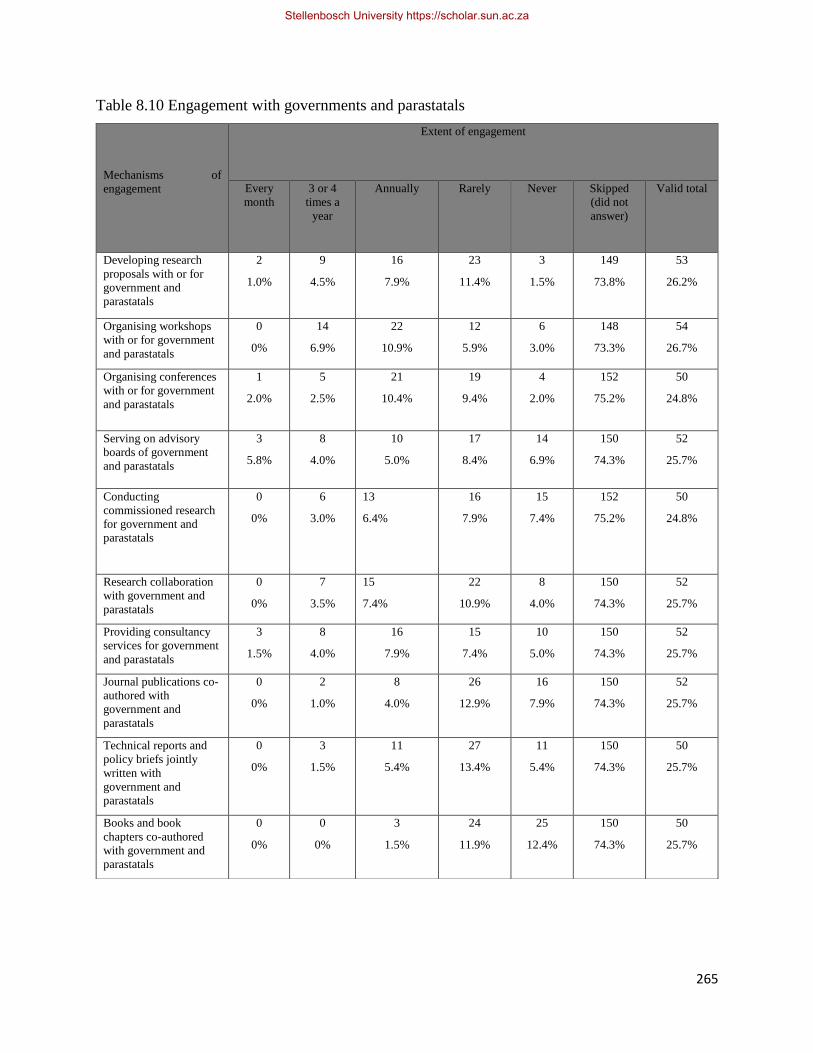
265
Table 8.10 Engagement with governments and parastatals
Mechanisms of
engagement
Extent of engagement
Every
month
3 or 4
times a
year
Annually
Rarely
Never
Skipped
(did not
answer)
Valid total
Developing research
proposals with or for
government and
parastatals
2
1.0%
9
4.5%
16
7.9%
23
11.4%
3
1.5%
149
73.8%
53
26.2%
Organising workshops
with or for government
and parastatals
0
0%
14
6.9%
22
10.9%
12
5.9%
6
3.0%
148
73.3%
54
26.7%
Organising conferences
with or for government
and parastatals
1
2.0%
5
2.5%
21
10.4%
19
9.4%
4
2.0%
152
75.2%
50
24.8%
Serving on advisory
boards of government
and parastatals
3
5.8%
8
4.0%
10
5.0%
17
8.4%
14
6.9%
150
74.3%
52
25.7%
Conducting
commissioned research
for government and
parastatals
0
0%
6
3.0%
13
6.4%
16
7.9%
15
7.4%
152
75.2%
50
24.8%
Research collaboration
with government and
parastatals
0
0%
7
3.5%
15
7.4%
22
10.9%
8
4.0%
150
74.3%
52
25.7%
Providing consultancy
services for government
and parastatals
3
1.5%
8
4.0%
16
7.9%
15
7.4%
10
5.0%
150
74.3%
52
25.7%
Journal publications co-
authored with
government and
parastatals
0
0%
2
1.0%
8
4.0%
26
12.9%
16
7.9%
150
74.3%
52
25.7%
Technical reports and
policy briefs jointly
written with
government and
parastatals
0
0%
3
1.5%
11
5.4%
27
13.4%
11
5.4%
150
74.3%
50
25.7%
Books and book
chapters co-authored
with government and
parastatals
0
0%
0
0%
3
1.5%
24
11.9%
25
12.4%
150
74.3%
50
25.7%
Stellenbosch University https://scholar.sun.ac.za
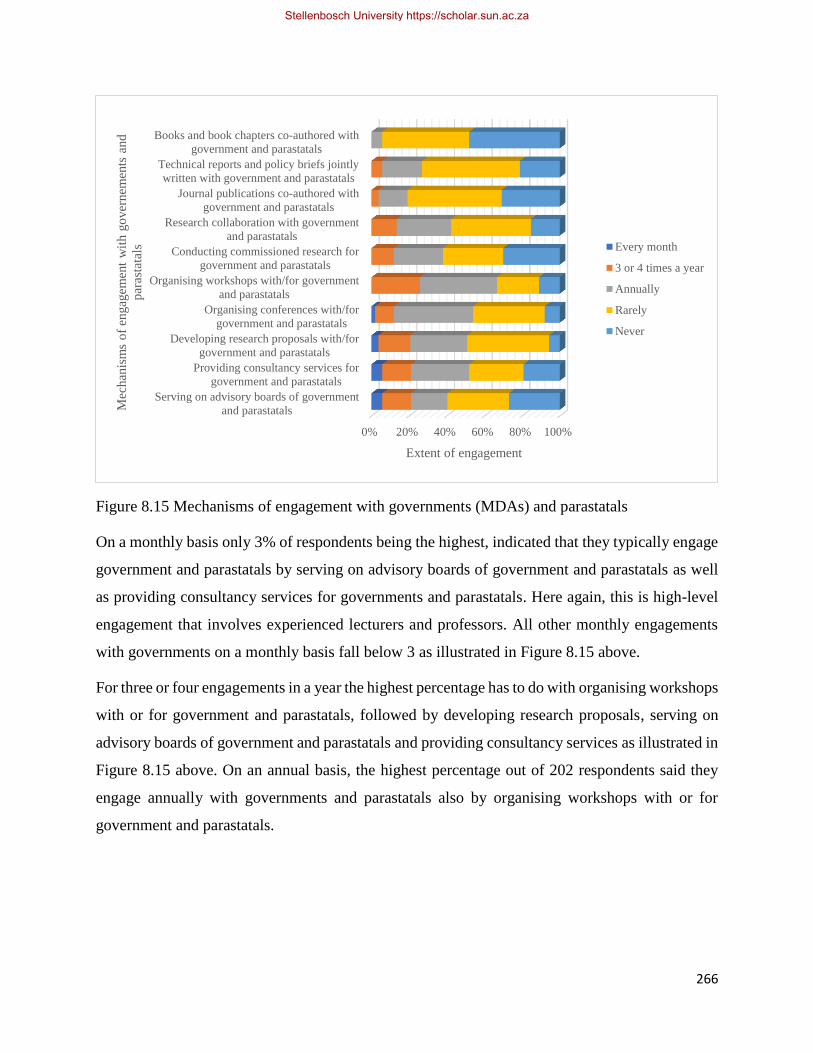
266
Figure 8.15 Mechanisms of engagement with governments (MDAs) and parastatals
On a monthly basis only 3% of respondents being the highest, indicated that they typically engage
government and parastatals by serving on advisory boards of government and parastatals as well
as providing consultancy services for governments and parastatals. Here again, this is high-level
engagement that involves experienced lecturers and professors. All other monthly engagements
with governments on a monthly basis fall below 3 as illustrated in Figure 8.15 above.
For three or four engagements in a year the highest percentage has to do with organising workshops
with or for government and parastatals, followed by developing research proposals, serving on
advisory boards of government and parastatals and providing consultancy services as illustrated in
Figure 8.15 above. On an annual basis, the highest percentage out of 202 respondents said they
engage annually with governments and parastatals also by organising workshops with or for
government and parastatals.
0% 20% 40% 60% 80% 100%
Serving on advisory boards of government
and parastatals
Providing consultancy services for
government and parastatals
Developing research proposals with/for
government and parastatals
Organising conferences with/for
government and parastatals
Organising workshops with/for government
and parastatals
Conducting commissioned research for
government and parastatals
Research collaboration with government
and parastatals
Journal publications co-authored with
government and parastatals
Technical reports and policy briefs jointly
written with government and parastatals
Books and book chapters co-authored with
government and parastatals
Extent of engagement
Mec
han
ism
s o
f en
gag
emen
t w
ith g
over
nem
ents
and
par
asta
tals Every month
3 or 4 times a year
Annually
Rarely
Never
Stellenbosch University https://scholar.sun.ac.za
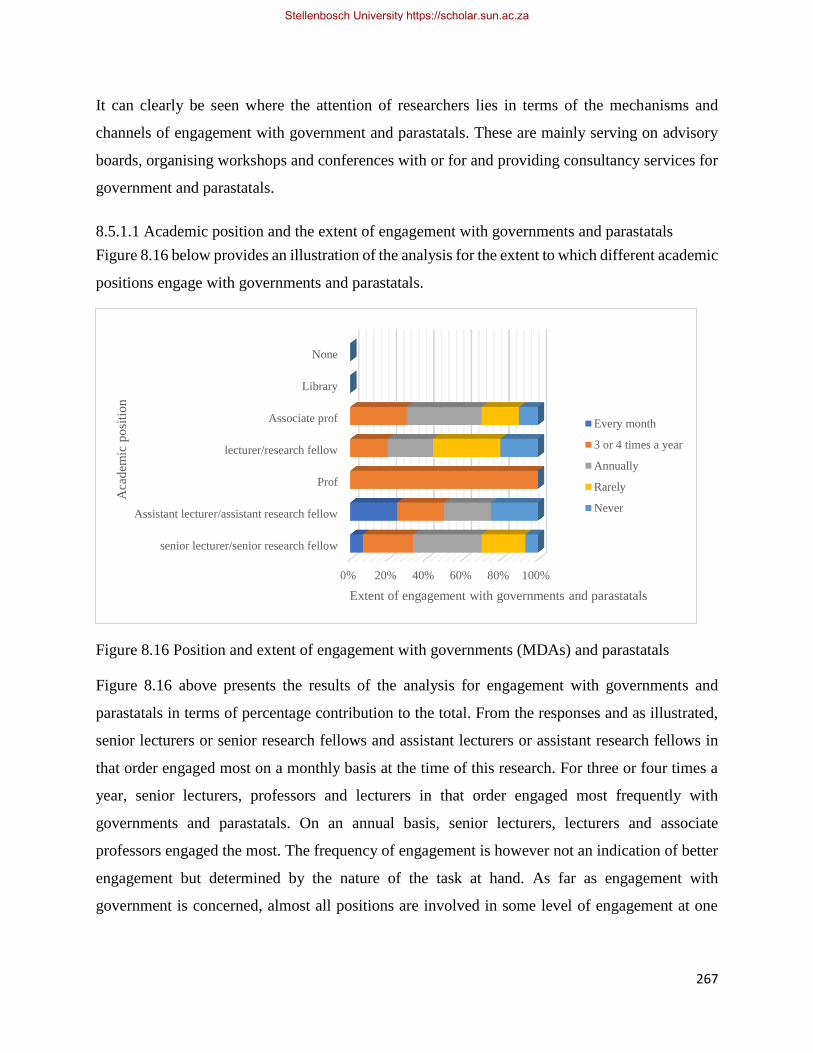
267
It can clearly be seen where the attention of researchers lies in terms of the mechanisms and
channels of engagement with government and parastatals. These are mainly serving on advisory
boards, organising workshops and conferences with or for and providing consultancy services for
government and parastatals.
8.5.1.1 Academic position and the extent of engagement with governments and parastatals
Figure 8.16 below provides an illustration of the analysis for the extent to which different academic
positions engage with governments and parastatals.
Figure 8.16 Position and extent of engagement with governments (MDAs) and parastatals
Figure 8.16 above presents the results of the analysis for engagement with governments and
parastatals in terms of percentage contribution to the total. From the responses and as illustrated,
senior lecturers or senior research fellows and assistant lecturers or assistant research fellows in
that order engaged most on a monthly basis at the time of this research. For three or four times a
year, senior lecturers, professors and lecturers in that order engaged most frequently with
governments and parastatals. On an annual basis, senior lecturers, lecturers and associate
professors engaged the most. The frequency of engagement is however not an indication of better
engagement but determined by the nature of the task at hand. As far as engagement with
government is concerned, almost all positions are involved in some level of engagement at one
0% 20% 40% 60% 80% 100%
senior lecturer/senior research fellow
Assistant lecturer/assistant research fellow
Prof
lecturer/research fellow
Associate prof
Library
None
Extent of engagement with governments and parastatals
Aca
dem
ic p
osi
tio
n
Every month
3 or 4 times a year
Annually
Rarely
Never
Stellenbosch University https://scholar.sun.ac.za
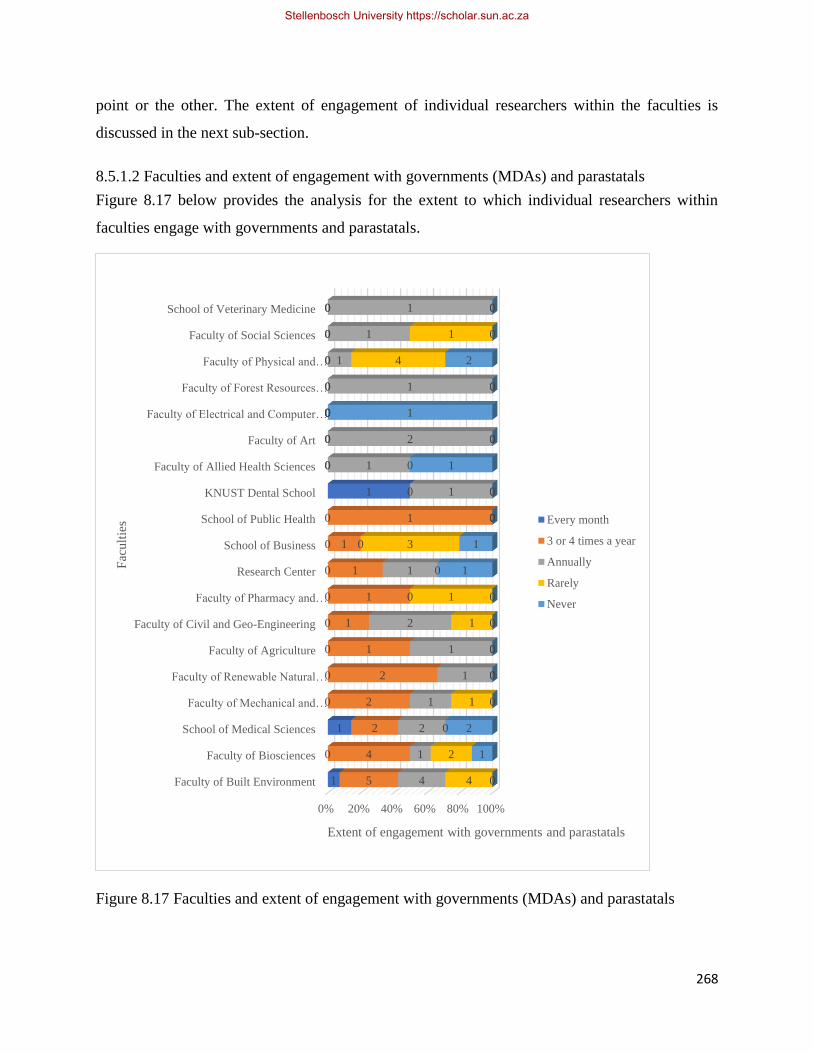
268
point or the other. The extent of engagement of individual researchers within the faculties is
discussed in the next sub-section.
8.5.1.2 Faculties and extent of engagement with governments (MDAs) and parastatals
Figure 8.17 below provides the analysis for the extent to which individual researchers within
faculties engage with governments and parastatals.
Figure 8.17 Faculties and extent of engagement with governments (MDAs) and parastatals
0% 20% 40% 60% 80% 100%
Faculty of Built Environment
Faculty of Biosciences
School of Medical Sciences
Faculty of Mechanical and…
Faculty of Renewable Natural…
Faculty of Agriculture
Faculty of Civil and Geo-Engineering
Faculty of Pharmacy and…
Research Center
School of Business
School of Public Health
KNUST Dental School
Faculty of Allied Health Sciences
Faculty of Art
Faculty of Electrical and Computer…
Faculty of Forest Resources…
Faculty of Physical and…
Faculty of Social Sciences
School of Veterinary Medicine
1
0
1
0
0
0
0
0
0
0
0
1
0
0
0
0
0
0
0
5
4
2
2
2
1
1
1
1
1
1
0
0
0
0
0
0
0
0
4
1
2
1
1
1
2
0
1
0
0
1
1
2
0
1
1
1
1
4
2
0
1
0
0
1
1
0
3
0
0
0
0
0
0
4
1
0
0
1
2
0
0
0
0
0
1
1
0
0
1
0
1
0
2
0
0
Extent of engagement with governments and parastatals
Fac
ult
ies Every month
3 or 4 times a year
Annually
Rarely
Never
Stellenbosch University https://scholar.sun.ac.za
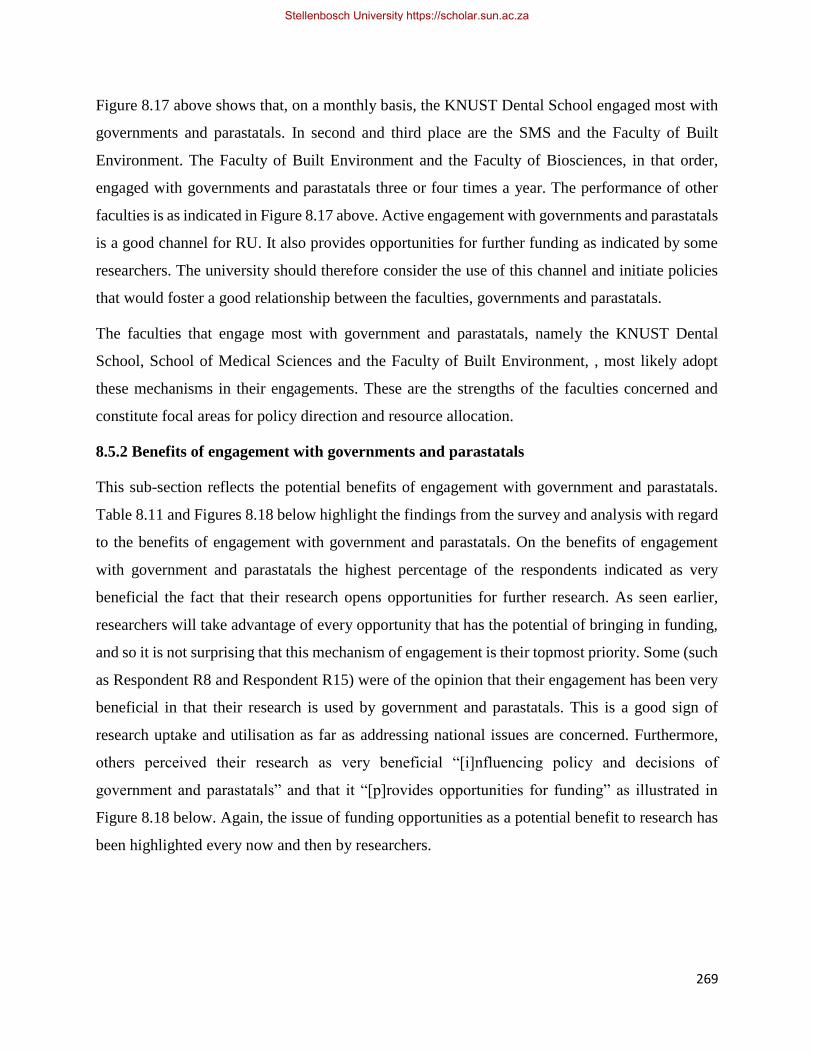
269
Figure 8.17 above shows that, on a monthly basis, the KNUST Dental School engaged most with
governments and parastatals. In second and third place are the SMS and the Faculty of Built
Environment. The Faculty of Built Environment and the Faculty of Biosciences, in that order,
engaged with governments and parastatals three or four times a year. The performance of other
faculties is as indicated in Figure 8.17 above. Active engagement with governments and parastatals
is a good channel for RU. It also provides opportunities for further funding as indicated by some
researchers. The university should therefore consider the use of this channel and initiate policies
that would foster a good relationship between the faculties, governments and parastatals.
The faculties that engage most with government and parastatals, namely the KNUST Dental
School, School of Medical Sciences and the Faculty of Built Environment, , most likely adopt
these mechanisms in their engagements. These are the strengths of the faculties concerned and
constitute focal areas for policy direction and resource allocation.
8.5.2 Benefits of engagement with governments and parastatals
This sub-section reflects the potential benefits of engagement with government and parastatals.
Table 8.11 and Figures 8.18 below highlight the findings from the survey and analysis with regard
to the benefits of engagement with government and parastatals. On the benefits of engagement
with government and parastatals the highest percentage of the respondents indicated as very
beneficial the fact that their research opens opportunities for further research. As seen earlier,
researchers will take advantage of every opportunity that has the potential of bringing in funding,
and so it is not surprising that this mechanism of engagement is their topmost priority. Some (such
as Respondent R8 and Respondent R15) were of the opinion that their engagement has been very
beneficial in that their research is used by government and parastatals. This is a good sign of
research uptake and utilisation as far as addressing national issues are concerned. Furthermore,
others perceived their research as very beneficial “[i]nfluencing policy and decisions of
government and parastatals” and that it “[p]rovides opportunities for funding” as illustrated in
Figure 8.18 below. Again, the issue of funding opportunities as a potential benefit to research has
been highlighted every now and then by researchers.
Stellenbosch University https://scholar.sun.ac.za
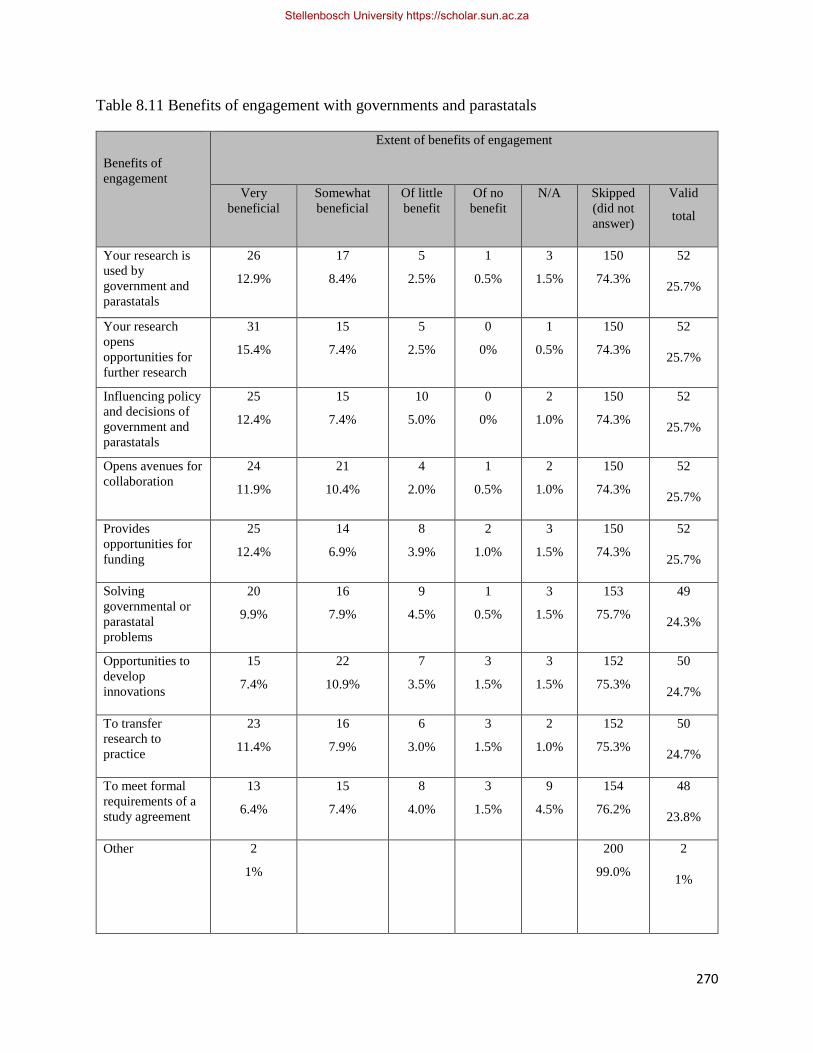
270
Table 8.11 Benefits of engagement with governments and parastatals
Benefits of
engagement
Extent of benefits of engagement
Very
beneficial
Somewhat
beneficial
Of little
benefit
Of no
benefit
N/A Skipped
(did not
answer)
Valid
total
Your research is
used by
government and
parastatals
26
12.9%
17
8.4%
5
2.5%
1
0.5%
3
1.5%
150
74.3%
52
25.7%
Your research
opens
opportunities for
further research
31
15.4%
15
7.4%
5
2.5%
0
0%
1
0.5%
150
74.3%
52
25.7%
Influencing policy
and decisions of
government and
parastatals
25
12.4%
15
7.4%
10
5.0%
0
0%
2
1.0%
150
74.3%
52
25.7%
Opens avenues for
collaboration
24
11.9%
21
10.4%
4
2.0%
1
0.5%
2
1.0%
150
74.3%
52
25.7%
Provides
opportunities for
funding
25
12.4%
14
6.9%
8
3.9%
2
1.0%
3
1.5%
150
74.3%
52
25.7%
Solving
governmental or
parastatal
problems
20
9.9%
16
7.9%
9
4.5%
1
0.5%
3
1.5%
153
75.7%
49
24.3%
Opportunities to
develop
innovations
15
7.4%
22
10.9%
7
3.5%
3
1.5%
3
1.5%
152
75.3%
50
24.7%
To transfer
research to
practice
23
11.4%
16
7.9%
6
3.0%
3
1.5%
2
1.0%
152
75.3%
50
24.7%
To meet formal
requirements of a
study agreement
13
6.4%
15
7.4%
8
4.0%
3
1.5%
9
4.5%
154
76.2%
48
23.8%
Other 2
1%
200
99.0%
2
1%
Stellenbosch University https://scholar.sun.ac.za

271
Figure 8.18 Perceived benefits of engagement with governments (MDAs) and parastatals
Some researchers consider it somewhat beneficial that their research provides opportunities to
develop innovations, opens avenues for collaboration, etc. as shown in Figure 8.18 above. These
are also important channels to explore to promote research. The ultimate goal of this study was to
propose a framework that will lead to the institutionalisation of research uptake. For this reason,
clear-cut pathways to research uptake are outlined as inferences from the survey and interviews to
promote the use of research findings.
8.5.3 Stages of involvement of governments and parastatals
This sub-section discusses the stages at which researchers involve governments and parastatals in
their research process. As discussed in Chapter 5, various authors have outlined stages where
researchers could involve their stakeholders for the needed buy-in and subsequent use of the
research. These stages include: the research proposal or development stage, data collection and
analysis stage, during the research process, during the research report drafting stage, during the
final report and dissemination stage, and at all stages of the research process (Bozeman, 2000;
NCDDR, 1995; Nicholson-Cole & Whitmarsh, 2008). Table 8.12 and Figure 8.19 below provide
0% 20% 40% 60% 80% 100%
Your research opens opportunities for…
Your research is used by government…
Influencing policy and decisions of…
Provides opportunities for funding
Opens avenues for collaboration
To transfer research to practice
Solving governmental or parastatal…
Opportunities to develop innovations
To meet formal requirements of a study…
Other
Extent of benefits of engagement
Ben
efit
s o
f en
gag
emen
t w
ith g
over
nm
ents
and
par
asta
tals Very beneficial
Somewhat beneficial
Of little benefit
Of no benefit
N/A
Stellenbosch University https://scholar.sun.ac.za
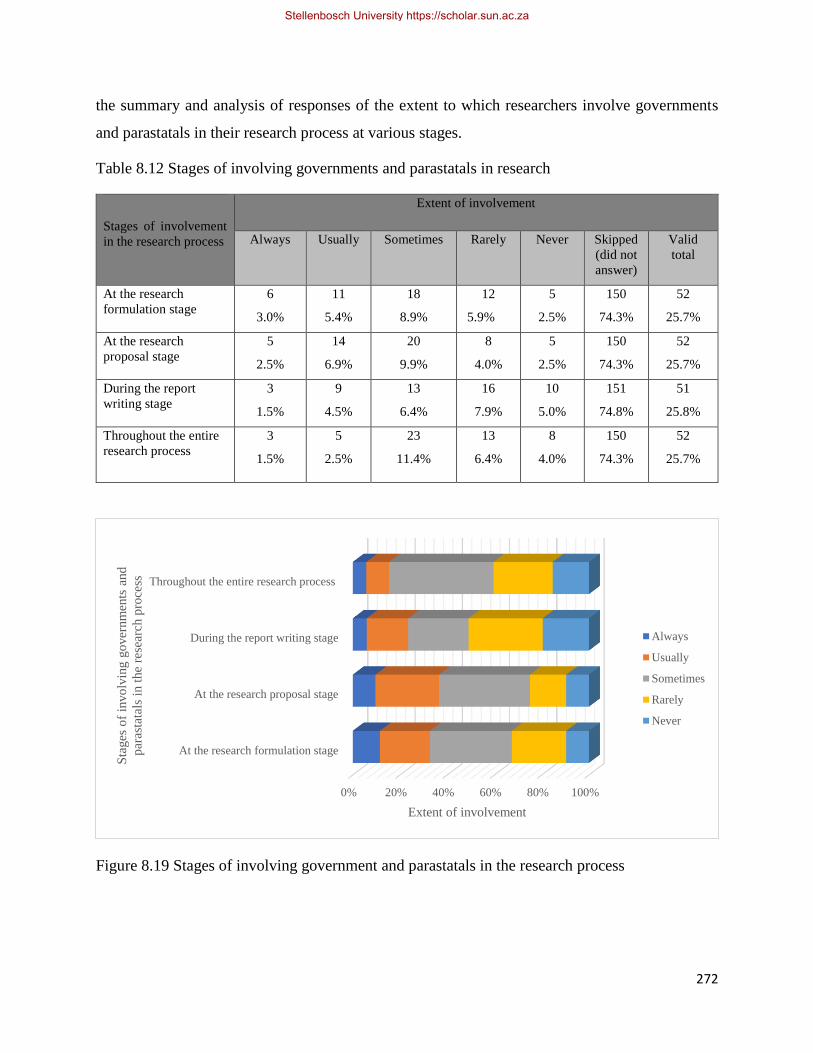
272
the summary and analysis of responses of the extent to which researchers involve governments
and parastatals in their research process at various stages.
Table 8.12 Stages of involving governments and parastatals in research
Stages of involvement
in the research process
Extent of involvement
Always
Usually
Sometimes
Rarely
Never
Skipped
(did not
answer)
Valid
total
At the research
formulation stage
6
3.0%
11
5.4%
18
8.9%
12
5.9%
5
2.5%
150
74.3%
52
25.7%
At the research
proposal stage
5
2.5%
14
6.9%
20
9.9%
8
4.0%
5
2.5%
150
74.3%
52
25.7%
During the report
writing stage
3
1.5%
9
4.5%
13
6.4%
16
7.9%
10
5.0%
151
74.8%
51
25.8%
Throughout the entire
research process
3
1.5%
5
2.5%
23
11.4%
13
6.4%
8
4.0%
150
74.3%
52
25.7%
Figure 8.19 Stages of involving government and parastatals in the research process
0% 20% 40% 60% 80% 100%
At the research formulation stage
At the research proposal stage
During the report writing stage
Throughout the entire research process
Extent of involvement
Sta
ges
of
invo
lvin
g g
over
nm
ents
and
par
asta
tals
in t
he
rese
arch
pro
cess
Always
Usually
Sometimes
Rarely
Never
Stellenbosch University https://scholar.sun.ac.za
273
Figure 8.19 above illustrates the outlook for the stages where researchers mostly involve
governments and parastatals in the research process. In order of merit researchers indicated the top
three as research formulation stage, research proposal stage and report writing stage. As argued by
various authors (Bozeman, 2000; NCDDR, 1995; Nicholson-Cole & Whitmarsh, 2008) these are
useful and important ways of getting research into practice since the stakeholders have been part
of the process at one point or the other. The same three stages are usually adopted by researchers
as illustrated in Figure 8.19 above. The importance of stakeholder involvement cannot be
overemphasised, since it leads to an increased likelihood of adoption and use of research findings.
During the interviews one respondent indicated that he involves his stakeholders only during the
evaluation of the project for feedback. This can be useful for future projects and research activities
and can be regarded as a key component of the research cycle. A number of reasons have been
attributed to non-use of research findings which could be useful to stakeholders. The next sub-
section sought to find out the most common reasons why governments and parastatals do not use
research findings.
8.5.4 Reasons why governments and parastatals do not use research findings
Table 8.13 below gives the outcomes for the most common reasons (ranked from the highest to
the lowest) why governments and parastatals do not use research findings which could be
beneficial to them. These are illustrated in Figure 8.20.
Stellenbosch University https://scholar.sun.ac.za
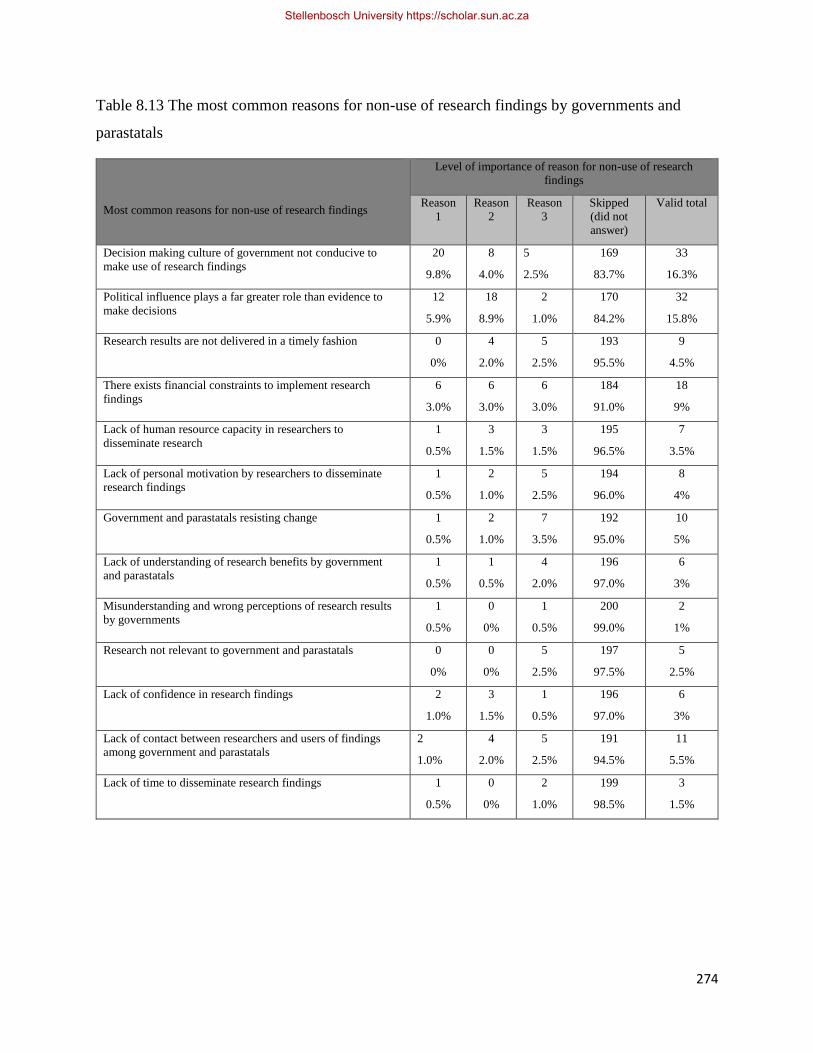
274
Table 8.13 The most common reasons for non-use of research findings by governments and
parastatals
Most common reasons for non-use of research findings
Level of importance of reason for non-use of research
findings
Reason
1
Reason
2
Reason
3
Skipped
(did not
answer)
Valid total
Decision making culture of government not conducive to
make use of research findings
20
9.8%
8
4.0%
5
2.5%
169
83.7%
33
16.3%
Political influence plays a far greater role than evidence to
make decisions
12
5.9%
18
8.9%
2
1.0%
170
84.2%
32
15.8%
Research results are not delivered in a timely fashion 0
0%
4
2.0%
5
2.5%
193
95.5%
9
4.5%
There exists financial constraints to implement research
findings
6
3.0%
6
3.0%
6
3.0%
184
91.0%
18
9%
Lack of human resource capacity in researchers to
disseminate research
1
0.5%
3
1.5%
3
1.5%
195
96.5%
7
3.5%
Lack of personal motivation by researchers to disseminate
research findings
1
0.5%
2
1.0%
5
2.5%
194
96.0%
8
4%
Government and parastatals resisting change 1
0.5%
2
1.0%
7
3.5%
192
95.0%
10
5%
Lack of understanding of research benefits by government
and parastatals
1
0.5%
1
0.5%
4
2.0%
196
97.0%
6
3%
Misunderstanding and wrong perceptions of research results
by governments
1
0.5%
0
0%
1
0.5%
200
99.0%
2
1%
Research not relevant to government and parastatals 0
0%
0
0%
5
2.5%
197
97.5%
5
2.5%
Lack of confidence in research findings 2
1.0%
3
1.5%
1
0.5%
196
97.0%
6
3%
Lack of contact between researchers and users of findings
among government and parastatals
2
1.0%
4
2.0%
5
2.5%
191
94.5%
11
5.5%
Lack of time to disseminate research findings 1
0.5%
0
0%
2
1.0%
199
98.5%
3
1.5%
Stellenbosch University https://scholar.sun.ac.za
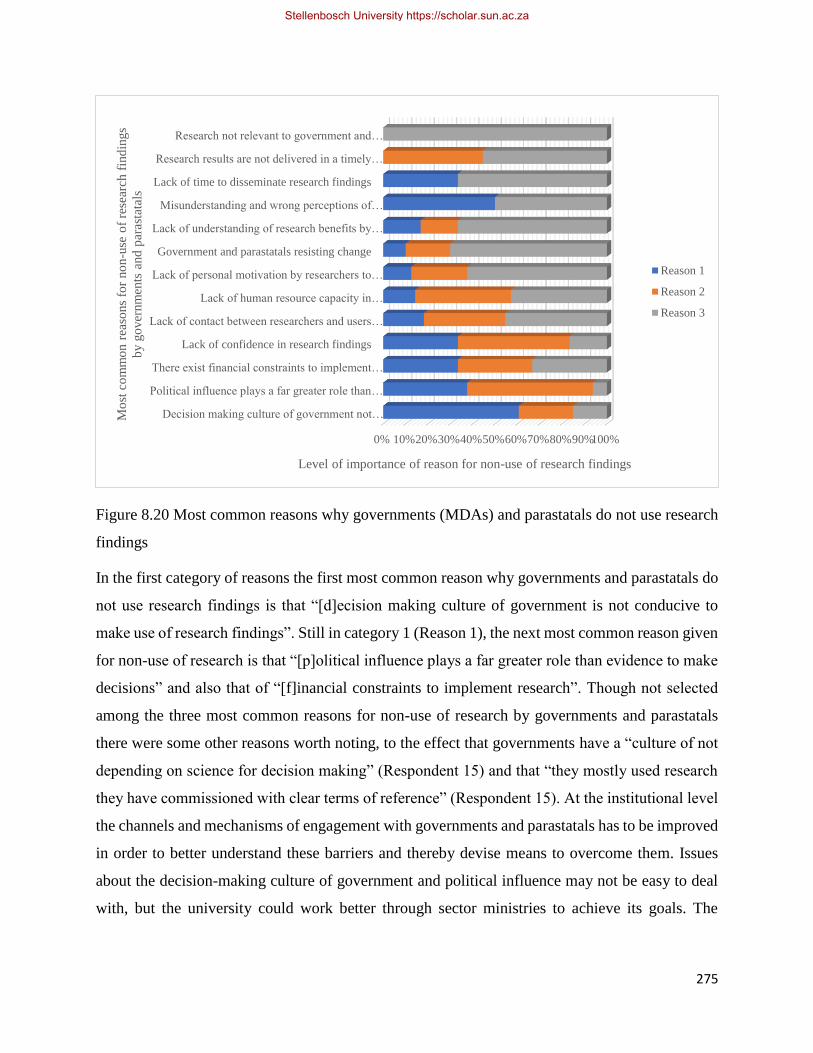
275
Figure 8.20 Most common reasons why governments (MDAs) and parastatals do not use research
findings
In the first category of reasons the first most common reason why governments and parastatals do
not use research findings is that “[d]ecision making culture of government is not conducive to
make use of research findings”. Still in category 1 (Reason 1), the next most common reason given
for non-use of research is that “[p]olitical influence plays a far greater role than evidence to make
decisions” and also that of “[f]inancial constraints to implement research”. Though not selected
among the three most common reasons for non-use of research by governments and parastatals
there were some other reasons worth noting, to the effect that governments have a “culture of not
depending on science for decision making” (Respondent 15) and that “they mostly used research
they have commissioned with clear terms of reference” (Respondent 15). At the institutional level
the channels and mechanisms of engagement with governments and parastatals has to be improved
in order to better understand these barriers and thereby devise means to overcome them. Issues
about the decision-making culture of government and political influence may not be easy to deal
with, but the university could work better through sector ministries to achieve its goals. The
0% 10%20%30%40%50%60%70%80%90%100%
Decision making culture of government not…
Political influence plays a far greater role than…
There exist financial constraints to implement…
Lack of confidence in research findings
Lack of contact between researchers and users…
Lack of human resource capacity in…
Lack of personal motivation by researchers to…
Government and parastatals resisting change
Lack of understanding of research benefits by…
Misunderstanding and wrong perceptions of…
Lack of time to disseminate research findings
Research results are not delivered in a timely…
Research not relevant to government and…
Level of importance of reason for non-use of research findings
Mo
st c
om
mo
n r
easo
ns
for
no
n-u
se o
f re
sear
ch f
ind
ings
by g
over
nm
ents
and
par
asta
tals
Reason 1
Reason 2
Reason 3
Stellenbosch University https://scholar.sun.ac.za
276
framework proposes ways of facilitating research use by all stakeholders, including government
and parastatals, in order to overcome the barriers stated above.
8.6 Engagements with scientists and researchers
This section discusses the responses obtained from researchers with regard to –
• how researchers at KNUST typically engage with scientists and researchers of other
universities and institutes via some specified mechanisms of engagement, the faculties and
academic positions that engage most;
• the benefits of such engagements;
• the stages at which they involve these stakeholders in their research process; and
• the most common reasons why stakeholders do not use research findings that could be
beneficial to them.
The sub-sections that follow examine each of the above in detail.
8.6.1 Typical engagement with scientists and researchers from other universities and
institutes
Following on from the foregoing discussions in this chapter this sub-section discusses how often
researchers typically engage with scientists and researchers from other universities and institutes
via some of the mechanisms and channels outlined in the literature. Table 8.14 and Figure 8.21
below provide the responses and comparisons of frequency of engagements through various
mechanisms.
Stellenbosch University https://scholar.sun.ac.za

277
Table 8.14 Engagements with scientists and researchers from other universities and institutes
Mechanisms of engagement
Extent of engagement
Every
month
3 or 4
times a
year
Annually Rarely Never
Skipped
(did not
answer)
Valid
total
Developing curriculum in
partnership with other scientists
and researchers
3.0% 11.2% 14.4% 14.4% 5.0% 52.0%
48%
Organising workshops with or for
other scientists and researchers 1.0% 11.9% 21.2% 11.4% 4.0% 50.5%
49.5%
Organising conferences with or for
other scientists and researchers 1.0% 9.4% 21.7% 9.9% 5.0% 53.0%
47%
Attending conferences with other
scientists and researchers 1.0% 14.9% 27.2% 5.9% 1.0% 50.0%
50%
Serving on advisory boards with
other scientists and researchers 3.0% 8.9% 10.9% 13.4% 9.30% 54.5%
45.5%
Research collaboration with other
scientists and researchers 5.9% 18.8% 20.3% 4.0% 0.50% 50.5%
49.5%
Providing consultancy services
with or for other scientists and
researchers
1.5% 8.9% 14.9% 15.7% 4.5% 54.5%
45.5%
Conducting commissioned
research with or for other scientists
and researchers
0% 8.9% 10.9% 17.8% 10.9% 51.5%
48.5%
Sharing facilities with other
scientists and researchers e.g.
laboratories and equipment and
research data
3.0% 14.3% 13.4% 10.4% 7.4% 51.5%
48.5%
Joint journal publications with
other scientists and researchers 2.0% 17.3% 17.8% 6.9% 3.5% 52.5%
47.5%
Newsletters 1.0% 4.5% 8.4% 12.4% 15.3% 58.4% 41.6%
Technical reports and policy briefs
jointly written with other scientists
and researchers
1.0% 7.4% 10.9% 15.3% 13.4% 52.0%
48.0%
Books and book chapters co-
authored with other scientists and
other researchers
0% 2.00% 8.4% 19.8% 17.8% 52.0%
48.0%
Public lectures 1.0% 4.5% 16.2% 13.4% 12.4% 52.5% 47.5%
Social media interaction with
other scientists and researchers 7.4% 9.4% 7.4% 9.9% 12.4% 53.5%
46.5%
Stellenbosch University https://scholar.sun.ac.za
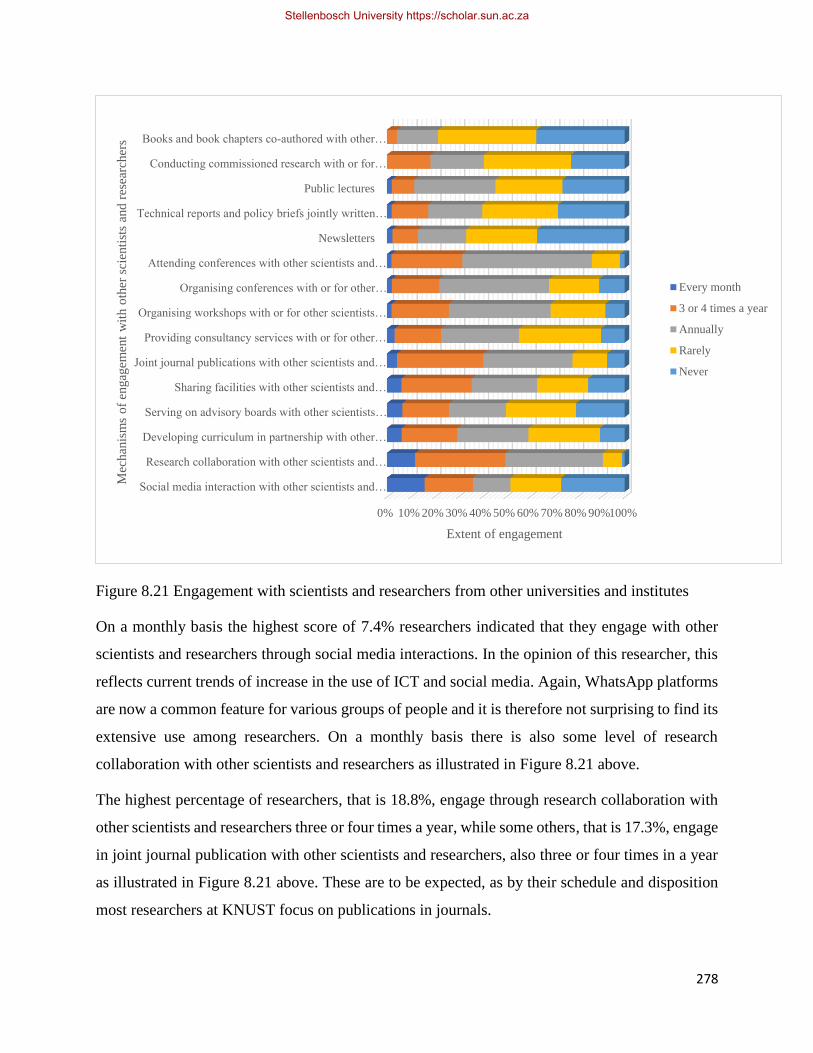
278
Figure 8.21 Engagement with scientists and researchers from other universities and institutes
On a monthly basis the highest score of 7.4% researchers indicated that they engage with other
scientists and researchers through social media interactions. In the opinion of this researcher, this
reflects current trends of increase in the use of ICT and social media. Again, WhatsApp platforms
are now a common feature for various groups of people and it is therefore not surprising to find its
extensive use among researchers. On a monthly basis there is also some level of research
collaboration with other scientists and researchers as illustrated in Figure 8.21 above.
The highest percentage of researchers, that is 18.8%, engage through research collaboration with
other scientists and researchers three or four times a year, while some others, that is 17.3%, engage
in joint journal publication with other scientists and researchers, also three or four times in a year
as illustrated in Figure 8.21 above. These are to be expected, as by their schedule and disposition
most researchers at KNUST focus on publications in journals.
0% 10% 20% 30% 40% 50% 60% 70% 80% 90%100%
Social media interaction with other scientists and…
Research collaboration with other scientists and…
Developing curriculum in partnership with other…
Serving on advisory boards with other scientists…
Sharing facilities with other scientists and…
Joint journal publications with other scientists and…
Providing consultancy services with or for other…
Organising workshops with or for other scientists…
Organising conferences with or for other…
Attending conferences with other scientists and…
Newsletters
Technical reports and policy briefs jointly written…
Public lectures
Conducting commissioned research with or for…
Books and book chapters co-authored with other…
Extent of engagement
Mec
han
ism
s o
f en
gag
emen
t w
ith o
ther
sci
enti
sts
and
res
earc
her
s
Every month
3 or 4 times a year
Annually
Rarely
Never
Stellenbosch University https://scholar.sun.ac.za
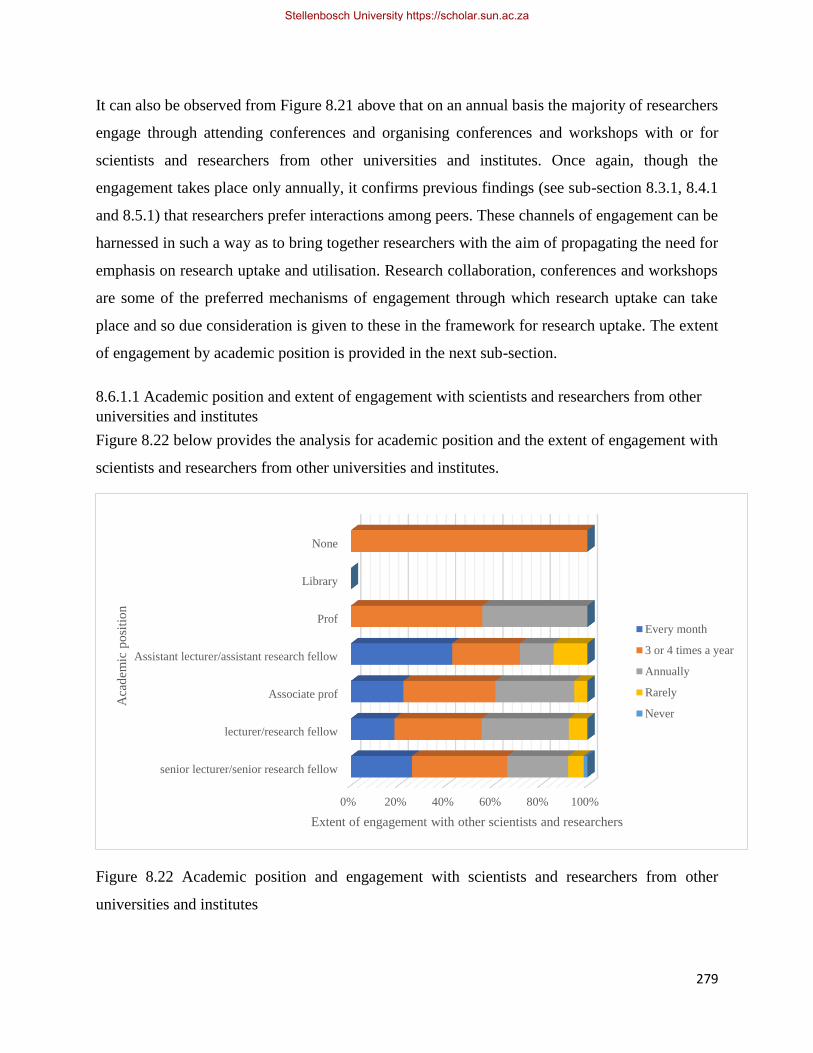
279
It can also be observed from Figure 8.21 above that on an annual basis the majority of researchers
engage through attending conferences and organising conferences and workshops with or for
scientists and researchers from other universities and institutes. Once again, though the
engagement takes place only annually, it confirms previous findings (see sub-section 8.3.1, 8.4.1
and 8.5.1) that researchers prefer interactions among peers. These channels of engagement can be
harnessed in such a way as to bring together researchers with the aim of propagating the need for
emphasis on research uptake and utilisation. Research collaboration, conferences and workshops
are some of the preferred mechanisms of engagement through which research uptake can take
place and so due consideration is given to these in the framework for research uptake. The extent
of engagement by academic position is provided in the next sub-section.
8.6.1.1 Academic position and extent of engagement with scientists and researchers from other
universities and institutes
Figure 8.22 below provides the analysis for academic position and the extent of engagement with
scientists and researchers from other universities and institutes.
Figure 8.22 Academic position and engagement with scientists and researchers from other
universities and institutes
0% 20% 40% 60% 80% 100%
senior lecturer/senior research fellow
lecturer/research fellow
Associate prof
Assistant lecturer/assistant research fellow
Prof
Library
None
Extent of engagement with other scientists and researchers
Aca
dem
ic p
osi
tio
n
Every month
3 or 4 times a year
Annually
Rarely
Never
Stellenbosch University https://scholar.sun.ac.za
280
On a monthly basis, senior lecturers and senior research fellows, lecturers and research fellows
and associate professors in that order engaged most with scientists and researchers from other
universities and HEIs. For three or four times a year, senior lecturers, lecturers and associate
professors engaged with scientists and researchers more than the others. The same order is
observed for annual engagements. Figure 8.22 above illustrates the engagements with scientists
and researchers from other universities and HEIs. Once again, it can be observed that senior
lectures and equivalents lecturers and associate professors engaged stakeholders the most. The
extent of engagement of individual researchers within the faculties is discussed in the next sub-
section.
8.6.1.2 Faculties and extent of engagement with scientists and researchers from other universities
and institutes
Figure 8.23 below provides the analysis for the extent of engagement by individual researchers at
the level of faculties.
Stellenbosch University https://scholar.sun.ac.za
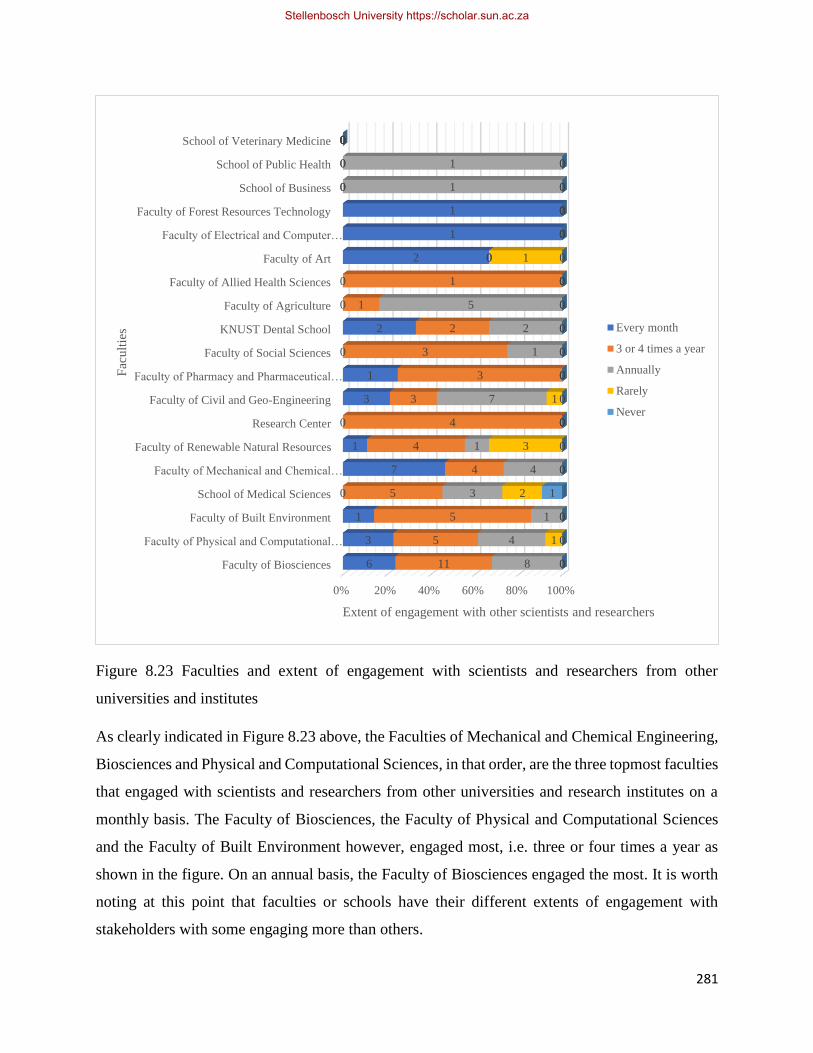
281
Figure 8.23 Faculties and extent of engagement with scientists and researchers from other
universities and institutes
As clearly indicated in Figure 8.23 above, the Faculties of Mechanical and Chemical Engineering,
Biosciences and Physical and Computational Sciences, in that order, are the three topmost faculties
that engaged with scientists and researchers from other universities and research institutes on a
monthly basis. The Faculty of Biosciences, the Faculty of Physical and Computational Sciences
and the Faculty of Built Environment however, engaged most, i.e. three or four times a year as
shown in the figure. On an annual basis, the Faculty of Biosciences engaged the most. It is worth
noting at this point that faculties or schools have their different extents of engagement with
stakeholders with some engaging more than others.
0% 20% 40% 60% 80% 100%
Faculty of Biosciences
Faculty of Physical and Computational…
Faculty of Built Environment
School of Medical Sciences
Faculty of Mechanical and Chemical…
Faculty of Renewable Natural Resources
Research Center
Faculty of Civil and Geo-Engineering
Faculty of Pharmacy and Pharmaceutical…
Faculty of Social Sciences
KNUST Dental School
Faculty of Agriculture
Faculty of Allied Health Sciences
Faculty of Art
Faculty of Electrical and Computer…
Faculty of Forest Resources Technology
School of Business
School of Public Health
School of Veterinary Medicine
6
3
1
0
7
1
0
3
1
0
2
0
0
2
1
1
0
0
0
11
5
5
5
4
4
4
3
3
3
2
1
1
0
0
0
0
0
0
8
4
1
3
4
1
0
7
0
1
2
5
0
0
0
0
1
1
0
0
1
0
2
0
3
0
1
0
0
0
0
0
1
0
0
0
0
0
0
0
0
1
0
0
0
0
0
0
0
0
0
0
0
0
0
0
0
Extent of engagement with other scientists and researchers
Fac
ult
ies Every month
3 or 4 times a year
Annually
Rarely
Never
Stellenbosch University https://scholar.sun.ac.za
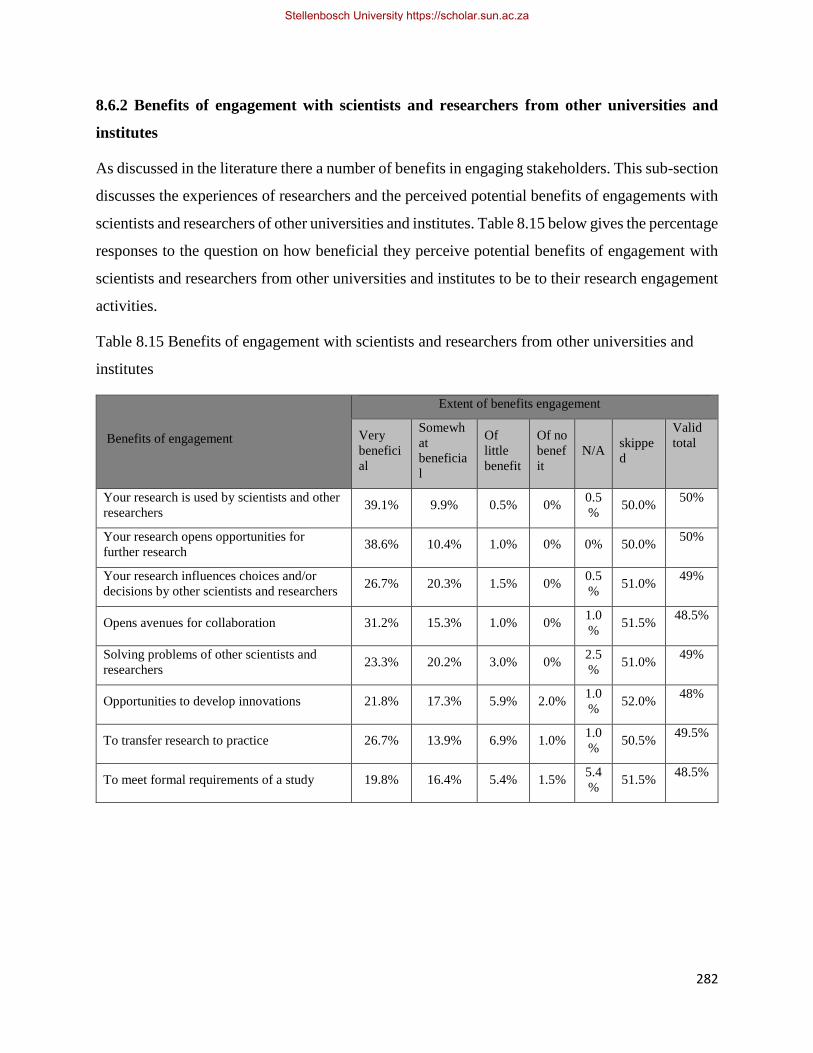
282
8.6.2 Benefits of engagement with scientists and researchers from other universities and
institutes
As discussed in the literature there a number of benefits in engaging stakeholders. This sub-section
discusses the experiences of researchers and the perceived potential benefits of engagements with
scientists and researchers of other universities and institutes. Table 8.15 below gives the percentage
responses to the question on how beneficial they perceive potential benefits of engagement with
scientists and researchers from other universities and institutes to be to their research engagement
activities.
Table 8.15 Benefits of engagement with scientists and researchers from other universities and
institutes
Benefits of engagement
Extent of benefits engagement
Very
benefici
al
Somewh
at
beneficia
l
Of
little
benefit
Of no
benef
it
N/A skippe
d
Valid
total
Your research is used by scientists and other
researchers 39.1% 9.9% 0.5% 0%
0.5
% 50.0%
50%
Your research opens opportunities for
further research 38.6% 10.4% 1.0% 0% 0% 50.0%
50%
Your research influences choices and/or
decisions by other scientists and researchers 26.7% 20.3% 1.5% 0%
0.5
% 51.0%
49%
Opens avenues for collaboration 31.2% 15.3% 1.0% 0% 1.0
% 51.5%
48.5%
Solving problems of other scientists and
researchers 23.3% 20.2% 3.0% 0%
2.5
% 51.0%
49%
Opportunities to develop innovations 21.8% 17.3% 5.9% 2.0% 1.0
% 52.0%
48%
To transfer research to practice 26.7% 13.9% 6.9% 1.0% 1.0
% 50.5%
49.5%
To meet formal requirements of a study 19.8% 16.4% 5.4% 1.5% 5.4
% 51.5%
48.5%
Stellenbosch University https://scholar.sun.ac.za
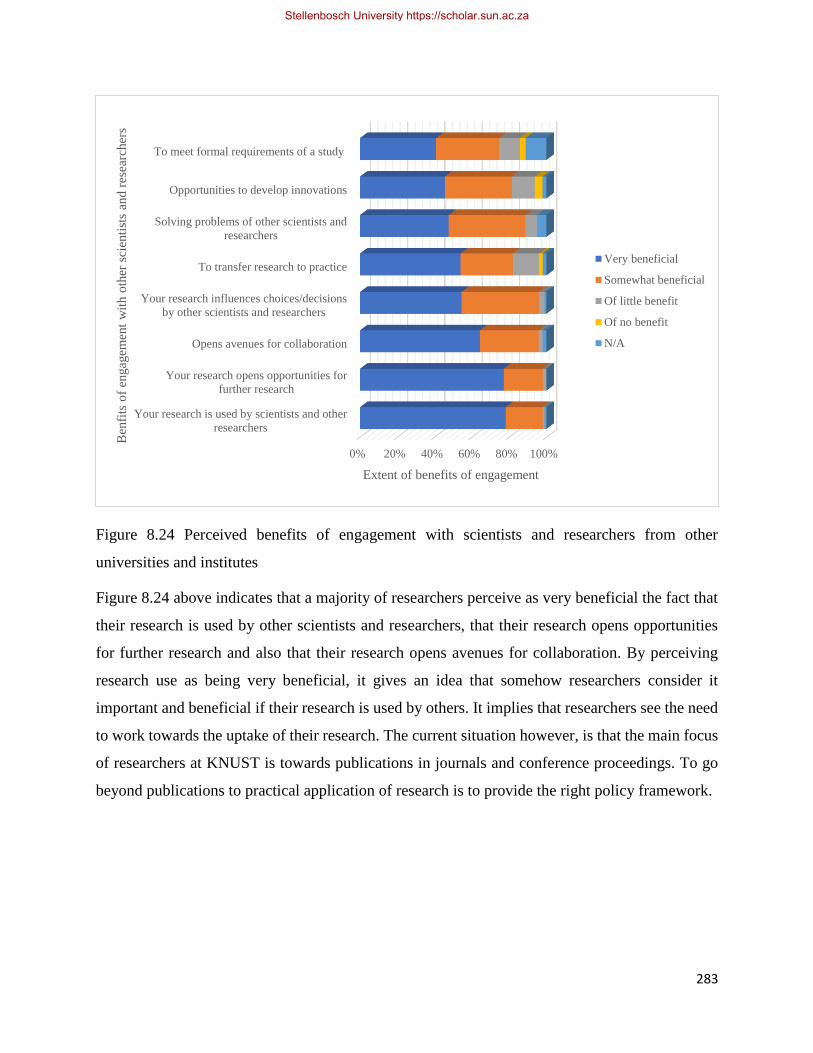
283
Figure 8.24 Perceived benefits of engagement with scientists and researchers from other
universities and institutes
Figure 8.24 above indicates that a majority of researchers perceive as very beneficial the fact that
their research is used by other scientists and researchers, that their research opens opportunities
for further research and also that their research opens avenues for collaboration. By perceiving
research use as being very beneficial, it gives an idea that somehow researchers consider it
important and beneficial if their research is used by others. It implies that researchers see the need
to work towards the uptake of their research. The current situation however, is that the main focus
of researchers at KNUST is towards publications in journals and conference proceedings. To go
beyond publications to practical application of research is to provide the right policy framework.
0% 20% 40% 60% 80% 100%
Your research is used by scientists and other
researchers
Your research opens opportunities for
further research
Opens avenues for collaboration
Your research influences choices/decisions
by other scientists and researchers
To transfer research to practice
Solving problems of other scientists and
researchers
Opportunities to develop innovations
To meet formal requirements of a study
Extent of benefits of engagement
Ben
fits
of
engag
emen
t w
ith o
ther
sci
enti
sts
and
res
earc
her
s
Very beneficial
Somewhat beneficial
Of little benefit
Of no benefit
N/A
Stellenbosch University https://scholar.sun.ac.za
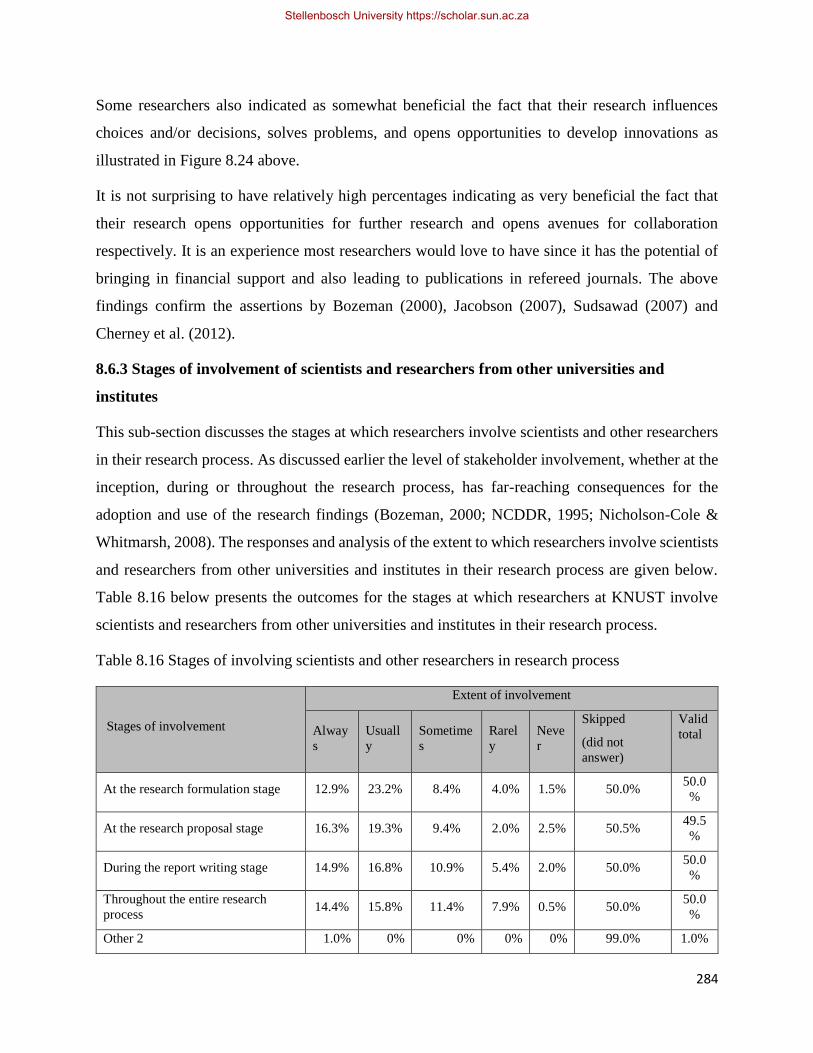
284
Some researchers also indicated as somewhat beneficial the fact that their research influences
choices and/or decisions, solves problems, and opens opportunities to develop innovations as
illustrated in Figure 8.24 above.
It is not surprising to have relatively high percentages indicating as very beneficial the fact that
their research opens opportunities for further research and opens avenues for collaboration
respectively. It is an experience most researchers would love to have since it has the potential of
bringing in financial support and also leading to publications in refereed journals. The above
findings confirm the assertions by Bozeman (2000), Jacobson (2007), Sudsawad (2007) and
Cherney et al. (2012).
8.6.3 Stages of involvement of scientists and researchers from other universities and
institutes
This sub-section discusses the stages at which researchers involve scientists and other researchers
in their research process. As discussed earlier the level of stakeholder involvement, whether at the
inception, during or throughout the research process, has far-reaching consequences for the
adoption and use of the research findings (Bozeman, 2000; NCDDR, 1995; Nicholson-Cole &
Whitmarsh, 2008). The responses and analysis of the extent to which researchers involve scientists
and researchers from other universities and institutes in their research process are given below.
Table 8.16 below presents the outcomes for the stages at which researchers at KNUST involve
scientists and researchers from other universities and institutes in their research process.
Table 8.16 Stages of involving scientists and other researchers in research process
Stages of involvement
Extent of involvement
Alway
s
Usuall
y
Sometime
s
Rarel
y
Neve
r
Skipped
(did not
answer)
Valid
total
At the research formulation stage 12.9% 23.2% 8.4% 4.0% 1.5% 50.0% 50.0
%
At the research proposal stage 16.3% 19.3% 9.4% 2.0% 2.5% 50.5% 49.5
%
During the report writing stage 14.9% 16.8% 10.9% 5.4% 2.0% 50.0% 50.0
%
Throughout the entire research
process 14.4% 15.8% 11.4% 7.9% 0.5% 50.0%
50.0
%
Other 2 1.0% 0% 0% 0% 0% 99.0% 1.0%
Stellenbosch University https://scholar.sun.ac.za
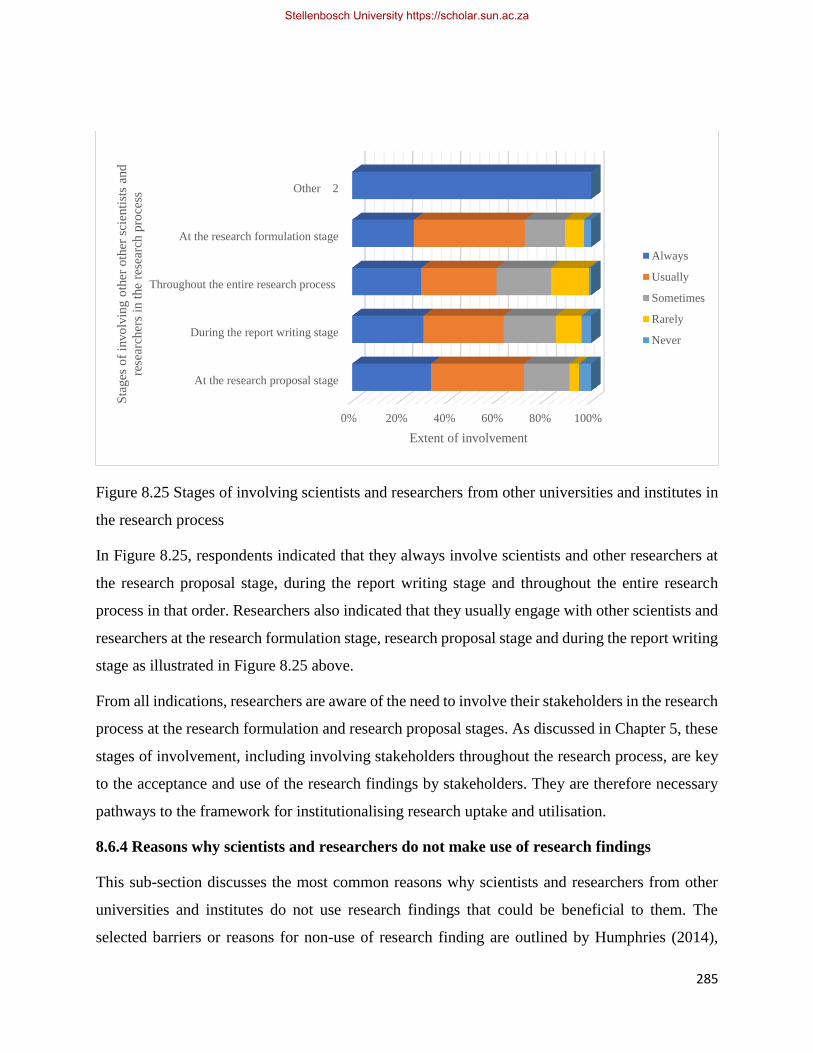
285
Figure 8.25 Stages of involving scientists and researchers from other universities and institutes in
the research process
In Figure 8.25, respondents indicated that they always involve scientists and other researchers at
the research proposal stage, during the report writing stage and throughout the entire research
process in that order. Researchers also indicated that they usually engage with other scientists and
researchers at the research formulation stage, research proposal stage and during the report writing
stage as illustrated in Figure 8.25 above.
From all indications, researchers are aware of the need to involve their stakeholders in the research
process at the research formulation and research proposal stages. As discussed in Chapter 5, these
stages of involvement, including involving stakeholders throughout the research process, are key
to the acceptance and use of the research findings by stakeholders. They are therefore necessary
pathways to the framework for institutionalising research uptake and utilisation.
8.6.4 Reasons why scientists and researchers do not make use of research findings
This sub-section discusses the most common reasons why scientists and researchers from other
universities and institutes do not use research findings that could be beneficial to them. The
selected barriers or reasons for non-use of research finding are outlined by Humphries (2014),
0% 20% 40% 60% 80% 100%
At the research proposal stage
During the report writing stage
Throughout the entire research process
At the research formulation stage
Other 2
Extent of involvement
Sta
ges
of
invo
lvin
g o
ther
oth
er s
cien
tist
s an
d
rese
arch
ers
in t
he
rese
arch
pro
cess
Always
Usually
Sometimes
Rarely
Never
Stellenbosch University https://scholar.sun.ac.za
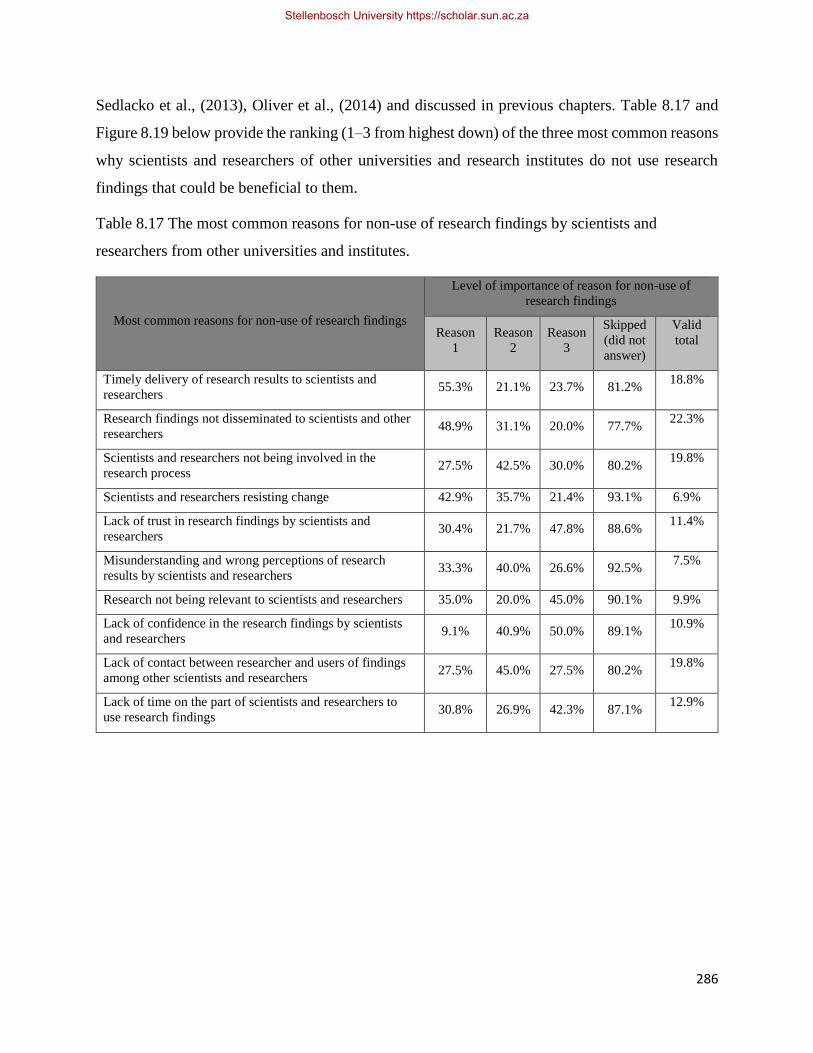
286
Sedlacko et al., (2013), Oliver et al., (2014) and discussed in previous chapters. Table 8.17 and
Figure 8.19 below provide the ranking (1–3 from highest down) of the three most common reasons
why scientists and researchers of other universities and research institutes do not use research
findings that could be beneficial to them.
Table 8.17 The most common reasons for non-use of research findings by scientists and
researchers from other universities and institutes.
Most common reasons for non-use of research findings
Level of importance of reason for non-use of
research findings
Reason
1
Reason
2
Reason
3
Skipped
(did not
answer)
Valid
total
Timely delivery of research results to scientists and
researchers 55.3% 21.1% 23.7% 81.2%
18.8%
Research findings not disseminated to scientists and other
researchers 48.9% 31.1% 20.0% 77.7%
22.3%
Scientists and researchers not being involved in the
research process 27.5% 42.5% 30.0% 80.2%
19.8%
Scientists and researchers resisting change 42.9% 35.7% 21.4% 93.1% 6.9%
Lack of trust in research findings by scientists and
researchers 30.4% 21.7% 47.8% 88.6%
11.4%
Misunderstanding and wrong perceptions of research
results by scientists and researchers 33.3% 40.0% 26.6% 92.5%
7.5%
Research not being relevant to scientists and researchers 35.0% 20.0% 45.0% 90.1% 9.9%
Lack of confidence in the research findings by scientists
and researchers 9.1% 40.9% 50.0% 89.1%
10.9%
Lack of contact between researcher and users of findings
among other scientists and researchers 27.5% 45.0% 27.5% 80.2%
19.8%
Lack of time on the part of scientists and researchers to
use research findings 30.8% 26.9% 42.3% 87.1%
12.9%
Stellenbosch University https://scholar.sun.ac.za
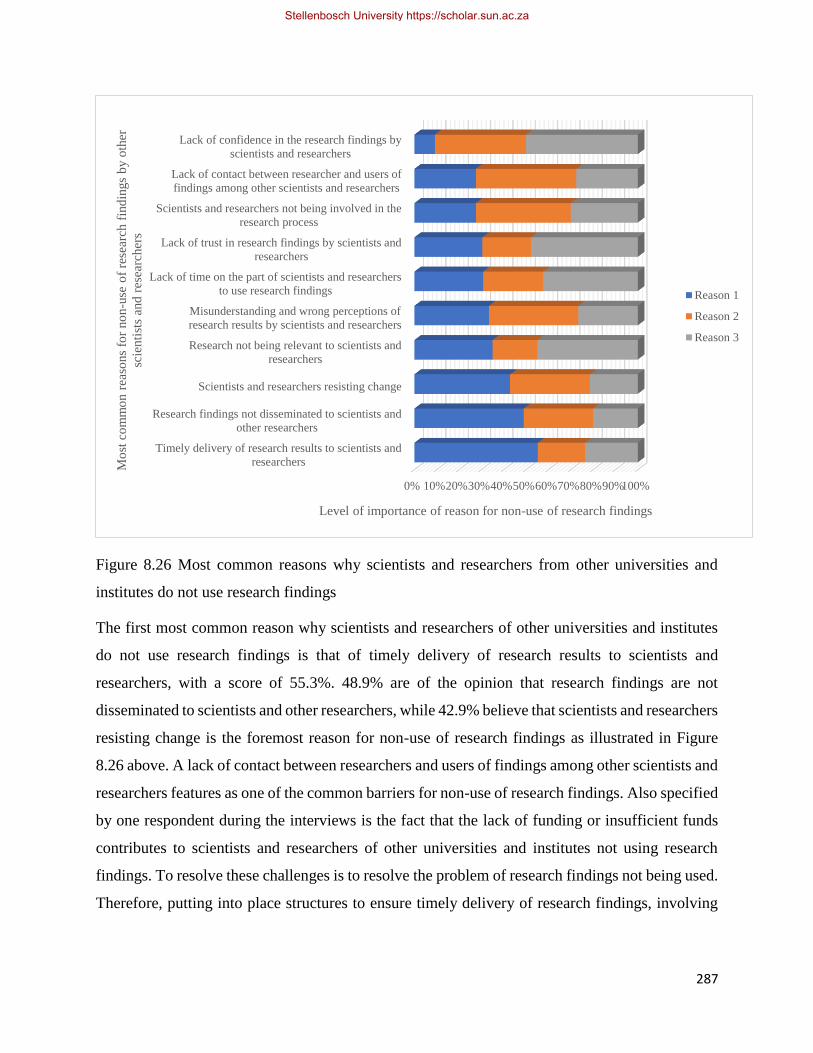
287
Figure 8.26 Most common reasons why scientists and researchers from other universities and
institutes do not use research findings
The first most common reason why scientists and researchers of other universities and institutes
do not use research findings is that of timely delivery of research results to scientists and
researchers, with a score of 55.3%. 48.9% are of the opinion that research findings are not
disseminated to scientists and other researchers, while 42.9% believe that scientists and researchers
resisting change is the foremost reason for non-use of research findings as illustrated in Figure
8.26 above. A lack of contact between researchers and users of findings among other scientists and
researchers features as one of the common barriers for non-use of research findings. Also specified
by one respondent during the interviews is the fact that the lack of funding or insufficient funds
contributes to scientists and researchers of other universities and institutes not using research
findings. To resolve these challenges is to resolve the problem of research findings not being used.
Therefore, putting into place structures to ensure timely delivery of research findings, involving
0% 10%20%30%40%50%60%70%80%90%100%
Timely delivery of research results to scientists and
researchers
Research findings not disseminated to scientists and
other researchers
Scientists and researchers resisting change
Research not being relevant to scientists and
researchers
Misunderstanding and wrong perceptions of
research results by scientists and researchers
Lack of time on the part of scientists and researchers
to use research findings
Lack of trust in research findings by scientists and
researchers
Scientists and researchers not being involved in the
research process
Lack of contact between researcher and users of
findings among other scientists and researchers
Lack of confidence in the research findings by
scientists and researchers
Level of importance of reason for non-use of research findings
Mo
st c
om
mo
n r
easo
ns
for
no
n-u
se o
f re
sear
ch f
ind
ings
by o
ther
scie
nti
sts
and
res
earc
her
s
Reason 1
Reason 2
Reason 3
Stellenbosch University https://scholar.sun.ac.za
288
stakeholders in the research process to build confidence, and sourcing for funding to disseminate
research will enhance the process towards uptake and utilisation of research.
8.7 Engagements with non-governmental organisations
The sub-sections below discuss how typically researchers at KNUST engage with non-
governmental organisations (NGOs) and which academic positions and faculties engage most, the
benefits of the engagements, the stages at which they involve these stakeholders in their research
process and what are the most common reasons why these NGOs (including charities and funders)
do not use research findings which could be beneficial to them. The details are as discussed and
illustrated below.
8.7.1 Typical engagement with non-governmental organisations
This sub-section discusses the mechanisms and channels of engagement adopted by researchers in
their engagements with NGOs. The listed mechanisms, discussed in Chapter 5, are as outlined by
authors like Becheikh and Ziam (2010), Cherney et al. (2012) and Hood (2002). Table 8.18 and
Figure 8.27 below provide the number of responses, respective percentages and analysis of how
often researchers typically engage with NGOs via the stated engagement mechanisms.
Stellenbosch University https://scholar.sun.ac.za
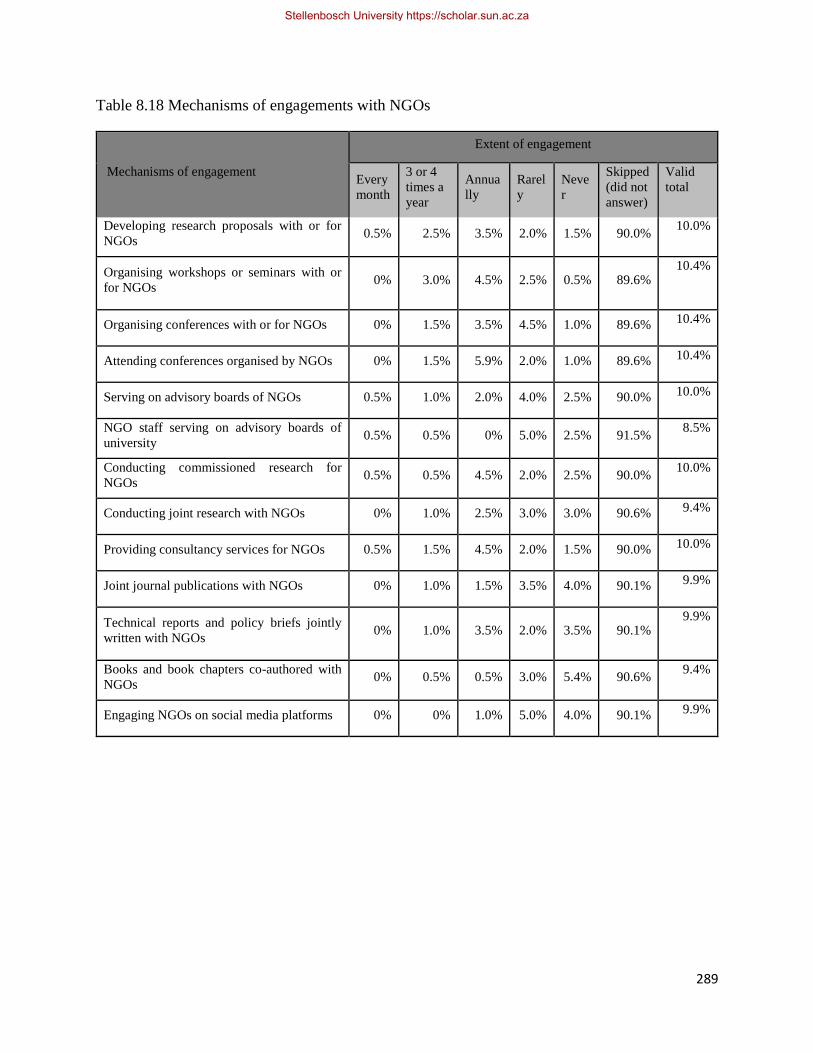
289
Table 8.18 Mechanisms of engagements with NGOs
Mechanisms of engagement
Extent of engagement
Every
month
3 or 4
times a
year
Annua
lly
Rarel
y
Neve
r
Skipped
(did not
answer)
Valid
total
Developing research proposals with or for
NGOs 0.5% 2.5% 3.5% 2.0% 1.5% 90.0%
10.0%
Organising workshops or seminars with or
for NGOs 0% 3.0% 4.5% 2.5% 0.5% 89.6%
10.4%
Organising conferences with or for NGOs 0% 1.5% 3.5% 4.5% 1.0% 89.6% 10.4%
Attending conferences organised by NGOs 0% 1.5% 5.9% 2.0% 1.0% 89.6% 10.4%
Serving on advisory boards of NGOs 0.5% 1.0% 2.0% 4.0% 2.5% 90.0% 10.0%
NGO staff serving on advisory boards of
university 0.5% 0.5% 0% 5.0% 2.5% 91.5%
8.5%
Conducting commissioned research for
NGOs 0.5% 0.5% 4.5% 2.0% 2.5% 90.0%
10.0%
Conducting joint research with NGOs 0% 1.0% 2.5% 3.0% 3.0% 90.6% 9.4%
Providing consultancy services for NGOs 0.5% 1.5% 4.5% 2.0% 1.5% 90.0% 10.0%
Joint journal publications with NGOs 0% 1.0% 1.5% 3.5% 4.0% 90.1% 9.9%
Technical reports and policy briefs jointly
written with NGOs 0% 1.0% 3.5% 2.0% 3.5% 90.1%
9.9%
Books and book chapters co-authored with
NGOs 0% 0.5% 0.5% 3.0% 5.4% 90.6%
9.4%
Engaging NGOs on social media platforms 0% 0% 1.0% 5.0% 4.0% 90.1% 9.9%
Stellenbosch University https://scholar.sun.ac.za
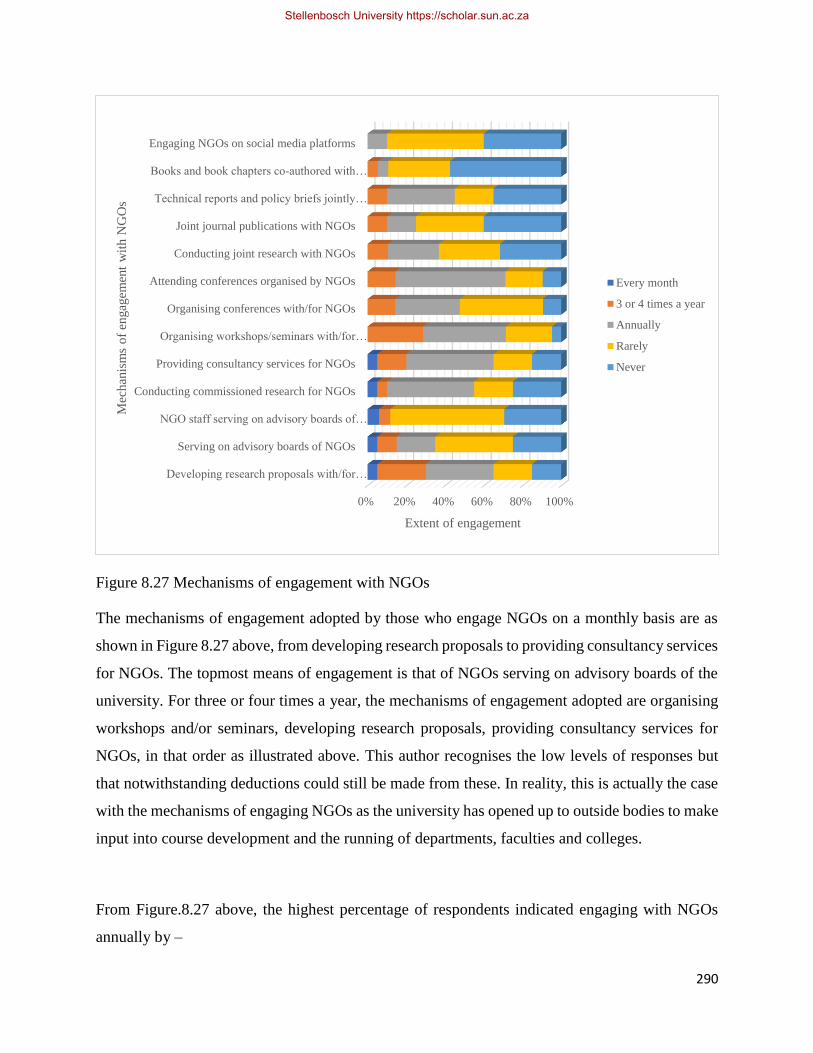
290
Figure 8.27 Mechanisms of engagement with NGOs
The mechanisms of engagement adopted by those who engage NGOs on a monthly basis are as
shown in Figure 8.27 above, from developing research proposals to providing consultancy services
for NGOs. The topmost means of engagement is that of NGOs serving on advisory boards of the
university. For three or four times a year, the mechanisms of engagement adopted are organising
workshops and/or seminars, developing research proposals, providing consultancy services for
NGOs, in that order as illustrated above. This author recognises the low levels of responses but
that notwithstanding deductions could still be made from these. In reality, this is actually the case
with the mechanisms of engaging NGOs as the university has opened up to outside bodies to make
input into course development and the running of departments, faculties and colleges.
From Figure.8.27 above, the highest percentage of respondents indicated engaging with NGOs
annually by –
0% 20% 40% 60% 80% 100%
Developing research proposals with/for…
Serving on advisory boards of NGOs
NGO staff serving on advisory boards of…
Conducting commissioned research for NGOs
Providing consultancy services for NGOs
Organising workshops/seminars with/for…
Organising conferences with/for NGOs
Attending conferences organised by NGOs
Conducting joint research with NGOs
Joint journal publications with NGOs
Technical reports and policy briefs jointly…
Books and book chapters co-authored with…
Engaging NGOs on social media platforms
Extent of engagement
Mec
han
ism
s o
f en
gag
emen
t w
ith N
GO
s
Every month
3 or 4 times a year
Annually
Rarely
Never
Stellenbosch University https://scholar.sun.ac.za
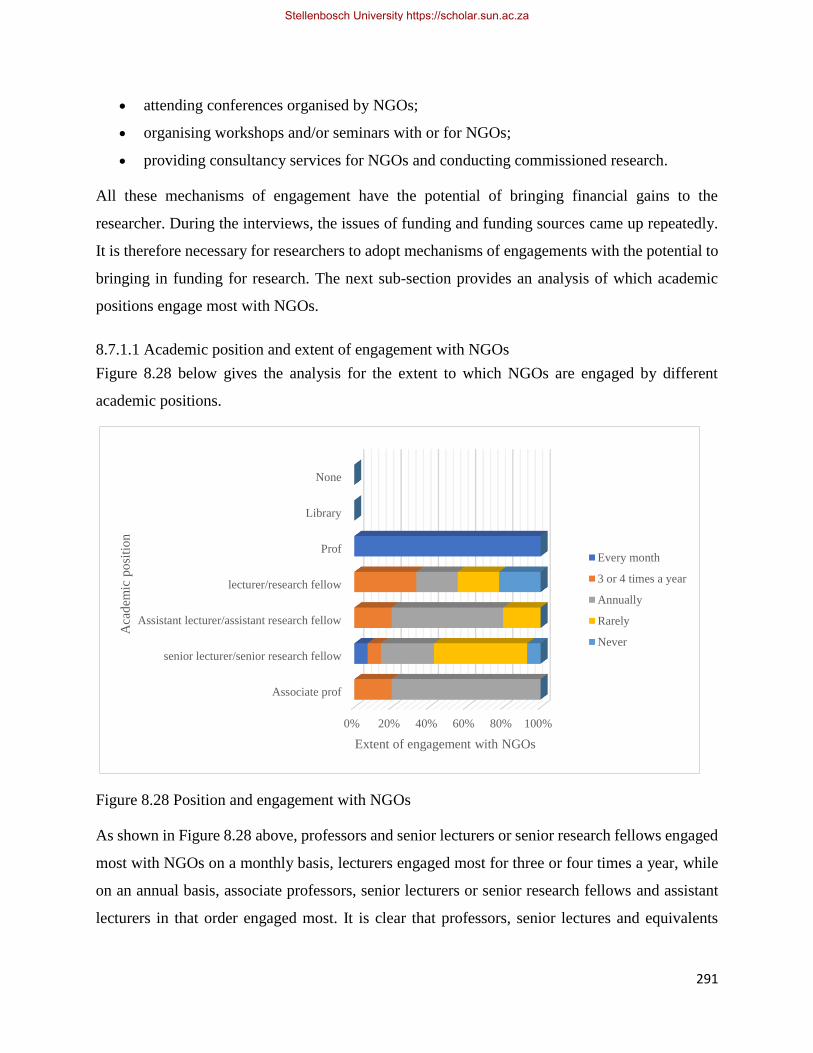
291
• attending conferences organised by NGOs;
• organising workshops and/or seminars with or for NGOs;
• providing consultancy services for NGOs and conducting commissioned research.
All these mechanisms of engagement have the potential of bringing financial gains to the
researcher. During the interviews, the issues of funding and funding sources came up repeatedly.
It is therefore necessary for researchers to adopt mechanisms of engagements with the potential to
bringing in funding for research. The next sub-section provides an analysis of which academic
positions engage most with NGOs.
8.7.1.1 Academic position and extent of engagement with NGOs
Figure 8.28 below gives the analysis for the extent to which NGOs are engaged by different
academic positions.
Figure 8.28 Position and engagement with NGOs
As shown in Figure 8.28 above, professors and senior lecturers or senior research fellows engaged
most with NGOs on a monthly basis, lecturers engaged most for three or four times a year, while
on an annual basis, associate professors, senior lecturers or senior research fellows and assistant
lecturers in that order engaged most. It is clear that professors, senior lectures and equivalents
0% 20% 40% 60% 80% 100%
Associate prof
senior lecturer/senior research fellow
Assistant lecturer/assistant research fellow
lecturer/research fellow
Prof
Library
None
Extent of engagement with NGOs
Aca
dem
ic p
osi
tio
n
Every month
3 or 4 times a year
Annually
Rarely
Never
Stellenbosch University https://scholar.sun.ac.za
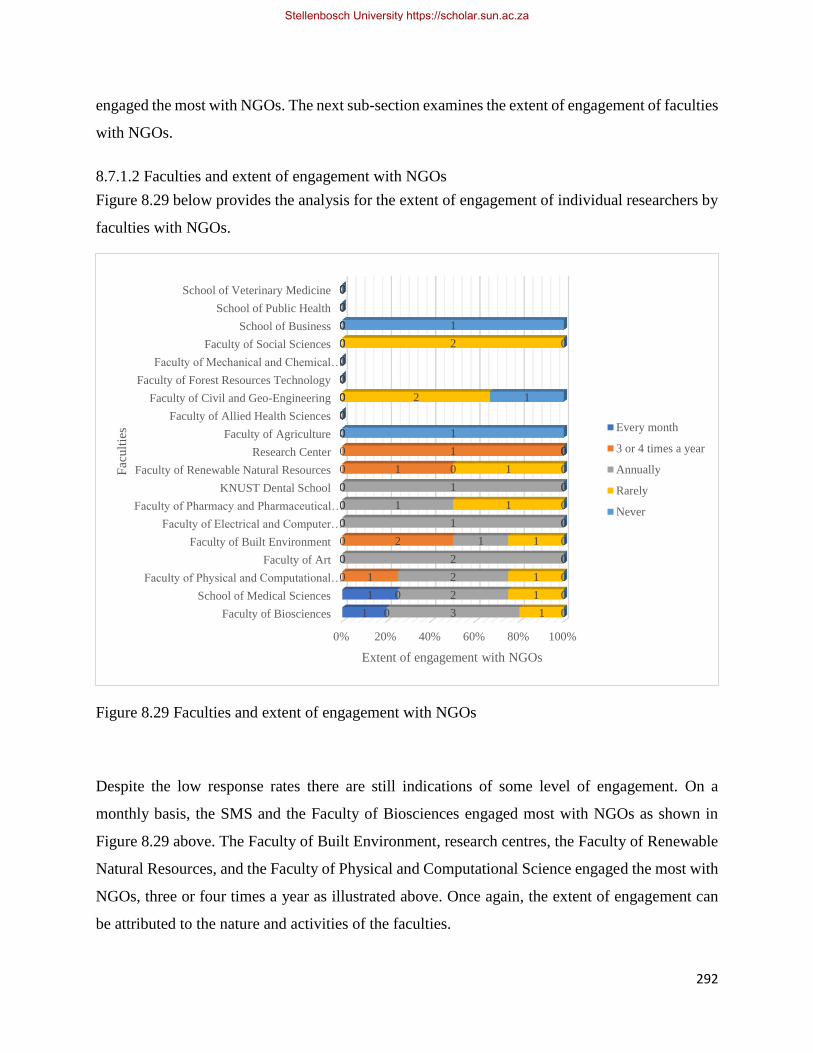
292
engaged the most with NGOs. The next sub-section examines the extent of engagement of faculties
with NGOs.
8.7.1.2 Faculties and extent of engagement with NGOs
Figure 8.29 below provides the analysis for the extent of engagement of individual researchers by
faculties with NGOs.
Figure 8.29 Faculties and extent of engagement with NGOs
Despite the low response rates there are still indications of some level of engagement. On a
monthly basis, the SMS and the Faculty of Biosciences engaged most with NGOs as shown in
Figure 8.29 above. The Faculty of Built Environment, research centres, the Faculty of Renewable
Natural Resources, and the Faculty of Physical and Computational Science engaged the most with
NGOs, three or four times a year as illustrated above. Once again, the extent of engagement can
be attributed to the nature and activities of the faculties.
0% 20% 40% 60% 80% 100%
Faculty of Biosciences
School of Medical Sciences
Faculty of Physical and Computational…
Faculty of Art
Faculty of Built Environment
Faculty of Electrical and Computer…
Faculty of Pharmacy and Pharmaceutical…
KNUST Dental School
Faculty of Renewable Natural Resources
Research Center
Faculty of Agriculture
Faculty of Allied Health Sciences
Faculty of Civil and Geo-Engineering
Faculty of Forest Resources Technology
Faculty of Mechanical and Chemical…
Faculty of Social Sciences
School of Business
School of Public Health
School of Veterinary Medicine
1
1
0
0
0
0
0
0
0
0
0
0
0
0
0
0
0
0
0
0
0
1
0
2
0
0
0
1
1
0
0
0
0
0
0
0
0
0
3
2
2
2
1
1
1
1
0
0
0
0
0
0
0
0
0
0
0
1
1
1
0
1
0
1
0
1
0
0
0
2
0
0
2
0
0
0
0
0
0
0
0
0
0
0
0
0
1
0
1
0
0
0
1
0
0
Extent of engagement with NGOs
Fac
ult
ies Every month
3 or 4 times a year
Annually
Rarely
Never
Stellenbosch University https://scholar.sun.ac.za
293
We can infer that the Faculty of Biosciences (comprising the Departments of Theoretical and
Applied Biology Biochemistry, Food Science, Environmental Science, and Optometry and Vision
Science), and the School of Medical Sciences engaged the most with NGOs on a monthly basis..
These engagements at the faculty level provide information on the strengths of different faculties
or colleges and inform policy as far as outreach is concerned. It also reveals the training needs of
each faculty. It is hoped that these faculties will adopt and enhance the above leading mechanisms
in their research engagements with NGOs. Other faculties could adopt these mechanisms as well
in order to reach out to NGOs with their research.
In concluding this sub-section, it seems that different faculties have different strengths as far
engagement with stakeholders is concerned. While excelling in some areas, weaknesses are
observed in other areas. Overall, faculties of the Colleges of Health Sciences, Art and Built
Environment, Science and Engineering are the ones that engaged the most with NGOs. The above
findings can serve as a guide to management of the university in the distribution of resources and
in determining the training needs of the faculties. The benefits of the above engagements are
discussed in the next sub-section.
8.7.2 Benefits of engagement with NGOs
There are some expected benefits accruing from stakeholder engagement, such as:
• chances that the research will be used;
• research is used to solve problems;
• modification of research;
• opportunities for further research;
• influencing policies and decisions of policymakers;
• opening avenues for collaboration;
• providing opportunities for innovations;
• providing justification for funding as part of fulfilling contract agreement (Bozeman, 2000;
Jacobson , 2007; Sudsawad, 2007).
This sub-section presented a discussion on how beneficial researchers perceive the stated potential
benefits of engagement with NGOs to be to their own research engagement activities.
Stellenbosch University https://scholar.sun.ac.za
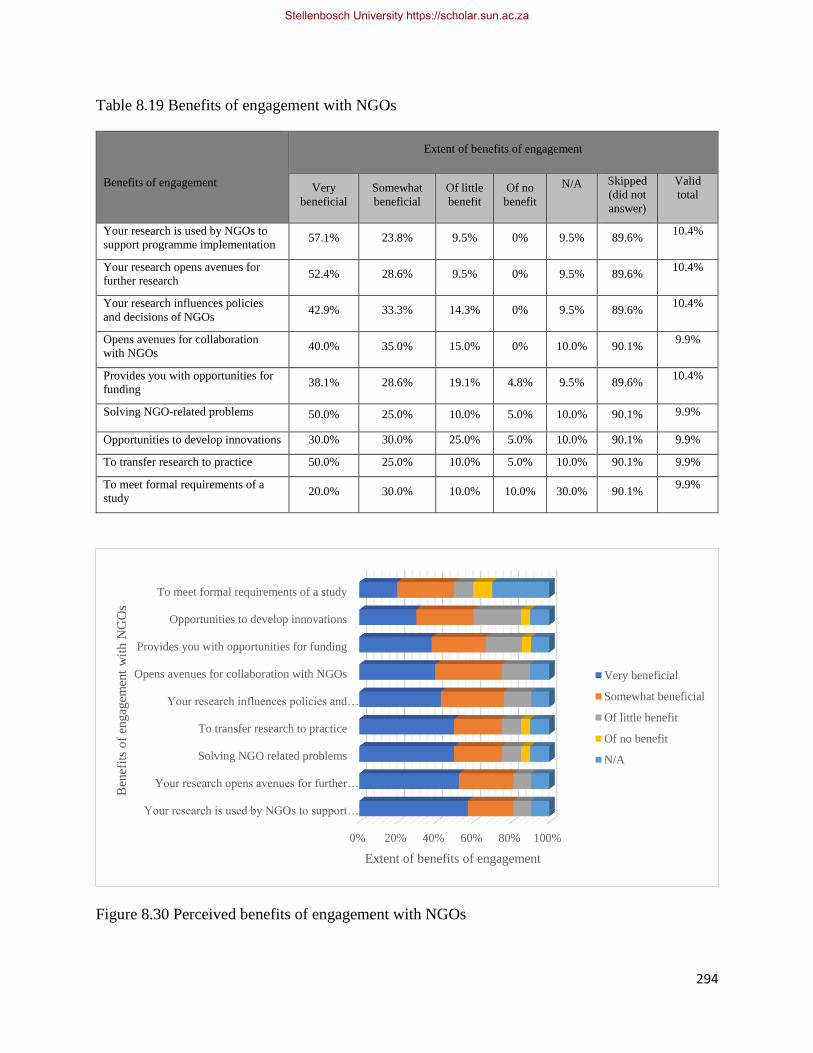
294
Table 8.19 Benefits of engagement with NGOs
Benefits of engagement
Extent of benefits of engagement
Very
beneficial
Somewhat
beneficial
Of little
benefit
Of no
benefit
N/A
Skipped
(did not
answer)
Valid
total
Your research is used by NGOs to
support programme implementation 57.1% 23.8% 9.5% 0% 9.5% 89.6%
10.4%
Your research opens avenues for
further research 52.4% 28.6% 9.5% 0% 9.5% 89.6%
10.4%
Your research influences policies
and decisions of NGOs 42.9% 33.3% 14.3% 0% 9.5% 89.6%
10.4%
Opens avenues for collaboration
with NGOs 40.0% 35.0% 15.0% 0% 10.0% 90.1%
9.9%
Provides you with opportunities for
funding 38.1% 28.6% 19.1% 4.8% 9.5% 89.6%
10.4%
Solving NGO-related problems 50.0% 25.0% 10.0% 5.0% 10.0% 90.1% 9.9%
Opportunities to develop innovations 30.0% 30.0% 25.0% 5.0% 10.0% 90.1% 9.9%
To transfer research to practice 50.0% 25.0% 10.0% 5.0% 10.0% 90.1% 9.9%
To meet formal requirements of a
study 20.0% 30.0% 10.0% 10.0% 30.0% 90.1%
9.9%
Figure 8.30 Perceived benefits of engagement with NGOs
0% 20% 40% 60% 80% 100%
Your research is used by NGOs to support…
Your research opens avenues for further…
Solving NGO related problems
To transfer research to practice
Your research influences policies and…
Opens avenues for collaboration with NGOs
Provides you with opportunities for funding
Opportunities to develop innovations
To meet formal requirements of a study
Extent of benefits of engagement
Ben
efit
s o
f en
gag
emen
t w
ith N
GO
s
Very beneficial
Somewhat beneficial
Of little benefit
Of no benefit
N/A
Stellenbosch University https://scholar.sun.ac.za

295
As shown in Table 8.19 and illustrated in Figure 8.30 above, 57.1% of respondents perceive as
very beneficial the fact that their research is used by NGOs to support programme implementation.
52.4% of respondents deem it very beneficial that their research opens avenues for further research,
while 50.0% believe that solving NGO-related problems and transferring research to practice are
also very beneficial. The figure also provides the analysis for researchers who perceive various
engagements with NGOs as being somewhat beneficial. These include avenues for collaboration,
influence on policies and decisions and opportunities to develop innovations in that order.
Research use in the above cases is the topmost priority of respondents’ engagement with NGOs
and this practice needs to be encouraged. Here again, researchers gave indications to the effect that
their research opens avenues for further research. Solving NGO-related problems and transferring
research into practice with NGOs is a rewarding experience that contributes towards research
uptake and utilisation. This practice, confirmed by the interview report, must be encouraged and
facilitated among researchers, since it leads to research uptake.
8.7.3 Stages of involvement of NGOs
The involvement of NGOs in the research process has the potential of influencing whether or not
research findings will be acceptable to them and subsequently used. As already discussed in the
previous sections, the literature spells out key stages of stakeholder involvement in the research
process. Table 8.20 and Figure 8.31 below provide the responses and analysis of the extent to
which researchers involve NGOs in the research process at the various stages.
Stellenbosch University https://scholar.sun.ac.za
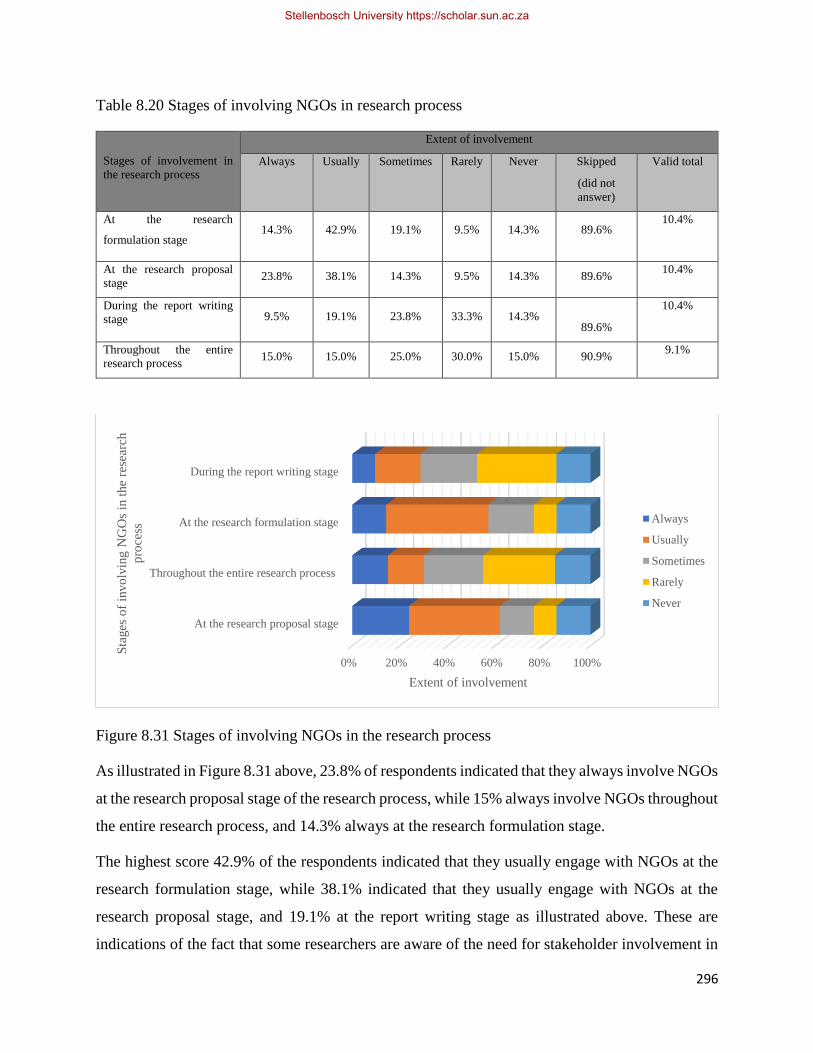
296
Table 8.20 Stages of involving NGOs in research process
Stages of involvement in
the research process
Extent of involvement
Always
Usually
Sometimes
Rarely
Never
Skipped
(did not
answer)
Valid total
At the research
formulation stage 14.3% 42.9% 19.1% 9.5% 14.3% 89.6%
10.4%
At the research proposal
stage 23.8% 38.1% 14.3% 9.5% 14.3% 89.6%
10.4%
During the report writing
stage 9.5% 19.1% 23.8% 33.3% 14.3%
89.6%
10.4%
Throughout the entire
research process 15.0% 15.0% 25.0% 30.0% 15.0% 90.9%
9.1%
Figure 8.31 Stages of involving NGOs in the research process
As illustrated in Figure 8.31 above, 23.8% of respondents indicated that they always involve NGOs
at the research proposal stage of the research process, while 15% always involve NGOs throughout
the entire research process, and 14.3% always at the research formulation stage.
The highest score 42.9% of the respondents indicated that they usually engage with NGOs at the
research formulation stage, while 38.1% indicated that they usually engage with NGOs at the
research proposal stage, and 19.1% at the report writing stage as illustrated above. These are
indications of the fact that some researchers are aware of the need for stakeholder involvement in
0% 20% 40% 60% 80% 100%
At the research proposal stage
Throughout the entire research process
At the research formulation stage
During the report writing stage
Extent of involvement
Sta
ges
of
invo
lvin
g N
GO
s in
the
rese
arch
pro
cess
Always
Usually
Sometimes
Rarely
Never
Stellenbosch University https://scholar.sun.ac.za
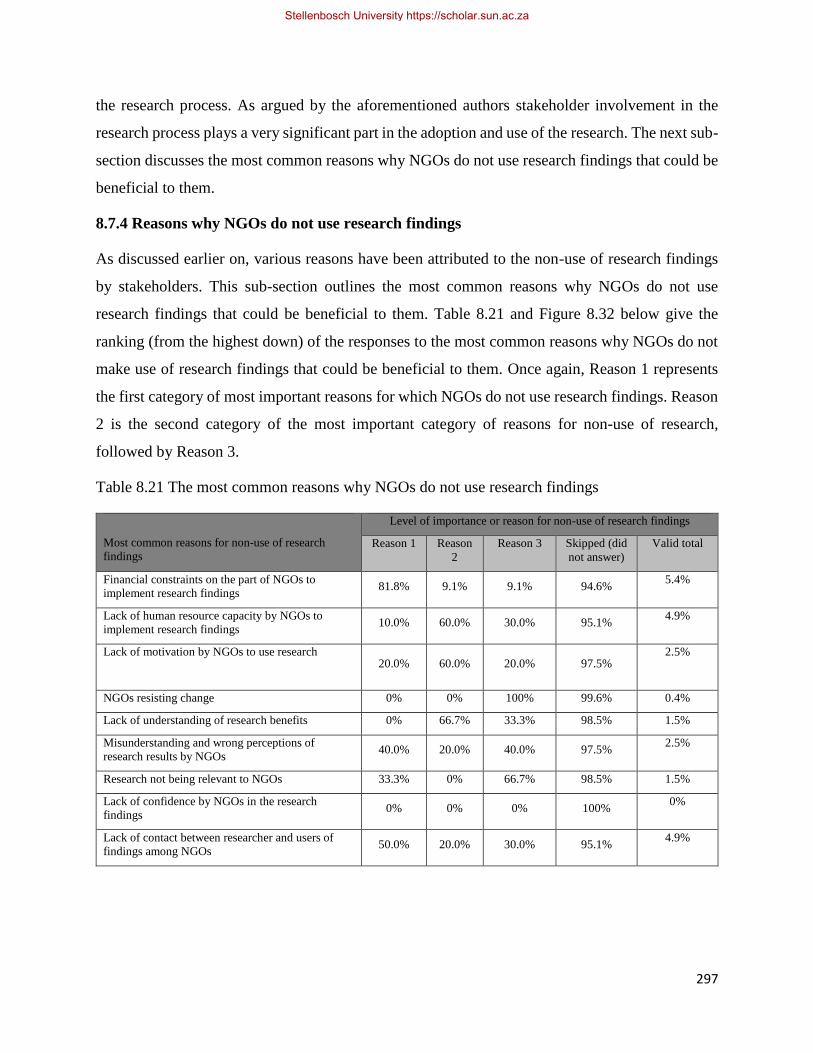
297
the research process. As argued by the aforementioned authors stakeholder involvement in the
research process plays a very significant part in the adoption and use of the research. The next sub-
section discusses the most common reasons why NGOs do not use research findings that could be
beneficial to them.
8.7.4 Reasons why NGOs do not use research findings
As discussed earlier on, various reasons have been attributed to the non-use of research findings
by stakeholders. This sub-section outlines the most common reasons why NGOs do not use
research findings that could be beneficial to them. Table 8.21 and Figure 8.32 below give the
ranking (from the highest down) of the responses to the most common reasons why NGOs do not
make use of research findings that could be beneficial to them. Once again, Reason 1 represents
the first category of most important reasons for which NGOs do not use research findings. Reason
2 is the second category of the most important category of reasons for non-use of research,
followed by Reason 3.
Table 8.21 The most common reasons why NGOs do not use research findings
Most common reasons for non-use of research
findings
Level of importance or reason for non-use of research findings
Reason 1 Reason
2
Reason 3 Skipped (did
not answer)
Valid total
Financial constraints on the part of NGOs to
implement research findings 81.8% 9.1% 9.1% 94.6%
5.4%
Lack of human resource capacity by NGOs to
implement research findings 10.0% 60.0% 30.0% 95.1%
4.9%
Lack of motivation by NGOs to use research 20.0% 60.0% 20.0% 97.5%
2.5%
NGOs resisting change 0% 0% 100% 99.6% 0.4%
Lack of understanding of research benefits 0% 66.7% 33.3% 98.5% 1.5%
Misunderstanding and wrong perceptions of
research results by NGOs 40.0% 20.0% 40.0% 97.5%
2.5%
Research not being relevant to NGOs 33.3% 0% 66.7% 98.5% 1.5%
Lack of confidence by NGOs in the research
findings 0% 0% 0% 100%
0%
Lack of contact between researcher and users of
findings among NGOs 50.0% 20.0% 30.0% 95.1%
4.9%
Stellenbosch University https://scholar.sun.ac.za
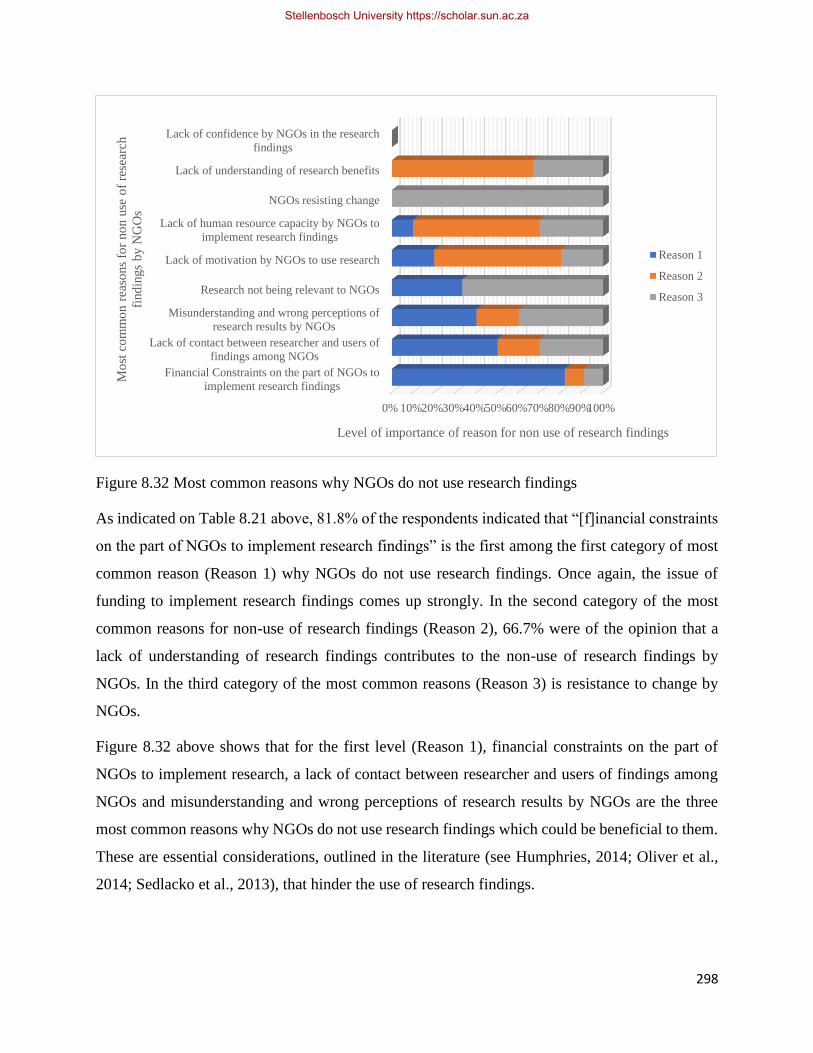
298
Figure 8.32 Most common reasons why NGOs do not use research findings
As indicated on Table 8.21 above, 81.8% of the respondents indicated that “[f]inancial constraints
on the part of NGOs to implement research findings” is the first among the first category of most
common reason (Reason 1) why NGOs do not use research findings. Once again, the issue of
funding to implement research findings comes up strongly. In the second category of the most
common reasons for non-use of research findings (Reason 2), 66.7% were of the opinion that a
lack of understanding of research findings contributes to the non-use of research findings by
NGOs. In the third category of the most common reasons (Reason 3) is resistance to change by
NGOs.
Figure 8.32 above shows that for the first level (Reason 1), financial constraints on the part of
NGOs to implement research, a lack of contact between researcher and users of findings among
NGOs and misunderstanding and wrong perceptions of research results by NGOs are the three
most common reasons why NGOs do not use research findings which could be beneficial to them.
These are essential considerations, outlined in the literature (see Humphries, 2014; Oliver et al.,
2014; Sedlacko et al., 2013), that hinder the use of research findings.
0% 10%20%30%40%50%60%70%80%90%100%
Financial Constraints on the part of NGOs to
implement research findings
Lack of contact between researcher and users of
findings among NGOs
Misunderstanding and wrong perceptions of
research results by NGOs
Research not being relevant to NGOs
Lack of motivation by NGOs to use research
Lack of human resource capacity by NGOs to
implement research findings
NGOs resisting change
Lack of understanding of research benefits
Lack of confidence by NGOs in the research
findings
Level of importance of reason for non use of research findings
Mo
st c
om
mo
n r
easo
ns
for
no
n u
se o
f re
sear
ch
find
ings
by N
GO
s
Reason 1
Reason 2
Reason 3
Stellenbosch University https://scholar.sun.ac.za

299
For the third level, that is Reason 3, all respondents indicated “NGOs resisting change” as their
most common reason for non-use of research. This issue was corroborated during the interviews
when an interviewee indicated that NGOs are set in their own ways of doing things and –
[T]hey are driven by their own agenda (Respondent R8)
Another interesting reason for non-use of research by NGOs as stated by Respondent R8 was:
NGOs too, one thing we’ve noticed is that they are NGOs though, but sometimes they have a
hidden agenda of making profit than the non-profit organisation that they are supposed to be
and so working through them too, there are some kind of double standards that you have to
reckon with.
There are corresponding facilitators to research use, as discussed in Chapter 3, that could help to
overcome some of the above-mentioned barriers. Building a strong relationship between
researchers and policymakers, in this case NGOs, has been suggested as a strong facilitator to
research use ( Humphries, 2014; Oliver et al., 2014; Sedlacko et al., 2013). In defining our
mechanisms and pathways to research uptake these facilitators are taken into consideration.
8.8 Conclusion
The foregoing discussions have centred mainly on the extent of engagement of researchers by
position and faculties with various stakeholders, the benefits of engagement, the stages at which
researchers involve their stakeholders in the research process and finally the reasons why
stakeholders do not use research findings that could be beneficial to them. The focus of the above
discussions has been aimed at finding answers to the research questions relating to knowledge
production and dissemination activities and their implications for research utilisation, the extent
and levels of engagement with the external environment, and, the individual and institutional
barriers to research uptake.
It has been observed that as far as engagement with stakeholders is concerned, respondents
engaged mostly with scientists and researchers from other universities and institutes. In their
research activities there were interactions, collaboration and partnerships with peers and
colleagues within and outside the university. Researchers at KNUST also engaged with
communities outside the university, government (MDAs) and parastatals, the private sector
(including industry) and NGOs on a lesser scale. During the interviews, interviewees mentioned
Stellenbosch University https://scholar.sun.ac.za
300
other stakeholders such as ornamental plant dealers, students, health professionals, individuals and
local people.
As far as engagement by academic position is concerned researchers of senior ranks engaged at
high levels the most with different stakeholders. Faculties engaged different stakeholders at
different levels depending on the activities involved. Appendices 7 and 8 provide a summary of
the extent to which different faculties and academic positions engaged with different stakeholders.
The mechanisms and channels of engagement vary from stakeholder to stakeholder, but it was
generally observed that respondents mostly engaged through conferences, workshops and
seminars, confirming thoughts expressed by Larsen (1980), the NCDDR (1995), Bozeman (2000),
Innvaer and Vist (2002), Becheikh and Ziam (2010) and Cherney et al. (2012). Other mechanisms
of engagement mentioned during the interviews were writing proposals, organising short courses,
networking, industrial internships, journal club presentations, radio programs, intervention
research, knowledge sharing, and focus group discussions.
Researchers generally consider it very beneficial if their research provides opportunities for further
research, opens avenues for collaboration and funding, their research is used and influences
practice. As stated by one interviewee “[y]ou become known to your colleagues, grant bodies as
productive and an authority in the subject area. Ultimately, you get more grants.” (Respondent R2)
For others the satisfaction that comes with meeting the needs of others are very rewarding as stated
by two interviewees.
[F]or me, when the people are using what you have come out with, then that is the biggest success
that one would be looking at (Respondent R1).
In addition to the research output we gained as researchers, it was absolutely refreshing to see these
women find jobs to be able to support their families as well as improve on their own living
conditions (Respondent R10)
Other benefits of doing research given by respondents are gaining credibility and an improvement
in their track records.
In order for acceptance, adoption and possible use of research findings respondents largely agreed
that stakeholders should be involved in the research process at the research formulation and
proposal stages. These are further confirmed from the interviews where there were indications of
Stellenbosch University https://scholar.sun.ac.za
301
research impact due to the extent of involvement of stakeholders in the research process. One
interviewee stated:
I think one of the fundamental things that I do in terms of research is to involve my
stakeholders from the very beginning (Respondent R6).
According to another interviewee, direct contact with farmers, collaboration with other scientists
at all stages and availability of funding proved very useful, confirming propositions from Hood
(2002), Becheikh and Ziam (2010).
The most common reason, given by respondents, why stakeholders do not use research findings
that could be beneficial to them was attributed to financial constraints both on the part of
researchers and stakeholders for dissemination and implementation of research findings. Some
other stated reasons for non-use of research, as far as government and policy issues are concerned
were:
Government, before, they come into power, have what we call the manifesto, right? They develop
a manifesto. I am sure they get people to help them to develop the manifesto but that is a political
thing and it is a four-year manifesto. Science and technology goes beyond four years. So they would
want to do things within the four years and these are the guys who are not very much science and
technology minded. I don’t like the issue of party manifestos because they are for four years and
there is no continuation with the work. Another government comes and disregards what another
government has done, then it does not help the country. (Respondent R16)
[S]ometimes we have not engaged the policymakers as much as we should in order for them to also
know the research that has been done, the findings and the need to change policy (Respondent
R16).
Table 8.22 below provides a summary of the mechanisms of engagements with different
stakeholders, most perceived benefit of engagement, most common stage of involving stakeholders
in the research process and the most common reason for non-use of research findings by different
stakeholders. These findings as discussed in the previous sections, are directly in agreement with
the literature (see Humphries, 2014; Oliver et al., 2014; Sedlacko et al., 2013) and therefore are
adopted in the framework for institutionalisation of research uptake and utilisation. The framework
which proposes pathways, mechanisms and channels of engagement with stakeholders is
ultimately geared towards optimum research uptake.
Stellenbosch University https://scholar.sun.ac.za
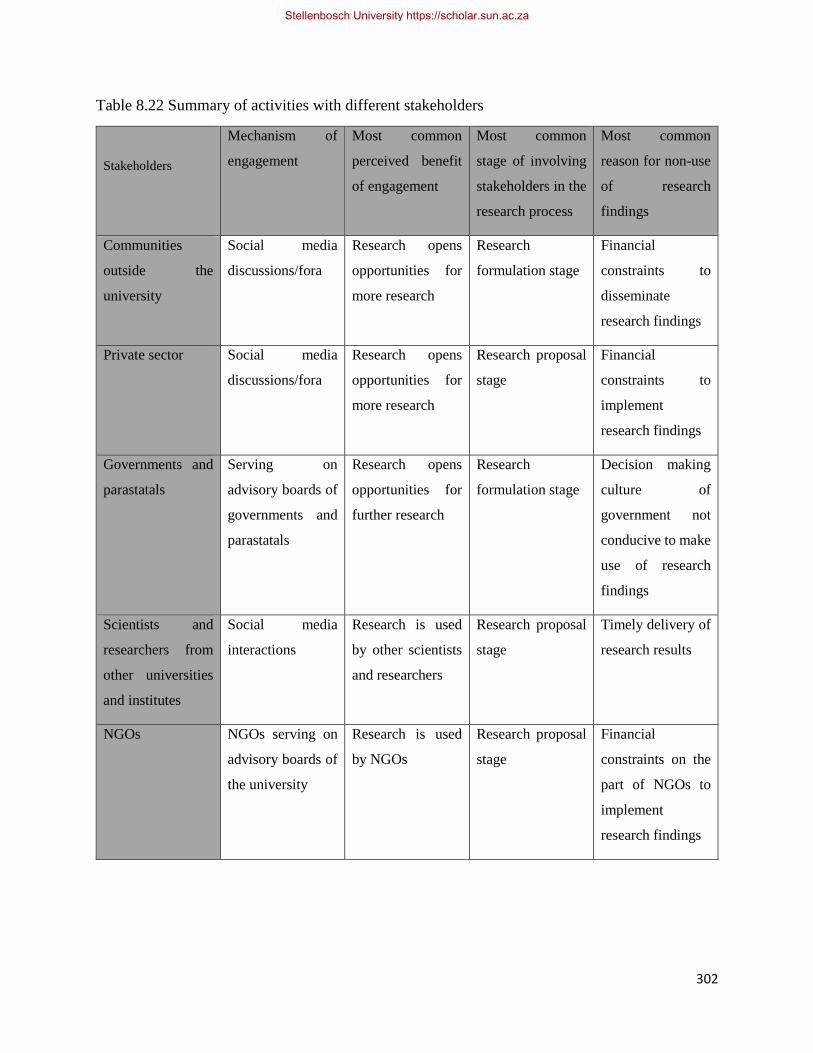
302
Table 8.22 Summary of activities with different stakeholders
Stakeholders
Mechanism of
engagement
Most common
perceived benefit
of engagement
Most common
stage of involving
stakeholders in the
research process
Most common
reason for non-use
of research
findings
Communities
outside the
university
Social media
discussions/fora
Research opens
opportunities for
more research
Research
formulation stage
Financial
constraints to
disseminate
research findings
Private sector Social media
discussions/fora
Research opens
opportunities for
more research
Research proposal
stage
Financial
constraints to
implement
research findings
Governments and
parastatals
Serving on
advisory boards of
governments and
parastatals
Research opens
opportunities for
further research
Research
formulation stage
Decision making
culture of
government not
conducive to make
use of research
findings
Scientists and
researchers from
other universities
and institutes
Social media
interactions
Research is used
by other scientists
and researchers
Research proposal
stage
Timely delivery of
research results
NGOs NGOs serving on
advisory boards of
the university
Research is used
by NGOs
Research proposal
stage
Financial
constraints on the
part of NGOs to
implement
research findings
Stellenbosch University https://scholar.sun.ac.za

303
CHAPTER 9 – CONCLUSIONS AND RECOMMENDATIONS
9.1 Introduction
This chapter presents the contribution this study makes to the body of knowledge regarding
research uptake and utilisation, and proposes a framework for institutionalising research uptake,
in particular, at KNUST. The framework is intended to provide policy direction for KNUST and
HE management in general on how research uptake can be integrated into the institutional research
cycle and thus institutionalised. It suggests various pathways by which research uptake
management can be improved. Additionally, the chapter concludes with some challenges to the
study and suggests areas for further studies in the area of research uptake and utilisation in Ghana.
9.2 Proposed framework for research uptake
As discussed in Chapter 2 of the current study, different authors have outlined different
frameworks and strategies with implication for research uptake. The current findings, outlined in
details below, fall in line with discussions from the literature and covers the university’s mission
and vision (Lavis & Robertson, 2003); research policy (Lavis & Robertson, 2003); research
stakeholders or users (Jacobson et al., 2007; Mitton et al., 2007); capacity building (Andrews,
2012); communicating research or accessibility of research (Andrews, 2012); budgeting for
research (Andrews, 2012); and M&E of uptake (Eagar et al., 2003; Lavis & Robertson, 2003;
Mitton et al., 2007). More recent works by Ellen et al. (2011) and Grobbelaar & Haber (2014) gave
further impetus to earlier research in the field of knowledge utilisation. It is from these elements
of the knowledge utilisation literature and the findings from the survey that the current study
proposes a model framework for RU.
At the initial stages of the DRUSSA programme KNUST only had a draft research policy to govern
its research agenda. Many researchers in the university were not privy to the content of the draft
policy. It was then the case that research was conducted for its own sake and purposely for
publication in refereed journals with the ultimate aim of career progression or promotion. With
time the term research uptake has taken root and the consciousness that research must be sent out
to end users has caught on with many researchers. With a strong advocacy for a policy regime as
far as research is concerned the KNUST had to come onboard. The university now has an approved
research policy which has aspects of RU/RUM incorporated in it. As discussed in Chapter 4 there
Stellenbosch University https://scholar.sun.ac.za

304
has been improvement in the research efforts of the university with the establishment of an office
for grants and research which ensures compliance to the prescriptions of the research policy. From
the survey and subsequent interviews this author affirms the importance of policy in the RU/RUM
process (Lavis & Robertson, 2003). It is with this view that an institutional policy is a key
component of the proposed RU framework.
The overarching aim of this study was to propose a research uptake framework to provide the
guiding principles to RU for the operations of the university, in particular, the KNUST. The key
issue that this author sought to address is how research can be utilised. Various factors have been
outlined which have the likelihood to determine the extent to which any research finding can be
used. Quite apart from the stated barriers during the survey and subsequent interviews (see sub-
section 9.4.2) there are other factors relating to the patterns underlying the research, the nature of
the research and the target audience (Ashley, 2009). These other determinants of research success
which have the potential of influencing the adoption of research findings have to be taken into
consideration. Mitigating actions are therefore necessary to ensure that the barriers to RU are
reduced to the barest minimum (Humphries, 2014; Oliver et al., 2014). The proposed research
uptake framework therefore gave due recognition to the issue about barriers outlined in sub-section
9.4.2.
The need for monitoring and evaluation of the entire research cycle has been emphasised every
now and then by various authors (Eagar et al., 2003; Lavis & Robertson, 2003; Mitton et al., 2007).
The current study confirms and reaffirms the need for monitoring and evaluation due to
uncertainties that are likely to crop up during the research process. As and when these issues crop
up during the research process the necessary adjustments could be made in the form of researcher’s
or university actions to limit or mitigate the effects of these opposing factors. Sub-section 9.4.3
outlines some university actions necessary to facilitate the RU/RUM process. It is with this view
that the proposed framework incorporates monitoring and evaluation as a searchlight for the entire
framework.
The RU process and the efforts to transmit research findings to possible users may be compared
to components of the diffusion process, namely, “the innovation, the social system through which
Stellenbosch University https://scholar.sun.ac.za
305
the innovation moves, the communication channels of that system, the time it takes for an
innovation to spread through the social system, and the adoption of the innovation by the intended
recipients” (Ashley, 2009:37). Similarly, for research findings to be used it must go through certain
communication channels within and outside of the university. This include stakeholder
engagement through dialoguing with the eventual users of the research findings. Also, due
cognisance must be given to the social system within which the implementation is expected to take
place. The social system may determine the language and the style of communicating the research
findings (Andrews, 2012). The language in which the research findings is communicated is very
necessary for understanding, appreciation and acceptance of research findings. This brings to the
fore the need for capacity building in areas such as science communication, dissemination and
negotiation skills.
According to Ashley (2009), the time it takes for an innovation to spread through a social system
is another component of the diffusion process. Some research findings will take a longer period
for its adoption and implementation while others take shorter periods. The timing and usage
depend on several factors such as the nature of the research findings and the context of its
application. These factors have the potential to slow down the research and uptake process and
therefore must be attended to as part of the university actions to mitigate the barriers and facilitate
the research process.
It must be acknowledged that not all research findings will be fully adopted in their entirety. There
is the possibility that parts of the research findings could be applicable in different contexts. In
some cases, research findings could be used only after some modification has taken place in order
to make them suitable for a particular system. This reinforces the need for constant engagement
with stakeholders by involving them throughout the research process as determined during the
survey. The need for modification of research findings before usage is comparable to the process
of adaptation in the diffusion process proposed by Rogers (2003).
The perceived characteristics of the research findings also has an influence on the extent of its
adoption or adaption by the eventual users. These characteristics must be such that it offers better
alternatives and must be culturally relevant to the users. The research findings must also be
compactible to the practices within the context of its application, that is, the social system within
Stellenbosch University https://scholar.sun.ac.za
306
which the research is applied. It is therefore necessary ensure that any research finding intended
for a particular audience have a relative advantage over what is already in practice (Ashley, 2009).
Once again, with a good monitoring and evaluation system these issues can be detected and
addressed. Per the proposed RU framework emphasis is placed on the issue of monitoring and
evaluation.
There is the need to emphasise the need for stakeholder involvement as an important factor in the
research uptake process. As already argued, the eventual users of research findings cannot be left
out of the research process. This was confirmed during the survey and interviews and falls directly
in line with the literature (Jacobson et al., 2007; Mitton et al., 2007). As argued by Gabbey and Le
May (2004), “successful implementation of research evidence will require a deeper understanding
of the processes of collective “sense making” by which knowledge, both explicit and tacit and
from whatever source, is negotiated, constructed, and internalised in routine practice” (Gabby &
Le May, 2004:1013). Collective sense making calls for active interactive and continuous
engagement with stakeholders so as to bring about the adoption or adaption of research findings
for application within systems which may already have existing practices. Some stakeholders may
be holding on to their own conceptions or misconceptions and practices. Some of these previous
knowledges may be in conflict with scientific knowledge arising out of research and thus could be
a barrier to receiving new ideas. It is with this view that this author supports the idea of active
stakeholder engagement. One other reason for the need for effective stakeholder engagement is
about ownership of research findings. Involving stakeholders in the research process at appropriate
points makes them feel part of the process and ownership of the findings (Jacobson et al., 2007;
Mitton et al., 2007). The mechanisms of engagement observed during the survey and interviews
are outlined in sub-section 9.4.1 above. In proposing the RU framework all the above factors were
taken into consideration so as to ensure that research is used by communities of need.
From the foregoing discussion this author proposes the framework below. The proposed
framework covers the essential focal areas needed for a policy framework for the university, the
key features being the following:
• a need for an institutional research policy that fully enforces RU and RUM;
• making research accessible to stakeholders;
Stellenbosch University https://scholar.sun.ac.za
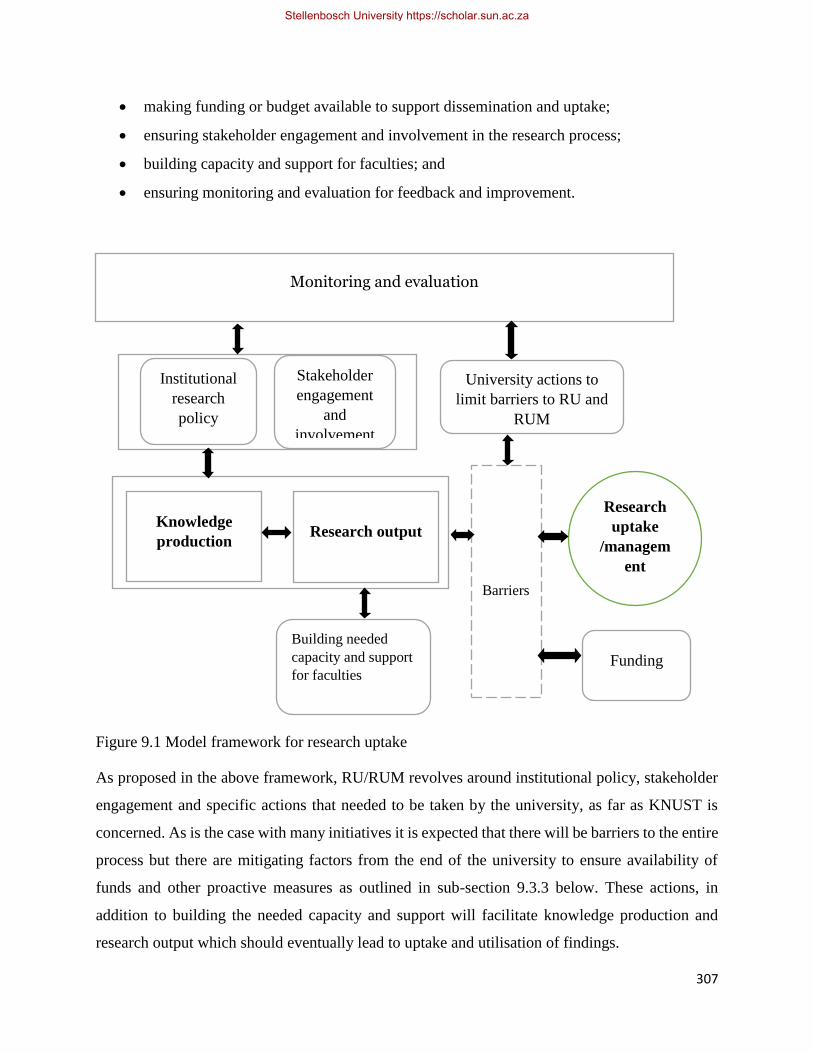
307
• making funding or budget available to support dissemination and uptake;
• ensuring stakeholder engagement and involvement in the research process;
• building capacity and support for faculties; and
• ensuring monitoring and evaluation for feedback and improvement.
Figure 9.1 Model framework for research uptake
As proposed in the above framework, RU/RUM revolves around institutional policy, stakeholder
engagement and specific actions that needed to be taken by the university, as far as KNUST is
concerned. As is the case with many initiatives it is expected that there will be barriers to the entire
process but there are mitigating factors from the end of the university to ensure availability of
funds and other proactive measures as outlined in sub-section 9.3.3 below. These actions, in
addition to building the needed capacity and support will facilitate knowledge production and
research output which should eventually lead to uptake and utilisation of findings.
Research
uptake
/managem
ent
Knowledge
production
Institutional
research
policy
Stakeholder
engagement
and
involvement
Funding
Research output
Barriers
Monitoring and evaluation
Building needed
capacity and support
for faculties
University actions to
limit barriers to RU and
RUM
c
c c
c
c
Stellenbosch University https://scholar.sun.ac.za
308
9.3 Demographic deductions
This sub-section outlines the various findings and deductions from the responses regarding
demographics.
9.3.1 Research outputs
Research outputs over the last three years have been mainly from articles published and
presentations at conferences, predominantly to academic audiences.
9.3.2 Gender and research output (articles published)
According to the ratios there is a balance of production levels between male and female
researchers. Female academic staff members are as productive or research active as their male
counterparts. However, generally speaking, male researchers seem to be slightly more productive
than female researchers.
9.3.3 Age and research output
The average age of respondents is 48, which falls within the most productive age group. The age
bracket of 46-50 is the most productive in terms of research output.
9.3.4 Age and academic qualification
Most professors and senior lecturers or senior research fellows are in the age bracket of 56–60.
9.4 Towards a framework for research uptake
This section presents findings for the four main thematic areas that contributed to the proposed
framework for research uptake, illustrated in Figure 9.1 above. The thematic areas are: stakeholder
engagement, mechanisms and channels of engagement, facilitators and barriers to research uptake,
and university actions to facilitate research uptake. These thematic areas cover aspects of the
capacity areas for policy as outlined in the framework component, which deals with the question
of how an organisation can transfer its knowledge to user stakeholders effectively.
9.4.1 Mechanisms and channels of engagement
This sub-section outlines the findings that are related to the forms and focus of interaction and
engagement, specifically the channels and mechanisms of stakeholder engagement in line with
Stellenbosch University https://scholar.sun.ac.za

309
stakeholder engagement and involvement suggested in the framework. The findings were as
follows:
1. The extent and usage of research findings is dependent on the extent to which stakeholders
are engaged. If stakeholders are not involved at some point in the research process, their
interest in the research finding is low. Engaging stakeholders from the initiation of the
research process therefore makes them part of the process and their input (if valued) leads
to acceptance and use of the research findings.
2. In order to engage with various stakeholders there are a number of channels through which
this can be done. Researchers adopt the most convenient means to reach out to their
stakeholders and the mode of engagement would under normal circumstances depend on
the kind of stakeholders involved. Researchers at KNUST mainly engage through
presentations at conferences and workshops, predominantly to academic audiences.
3. Researchers of professorial level engage more with stakeholders at policy level and through
collaborations, more than senior lecturers or senior research fellows and the junior
academics.
4. Researchers have their personal goals for researching issues in their fields of endeavour.
The primary goal of researchers at KNUST is not purposely for solving local and national
problems, but for personal career enhancement. Most researchers in the university aspire
to advance in their careers and since one key criterion for promotion is publication in
journals, many aim for that without necessarily considering local and national needs.
5. Researchers at KNUST generally do not prioritise solving environmental and social
problems, influencing policy, influencing practice and solving immediate and/or technical
problems. Although research is intended to solve problems, including environmental and
social problems, researchers at KNUST rarely consider the dissemination and subsequent
use of their research in these priority areas. What matters to the researchers is the
publication of their findings.
Engagements with other scientists and researchers
6. Researchers mostly engage with scientists and researchers from other universities and
institutes by attending conferences and organising workshops with or for other scientists
Stellenbosch University https://scholar.sun.ac.za
310
and researchers. They engage with other stakeholders, but not on the same scale as with
other scientists and researchers from other universities and institutes.
7. Researchers consider engagement with other scientists and researchers as very beneficial,
because their research is used by the other researchers. This opens opportunities for further
research, as well as opening avenues for collaboration which leads to funding
opportunities.
8. With regard to the stages at which researchers involve their stakeholders in the research
process, researchers usually involve other scientists and researchers in their research
process during the research formulation stage. During the design of the research project the
researcher and the stakeholder both have a stake in the findings and therefore their level of
involvement in the research process is high, beginning mostly from the research
formulation stage to the report writing stage.
9. The most common reasons why other scientists and researchers do not use research results
are: timely delivery of research results, research findings are not disseminated and
resistance to change. A lack of contact between researchers and the users of findings among
other scientists and researchers featured as one of the common barriers. A lack of funding
or insufficient funds is also a problem.
Engagements with communities outside the university
10. The three most common mechanisms of engagement with communities adopted by
researchers at KNUST are: conducting research in communities, drawing on community
advisors for support, strategy and advice, and using community sites for teaching and
learning.
11. Researchers have the perception that it is very beneficial to engage with communities,
because it opens opportunities for more research, transfers research to practice and solves
community-based problems. In reality, however, the level of engagement by researchers
with communities outside the university is very low.
12. Researchers always involve communities in their research at the research formulation and
proposal stages.
Stellenbosch University https://scholar.sun.ac.za
311
13. The most common reasons why communities do not use research findings that could be
beneficial to them are financial constraints on the part of researchers to disseminate
research findings to communities, financial constraints on the part of communities to
implement research findings and a lack of human resource capacity among researchers to
support and disseminate research.
Engagements with government and parastatals
14. Researchers hardly engage directly with government and parastatals on a regular basis,
though researchers believe that it is very beneficial to engage with these groups for the
following reasons: the engagement opens opportunities for further research, their research
is used by government and parastatals, their research influences policies and decisions by
government and parastatals, and provides opportunities for funding.
15. The few researchers who engage with governments and parastatals do so by serving on
advisory boards, organising workshops or conferences with or for these bodies and by
providing consultancy services.
16. The three most common reasons why governments and parastatals do not use research
findings that could be beneficial to them are that the decision-making culture of
government is not conducive to make use of research findings, political influence plays a
far greater role than evidence to make decisions, and government and parastatals resisting
change.
Engagements with the private sector
17. Researchers engage the private sector, including industry, mainly through the development
of proposals with or for the private sector, providing consultancy services and by attending
conferences with the private sector.
18. The most often-cited reasons for engagement with the private sector are that it opens up
opportunities for more research and thus opportunities for funding, to transfer research into
practice and opens avenues for collaboration.
19. Researchers always involve the private sector at the research proposal stage, and to a lesser
extent the research formulation stage, or throughout the entire research process. Involving
Stellenbosch University https://scholar.sun.ac.za

312
the private sector throughout the research process makes adoption of findings easier and
builds confidence in the research findings.
20. The most common reasons why the private sector does not use research findings have been
attributed to financial constraints to implement research findings, a lack of personal
motivation by researchers to disseminate research findings and a lack of contact between
researchers and users of research findings within the private sector.
Engagements with NGOs
21. NGOs are the group of stakeholders which is the least engaged with by researchers.
Researchers engage NGOs annually through conferences organised by the NGOs,
conducting commissioned research and providing consultancy services for the NGOs.
22. Researchers perceive as very beneficial their research being used by NGOs to support
programme implementation. In addition, their research opens avenues for further research,
as well as transferring research to practice.
23. Researchers at KNUST who engage with NGOs usually involve them at the research
formulation stage. Stakeholder involvement in the research process is key to research use,
because it brings about acceptance and the necessary buy-in.
24. The reasons why NGOs do not use research results that could be beneficial to them are:
financial constraints on the part of NGOs to implement research, a lack of contact between
researchers and users of findings among NGOs, and misunderstanding and wrong
perceptions regarding research results by NGOs.
9.4.2 Facilitators and barriers to research uptake
Listed below are the findings related to barriers and facilitators to research production,
dissemination, uptake and utilisation. As illustrated in Figure 9.1 above, the barriers oppose the
entire research uptake process. These include institutional and systemic barriers that inhibit the
developmental activities of the university. For optimum research uptake the facilitators ought to
be enhanced while efforts are made to limit the barriers. The findings so far are as follows;
1. Research findings, when available, must necessarily be supplied to the end users. It was
observed that there are research findings available which could be useful to stakeholders,
Stellenbosch University https://scholar.sun.ac.za
313
but these findings are not disseminated to them. The institution and researchers do not have
adequate avenues for dissemination.
2. End users of research must understand what the research is about and it must be
communicated to them in a language with which they are familiar.
3. Existing links between researchers and the users of research, including policy-makers, are
weak. This reinforces the need for stakeholder engagement.
4. The main motivation of researchers at KNUST to do research is career progression or for
promotion. Other factors and mechanisms that lead to research uptake can also be linked
to the promotion criteria or rewarded in other ways.
5. Researchers hardly consider the uptake of their research as a priority. This calls for the
setting of priorities and institutional policies to promote and push for research uptake.
6. Until recently there has been no policy regime in the university that seeks to promote
research uptake. A recently promulgated research policy provides that research uptake be
given the needed recognition.
7. Academic qualification has a direct bearing on research output. Researchers with terminal
degrees, i.e. doctorate degrees, are more research active than those with master’s degrees.
8. Female academic staff members are almost equally research active and productive
compared to their male counterparts, though the male counterparts seem to be slightly
ahead. With equal incentives and resources female academic staff will do equally well.
9. Age and experience of researchers have a direct bearing on research output. This explains
why professors, senior lecturers and equivalents are producing more research outputs than
the junior ranks. These professors and experienced researchers should be encouraged to
team up with the less experienced staff members in research activities.
10. Professors shift their focus from publication in journals to high level engagements with
stakeholders, such as consultancies and conference presentations. Qualification and
experience lead to better engagement and also have implications for mentoring and
training.
Stellenbosch University https://scholar.sun.ac.za

314
11. There are mechanisms and channels of engagement with stakeholders that facilitate
research success and impact as discussed in 9.3.1 above.
12. The most common reasons why stakeholders do not use research findings that could be
beneficial to them were discussed in 9.3.1 above. Corresponding facilitators, as suggested,
are needed to overcome these barriers.
13. For research to be accepted and used by stakeholders they must be involved throughout the
research process.
9.4.3 University actions to facilitate research uptake
This sub-section outlines the findings related to internal and external drivers of focus, the nature
and level of knowledge production and how the university can relate with stakeholders. These
university actions are key to the research uptake and management process as illustrated in the
proposed framework in Figure 9.1 above. The possible actions include the following.
1. The university (KNUST) has the potential and can play a key role in local and national
development, therefore the university must identify national and local needs for possible
attention.
2. The research policy of the university must spell out modalities to link research to the
developmental goals of the nation and this must be incentivised.
3. There is adequate research already completed, as well as ongoing, available in the
university with the potential to resolve local and national problems. The university must
ensure that these research products are publicised in newspapers, through radio
programmes, during open days, fairs, symposia, exhibitions, dissemination workshops and
conferences, all in a bid to showcase university research to stakeholders.
4. The criterion that requires publication for promotion motivates researchers to focus on
advancement of knowledge for career progression, but the university should also recognise
the need for dissemination and actions that ensure that research reaches the end user.
5. The university, as a research but teaching institution, should emphasis teaching through
research. This can be done by ensuring that lecturers, or researchers especially, conduct
research in their areas of specialisation. Research must be in line with the teaching
Stellenbosch University https://scholar.sun.ac.za
315
curriculum, so that in the long run the findings and procedures will benefit the students
who are also stakeholders in the knowledge production and utilisation chain.
6. All research conducted in the university must be documented and kept in online
repositories and open access journals. For the sake of public consumption research must
be documented in a language that can be understood by key stakeholders. The university
must consider translating publications, especially of research findings meant for
indigenous people, into local languages and with graphics that the local people can read
and understand. Communicating scientific research is important and must be done in such
a manner that people who are not scientists can understand the key concepts.
7. The university should make funds available for sponsorship to attend conferences,
disseminate research and for the procurement of essential laboratory equipment and
consumables to facilitate research.
8. KNUST has research centres attached to each of the colleges responsible for research and
innovations for the public good. To be able to carry out their mandate, these centres should
be well resourced and tasked to link up with industry, government and other stakeholders
to address societal challenges in a practical way.
9. The university should set targets for research that addresses local and national problems,
with sources for funding and purposefully assign these to specific departments.
Government and other beneficiaries should be made aware of this and must get involved
in the process in order for them to be aware of the existence of that knowledge and the
suitability of that knowledge to address societal challenges.
10. In view of 9 above the university must encourage and reward developmental and applied
research which have the potential of influencing practice and solving environmental and
social problems.
11. The identified strengths, focus and engagement practices of the different faculties must be
strengthened and channelled. The university must put in place measures to build the
capacities of faculties that are weak in their delivery of teaching, research and extension of
research to communities of need. Continuous professional development must be an issue
of policy.
Stellenbosch University https://scholar.sun.ac.za
316
9.4.4 Pathways to research uptake
This sub-section provides pathways for research uptake with an illustration derived from a network
of ATLAS.ti. In order for research to be utilised there are various pathways to follow. Many drivers
necessary for research uptake and utilisation were identified in the literature and the survey. These
drivers facilitate and serve as links for ‘sustained interactivity’ between the producers and users of
knowledge (Andrews, 2012; Lavis et al. 2003; Mitton et al. 2007). Along these same lines
Jacobson et al., (2003) proposed that, key to the research uptake process is the need for
interpersonal links. These links provide for an effective interaction between all the actors in the
research production and utilisation process. Figure 9.2 below gives an illustration that identifies
some interconnections between the essential pathways and drivers necessary for research uptake
and utilisation. The illustration below also covers the essential processes that one needs to go
through from knowledge production to knowledge utilisation (Becheikh et al., 2010) including the
exchanges between researchers and those who apply research. As far as this current study is
concerned, within the research cycle, attention needs to be given to the following drivers of
research uptake; research output, stakeholders engaged with, mechanisms of engagement;
importance of engagement, beneficiaries of research, research use and impact, channels of
dissemination, challenges to RU and university actions to facilitate RU. Figure 9.2 below provides
an illustration that establishes the linkages between these actors of the research production and
dissemination process.
Stellenbosch University https://scholar.sun.ac.za
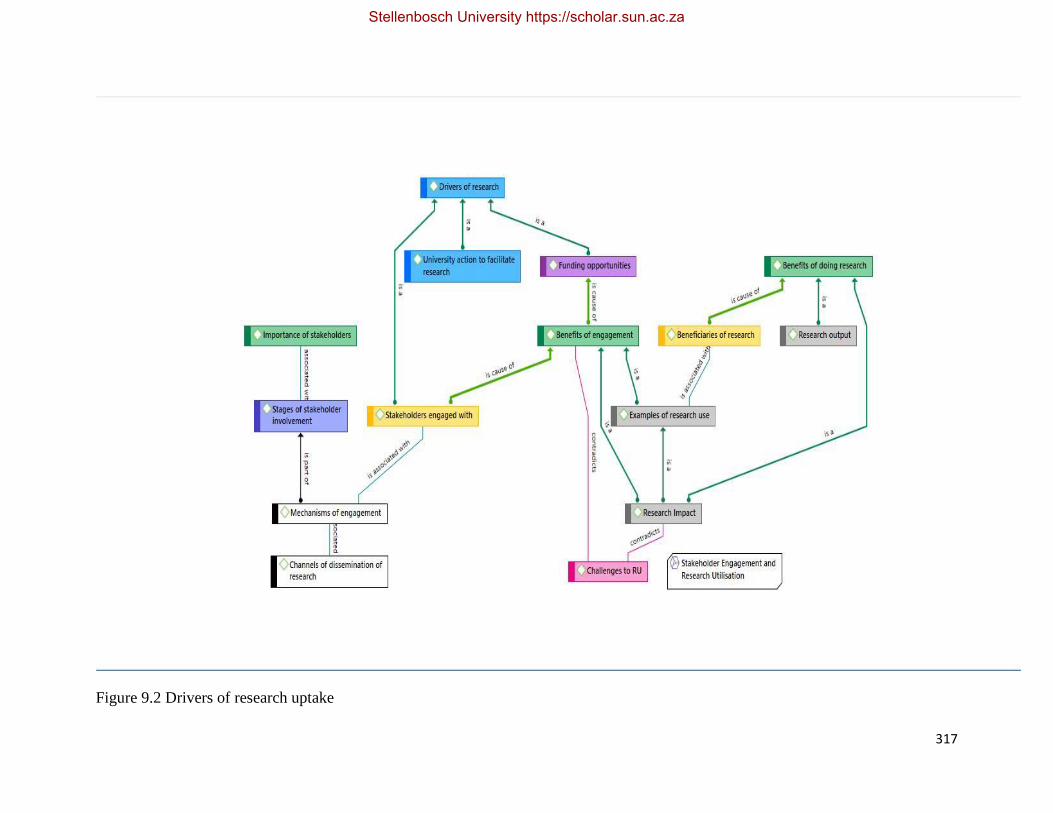
317
Figure 9.2 Drivers of research uptake
Stellenbosch University https://scholar.sun.ac.za
318
As illustrated in Figure 9.2 above there are facilitators, mechanisms and channels as well as barriers to research
uptake. These are interconnected and influence each other as discussed in Chapters 7 and 8 of this study. For
example, the various university actions are intended to facilitate research uptake. Also, the importance of
stakeholders in the research process has been emphasised. The linkages and their effects on each other were
taken into consideration in the proposed framework for research uptake.
9.5 Conclusions of the study
Based on the findings from the study the following conclusions were drawn.
1. Female academic staff members are as productive or research active as their male counterparts,
although generally speaking male researchers seem to be slightly ahead.
2. There is an indication of an aging staff complement, and therefore there is the need to put into place
measures to attract young staff members. This is an issue that ought to be addressed by management,
because of its negative impact on training, promotion of knowledge and service to the community.
3. The performance in terms of research output differs for different fields, reiterating the need to have
tailor-made strategies and incentives for research uptake for the different areas of study.
4. Professors or senior lecturers and equivalents are more productive in research output than lecturers,
assistant lecturers and equivalents. This has implications for development initiatives and continuous
professional development of researchers.
5. Professors turn their attention towards other productive areas such as stakeholder engagement for
consultancies, mentoring and supervision of postgraduate students.
6. It can also be deduced that whereas professors engage mainly with government and MDAs, followed
by the private sector, associate professors engage almost equally with all stakeholders. Senior lecturers
and equivalents focus on engagement with the private sector while lecturers and equivalents engage
more with NGOs. Assistant lecturers and equivalents engage mainly with NGOs.
7. There is every indication that researchers at KNUST engage mostly with scientists and researchers
from other universities and institutes, followed by communities outside the university, the private sector
(industry, large firms, SMMEs), government (MDAs) and parastatals, with the group least engaged
being NGOs.
Stellenbosch University https://scholar.sun.ac.za
319
8. The extent and usage of research findings is dependent on the extent to which stakeholders are engaged.
Stakeholders’ input into the research process is key to the acceptance and adoption of research findings.
9. The most common channel of engagement by researchers at KNUST with stakeholders is through
presentations at conferences and the organisation of workshops to predominantly academic audiences.
10. The main barriers to research uptake are financial and capacity constraints to disseminate research,
inadequate engagement with stakeholders, and the initial absence of an institutional policy framework
to drive university research.
11. The primary goal of researchers at KNUST is publication in refereed journals with the aim of career
enhancement. Research is thus largely not for the purpose of addressing societal problems.
12. As far as engagement by academic position is concerned researchers of senior ranks engage at high
levels the most with different stakeholders.
13. Faculties engage different stakeholders at different levels depending on the activities involved.
9.6 Recommendations
Listed below are the recommendations made based on the results of the current study.
1. University-wide publicity, dissemination workshops, exhibitions, fairs, and open days are needed to
create stakeholder awareness of the existence and availability of research findings.
2. Different stakeholders have different operational procedures and this must be taken into consideration
during stakeholder engagement. It is necessary to consider the specific needs of stakeholders so as to
adopt the appropriate mechanism of engagement.
3. There is the need for an active continuous interaction between researchers and users of research in order
to build the needed confidence and the buy-in for use of research findings. Continuous engagement
allows for stakeholder input, refinement of the research and subsequently the adoption and use of the
findings.
4. Staff engagement procedures, especially at management level, must consider expertise in research
uptake. It has been the case that most researchers and management staff lack capacity in research
management, resulting in a lack of attention to research uptake and research uptake management. For
those already engaged in the service of the university, retraining in the area of research management is
necessary as part of continuous professional development.
Stellenbosch University https://scholar.sun.ac.za
320
5. There must be an emphasis on graduate training in order to produce research that is cutting edge enough
for local and national development. The current emphasis on undergraduate recruitment and training
has implications for future research output. Although there may be some good undergraduate projects
available, graduate training has much to offer in terms of cutting-edge research with the potential to
address societal challenges.
6. The university must aim to promote PhD studies as a good channel for research or knowledge
generation and dissemination. Graduate training should be designed in such a way that research uptake
is made an integral part of the training. Students can be encouraged to undertake projects with
stakeholders within the industrial sector, with government agencies, and in communities.
7. There is the need to redefine the roles and responsibilities of researchers to include research
dissemination and uptake. Letters appointing staff must categorically state the duties to include research
dissemination in addition to teaching and service to communities.
8. The promotion criteria must acknowledge research that has been utilised, more than those which are
only published without any significant citation index or impact.
9. There must be policies and incentives that promote a shift towards using research to solve local and
national problems.
10. There is the need for a budget line to provide the necessary funds and resources for research
dissemination and uptake. The university should consider additional linkages with stakeholders to set
up research chairs to bring in the needed funding for research.
11. The Offices of Grants and Research of the university must ensure that research proposals which include
dissemination and uptake are accorded more support than those which do not go further than publication
in journals.
12. Research findings must be made relevant to communities in need. Stakeholder demand-driven research
has greater potential for uptake and utilisation, and therefore communities in need ought to be consulted
in any attempt to address their needs.
13. Research uptake management capacity should be built for top level HE managers to oversee offices of
grants and research in the university. There must be programmes for continuous professional
development to raise the calibre and competence of staff for good research output.
Stellenbosch University https://scholar.sun.ac.za
321
14. Researchers should team up and work with government at senior ministerial level for evidence-
informed policymaking. The same principle can be applied to other stakeholders.
15. For stakeholders to accept and adopt research findings they must be involved in the research process at
some point in time, especially, during the research formulation and proposal stages.
16. Institutional research centres must be made responsible for research and innovations meant for the
public good. To be able to carry out their mandates, these centres should be well resourced and tasked
to link up with industry, government and other stakeholders to address societal challenges practically.
17. The university should set targets for research that address local and national problems, find sources for
funding and purposely assign these to specific departments according to their strengths. Government
and other beneficiaries should be made aware of this and involved in the process in order for them to
be aware of the existence of that knowledge and the suitability of that knowledge for addressing societal
challenges.
18. Research collaboration, conferences and workshops are the preferred mechanisms of engagement
through which research uptake can take place. The university should take advantage of this to ensure
that the needed resource support is provided for dissemination and eventual uptake of research findings.
9.7 Challenges to the study
A few limitations encountered during the study are that:
Available literature is not explicit in terms of the research uptake and utilisation strategy for Sub-Saharan
African HEIs. Most of the available pieces of literature were on knowledge production and utilisation in foreign
contexts.
9.8 Future studies
A study may be necessary to look at the types of research taking place in the university and their impact, the
quality of research and the types of journals in which researchers are publishing. Furthermore, there is the need
to do a tracer studies of the impact of research conducted by researchers of KNUST. Research impact
assessment is necessary for improving the research uptake management system of the university.
There is also the need to investigate researcher’s perception and understanding of what constitutes service to
community and how these could be given full recognition in the university’s scheme of affairs.
Stellenbosch University https://scholar.sun.ac.za
322
LIST OF REFERENCES
(AUP) Africa Union Commission 2015. Agenda 2063: The Africa we want. Available online at
http://www.un.org/en/africa/osaa/pdf/au/agenda2063.pdf
Ajayi, J.F.A., Goma, L.K.H. & Johnson, G.A. 1996. The African experience with higher education. Ohio
University Press, Scott Quadrangle, Athens, OH 45701.
Amara, N., Quimet, M. & Landry, R. 2004. New evidence on instrumental, conceptual and symbolic utilization
of university research in government agencies. SAGE journals. 26(1) Retrieved from
https://journals.sagepub.com/doi/abs/10.1177/1075547004267491. [Accessed 7 December 2018]
Andrews, K. 2012. Knowledge for purpose: Managing research for uptake – a guide to a knowledge and
adoption program. Department of Sustainability, Environment, Water. Population and Communities,
Canberra. Retrieved from http://cutlass.deh.gov.au/biodiversity/publications/pubs/knowledge-for-
purpose.pdf [Accessed 20 September 2016].
Appiah-Adu, K. & Bawumia, M. (Eds.). 2015. Key determinants of national development: Historical
perspectives and implications for developing economies. Oxford: Routledge
Arocena, R., & Sutz, J. 2007. Universities, innovation and development processes in the changing global
economy. In Science, Technology and Innovation Policy, Atlanta Conference on (pp. 1-11). IEEE.
Ashley, S.R. 2009. Innovation diffusion: Implications for evaluation. New Directions for Evaluation, (124):35–
45.
Auranen, O. (2005). Social capital in Mode 1 and Mode 2 knowledge production: A Finnish case study. In
Capitalization of Knowledge Conference: Cognitive, economic, social and cultural aspects, Turin,
Italy. 18-21.
Backer, T. E. 1991. Knowledge utilization: The third wave. Knowledge, 12(3), 225-240.
Bailey, T., & Mouton, J. 2005. A review of models of research utilisation. Sun Press, Stellenbosch.
Baldini, N., Grimaldi, R., & Sobrero, M. 2006. Institutional changes and the commercialization of academic
knowledge: A study of Italian universities’ patenting activities between 1965 and 2002. Research policy,
35(4), 518-532.
Becheikh, N., Ziam, S., Idrissi, O., Castonguay, Y., & Landry, R. 2010. How to improve knowledge transfer
strategies and practices in education? Answers from a systematic literature review. Research in higher
education journal, 7, 1-22.
Belkhodja, O., Amara, N., Landry, R. & Ouimet, M. 2007. The extent and organizational determinants of
research utilization in Canadian health services organizations. Science Communication, 28(3):377–417.
Stellenbosch University https://scholar.sun.ac.za
323
Bloom, D. E., Canning, D., & Chan, K. 2006. Higher education and economic development in Africa (Vol.
102). Washington, DC: World Bank.
Books and Publications Committee. 2015. Criteria for publication in the Journal of Science and Technology
(JUST).
Boshoff, N. 2009. Neo-colonialism and research collaboration in Central Africa. Scientometrics, 81(2):413–
434.
Boshoff, N. 2013. Knowledge utilisation: Key authors and models. Centre for Research on
Evaluation, Science and technology (CREST), Stellenbosch University, South Africa. (36 pp.)
Bowen, S., & Zwi, A. B. 2005. Pathways to “evidence-informed” policy and practice: a framework for action.
PLoS medicine, 2(7), e166.
Bozeman, B. 2000. Technology transfer and public policy: a review of research and theory. Research policy,
29(4-5), 627-655.
Caplan, N. 1979. The two-communities theory and knowledge utilization. American Behavioral Scientist,
22(3):459–470.
Carayannis, E. G., & Campbell, D. F. 2010. Triple Helix, Quadruple Helix and Quintuple Helix and how do
knowledge, innovation and the environment relate to each other?: a proposed framework for a trans-
disciplinary analysis of sustainable development and social ecology. International Journal of Social
Ecology and Sustainable Development (IJSESD), 1(1), 41-69.
Carden, F. 2009. Knowledge to policy: Making the most of development research. IDRC. Retrieved from
https://books.google.com/books?hl=en&lr=&id=Ca1LIT8Zw98C&pgis=1 [Accessed 15 May 2014].
Castells, M. 1994. The university system: Engine of development in the new world economy. In J. Salmi and
A. M. Verspoor, (Eds.), Revitalising Higher Education (pp. 14–40). Oxford: Pergamon.
Castells, M. 2009. Lecture on higher education. Centre for Higher Education Transformation, Cape Town,
August, 7.
Chapple, W., Lockett, A., Siegel, D. & Wright, M. 2005. Assessing the relative performance of UK university
technology transfer offices: Parametric and non-parametric evidence. Research Policy, 34(3):369–384.
Chatelin, Y., Gaillard, J., & Keller, A. S. (1997). The Nigerian scientific community: the colossus with feet of
clay. Scientific Communities in the Developing World, 129-54.
Chaudoir, S. R., Dugan, A. G., & Barr, C. H. 2013. Measuring factors affecting implementation of health
innovations: a systematic review of structural, organizational, provider, patient, and innovation level
measures. Implementation Science, 8(1), 22.
Cherney, A., Povey, J., Head, B., Boreham, P., & Ferguson, M. 2012. What influences the utilisation of
educational research by policy-makers and practitioners?: The perspectives of academic educational
Stellenbosch University https://scholar.sun.ac.za
324
researchers. International Journal of Educational Research, 56, 23-34.
CHIR (Canadian Institute of Health Research). 2005. Knowledge translation. Health Services Policy. Ottawa.
CHSRF (Canadian Health Services Research Foundation). 1999a. African higher education: Challenges for
the 21st century. Higher Education. Retrieved from
http://link.springer.com/article/10.1023/B:HIGH.0000009822.49980.30 [Assessed 10 May 2015].
Teferra, D., & Altbachl, P. G. (2004). African higher education: Challenges for the 21st century. Higher
education, 47(1), 21-50.
CHSRF (Canadian Health Services Research Foundation) (Ed.). 1999. Issues in linkage and exchange between
researchers and decision-makers. Ottawa: Retrieved from https://www.cfhi-
fcass.ca/migrated/pdf/event_reports/linkage_e.pdf .
Cloete, N., Bailey, T., Pillay, P., Bunting, I., & Maassen, P. Universities and economic development in Africa.
2011. Wynberg, SA: Centre for Higher Education Transformation (CHET).
Cloete, N., Maassen, P., & Bailey, T. (Eds.). 2015. Knowledge Production and Contradictory Functions in
African Higher Education. Cape Town: African Minds.
Coleman, J. S. 1986. The idea of the developmental university. Minerva, 24(4), 476-494.
Cordingley, P. 2008. Research evidence-informed practice: Focusing on practice and practitioners. Cambridge
Journal of Education, 38(1):37–52.
Cousins, J.B. & Simon, M. 1996. The nature and impact of policy-induced partnerships between research and
practice communities. Education and Evaluation Policy Analysis, 18(3):199–218.
CSIR (Council for Scientific and Industrial Research). 2017. Mandate. Retrieved from
http://www.csir.org.gh/index.php/about-csir/structure-organisation [Accessed 15 July 2017].
Davis, H.R. & Salasin, S. 1975. The utilization of evaluation. In M. Guttentag & Streuing I.(eds.). Handbook
of evaluation research. Beverley Hills, CA: Sage,.
DFID (Department for International Development). 2013. Research uptake: A guide for DFID-Funded
Research Programmes. London: UKAid.
DRUSSA (Development Research Uptake in Sub-Saharan Africa). 2012. Retrieved
https://www.acu.ac.uk/publication/download?publication=633 [Accessed 15 July 2017].
DRUSSA (Development Research Uptake in Sub-Saharan Africa). 2014. Institutionalising university
research uptake: A framework for strategy. Retrieved from
https://www.acu.ac.uk/publication/download?publication=633 [Accessed 15 July 2015].
DRUSSA (Development Research Uptake in Sub-Saharan Africa). 2015. Development Research Uptake in
Stellenbosch University https://scholar.sun.ac.za
325
Sub-Saharan Africa (DRUSSA)Work Package 5 (WP5). Retrieved from
https://www.acu.ac.uk/publication/download?publication=633 [Accessed 15 July 2015].
Eagar, K., Cromwell, D., Owen, A., Senior, K., Gordon, R. & Green, J. 2003. Health services research and
development in practice: An Australian experience. Journal of Health Services Research & Policy,
8(2):7–13.
Effah, P. & Addae-Mensah, I. 2013. Senior Academic Leadership Training (SALT) Module on Research and
Scholarship. Retrieved from http://www.africanminds.co.za/wp-
content/uploads/2015/07/9781920677893_txt1.pdf [Accessed 15 July 2015].
Eisemon, T.O. & Davis, C.H. 1991. Can the quality of scientific training and research in Africa be improved?
Minerva, 29(1):1–26.
Ellen, M. E., Lavis, J. N., Ouimet, M., Grimshaw, J., & Bédard, P. O. 2011. Determining research knowledge
infrastructure for healthcare systems: a qualitative study. Implementation Science, 6(1), 60.
Estabrooks, C. A., Derksen, L., Winther, C., Lavis, J. N., Scott, S. D., Wallin, L., & Profetto-McGrath, J.
(2008). The intellectual structure and substance of the knowledge utilization field: A longitudinal
author co-citation analysis, 1945 to 2004. Implementation Science, 3(1), 49.
Estabrooks, C. A., Squires, J. E., Cummings, G. G., Teare, G. F., & Norton, P. G. 2009. Study protocol for the
translating research in elder care (TREC): building context–an organizational monitoring program in
long-term care project (project one). Implementation Science, 4(1), 52.
Etzkowitz, H. 2004. The evolution of the entrepreneurial university. International Journal of Technology and
Globalisation, 1(1):64–77.
Etzkowitz, H., Webster, A., Gebhardt, C. & Terra, B.R.C. 2000. The future of the university and the university
of the future: Evolution of ivory tower to entrepreneurial paradigm. Research Policy, 29(2):313–330.
EU (European Union). 2015. Open Innovation 2.0 Digital Agenda for Europe: A Europe 2020 Initiative.
Retrieved from https://eige.europa.eu/resources/digital_agenda_en.pdf [Accessed 15 July 2015].
Falk, E., Harber, T. & Roberts, L. 2014. DRUSSA benchmarking report. Retrieved from
https://www.gov.uk/dfid-research-outputs/drussa-benchmarking-report-2014-summaries-and-
analysis-from-the-2014-drussa-benchmarking-survey-and-leadership-and-benchmarking-conference-
june-2014 [Accessed 15 July 2015].
Faust, D.G. 2010. The role of universities in a changing world. Dublin. Retrieved from
https://www.harvard.edu/president/speech/2010/role-university-changing-world [Accessed 15 July
2015].
Forida, R. and Cohen, W., 1999. Engine or infrastructure? The university role in economic development. From
industrializing knowledge. University–industry linkages in Japan and the United States, pp.589-610.
Stellenbosch University https://scholar.sun.ac.za
326
Gabby, J. & Le May, A. 2004. Evidence based guidelines or collectively constructed “mindlines”?
Ethnographic study of knowledge management in primary care. British Medical Journal, 329(7473),
1013-1016.
Gagliardi, A.R., Brouwers, M.C., Palda, V.A., Lemieux-Charles, L. & Grimshaw, J.M. 2011. How can we
improve guideline use? A conceptual framework of implementability. Implementation Science,
6(1):26-27.
Geuna, A. & Muscio, A. 2009. The governance of university knowledge transfer: A critical review of the
literature. Minerva, 47(1):93–114.
Ghana Health Service. 2017. 2016 annual report. Retrieved from
https://www.ghanahealthservice.org/downloads/GHS_ANNUAL_REPORT_2016_n.pdf [Accessed
23 July 2018].
Gibb, A., Haskins, G. & Robertson, I. 2009. Leading the entrepreneurial university. Retrieved from National
Council for Graduate Entrepreneurship. http://eureka.sbs.ox.ac.uk/4861/1/EULP_-
_LEADERS_PAPER_final_dec_19.pdf pdf [Accessed 23 July 2018].
Gibb, A., & Hannon, P. 2006. Towards the entrepreneurial university. International Journal of
Entrepreneurship Education, 4(1), 73-110.
Gibbons, M. 2013. The rise of postmodern universities: The power of innovation. In D.M. Schreuder (ed.).
Universities for a new world: Making a global network in international higher education, 1913–
2013. Retrieved from https://core.ac.uk/download/pdf/41233627.pdf [Accessed 23 July 2018].
Gibbons, M., Limoges, C., Nowotny, H., Schwartzmann, S., Scott, P. & Trow, M. 1994. The new production
of knowledge: The dynamics of science and research in contemporary societies. London: Sage.
Gjerding, A.N., Wilderom, C.P.M., Cameron, S.P.B., Taylor, A. & Scheunert, K.-J. 2006. Twenty practices of
an entrepreneurial universities. Higher Education Management and Policy, 18(3), 1-28
Graham, I.D., Logan, J., Harrison, M.B., Straus, S.E., Tetroe, J., Caswell, W. & Robinson, N. 2006. Lost in
knowledge translation: Time for a map? Journal of Continuing Education in the Health Professions,
26(1):13–24
.
Grand Canyon University. 2014. Research Policy. Retrieved from
https://www.gcu.edu/sites/default/files/media/Documents/University-Handbooks/University-Policy-
Handbook-2018-2019-Summer.pdf [Accessed 23 July 2018].
Greer, A.L. 1977. Advances in the study of diffusion of innovation in health care organizations. The Milbank
Memorial Fund Quarterly Health and Society, Vol. 55, No. 4 505-532
Grimshaw, J.M., Eccles, M.P., Lavis, J.N., Hill, S.J. & Squires, J.E. 2012. Knowledge translation of research
findings. Implementation Science, 7(1):50-51.
Stellenbosch University https://scholar.sun.ac.za
327
Grobbelaar, S. 2013. Building institutional capacity for research uptake. Retrieved from
https://www.cput.ac.za/storage/research/uptake/building_institutional_capacity_for_research_uptake
.pdf [Accessed 17 August 2017].
Grobbelaar, S. & De Wet, G. 2013. Exploring pathways towards an integrated development role: The
University of Fort Hare. South African Journal of Higher Education, 30(1), .162-187.
Grobbelaar, S. & Haber, T. 2014. Towards the institutionalisation of research uptake in sub-Saharan African
universities. Journal of Higher Education in Africa / Revue de l'enseignement supérieur en Afrique,
14(1)155-181
Grobbelaar, S. & Kirkland, J. 2013. Development research uptake in sub-Saharan Africa. Retrieved from
http://docs.lib.purdue.edu/cgi/viewcontent.cgi?article=1978&context=iatul [Accessed 17 August
2017].
GSS (Ghana Statistical Service). 2017a. Provisional gross domestic product (GDP) for third quarter of 2017.
Newsletter no. B12-2003. Retrieved from http://uis.unesco.org/en/country/gh?theme=education-and-
literacy [Accessed 27 August 2018].
GSS (Ghana Statistical Service). 2017b. Quarterly gross domestic product.. Retrieved from
http://www.statsghana.gov.gh/docfiles/GDP/Quarterly_Gross_Domestic_Product.pdf [Accessed 13
May 2018].
Guston, D. & Keniston, K. 1994. The fragile contract: University science and the federal government.
Retrieved from
https://books.google.com/books?hl=en&lr=&id=08Gc9x3KGSEC&oi=fnd&pg=PR7&dq=71.%09Gu
ston,+D.H+and+Keniston,+K.+(eds)+(1994).+The+fragile+contract:+University+Science+and+the+
Federal+Government.+Massachusetts+Institute+of+Technology.&ots=m2OncTE6Iz&sig=cOrAXY1
-dbJCTxwN10VeVgZX7aE [Accessed 27 August 2016].
Hargreaves, D.H. 1999. The knowledge creation school. British Journal of Educational Studies, 47(2):122–
144.
Havelock, R. G., & Zlotolow, S. 1995. The change agent's guide. Educational Technology. Retrieved from
https://books.google.com.gh/books?hl=en&lr=&id=h-
uIrSJeVyUC&oi=fnd&pg=PR5&dq=Havelock,.+The+change+agent%E2%80%99s+guide+to+innovation&o
ts=n6txDfK9w4&sig=4LaMT7DCNuK02rMJNjtDeH07YPY&redir_esc=y#v=onepage&q=Havelock%2C.%
20The%20change%20agent%E2%80%99s%20guide%20to%20innovation&f=false [Accessed 15 May
2014].
Hemsley-Brown, J. 2004. Facilitating research utilisation: a cross-sector review of research evidence.
International Journal of Public Sector Management, 17(6), 534-552.
Hemsley-Brown, J. & Oplatka, I. 2005. Bridging the research-practice gap: Barriers and facilitators to research
use among school principals from England and Israel. International Journal of Public Sector
Management, 18(5). :424-446. Retrieved from doi: 10.1108/09513550510608886 [Accessed 15 June
Stellenbosch University https://scholar.sun.ac.za
328
2014].
Henk F. M, Valentina M. and Mark A. 2017. Trends in Russian research output indexed in Scopus and Web
of Science. Retrieved from https://arxiv.org/ftp/arxiv/papers/1805/1805.02434.pdf
Hessels, L. K., & Van Lente, H. 2008. Re-thinking new knowledge production: A literature review and a
research agenda. Research policy, 37(4), 740-760.
Hood, P. 2002. Perspectives on knowledge utilization in education. Retrieved from
http://horizon.documentation.ird.fr/exl-doc/pleins_textes/divers11-02/010009929.pdf [Accessed 15
May 2014].
Huberman, M. (1990). Linkage between researchers and practitioners: A qualitative study. American
educational research journal, 27(2), 363-391.
Huberman, M. 1994. Research utilization: The state of the art. Knowledge and policy, 7(4), 13-33.
Humphries, S. 2014. Barriers and facilitators to evidence-use in program management: A systematic review of
the literature. BMC. Health Services Research, 14(1), 171-172. Retrieved from
http://bmchealthservres.biomedcentral.com/articles/10.1186/1472-6963-14-171 [Accessed 20 May
2015].
Innvaer, S. & Vist, G. 2002. Health policy-makers’ perceptions of their use of evidence: A systematic review.
Journal of Health Services Research Policy, 7(4), 239-244. Retrieved from
http://hsr.sagepub.com/content/7/4/239.short [Accessed 20 May 2015].
Jacob, M. 2001. Managing the institutionalisation of mode 2 knowledge production. Science & Technology
Studies 14(2) : 83-100.
Jacobs, K., Jones, C. A., & Modell, S. 2007. Parliamentary financial oversight and accountability in the
Antipodes. APIRA. Retrieved from https://researchbank.acu.edu.au/flb_pub/466/ [Accessed 20
May 2015].
Jacobson, N. 2007. Social epistemology: Theory for the “fourth wave” of knowledge transfer and exchange
research. Science communication, 29(1), 116-127.
Jacobson, N., Butterill, D. & Goering, P. 2007. Development of a framework
for knowledge translation: Understanding user context. Journal of Health Services Research Policy, 8(2),;.94-
99. Retrieved from http://hsr.sagepub.com/content/8/2/94.short [Accessed 12 July 2015].
Jenkins, A. & Healey, M. 2005. Institutional strategies to link teaching and research. Retrieved from
http://www.vision2020.gu.se/digitalAssets/1345/1345048_institutional_strategies.pdf [Accessed 12
July 2015].
KCCR (Kumasi Centre for Collaborative Research in Tropical Medicine). 2017 About us. Available at
https://kccr-ghana.org/about-us/
Stellenbosch University https://scholar.sun.ac.za

329
K4Health. 2015. Research Utilisation Tool Kit. Retrieved from https://www.k4health.org/toolkits/research-
utilization [Accessed 12 July 2015].
Kiefer, L., Frank, J., Di Ruggiero, E., Dobbins, M., Manuel, D., Gully, P. R., & Mowat, D. (2005). Fostering
evidence-based decision-making in Canada: examining the need for a Canadian population and public health
evidence centre and research network. Canadian Journal of Public Health/Revue Canadienne de Sante'e
Publique, 96(3), I1-I19.
Kilgore, S. B., & Pendleton, W. W. 1993. The organizational context of learning: Framework for
understanding the acquisition of knowledge. Sociology of Education, 66(1) :63-87.
Kirkland, J., Mouton, J. & Coates, D. 2010. Communicating Research for Utilisation (CRU): Specialist
professional and institutional capacity building in Sub Saharan Africa. Retrieved from
https://assets.publishing.service.gov.uk/media/57a08af4e5274a27b200087d/CRU_SCOPING_REPO
RT-30July2010.pdf [Accessed 20 May 2015].
Kirst, M.W. 2000. Bridging education research and education policy making. Oxford Review of Education,
26(3/4):379–391.
Kitson, M., 2009. The connected university: Driving recovery and growth in the UK economy. NESTA.
Knott, J. & Wildavsky, A. 1980. If dissemination is the solution, what is the problem? Knowledge: Creation,
Diffusion, Utilization, 1(4):537–578.
KNUST (Kwame Nkrumah University of Science and Technology). 2016. KNUST annual budget 2016.
Printed annually by authority of the university council
KNUST (Kwame Nkrumah University of Science and Technology). 2005. KNUST corporate strategic plan
2005-2014 (PLAN2K14). Published by University Printing Press (UPK), Kumasi
KNUST (Kwame Nkrumah University of Science and Technology). 2012. KNUST draft research policy Not
in print
KNUST (Kwame Nkrumah University of Science and Technology). 2015. KNUST research report 2015.
Published by University Printing Press (UPK), Kumasi
KNUST (Kwame Nkrumah University of Science and Technology). 2016. KNUST research report 2016.
Published by University Printing Press (UPK), Kumasi
Koivula, M., Tarkka, M. T., Simonen, M., Katajisto, J., & Salminen, L. 2011. Research utilisation among
nursing teachers in Finland: a national survey. Nurse Education Today, 31(1), 24-30.
Landry, R., Amara, N. & Lamari, M. 2001. Utilization of social science research knowledge in Canada.
Research Policy, 30(2):333–349. Retrieved from
http://www.sciencedirect.com/science/article/pii/S0048733300000810 [Accessed 20 May 2015].
Stellenbosch University https://scholar.sun.ac.za

330
Larsen, J.K. 1980. Knowledge utilisation: What is it? Knowledge: Creation, Diffusion, Utilization, 1(3):421–
442.
Lauri, M.A., 2011. Triangulation of data analysis techniques. Papers on Social Representations, 20(2), pp.34-
1.
Lavis, J. & Robertson, D. 2003. How can research organizations more effectively transfer research knowledge
to decision makers? Milbank Quarterly, 81(2),.221-248.
Lavis, J.N., Lomas, J., Hamid, M. & Sewankambo, N.K. 2006. Assessing country-level efforts to link research
to action. Bulletin of the World Health Organization, 84(8):620–628.
Lester, R. 2005. Universities, innovation, and the competitiveness of local economies. Retrieved from
http://web.mit.edu/nse/lester/media/LIS05-010.pdf [Accessed 20 July 2015].
Lulat, Y.G.-M. 2007. A history of African higher education from antiquity to the present: A critical synthesis.
The Developing Economies, 45(2):245–248. doi: 10.1111/j.1746-1049.2007.00041_3.x
Marlin-Bennett, R., 2004. Knowledge Power: Intellectual Property, Information, and Privacy. Lynne Rienner
Publishers.
Martin, B. & Etzkowitz, H. 2000. The origin and evolution of the university species. Retrieved from
http://citeseerx.ist.psu.edu/viewdoc/download?doi=10.1.1.599.5719&rep=rep1&type=pdf
[Accessed 13 April 2018].
Mbabane, L.M. 2010. Development university concept document for Higher Education Summit. In Black
Management Forum, CPUT. Bellville. Retrieved from
https://www.cput.ac.za/storage/services/transformation/he_transformation_summit_report.pdf
Menon, A. & Varadarajan, P.R. 1992. A model of marketing knowledge use within firms. JSTOR, 56(4), 53-
71. Retrieved from https://www.jstor.org/stable/1251986?seq=1#page_scan_tab_contents [Accessed 7
December 2018]
Mhlongo, T.P. & Brink, H. 1996. Research utilization. Curationis, 19:6–10. Retrieved from
https://www.k4health.org/toolkits/research-utilization [Accessed 20 July 2015].
Mitton, C., Adair, C. & McKenzie, E. 2007. Knowledge transfer and exchange: Review and synthesis of the
literature. Milbank Quarterly, 85(4), .729-768.
MEST (Ministry of Environment Science and Technology) 2011. National Science, technology and innovation
policy. Retrieve from http://careers.csir.org.gh/images/stories/National-STI-Policy.pdf
MoH (Ministry of Health). 2014. Holistic assessment of the Health Sector Programme of Work 2014. Retrieved
from http://www.mohghana.org/UploadFiles/Publications/Holistic Assessment
2015150706082855.pdf [Accessed 13 April 2018].
Stellenbosch University https://scholar.sun.ac.za

331
MoH (Ministry of Health). 2016. Ghana National Healthcare Policy Strategy 2017–2021 (Vol. I). Accra. doi:
10.1002/ejoc.201200111
Mouton, J. 2008. Africa's science decline: The challenge of building scientific institutions. Harvard
International Review, 30(3), 46.
Mouton, J. 2012. Science utilisation and impact. Stellenbosch: CREST. Retrieved from
http://scholar.sun.ac.za/bitstream/handle/10019.1/101639/Mouton-
crest.pdf?sequence=1&isAllowed=y [Accessed 13 April 2018].
Mowery, D., Nelson, R., Sampat, B. & Ziedonis, A. 2015. Ivory tower and industrial innovation: A university-
industry technology transfer before and after the Bayh-Dole Act. Stanford : Stanford University Press.
Nagtegaal, L. W., & de Bruin, R. E. (1994). The French connection and other neo-colonial patterns in the
global network of science. Research Evaluation, 4(2), 119-127.
Nath, S. & Europe, J. 2007. Final report: Getting research into policy and practice (GRIPP). Retrieved from
http://pdf.usaid.gov/pdf_docs/Pnadk001.pdf [Accessed 11 June 2015].
NCDDR (National Centre for the Dissemination of Disability Research). 1996. Knowledge transfer.
Retrieved from http://ktdrr.org/ktlibrary/articles_pubs/ncddrwork/NCDDR_lit_review_on_dissem.pdf
[Accessed 20 May 2015].
NDPC (National Development Planning Commission). 2006. The Coordinated Programme for Economic
and Social Development of Ghana 2007–2015. Retrieved from https://new-ndpc-
static1.s3.amazonaws.com/pubication/NDP+Framework+Vol+I+LTDO+Feb+1994.pdf [Accessed
03 May 2015].
NDPC (National Development Planning Commission). 2014. The Implementation of the Ghana Shared
Growth and development Agenda (GSGDA) 2010–2013. Annual progress report. Retrieved from
https://s3.amazonaws.com/ndpc-static/pubication/Coordinated+Programme+2007-2015.pdf
[Accessed 23 April 2018].
Nelson, R.R., 2008. Economic development from the perspective of evolutionary economic theory. Oxford
development studies, 36(1), 9-21.
Nicholson-Cole, S. and Whitmarsh, L., 2008. Researching with stakeholders: Lessons from interdisciplinary
climate change research.
Nicolaou, N. & Birley, S. 2003. Social networks in organizational emergence: The university spinout
phenomenon. Management Science, 49(12), 1702-1725
Nieminen, M. 2005. Academic research in change: Transformation of Finnish university policies and
university research during the 1990s. Retrieved from https://uta32-
kk.lib.helsinki.fi/handle/10024/67467 [Accessed 24 May 2015].
Stellenbosch University https://scholar.sun.ac.za
332
Nutley, S., Walter, I. & Davies, H. 2007. Using evidence: How research can inform public services.
Retrieved from
https://books.google.com/books?hl=en&lr=&id=UfMefp4rO9sC&oi=fnd&pg=PR9&dq=Using+evid
ence:+How+research+can+inform+public+services.+&ots=SIK6dGJeF_&sig=6jMkN-
z03Fe5k_wmHntve28Fn-Q [Accessed 23 May 2014].
OECD (Organisation of Economic Co-operation and Development). 2012. Good practices in survey design
step-by-step. In Measuring regulatory performance: A practitioner’s guide to perception surveys.
Chapt. 3. Retrieved from https://www.oecd.org/gov/regulatory-policy/48933826.pdf [Accessed 23
May 2014].
OGR (Office of Grants & Research, KNUST).2018. Functions. Available at: https://ogr.knust.edu.gh/about-
us/functions [Accessed 3 October 2018].
Okolie, A. C. 2003. Producing knowledge for sustainable development in Africa: Implications for higher
education. Higher Education, 46(2), 235-260.
Oliver, K., Innvar, S., Lorenc, T., Woodman, J. and Thomas, J 2014. A systematic review of barriers to and
facilitators of the use of evidence by policymakers. BMC Health Services Research, 14(2), p.2
Retrieved from http://www.biomedcentral.com/1472-6963/14 [Accessed 25 July 2015].
Phipps, D. J, Jensen, K.E. & Myers, J.G. 2012. Applying social science research for public benefit using
knowledge mobilisation and social media. Open Access Retrieved from
https://www.intechopen.com/books/theoretical-and-methodological-approaches-to-social-sciences-
and-knowledge-management/applying-social-sciences-research-for-public-benefit-using-knowledge-
mobilization-and-social-media [Accessed 01 October 2018].
Porter, R. & Hicks, I. 1995. Knowledge utilization and the process of policy formation: Toward a framework
for Africa. Retrieved from http://www.popline.org/node/312839 [Accessed 23 May 2015].
Pyra, K. 2003. Knowledge translation: A review of the literature. Prepared for the Nova Scotia Health Research
Foundation. Retrieved from
https://scholar.google.com/scholar?hl=en&q=%29.+Knowledge+Translation%3A+A+Review+of+the
+Literature%3A+Prepared+for+the+Nova+Scotia+Health+Research+Foundation&btnG=&as_sdt=1
%2C5&as_sdtp=#0 [Accessed 23 May 2015].
QAPU (Quality Assurance and Planning Unit). 2017. Vice-Chancellors Report. Retrieved from
http://www.uta.fi/yky/tutkimus/tasti/Julkaisut/Sahkoinenkirjasto/PA296_Auranen_Social%20Capital
%20in%20Mode%201%20and%20Mode%202%20Knowledge%20.pdf [Accessed 11 September
2013].
Rich, R. F. (1991). Knowledge creation, diffusion, and utilization: Perspectives of the founding editor of
Knowledge. Knowledge, 12(3), 319-337.
Rogers, E.M. 2003. Diffusion of Innovations. Fifth edition. New York, NY: Free Press.
Salamzadeh, A., Salamzadeh, Y. & Daraei, M. 2011. Toward a systematic framework for an entrepreneurial
Stellenbosch University https://scholar.sun.ac.za
333
university: A study in Iranian context with an IPOO Model. Retrieved from
http://papers.ssrn.com/abstract=2026623 [Accessed 23 July 2015].
Santalo, J. 2004. The challenges of research management: Developing a research strategy and funding it.
European University Association Workshop on Managing the University Community, Barcelona.
Scopus. 2017. Research outputs 2012 to 2016. Scopus databases. Retrieved from
https://arxiv.org/ftp/arxiv/papers/1805/1805.02434.pdf [Accessed 23 July 2015]
Sedlacko, M., Pisano, U., Berger, G., & Lepuschitz, K. (2013). Bridging the science-policy gap:
development and reception of a joint research agenda on sustainable food consumption. Sustainability:
Science, Practice and Policy, 9(2), 105-123.
Shaxson, L. 2013. Research uptake and impact: are we in danger of overstating ourselves?. Impact of Social
Sciences Blog. Retrieved from http://eprints.lse.ac.uk/71753/1/blogs.lse.ac.uk-
Research%20uptake%20and%20impact%20are%20we%20in%20danger%20of%20overstating%20o
urselves.pdf [Accessed 27 May 2015]
Shaxson, L. (2013). Research uptake and impact: are we in danger of overstating ourselves? Impact of Social
Sciences Blog.
Shelley, M.C. 2001. How to do a survey (A 9-step process). Fall LC 2001 Assessment Work. Qualitative
Research in Psychology. Retrieved from https://www.lc.iastate.edu/pdfs-
docs/F2001AssessmentWorkshopSurvey.pdf [Accessed 27 May 2015]
Siegel, D. S., Waldman, D. A., Atwater, L. E., & Link, A. N. 2003. Commercial knowledge transfers from
universities to firms: improving the effectiveness of university–industry collaboration. The Journal of
High Technology Management Research, 14(1), 111-133.
Research policy of University of Stellenbosch 2016.. Retrieved from
http://www.sun.ac.za/english/policy/Documents/Research%20policy.pdf [Accessed 27 May 2015]
Sudsawad, P. 2007. Knowledge translation. Public Works, 2(2):97–104. Retrieved from
http://liee.ntua.gr/wp-content/uploads/2018/02/663-Using-Knowledge-For-Better-Health-.pdf
[Accessed 27 May 2015].
Sumner, A., Crichton, J., Theobald, S., Zulu, E., & Parkhurst, J. 2011. What shapes research impact on policy?
Understanding research uptake in sexual and reproductive health policy processes in resource poor
contexts. Health Research Policy and Systems, 9(1), S1- S3.
Teferra, D. & Altbachl, P.G. 2004. African higher education: Challenges for the 21st century. Higher
Education, 47(1):21–50. https://link.springer.com/article/10.1023/B:HIGH.0000009822.49980.30
[Accessed 27 May 2015].
The World Bank. 2009. Accelerating catch up: Tertiary education for growth in sub-Saharan Africa.
Washington, DC.
Stellenbosch University https://scholar.sun.ac.za
334
The World Bank Group. 2017. Overview. Retrieved from
http://www.worldbank.org/en/country/ghana/overview [Accessed 10 June 2016].
Thompson, G.N., Estabrooks, C.A. & Degner, L.F. 2006. Clarifying the concepts in knowledge transfer: A
literature review. Journal of Advanced Nursing, 53(6):691–701. doi: 10.1111/j.1365-
2648.2006.03775.x
UNCT (United Nations Country Team). 2017. The Sustainable Development Goals (SDGs) in Ghana. Accra.
Retrieved from http://gh.one.un.org/content/dam/unct/ghana/docs/Delivering%20as%20One/UNCT-
GH-UNSDP-2018.pdf [Accessed 10 June 2017]
UNDP (United Nations Development Programme). 2015. Ghana Millennium Development Goals 2015
Retrieved from
http://www.gh.undp.org/content/dam/ghana/docs/Doc/Inclgro/UNDP_GH_2015%20Ghana%20MDG
s%20Report.pdf [Accessed 10 June 2016]
UNESCO (United Nations Educational, Scientific and Cultural Organisation). 2009. Mapping the research
systems in developing countries. Regional report on Sub-Saharan Africa. (Vol. 11). Retrieved from
http://unesdoc.unesco.org/images/0019/001918/191870e.pdf [Accessed 10 June 2016]
UNESCO (United Nations Educational, Scientific and Cultural Organisation). 2010. Trends in tertiary
education: Sub-Saharan Africa. Retrieved from
http://unesdoc.unesco.org/images/0019/001926/192603e.pdf [Accessed 23 May 2017].
UNESCO (United Nations Educational, Scientific and Cultural Organization). 2018. Education and literacy.
Retrieved from http://uis.unesco.org/en/country/gh?theme=education-and-literacy [Accessed 13 May
2016].
UNICEF (United Nations Children’s Fund). 2015. Inclusive Education Policy. Retrieved from
https://www.unicef.org/publicpartnerships/files/EducationTheCaseForSupport.pdf [Accessed 23 May
2018].
University of Fort Hare. 2009. Strategic Plan: 2009–2016. Alice. Retrieved from
http://ufh.ac.za/files/Institutional%20Improvement%20Plan%20Section%20One%20Final%2029%20
Sept.pdf [Accessed 23 May 2018].
University of Ghana. 2014. Research policy guidelines. Retrieved from
https://www.orid.ug.edu.gh/sites/orid.ug.edu.gh/files/research_ethics_policy/files/assets/common/do
wnloads/publication.pdf [Accessed 20 May 2018].
University of Mauritius. 2009. Operational plan for research strategy. Retrieved from http://ministry-
education.govmu.org/English/Documents/Publications/EHRSP%202008-2020.pdf [Accessed 13 May
2018].
University of Southampton. 2014. Types of research. Retrieved from
https://www.southampton.ac.uk/courses/modules/mang2064.page [Accessed 09 May 2018].
Stellenbosch University https://scholar.sun.ac.za

335
Vingilis, E., Hartford, K. & Schrecker, T. 2003. Integrating knowledge generation with knowledge diffusion
and utilization: A case study analysis of the Consortium for Applied Research and Evaluation in
Mental. Canadian Journal of Public Health, 94(6): 468-471. Retrieved from
https://www.jstor.org/stable/pdf/41993745.pdf?refreqid=excelsior%3A48da5e7b5293c4d16f581c148
3f98dc1 [Accessed 25 May 2014].
Waddell, C. 2001. So much research evidence, so little dissemination and uptake: Mixing the useful with the
pleasing. Evidence-Based Mental Health, 4(1):3–5.
Weingart, P. 2013. The loss of trust and how to regain it: Performance measures and entrepreneurial
universities. Trust in universities (Vol. 86). London: Portland Press Limited, 1-13.
.
Weiss, C.H. 1979. The many meanings of research utilization. Public Administration Review, 39(5):426–431.
Weiss, C. 1980. Knowledge creep and decision accretion: Knowledge: Creation, Diffusion, Utilization, 1:381–
404.
Wilson, K.M., Brady, T.J. & Lesesne, C. 2011. An organizing framework for translation in public health: The
Knowledge to Action Framework. Preventing Chronic Disease, 8(2):46-47. Retrieved from
http://www.pubmedcentral.nih.gov/articlerender.fcgi?artid=3073439&tool=pmcentrez&rendertype=a
bstract [Accessed 10 August 2017].
Wilson, P.M., Petticrew, M., Calnan, M.W. & Nazareth, I. 2010. Disseminating research findings: What should
researchers do? A systematic scoping review of conceptual frameworks. Implementation Science,
5(1):91-92.
Wilson, R. 2003. Using research for school improvement: The LEA’s role. Slough: National Foundation for
Educational Research.
Wilton P. 2017. Organising for change: How can higher education meet the changing needs of employment.
Retrieved from https://www.wiltonpark.org.uk/wp-content/uploads/Wilton-Park-annual-reports-and-
accounts-2017-2018.pdf [Accessed 10 August 2017].
Woldegiorgis, E. & Doevenspeck, M. 2013. The changing role of higher education in Africa: A historical
reflection. Higher Education Studies, 3(6), 35-36 . Retrieved from
http://www.ccsenet.org/journal/index.php/hes/article/view/31139 [Accessed 16 June 2015].
Wood, J. 2013. Sampling in interview-based qualitative research: A theoretical and practical guide. In D.M.
Schreuder (ed.). Universities for a new world: Making a global network in international higher
education. Sage, 1913–2013.
Robinson, O. C. (2014). Sampling in interview-based qualitative research: A theoretical and practical guide.
Qualitative research in psychology, 11(1), 25-41.
Stellenbosch University https://scholar.sun.ac.za
336
Yin, R. 2009. Case study research: Design and methods. Fourth edition. Retrieved from
https://scholar.google.com/scholar?hl=en&q=180.%09Yin%2C+R.+K.+%282009%29.+Case+Study
+Research+Design+and+Methods+%284th+Ed%29.+Applied+Social+Research+Methods+Series+V
ol.+5.+Thousand+Oaks%3A+SAGE+&btnG=&as_sdt=1%2C5&as_sdtp=#0 [Accessed 22 July
2015].
Ylinenpää, H. 2001. Science parks, clusters and regional development. In 31st European Small Business
Seminar. Retrieved from http://pure.ltu.se/portal/files/717490/AR2001_48.pdf [Accessed 20 June
2016].
APPENDICES
1. SAMPLE OF SURVEY INSTRUMENT
SURVEY ON STAKEHOLDER ENGAGEMENT, CHANNELS AND MECHANISMS OF
ENGAGEMENT FOR RESEARCH UPTAKE
Introduction
Dear Sir/ Madam
We are approaching you in order to solicit your views in our assessment of the extent of stakeholders
engagement (involvement in research process) and research dissemination activities at KNUST. Essentially,
we are looking at research activities in relation to the following audience:
Local communities outside the university
Private sector (this includes industry/ large firms and small and medium managed enterprises-SMMEs)
Government (ministries, departments and agencies-MDAs) and parastatals
Researchers and Scientists from other universities and research institutes
Non-governmental organisations (NGOs) such as charities and funders.
The survey consists of 20-24 questions (depending on the number of stakeholders you are most frequently
involved with) ideally; it should take you no longer than 15minutes to complete the survey. Participation in
the survey is voluntary and all information will be treated as highly confidential.
We promise to adhere to ethical standards in analyzing respondents’ feedback so as to ensure confidentiality
and anonymity.by continuing you agree to these conditions.
Thank you in advance for your time and valuable input!
Stellenbosch University https://scholar.sun.ac.za
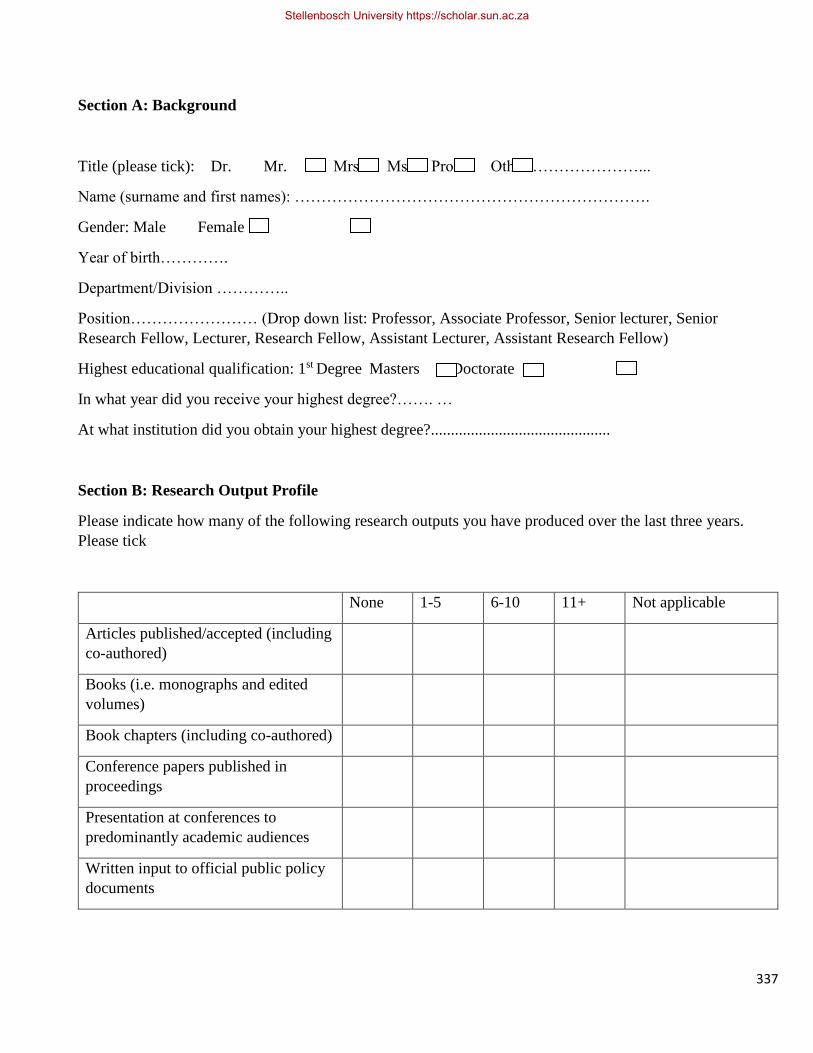
337
Section A: Background
Title (please tick): Dr. Mr. Mrs. Ms. Prof. Other…………………...
Name (surname and first names): ………………………………………………………….
Gender: Male Female
Year of birth………….
Department/Division …………..
Position…………………… (Drop down list: Professor, Associate Professor, Senior lecturer, Senior
Research Fellow, Lecturer, Research Fellow, Assistant Lecturer, Assistant Research Fellow)
Highest educational qualification: 1st Degree Masters Doctorate
In what year did you receive your highest degree?……. …
At what institution did you obtain your highest degree?.............................................
Section B: Research Output Profile
Please indicate how many of the following research outputs you have produced over the last three years.
Please tick
None 1-5 6-10 11+ Not applicable
Articles published/accepted (including
co-authored)
Books (i.e. monographs and edited
volumes)
Book chapters (including co-authored)
Conference papers published in
proceedings
Presentation at conferences to
predominantly academic audiences
Written input to official public policy
documents
Stellenbosch University https://scholar.sun.ac.za
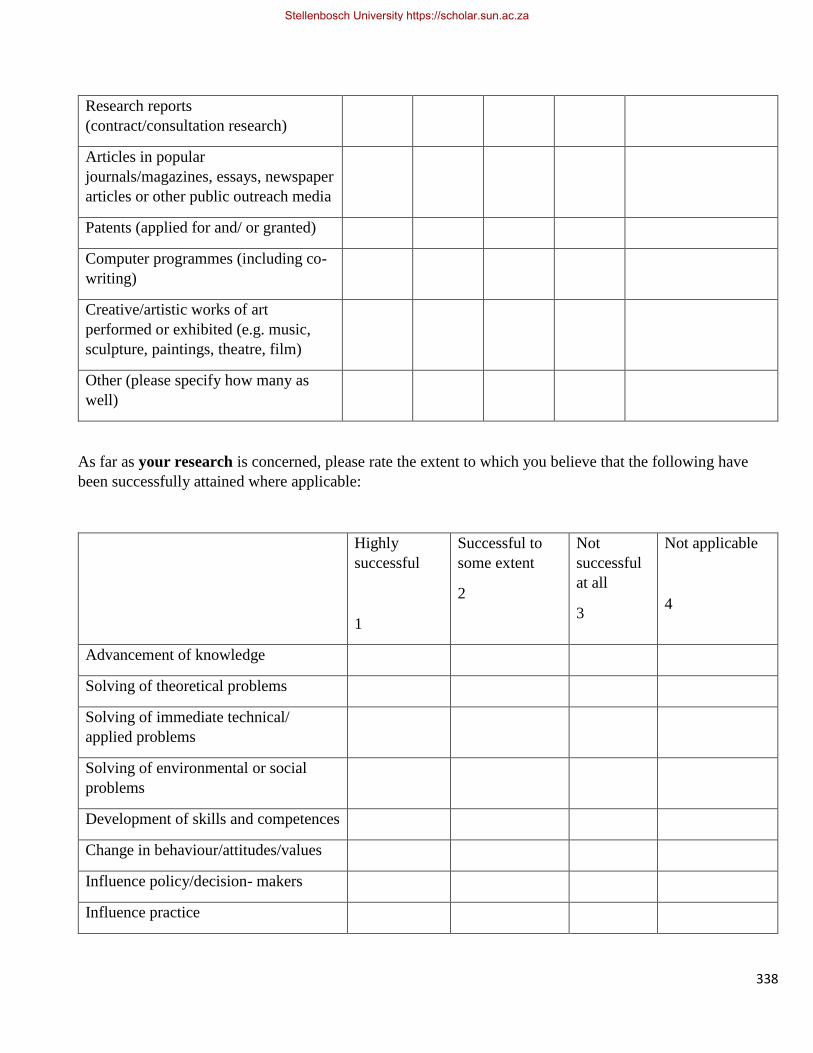
338
Research reports
(contract/consultation research)
Articles in popular
journals/magazines, essays, newspaper
articles or other public outreach media
Patents (applied for and/ or granted)
Computer programmes (including co-
writing)
Creative/artistic works of art
performed or exhibited (e.g. music,
sculpture, paintings, theatre, film)
Other (please specify how many as
well)
As far as your research is concerned, please rate the extent to which you believe that the following have
been successfully attained where applicable:
Highly
successful
1
Successful to
some extent
2
Not
successful
at all
3
Not applicable
4
Advancement of knowledge
Solving of theoretical problems
Solving of immediate technical/
applied problems
Solving of environmental or social
problems
Development of skills and competences
Change in behaviour/attitudes/values
Influence policy/decision- makers
Influence practice
Stellenbosch University https://scholar.sun.ac.za
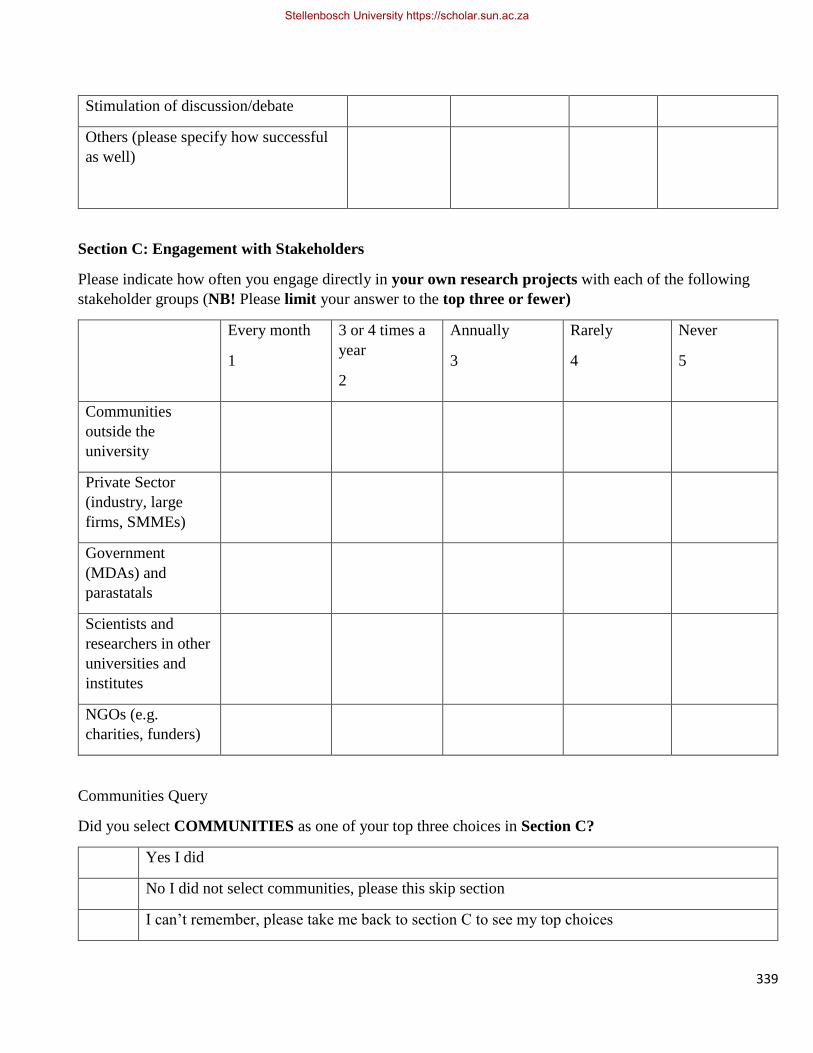
339
Stimulation of discussion/debate
Others (please specify how successful
as well)
Section C: Engagement with Stakeholders
Please indicate how often you engage directly in your own research projects with each of the following
stakeholder groups (NB! Please limit your answer to the top three or fewer)
Every month
1
3 or 4 times a
year
2
Annually
3
Rarely
4
Never
5
Communities
outside the
university
Private Sector
(industry, large
firms, SMMEs)
Government
(MDAs) and
parastatals
Scientists and
researchers in other
universities and
institutes
NGOs (e.g.
charities, funders)
Communities Query
Did you select COMMUNITIES as one of your top three choices in Section C?
Yes I did
No I did not select communities, please this skip section
I can’t remember, please take me back to section C to see my top choices
Stellenbosch University https://scholar.sun.ac.za

340
Section D: Engagement with Communities (your personal experiences with communities of need)
Communities
How do you typically engage with communities around the university? Please tick in the boxes below how
often you engage with these stakeholder groups through these engagement mechanisms.
Every
month
1
3 or 4
times a
year
2
Annually
3
Rarely
4
Never
5
Organising exhibitions in the communities
Conducting research in the communities
Using community sites for teaching and
learning
Forming community-based networks for
learning
Drawing on community advisors for
support, strategy and advice
Performing research related
Drama/concerts/theatre in communities
Using social media to reach out to
communities
Other (please specify how
often as well)
How beneficial do you perceive the following potential benefits of community engagement to be your own
research engagement activities:
Very
beneficial
Somewhat
beneficial
Of little
benefit
Of no
benefit
Not
applicable
Stellenbosch University https://scholar.sun.ac.za
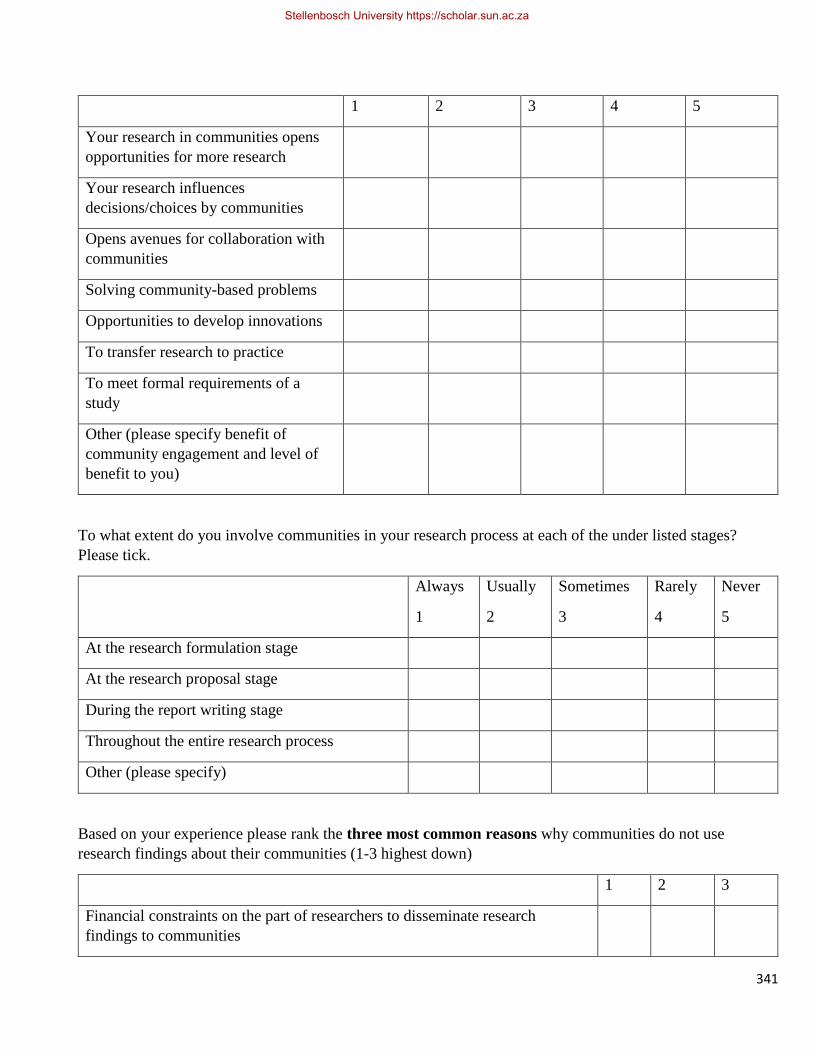
341
1 2 3 4 5
Your research in communities opens
opportunities for more research
Your research influences
decisions/choices by communities
Opens avenues for collaboration with
communities
Solving community-based problems
Opportunities to develop innovations
To transfer research to practice
To meet formal requirements of a
study
Other (please specify benefit of
community engagement and level of
benefit to you)
To what extent do you involve communities in your research process at each of the under listed stages?
Please tick.
Always
1
Usually
2
Sometimes
3
Rarely
4
Never
5
At the research formulation stage
At the research proposal stage
During the report writing stage
Throughout the entire research process
Other (please specify)
Based on your experience please rank the three most common reasons why communities do not use
research findings about their communities (1-3 highest down)
1 2 3
Financial constraints on the part of researchers to disseminate research
findings to communities
Stellenbosch University https://scholar.sun.ac.za
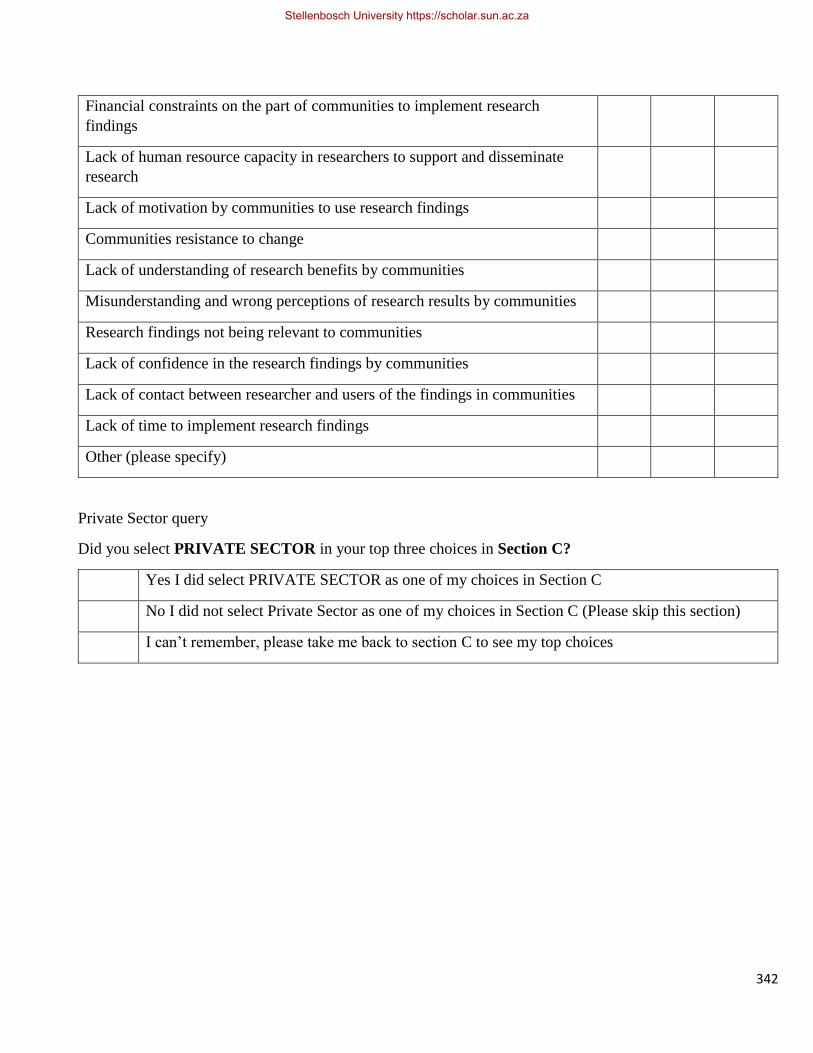
342
Financial constraints on the part of communities to implement research
findings
Lack of human resource capacity in researchers to support and disseminate
research
Lack of motivation by communities to use research findings
Communities resistance to change
Lack of understanding of research benefits by communities
Misunderstanding and wrong perceptions of research results by communities
Research findings not being relevant to communities
Lack of confidence in the research findings by communities
Lack of contact between researcher and users of the findings in communities
Lack of time to implement research findings
Other (please specify)
Private Sector query
Did you select PRIVATE SECTOR in your top three choices in Section C?
Yes I did select PRIVATE SECTOR as one of my choices in Section C
No I did not select Private Sector as one of my choices in Section C (Please skip this section)
I can’t remember, please take me back to section C to see my top choices
Stellenbosch University https://scholar.sun.ac.za
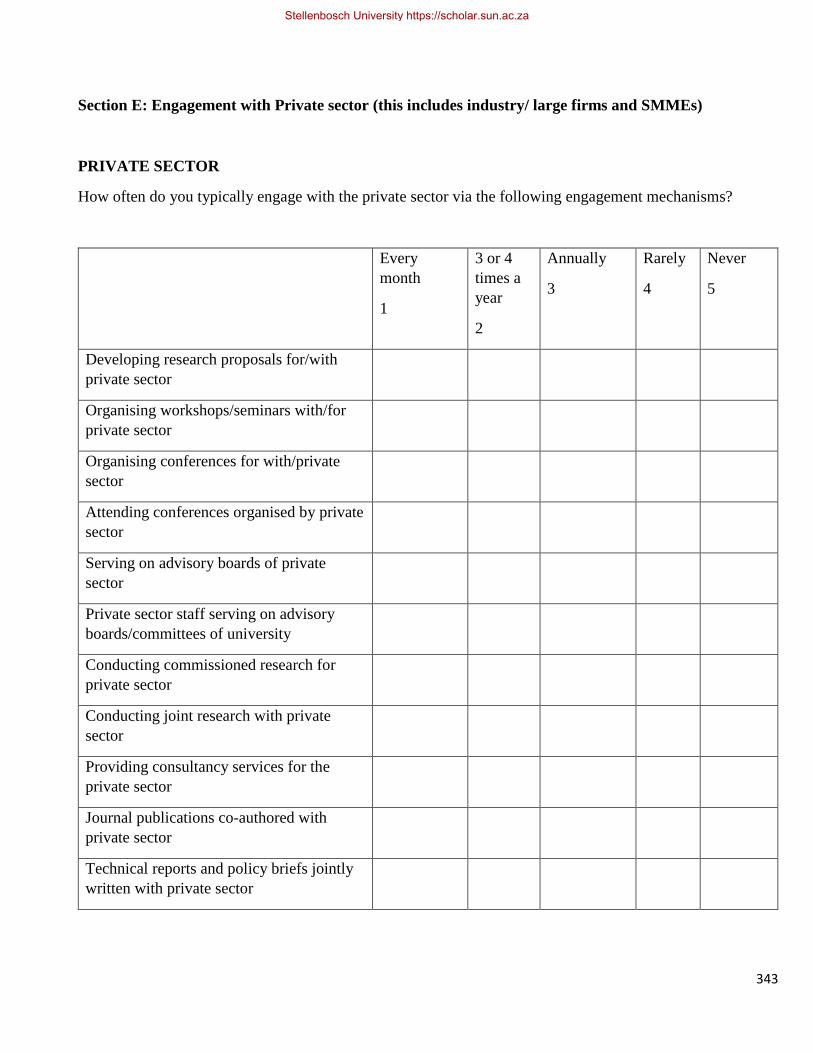
343
Section E: Engagement with Private sector (this includes industry/ large firms and SMMEs)
PRIVATE SECTOR
How often do you typically engage with the private sector via the following engagement mechanisms?
Every
month
1
3 or 4
times a
year
2
Annually
3
Rarely
4
Never
5
Developing research proposals for/with
private sector
Organising workshops/seminars with/for
private sector
Organising conferences for with/private
sector
Attending conferences organised by private
sector
Serving on advisory boards of private
sector
Private sector staff serving on advisory
boards/committees of university
Conducting commissioned research for
private sector
Conducting joint research with private
sector
Providing consultancy services for the
private sector
Journal publications co-authored with
private sector
Technical reports and policy briefs jointly
written with private sector
Stellenbosch University https://scholar.sun.ac.za
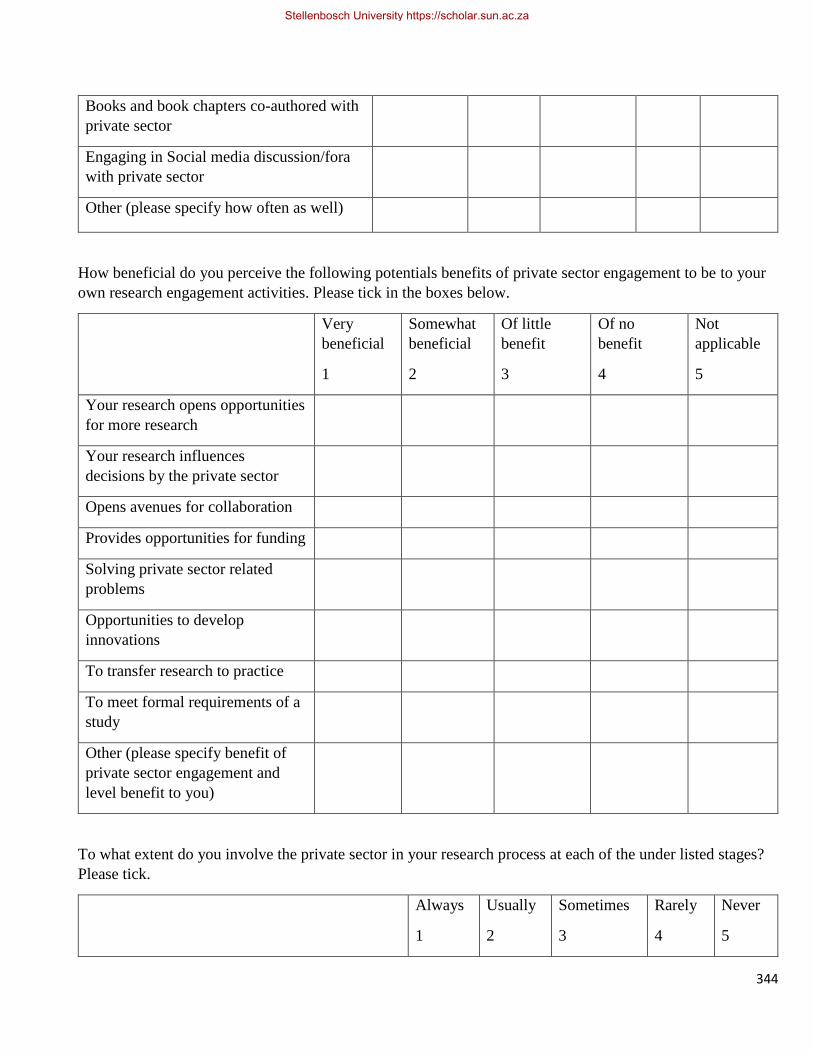
344
Books and book chapters co-authored with
private sector
Engaging in Social media discussion/fora
with private sector
Other (please specify how often as well)
How beneficial do you perceive the following potentials benefits of private sector engagement to be to your
own research engagement activities. Please tick in the boxes below.
Very
beneficial
1
Somewhat
beneficial
2
Of little
benefit
3
Of no
benefit
4
Not
applicable
5
Your research opens opportunities
for more research
Your research influences
decisions by the private sector
Opens avenues for collaboration
Provides opportunities for funding
Solving private sector related
problems
Opportunities to develop
innovations
To transfer research to practice
To meet formal requirements of a
study
Other (please specify benefit of
private sector engagement and
level benefit to you)
To what extent do you involve the private sector in your research process at each of the under listed stages?
Please tick.
Always
1
Usually
2
Sometimes
3
Rarely
4
Never
5
Stellenbosch University https://scholar.sun.ac.za
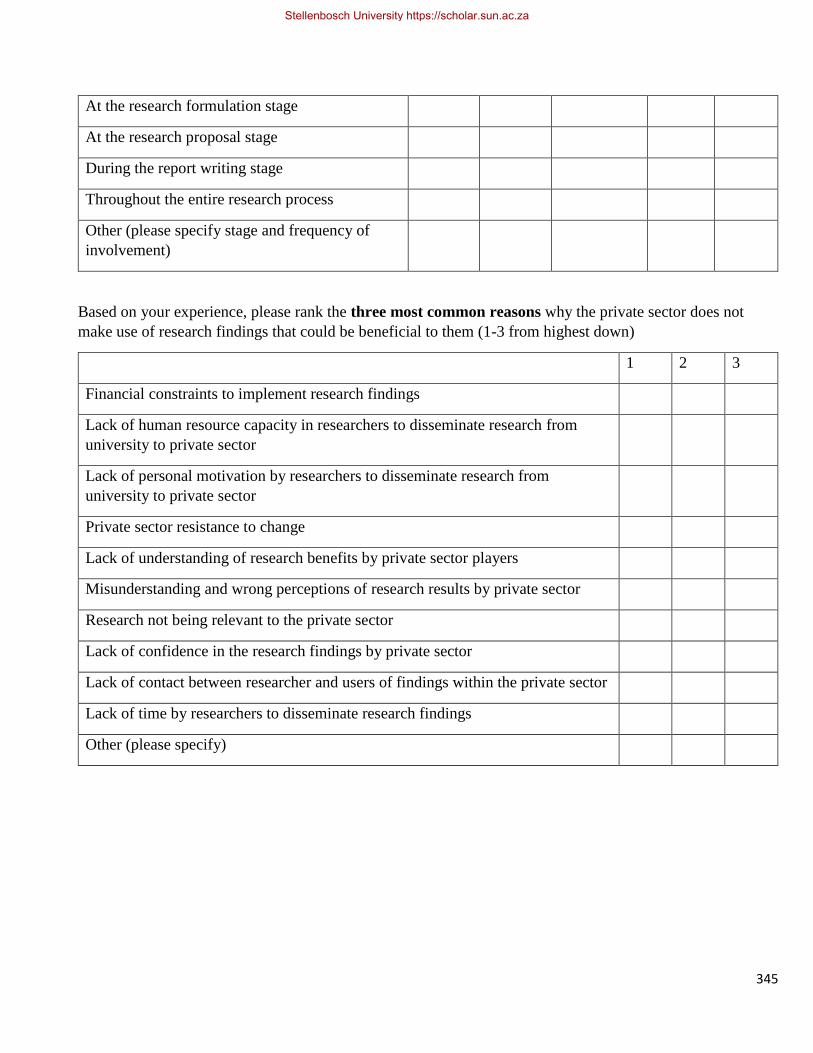
345
At the research formulation stage
At the research proposal stage
During the report writing stage
Throughout the entire research process
Other (please specify stage and frequency of
involvement)
Based on your experience, please rank the three most common reasons why the private sector does not
make use of research findings that could be beneficial to them (1-3 from highest down)
1 2 3
Financial constraints to implement research findings
Lack of human resource capacity in researchers to disseminate research from
university to private sector
Lack of personal motivation by researchers to disseminate research from
university to private sector
Private sector resistance to change
Lack of understanding of research benefits by private sector players
Misunderstanding and wrong perceptions of research results by private sector
Research not being relevant to the private sector
Lack of confidence in the research findings by private sector
Lack of contact between researcher and users of findings within the private sector
Lack of time by researchers to disseminate research findings
Other (please specify)
Stellenbosch University https://scholar.sun.ac.za

346
Government and Parastatals Query
Did you select GOVERNMENT AND PARASTATALS as one of your top three choices in Section C?
Yes I DID select Governments and Parastatals as one of my top three choices in Section C
No I did NOT select Governments and Parastatals as one of my top three choices in Section C (Please
skip this section)
I can’t remember take me back to section C to see my top 3 choices
Section F: Engagement with Governments (ministries, departments and agencies-MDAs) and
Parastatals
Government and Parastatals
How do you typically engage with governments (MDAs) and parastatals? Please tick in the boxes below how
often you engage with these stakeholder groups through these engagement mechanisms.
Every
month
1
3 or 4
times a
year
2
Annually
3
Rarely
4
Never
5
Developing research proposals with/for
government and parastatals
Organising workshops with/for government
and parastatals
Organising conferences with/for
government and parastatals
Serving on advisory boards of government
and parastatals
Conducting commissioned research for
government and parastatals
Research collaboration with government
and parastatals
Stellenbosch University https://scholar.sun.ac.za
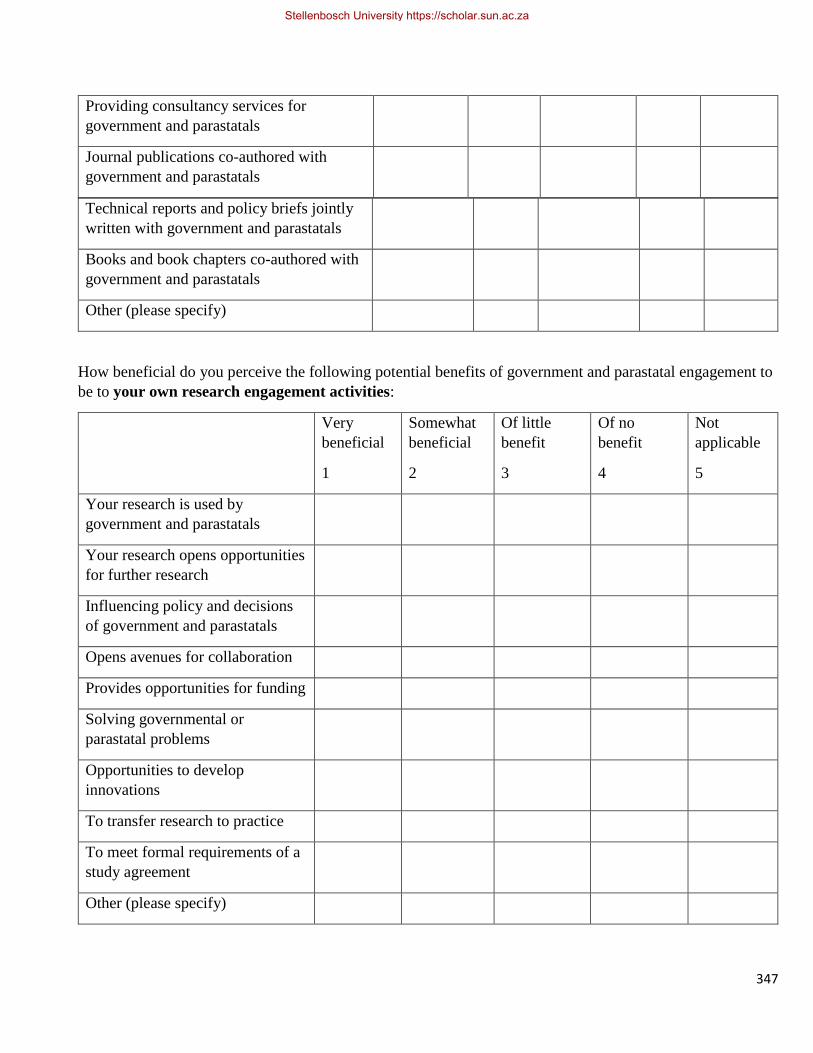
347
Providing consultancy services for
government and parastatals
Journal publications co-authored with
government and parastatals
Technical reports and policy briefs jointly
written with government and parastatals
Books and book chapters co-authored with
government and parastatals
Other (please specify)
How beneficial do you perceive the following potential benefits of government and parastatal engagement to
be to your own research engagement activities:
Very
beneficial
1
Somewhat
beneficial
2
Of little
benefit
3
Of no
benefit
4
Not
applicable
5
Your research is used by
government and parastatals
Your research opens opportunities
for further research
Influencing policy and decisions
of government and parastatals
Opens avenues for collaboration
Provides opportunities for funding
Solving governmental or
parastatal problems
Opportunities to develop
innovations
To transfer research to practice
To meet formal requirements of a
study agreement
Other (please specify)
Stellenbosch University https://scholar.sun.ac.za

348
To what extent do you involve governments and parastatals in your research process at each of the under
listed stages? Please tick.
Always
1
Usually
2
Sometimes
3
Rarely
4
Never
5
At the research formulation stage
At the research proposal stage
During the report writing stage
Throughout the entire research process
Other (please specify)
Based on your experience, please rank the three most common reasons why governments and parastatals do
not make use of research findings that could benefit them (1-3from highest down)
1 2 3
Decision making culture of government not conducive to
make use of research findings
Political influence plays a far greater role than evidence to
make decisions
Research results are not delivered in a timely fashion
There exists financial constraints to implement research
findings
Lack of human resource capacity in researchers to
disseminate research
Lack of personal motivation by researchers to disseminate
research findings
Government and parastatals resisting change
Lack of understanding of research benefits by government
and parastatals
Misunderstanding and wrong perceptions of research results
by governments
Research not relevant to government and parastatals
Lack of confidence in research findings
Stellenbosch University https://scholar.sun.ac.za

349
Lack of contact between researchers and users of findings
among government and parastatals
Lack of time to disseminate research findings
Other (please specify stage and frequency of involvement)
Scientist and Researchers Query
Did you select SCIENTIST AND RESEARCHERS as one of your top three choices in Section C?
Yes I DID select Scientist and Researchers as one of my top three choices in Section C
No I did NOT select Scientist and Researchers as one of my top three choices in Section C (
Please skip this section)
I can’t remember take me back to section C to see my top 3 choices
Section G: Engagement with Scientists and researchers of other universities and institutes
Scientist and Researchers
How often do you typically engage with scientists and researchers from other universities and institutes via
the following engagement mechanisms?
Every
month
1
3 or 4
times a
year
2
Annually
3
Rarely
4
Never
5
Developing curriculum in partnership with
other scientists and researchers
Organising workshops with/for other
scientists and researchers
Organising conferences with/for other
scientists and researchers
Attending conferences with other scientists
and researchers
Stellenbosch University https://scholar.sun.ac.za
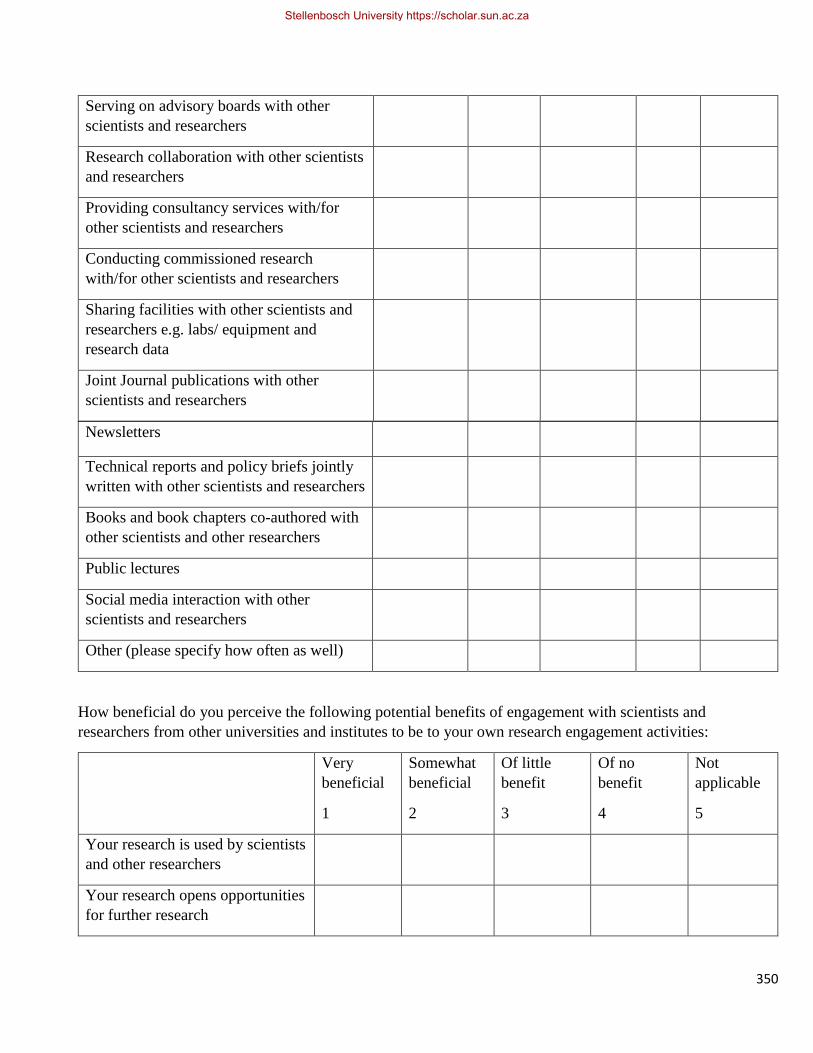
350
Serving on advisory boards with other
scientists and researchers
Research collaboration with other scientists
and researchers
Providing consultancy services with/for
other scientists and researchers
Conducting commissioned research
with/for other scientists and researchers
Sharing facilities with other scientists and
researchers e.g. labs/ equipment and
research data
Joint Journal publications with other
scientists and researchers
Newsletters
Technical reports and policy briefs jointly
written with other scientists and researchers
Books and book chapters co-authored with
other scientists and other researchers
Public lectures
Social media interaction with other
scientists and researchers
Other (please specify how often as well)
How beneficial do you perceive the following potential benefits of engagement with scientists and
researchers from other universities and institutes to be to your own research engagement activities:
Very
beneficial
1
Somewhat
beneficial
2
Of little
benefit
3
Of no
benefit
4
Not
applicable
5
Your research is used by scientists
and other researchers
Your research opens opportunities
for further research
Stellenbosch University https://scholar.sun.ac.za
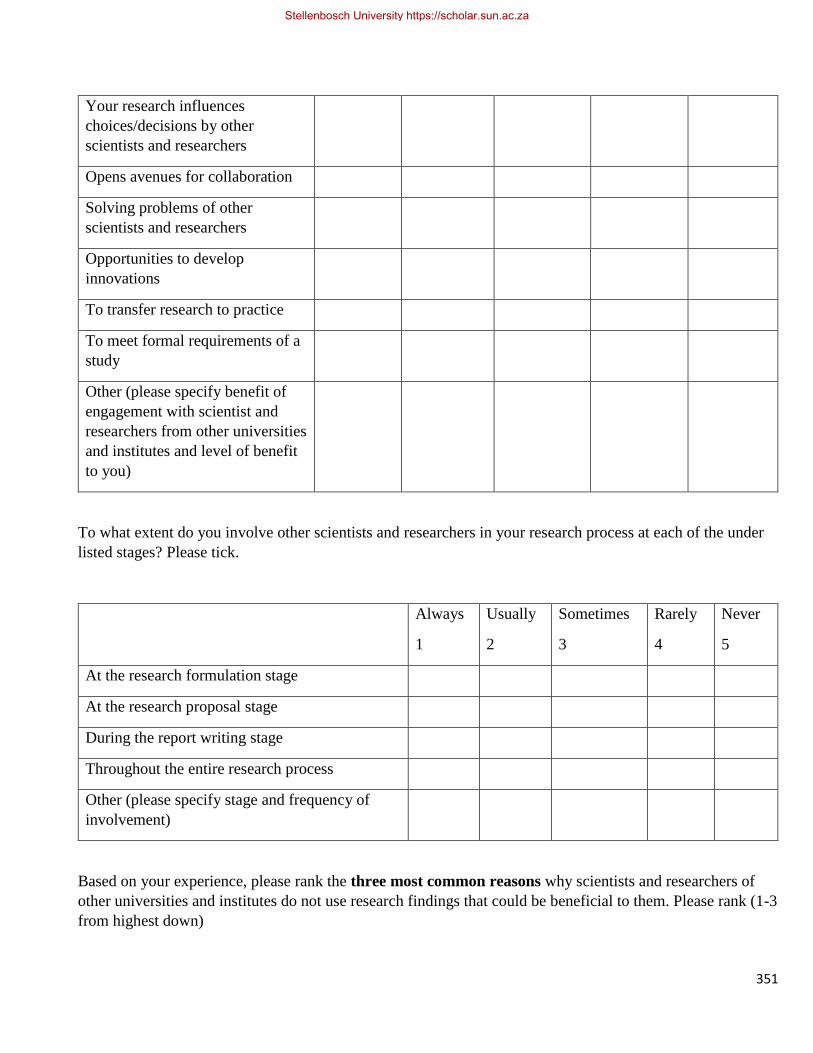
351
Your research influences
choices/decisions by other
scientists and researchers
Opens avenues for collaboration
Solving problems of other
scientists and researchers
Opportunities to develop
innovations
To transfer research to practice
To meet formal requirements of a
study
Other (please specify benefit of
engagement with scientist and
researchers from other universities
and institutes and level of benefit
to you)
To what extent do you involve other scientists and researchers in your research process at each of the under
listed stages? Please tick.
Always
1
Usually
2
Sometimes
3
Rarely
4
Never
5
At the research formulation stage
At the research proposal stage
During the report writing stage
Throughout the entire research process
Other (please specify stage and frequency of
involvement)
Based on your experience, please rank the three most common reasons why scientists and researchers of
other universities and institutes do not use research findings that could be beneficial to them. Please rank (1-3
from highest down)
Stellenbosch University https://scholar.sun.ac.za
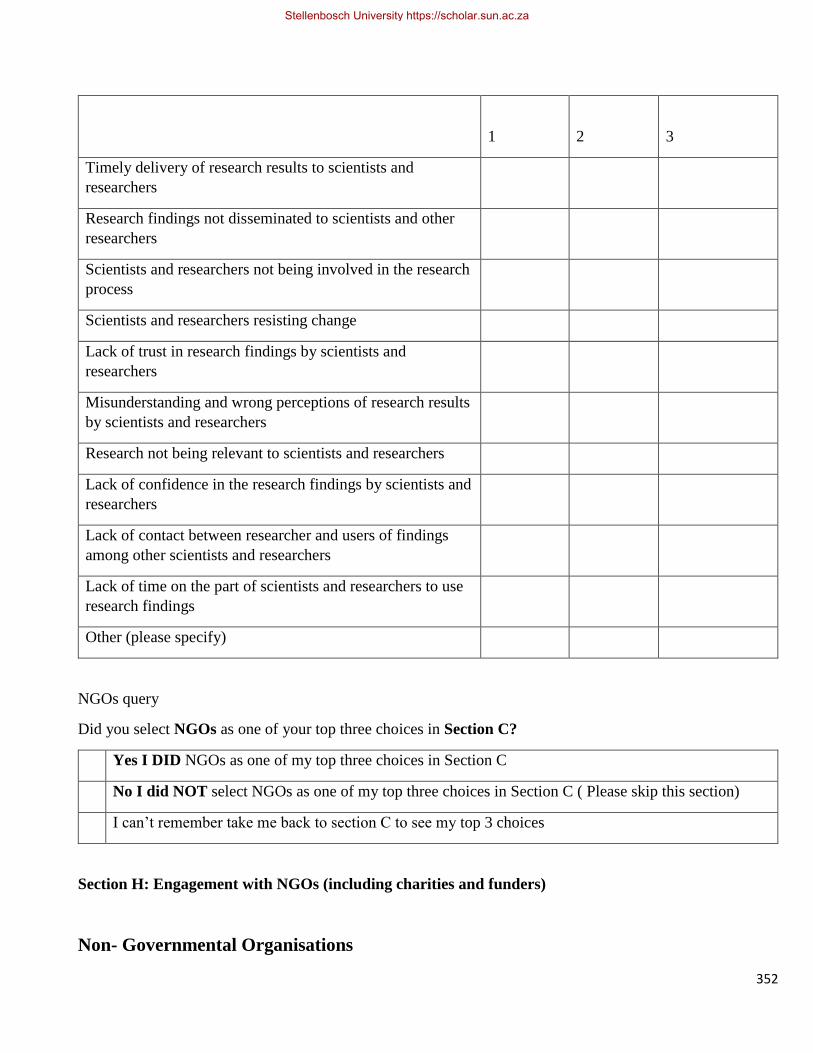
352
1
2
3
Timely delivery of research results to scientists and
researchers
Research findings not disseminated to scientists and other
researchers
Scientists and researchers not being involved in the research
process
Scientists and researchers resisting change
Lack of trust in research findings by scientists and
researchers
Misunderstanding and wrong perceptions of research results
by scientists and researchers
Research not being relevant to scientists and researchers
Lack of confidence in the research findings by scientists and
researchers
Lack of contact between researcher and users of findings
among other scientists and researchers
Lack of time on the part of scientists and researchers to use
research findings
Other (please specify)
NGOs query
Did you select NGOs as one of your top three choices in Section C?
Yes I DID NGOs as one of my top three choices in Section C
No I did NOT select NGOs as one of my top three choices in Section C ( Please skip this section)
I can’t remember take me back to section C to see my top 3 choices
Section H: Engagement with NGOs (including charities and funders)
Non- Governmental Organisations
Stellenbosch University https://scholar.sun.ac.za
353
How do you typically engage with NGOs? Please tick in the boxes below how often you engage with these
stakeholder groups through these engagement mechanisms.
How often do you typically engage with NGOs via the following engagement mechanisms?
Every
month
1
3 or 4
times a
year
2
Annually
3
Rarely
4
Never
5
Developing research proposals with/for
NGOs
Organising workshops/seminars with/for
NGOs
Organising conferences with/for NGOs
Attending conferences organised by NGOs
Serving on advisory boards of NGOs
NGO staff serving on advisory boards of
university
Conducting commissioned research for
NGOs
Conducting joint research with NGOs
Providing consultancy services for NGOs
Joint journal publications with NGOs
Technical reports and policy briefs jointly
written with NGOs
Books and book chapters co-authored with
NGOs
Engaging NGOs on social media platforms
Other (please specify)
How beneficial do you perceive the following potential benefits of NGO engagement to be to your own
research engagement activities:
Stellenbosch University https://scholar.sun.ac.za

354
Very
beneficial
1
Somewhat
beneficial
2
Of little
benefit
3
Of no
benefit
4
Not
applicable
5
Your research is used by NGOs to
support programme
implementation
Your research opens avenues for
further research
Your research influences policies
and decisions of NGOs
Opens avenues for collaboration
with NGOs
Provides you with opportunities
for funding
Solving NGO related problems
Opportunities to develop
innovations
To transfer research to practice
To meet formal requirements of a
study
Other (please specify)
To what extent do you involve NGOs in your research process at each of the under listed stages? Please tick.
Always
1
Usually
2
Sometimes
3
Rarely
4
Never
5
At the research formulation stage
At the research proposal stage
During the report writing stage
Throughout the entire research process
Other (please specify)
Stellenbosch University https://scholar.sun.ac.za
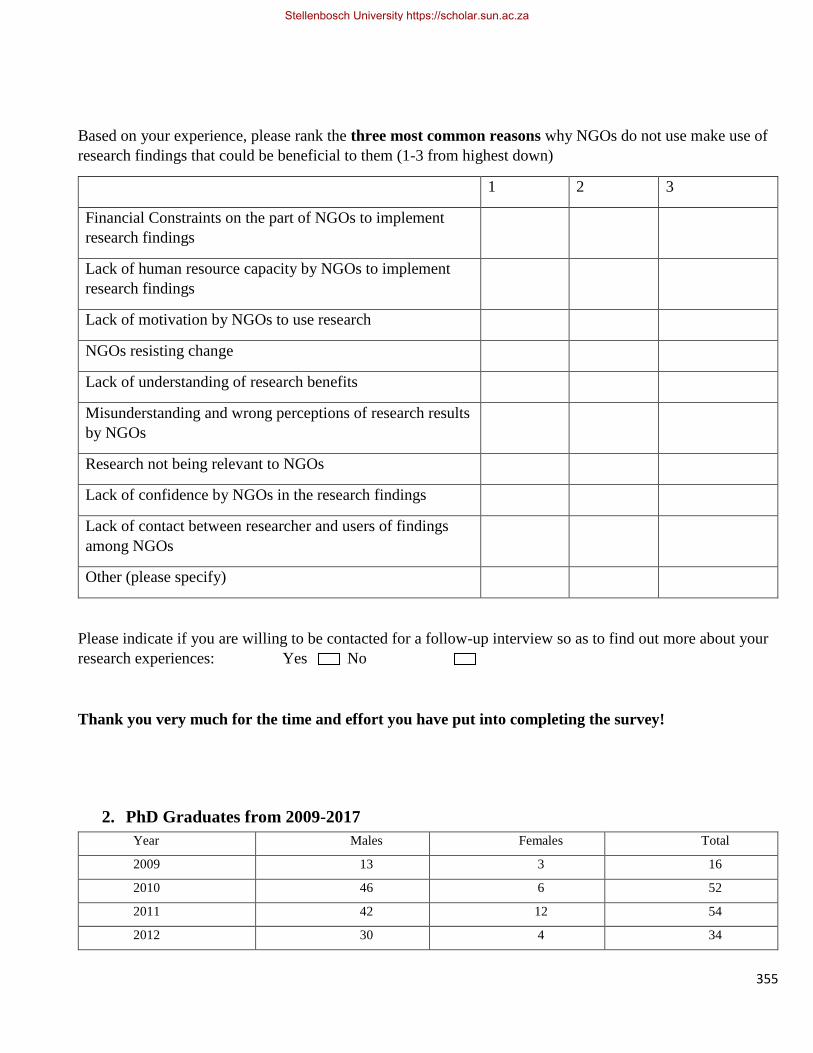
355
Based on your experience, please rank the three most common reasons why NGOs do not use make use of
research findings that could be beneficial to them (1-3 from highest down)
1 2 3
Financial Constraints on the part of NGOs to implement
research findings
Lack of human resource capacity by NGOs to implement
research findings
Lack of motivation by NGOs to use research
NGOs resisting change
Lack of understanding of research benefits
Misunderstanding and wrong perceptions of research results
by NGOs
Research not being relevant to NGOs
Lack of confidence by NGOs in the research findings
Lack of contact between researcher and users of findings
among NGOs
Other (please specify)
Please indicate if you are willing to be contacted for a follow-up interview so as to find out more about your
research experiences: Yes No
Thank you very much for the time and effort you have put into completing the survey!
2. PhD Graduates from 2009-2017
Year Males Females Total
2009 13 3 16
2010 46 6 52
2011 42 12 54
2012 30 4 34
Stellenbosch University https://scholar.sun.ac.za
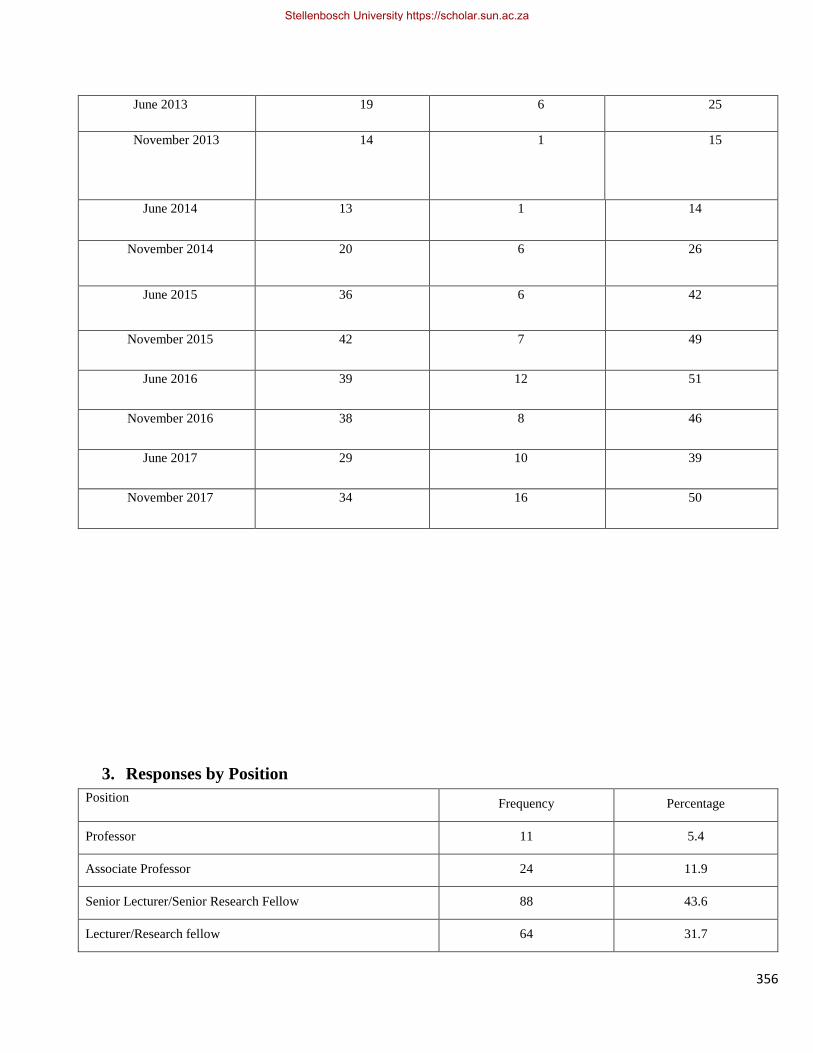
356
June 2013 19 6 25
November 2013 14 1 15
June 2014 13 1 14
November 2014 20 6 26
June 2015 36 6 42
November 2015 42 7 49
June 2016 39 12 51
November 2016 38 8 46
June 2017 29 10 39
November 2017 34 16 50
3. Responses by Position
Position Frequency Percentage
Professor 11 5.4
Associate Professor 24 11.9
Senior Lecturer/Senior Research Fellow 88 43.6
Lecturer/Research fellow 64 31.7
Stellenbosch University https://scholar.sun.ac.za
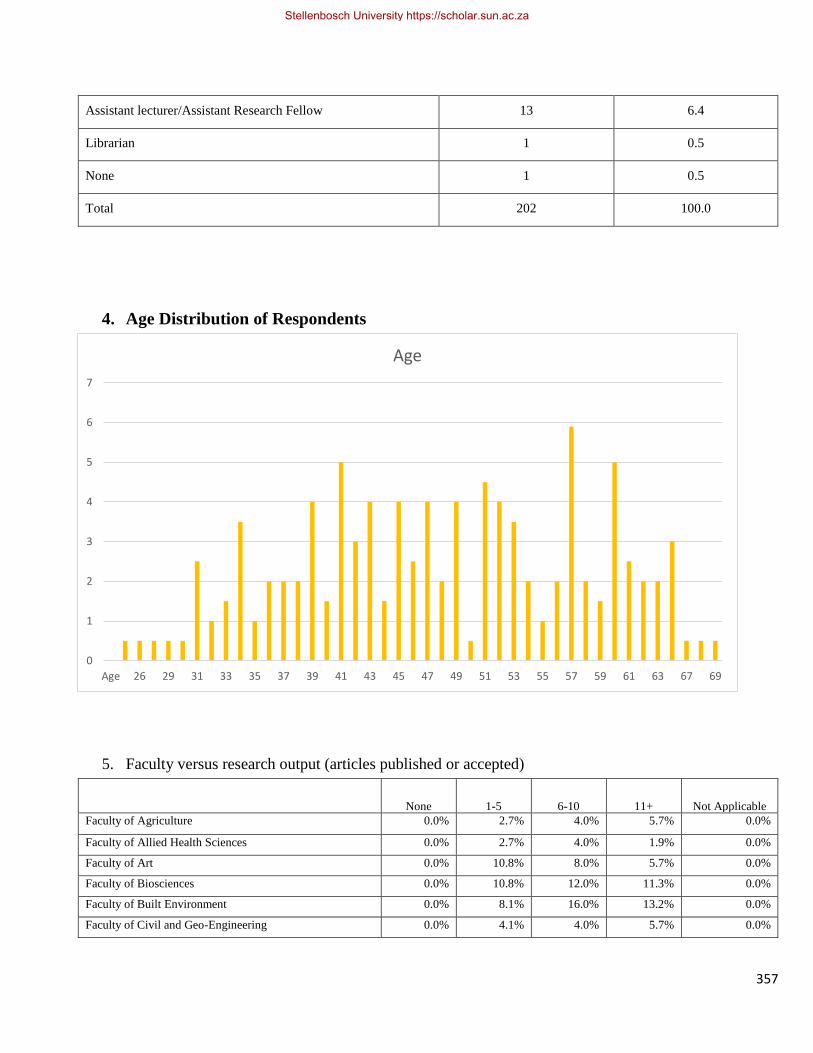
357
Assistant lecturer/Assistant Research Fellow 13 6.4
Librarian 1 0.5
None 1 0.5
Total 202 100.0
4. Age Distribution of Respondents
5. Faculty versus research output (articles published or accepted)
None 1-5 6-10 11+ Not Applicable
Faculty of Agriculture 0.0% 2.7% 4.0% 5.7% 0.0%
Faculty of Allied Health Sciences 0.0% 2.7% 4.0% 1.9% 0.0%
Faculty of Art 0.0% 10.8% 8.0% 5.7% 0.0%
Faculty of Biosciences 0.0% 10.8% 12.0% 11.3% 0.0%
Faculty of Built Environment 0.0% 8.1% 16.0% 13.2% 0.0%
Faculty of Civil and Geo-Engineering 0.0% 4.1% 4.0% 5.7% 0.0%
0
1
2
3
4
5
6
7
Age 26 29 31 33 35 37 39 41 43 45 47 49 51 53 55 57 59 61 63 67 69
Age
Stellenbosch University https://scholar.sun.ac.za
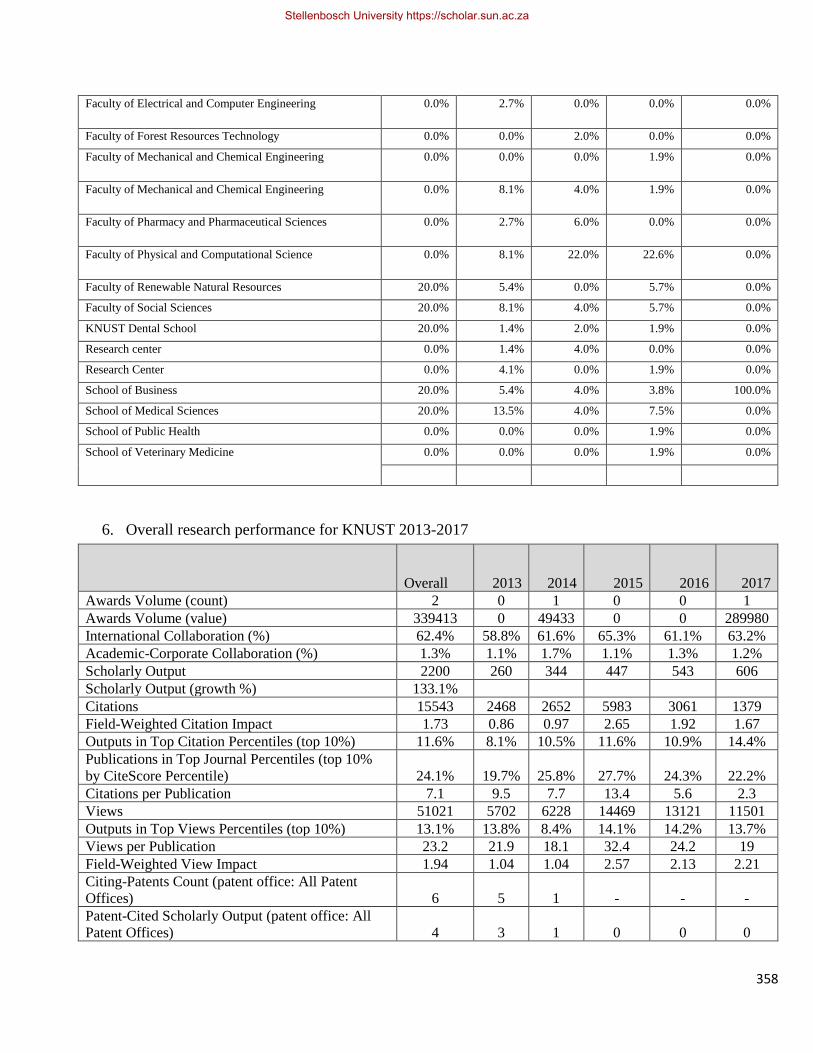
358
Faculty of Electrical and Computer Engineering 0.0% 2.7% 0.0% 0.0% 0.0%
Faculty of Forest Resources Technology 0.0% 0.0% 2.0% 0.0% 0.0%
Faculty of Mechanical and Chemical Engineering 0.0% 0.0% 0.0% 1.9% 0.0%
Faculty of Mechanical and Chemical Engineering 0.0% 8.1% 4.0% 1.9% 0.0%
Faculty of Pharmacy and Pharmaceutical Sciences 0.0% 2.7% 6.0% 0.0% 0.0%
Faculty of Physical and Computational Science 0.0% 8.1% 22.0% 22.6% 0.0%
Faculty of Renewable Natural Resources 20.0% 5.4% 0.0% 5.7% 0.0%
Faculty of Social Sciences 20.0% 8.1% 4.0% 5.7% 0.0%
KNUST Dental School 20.0% 1.4% 2.0% 1.9% 0.0%
Research center 0.0% 1.4% 4.0% 0.0% 0.0%
Research Center 0.0% 4.1% 0.0% 1.9% 0.0%
School of Business 20.0% 5.4% 4.0% 3.8% 100.0%
School of Medical Sciences 20.0% 13.5% 4.0% 7.5% 0.0%
School of Public Health 0.0% 0.0% 0.0% 1.9% 0.0%
School of Veterinary Medicine 0.0% 0.0% 0.0% 1.9% 0.0%
6. Overall research performance for KNUST 2013-2017
Overall 2013 2014 2015 2016 2017
Awards Volume (count) 2 0 1 0 0 1
Awards Volume (value) 339413 0 49433 0 0 289980
International Collaboration (%) 62.4% 58.8% 61.6% 65.3% 61.1% 63.2%
Academic-Corporate Collaboration (%) 1.3% 1.1% 1.7% 1.1% 1.3% 1.2%
Scholarly Output 2200 260 344 447 543 606
Scholarly Output (growth %) 133.1% Citations 15543 2468 2652 5983 3061 1379
Field-Weighted Citation Impact 1.73 0.86 0.97 2.65 1.92 1.67
Outputs in Top Citation Percentiles (top 10%) 11.6% 8.1% 10.5% 11.6% 10.9% 14.4%
Publications in Top Journal Percentiles (top 10%
by CiteScore Percentile) 24.1% 19.7% 25.8% 27.7% 24.3% 22.2%
Citations per Publication 7.1 9.5 7.7 13.4 5.6 2.3
Views 51021 5702 6228 14469 13121 11501
Outputs in Top Views Percentiles (top 10%) 13.1% 13.8% 8.4% 14.1% 14.2% 13.7%
Views per Publication 23.2 21.9 18.1 32.4 24.2 19
Field-Weighted View Impact 1.94 1.04 1.04 2.57 2.13 2.21
Citing-Patents Count (patent office: All Patent
Offices) 6 5 1 - - -
Patent-Cited Scholarly Output (patent office: All
Patent Offices) 4 3 1 0 0 0
Stellenbosch University https://scholar.sun.ac.za
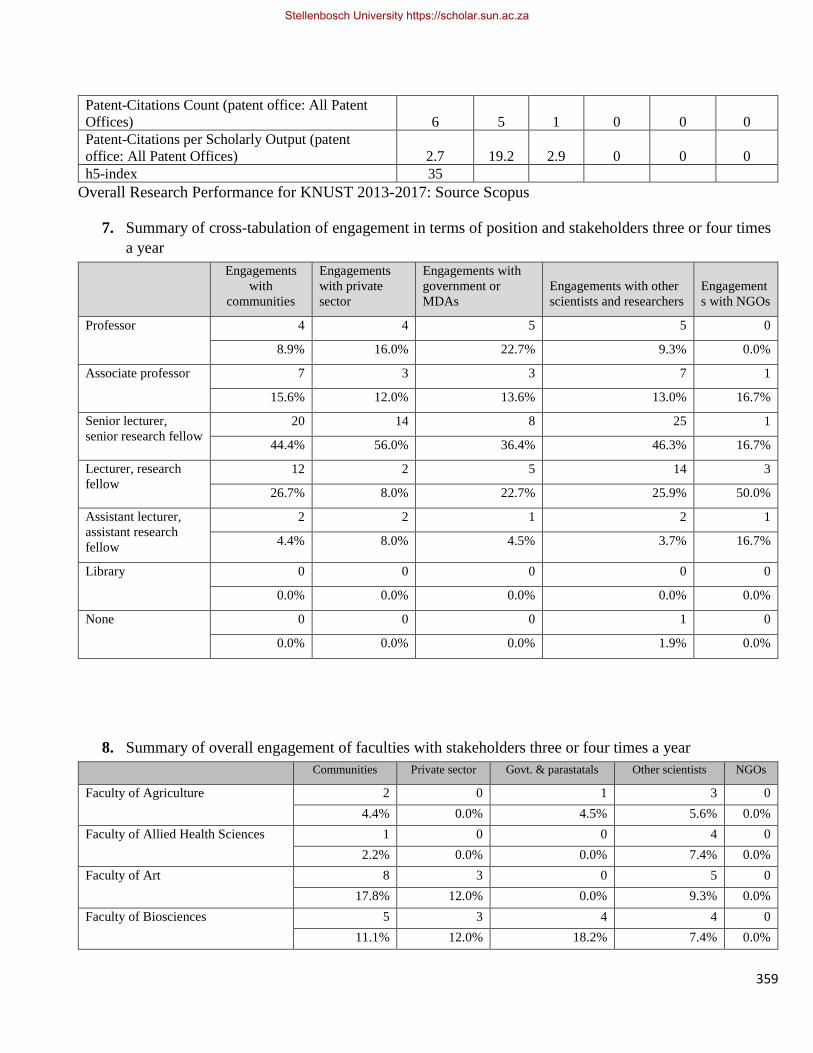
359
Patent-Citations Count (patent office: All Patent
Offices) 6 5 1 0 0 0
Patent-Citations per Scholarly Output (patent
office: All Patent Offices) 2.7 19.2 2.9 0 0 0
h5-index 35 Overall Research Performance for KNUST 2013-2017: Source Scopus
7. Summary of cross-tabulation of engagement in terms of position and stakeholders three or four times
a year
Engagements
with
communities
Engagements
with private
sector
Engagements with
government or
MDAs
Engagements with other
scientists and researchers
Engagement
s with NGOs
Professor 4 4 5 5 0
8.9% 16.0% 22.7% 9.3% 0.0%
Associate professor 7 3 3 7 1
15.6% 12.0% 13.6% 13.0% 16.7%
Senior lecturer,
senior research fellow
20 14 8 25 1
44.4% 56.0% 36.4% 46.3% 16.7%
Lecturer, research
fellow
12 2 5 14 3
26.7% 8.0% 22.7% 25.9% 50.0%
Assistant lecturer,
assistant research
fellow
2 2 1 2 1
4.4% 8.0% 4.5% 3.7% 16.7%
Library 0 0 0 0 0
0.0% 0.0% 0.0% 0.0% 0.0%
None 0 0 0 1 0
0.0% 0.0% 0.0% 1.9% 0.0%
8. Summary of overall engagement of faculties with stakeholders three or four times a year
Communities Private sector Govt. & parastatals Other scientists NGOs
Faculty of Agriculture 2 0 1 3 0
4.4% 0.0% 4.5% 5.6% 0.0%
Faculty of Allied Health Sciences 1 0 0 4 0
2.2% 0.0% 0.0% 7.4% 0.0%
Faculty of Art 8 3 0 5 0
17.8% 12.0% 0.0% 9.3% 0.0%
Faculty of Biosciences 5 3 4 4 0
11.1% 12.0% 18.2% 7.4% 0.0%
Stellenbosch University https://scholar.sun.ac.za
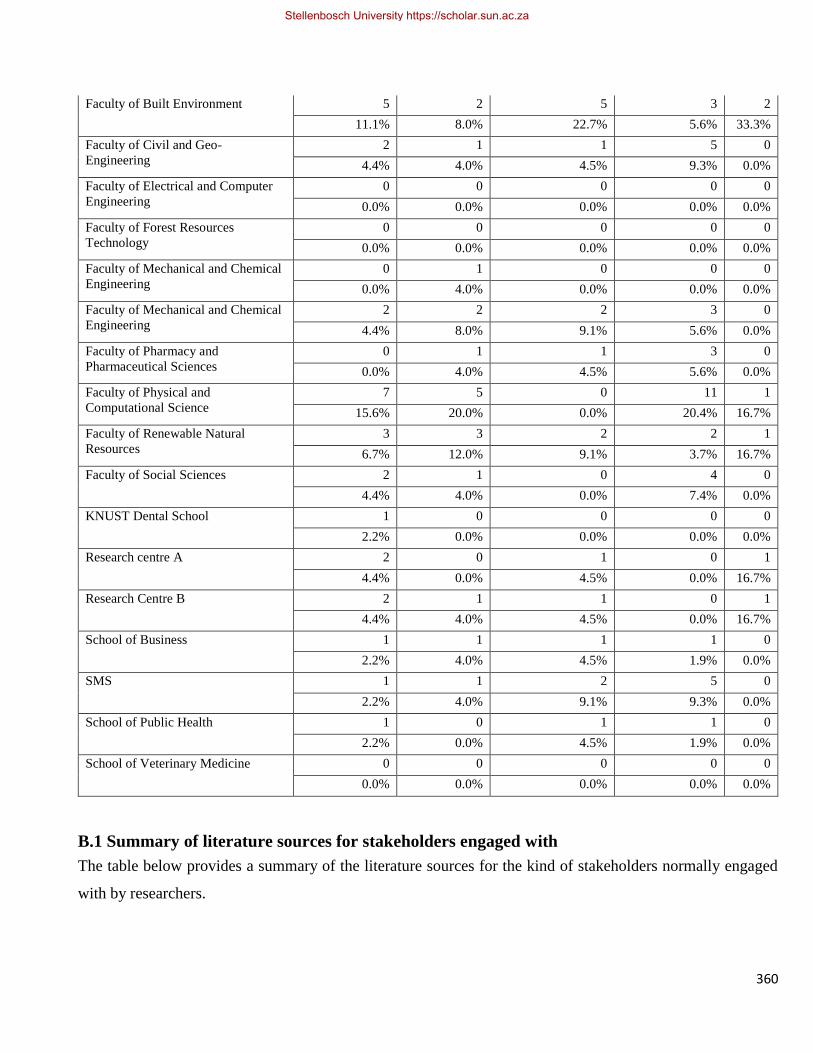
360
Faculty of Built Environment 5 2 5 3 2
11.1% 8.0% 22.7% 5.6% 33.3%
Faculty of Civil and Geo-
Engineering
2 1 1 5 0
4.4% 4.0% 4.5% 9.3% 0.0%
Faculty of Electrical and Computer
Engineering
0 0 0 0 0
0.0% 0.0% 0.0% 0.0% 0.0%
Faculty of Forest Resources
Technology
0 0 0 0 0
0.0% 0.0% 0.0% 0.0% 0.0%
Faculty of Mechanical and Chemical
Engineering
0 1 0 0 0
0.0% 4.0% 0.0% 0.0% 0.0%
Faculty of Mechanical and Chemical
Engineering
2 2 2 3 0
4.4% 8.0% 9.1% 5.6% 0.0%
Faculty of Pharmacy and
Pharmaceutical Sciences
0 1 1 3 0
0.0% 4.0% 4.5% 5.6% 0.0%
Faculty of Physical and
Computational Science
7 5 0 11 1
15.6% 20.0% 0.0% 20.4% 16.7%
Faculty of Renewable Natural
Resources
3 3 2 2 1
6.7% 12.0% 9.1% 3.7% 16.7%
Faculty of Social Sciences 2 1 0 4 0
4.4% 4.0% 0.0% 7.4% 0.0%
KNUST Dental School 1 0 0 0 0
2.2% 0.0% 0.0% 0.0% 0.0%
Research centre A 2 0 1 0 1
4.4% 0.0% 4.5% 0.0% 16.7%
Research Centre B 2 1 1 0 1
4.4% 4.0% 4.5% 0.0% 16.7%
School of Business 1 1 1 1 0
2.2% 4.0% 4.5% 1.9% 0.0%
SMS 1 1 2 5 0
2.2% 4.0% 9.1% 9.3% 0.0%
School of Public Health 1 0 1 1 0
2.2% 0.0% 4.5% 1.9% 0.0%
School of Veterinary Medicine 0 0 0 0 0
0.0% 0.0% 0.0% 0.0% 0.0%
B.1 Summary of literature sources for stakeholders engaged with
The table below provides a summary of the literature sources for the kind of stakeholders normally engaged
with by researchers.
Stellenbosch University https://scholar.sun.ac.za
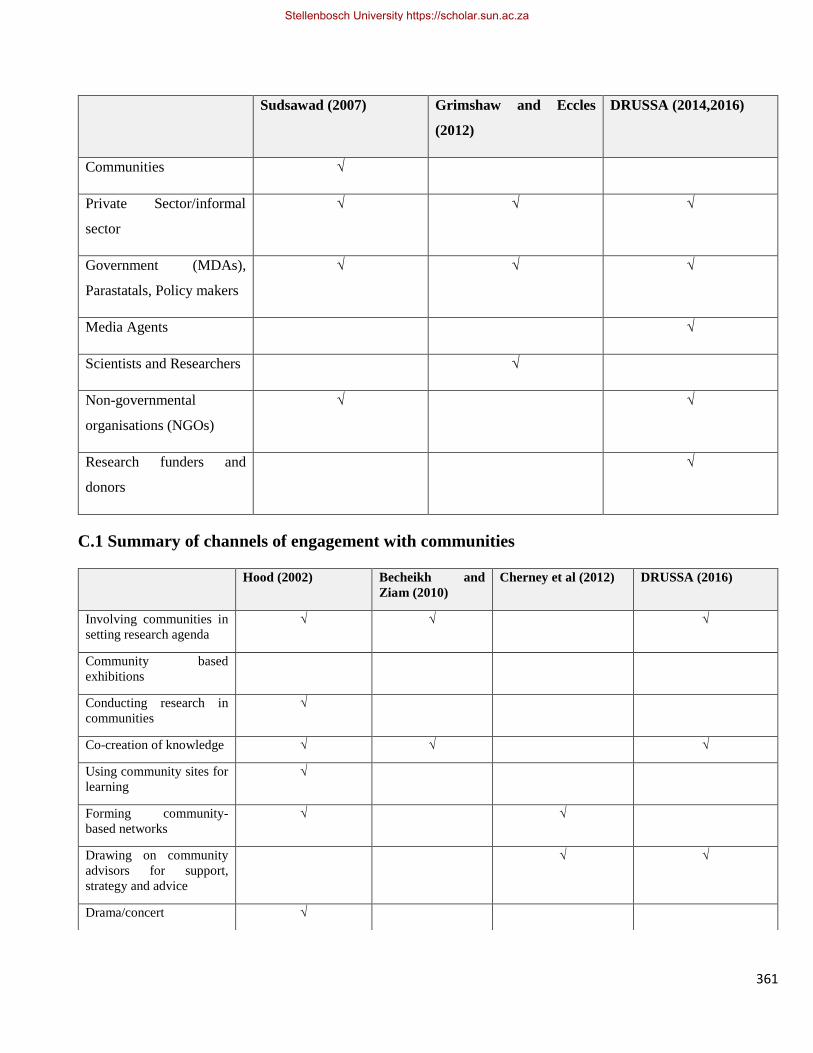
361
Sudsawad (2007) Grimshaw and Eccles
(2012)
DRUSSA (2014,2016)
Communities √
Private Sector/informal
sector
√ √ √
Government (MDAs),
Parastatals, Policy makers
√ √ √
Media Agents √
Scientists and Researchers √
Non-governmental
organisations (NGOs)
√ √
Research funders and
donors
√
C.1 Summary of channels of engagement with communities
Hood (2002) Becheikh and
Ziam (2010)
Cherney et al (2012) DRUSSA (2016)
Involving communities in
setting research agenda
√ √ √
Community based
exhibitions
Conducting research in
communities
√
Co-creation of knowledge √ √ √
Using community sites for
learning
√
Forming community-
based networks
√ √
Drawing on community
advisors for support,
strategy and advice
√ √
Drama/concert √
Stellenbosch University https://scholar.sun.ac.za
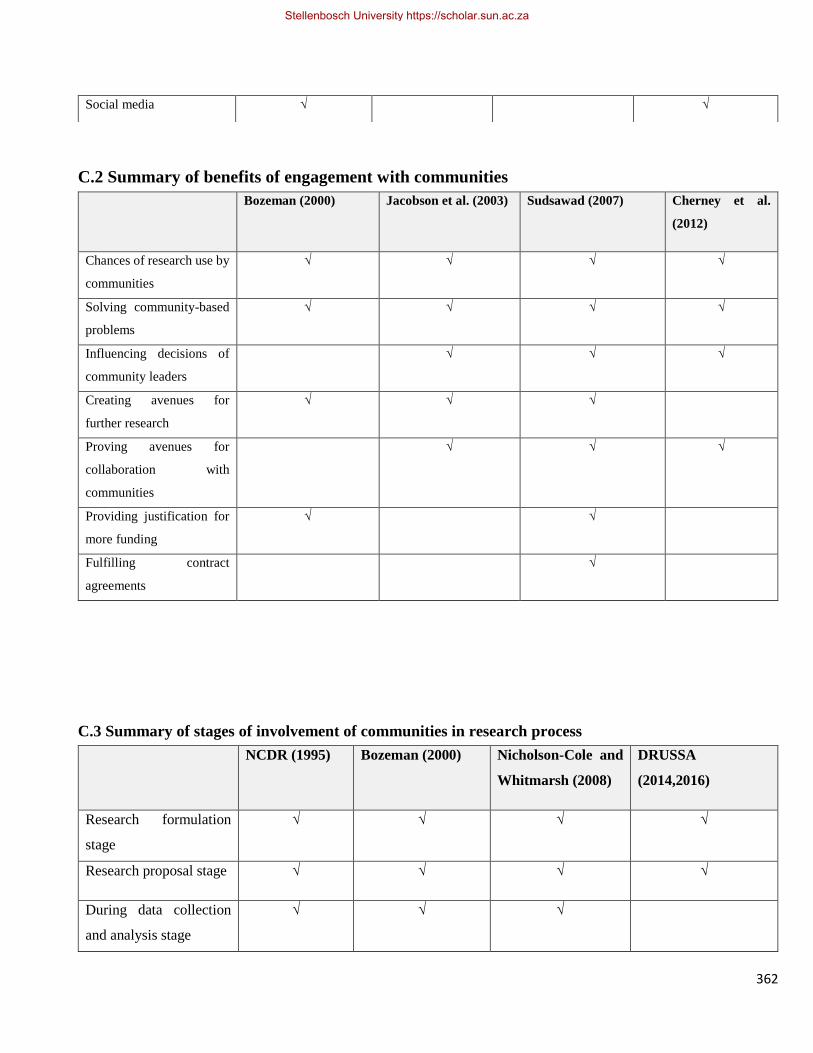
362
C.2 Summary of benefits of engagement with communities
Bozeman (2000) Jacobson et al. (2003) Sudsawad (2007) Cherney et al.
(2012)
Chances of research use by
communities
√ √ √ √
Solving community-based
problems
√ √ √ √
Influencing decisions of
community leaders
√ √ √
Creating avenues for
further research
√ √ √
Proving avenues for
collaboration with
communities
√ √ √
Providing justification for
more funding
√ √
Fulfilling contract
agreements
√
C.3 Summary of stages of involvement of communities in research process
NCDR (1995) Bozeman (2000) Nicholson-Cole and
Whitmarsh (2008)
DRUSSA
(2014,2016)
Research formulation
stage
√ √ √ √
Research proposal stage √ √ √ √
During data collection
and analysis stage
√ √ √
Social media √ √
Stellenbosch University https://scholar.sun.ac.za

363
During all stages of the
research process
√ √ √
During the research
report drafting stage
√ √ √
During the final report
stage
√ √ √
During the research
dissemination stage
√ √ √
C.4 Summary of barriers to engagement with communities
The table below provides the sources of the options as discussed in the literature.
Sedlacko and Pisano
(2013)
Humphries (2014) Oliver and Innvar (2014)
Financial constraints to
implement findings
√ √ √
Lack of human resource
capacity to support and
disseminate research
√ √ √
Lack of expertise in
science communication
√ √ √
Misunderstanding and
wrong perception of
research
√ √
Lack of personal
motivation to disseminate
research
√ √
Research findings not
being relevant to
communities
√ √
Stellenbosch University https://scholar.sun.ac.za
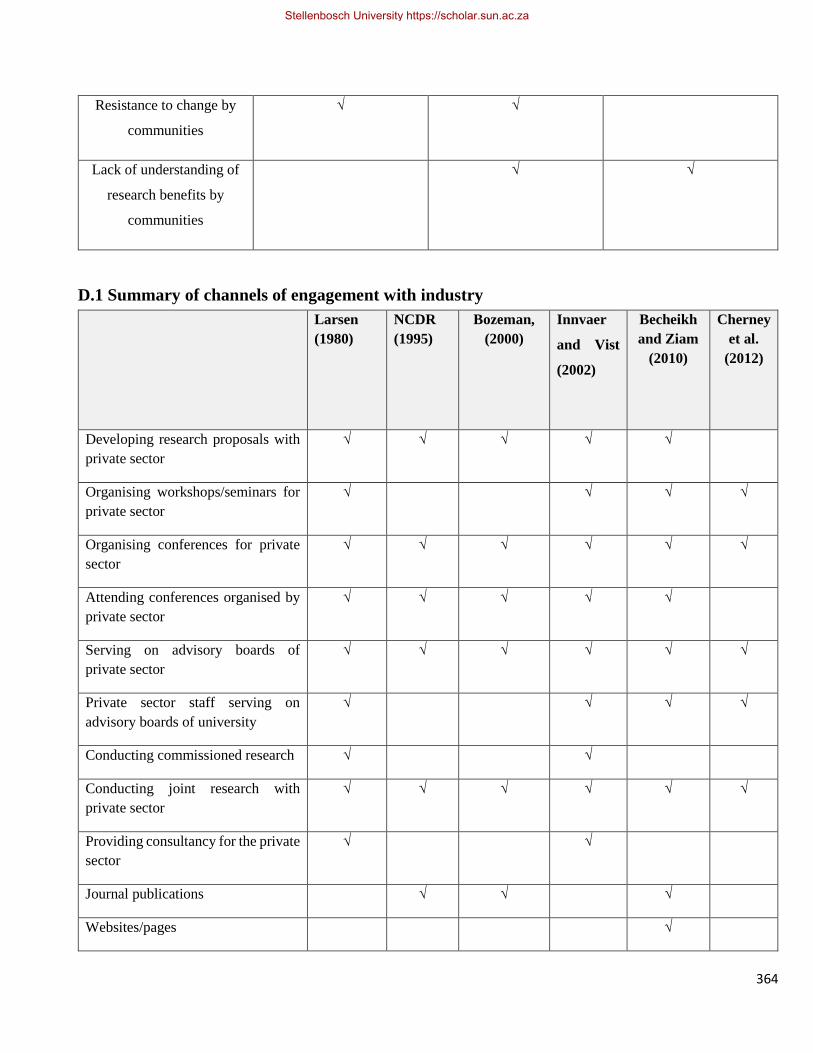
364
Resistance to change by
communities
√ √
Lack of understanding of
research benefits by
communities
√ √
D.1 Summary of channels of engagement with industry
Larsen
(1980)
NCDR
(1995)
Bozeman,
(2000)
Innvaer
and Vist
(2002)
Becheikh
and Ziam
(2010)
Cherney
et al.
(2012)
Developing research proposals with
private sector
√ √ √ √ √
Organising workshops/seminars for
private sector
√ √ √ √
Organising conferences for private
sector
√ √ √ √ √ √
Attending conferences organised by
private sector
√ √ √ √ √
Serving on advisory boards of
private sector
√ √ √ √ √ √
Private sector staff serving on
advisory boards of university
√ √ √ √
Conducting commissioned research √ √
Conducting joint research with
private sector
√ √ √ √ √ √
Providing consultancy for the private
sector
√ √
Journal publications √ √ √
Websites/pages √
Stellenbosch University https://scholar.sun.ac.za
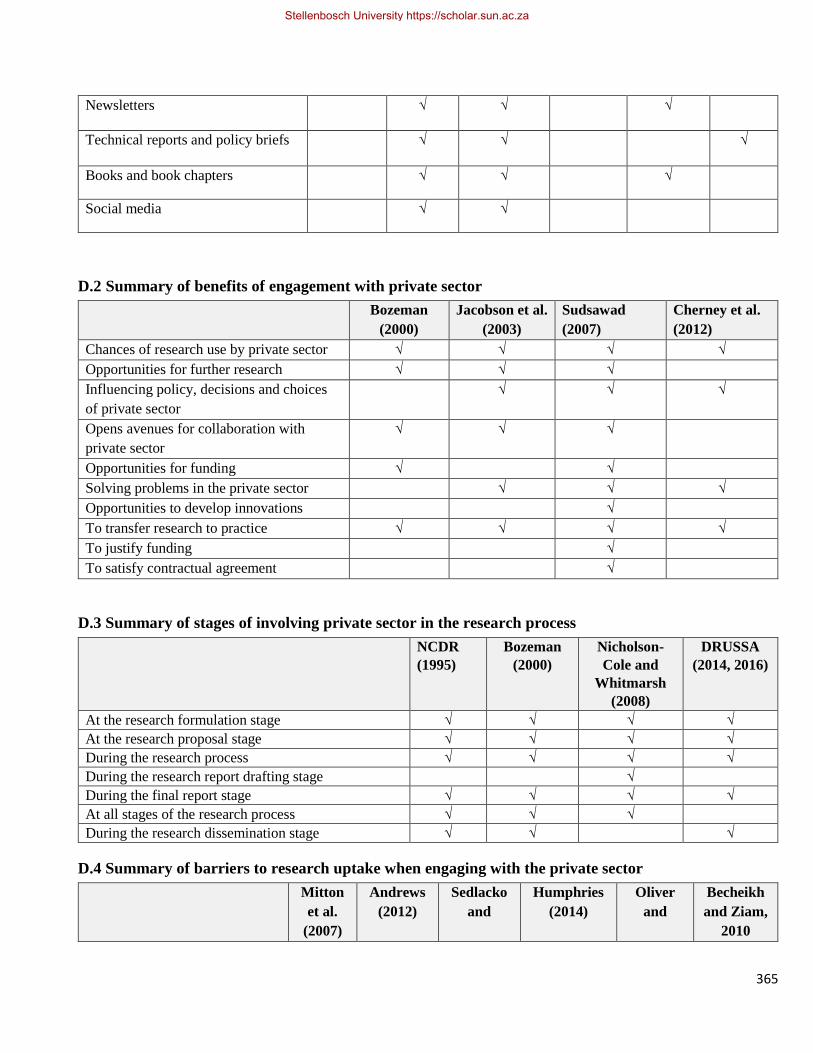
365
Newsletters √ √ √
Technical reports and policy briefs √ √ √
Books and book chapters √ √ √
Social media √ √
D.2 Summary of benefits of engagement with private sector
Bozeman
(2000)
Jacobson et al.
(2003)
Sudsawad
(2007)
Cherney et al.
(2012)
Chances of research use by private sector √ √ √ √
Opportunities for further research √ √ √
Influencing policy, decisions and choices
of private sector
√ √ √
Opens avenues for collaboration with
private sector
√ √ √
Opportunities for funding √ √
Solving problems in the private sector √ √ √
Opportunities to develop innovations √
To transfer research to practice √ √ √ √
To justify funding √
To satisfy contractual agreement √
D.3 Summary of stages of involving private sector in the research process
NCDR
(1995)
Bozeman
(2000)
Nicholson-
Cole and
Whitmarsh
(2008)
DRUSSA
(2014, 2016)
At the research formulation stage √ √ √ √
At the research proposal stage √ √ √ √
During the research process √ √ √ √
During the research report drafting stage √
During the final report stage √ √ √ √
At all stages of the research process √ √ √
During the research dissemination stage √ √ √
D.4 Summary of barriers to research uptake when engaging with the private sector
Mitton
et al.
(2007)
Andrews
(2012)
Sedlacko
and
Humphries
(2014)
Oliver
and
Becheikh
and Ziam,
2010
Stellenbosch University https://scholar.sun.ac.za
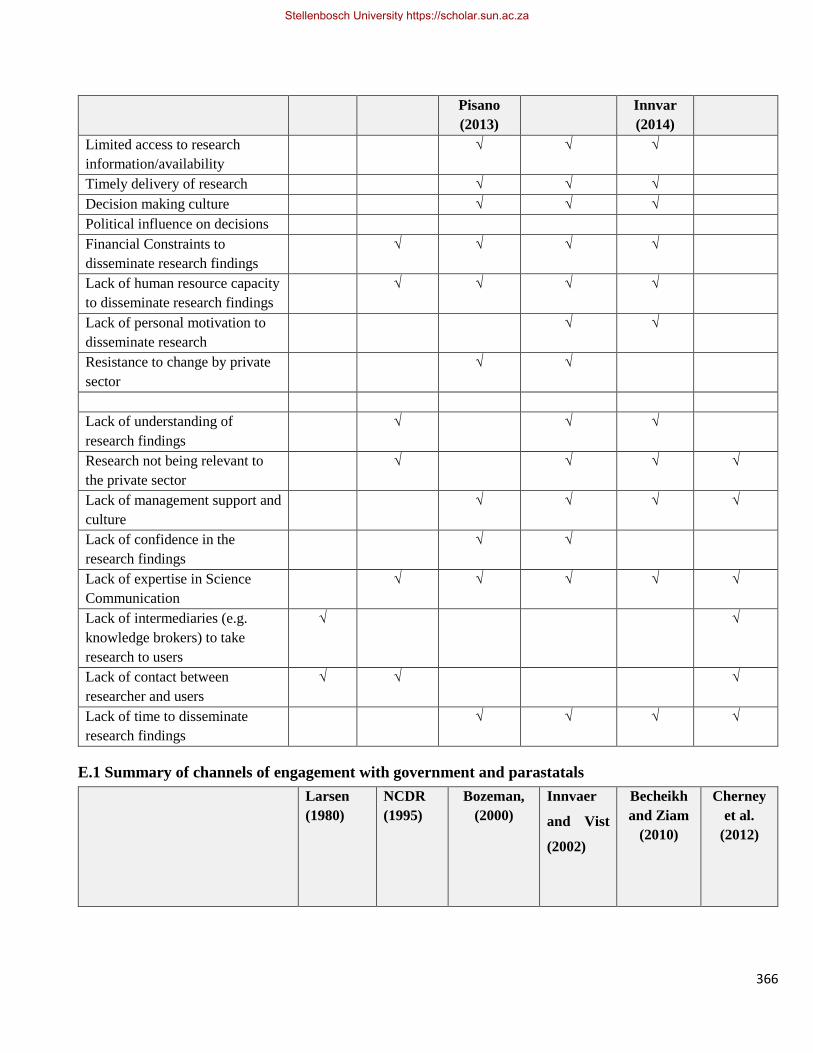
366
Pisano
(2013)
Innvar
(2014)
Limited access to research
information/availability
√ √ √
Timely delivery of research √ √ √
Decision making culture √ √ √
Political influence on decisions
Financial Constraints to
disseminate research findings
√ √ √ √
Lack of human resource capacity
to disseminate research findings
√ √ √ √
Lack of personal motivation to
disseminate research
√ √
Resistance to change by private
sector
√ √
Lack of understanding of
research findings
√ √ √
Research not being relevant to
the private sector
√ √ √ √
Lack of management support and
culture
√ √ √ √
Lack of confidence in the
research findings
√ √
Lack of expertise in Science
Communication
√ √ √ √ √
Lack of intermediaries (e.g.
knowledge brokers) to take
research to users
√ √
Lack of contact between
researcher and users
√ √ √
Lack of time to disseminate
research findings
√ √ √ √
E.1 Summary of channels of engagement with government and parastatals
Larsen
(1980)
NCDR
(1995)
Bozeman,
(2000)
Innvaer
and Vist
(2002)
Becheikh
and Ziam
(2010)
Cherney
et al.
(2012)
Stellenbosch University https://scholar.sun.ac.za
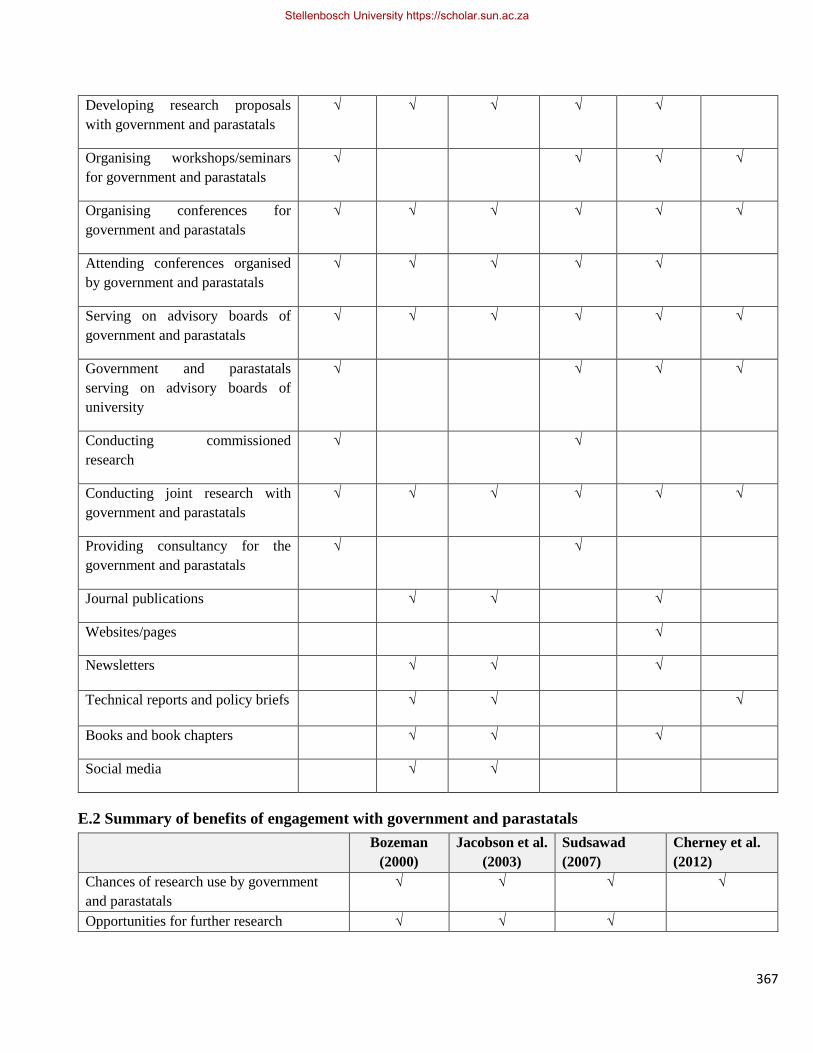
367
Developing research proposals
with government and parastatals
√ √ √ √ √
Organising workshops/seminars
for government and parastatals
√ √ √ √
Organising conferences for
government and parastatals
√ √ √ √ √ √
Attending conferences organised
by government and parastatals
√ √ √ √ √
Serving on advisory boards of
government and parastatals
√ √ √ √ √ √
Government and parastatals
serving on advisory boards of
university
√ √ √ √
Conducting commissioned
research
√ √
Conducting joint research with
government and parastatals
√ √ √ √ √ √
Providing consultancy for the
government and parastatals
√ √
Journal publications √ √ √
Websites/pages √
Newsletters √ √ √
Technical reports and policy briefs √ √ √
Books and book chapters √ √ √
Social media √ √
E.2 Summary of benefits of engagement with government and parastatals
Bozeman
(2000)
Jacobson et al.
(2003)
Sudsawad
(2007)
Cherney et al.
(2012)
Chances of research use by government
and parastatals
√ √ √ √
Opportunities for further research √ √ √
Stellenbosch University https://scholar.sun.ac.za
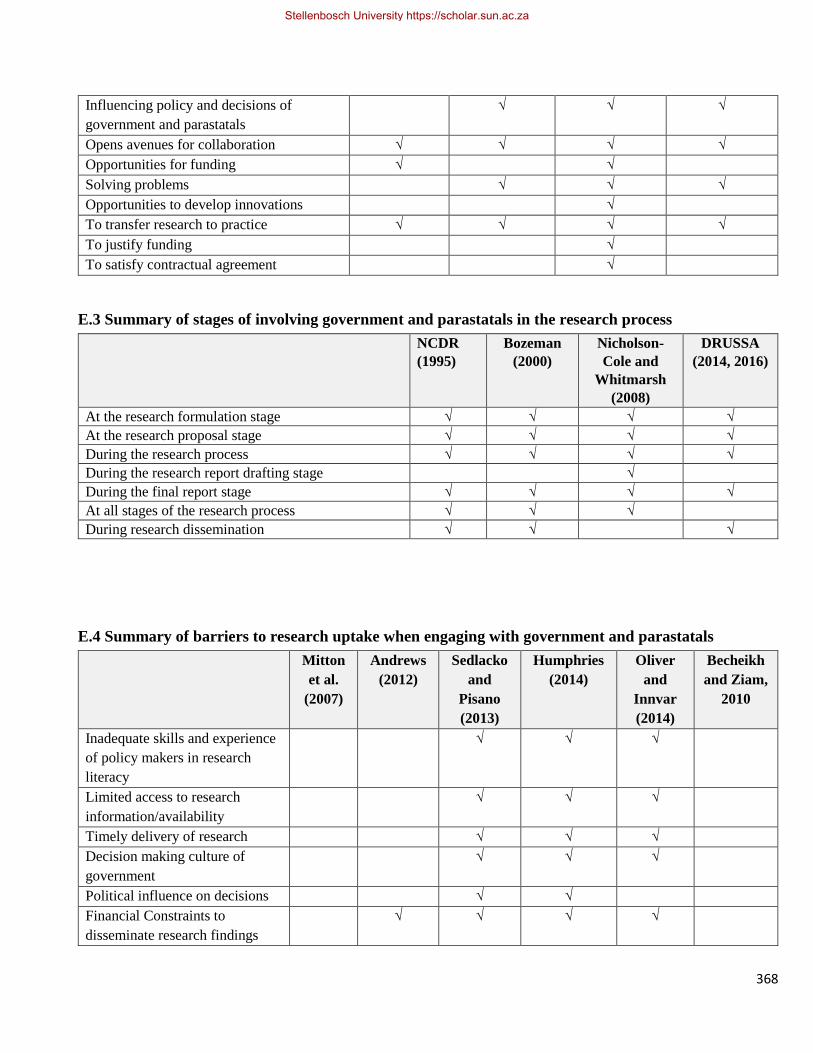
368
Influencing policy and decisions of
government and parastatals
√ √ √
Opens avenues for collaboration √ √ √ √
Opportunities for funding √ √
Solving problems √ √ √
Opportunities to develop innovations √
To transfer research to practice √ √ √ √
To justify funding √
To satisfy contractual agreement √
E.3 Summary of stages of involving government and parastatals in the research process
NCDR
(1995)
Bozeman
(2000)
Nicholson-
Cole and
Whitmarsh
(2008)
DRUSSA
(2014, 2016)
At the research formulation stage √ √ √ √
At the research proposal stage √ √ √ √
During the research process √ √ √ √
During the research report drafting stage √
During the final report stage √ √ √ √
At all stages of the research process √ √ √
During research dissemination √ √ √
E.4 Summary of barriers to research uptake when engaging with government and parastatals
Mitton
et al.
(2007)
Andrews
(2012)
Sedlacko
and
Pisano
(2013)
Humphries
(2014)
Oliver
and
Innvar
(2014)
Becheikh
and Ziam,
2010
Inadequate skills and experience
of policy makers in research
literacy
√ √ √
Limited access to research
information/availability
√ √ √
Timely delivery of research √ √ √
Decision making culture of
government
√ √ √
Political influence on decisions √ √
Financial Constraints to
disseminate research findings
√ √ √ √
Stellenbosch University https://scholar.sun.ac.za
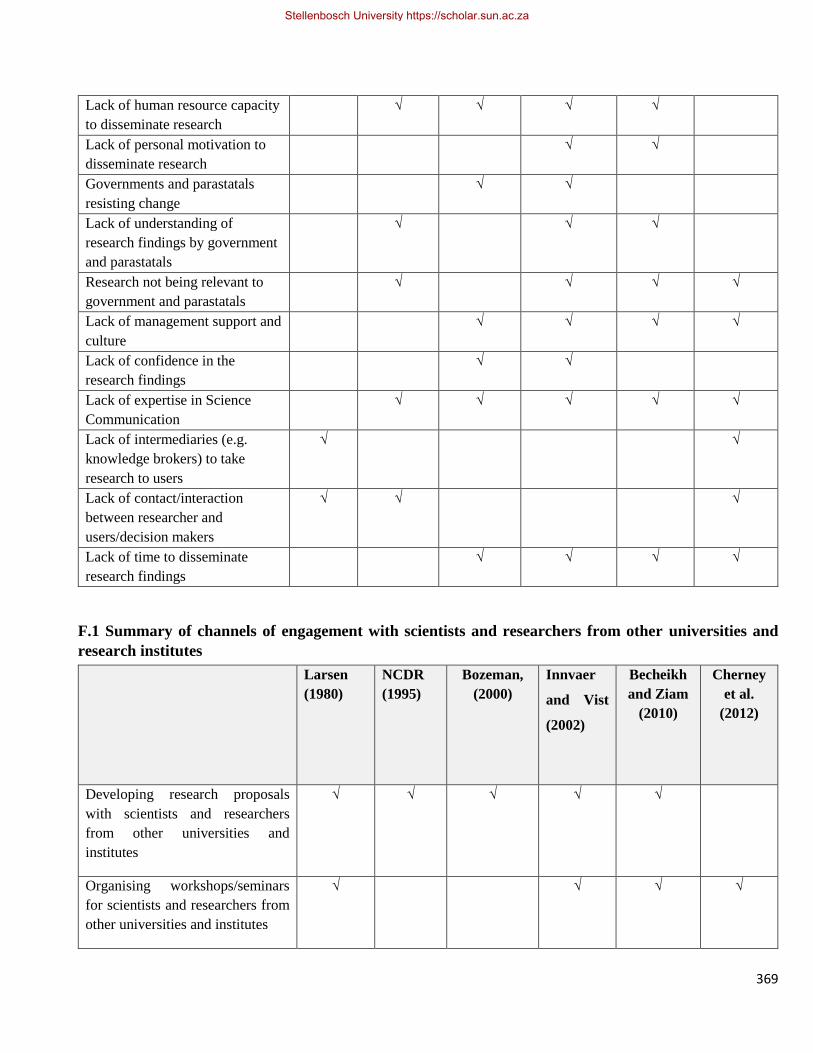
369
Lack of human resource capacity
to disseminate research
√ √ √ √
Lack of personal motivation to
disseminate research
√ √
Governments and parastatals
resisting change
√ √
Lack of understanding of
research findings by government
and parastatals
√ √ √
Research not being relevant to
government and parastatals
√ √ √ √
Lack of management support and
culture
√ √ √ √
Lack of confidence in the
research findings
√ √
Lack of expertise in Science
Communication
√ √ √ √ √
Lack of intermediaries (e.g.
knowledge brokers) to take
research to users
√ √
Lack of contact/interaction
between researcher and
users/decision makers
√ √ √
Lack of time to disseminate
research findings
√ √ √ √
F.1 Summary of channels of engagement with scientists and researchers from other universities and
research institutes
Larsen
(1980)
NCDR
(1995)
Bozeman,
(2000)
Innvaer
and Vist
(2002)
Becheikh
and Ziam
(2010)
Cherney
et al.
(2012)
Developing research proposals
with scientists and researchers
from other universities and
institutes
√ √ √ √ √
Organising workshops/seminars
for scientists and researchers from
other universities and institutes
√ √ √ √
Stellenbosch University https://scholar.sun.ac.za

370
Organising conferences for
scientists and researchers from
other universities and institutes
√ √ √ √ √ √
Attending conferences organised
by scientists and researchers from
other universities and institutes
√ √ √ √ √
Serving on advisory boards of
scientists and researchers from
other universities and institutes
√ √ √ √ √ √
Scientists and researchers from
other universities and institutes
serving on advisory boards of
university
√ √ √
Conducting commissioned
research
√ √
Conducting joint research with
scientists and researchers from
other universities and institutes
√ √ √ √ √ √
Providing consultancy for the
scientists and researchers from
other universities and institutes
√ √
Journal publications √ √ √
Websites/pages √
Newsletters √ √ √
Technical reports and policy briefs √ √ √
Books and book chapters √ √ √
Social media √ √
F.2 Summary of benefits of engagement with scientists and researchers from other universities and
research institutes
Bozeman
(2000)
Jacobson et al.
(2003)
Sudsawad
(2007)
Cherney et al.
(2012)
Stellenbosch University https://scholar.sun.ac.za
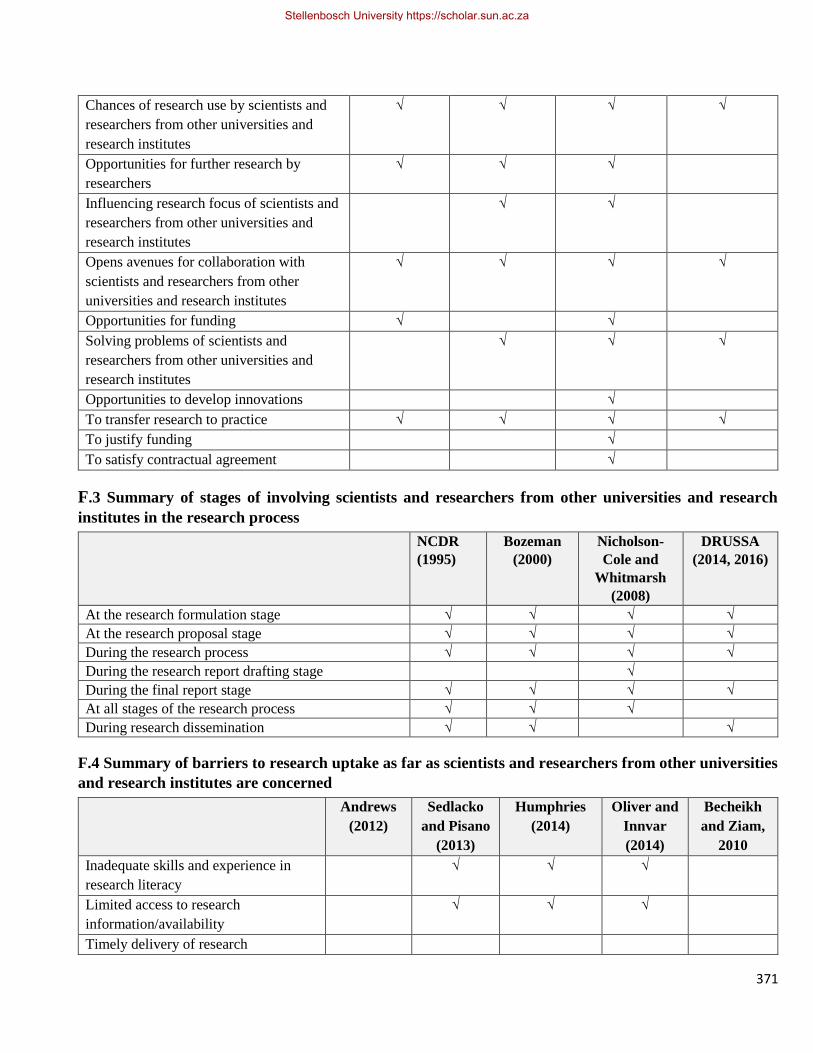
371
Chances of research use by scientists and
researchers from other universities and
research institutes
√ √ √ √
Opportunities for further research by
researchers
√ √ √
Influencing research focus of scientists and
researchers from other universities and
research institutes
√ √
Opens avenues for collaboration with
scientists and researchers from other
universities and research institutes
√ √ √ √
Opportunities for funding √ √
Solving problems of scientists and
researchers from other universities and
research institutes
√ √ √
Opportunities to develop innovations √
To transfer research to practice √ √ √ √
To justify funding √
To satisfy contractual agreement √
F.3 Summary of stages of involving scientists and researchers from other universities and research
institutes in the research process
NCDR
(1995)
Bozeman
(2000)
Nicholson-
Cole and
Whitmarsh
(2008)
DRUSSA
(2014, 2016)
At the research formulation stage √ √ √ √
At the research proposal stage √ √ √ √
During the research process √ √ √ √
During the research report drafting stage √
During the final report stage √ √ √ √
At all stages of the research process √ √ √
During research dissemination √ √ √
F.4 Summary of barriers to research uptake as far as scientists and researchers from other universities
and research institutes are concerned
Andrews
(2012)
Sedlacko
and Pisano
(2013)
Humphries
(2014)
Oliver and
Innvar
(2014)
Becheikh
and Ziam,
2010
Inadequate skills and experience in
research literacy
√ √ √
Limited access to research
information/availability
√ √ √
Timely delivery of research
Stellenbosch University https://scholar.sun.ac.za
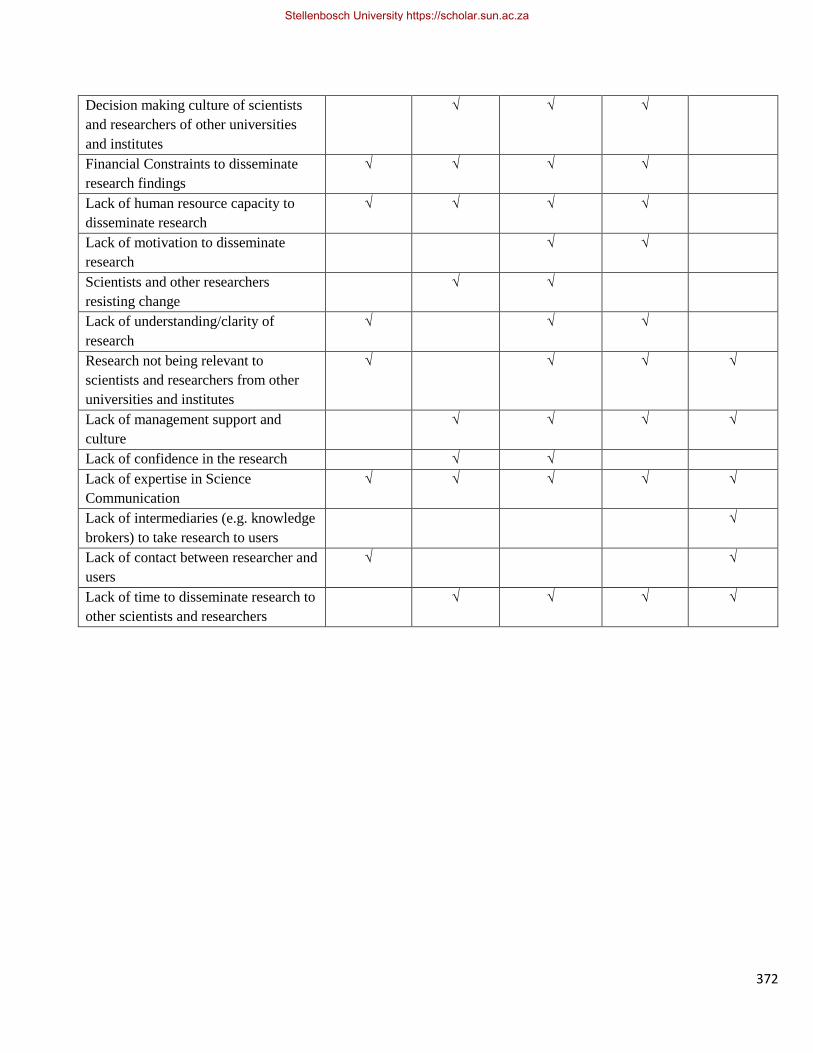
372
Decision making culture of scientists
and researchers of other universities
and institutes
√ √ √
Financial Constraints to disseminate
research findings
√ √ √ √
Lack of human resource capacity to
disseminate research
√ √ √ √
Lack of motivation to disseminate
research
√ √
Scientists and other researchers
resisting change
√ √
Lack of understanding/clarity of
research
√ √ √
Research not being relevant to
scientists and researchers from other
universities and institutes
√ √ √ √
Lack of management support and
culture
√ √ √ √
Lack of confidence in the research √ √
Lack of expertise in Science
Communication
√ √ √ √ √
Lack of intermediaries (e.g. knowledge
brokers) to take research to users
√
Lack of contact between researcher and
users
√ √
Lack of time to disseminate research to
other scientists and researchers
√ √ √ √
Stellenbosch University https://scholar.sun.ac.za