researcharticle associationbetweendnamethylationin...
TRANSCRIPT
RESEARCH ARTICLE
Association between DNA Methylation inWhole Blood and Measures of GlucoseMetabolism: KORA F4 StudyJennifer Kriebel1,2,3☯, Christian Herder3,4☯, Wolfgang Rathmann5☯, SimoneWahl1,2,3,Sonja Kunze1,2, Sophie Molnos1,2,3, Nadezda Volkova1,2, Katharina Schramm6,7,Maren Carstensen-Kirberg3,4, Melanie Waldenberger1,2, Christian Gieger1,2,Annette Peters1,2,3, Thomas Illig8,9, Holger Prokisch6,7‡, Michael Roden3,4,10‡,Harald Grallert1,2,3‡*
1 Research Unit of Molecular Epidemiology, Helmholtz ZentrumMuenchen, German Research Center forEnvironmental Health, Neuherberg, Germany, 2 Institute of Epidemiology II, Helmholtz ZentrumMuenchen,German Research Center for Environmental Health, Neuherberg, Germany, 3 German Center for DiabetesResearch (DZD), Muenchen-Neuherberg, Germany, 4 Institute for Clinical Diabetology, German DiabetesCenter, Leibniz Center for Diabetes Research at Heinrich Heine University Duesseldorf, Duesseldorf,Germany, 5 Institute for Biometrics and Epidemiology, German Diabetes Center, Leibniz Center for DiabetesResearch at Heinrich Heine University Duesseldorf, Duesseldorf, Germany, 6 Institute of Human Genetics,Helmholtz ZentrumMuenchen, German Research Center for Environmental Health, Neuherberg, Germany,7 Institute of Human Genetics, Technische Universitaet Muenchen, Munich, Germany, 8 Hannover UnifiedBiobank, Hannover Medical School, Hanover, Germany, 9 Institute of Human Genetics, Hannover MedicalSchool, Hanover, Germany, 10 Department of Endocrinology and Diabetology, University HospitalDuesseldorf, Duesseldorf, Germany
☯ These authors contributed equally to this work.‡ These authors also contributed equally to this work.* [email protected]
AbstractEpigenetic regulation has been postulated to affect glucose metabolism, insulin sensitivity
and the risk of type 2 diabetes. Therefore, we performed an epigenome-wide association
study for measures of glucose metabolism in whole blood samples of the population-based
Cooperative Health Research in the Region of Augsburg F4 study using the Illumina
HumanMethylation 450 BeadChip. We identified a total of 31 CpG sites where methylation
level was associated with measures of glucose metabolism after adjustment for age, sex,
smoking, and estimated white blood cell proportions and correction for multiple testing
using the Benjamini-Hochberg (B-H) method (four for fasting glucose, seven for fasting
insulin, 25 for homeostasis model assessment-insulin resistance [HOMA-IR]; B-H-adjusted
p-values between 9.2x10⁻⁵ and 0.047). In addition, DNA methylation at cg06500161 (anno-
tated to ABCG1) was associated with all the aforementioned phenotypes and 2-hour glu-
cose (B-H-adjusted p-values between 9.2x10⁻⁵ and 3.0x10⁻³). Methylation status of
additional three CpG sites showed an association with fasting insulin only after additional
adjustment for body mass index (BMI) (B-H-adjusted p-values = 0.047). Overall, effect
strengths were reduced by around 30% after additional adjustment for BMI, suggesting that
this variable has an influence on the investigated phenotypes. Furthermore, we found signif-
icant associations between methylation status of 21 of the aforementioned CpG sites and 2-
PLOS ONE | DOI:10.1371/journal.pone.0152314 March 28, 2016 1 / 25
OPEN ACCESS
Citation: Kriebel J, Herder C, Rathmann W, Wahl S,Kunze S, Molnos S, et al. (2016) Associationbetween DNA Methylation in Whole Blood andMeasures of Glucose Metabolism: KORA F4 Study.PLoS ONE 11(3): e0152314. doi:10.1371/journal.pone.0152314
Editor: Jorg Tost, CEA - Institut de Genomique,FRANCE
Received: October 9, 2015
Accepted: March 11, 2016
Published: March 28, 2016
Copyright: © 2016 Kriebel et al. This is an openaccess article distributed under the terms of theCreative Commons Attribution License, which permitsunrestricted use, distribution, and reproduction in anymedium, provided the original author and source arecredited.
Data Availability Statement: Data are subject tonational data protection laws and only available uponformal request. The KORA data are easily accessiblevia the online portal KORA.passt. (https://epi.helmholtz-muenchen.de/).
Funding: The KORA study was initiated andfinanced by the Helmholtz Zentrum München –German Research Center for Environmental Health,which is funded by the German Federal Ministry ofEducation and Research (BMBF) and by the State ofBavaria. Furthermore, KORA research wassupported within the Munich Center of Health
hour insulin in a subset of samples with seven significant associations persisting after addi-
tional adjustment for BMI. In a subset of 533 participants, methylation of the CpG site
cg06500161 (ABCG1) was inversely associated with ABCG1 gene expression (B-H-
adjusted p-value = 1.5x10⁻⁹). Additionally, we observed an enrichment of the top 1,000 CpG
sites for diabetes-related canonical pathways using Ingenuity Pathway Analysis. In conclu-
sion, our study indicates that DNA methylation and diabetes-related traits are associated
and that these associations are partially BMI-dependent. Furthermore, the interaction of
ABCG1 with glucose metabolism is modulated by epigenetic processes.
IntroductionMany factors, not only environment and lifestyle, but also genes, contribute to the developmentof type 2 diabetes (T2D) [1, 2]. The heritability of T2D and related traits has been estimated tobe between 15 and 85% [3–7]. So far, 88 genetic susceptibility loci for T2D have been identified.However, these loci explain only 5–10% of the estimated heritability [8–13]. The analysis ofDNAmethylation patterns is expected to reveal epigenetic modifications associated with T2Dat a genome-wide scale and may therefore hopefully help to clarify some of the missing herita-bility and improve our understanding of the pathomechanisms leading to T2D.
A small number of cross-sectional studies have provided first evidence for an associationbetween DNA methylation and T2D. In skeletal muscle, peroxisome proliferator-activatedreceptor gamma (PPARgamma) coactivator-1 alpha (PGC-1alpha) is hypermethylated in T2Dpatients compared to glucose tolerant individuals [14]. Furthermore, increased DNA methyla-tion on the FTO obesity susceptibility haplotype was found when comparing human wholeblood of 30 diabetic females and 30 females without diabetes [15]. A larger study comprising710 T2D cases and 459 controls observed an excess of differentially methylated sites in genomicregions that are associated with T2D [16]. However, analyses of genome-wide DNAmethyla-tion and T2D-related traits as the phenotypes of interest in a population-based setting usingwhole blood have not been previously published.
Hallmarks in the pathogenesis of T2D are reduced insulin sensitivity and impaired insulinsecretion, which eventually lead to chronic hyperglycemia [17, 18]. Therefore, we aimed toinvestigate (i) associations between DNA methylation and T2D-related traits [glucose, insulin,HOMA-IR (homeostasis model assessment-insulin resistance)]; (ii) the impact of BMI onthese associations; (iii) associations between DNA methylation at the significant CpG sites andgene expression; and (iv) the enrichment for pathways linked to diabetes. To these ends, weperformed epigenome-wide association studies (EWAS) using whole blood samples from apopulation-based prospective study, the Cooperative Health Research in the Region of Augs-burg (KORA) F4 study. We provide evidence that the interaction of ABCG1 with glucosemetabolism is modulated by epigenetic processes.
Material/Methods
Ethics statementThe study was conducted according to the principles expressed in the Declaration of Helsinki.Written informed consent was obtained from all participants. The study, including the proto-col for subject recruitment and assessment and the informed consent for participants, wasreviewed and approved by the local ethical committee (Bayerische Landesärztekammer).
DNAMethylation and Glucose Metabolism
PLOSONE | DOI:10.1371/journal.pone.0152314 March 28, 2016 2 / 25
Sciences (MC-Health), Ludwig-Maximilians-Universität, as part of LMUinnovativ. This work wassupported by the Ministry of Science and Research ofthe State of North Rhine-Westphalia (MIWF NRW)and the German Federal Ministry of Health (BMG).The diabetes part of the KORA F4 study was fundedby a grant from the German Research Foundation(DFG; RA 459/3-1). This study was supported by theGerman Center for Diabetes Research (DZD e.V.).
Competing Interests: The authors have declaredthat no competing interests exist.

Study populationThe KORA studies comprise a series of independent population-based epidemiological surveysand follow-up examinations of individuals living in the region of Augsburg and two adjacentcounties in Southern Germany [19]. No evidence for population stratification in the KORAstudy was found [20].
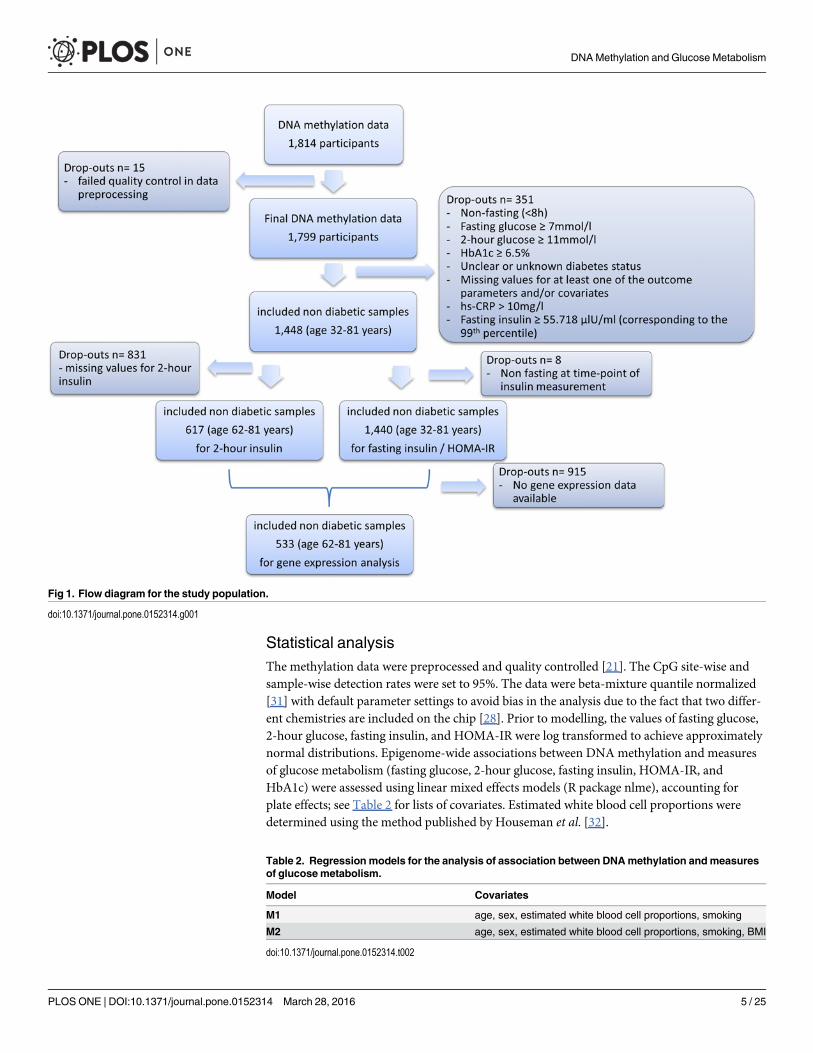
DNA methylation data were generated for 1,814 participants of the KORA F4 study (2006–2008), who were randomly selected from a total of 3,080 KORA F4 participants aged between32 and 81 years [21]. Fifteen samples were excluded upon quality control, resulting in 1,799participants available for our study. In addition, 351 participants were excluded due to exhibit-ing at least one of the following criteria:
• non-fasting (less than 8 hours),
• overt diabetes (fasting glucose� 7 mmol/l and/or 2-hour glucose� 11.1 mmol/l and/orHbA1c� 6.5% [22] and/or known diabetes and/or diabetes treatment),
• unknown diabetes status as well as unclear information concerning the diabetes status,
• missing values in at least one of the outcome parameters and/or covariates,
• hsC-reactive protein> 10 mg/l (as an indicator for an acute infection),
• participants with fasting insulin� 55.718 [μlU/ml] (corresponding to the 99th percentile) asthey clearly represented outliers in the dataset for this variable.
Data from 1,448 non-diabetic individuals aged between 32 and 81 years (see also Table 1)were included in the EWAS of fasting glucose, 2-hour glucose, and HbA1c (Fig 1). For theEWAS of fasting insulin and HOMA-IR and 2-hour insulin, 1,440 (aged 32–81 years) and 617(aged 62–81 years) participants were included, respectively (S1 and S2 Tables, Fig 1). Geneexpression analyses were possible in a subgroup of 533 subjects aged 62 to 81 years for whomboth gene expression data and methylation data were available (S3 Table, Fig 1) [23].
Assessment of diabetes-related traitsFor the determination of fasting glucose and 2-hour glucose levels, fasting venous blood andblood samples after an oral glucose tolerance test (OGTT) for all non-diabetic participantswere collected and analyzed as described elsewhere [24–26]. HbA1c values in blood were deter-mined using high performance liquid chromatography (HPLC) (Menarini HA-8160) [24].Fasting insulin was measured by ELISA [27]. HOMA-IR was calculated as [fasting plasma glu-cose (mmol/l) x fasting serum insulin (mU/l) / 22.5] [25]. Diabetes status was determined in allsurveys via self-report. Self-reports were subsequently validated by contacting the treating phy-sician or additionally performing an OGTT [24].
Genome-wide DNAmethylation analysisGenomic DNA (1 µg), isolated from whole blood, was bisulfite converted using the EZ-96DNAMethylation Kit (Zymo Research, Orange, CA, USA) as described recently [21].Genome-wide DNAmethylation was investigated using the Illumina HumanMethylation 450BeadChip (Illumina, San Diego, CA, USA) following the Illumina Infinium HDMethylationinstructions as described [21]. This array comprises>485,000 CpG sites covering 99% of thegenes in the reference sequence database [28]. Probes are distributed over the whole gene,including the promotor region, gene body, 3`UTR, and intergenic region [28, 29]. Beta valuesrepresenting continuous numbers between 0 and 1 reflecting the methylation degree were
DNAMethylation and Glucose Metabolism
PLOSONE | DOI:10.1371/journal.pone.0152314 March 28, 2016 3 / 25
exported and used for statistical analysis, since methylation in this study is considered as theindependent variable. GenomeStudio (version 2010.3) with Methylation Module (version1.8.5) was used to process the raw image data generated by the BeadArray Reader. Initial qual-ity control of assay performance was undertaken using “Control Dashboard” provided by Gen-omeStudio Software, including the assessment of staining, extension, hybridization, targetremoval, bisulfite conversion, specificity, negative, and non-polymorphic control.
Gene expression studiesTotal RNA was extracted from whole blood taken under fasting conditions according to themanufacturer’s instructions using the PAXgene Blood miRNA Kit (QIAGEN, Redwood City,CA, USA). Gene expression profiling was done using the Illumina Human HT-12 v3 Expres-sion BeadChip (Illumina, San Diego, CA, USA) as described elsewhere [23, 30].
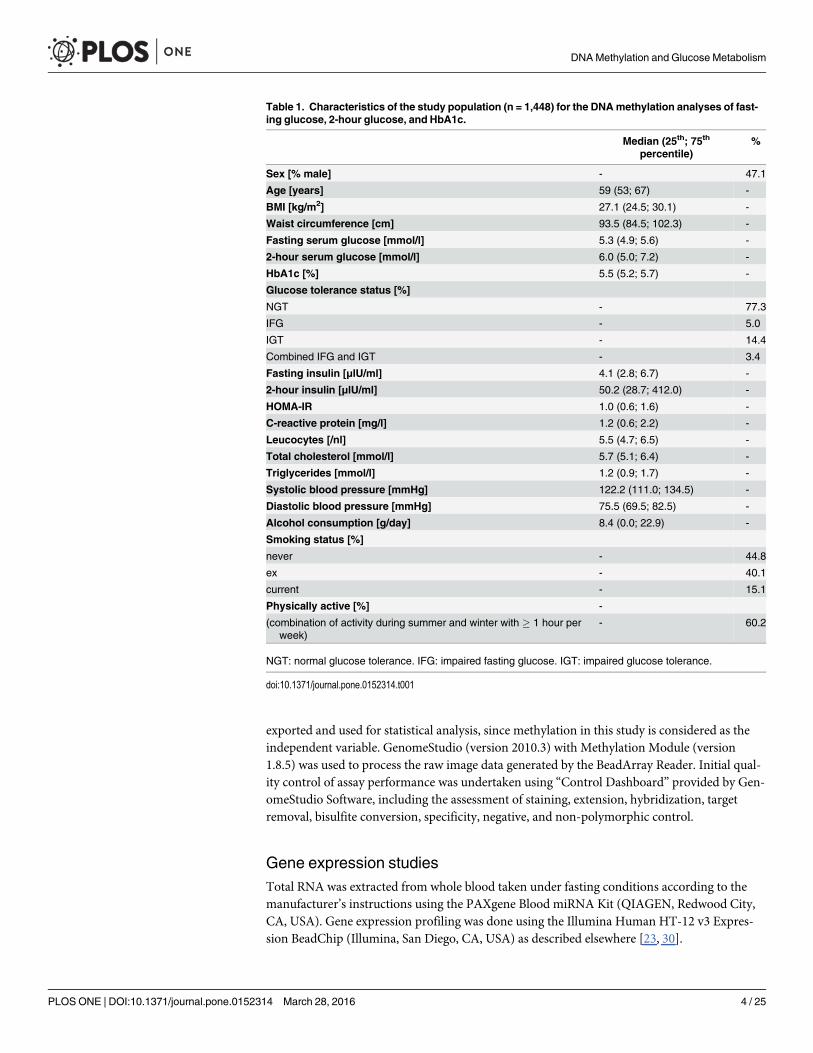
Table 1. Characteristics of the study population (n = 1,448) for the DNAmethylation analyses of fast-ing glucose, 2-hour glucose, and HbA1c.
Median (25th; 75th
percentile)%
Sex [% male] - 47.1
Age [years] 59 (53; 67) -
BMI [kg/m2] 27.1 (24.5; 30.1) -
Waist circumference [cm] 93.5 (84.5; 102.3) -
Fasting serum glucose [mmol/l] 5.3 (4.9; 5.6) -
2-hour serum glucose [mmol/l] 6.0 (5.0; 7.2) -
HbA1c [%] 5.5 (5.2; 5.7) -
Glucose tolerance status [%]
NGT - 77.3
IFG - 5.0
IGT - 14.4
Combined IFG and IGT - 3.4
Fasting insulin [μlU/ml] 4.1 (2.8; 6.7) -
2-hour insulin [μlU/ml] 50.2 (28.7; 412.0) -
HOMA-IR 1.0 (0.6; 1.6) -
C-reactive protein [mg/l] 1.2 (0.6; 2.2) -
Leucocytes [/nl] 5.5 (4.7; 6.5) -
Total cholesterol [mmol/l] 5.7 (5.1; 6.4) -
Triglycerides [mmol/l] 1.2 (0.9; 1.7) -
Systolic blood pressure [mmHg] 122.2 (111.0; 134.5) -
Diastolic blood pressure [mmHg] 75.5 (69.5; 82.5) -
Alcohol consumption [g/day] 8.4 (0.0; 22.9) -
Smoking status [%]
never - 44.8
ex - 40.1
current - 15.1
Physically active [%] -
(combination of activity during summer and winter with � 1 hour perweek)
- 60.2
NGT: normal glucose tolerance. IFG: impaired fasting glucose. IGT: impaired glucose tolerance.
doi:10.1371/journal.pone.0152314.t001
DNAMethylation and Glucose Metabolism
PLOSONE | DOI:10.1371/journal.pone.0152314 March 28, 2016 4 / 25
Statistical analysisThe methylation data were preprocessed and quality controlled [21]. The CpG site-wise andsample-wise detection rates were set to 95%. The data were beta-mixture quantile normalized[31] with default parameter settings to avoid bias in the analysis due to the fact that two differ-ent chemistries are included on the chip [28]. Prior to modelling, the values of fasting glucose,2-hour glucose, fasting insulin, and HOMA-IR were log transformed to achieve approximatelynormal distributions. Epigenome-wide associations between DNAmethylation and measuresof glucose metabolism (fasting glucose, 2-hour glucose, fasting insulin, HOMA-IR, andHbA1c) were assessed using linear mixed effects models (R package nlme), accounting forplate effects; see Table 2 for lists of covariates. Estimated white blood cell proportions weredetermined using the method published by Houseman et al. [32].
Fig 1. Flow diagram for the study population.
doi:10.1371/journal.pone.0152314.g001
Table 2. Regression models for the analysis of association between DNAmethylation andmeasuresof glucosemetabolism.
Model Covariates
M1 age, sex, estimated white blood cell proportions, smoking
M2 age, sex, estimated white blood cell proportions, smoking, BMI
doi:10.1371/journal.pone.0152314.t002
DNAMethylation and Glucose Metabolism
PLOSONE | DOI:10.1371/journal.pone.0152314 March 28, 2016 5 / 25
Furthermore, 2-hour insulin, cubic root transformed, was analyzed similarly for those CpGsites whose methylation levels showed genome-wide significance in model 1 for at least one ofthe phenotypes mentioned above, due to the smaller number of samples with available 2-hourinsulin data. All results were corrected for multiple testing using the Benjamini-Hochberg(B-H) method [33]. We checked whether the detected CpG site contained SNPs with MAF�0.05 within the probe-binding regions. Cg09349128, cg15309457 and cg27434584 has to beregarded with caution as SNPs were included in the probe-binding region, which could lead toan influence of probe binding. Cross-reactive probes were checked using the list provided byChen et al. [34]. For sensitivity analyses the study population was stratified according to DNAmethylation quintiles for the CpG sites whose methylation levels showed significant associa-tions with our phenotypes of interest, and p-values were determined using linear regression forcontinuous variables and Χ2 tests for categorical variables.
For a subset of 533 participants both methylation and gene expression data were available.In this subset the associations between methylation at the significant CpGs and gene expressionat nearby genes were analyzed using linear regression models. Transcript probes that mappedto a ±500kb window around the CpG site were included. Models were adjusted for the geneexpression specific technical variables [23] sample storage time, RNA integrity number (RIN),and RNA amplification batch, as well as for the methylation specific variables age, sex, BMI,smoking, estimated white blood cell proportions [32], and plate. We accounted for multipletesting using the B-H correction. For methylation as well as gene expression analysis resultswere defined as significant if the B-H-adjusted p-value was<0.05. All statistical analyses wereperformed using R (version 2.15.3 or higher).
Pathway analysisThe Ingenuity Pathway Analysis (IPA) software (IPA build version: 364062M, content version:26127183, release date: 2015-12-12, analysis date: 2016-01-08, http://www.ingenuity.com/)(QIAGEN, Redwood City, CA, USA) was used to detect potential pathways and networks inthe DNA methylation data relevant in the cross-sectional study in an unbiased way. Weincluded the 1,000 CpG sites with the smallest p-values for association with the respective traitsand conducted pathway analysis separately for each trait. The database underlying IPA isreferred to as the Ingenuity Knowledge Base (Gene and Endogenous Chemicals). The referenceset was restricted to genes represented on the Illumina HT-12 v4 BeadChip, and only humanannotations were considered. Pathway analyses were performed with IPA’s Core Analysismodule. Canonical pathways with a p-value<0.05 after B-H correction were defined as a sta-tistically significant overrepresentation of input genes in a given process.
Results
Study populationCharacteristics of the main study population of 1,448 individuals (for the analyses of fastingglucose, 2-hour glucose and HbA1c) are provided in Table 1. S1 and S2 Tables give the corre-sponding information for the subgroups of 1,440 and 617 individuals for the analyses of fastinginsulin/HOMA-IR and 2-hour insulin, respectively.
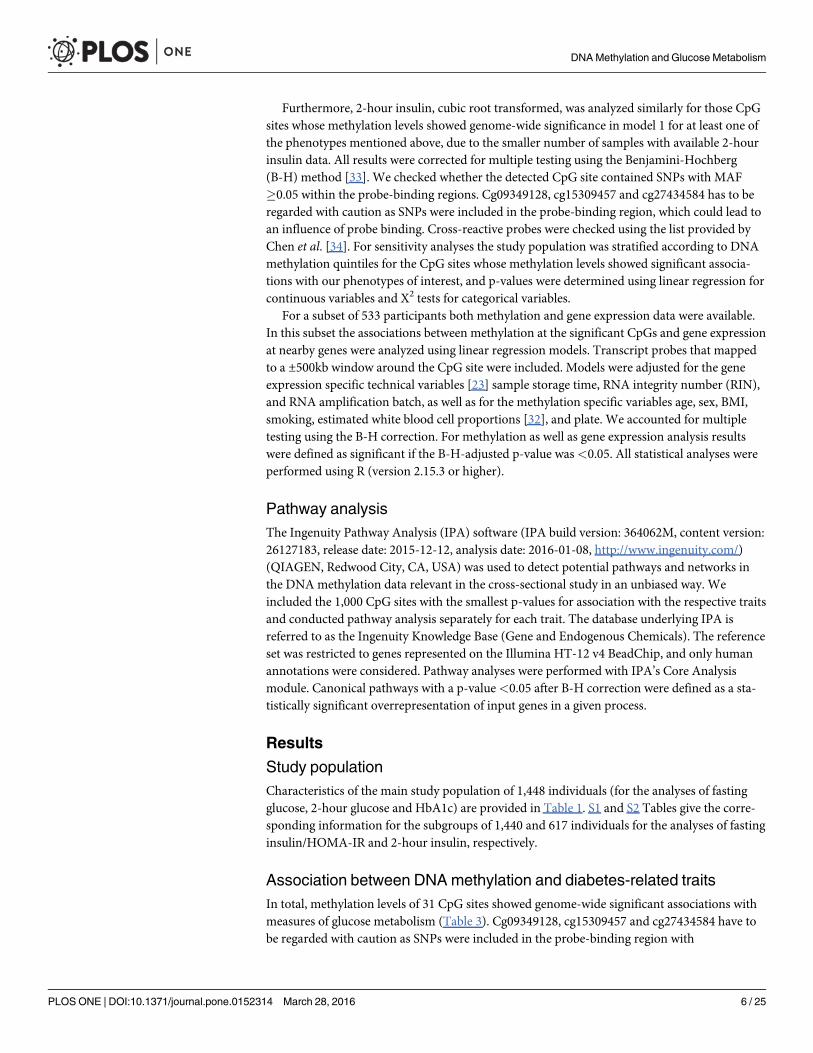
Association between DNAmethylation and diabetes-related traitsIn total, methylation levels of 31 CpG sites showed genome-wide significant associations withmeasures of glucose metabolism (Table 3). Cg09349128, cg15309457 and cg27434584 have tobe regarded with caution as SNPs were included in the probe-binding region with
DNAMethylation and Glucose Metabolism
PLOSONE | DOI:10.1371/journal.pone.0152314 March 28, 2016 6 / 25
Tab
le3.
Res
ultsforas
sociationsbetwee
ngen
ome-wideDNAmethylationleve
lsan
dfastinggluco
se,2
-hourgluco
se,fas
tinginsu
lin,2
-hourinsu
lin,a
ndHOMA-IR
,after
adjustmen
tfordifferentp
otential
confounders.
Age,
sex,
estimated
whitebloodce
llproportions,
smoking(m
odel
1)Age,
sex,
estimated
whitebloodce
llproportions,
BMI,sm
oking(m
odel
2)
Phen
otype
CpG
Annotated
gen
eLoca
tionon
chromoso
me
Loca
tionwithin
gen
eRelationto
CpG
island
Coefficien
tp-value
B-H
-adjusted
p-value
Coefficien
tp-value
B-H
-adjusted
p-value
Fas
tinggluco
secg
0057
4958
CPT1
A11
:686
0762
25'UTR
NSho
re-0.097
9.8x
10-8
0.01
4-0.060
5.8x
10-4
0.98
5
cg06
5001
61ABCG1
21:436
5658
7ge
nebo
dySSho
re0.04
44.2x
10-10
9.2x
10-5
0.02
61.2x
10-4
0.83
3
cg07
5049
77un
anno
tated
10:102
1310
12-
NShe
lf0.02
32.0x
10-7
0.02
20.01
75.5x
10-5
0.71
2
cg11
0246
82SREBF1
17:177
3009
4ge
nebo
dySShe
lf0.05
62.5x
10-10
9.2x
10-5
0.04
12.0x
10-6
0.56
9
cg22
0408
09#
HCG11
6:26
5225
78ge
nebo
dyIsland
-0.021
3.2x
10-7
0.02
9-0.018
9.6x
10-6
0.62
7
2-hourgluco
secg
0650
0161
ABCG1
21:436
5658
7ge
nebo
dySSho
re0.04
24.6x
10-9
2.0x
10-3
0.02
71.6x
10-4
0.98
1
Fas
tinginsu
lin*
cg03
5812
71PALL
D4:16
9806
766
gene
body
-0.03
22.5x
10-5
0.18
30.03
55.2x
10-7
0.04
7
cg06
5001
61ABCG1
21:436
5658
7ge
nebo
dySSho
re0.04
36.9x
10-9
3.0x
10-3
0.01
88.6x
10-3
0.37
3
cg07
0922
12DGKZ
11:463
8254
4ge
nebo
dy,T
SS15
00$
--0.080
1.7x
10-7
0.01
5-0.066
2.8x
10-6
0.11
1
cg09
6131
92un
anno
tated
2:18
1388
538
--
0.02
13.0x
10-7
0.01
70.01
34.7x
10-4
0.33
1
cg09
6947
82un
anno
tated
2:97
4087
99-
SShe
lf-0.037
5.8x
10-8
0.01
1-0.031
4.7x
10-7
0.04
7
cg11
3761
47SLC
43A1
11:572
6119
8ge
nebo
dy-
-0.076
2.1x
10-7
0.01
5-0.041
2.3x
10-3
0.34
0
cg13
0169
16CREB3L
27:13
7660
322
gene
body
-0.01
61.2x
10-6
0.05
10.01
55.1x
10-7
0.04
7
cg17
2662
33DGKZ
11:463
8272
5ge
nebo
dy,T
SS15
00$
--0.102
1.6x
10-7
0.01
5-0.088
6.3x
10-7
0.04
7
cg17
9715
78STK
401:36
8524
63TSS15
00SSho
re-0.039
2.7x
10-7
0.01
7-0.019
5.5x
10-3
0.35
6
cg22
0657
33un
anno
tated
8:11
8013
20-
--0.067
7.2x
10-8
0.01
1-0.057
5.3x
10-7
0.04
7
cg23
8996
54un
anno
tated
8:11
7599
30-
Island
-0.073
1.4x
10-6
0.05
1-0.068
6.1x
10-7
0.04
7
2-hourinsu
lin**
*cg
0057
4958
CPT1
A11
:686
0762
25'UTR
N_S
hore
-0.101
8.1x
10-4
3.4x
10-3
-0.063
0.03
00.08
9
cg01
7518
00ANKRD56
4:77
8203
91TSS15
00S_S
hore
-0.017
0.01
60.03
1-0.014
0.03
20.08
9
cg02
7116
08SLC
1A5
19:472
8796
41s
tExo
n,5'UTR,g
enebo
dyN_S
helf
-0.025
0.01
80.03
1-0.010
0.29
60.41
7
cg03
9792
41EPB49
8:21
9168
241s
tExo
n,5'UTR$
S_S
helf
0.04
49.0x
10-4
3.4x
10-3
0.04
26.0x
10-4
9.4x
10-3
cg04
1613
65DHRS13
17:272
3039
3TSS15
00S_S
hore
-0.030
0.01
60.03
1-0.018
0.12
00.19
6
cg06
5001
61ABCG1
21:436
5658
7ge
nebo
dyS_S
hore
0.05
82.9x
10-7
9.0x
10-6
0.04
02.0x
10-4
6.1x
10-3
cg06
9467
97un
anno
tated
16:114
2240
9-
--0.032
1.5x
10-4
2.3x
10-3
-0.025
1.4x
10-3
0.01
2
cg07
5049
77un
anno
tated
10:102
1310
12-
N_S
helf
0.01
50.02
90.04
20.01
00.10
60.19
6
cg09
4693
55SKI
1:21
6188
6ge
nebo
dyS_S
hore
-0.036
9.8x
10-4
3.4x
10-3
-0.020
0.05
90.14
1
cg09
6947
82un
anno
tated
2:97
4087
99-
S_S
helf
-0.036
6.9x
10-4
3.4x
10-3
-0.031
1.6x
10-3
0.01
2
cg11
0246
82SREBF1
17:177
3009
4ge
nebo
dyS_S
helf
0.04
32.9x
10-3
8.8x
10-3
0.03
10.02
20.07
6
cg11
3075
65PXN
12:120
7011
65ge
nebo
dyN_S
hore
-0.046
4.6x
10-4
3.4x
10-3
-0.036
3.4x
10-3
0.02
1
cg11
3761
47SLC
43A1
11:572
6119
8ge
nebo
dy-
-0.077
7.4x
10-4
3.4x
10-3
-0.046
0.03
60.09
4
cg11
9908
13KIAA06
6417
:260
3739
gene
body
S_S
hore
0.06
73.5x
10-3
9.1x
10-3
0.05
87.7x
10-3
0.03
4
cg12
5937
93un
anno
tated
1:15
6074
135
--
-0.037
6.7x
10-3
0.01
6-0.010
0.43
90.54
5
cg13
0169
16CREB3L
27:13
7660
322
gene
body
-0.01
53.1x
10-3
8.8x
10-3
0.01
34.0x
10-3
0.02
1
cg15
3094
57*
unan
notated
5:17
4646
9-
Island
-0.018
0.02
70.04
2-0.005
0.49
80.55
9
cg17
5882
94un
anno
tated
2:12
9548
156
--
-0.031
0.01
20.02
6-0.020
0.08
60.17
7
cg17
9715
78STK
401:36
8524
63TSS15
00S_S
hore
-0.044
5.0x
10-4
3.4x
10-3
-0.022
0.06
70.14
7
cg20
4772
59TN
F6:31
5449
60ge
nebo
dyN_S
helf
-0.041
0.01
70.03
1-0.015
0.37
80.50
9
cg27
4345
84*
ESCO1
18:191
1405
2ge
nebo
dy-
0.03
20.02
20.03
70.03
20.01
50.05
7
HOMA-IR**
cg01
7518
00ANKRD56
4:77
8203
91TSS15
00SSho
re-0.022
2.5x
10-6
0.04
7-0.017
8.5x
10-5
0.25
9
cg02
7116
08SLC
1A5
19:472
8796
41s
tExo
n,5'UTR,g
enebo
dy$
NShe
lf-0.033
1.1x
10-6
0.03
7-0.021
5.0x
10-4
0.29
4
(Con
tinue
d)
DNA Methylation and Glucose Metabolism
PLOSONE | DOI:10.1371/journal.pone.0152314 March 28, 2016 7 / 25
Tab
le3.
(Con
tinue
d)
Age,
sex,
estimated
whitebloodce
llproportions,
smoking(m
odel
1)Age,
sex,
estimated
whitebloodce
llproportions,
BMI,sm
oking(m
odel
2)
Phen
otype
CpG
Annotated
gen
eLoca
tionon
chromoso
me
Loca
tionwithin
gen
eRelationto
CpG
island
Coefficien
tp-value
B-H
-adjusted
p-value
Coefficien
tp-value
B-H
-adjusted
p-value
cg03
9792
41EPB49
8:21
9168
241s
tExo
n,5'UTR$
SShe
lf0.03
72.8x
10-6
0.04
80.03
03.2x
10-5
0.20
8
cg04
1613
65DHRS13
17:272
3039
3TSS15
00SSho
re-0.040
1.3x
10-6
0.03
8-0.028
1.4x
10-4
0.27
3
cg06
5001
61ABCG1
21:436
5658
7ge
nebo
dySSho
re0.04
73.9x
10-10
1.7x
10-4
0.02
12.7x
10-3
0.31
4
cg06
9467
97un
anno
tated
16:114
2240
9-
--0.027
6.6x
10-7
0.02
9-0.017
3.3x
10-4
0.28
7
cg07
0922
12DGKZ
11:463
8254
4ge
nebo
dy,T
SS15
00$
--0.083
5.6x
10-8
5.6x
10-3
-0.067
9.5x
10-7
0.05
7
cg09
3491
28*
unan
notated
22:503
2798
6-
NSho
re-0.036
1.8x
10-6
0.04
2-0.019
7.7x
10-3
0.34
2
cg09
4693
55SKI
1:21
6188
6ge
nebo
dySSho
re-0.034
1.6x
10-6
0.04
0-0.019
3.1x
10-3
0.31
6
cg09
6131
92un
anno
tated
2:18
1388
538
--
0.02
13.4x
10-7
0.01
90.01
36.1x
10-4
0.29
4
cg09
6947
82un
anno
tated
2:97
4087
99-
SShe
lf-0.037
6.4x
10-8
5.6x
10-3
-0.031
5.1x
10-7
0.05
1
cg11
3075
65PXN
12:120
7011
65ge
nebo
dyN
Sho
re-0.040
2.8x
10-6
0.04
8-0.029
2.4x
10-4
0.28
7
cg11
3761
47SLC
43A1
11:572
6119
8ge
nebo
dy-
-0.079
5.1x
10-8
5.6x
10-3
-0.043
1.2x
10-3
0.30
6
cg11
9908
13KIAA06
6417
:260
3739
gene
body
SSho
re0.07
11.4x
10-6
0.03
80.05
96.7x
10-6
0.14
9
cg12
5937
93un
anno
tated
1:15
6074
135
--
-0.042
1.0x
10-6
0.03
7-0.011
0.16
60.59
5
cg13
0169
16CREB3L
27:13
7660
322
gene
body
-0.01
68.7x
10-7
0.03
50.01
53.1x
10-7
0.05
1
cg15
3094
57*
unan
notated
5:17
4646
9-
Island
-0.025
1.9x
10-6
0.04
2-0.017
5.5x
10-4
0.29
4
cg17
2662
33DGKZ
11:463
8272
5ge
nebo
dy,T
SS15
00$
--0.102
1.4x
10-7
0.01
0-0.087
5.7x
10-7
0.05
1
cg17
5882
94un
anno
tated
2:12
9548
156
--
-0.038
2.5x
10-6
0.04
7-0.027
1.8x
10-4
0.28
7
cg17
9715
78STK
401:36
8524
63TSS15
00SSho
re-0.039
1.8x
10-7
0.01
1-0.019
5.7x
10-3
0.33
4
cg18
3379
63DGKZ
11:463
8320
91s
tExo
n,5'UTR,g
enebo
dy$
--0.069
1.5x
10-6
0.03
8-0.063
1.3x
10-6
0.05
7
cg20
4772
59TN
F6:31
5449
60ge
nebo
dyN
She
lf-0.055
6.5x
10-7
0.02
9-0.031
2.6x
10-3
0.31
3
cg22
0657
33un
anno
tated
8:11
8013
20-
--0.067
5.2x
10-8
5.6x
10-3
-0.057
3.8x
10-7
0.05
1
cg22
7982
14un
anno
tated
1:21
2692
190
-SShe
lf-0.035
2.4x
10-6
0.04
7-0.024
4.3x
10-4
0.29
4
cg23
8996
54un
anno
tated
8:11
7599
30-
Island
-0.072
1.4x
10-6
0.03
8-0.068
5.6x
10-7
0.05
1
cg27
4345
84*
ESCO1
18:191
1405
2ge
nebo
dy-
0.04
12.6x
10-6
0.04
70.03
81.3x
10-6
0.05
7
Res
ults
arepres
entedwith
regres
sion
coefficien
ts(in
crea
sein
SDof
phen
otyp
epe
r1%
increa
sein
methy
latio
n),u
nadjus
tedp-va
lues
undB-H
-adjus
tedp-va
lues
.Chrom
osom
e
inform
ationisba
sedon
Gen
omeBuild
37.
#CpG
site
hasto
berega
rded
with
cautionas
itislistedas
acros
s-reac
tiveprob
eby
Che
net
al.[34
].
*CpG
site
hasto
berega
rded
with
cautionas
SNPswereinclud
edin
theprob
e-bind
ingregion
,which
couldlead
toan
influe
nceof
prob
ebind
ing.
**Ana
lyse
sforfastinginsu
linan
dHOMA-IR
werepe
rformed
with
aredu
cedda
tase
t(n=1,44
0).
***Ana
lyse
sfor2-ho
urinsu
linwerepe
rformed
with
aredu
cedda
tase
t(n=61
7)an
don
lyforCpG
sites(n
=31
)who
semethy
latio
nleve
lsweresign
ifica
ntlyas
sociated
with
the
othe
rinve
stigated
phen
otyp
es.T
SS:T
rans
criptio
nstarts
ite.
$de
pend
ingon
tran
scrip
tionva
riant.C
pGisland
:site
with
anac
cumulationof
CpG
sites.
shore:
loca
tedne
xtto
theCpG
island
.she
lf:loca
tedmorethan
2kbaw
ayfrom
theCpG
island
.S/N
forw
ard-sp
aceof
shoreor
shelf:sp
ecifies
theloca
tionin
relatio
nto
theCpG
island
(Nup
stream
theCpG
island
;Sdo
wns
trea
mtheCpG
site).
doi:10.1371/journal.pone.0152314.t003
DNAMethylation and Glucose Metabolism
PLOSONE | DOI:10.1371/journal.pone.0152314 March 28, 2016 8 / 25
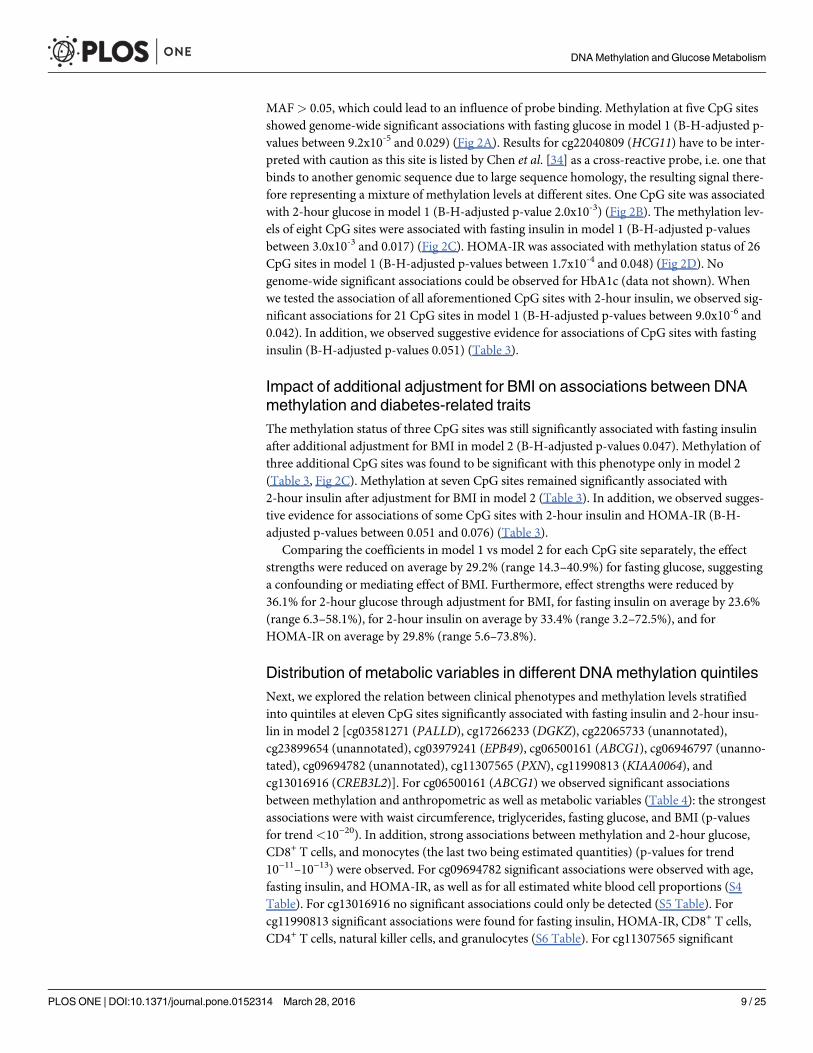
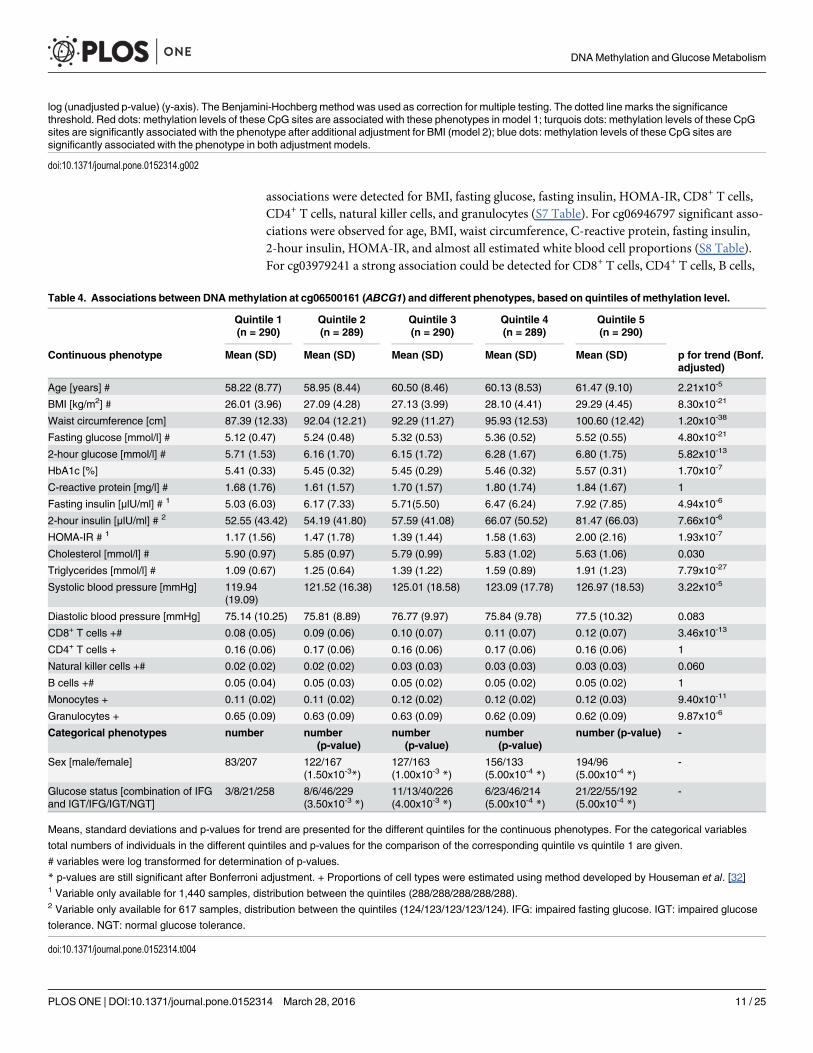
MAF> 0.05, which could lead to an influence of probe binding. Methylation at five CpG sitesshowed genome-wide significant associations with fasting glucose in model 1 (B-H-adjusted p-values between 9.2x10⁻⁵ and 0.029) (Fig 2A). Results for cg22040809 (HCG11) have to be inter-preted with caution as this site is listed by Chen et al. [34] as a cross-reactive probe, i.e. one thatbinds to another genomic sequence due to large sequence homology, the resulting signal there-fore representing a mixture of methylation levels at different sites. One CpG site was associatedwith 2-hour glucose in model 1 (B-H-adjusted p-value 2.0x10⁻³) (Fig 2B). The methylation lev-els of eight CpG sites were associated with fasting insulin in model 1 (B-H-adjusted p-valuesbetween 3.0x10⁻³ and 0.017) (Fig 2C). HOMA-IR was associated with methylation status of 26CpG sites in model 1 (B-H-adjusted p-values between 1.7x10⁻⁴ and 0.048) (Fig 2D). Nogenome-wide significant associations could be observed for HbA1c (data not shown). Whenwe tested the association of all aforementioned CpG sites with 2-hour insulin, we observed sig-nificant associations for 21 CpG sites in model 1 (B-H-adjusted p-values between 9.0x10⁻⁶ and0.042). In addition, we observed suggestive evidence for associations of CpG sites with fastinginsulin (B-H-adjusted p-values 0.051) (Table 3).
Impact of additional adjustment for BMI on associations between DNAmethylation and diabetes-related traitsThe methylation status of three CpG sites was still significantly associated with fasting insulinafter additional adjustment for BMI in model 2 (B-H-adjusted p-values 0.047). Methylation ofthree additional CpG sites was found to be significant with this phenotype only in model 2(Table 3, Fig 2C). Methylation at seven CpG sites remained significantly associated with2-hour insulin after adjustment for BMI in model 2 (Table 3). In addition, we observed sugges-tive evidence for associations of some CpG sites with 2-hour insulin and HOMA-IR (B-H-adjusted p-values between 0.051 and 0.076) (Table 3).
Comparing the coefficients in model 1 vs model 2 for each CpG site separately, the effectstrengths were reduced on average by 29.2% (range 14.3–40.9%) for fasting glucose, suggestinga confounding or mediating effect of BMI. Furthermore, effect strengths were reduced by36.1% for 2-hour glucose through adjustment for BMI, for fasting insulin on average by 23.6%(range 6.3–58.1%), for 2-hour insulin on average by 33.4% (range 3.2–72.5%), and forHOMA-IR on average by 29.8% (range 5.6–73.8%).
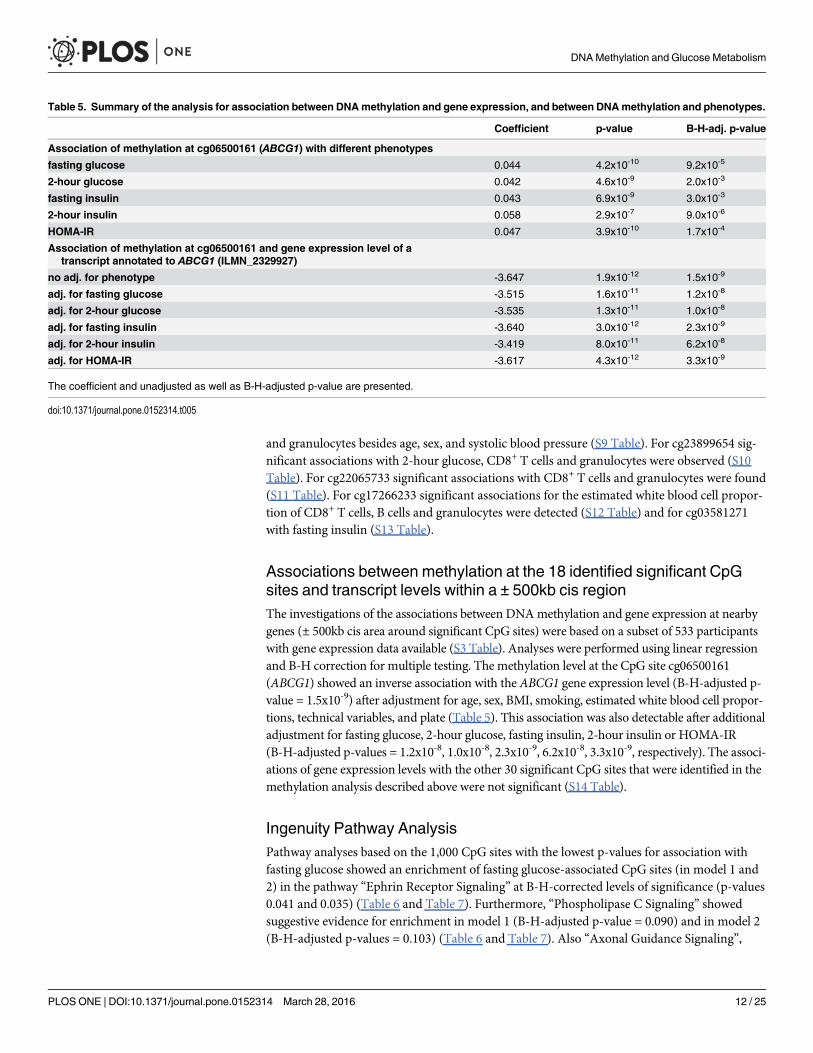
Distribution of metabolic variables in different DNAmethylation quintilesNext, we explored the relation between clinical phenotypes and methylation levels stratifiedinto quintiles at eleven CpG sites significantly associated with fasting insulin and 2-hour insu-lin in model 2 [cg03581271 (PALLD), cg17266233 (DGKZ), cg22065733 (unannotated),cg23899654 (unannotated), cg03979241 (EPB49), cg06500161 (ABCG1), cg06946797 (unanno-tated), cg09694782 (unannotated), cg11307565 (PXN), cg11990813 (KIAA0064), andcg13016916 (CREB3L2)]. For cg06500161 (ABCG1) we observed significant associationsbetween methylation and anthropometric as well as metabolic variables (Table 4): the strongestassociations were with waist circumference, triglycerides, fasting glucose, and BMI (p-valuesfor trend<10−20). In addition, strong associations between methylation and 2-hour glucose,CD8+ T cells, and monocytes (the last two being estimated quantities) (p-values for trend10−11–10−13) were observed. For cg09694782 significant associations were observed with age,fasting insulin, and HOMA-IR, as well as for all estimated white blood cell proportions (S4Table). For cg13016916 no significant associations could only be detected (S5 Table). Forcg11990813 significant associations were found for fasting insulin, HOMA-IR, CD8+ T cells,CD4+ T cells, natural killer cells, and granulocytes (S6 Table). For cg11307565 significant
DNAMethylation and Glucose Metabolism
PLOSONE | DOI:10.1371/journal.pone.0152314 March 28, 2016 9 / 25

Fig 2. Genome-wide associations between methylation and (a) fasting glucose, (b) 2-hour glucose, (c) fasting insulin, (d) HOMA-IR, after adjustment for sex,age, and estimated white blood cell proportions (model 1). Results are plotted for each chromosome (excluding the sex chromosomes) (x-axis) against the–
DNAMethylation and Glucose Metabolism
PLOSONE | DOI:10.1371/journal.pone.0152314 March 28, 2016 10 / 25
associations were detected for BMI, fasting glucose, fasting insulin, HOMA-IR, CD8+ T cells,CD4+ T cells, natural killer cells, and granulocytes (S7 Table). For cg06946797 significant asso-ciations were observed for age, BMI, waist circumference, C-reactive protein, fasting insulin,2-hour insulin, HOMA-IR, and almost all estimated white blood cell proportions (S8 Table).For cg03979241 a strong association could be detected for CD8+ T cells, CD4+ T cells, B cells,
log (unadjusted p-value) (y-axis). The Benjamini-Hochberg method was used as correction for multiple testing. The dotted line marks the significancethreshold. Red dots: methylation levels of these CpG sites are associated with these phenotypes in model 1; turquois dots: methylation levels of these CpGsites are significantly associated with the phenotype after additional adjustment for BMI (model 2); blue dots: methylation levels of these CpG sites aresignificantly associated with the phenotype in both adjustment models.
doi:10.1371/journal.pone.0152314.g002
Table 4. Associations between DNAmethylation at cg06500161 (ABCG1) and different phenotypes, based on quintiles of methylation level.
Quintile 1(n = 290)
Quintile 2(n = 289)
Quintile 3(n = 290)
Quintile 4(n = 289)
Quintile 5(n = 290)
Continuous phenotype Mean (SD) Mean (SD) Mean (SD) Mean (SD) Mean (SD) p for trend (Bonf.adjusted)
Age [years] # 58.22 (8.77) 58.95 (8.44) 60.50 (8.46) 60.13 (8.53) 61.47 (9.10) 2.21x10⁻⁵
BMI [kg/m2] # 26.01 (3.96) 27.09 (4.28) 27.13 (3.99) 28.10 (4.41) 29.29 (4.45) 8.30x10⁻²¹
Waist circumference [cm] 87.39 (12.33) 92.04 (12.21) 92.29 (11.27) 95.93 (12.53) 100.60 (12.42) 1.20x10-38
Fasting glucose [mmol/l] # 5.12 (0.47) 5.24 (0.48) 5.32 (0.53) 5.36 (0.52) 5.52 (0.55) 4.80x10⁻²¹
2-hour glucose [mmol/l] # 5.71 (1.53) 6.16 (1.70) 6.15 (1.72) 6.28 (1.67) 6.80 (1.75) 5.82x10⁻¹³
HbA1c [%] 5.41 (0.33) 5.45 (0.32) 5.45 (0.29) 5.46 (0.32) 5.57 (0.31) 1.70x10⁻⁷
C-reactive protein [mg/l] # 1.68 (1.76) 1.61 (1.57) 1.70 (1.57) 1.80 (1.74) 1.84 (1.67) 1
Fasting insulin [μlU/ml] # 1 5.03 (6.03) 6.17 (7.33) 5.71(5.50) 6.47 (6.24) 7.92 (7.85) 4.94x10⁻⁶
2-hour insulin [μlU/ml] # 2 52.55 (43.42) 54.19 (41.80) 57.59 (41.08) 66.07 (50.52) 81.47 (66.03) 7.66x10⁻⁶
HOMA-IR # 1 1.17 (1.56) 1.47 (1.78) 1.39 (1.44) 1.58 (1.63) 2.00 (2.16) 1.93x10⁻⁷
Cholesterol [mmol/l] # 5.90 (0.97) 5.85 (0.97) 5.79 (0.99) 5.83 (1.02) 5.63 (1.06) 0.030
Triglycerides [mmol/l] # 1.09 (0.67) 1.25 (0.64) 1.39 (1.22) 1.59 (0.89) 1.91 (1.23) 7.79x10⁻²⁷
Systolic blood pressure [mmHg] 119.94(19.09)
121.52 (16.38) 125.01 (18.58) 123.09 (17.78) 126.97 (18.53) 3.22x10⁻⁵
Diastolic blood pressure [mmHg] 75.14 (10.25) 75.81 (8.89) 76.77 (9.97) 75.84 (9.78) 77.5 (10.32) 0.083
CD8+ T cells +# 0.08 (0.05) 0.09 (0.06) 0.10 (0.07) 0.11 (0.07) 0.12 (0.07) 3.46x10⁻¹³
CD4+ T cells + 0.16 (0.06) 0.17 (0.06) 0.16 (0.06) 0.17 (0.06) 0.16 (0.06) 1
Natural killer cells +# 0.02 (0.02) 0.02 (0.02) 0.03 (0.03) 0.03 (0.03) 0.03 (0.03) 0.060
B cells +# 0.05 (0.04) 0.05 (0.03) 0.05 (0.02) 0.05 (0.02) 0.05 (0.02) 1
Monocytes + 0.11 (0.02) 0.11 (0.02) 0.12 (0.02) 0.12 (0.02) 0.12 (0.03) 9.40x10⁻¹¹
Granulocytes + 0.65 (0.09) 0.63 (0.09) 0.63 (0.09) 0.62 (0.09) 0.62 (0.09) 9.87x10⁻⁶
Categorical phenotypes number number(p-value)
number(p-value)
number(p-value)
number (p-value) -
Sex [male/female] 83/207 122/167(1.50x10-3*)
127/163(1.00x10-3 *)
156/133(5.00x10-4 *)
194/96(5.00x10-4 *)
-
Glucose status [combination of IFGand IGT/IFG/IGT/NGT]
3/8/21/258 8/6/46/229(3.50x10-3 *)
11/13/40/226(4.00x10-3 *)
6/23/46/214(5.00x10-4 *)
21/22/55/192(5.00x10-4 *)
-
Means, standard deviations and p-values for trend are presented for the different quintiles for the continuous phenotypes. For the categorical variables
total numbers of individuals in the different quintiles and p-values for the comparison of the corresponding quintile vs quintile 1 are given.
# variables were log transformed for determination of p-values.
* p-values are still significant after Bonferroni adjustment. + Proportions of cell types were estimated using method developed by Houseman et al. [32]1 Variable only available for 1,440 samples, distribution between the quintiles (288/288/288/288/288).2 Variable only available for 617 samples, distribution between the quintiles (124/123/123/123/124). IFG: impaired fasting glucose. IGT: impaired glucose
tolerance. NGT: normal glucose tolerance.
doi:10.1371/journal.pone.0152314.t004
DNAMethylation and Glucose Metabolism
PLOSONE | DOI:10.1371/journal.pone.0152314 March 28, 2016 11 / 25
and granulocytes besides age, sex, and systolic blood pressure (S9 Table). For cg23899654 sig-nificant associations with 2-hour glucose, CD8+ T cells and granulocytes were observed (S10Table). For cg22065733 significant associations with CD8+ T cells and granulocytes were found(S11 Table). For cg17266233 significant associations for the estimated white blood cell propor-tion of CD8+ T cells, B cells and granulocytes were detected (S12 Table) and for cg03581271with fasting insulin (S13 Table).
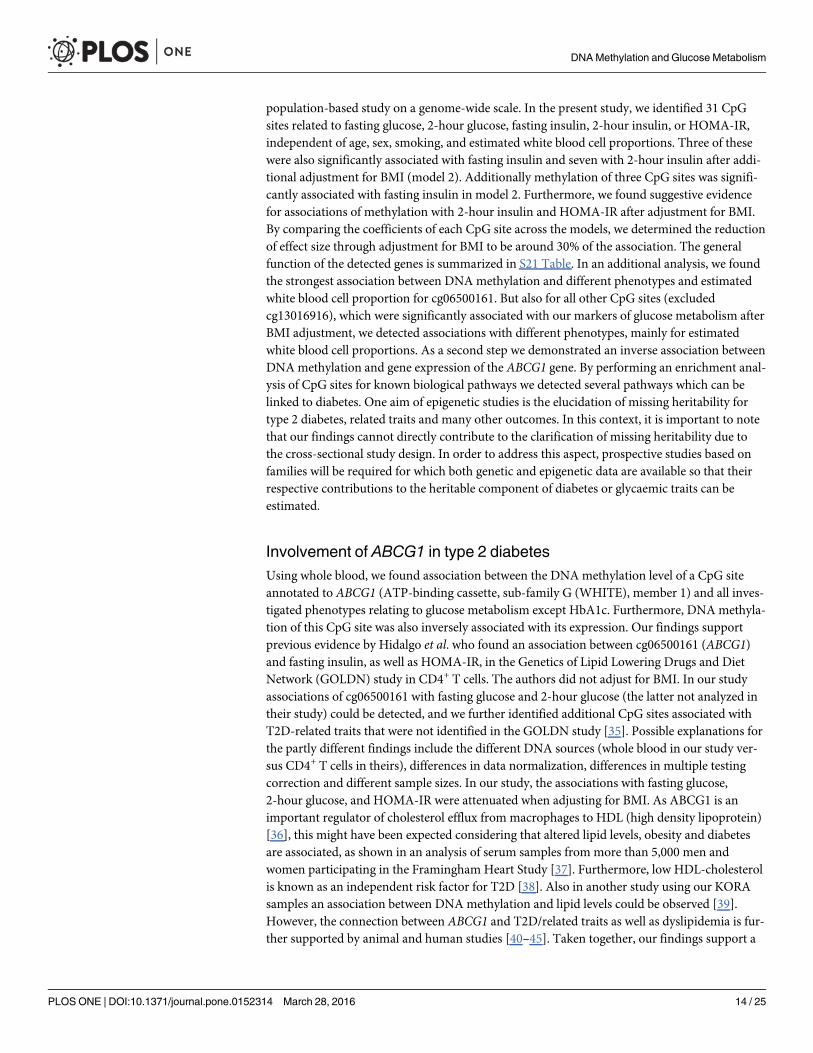
Associations between methylation at the 18 identified significant CpGsites and transcript levels within a ± 500kb cis regionThe investigations of the associations between DNAmethylation and gene expression at nearbygenes (± 500kb cis area around significant CpG sites) were based on a subset of 533 participantswith gene expression data available (S3 Table). Analyses were performed using linear regressionand B-H correction for multiple testing. The methylation level at the CpG site cg06500161(ABCG1) showed an inverse association with the ABCG1 gene expression level (B-H-adjusted p-value = 1.5x10⁻⁹) after adjustment for age, sex, BMI, smoking, estimated white blood cell propor-tions, technical variables, and plate (Table 5). This association was also detectable after additionaladjustment for fasting glucose, 2-hour glucose, fasting insulin, 2-hour insulin or HOMA-IR(B-H-adjusted p-values = 1.2x10⁻⁸, 1.0x10⁻⁸, 2.3x10⁻⁹, 6.2x10⁻⁸, 3.3x10⁻⁹, respectively). The associ-ations of gene expression levels with the other 30 significant CpG sites that were identified in themethylation analysis described above were not significant (S14 Table).
Ingenuity Pathway AnalysisPathway analyses based on the 1,000 CpG sites with the lowest p-values for association withfasting glucose showed an enrichment of fasting glucose-associated CpG sites (in model 1 and2) in the pathway “Ephrin Receptor Signaling” at B-H-corrected levels of significance (p-values0.041 and 0.035) (Table 6 and Table 7). Furthermore, “Phospholipase C Signaling” showedsuggestive evidence for enrichment in model 1 (B-H-adjusted p-value = 0.090) and in model 2(B-H-adjusted p-values = 0.103) (Table 6 and Table 7). Also “Axonal Guidance Signaling”,
Table 5. Summary of the analysis for association between DNAmethylation and gene expression, and between DNAmethylation and phenotypes.
Coefficient p-value B-H-adj. p-value
Association of methylation at cg06500161 (ABCG1) with different phenotypes
fasting glucose 0.044 4.2x10⁻¹⁰ 9.2x10⁻⁵
2-hour glucose 0.042 4.6x10⁻⁹ 2.0x10⁻³
fasting insulin 0.043 6.9x10⁻⁹ 3.0x10⁻³
2-hour insulin 0.058 2.9x10⁻⁷ 9.0x10⁻⁶
HOMA-IR 0.047 3.9x10⁻¹⁰ 1.7x10⁻⁴
Association of methylation at cg06500161 and gene expression level of atranscript annotated to ABCG1 (ILMN_2329927)
no adj. for phenotype -3.647 1.9x10⁻¹² 1.5x10⁻⁹
adj. for fasting glucose -3.515 1.6x10⁻¹¹ 1.2x10⁻⁸
adj. for 2-hour glucose -3.535 1.3x10⁻¹¹ 1.0x10⁻⁸
adj. for fasting insulin -3.640 3.0x10⁻¹² 2.3x10⁻⁹
adj. for 2-hour insulin -3.419 8.0x10⁻¹¹ 6.2x10⁻⁸
adj. for HOMA-IR -3.617 4.3x10⁻¹² 3.3x10⁻⁹
The coefficient and unadjusted as well as B-H-adjusted p-value are presented.
doi:10.1371/journal.pone.0152314.t005
DNAMethylation and Glucose Metabolism
PLOSONE | DOI:10.1371/journal.pone.0152314 March 28, 2016 12 / 25
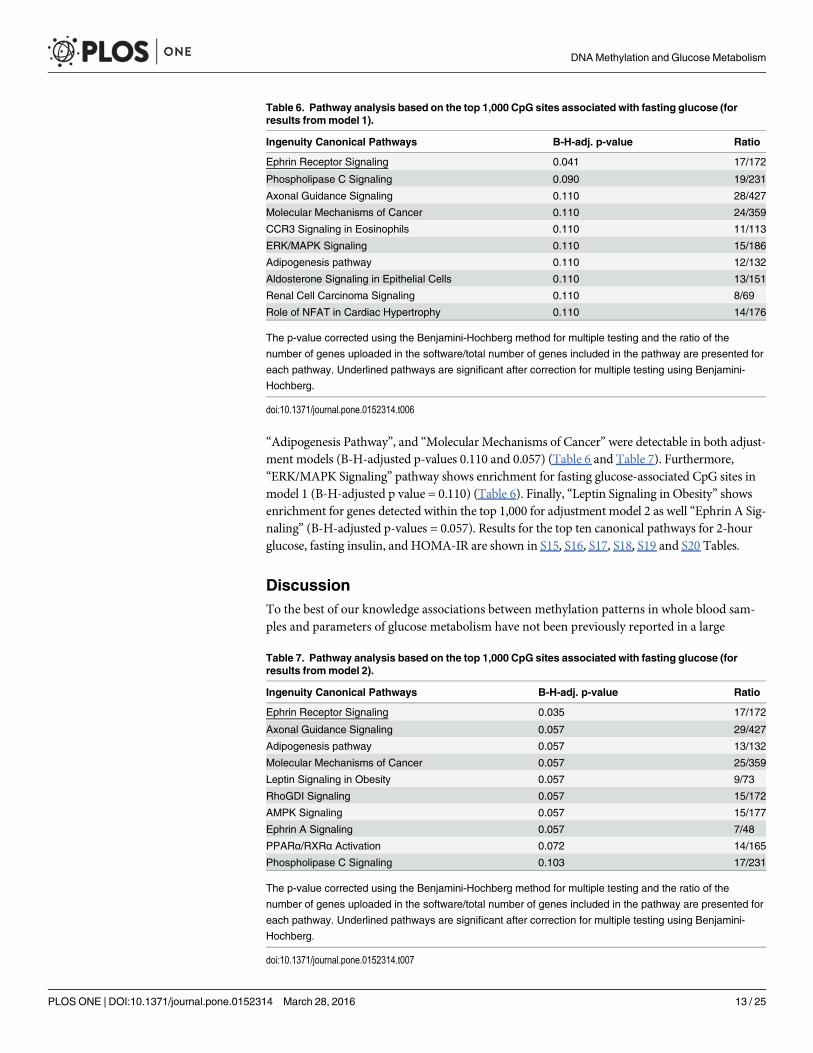
“Adipogenesis Pathway”, and “Molecular Mechanisms of Cancer” were detectable in both adjust-ment models (B-H-adjusted p-values 0.110 and 0.057) (Table 6 and Table 7). Furthermore,“ERK/MAPK Signaling” pathway shows enrichment for fasting glucose-associated CpG sites inmodel 1 (B-H-adjusted p value = 0.110) (Table 6). Finally, “Leptin Signaling in Obesity” showsenrichment for genes detected within the top 1,000 for adjustment model 2 as well “Ephrin A Sig-naling” (B-H-adjusted p-values = 0.057). Results for the top ten canonical pathways for 2-hourglucose, fasting insulin, and HOMA-IR are shown in S15, S16, S17, S18, S19 and S20 Tables.
DiscussionTo the best of our knowledge associations between methylation patterns in whole blood sam-ples and parameters of glucose metabolism have not been previously reported in a large
Table 7. Pathway analysis based on the top 1,000 CpG sites associated with fasting glucose (forresults frommodel 2).
Ingenuity Canonical Pathways B-H-adj. p-value Ratio
Ephrin Receptor Signaling 0.035 17/172
Axonal Guidance Signaling 0.057 29/427
Adipogenesis pathway 0.057 13/132
Molecular Mechanisms of Cancer 0.057 25/359
Leptin Signaling in Obesity 0.057 9/73
RhoGDI Signaling 0.057 15/172
AMPK Signaling 0.057 15/177
Ephrin A Signaling 0.057 7/48
PPARα/RXRα Activation 0.072 14/165
Phospholipase C Signaling 0.103 17/231
The p-value corrected using the Benjamini-Hochberg method for multiple testing and the ratio of the
number of genes uploaded in the software/total number of genes included in the pathway are presented for
each pathway. Underlined pathways are significant after correction for multiple testing using Benjamini-
Hochberg.
doi:10.1371/journal.pone.0152314.t007
Table 6. Pathway analysis based on the top 1,000 CpG sites associated with fasting glucose (forresults frommodel 1).
Ingenuity Canonical Pathways B-H-adj. p-value Ratio
Ephrin Receptor Signaling 0.041 17/172
Phospholipase C Signaling 0.090 19/231
Axonal Guidance Signaling 0.110 28/427
Molecular Mechanisms of Cancer 0.110 24/359
CCR3 Signaling in Eosinophils 0.110 11/113
ERK/MAPK Signaling 0.110 15/186
Adipogenesis pathway 0.110 12/132
Aldosterone Signaling in Epithelial Cells 0.110 13/151
Renal Cell Carcinoma Signaling 0.110 8/69
Role of NFAT in Cardiac Hypertrophy 0.110 14/176
The p-value corrected using the Benjamini-Hochberg method for multiple testing and the ratio of the
number of genes uploaded in the software/total number of genes included in the pathway are presented for
each pathway. Underlined pathways are significant after correction for multiple testing using Benjamini-
Hochberg.
doi:10.1371/journal.pone.0152314.t006
DNAMethylation and Glucose Metabolism
PLOSONE | DOI:10.1371/journal.pone.0152314 March 28, 2016 13 / 25
population-based study on a genome-wide scale. In the present study, we identified 31 CpGsites related to fasting glucose, 2-hour glucose, fasting insulin, 2-hour insulin, or HOMA-IR,independent of age, sex, smoking, and estimated white blood cell proportions. Three of thesewere also significantly associated with fasting insulin and seven with 2-hour insulin after addi-tional adjustment for BMI (model 2). Additionally methylation of three CpG sites was signifi-cantly associated with fasting insulin in model 2. Furthermore, we found suggestive evidencefor associations of methylation with 2-hour insulin and HOMA-IR after adjustment for BMI.By comparing the coefficients of each CpG site across the models, we determined the reductionof effect size through adjustment for BMI to be around 30% of the association. The generalfunction of the detected genes is summarized in S21 Table. In an additional analysis, we foundthe strongest association between DNAmethylation and different phenotypes and estimatedwhite blood cell proportion for cg06500161. But also for all other CpG sites (excludedcg13016916), which were significantly associated with our markers of glucose metabolism afterBMI adjustment, we detected associations with different phenotypes, mainly for estimatedwhite blood cell proportions. As a second step we demonstrated an inverse association betweenDNAmethylation and gene expression of the ABCG1 gene. By performing an enrichment anal-ysis of CpG sites for known biological pathways we detected several pathways which can belinked to diabetes. One aim of epigenetic studies is the elucidation of missing heritability fortype 2 diabetes, related traits and many other outcomes. In this context, it is important to notethat our findings cannot directly contribute to the clarification of missing heritability due tothe cross-sectional study design. In order to address this aspect, prospective studies based onfamilies will be required for which both genetic and epigenetic data are available so that theirrespective contributions to the heritable component of diabetes or glycaemic traits can beestimated.
Involvement of ABCG1 in type 2 diabetesUsing whole blood, we found association between the DNAmethylation level of a CpG siteannotated to ABCG1 (ATP-binding cassette, sub-family G (WHITE), member 1) and all inves-tigated phenotypes relating to glucose metabolism except HbA1c. Furthermore, DNAmethyla-tion of this CpG site was also inversely associated with its expression. Our findings supportprevious evidence by Hidalgo et al. who found an association between cg06500161 (ABCG1)and fasting insulin, as well as HOMA-IR, in the Genetics of Lipid Lowering Drugs and DietNetwork (GOLDN) study in CD4+ T cells. The authors did not adjust for BMI. In our studyassociations of cg06500161 with fasting glucose and 2-hour glucose (the latter not analyzed intheir study) could be detected, and we further identified additional CpG sites associated withT2D-related traits that were not identified in the GOLDN study [35]. Possible explanations forthe partly different findings include the different DNA sources (whole blood in our study ver-sus CD4+ T cells in theirs), differences in data normalization, differences in multiple testingcorrection and different sample sizes. In our study, the associations with fasting glucose,2-hour glucose, and HOMA-IR were attenuated when adjusting for BMI. As ABCG1 is animportant regulator of cholesterol efflux from macrophages to HDL (high density lipoprotein)[36], this might have been expected considering that altered lipid levels, obesity and diabetesare associated, as shown in an analysis of serum samples from more than 5,000 men andwomen participating in the Framingham Heart Study [37]. Furthermore, low HDL-cholesterolis known as an independent risk factor for T2D [38]. Also in another study using our KORAsamples an association between DNAmethylation and lipid levels could be observed [39].However, the connection between ABCG1 and T2D/related traits as well as dyslipidemia is fur-ther supported by animal and human studies [40–45]. Taken together, our findings support a
DNAMethylation and Glucose Metabolism
PLOSONE | DOI:10.1371/journal.pone.0152314 March 28, 2016 14 / 25
role of the ABCG1 gene in the regulation of glucose metabolism and suggest that epigeneticmechanisms are involved in the association.
It is known that DNA methylation can influence the expression of genes [46–49]. From ourfindings that DNA methylation and gene expression of ABCG1 are associated independently ofour investigated phenotypes, we conclude that DNA methylation and gene expression mayaffect each other and therefore may have an influence on insulin or glucose levels. Our resultscannot provide evidence for the direction of influence.
Relevance of the other associated CpG sites for type 2 diabetesSREBF1 (sterol regulatory element binding transcription factor 1), for which a significant asso-ciation between methylation status and fasting glucose and 2-hour insulin was observed, hasbeen linked to diabetes or related traits in human studies before [50, 51]. Also TNF (tumornecrosis factor) has been implicated in the development of type 2 diabetes. This latter geneencodes the proinflammatory cytokine TNFalpha that is secreted mainly by macrophages andoverexpressed in adipose tissue [52]. It is involved in the regulation of lipid metabolism andinsulin resistance [53, 54]. Animal studies demonstrate an association between TNFalpha anddiabetes [55–57]. In cell culture experiments an association between TNFalpha and insulinresistance was observed [58, 59]. In human studies it was shown that the level of this cytokineis increased in T2D patients and subjects with insulin resistance [60, 61]. For CPT1A (carnitinepalmitoyltransferase 1a), which is a key enzyme of fatty acid transport into mitochondria forbeta-oxidation [62, 63], a link to diabetes or related traits can be found in animal and expres-sion studies [63–65]. However, when analyzing SNPs at the CPT1A locus in diabetic and non-diabetic individuals, no association with T2D, hepatic lipid content or insulin resistance inT2D was observed [66]. Furthermore, a link between PALLD (palladin, cytoskeletal associatedprotein) and obesity has been reported [67]. For the amino acid transporter SLC1A5 anenhanced expression was observed in goat mammary gland epithelial transfected cells [68].Furthermore, the overexpression of GLUT1 and GLUT12 increases the expression of SLC1A5in goat mammary gland epithelial transfected cells [69]. Diaz et al. conclude from their experi-ments using transgenic mice overexpressing chicken Ski that Ski plays a main role in skeletalmuscle metabolism and adipogenesis and therefore influence risk of obesity and diabetes [70].This result was supported by findings of Leong et al. [71]. For PXN it was shown that glucoseinduces the activation of this paxillin, which is mediated by beta 1 integrin intracellular signal-ing [72].
Involvement of BMI in DNA methylation associationWe showed that effect strengths were reduced on average by around 30% after adjustment forBMI, suggesting an influence of BMI on the investigated phenotypes.
In the literature evidence can be found that BMI is associated with DNA methylation pat-terns. For example Na et al. showed a differential influence of BMI on global DNAmethylationwhen analyzing healthy women. They found a U-shaped association between BMI and Alumethylation, where the lowest methylation degree was found at a BMI between 23 and 30 kg/m2. These findings imply an involvement of BMI-related changes in Alu methylation in the eti-ology and pathogenesis of obesity [73]. Furthermore, allele-specific, age-dependent, and BMI-associated methylation atMCHR1 was shown in human blood samples [74]. Furthermore, wecould demonstrate in our study by trend analysis that the degree of methylation at cg06500161rose with increasing measures of BMI. However, functional and/or time-series studies areneeded to elucidate potential cause and effect mechanisms in the association between thesegenes, adiposity and glucose mechanisms.
DNAMethylation and Glucose Metabolism
PLOSONE | DOI:10.1371/journal.pone.0152314 March 28, 2016 15 / 25
As the previously discussed findings of our study indicate that BMI influences methylation,it is not unexpected that adjustment for BMI diminishes the association of selected CpG siteswith the investigated measurements of glucose metabolism. Some CpG sites where associationsseem to be mediated by BMI are biologically plausible in the context of T2D or related traits.
Association of gene expression and DNAmethylationWe demonstrate an inverse association between DNA methylation and gene expression of theABCG1 gene. In general this finding is not surprising due to the fact that hypermethylationwithin the gene promotor and shores is mostly associated with a reduced gene expression [75–78]. Recent studies demonstrate that methylation in the gene body may lead to increased ratherthan decreased gene expression [79, 80], which would be in contrast to our findings. However,due to lack of general evidence further studies will be required to elucidate the mechanismsunderlying our findings, as this cannot be achieved in an epidemiological setting. The particu-larly strong association between methylation at cg06500161 and the markers of glucose metab-olism seems reflected by the fact that we can only demonstrate an association of methylationand gene expression for this gene after correction for multiple testing, whereas associations forother CpG sites were significant only before correction for multiple testing. It should be notedthat the sample size for the gene expression analyses was limited to 533 samples and thereforestatistical power may have been lower compared to the analysis between methylation and phe-notypes. Additional 23 CpG sites show an association with gene expression in the unadjustedanalysis (S14 Table).
Enrichment of signals from biological pathways and link to diabetesIn order to functionally integrate our results, we conducted a pathway analysis based on the1,000 top hits for each phenotype and each model. Some of the identified pathways have awell-established link to diabetes or related traits. One example is the “Adipogenesis Pathway”.An et al. show that cyclin Y is involved in adipogenesis and lipid accumulation and that itsinhibition could be a therapeutic approach to obesity and diabetes [81]. Furthermore, it wasshown that adipose cell expansion is associated with abdominal obesity and insulin resistance[82] and that there is an association between genetic predisposition for T2D and adipocytehypertrophy [83]. Another example is “Phospholipase C Signaling”. A contribution of phos-pholipase C delta1 to obesity through regulation of thermogenesis and adipogenesis in micewas observed [84], as were its effects on insulin secretion in a pancreatic beta-cell line [85]. Alink to diabetes can also be found for “Leptin Signaling in Obesity”, as leptin is involved in theregulation of obesity, which in turn is an important risk factor for T2D [86]. A further link todiabetes exists for “Ephrin Receptor Signaling” and “Ephrin A/B Signaling”. It was shown thatEphA and ephrin A regulate insulin secretion [87] and that the communication between ephrinreceptors and ephrin in exocrine and endocrine cells is involved in pancreatic function [88].Ephrin receptors and ephrins are expressed in pancreatic beta-cells in humans and mice [89]and EphAs are tyrosine phosphorylated under low glucose concentrations and initiate forwardsignaling, which in turn reduces insulin secretion [90]. Finally, there is evidence for linking“ERK/MAPK Signaling” to diabetes, as it was shown that MAPK/ERK signaling controls glu-cose metabolism by regulating insulin sensitivity in Drosophila [91]. Furthermore, an associa-tion between sustained activation of ERK signaling in adipocytes and the pathogenesis of T2Dwas found [92]. Additional, Hsp60 activates ERK1/2 in skeletal muscle cells and thus inhibitsinsulin signaling and insulin-stimulated glucose uptake [93]. Taken together, we observe anenrichment of our detected genes in pathways which are connected to diabetes or related traits.
DNAMethylation and Glucose Metabolism
PLOSONE | DOI:10.1371/journal.pone.0152314 March 28, 2016 16 / 25
From this we conclude that our results, although not always significant, are biologically plausi-ble in the context of measures of glucose metabolism and may be the basis for further analysis.
Strengths/LimitationsThe main strength of this study is the use of whole blood samples, as whole blood is readilyavailable in the clinical routine, unlike tissue biopsies, and therefore has greater relevance inthe context of the prediction of diabetes. On the other hand, this is also a limitation, as it isknown that DNAmethylation patterns differ across tissues [32] and whole blood thus repre-sents a mixture of cell types and may differ in methylation profile from insulin-responsive tis-sues like liver, skeletal muscle and adipose tissue. However, we adjusted for estimated whiteblood cell proportions derived from methylation data for blood cells in order to reduce con-founding due to inter-individual differences in blood cell proportions.
Further strengths of our study are the genome-wide approach and the population-baseddesign. Our study also included oral glucose tolerance tests so that data for 2-hour glucose and2-hour insulin were available. However, a major caveat of our cross-sectional study design isthat it does not allow deductions on cause and effect. Finally, meta-analyses of EWAS of glyce-mic traits will have a larger power to detect further CpG sites whose methylation levels did notreach statistical significance in our study.
ConclusionOur study presents evidence of association between DNA methylation and measures of glucosemetabolism, using whole blood samples from individuals with European ancestry. Our findingsshow that epigenetic markers associated with measures of glucose metabolism can be detectedin whole blood samples, and they confirm previous evidence that ABCG1 is involved in diabe-tes either directly or indirectly. Furthermore, we confirm recent findings found in CD4+ Tcells–as well as from participants with Indian Asian ancestry–from the GOLDN and LOLIPOPstudies, which demonstrated an association between methylation degree of cg06500161(ABCG1) and measures of glucose metabolism and incident T2D [35, 45]. In addition wedetected enrichment of differentially methylated genes in pathways which are biologically plau-sible in the context of diabetes. The findings provide evidence that DNAmethylation may beassociated with T2D and related traits, a relationship which can be measured in DNA isolatedfrom whole blood. Particularly, epigenetic patterns of disease-relevant tissues might furtheradvance our understanding of how DNA methylation at the identified genes is involved in dia-betes and therefore its pathophysiology. However, for ethical and practical reasons, DNAmethylation analyses are often only feasible in whole blood rather than in disease-relevant tis-sues, particularly in large population-based observational studies.
Supporting InformationS1 Table. Characteristics of the study population (n = 1,440) for the DNAmethylationanalyses of fasting insulin and HOMA-IR.(DOC)
S2 Table. Characteristics of the study population (n = 617) for the DNAmethylation analy-ses of 2-hour insulin.(DOC)
S3 Table. Characteristics of the study population (n = 533) for the gene expression analyses.(DOC)
DNAMethylation and Glucose Metabolism
PLOSONE | DOI:10.1371/journal.pone.0152314 March 28, 2016 17 / 25
S4 Table. Associations between DNAmethylation at cg09694782 (unannotated) and differ-ent phenotypes, based on quintiles of methylation level.Means, standard deviations and p-values for trend are presented for the different quintiles for the continuous phenotypes. For thecategorical variables total numbers of individuals in the different quintiles and p-values for thecomparison of the corresponding quintile vs the quintile 1 are given.(DOC)
S5 Table. Associations between DNAmethylation at cg13016916 (CREB3L2) and differentphenotypes, based on quintiles of methylation level.Means, standard deviations and p-valuesfor trend are presented for the different quintiles for the continuous phenotypes. For the cate-gorical variables total numbers of individuals in the different quintiles and p-values for thecomparison of the corresponding quintile vs the quintile 1 are given.(DOC)
S6 Table. Associations between DNAmethylation at cg11990813 (KIAA0664) and differentphenotypes, based on quintiles of methylation level.Means, standard deviations and p-valuesfor trend are presented for the different quintiles for the continuous phenotypes. For the cate-gorical variables total numbers of individuals in the different quintiles and p-values for thecomparison of the corresponding quintile vs the quintile 1 are given.(DOC)
S7 Table. Associations between DNAmethylation at cg11307565 (PXN) and different phe-notypes, based on quintiles of methylation level.Means, standard deviations and p-values fortrend are presented for the different quintiles for the continuous phenotypes. For the categori-cal variables total numbers of individuals in the different quintiles and p-values for the compar-ison of the corresponding quintile vs the quintile 1 are given.(DOC)
S8 Table. Associations between DNAmethylation at cg06946797 (unannotated) and differ-ent phenotypes, based on quintiles of methylation level.Means, standard deviations and p-values for trend are presented for the different quintiles for the continuous phenotypes. For thecategorical variables total numbers of individuals in the different quintiles and p-values for thecomparison of the corresponding quintile vs the quintile 1 are given.(DOC)
S9 Table. Associations between DNAmethylation at cg03979241 (EPB49) and differentphenotypes, based on quintiles of methylation level.Means, standard deviations and p-valuesfor trend are presented for the different quintiles for the continuous phenotypes. For the cate-gorical variables total numbers of individuals in the different quintiles and p-values for thecomparison of the corresponding quintile vs the quintile 1 are given.(DOC)
S10 Table. Associations between DNAmethylation at cg23899654 (unannotated) and dif-ferent phenotypes, based on quintiles of methylation level.Means, standard deviations andp-values for trend are presented for the different quintiles for the continuous phenotypes. Forthe categorical variables total numbers of individuals in the different quintiles and p-values forthe comparison of the corresponding quintile vs the quintile 1 are given.(DOC)
S11 Table. Associations between DNAmethylation at cg22065733 (unannotated) and dif-ferent phenotypes, based on quintiles of methylation level.Means, standard deviations andp-values for trend are presented for the different quintiles for the continuous phenotypes. For
DNAMethylation and Glucose Metabolism
PLOSONE | DOI:10.1371/journal.pone.0152314 March 28, 2016 18 / 25
the categorical variables total numbers of individuals in the different quintiles and p-values forthe comparison of the corresponding quintile vs the quintile 1 are given.(DOC)
S12 Table. Associations between DNAmethylation at cg17266233 (DGKZ) and differentphenotypes, based on quintiles of methylation level.Means, standard deviations and p-valuesfor trend are presented for the different quintiles for the continuous phenotypes. For the cate-gorical variables total numbers of individuals in the different quintiles and p-values for thecomparison of the corresponding quintile vs the quintile 1 are given.(DOC)
S13 Table. Associations between DNAmethylation at cg03581271 (PALLD) and differentphenotypes, based on quintiles of methylation level.Means, standard deviations and p-valuesfor trend are presented for the different quintiles for the continuous phenotypes. For the cate-gorical variables total numbers of individuals in the different quintiles and p-values for thecomparison of the corresponding quintile vs the quintile 1 are given.(DOC)
S14 Table. Summary of the analysis for association between DNAmethylation and geneexpression showing the top association per CpG sites for unadjusted p-values< 0.05.(DOC)
S15 Table. Pathway analysis based on the top 1,000 CpG sites associated with 2-hour glu-cose (for results from model 1). The table gives p-values corrected using the Benjamini-Hoch-berg method for multiple testing and the ratio of the number of genes uploaded in thesoftware/total number of genes included in the pathway are presented for each pathway.Underlined pathways are significant after correction for multiple testing using Benjamini-Hochberg.(DOC)
S16 Table. Pathway analysis based on the top 1,000 CpG sites associated with 2-hour glu-cose (for results from model 2). The table gives p-values corrected using the Benjamini-Hoch-berg method for multiple testing and the ratio of the number of genes uploaded in thesoftware/total number of genes included in the pathway are presented for each pathway.Underlined pathways are significant after correction for multiple testing using Benjamini-Hochberg.(DOC)
S17 Table. Pathway analysis based on the top 1,000 CpG sites associated with fasting insu-lin (for results from model 1). The table gives p-values corrected using the Benjamini-Hoch-berg method for multiple testing and the ratio of the number of genes uploaded in thesoftware/total number of genes included in the pathway are presented for each pathway.(DOC)
S18 Table. Pathway analysis based on the top 1,000 CpG sites associated with fasting insu-lin (for results from model 2). The table gives p-values corrected using the Benjamini-Hoch-berg method for multiple testing and the ratio of the number of genes uploaded in thesoftware/total number of genes included in the pathway are presented for each pathway.Underlined pathways are significant after correction for multiple testing using Benjamini-Hochberg.(DOC)
DNAMethylation and Glucose Metabolism
PLOSONE | DOI:10.1371/journal.pone.0152314 March 28, 2016 19 / 25
S19 Table. Pathway analysis based on the top 1,000 CpG sites associated with HOMA-IR(for results from model 1). The table gives p-values corrected using the Benjamini-Hochbergmethod for multiple testing and the ratio of the number of genes uploaded in the software/totalnumber of genes included in the pathway are presented for each pathway.(DOC)
S20 Table. Pathway analysis based on the top 1,000 CpG sites associated with HOMA-IR(for results from model 2). The table gives p-values corrected using the Benjamini-Hochbergmethod for multiple testing and the ratio of the number of genes uploaded in the software/totalnumber of genes included in the pathway are presented for each pathway. Underlined path-ways are significant after correction for multiple testing using Benjamini-Hochberg.(DOC)
S21 Table. Function of genes showing significant associations between methylation statusand parameters of glucose metabolism. Informations were taken from www.ncbi.nlm.nih.gov/gene/ in February 2016, if not stated otherwise.(DOC)
AcknowledgmentsWe thank all participants of the KORA F4 study. Furthermore, we thank Nadine Lindemann,Franziska Scharl, and Nicole Spada for technical assistance. We also thank Rory Wilson forproofreading of the manuscript.
Author ContributionsConceived and designed the experiments: JK CHWR CG AP TI HPMR HG. Performed theexperiments: JK SK. Analyzed the data: JK SW SM NV KS MCK. Contributed reagents/materi-als/analysis tools: CHWRMWCG AP HP HG. Wrote the paper: JK CHWR SW SK SM NVKS MCKMWCG AP TI HP MR HG.
References1. Tamayo T, Rosenbauer J, Wild SH, Spijkerman AM, Baan C, Forouhi NG, et al. Diabetes in Europe: an
update. Diabetes Res Clin Pract. 2014; 103(2):206–17. doi: 10.1016/j.diabres.2013.11.007 PMID:24300019
2. RathmannW, Scheidt-Nave C, Roden M, Herder C. Type 2 diabetes: prevalence and relevance ofgenetic and acquired factors for its prediction. Deutsches Arzteblatt international. 2013; 110(19):331–7.doi: 10.3238/arztebl.2013.0331 PMID: 23762204
3. Travers ME, McCarthy MI. Type 2 diabetes and obesity: genomics and the clinic. HumGenet. 2011;130(1):41–58. doi: 10.1007/s00439-011-1023-8 PMID: 21647602
4. Poulsen P, Levin K, Petersen I, Christensen K, Beck-Nielsen H, Vaag A. Heritability of insulin secretion,peripheral and hepatic insulin action, and intracellular glucose partitioning in young and old Danishtwins. Diabetes. 2005; 54(1):275–83. PMID: 15616039
5. Poulsen P, Kyvik KO, Vaag A, Beck-Nielsen H. Heritability of type II (non-insulin-dependent) diabetesmellitus and abnormal glucose tolerance—a population-based twin study. Diabetologia. 1999; 42(2):139–45. PMID: 10064092
6. Schousboe K, Visscher PM, Henriksen JE, Hopper JL, Sorensen TI, Kyvik KO. Twin study of geneticand environmental influences on glucose tolerance and indices of insulin sensitivity and secretion. Dia-betologia. 2003; 46(9):1276–83. PMID: 12898014
7. Schwenk RW, Vogel H, Schurmann A. Genetic and epigenetic control of metabolic health. Molecularmetabolism. 2013; 2(4):337–47. doi: 10.1016/j.molmet.2013.09.002 PMID: 24327950
8. Morris A, Voight BF, Teslovich TM, Ferreira T. Large-scale association analysis provides insights intothe genetic architecture and pathophysiology of type 2 diabetes. Nat Genet. 2012; 44(9):981–90. doi:10.1038/ng.2383 PMID: 22885922
DNAMethylation and Glucose Metabolism
PLOSONE | DOI:10.1371/journal.pone.0152314 March 28, 2016 20 / 25
9. Basile KJ, Johnson ME, Xia Q, Grant SF. Genetic susceptibility to type 2 diabetes and obesity: follow-up of findings from genome-wide association studies. International journal of endocrinology. 2014;2014:769671. doi: 10.1155/2014/769671 PMID: 24719615
10. Voight BF, Scott LJ, Steinthorsdottir V, Morris AP, Dina C, Welch RP, et al. Twelve type 2 diabetes sus-ceptibility loci identified through large-scale association analysis. Nat Genet. 2010; 42(7):579–89. doi:10.1038/ng.609 PMID: 20581827
11. Marullo L, El-Sayed Moustafa JS, Prokopenko I. Insights into the genetic susceptibility to type 2 diabe-tes from genome-wide association studies of glycaemic traits. Curr Diab Rep. 2014; 14(11):551. doi:10.1007/s11892-014-0551-8 PMID: 25344220
12. Replication DIG, Meta-analysis C, Asian Genetic Epidemiology Network Type 2 Diabetes C, SouthAsian Type 2 Diabetes C, Mexican American Type 2 Diabetes C, Type 2 Diabetes Genetic Explorationby Nex-generation sequencing in muylti-Ethnic Samples C, et al. Genome-wide trans-ancestry meta-analysis provides insight into the genetic architecture of type 2 diabetes susceptibility. Nat Genet.2014; 46(3):234–44. doi: 10.1038/ng.2897 PMID: 24509480
13. Herder C, Roden M. Genetics of type 2 diabetes: pathophysiologic and clinical relevance. Eur J ClinInvest. 2011; 41(6):679–92. doi: 10.1111/j.1365-2362.2010.02454.x PMID: 21198561
14. Barres R, Osler ME, Yan J, Rune A, Fritz T, Caidahl K, et al. Non-CpGmethylation of the PGC-1alphapromoter through DNMT3B controls mitochondrial density. Cell metabolism. 2009; 10(3):189–98. doi:10.1016/j.cmet.2009.07.011 PMID: 19723495
15. Bell CG, Finer S, Lindgren CM, Wilson GA, Rakyan VK, Teschendorff AE, et al. Integrated genetic andepigenetic analysis identifies haplotype-specific methylation in the FTO type 2 diabetes and obesitysusceptibility locus. PLoS One. 2010; 5(11):e14040. doi: 10.1371/journal.pone.0014040 PMID:21124985
16. Toperoff G, Aran D, Kark JD, Rosenberg M, Dubnikov T, Nissan B, et al. Genome-wide survey revealspredisposing diabetes type 2-related DNAmethylation variations in human peripheral blood. HumMolGenet. 2012; 21(2):371–83. doi: 10.1093/hmg/ddr472 PMID: 21994764
17. Stumvoll M, Goldstein BJ, van Haeften TW. Type 2 diabetes: principles of pathogenesis and therapy.Lancet. 2005; 365(9467):1333–46. PMID: 15823385
18. Tabak AG, Herder C, RathmannW, Brunner EJ, Kivimaki M. Prediabetes: a high-risk state for diabetesdevelopment. Lancet. 2012; 379(9833):2279–90. doi: 10.1016/S0140-6736(12)60283-9 PMID:22683128
19. Holle R, Happich M, Lowel H, Wichmann HE. KORA—a research platform for population based healthresearch. Gesundheitswesen. 2005; 67 Suppl 1:S19–25. PMID: 16032513
20. Steffens M, Lamina C, Illig T, Bettecken T, Vogler R, Entz P, et al. SNP-based analysis of genetic sub-structure in the German population. Hum Hered. 2006; 62(1):20–9. PMID: 17003564
21. Zeilinger S, Kuhnel B, Klopp N, Baurecht H, Kleinschmidt A, Gieger C, et al. Tobacco smoking leads toextensive genome-wide changes in DNAmethylation. PLoS One. 2013; 8(5):e63812. doi: 10.1371/journal.pone.0063812 PMID: 23691101
22. American Diabetes A. Standards of medical care in diabetes—2014. Diabetes Care. 2014; 37 Suppl 1:S14–80. doi: 10.2337/dc14-S014 PMID: 24357209
23. Schurmann C, Heim K, Schillert A, Blankenberg S, Carstensen M, Dorr M, et al. Analyzing illuminagene expression microarray data from different tissues: methodological aspects of data analysis in themetaxpress consortium. PLoS One. 2012; 7(12):e50938. doi: 10.1371/journal.pone.0050938 PMID:23236413
24. RathmannW, Kowall B, Tamayo T, Giani G, Holle R, Thorand B, et al. Hemoglobin A1c and glucose cri-teria identify different subjects as having type 2 diabetes in middle-aged and older populations: theKORA S4/F4 Study. Ann Med. 2012; 44(2):170–7. doi: 10.3109/07853890.2010.531759 PMID:21091229
25. RathmannW, Strassburger K, Heier M, Holle R, Thorand B, Giani G, et al. Incidence of Type 2 diabetesin the elderly German population and the effect of clinical and lifestyle risk factors: KORA S4/F4 cohortstudy. Diabet Med. 2009; 26(12):1212–9. doi: 10.1111/j.1464-5491.2009.02863.x PMID: 20002472
26. RathmannW, Haastert B, Icks A, Lowel H, Meisinger C, Holle R, et al. High prevalence of undiagnoseddiabetes mellitus in Southern Germany: target populations for efficient screening. The KORA survey2000. Diabetologia. 2003; 46(2):182–9. PMID: 12627316
27. Herder C, Ouwens DM, Carstensen M, Kowall B, Huth C, Meisinger C, et al. Adiponectin may mediatethe association between omentin, circulating lipids and insulin sensitivity: results from the KORA F4study. Eur J Endocrinol. 2015; 172(4):423–32. doi: 10.1530/EJE-14-0879 PMID: 25733068
DNAMethylation and Glucose Metabolism
PLOSONE | DOI:10.1371/journal.pone.0152314 March 28, 2016 21 / 25
28. Bibikova M, Barnes B, Tsan C, Ho V, Klotzle B, Le JM, et al. High density DNAmethylation array withsingle CpG site resolution. Genomics. 2011; 98(4):288–95. doi: 10.1016/j.ygeno.2011.07.007 PMID:21839163
29. Sandoval J, Heyn H, Moran S, Serra-Musach J, Pujana MA, Bibikova M, et al. Validation of a DNAmethylation microarray for 450,000 CpG sites in the human genome. Epigenetics: official journal of theDNAMethylation Society. 2011; 6(6):692–702.
30. Schramm K, Marzi C, Schurmann C, Carstensen M, Reinmaa E, Biffar R, et al. Mapping the geneticarchitecture of gene regulation in whole blood. PLoS One. 2014; 9(4):e93844. doi: 10.1371/journal.pone.0093844 PMID: 24740359
31. Teschendorff AE, Marabita F, Lechner M, Bartlett T, Tegner J, Gomez-Cabrero D, et al. A beta-mixturequantile normalization method for correcting probe design bias in Illumina Infinium 450 k DNAmethyla-tion data. Bioinformatics. 2013; 29(2):189–96. doi: 10.1093/bioinformatics/bts680 PMID: 23175756
32. Houseman EA, AccomandoWP, Koestler DC, Christensen BC, Marsit CJ, Nelson HH, et al. DNAmeth-ylation arrays as surrogate measures of cell mixture distribution. BMC Bioinformatics. 2012; 13:86. doi:10.1186/1471-2105-13-86 PMID: 22568884
33. Benjamini Y, Hochberg Y. Controlling the False Discovery Rate: A Practical and Powerful Approach toMultiple Testing. Journal of the Royal Statistical Society Series B (Methodological). 1995; 57(1):289–300.
34. Chen YA, Lemire M, Choufani S, Butcher DT, Grafodatskaya D, Zanke BW, et al. Discovery of cross-reactive probes and polymorphic CpGs in the Illumina Infinium HumanMethylation450 microarray. Epi-genetics: official journal of the DNAMethylation Society. 2013; 8(2):203–9.
35. Hidalgo B, Irvin MR, Sha J, Zhi D, Aslibekyan S, Absher D, et al. Epigenome-wide association study offasting measures of glucose, insulin, and HOMA-IR in the Genetics of Lipid Lowering Drugs and DietNetwork study. Diabetes. 2014; 63(2):801–7. doi: 10.2337/db13-1100 PMID: 24170695
36. Westerterp M, Bochem AE, Yvan-Charvet L, Murphy AJ, Wang N, Tall AR. ATP-binding cassette trans-porters, atherosclerosis, and inflammation. Circ Res. 2014; 114(1):157–70. doi: 10.1161/CIRCRESAHA.114.300738 PMID: 24385509
37. Wilson PW, McGee DL, Kannel WB. Obesity, very low density lipoproteins, and glucose intoleranceover fourteen years: The Framingham Study. Am J Epidemiol. 1981; 114(5):697–704. PMID: 7304597
38. von Eckardstein A, Schulte H, Assmann G. Risk for diabetes mellitus in middle-aged Caucasian maleparticipants of the PROCAM study: implications for the definition of impaired fasting glucose by theAmerican Diabetes Association. Prospective Cardiovascular Munster. J Clin Endocrinol Metab. 2000;85(9):3101–8. PMID: 10999793
39. Pfeiffer L, Wahl S, Pilling LC, Reischl E, Sandling JK, Kunze S, et al. DNAmethylation of lipid-relatedgenes affects blood lipid levels. Circulation Cardiovascular genetics. 2015; 8(2):334–42. doi: 10.1161/CIRCGENETICS.114.000804 PMID: 25583993
40. Kruit JK, Wijesekara N, Westwell-Roper C, Vanmierlo T, de HaanW, Bhattacharjee A, et al. Loss ofboth ABCA1 and ABCG1 results in increased disturbances in islet sterol homeostasis, inflammation,and impaired beta-cell function. Diabetes. 2012; 61(3):659–64. doi: 10.2337/db11-1341 PMID:22315310
41. Sturek JM, Castle JD, Trace AP, Page LC, Castle AM, Evans-Molina C, et al. An intracellular role forABCG1-mediated cholesterol transport in the regulated secretory pathway of mouse pancreatic betacells. J Clin Invest. 2010; 120(7):2575–89. doi: 10.1172/JCI41280 PMID: 20530872
42. Zhou H, Li C, Li J, Yao H, Su R, Li W, et al. Associations of ATP-binding cassette transporter A1 andG1 with insulin secretion in human insulinomas. Pancreas. 2012; 41(6):934–9. doi: 10.1097/MPA.0b013e318243a5e3 PMID: 22466164
43. Johansson LE, Danielsson AP, Parikh H, Klintenberg M, Norstrom F, Groop L, et al. Differential geneexpression in adipose tissue from obese human subjects during weight loss and weight maintenance.Am J Clin Nutr. 2012; 96(1):196–207. doi: 10.3945/ajcn.111.020578 PMID: 22648723
44. Mauldin JP, Nagelin MH, Wojcik AJ, Srinivasan S, Skaflen MD, Ayers CR, et al. Reduced expression ofATP-binding cassette transporter G1 increases cholesterol accumulation in macrophages of patientswith type 2 diabetes mellitus. Circulation. 2008; 117(21):2785–92. doi: 10.1161/CIRCULATIONAHA.107.741314 PMID: 18490524
45. Chambers JC, Loh M, Lehne B, Drong A, Kriebel J, Motta V, et al. Epigenome-wide association of DNAmethylation markers in peripheral blood from Indian Asians and Europeans with incident type 2 diabe-tes: a nested case-control study. Lancet Diabetes Endocrinol. 2015; 3(7):526–34. doi: 10.1016/S2213-8587(15)00127-8 PMID: 26095709
46. Holliday R. Epigenetics: a historical overview. Epigenetics: official journal of the DNAMethylation Soci-ety. 2006; 1(2):76–80.
DNAMethylation and Glucose Metabolism
PLOSONE | DOI:10.1371/journal.pone.0152314 March 28, 2016 22 / 25
47. Hou L, Zhang X, Wang D, Baccarelli A. Environmental chemical exposures and human epigenetics.International journal of epidemiology. 2012; 41(1):79–105. doi: 10.1093/ije/dyr154 PMID: 22253299
48. Waki H, Yamauchi T, Kadowaki T. The Epigenome and Its Role in Diabetes. Curr Diab Rep. 2012; 12(6):673–85. doi: 10.1007/s11892-012-0328-x PMID: 23070559
49. Langevin SM, Kelsey KT. The fate is not always written in the genes: epigenomics in epidemiologicstudies. Environmental and molecular mutagenesis. 2013; 54(7):533–41. doi: 10.1002/em.21762PMID: 23444110
50. Vitto MF, Luz G, Luciano TF, Marques SO, Souza DR, Pinho RA, et al. Reversion of steatosis bySREBP-1c antisense oligonucleotide did not improve hepatic insulin action in diet-induced obesitymice. HormMetab Res. 2012; 44(12):885–90. doi: 10.1055/s-0032-1321819 PMID: 22932913
51. Haas JT, Miao J, Chanda D, Wang Y, Zhao E, Haas ME, et al. Hepatic insulin signaling is required forobesity-dependent expression of SREBP-1c mRNA but not for feeding-dependent expression. Cellmetabolism. 2012; 15(6):873–84. doi: 10.1016/j.cmet.2012.05.002 PMID: 22682225
52. Hotamisligil GS. Inflammation and metabolic disorders. Nature. 2006; 444(7121):860–7. PMID:17167474
53. Feingold KR, Soued M, Staprans I, Gavin LA, Donahue ME, Huang BJ, et al. Effect of tumor necrosisfactor (TNF) on lipid metabolism in the diabetic rat. Evidence that inhibition of adipose tissue lipoproteinlipase activity is not required for TNF-induced hyperlipidemia. J Clin Invest. 1989; 83(4):1116–21.PMID: 2703526
54. Korkmazer E, Solak N. Correlation between inflammatory markers and insulin resistance in pregnancy.Journal of obstetrics and gynaecology: the journal of the Institute of Obstetrics and Gynaecology.2014:1–4.
55. Xu J, Zhao YH, Chen YP, Yuan XL, Wang J, Zhu H, et al. Maternal circulating concentrations of tumornecrosis factor-alpha, leptin, and adiponectin in gestational diabetes mellitus: a systematic review andmeta-analysis. TheScientificWorldJournal. 2014; 2014:926932. doi: 10.1155/2014/926932 PMID:25202741
56. Chen X, Huang Z, RanW, Liao G, Zha L, Wang Z. Type 2 diabetes mellitus control and atherosclerosisprevention in a non-obese rat model using duodenal-jejunal bypass. Experimental and therapeuticmedicine. 2014; 8(3):856–62. PMID: 25120614
57. Volpe CM, Abreu LF, Gomes PS, Gonzaga RM, Veloso CA, Nogueira-Machado JA. The production ofnitric oxide, IL-6, and TNF-alpha in palmitate-stimulated PBMNCs is enhanced through hyperglycemiain diabetes. Oxidative medicine and cellular longevity. 2014; 2014:479587. doi: 10.1155/2014/479587PMID: 24803982
58. Fernandez-Veledo S, Vila-Bedmar R, Nieto-Vazquez I, Lorenzo M. c-Jun N-terminal kinase 1/2 activa-tion by tumor necrosis factor-alpha induces insulin resistance in human visceral but not subcutaneousadipocytes: reversal by liver X receptor agonists. J Clin Endocrinol Metab. 2009; 94(9):3583–93. doi:10.1210/jc.2009-0558 PMID: 19567513
59. Wang Z, Lv J, Zhang R, Zhu Y, Zhu D, Sun Y, et al. Co-culture with fat cells induces cellular insulinresistance in primary hepatocytes. Biochem Biophys Res Commun. 2006; 345(3):976–83. PMID:16712794
60. Kalninova J, Jakus V, Glejtkova M, Kuracka L, Sandorova E. Impact of glycemic control on advancedglycation and inflammation in overweight and obese patients with type 2 diabetes mellitus. Bratisl LekListy. 2014; 115(8):457–68. PMID: 25246279
61. Marques-Vidal P, Bastardot F, von Kanel R, Paccaud F, Preisig M, Waeber G, et al. Associationbetween circulating cytokine levels, diabetes and insulin resistance in a population-based sample(CoLaus study). Clin Endocrinol (Oxf). 2013; 78(2):232–41.
62. De Silva NM, Freathy RM, Palmer TM, Donnelly LA, Luan J, Gaunt T, et al. Mendelian randomizationstudies do not support a role for raised circulating triglyceride levels influencing type 2 diabetes, glu-cose levels, or insulin resistance. Diabetes. 2011; 60(3):1008–18. doi: 10.2337/db10-1317 PMID:21282362
63. Meng ZX, Yin Y, Lv JH, Sha M, Lin Y, Gao L, et al. Aberrant activation of liver X receptors impairs pan-creatic beta cell function through upregulation of sterol regulatory element-binding protein 1c in mouseislets and rodent cell lines. Diabetologia. 2012; 55(6):1733–44. doi: 10.1007/s00125-012-2516-2PMID: 22415588
64. Nyman LR, Tian L, HammDA, Schoeb TR, Gower BA, Nagy TR, et al. Long term effects of high fat orhigh carbohydrate diets on glucose tolerance in mice with heterozygous carnitine palmitoyltransferase-1a (CPT-1a) deficiency: Diet influences on CPT1a deficient mice. Nutrition & diabetes. 2011; 1:e14.
65. Orellana-Gavalda JM, Herrero L, Malandrino MI, Paneda A, Sol Rodriguez-Pena M, Petry H, et al.Molecular therapy for obesity and diabetes based on a long-term increase in hepatic fatty-acid oxida-tion. Hepatology. 2011; 53(3):821–32. doi: 10.1002/hep.24140 PMID: 21319201
DNAMethylation and Glucose Metabolism
PLOSONE | DOI:10.1371/journal.pone.0152314 March 28, 2016 23 / 25
66. Hirota Y, Ohara T, Zenibayashi M, Kuno S, Fukuyama K, Teranishi T, et al. Lack of association ofCPT1A polymorphisms or haplotypes on hepatic lipid content or insulin resistance in Japanese individ-uals with type 2 diabetes mellitus. Metabolism. 2007; 56(5):656–61. PMID: 17445541
67. Gonzalez-Muniesa P, Marrades MP, Martinez JA, Moreno-Aliaga MJ. Differential proinflammatory andoxidative stress response and vulnerability to metabolic syndrome in habitual high-fat young male con-sumers putatively predisposed by their genetic background. Int J Mol Sci. 2013; 14(9):17238–55. doi:10.3390/ijms140917238 PMID: 23975165
68. Zhu L, Yu Q, Lin J, Zhang Q, Yang Q. Cloning and functional analysis of goat glucose transporter 4.Molecular biology reports. 2014; 41(2):757–68. doi: 10.1007/s11033-013-2915-6 PMID: 24381100
69. Yu Q, Zhu L, Lin J, Zhang Q, Tian Q, HuW, et al. Functional analyse of GLUT1 and GLUT12 in glucoseuptake in goat mammary gland epithelial cells. PLoS One. 2013; 8(5):e65013. doi: 10.1371/journal.pone.0065013 PMID: 23724114
70. Diaz M, Martel N, Fitzsimmons RL, Eriksson NA, Cowin GJ, Thomas GP, et al. Ski overexpression inskeletal muscle modulates genetic programs that control susceptibility to diet-induced obesity and insu-lin signaling. Obesity (Silver Spring). 2012; 20(11):2157–67.
71. Leong GM, Kee AJ, Millard SM, Martel N, Eriksson N, Turner N, et al. The Ski proto-oncogene regulatesbody composition and suppresses lipogenesis. Int J Obes (Lond). 2010; 34(3):524–36.
72. Rondas D, Tomas A, Soto-Ribeiro M, Wehrle-Haller B, Halban PA. Novel mechanistic link betweenfocal adhesion remodeling and glucose-stimulated insulin secretion. J Biol Chem. 2012; 287(4):2423–36. doi: 10.1074/jbc.M111.279885 PMID: 22139838
73. Na YK, Hong HS, Lee DH, LeeWK, Kim DS. Effect of body mass index on global DNAmethylation inhealthy Korean women. Molecules and cells. 2014; 37(6):467–72. doi: 10.14348/molcells.2014.0073PMID: 24938226
74. Stepanow S, Reichwald K, Huse K, Gausmann U, Nebel A, Rosenstiel P, et al. Allele-specific, age-dependent and BMI-associated DNAmethylation of humanMCHR1. PLoS One. 2011; 6(5):e17711.doi: 10.1371/journal.pone.0017711 PMID: 21637341
75. Baccarelli A, Bollati V. Epigenetics and environmental chemicals. Current opinion in pediatrics. 2009;21(2):243–51. PMID: 19663042
76. Choudhuri S, Cui Y, Klaassen CD. Molecular targets of epigenetic regulation and effectors of environ-mental influences. Toxicology and applied pharmacology. 2010; 245(3):378–93. doi: 10.1016/j.taap.2010.03.022 PMID: 20381512
77. Irizarry RA, Ladd-Acosta C, Wen B, Wu Z, Montano C, Onyango P, et al. The human colon cancermethylome shows similar hypo- and hypermethylation at conserved tissue-specific CpG island shores.Nat Genet. 2009; 41(2):178–86. doi: 10.1038/ng.298 PMID: 19151715
78. Doi A, Park IH, Wen B, Murakami P, Aryee MJ, Irizarry R, et al. Differential methylation of tissue- andcancer-specific CpG island shores distinguishes human induced pluripotent stem cells, embryonicstem cells and fibroblasts. Nat Genet. 2009; 41(12):1350–3. doi: 10.1038/ng.471 PMID: 19881528
79. Baylin SB, Jones PA. A decade of exploring the cancer epigenome—biological and translational impli-cations. Nature reviews Cancer. 2011; 11(10):726–34. doi: 10.1038/nrc3130 PMID: 21941284
80. Rivera RM, Bennett LB. Epigenetics in humans: an overview. Current opinion in endocrinology, diabe-tes, and obesity. 2010; 17(6):493–9. doi: 10.1097/MED.0b013e3283404f4b PMID: 20962634
81. AnW, Zhang Z, Zeng L, Yang Y, Zhu X, Wu J. Cyclin Y Is Involved in the Regulation of Adipogenesisand Lipid Production. PLoS One. 2015; 10(7):e0132721. doi: 10.1371/journal.pone.0132721 PMID:26161966
82. Gustafson B, Hedjazifar S, Gogg S, Hammarstedt A, Smith U. Insulin resistance and impaired adipo-genesis. Trends Endocrinol Metab. 2015; 26(4):193–200. doi: 10.1016/j.tem.2015.01.006 PMID:25703677
83. Henninger AM, Eliasson B, Jenndahl LE, Hammarstedt A. Adipocyte hypertrophy, inflammation andfibrosis characterize subcutaneous adipose tissue of healthy, non-obese subjects predisposed to type2 diabetes. PLoS One. 2014; 9(8):e105262. doi: 10.1371/journal.pone.0105262 PMID: 25148116
84. Hirata M, Suzuki M, Ishii R, Satow R, Uchida T, Kitazumi T, et al. Genetic defect in phospholipaseCdelta1 protects mice from obesity by regulating thermogenesis and adipogenesis. Diabetes. 2011; 60(7):1926–37. doi: 10.2337/db10-1500 PMID: 21617180
85. Fiume R, Ramazzotti G, Faenza I, Piazzi M, Bavelloni A, Billi AM, et al. Nuclear PLCs affect insulinsecretion by targeting PPARgamma in pancreatic beta cells. FASEB journal: official publication of theFederation of American Societies for Experimental Biology. 2012; 26(1):203–10.
86. Alexandraki K, Piperi C, Kalofoutis C, Singh J, Alaveras A, Kalofoutis A. Inflammatory process in type 2diabetes: The role of cytokines. Ann N Y Acad Sci. 2006; 1084:89–117. PMID: 17151295
DNAMethylation and Glucose Metabolism
PLOSONE | DOI:10.1371/journal.pone.0152314 March 28, 2016 24 / 25
87. Kulkarni RN, Kahn CR. Ephs and ephrins keep pancreatic Beta cells connected. Cell. 2007; 129(2):241–3. PMID: 17448984
88. Dorrell C, Schug J, Lin CF, Canaday PS, Fox AJ, Smirnova O, et al. Transcriptomes of the majorhuman pancreatic cell types. Diabetologia. 2011; 54(11):2832–44. doi: 10.1007/s00125-011-2283-5PMID: 21882062
89. Jain R, Lammert E. Cell-cell interactions in the endocrine pancreas. Diabetes Obes Metab. 2009; 11Suppl 4:159–67. doi: 10.1111/j.1463-1326.2009.01102.x PMID: 19817798
90. Konstantinova I, Nikolova G, Ohara-Imaizumi M, Meda P, Kucera T, Zarbalis K, et al. EphA-Ephrin-A-mediated beta cell communication regulates insulin secretion from pancreatic islets. Cell. 2007; 129(2):359–70. PMID: 17448994
91. ZhangW, Thompson BJ, Hietakangas V, Cohen SM. MAPK/ERK signaling regulates insulin sensitivityto control glucose metabolism in Drosophila. PLoS Genet. 2011; 7(12):e1002429. doi: 10.1371/journal.pgen.1002429 PMID: 22242005
92. Ozaki KI, Awazu M, Tamiya M, Iwasaki Y, Harada A, Kugisaki S, et al. Targeting the ERK signalingpathway as a potential treatment for insulin resistance and type 2 diabetes. American journal of physiol-ogy Endocrinology and metabolism. 2016:ajpendo 00445 2015.
93. Marker T, Sell H, Zillessen P, Glode A, Kriebel J, Ouwens DM, et al. Heat shock protein 60 as a media-tor of adipose tissue inflammation and insulin resistance. Diabetes. 2012; 61(3):615–25. doi: 10.2337/db10-1574 PMID: 22315307
DNAMethylation and Glucose Metabolism
PLOSONE | DOI:10.1371/journal.pone.0152314 March 28, 2016 25 / 25