researcharticle lineage … · researcharticle lineage-specificchangesinbiomarkersin...
TRANSCRIPT
RESEARCH ARTICLE
Lineage-Specific Changes in Biomarkers inGreat Apes and HumansClaudius Ronke1*, Michael Dannemann2, Michel Halbwax2, Anne Fischer2,Christin Helmschrodt1, Mathias Brügel1, Claudine André4, Rebeca Atencia5,Lawrence Mugisha6,7, Markus Scholz3, Uta Ceglarek1, Joachim Thiery1, Svante Pääbo2,Kay Prüfer2, Janet Kelso2
1 Institute of Laboratory Medicine, Clinical Chemistry and Molecular Diagnostics, University Hospital Leipzig,Leipzig, Germany, 2 Max Planck Institute for Evolutionary Anthropology, Leipzig, Germany, 3 Institute forMedical Informatics, Statistics and Epidemiology, University of Leipzig, Leipzig, Germany, 4 Lola Ya BonoboSanctuary, “Petites Chutes de la Lukaya,” Kinshasa, Democratic Republic of Congo, 5 Réserve NaturelleSanctuaire àChimpanzés de Tchimpounga, Jane Goodall Institute, Pointe-Noire, Republic of Congo,6 Conservation & Ecosystem Health Alliance (CEHA), Kampala, Uganda, 7 College of Veterinary Medicine,Animal Resources & Biosecurity, Makerere University, Kampala, Uganda
AbstractAlthough human biomedical and physiological information is readily available, such infor-
mation for great apes is limited. We analyzed clinical chemical biomarkers in serum sam-
ples from 277 wild- and captive-born great apes and from 312 healthy human volunteers
as well as from 20 rhesus macaques. For each individual, we determined a maximum of
33 markers of heart, liver, kidney, thyroid and pancreas function, hemoglobin and lipid
metabolism and one marker of inflammation. We identified biomarkers that show differ-
ences between humans and the great apes in their average level or activity. Using the rhe-
sus macaques as an outgroup, we identified human-specific differences in the levels of
bilirubin, cholinesterase and lactate dehydrogenase, and bonobo-specific differences in the
level of apolipoprotein A-I. For the remaining twenty-nine biomarkers there was no evidence
for lineage-specific differences. In fact, we find that many biomarkers show differences
between individuals of the same species in different environments. Of the four lineage-
specific biomarkers, only bilirubin showed no differences between wild- and captive-born
great apes. We show that the major factor explaining the human-specific difference in
bilirubin levels may be genetic. There are human-specific changes in the sequence of the
promoter and the protein-coding sequence of uridine diphosphoglucuronosyltransferase
1 (UGT1A1), the enzyme that transforms bilirubin and toxic plant compounds into water-sol-
uble, excretable metabolites. Experimental evidence that UGT1A1 is down-regulated in the
human liver suggests that changes in the promoter may be responsible for the human-spe-
cific increase in bilirubin. We speculate that since cooking reduces toxic plant compounds,
consumption of cooked foods, which is specific to humans, may have resulted in relaxed
constraint on UGT1A1 which has in turn led to higher serum levels of bilirubin in humans.
PLOS ONE | DOI:10.1371/journal.pone.0134548 August 6, 2015 1 / 21
OPEN ACCESS
Citation: Ronke C, Dannemann M, Halbwax M,Fischer A, Helmschrodt C, Brügel M, et al. (2015)Lineage-Specific Changes in Biomarkers in GreatApes and Humans. PLoS ONE 10(8): e0134548.doi:10.1371/journal.pone.0134548
Editor: Francesc Calafell, Universitat Pompeu Fabra,SPAIN
Received: December 16, 2014
Accepted: July 10, 2015
Published: August 6, 2015
Copyright: © 2015 Ronke et al. This is an openaccess article distributed under the terms of theCreative Commons Attribution License, which permitsunrestricted use, distribution, and reproduction in anymedium, provided the original author and source arecredited.
Data Availability Statement: All relevant data arewithin the paper and its Supporting Information files.
Funding: The authors acknowledge financial supportfrom the Max Planck Society as well as grants fromthe European Research Council (ERC) (grant233297, TWOPAN) to S.P., the German ResearchFoundation (Deutsche Forschungsgemeinschaft(DFG)) SFB1052 “Obesity mechanisms” (projectA02) to J.K and from the German ResearchFoundation (Deutsche Forschungsgemeinschaft(DFG)) and the University of Leipzig within theprogram of Open Access Publishing. The fundershad no role in study design, data collection and
IntroductionHumans and their closest evolutionary relatives, the chimpanzees and bonobos, differ fromone another in morphological, cognitive, behavioural and physiological traits [1–3]. The avail-ability of genome sequences for human, chimpanzee, bonobo and rhesus macaque allows forthe identification of lineage-specific sequence changes. However, since most of the sequencedifferences are likely to be neutral [4], it remains a challenging task to identify those that haveimportant biological consequences [5]. For a relative small number of loci, human lineage-spe-cific genomic changes have been linked to phenotypic differences to the other great apes [6].One example is a deletion within the human gene CMAH which leads to the loss of the sialicacid Neu5Gc and to altered pathogen susceptibility [7].
Using the great apes to identify connections between genotype and phenotype in humans ishampered by the comparatively limited biomedical and physiological information about greatapes [1, 5, 8]. Blood provides an opportunity to quantitatively analyze metabolic products thatcan serve as markers of metabolic and hormonal states [9]. The genes and metabolic pathwaysunderlying these metabolic products are often well-characterized and it is therefore sometimespossible to identify the potential genetic basis for differences in metabolite levels.
While blood biomarkers are extensively studied in humans, there have been only limitedcomparative studies of humans and great apes. These that exist have been carried out in smallnumbers of captive animals [10, 11] or involve a single species [12–15].
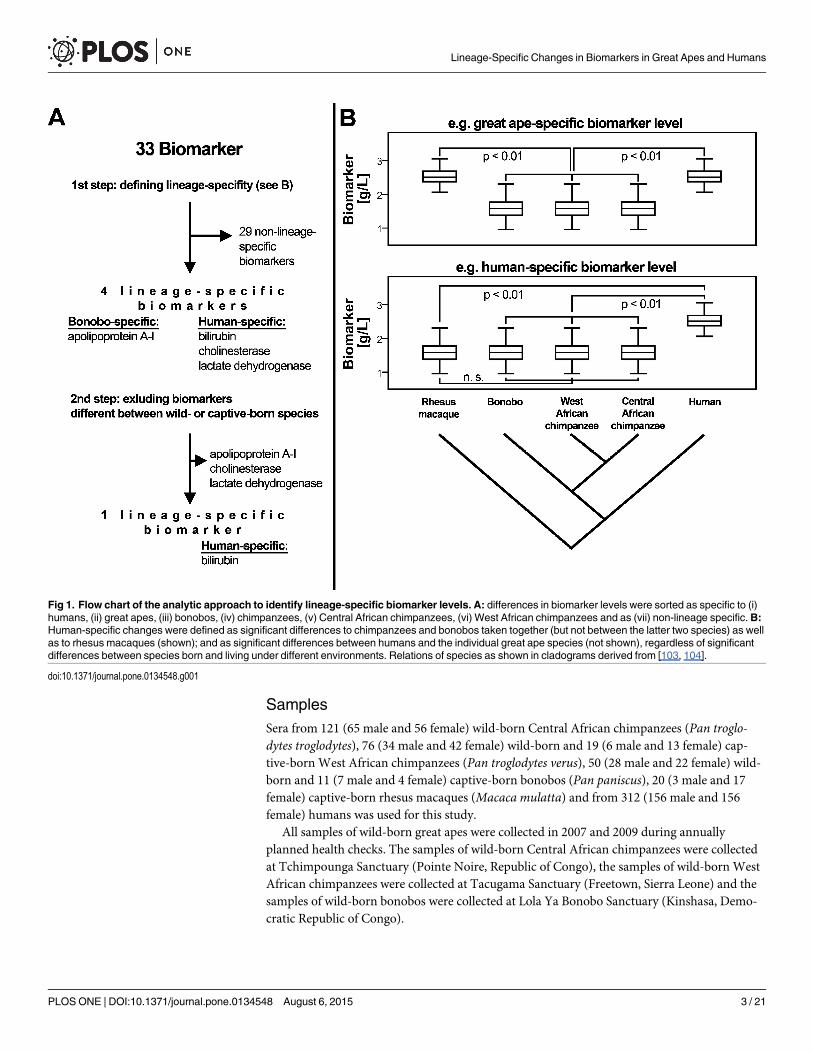
The aim of this study was to identify biomarkers that show lineage-specific changes in theirlevels or activity in the serum of humans, chimpanzees and bonobos. We analyzed serum sam-ples from 277 wild-born and captive-born great apes (121 Central African chimpanzees, 95West African chimpanzees, 61 bonobos), and from 312 healthy human volunteers from Ger-many. For each sample we measured up to 33 biomarkers that are routinely used in humanand veterinary medicine to quantify heart, liver, kidney, thyroid and pancreas function, hemo-globin and lipid metabolism and one marker of inflammation. We assigned lineage-specificchanges based on comparison to serum levels of the same biomarkers in 20 rhesus macaquesfrom Germany (Fig 1). We identified biomarkers that are likely to have changed on one lineageand divide these into changes that are strongly influenced by environmental factors andchanges that are unlikely to be explained by environmental effects alone.
Methodology
Ethics statementAll animal work was conducted according to relevant national, EU and international guide-lines. In all cases, the animals were not subjected to any experimental procedures, and theblood samples used were left-over aliquots collected by veterinarians carrying out routine med-ical examinations. Authorization for use of the samples was obtained from the respective Min-istries of Environment as well as by the Ministère de la Recherche Scientifique (DRC) to “LesAmis des Bonobos du Congo”, the Uganda Wildlife Authority and the Uganda National Coun-cil for Science and Technology, and the Ministère de l'Enseignement Supérieur et de la Recher-che Scientifique from Republic of Congo. The international transport of samples was approved(CITES numbers: Uganda E-3520/05, Kenya E-1259/05, DRC E-0908/07, Republic of CongoE-1274/07). The proposal that in part covers this research (233297, TWOPAN) was reviewedand approved by the European Commission.
Lineage-Specific Changes in Biomarkers in Great Apes and Humans
PLOS ONE | DOI:10.1371/journal.pone.0134548 August 6, 2015 2 / 21
analysis, decision to publish, or preparation of themanuscript.
Competing Interests: The authors have declaredthat no competing interests exist.
SamplesSera from 121 (65 male and 56 female) wild-born Central African chimpanzees (Pan troglo-dytes troglodytes), 76 (34 male and 42 female) wild-born and 19 (6 male and 13 female) cap-tive-born West African chimpanzees (Pan troglodytes verus), 50 (28 male and 22 female) wild-born and 11 (7 male and 4 female) captive-born bonobos (Pan paniscus), 20 (3 male and 17female) captive-born rhesus macaques (Macaca mulatta) and from 312 (156 male and 156female) humans was used for this study.
All samples of wild-born great apes were collected in 2007 and 2009 during annuallyplanned health checks. The samples of wild-born Central African chimpanzees were collectedat Tchimpounga Sanctuary (Pointe Noire, Republic of Congo), the samples of wild-born WestAfrican chimpanzees were collected at Tacugama Sanctuary (Freetown, Sierra Leone) and thesamples of wild-born bonobos were collected at Lola Ya Bonobo Sanctuary (Kinshasa, Demo-cratic Republic of Congo).
Fig 1. Flow chart of the analytic approach to identify lineage-specific biomarker levels. A: differences in biomarker levels were sorted as specific to (i)humans, (ii) great apes, (iii) bonobos, (iv) chimpanzees, (v) Central African chimpanzees, (vi) West African chimpanzees and as (vii) non-lineage specific.B:Human-specific changes were defined as significant differences to chimpanzees and bonobos taken together (but not between the latter two species) as wellas to rhesus macaques (shown); and as significant differences between humans and the individual great ape species (not shown), regardless of significantdifferences between species born and living under different environments. Relations of species as shown in cladograms derived from [103, 104].
doi:10.1371/journal.pone.0134548.g001
Lineage-Specific Changes in Biomarkers in Great Apes and Humans
PLOS ONE | DOI:10.1371/journal.pone.0134548 August 6, 2015 3 / 21
The wild-born great apes were fasting from the evening before the anaesthesia and werethen anaesthetized with a combination of medetomidine (Domitor, Pfizer, NY, USA, 0.03 to0.05 mg/kg) and ketamine (Imalgen, Merial, GA, USA, 3 to 4 mg/kg), injected intramuscularlywith either a dart (Telinject, France) or a syringe (Terumo, Japan). Blood was collected fromthe femoral vein with the Vacutainer (Becton Dickinson, NJ, USA) or with the Monovette-sys-tem (Sarstedt, Germany). Then blood was processed according to a standardized protocol inorder to minimize preanalytic influences. Blood was allowed to clot for 30 minutes at roomtemperature, then centrifuged at 4° C for 10 minutes at 1600 g. The supernatant serum wastransferred into a freezing tube, stored on dry ice, protected from light and transferred to ourlaboratory for subsequent biomarker analysis. Two bonobos were excluded from analysis sincethey died shortly after the sampling of the blood. One Central African chimpanzee wasexcluded since he was an outlier in a principle component analysis. Median ages for wild-bornbonobos, Central and West African chimpanzees were 6 years (range: 3 to 20 years), 8 years(range: 2 to 42 years) and 4 years (range: 1 to 23 years), respectively (Table 1). Median weightswere 18.8 kg (2.5th to 97.5th percentiles: 4.9 and 45 kg), 38.8 kg (2.5th to 97.5th percentiles: 10and 67 kg) and 27 kg (2.5th to 97.5th percentiles: 9.9 and 53.2 kg).
Samples from captive-born West African chimpanzees and bonobos were obtained fromthe Leipzig Zoo during routine health checks between 2005 and 2013. Animals fasted for 12hours prior to anaesthesia with a combination of xylazine (2 to 3 mg/kg for bonobos and 2.4 to4 mg/kg for chimpanzees) and ketamine (4 to 6 mg/kg for bonobos and 2.5 to 4 mg/kg forchimpanzees), injected intramuscularly with a dart. Blood was taken either from the venasaphena parva superficialis or from the vena mediana cubiti. Sera were stored at -80°C prior toanalysis. No weights were available for captive-born great apes. Median ages for captive-bornbonobos, and West African chimpanzees were 14 years (range: 3 to 17 years) and 20 years(range: 8 to 46 years), respectively (Table 1).
Sera from rhesus macaques were purchased from the German primate center (Göttingen/Germany). The sera were from healthy individuals kept for breeding purposes, and were col-lected during routine physical exams in May 2007 from the vena saphena of the proximal forthof the thigh. Animals had been anaesthetized with ketamine after a 12 hour fast. All sera werestored at -20° C prior to analysis. Although individual weights were not recorded for each rhe-sus macaque, males were between 2 and 3 kg and females between 7 and 8 kg. The median agefor rhesus macaques was 3.5 years (range: 1 to 22 years; Table 1).
As the human reference group we used serum of a group of 312 young healthy blood donorspreviously described [16]. Median age was 27 years (range: 18 to 65 years; Table 1); medianweight was 70 kg (2.5th to 97.5th percentiles: 52 and 98 kg).
Biochemical analysesAll biochemical analyses were performed at the Institute of Laboratory Medicine, ClinicalChemistry and Molecular Diagnostics of the University Clinic Leipzig/Germany except forparts of the analysis of lipoprotein(a) (Lp(a)) which was performed at the Department of Medi-cal Genetics, Molecular and Clinical Pharmacology, Divisions of Genetic Epidemiology andHuman Genetics of the Innsbruck Medical University (Innsbruck/Austria).
Total cholesterol, HDL and LDL cholesterol, triglycerides, albumin, total protein, creatinine,urea and uric acid, bilirubin, glucose and phosphate were measured by using commercial pho-tometric tests on an automated Modular P analyzer (Roche/Hitachi; S1 Dataset) [17–31]. Con-centrations of apolipoprotein A-I and apolipoprotein B-100, C-reactive protein andLipoprotein (a) were measured by using immunoturbidimetric assays (Tina-quant apo AI ver-sion 2 and Tina-quant apo B-100 version 2, C-reactive protein Gen.3; Tina-quant Lipoprotein
Lineage-Specific Changes in Biomarkers in Great Apes and Humans
PLOS ONE | DOI:10.1371/journal.pone.0134548 August 6, 2015 4 / 21
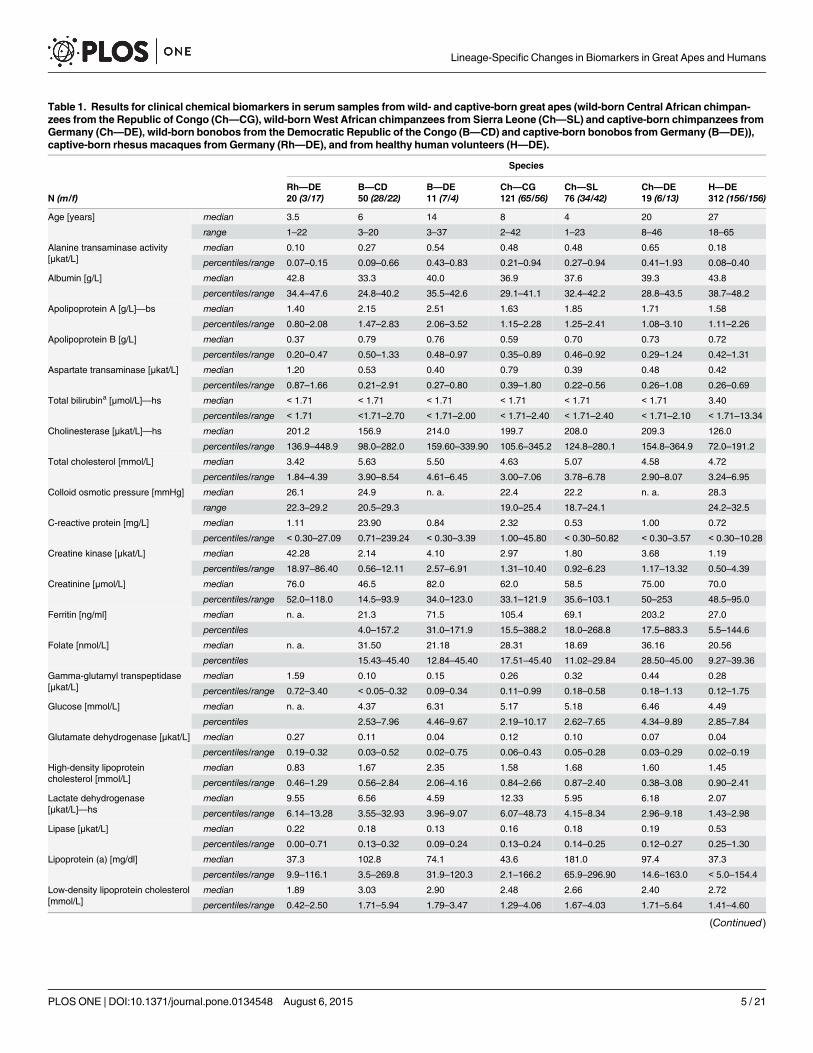
Table 1. Results for clinical chemical biomarkers in serum samples fromwild- and captive-born great apes (wild-born Central African chimpan-zees from the Republic of Congo (Ch—CG), wild-bornWest African chimpanzees from Sierra Leone (Ch—SL) and captive-born chimpanzees fromGermany (Ch—DE), wild-born bonobos from the Democratic Republic of the Congo (B—CD) and captive-born bonobos fromGermany (B—DE)),captive-born rhesusmacaques fromGermany (Rh—DE), and from healthy human volunteers (H—DE).
Species
Rh—DE B—CD B—DE Ch—CG Ch—SL Ch—DE H—DEN (m/f) 20 (3/17) 50 (28/22) 11 (7/4) 121 (65/56) 76 (34/42) 19 (6/13) 312 (156/156)
Age [years] median 3.5 6 14 8 4 20 27
range 1–22 3–20 3–37 2–42 1–23 8–46 18–65
Alanine transaminase activity[μkat/L]
median 0.10 0.27 0.54 0.48 0.48 0.65 0.18
percentiles/range 0.07–0.15 0.09–0.66 0.43–0.83 0.21–0.94 0.27–0.94 0.41–1.93 0.08–0.40
Albumin [g/L] median 42.8 33.3 40.0 36.9 37.6 39.3 43.8
percentiles/range 34.4–47.6 24.8–40.2 35.5–42.6 29.1–41.1 32.4–42.2 28.8–43.5 38.7–48.2
Apolipoprotein A [g/L]—bs median 1.40 2.15 2.51 1.63 1.85 1.71 1.58
percentiles/range 0.80–2.08 1.47–2.83 2.06–3.52 1.15–2.28 1.25–2.41 1.08–3.10 1.11–2.26
Apolipoprotein B [g/L] median 0.37 0.79 0.76 0.59 0.70 0.73 0.72
percentiles/range 0.20–0.47 0.50–1.33 0.48–0.97 0.35–0.89 0.46–0.92 0.29–1.24 0.42–1.31
Aspartate transaminase [μkat/L] median 1.20 0.53 0.40 0.79 0.39 0.48 0.42
percentiles/range 0.87–1.66 0.21–2.91 0.27–0.80 0.39–1.80 0.22–0.56 0.26–1.08 0.26–0.69
Total bilirubina [μmol/L]—hs median < 1.71 < 1.71 < 1.71 < 1.71 < 1.71 < 1.71 3.40
percentiles/range < 1.71 <1.71–2.70 < 1.71–2.00 < 1.71–2.40 < 1.71–2.40 < 1.71–2.10 < 1.71–13.34
Cholinesterase [μkat/L]—hs median 201.2 156.9 214.0 199.7 208.0 209.3 126.0
percentiles/range 136.9–448.9 98.0–282.0 159.60–339.90 105.6–345.2 124.8–280.1 154.8–364.9 72.0–191.2
Total cholesterol [mmol/L] median 3.42 5.63 5.50 4.63 5.07 4.58 4.72
percentiles/range 1.84–4.39 3.90–8.54 4.61–6.45 3.00–7.06 3.78–6.78 2.90–8.07 3.24–6.95
Colloid osmotic pressure [mmHg] median 26.1 24.9 n. a. 22.4 22.2 n. a. 28.3
range 22.3–29.2 20.5–29.3 19.0–25.4 18.7–24.1 24.2–32.5
C-reactive protein [mg/L] median 1.11 23.90 0.84 2.32 0.53 1.00 0.72
percentiles/range < 0.30–27.09 0.71–239.24 < 0.30–3.39 1.00–45.80 < 0.30–50.82 < 0.30–3.57 < 0.30–10.28
Creatine kinase [μkat/L] median 42.28 2.14 4.10 2.97 1.80 3.68 1.19
percentiles/range 18.97–86.40 0.56–12.11 2.57–6.91 1.31–10.40 0.92–6.23 1.17–13.32 0.50–4.39
Creatinine [μmol/L] median 76.0 46.5 82.0 62.0 58.5 75.00 70.0
percentiles/range 52.0–118.0 14.5–93.9 34.0–123.0 33.1–121.9 35.6–103.1 50–253 48.5–95.0
Ferritin [ng/ml] median n. a. 21.3 71.5 105.4 69.1 203.2 27.0
percentiles 4.0–157.2 31.0–171.9 15.5–388.2 18.0–268.8 17.5–883.3 5.5–144.6
Folate [nmol/L] median n. a. 31.50 21.18 28.31 18.69 36.16 20.56
percentiles 15.43–45.40 12.84–45.40 17.51–45.40 11.02–29.84 28.50–45.00 9.27–39.36
Gamma-glutamyl transpeptidase[μkat/L]
median 1.59 0.10 0.15 0.26 0.32 0.44 0.28
percentiles/range 0.72–3.40 < 0.05–0.32 0.09–0.34 0.11–0.99 0.18–0.58 0.18–1.13 0.12–1.75
Glucose [mmol/L] median n. a. 4.37 6.31 5.17 5.18 6.46 4.49
percentiles 2.53–7.96 4.46–9.67 2.19–10.17 2.62–7.65 4.34–9.89 2.85–7.84
Glutamate dehydrogenase [μkat/L] median 0.27 0.11 0.04 0.12 0.10 0.07 0.04
percentiles/range 0.19–0.32 0.03–0.52 0.02–0.75 0.06–0.43 0.05–0.28 0.03–0.29 0.02–0.19
High-density lipoproteincholesterol [mmol/L]
median 0.83 1.67 2.35 1.58 1.68 1.60 1.45
percentiles/range 0.46–1.29 0.56–2.84 2.06–4.16 0.84–2.66 0.87–2.40 0.38–3.08 0.90–2.41
Lactate dehydrogenase[μkat/L]—hs
median 9.55 6.56 4.59 12.33 5.95 6.18 2.07
percentiles/range 6.14–13.28 3.55–32.93 3.96–9.07 6.07–48.73 4.15–8.34 2.96–9.18 1.43–2.98
Lipase [μkat/L] median 0.22 0.18 0.13 0.16 0.18 0.19 0.53
percentiles/range 0.00–0.71 0.13–0.32 0.09–0.24 0.13–0.24 0.14–0.25 0.12–0.27 0.25–1.30
Lipoprotein (a) [mg/dl] median 37.3 102.8 74.1 43.6 181.0 97.4 37.3
percentiles/range 9.9–116.1 3.5–269.8 31.9–120.3 2.1–166.2 65.9–296.90 14.6–163.0 < 5.0–154.4
Low-density lipoprotein cholesterol[mmol/L]
median 1.89 3.03 2.90 2.48 2.66 2.40 2.72
percentiles/range 0.42–2.50 1.71–5.94 1.79–3.47 1.29–4.06 1.67–4.03 1.71–5.64 1.41–4.60
(Continued)
Lineage-Specific Changes in Biomarkers in Great Apes and Humans
PLOS ONE | DOI:10.1371/journal.pone.0134548 August 6, 2015 5 / 21
(a), Roche; S1 Dataset) on Modular P [32–35]. The catalytic activities of alanine transaminase,aspartate transaminase, cholinesterase, creatine kinase, gamma-glutamyl transpeptidase, gluta-mate dehydrogenase, lactate dehydrogenase and lipase were determined using a photometrictest on the same automated analyzer (S1 Dataset) [36–40]. Ferritin, free and total triiodothyro-nine and thyroxine, amino-terminal prohormone of brain natriuretic peptide (NTproBNP),troponin T and vitamin B12 were analyzed by a heterogeneous electrochemiluminescenceimmunoassay on an automated Modular E analyzer (Roche/Hitachi, S1 Dataset) [41, 42]. Lp(a) quantification in samples from the Republic of Congo, Sierra Leone and the DemocraticRepublic of Congo was performed as described in detail [43, 44] with a double-antibodyenzyme-linked immunosorbent assay (ELISA), using an affinity-purified polyclonal apo(a)antibody for coating and the horseradish peroxidase-conjugated monoclonal antibody fordetection. Colloid osmotic pressure was determined via direct hydrostatic pressure measure-ment on a colloid osmometer (Osmomat 50, Gonotec, Berlin, Germany) [45, 46] in triplicates.
A list of all biomarkers measured in this study with the corresponding method of detection,associated gene name (where possible) and pairwise alignment score for the comparison of
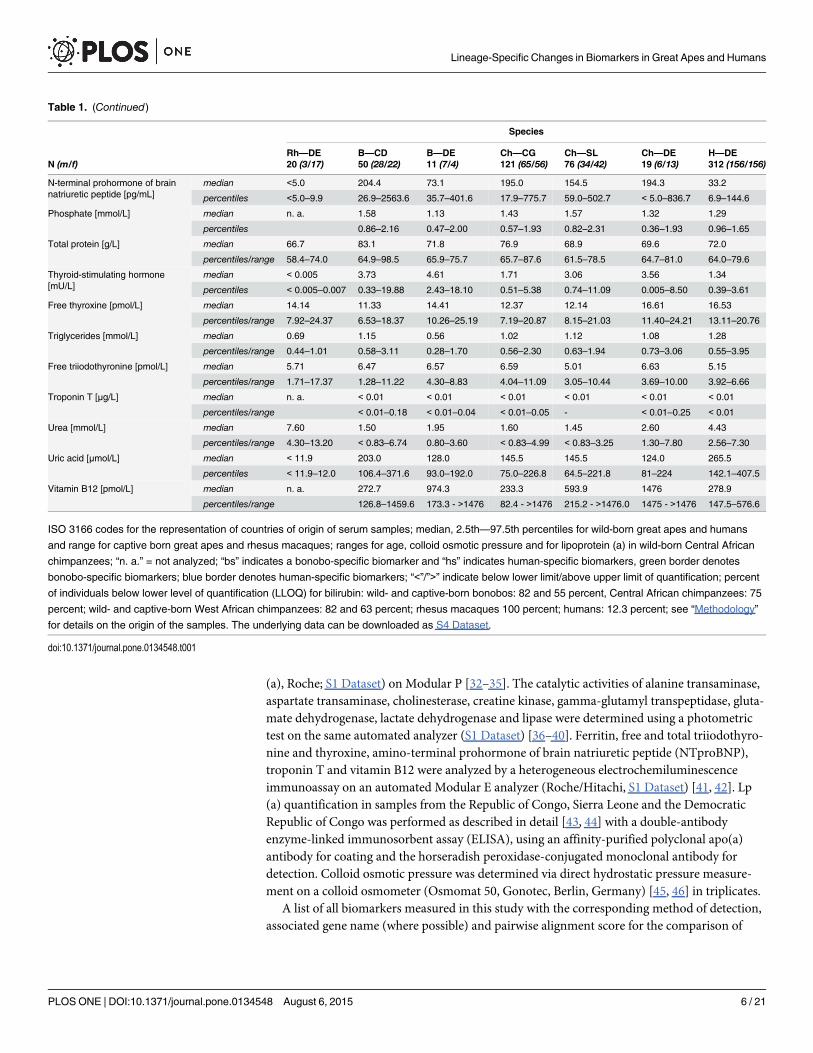
Table 1. (Continued)
Species
Rh—DE B—CD B—DE Ch—CG Ch—SL Ch—DE H—DEN (m/f) 20 (3/17) 50 (28/22) 11 (7/4) 121 (65/56) 76 (34/42) 19 (6/13) 312 (156/156)
N-terminal prohormone of brainnatriuretic peptide [pg/mL]
median <5.0 204.4 73.1 195.0 154.5 194.3 33.2
percentiles <5.0–9.9 26.9–2563.6 35.7–401.6 17.9–775.7 59.0–502.7 < 5.0–836.7 6.9–144.6
Phosphate [mmol/L] median n. a. 1.58 1.13 1.43 1.57 1.32 1.29
percentiles 0.86–2.16 0.47–2.00 0.57–1.93 0.82–2.31 0.36–1.93 0.96–1.65
Total protein [g/L] median 66.7 83.1 71.8 76.9 68.9 69.6 72.0
percentiles/range 58.4–74.0 64.9–98.5 65.9–75.7 65.7–87.6 61.5–78.5 64.7–81.0 64.0–79.6
Thyroid-stimulating hormone[mU/L]
median < 0.005 3.73 4.61 1.71 3.06 3.56 1.34
percentiles < 0.005–0.007 0.33–19.88 2.43–18.10 0.51–5.38 0.74–11.09 0.005–8.50 0.39–3.61
Free thyroxine [pmol/L] median 14.14 11.33 14.41 12.37 12.14 16.61 16.53
percentiles/range 7.92–24.37 6.53–18.37 10.26–25.19 7.19–20.87 8.15–21.03 11.40–24.21 13.11–20.76
Triglycerides [mmol/L] median 0.69 1.15 0.56 1.02 1.12 1.08 1.28
percentiles/range 0.44–1.01 0.58–3.11 0.28–1.70 0.56–2.30 0.63–1.94 0.73–3.06 0.55–3.95
Free triiodothyronine [pmol/L] median 5.71 6.47 6.57 6.59 5.01 6.63 5.15
percentiles/range 1.71–17.37 1.28–11.22 4.30–8.83 4.04–11.09 3.05–10.44 3.69–10.00 3.92–6.66
Troponin T [μg/L] median n. a. < 0.01 < 0.01 < 0.01 < 0.01 < 0.01 < 0.01
percentiles/range < 0.01–0.18 < 0.01–0.04 < 0.01–0.05 - < 0.01–0.25 < 0.01
Urea [mmol/L] median 7.60 1.50 1.95 1.60 1.45 2.60 4.43
percentiles/range 4.30–13.20 < 0.83–6.74 0.80–3.60 < 0.83–4.99 < 0.83–3.25 1.30–7.80 2.56–7.30
Uric acid [μmol/L] median < 11.9 203.0 128.0 145.5 145.5 124.0 265.5
percentiles < 11.9–12.0 106.4–371.6 93.0–192.0 75.0–226.8 64.5–221.8 81–224 142.1–407.5
Vitamin B12 [pmol/L] median n. a. 272.7 974.3 233.3 593.9 1476 278.9
percentiles/range 126.8–1459.6 173.3 - >1476 82.4 - >1476 215.2 - >1476.0 1475 - >1476 147.5–576.6
ISO 3166 codes for the representation of countries of origin of serum samples; median, 2.5th—97.5th percentiles for wild-born great apes and humans
and range for captive born great apes and rhesus macaques; ranges for age, colloid osmotic pressure and for lipoprotein (a) in wild-born Central African
chimpanzees; “n. a.” = not analyzed; “bs” indicates a bonobo-specific biomarker and “hs” indicates human-specific biomarkers, green border denotes
bonobo-specific biomarkers; blue border denotes human-specific biomarkers; “<”/”>” indicate below lower limit/above upper limit of quantification; percent
of individuals below lower level of quantification (LLOQ) for bilirubin: wild- and captive-born bonobos: 82 and 55 percent, Central African chimpanzees: 75
percent; wild- and captive-born West African chimpanzees: 82 and 63 percent; rhesus macaques 100 percent; humans: 12.3 percent; see “Methodology”
for details on the origin of the samples. The underlying data can be downloaded as S4 Dataset.
doi:10.1371/journal.pone.0134548.t001
Lineage-Specific Changes in Biomarkers in Great Apes and Humans
PLOS ONE | DOI:10.1371/journal.pone.0134548 August 6, 2015 6 / 21
proteins between humans and both West African chimpanzees and rhesus macaques is pro-vided in S1 Dataset. A protein search was done using the HomoloGene function on NCBI’swebpage to obtain homologous protein sequences of human, West African chimpanzee andrhesus macaque proteins. When a homologous protein was not available for any of the non-human primate species using the HomoloGene function, a protein blast with the human pro-tein was performed using UniProt to find the homologous protein in the remaining species.
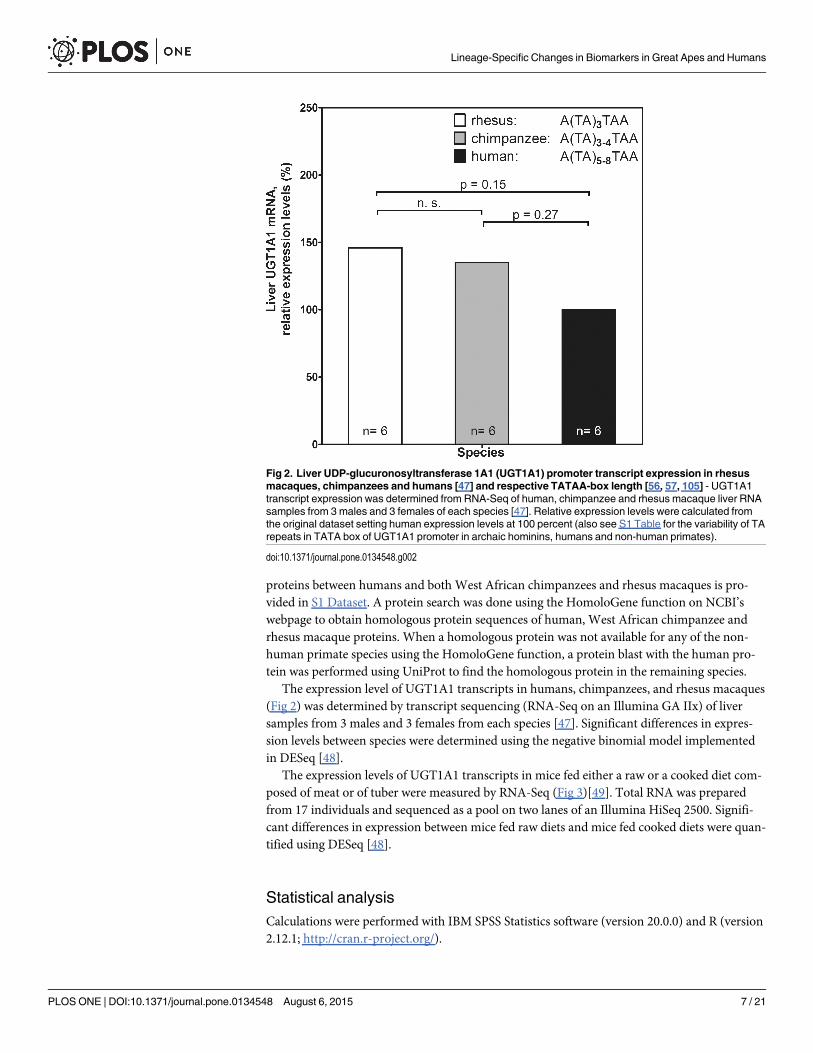
The expression level of UGT1A1 transcripts in humans, chimpanzees, and rhesus macaques(Fig 2) was determined by transcript sequencing (RNA-Seq on an Illumina GA IIx) of liversamples from 3 males and 3 females from each species [47]. Significant differences in expres-sion levels between species were determined using the negative binomial model implementedin DESeq [48].
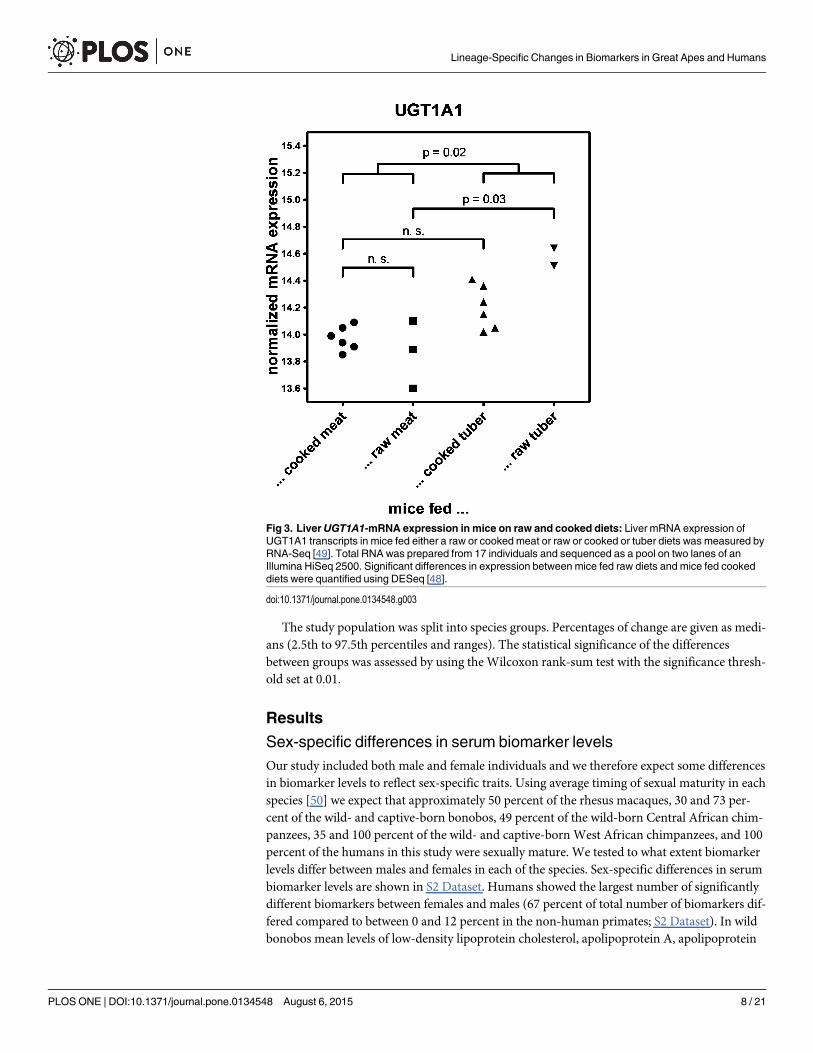
The expression levels of UGT1A1 transcripts in mice fed either a raw or a cooked diet com-posed of meat or of tuber were measured by RNA-Seq (Fig 3)[49]. Total RNA was preparedfrom 17 individuals and sequenced as a pool on two lanes of an Illumina HiSeq 2500. Signifi-cant differences in expression between mice fed raw diets and mice fed cooked diets were quan-tified using DESeq [48].
Statistical analysisCalculations were performed with IBM SPSS Statistics software (version 20.0.0) and R (version2.12.1; http://cran.r-project.org/).
Fig 2. Liver UDP-glucuronosyltransferase 1A1 (UGT1A1) promoter transcript expression in rhesusmacaques, chimpanzees and humans [47] and respective TATAA-box length [56, 57, 105] - UGT1A1transcript expression was determined from RNA-Seq of human, chimpanzee and rhesus macaque liver RNAsamples from 3 males and 3 females of each species [47]. Relative expression levels were calculated fromthe original dataset setting human expression levels at 100 percent (also see S1 Table for the variability of TArepeats in TATA box of UGT1A1 promoter in archaic hominins, humans and non-human primates).
doi:10.1371/journal.pone.0134548.g002
Lineage-Specific Changes in Biomarkers in Great Apes and Humans
PLOS ONE | DOI:10.1371/journal.pone.0134548 August 6, 2015 7 / 21
The study population was split into species groups. Percentages of change are given as medi-ans (2.5th to 97.5th percentiles and ranges). The statistical significance of the differencesbetween groups was assessed by using theWilcoxon rank-sum test with the significance thresh-old set at 0.01.
Results
Sex-specific differences in serum biomarker levelsOur study included both male and female individuals and we therefore expect some differencesin biomarker levels to reflect sex-specific traits. Using average timing of sexual maturity in eachspecies [50] we expect that approximately 50 percent of the rhesus macaques, 30 and 73 per-cent of the wild- and captive-born bonobos, 49 percent of the wild-born Central African chim-panzees, 35 and 100 percent of the wild- and captive-born West African chimpanzees, and 100percent of the humans in this study were sexually mature. We tested to what extent biomarkerlevels differ between males and females in each of the species. Sex-specific differences in serumbiomarker levels are shown in S2 Dataset. Humans showed the largest number of significantlydifferent biomarkers between females and males (67 percent of total number of biomarkers dif-fered compared to between 0 and 12 percent in the non-human primates; S2 Dataset). In wildbonobos mean levels of low-density lipoprotein cholesterol, apolipoprotein A, apolipoprotein
Fig 3. LiverUGT1A1-mRNA expression in mice on raw and cooked diets: Liver mRNA expression ofUGT1A1 transcripts in mice fed either a raw or cooked meat or raw or cooked or tuber diets was measured byRNA-Seq [49]. Total RNA was prepared from 17 individuals and sequenced as a pool on two lanes of anIllumina HiSeq 2500. Significant differences in expression between mice fed raw diets and mice fed cookeddiets were quantified using DESeq [48].
doi:10.1371/journal.pone.0134548.g003
Lineage-Specific Changes in Biomarkers in Great Apes and Humans
PLOS ONE | DOI:10.1371/journal.pone.0134548 August 6, 2015 8 / 21
B and total cholesterol were significantly higher in females than in males. However, this differ-ence was not seen in captive-born bonobos where levels of these same biomarkers were not sig-nificantly different between males and females (S2 Dataset).
Wild-born male Central African chimpanzees showed a significantly higher catalytic activ-ity of creatine kinase, and higher levels of uric acid and ferritin than females. Cholinesterasewas found to be significantly increased in wild-born male West African chimpanzees, whilelactate dehydrogenase was significantly higher in captive-born West African male chimpanzees(S2 Dataset). In rhesus macaques no significant differences between the sexes were found forany of the biomarkers. In humans, all biomarkers with the exception of total cholesterol, col-loid-osmotic pressure, folic acid, glucose, lactate dehydrogenase, lipoprotein (a), Thyroid-stim-ulating hormone, troponin T and vitamin B12 showed significant differences between the sexes(S2 Dataset).
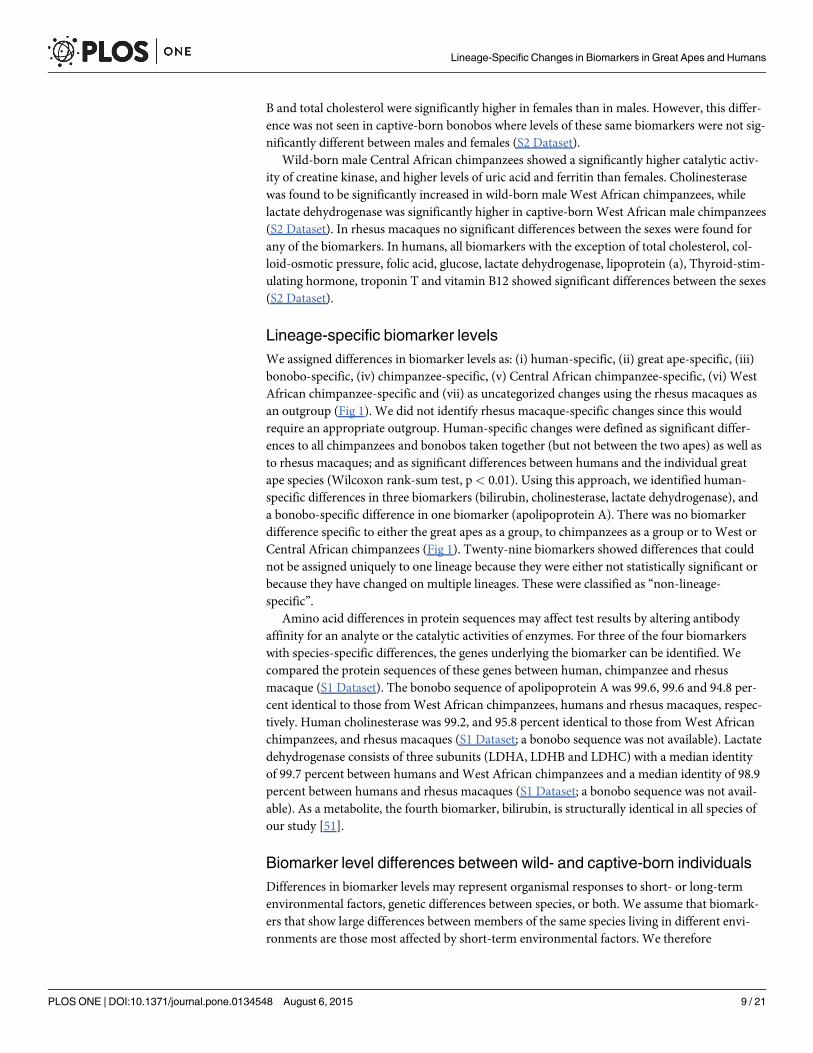
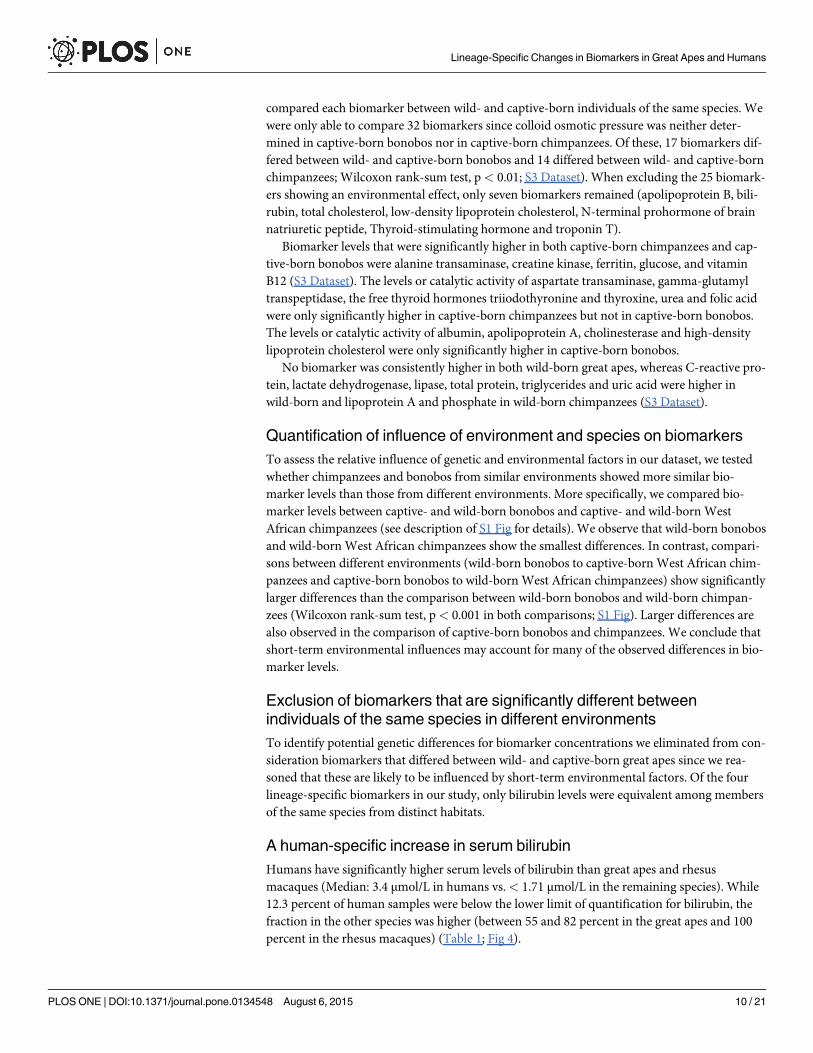
Lineage-specific biomarker levelsWe assigned differences in biomarker levels as: (i) human-specific, (ii) great ape-specific, (iii)bonobo-specific, (iv) chimpanzee-specific, (v) Central African chimpanzee-specific, (vi) WestAfrican chimpanzee-specific and (vii) as uncategorized changes using the rhesus macaques asan outgroup (Fig 1). We did not identify rhesus macaque-specific changes since this wouldrequire an appropriate outgroup. Human-specific changes were defined as significant differ-ences to all chimpanzees and bonobos taken together (but not between the two apes) as well asto rhesus macaques; and as significant differences between humans and the individual greatape species (Wilcoxon rank-sum test, p< 0.01). Using this approach, we identified human-specific differences in three biomarkers (bilirubin, cholinesterase, lactate dehydrogenase), anda bonobo-specific difference in one biomarker (apolipoprotein A). There was no biomarkerdifference specific to either the great apes as a group, to chimpanzees as a group or to West orCentral African chimpanzees (Fig 1). Twenty-nine biomarkers showed differences that couldnot be assigned uniquely to one lineage because they were either not statistically significant orbecause they have changed on multiple lineages. These were classified as “non-lineage-specific”.
Amino acid differences in protein sequences may affect test results by altering antibodyaffinity for an analyte or the catalytic activities of enzymes. For three of the four biomarkerswith species-specific differences, the genes underlying the biomarker can be identified. Wecompared the protein sequences of these genes between human, chimpanzee and rhesusmacaque (S1 Dataset). The bonobo sequence of apolipoprotein A was 99.6, 99.6 and 94.8 per-cent identical to those fromWest African chimpanzees, humans and rhesus macaques, respec-tively. Human cholinesterase was 99.2, and 95.8 percent identical to those fromWest Africanchimpanzees, and rhesus macaques (S1 Dataset; a bonobo sequence was not available). Lactatedehydrogenase consists of three subunits (LDHA, LDHB and LDHC) with a median identityof 99.7 percent between humans and West African chimpanzees and a median identity of 98.9percent between humans and rhesus macaques (S1 Dataset; a bonobo sequence was not avail-able). As a metabolite, the fourth biomarker, bilirubin, is structurally identical in all species ofour study [51].
Biomarker level differences between wild- and captive-born individualsDifferences in biomarker levels may represent organismal responses to short- or long-termenvironmental factors, genetic differences between species, or both. We assume that biomark-ers that show large differences between members of the same species living in different envi-ronments are those most affected by short-term environmental factors. We therefore
Lineage-Specific Changes in Biomarkers in Great Apes and Humans
PLOS ONE | DOI:10.1371/journal.pone.0134548 August 6, 2015 9 / 21
compared each biomarker between wild- and captive-born individuals of the same species. Wewere only able to compare 32 biomarkers since colloid osmotic pressure was neither deter-mined in captive-born bonobos nor in captive-born chimpanzees. Of these, 17 biomarkers dif-fered between wild- and captive-born bonobos and 14 differed between wild- and captive-bornchimpanzees; Wilcoxon rank-sum test, p< 0.01; S3 Dataset). When excluding the 25 biomark-ers showing an environmental effect, only seven biomarkers remained (apolipoprotein B, bili-rubin, total cholesterol, low-density lipoprotein cholesterol, N-terminal prohormone of brainnatriuretic peptide, Thyroid-stimulating hormone and troponin T).
Biomarker levels that were significantly higher in both captive-born chimpanzees and cap-tive-born bonobos were alanine transaminase, creatine kinase, ferritin, glucose, and vitaminB12 (S3 Dataset). The levels or catalytic activity of aspartate transaminase, gamma-glutamyltranspeptidase, the free thyroid hormones triiodothyronine and thyroxine, urea and folic acidwere only significantly higher in captive-born chimpanzees but not in captive-born bonobos.The levels or catalytic activity of albumin, apolipoprotein A, cholinesterase and high-densitylipoprotein cholesterol were only significantly higher in captive-born bonobos.
No biomarker was consistently higher in both wild-born great apes, whereas C-reactive pro-tein, lactate dehydrogenase, lipase, total protein, triglycerides and uric acid were higher inwild-born and lipoprotein A and phosphate in wild-born chimpanzees (S3 Dataset).
Quantification of influence of environment and species on biomarkersTo assess the relative influence of genetic and environmental factors in our dataset, we testedwhether chimpanzees and bonobos from similar environments showed more similar bio-marker levels than those from different environments. More specifically, we compared bio-marker levels between captive- and wild-born bonobos and captive- and wild-born WestAfrican chimpanzees (see description of S1 Fig for details). We observe that wild-born bonobosand wild-born West African chimpanzees show the smallest differences. In contrast, compari-sons between different environments (wild-born bonobos to captive-born West African chim-panzees and captive-born bonobos to wild-born West African chimpanzees) show significantlylarger differences than the comparison between wild-born bonobos and wild-born chimpan-zees (Wilcoxon rank-sum test, p< 0.001 in both comparisons; S1 Fig). Larger differences arealso observed in the comparison of captive-born bonobos and chimpanzees. We conclude thatshort-term environmental influences may account for many of the observed differences in bio-marker levels.
Exclusion of biomarkers that are significantly different betweenindividuals of the same species in different environmentsTo identify potential genetic differences for biomarker concentrations we eliminated from con-sideration biomarkers that differed between wild- and captive-born great apes since we rea-soned that these are likely to be influenced by short-term environmental factors. Of the fourlineage-specific biomarkers in our study, only bilirubin levels were equivalent among membersof the same species from distinct habitats.
A human-specific increase in serum bilirubinHumans have significantly higher serum levels of bilirubin than great apes and rhesusmacaques (Median: 3.4 μmol/L in humans vs.< 1.71 μmol/L in the remaining species). While12.3 percent of human samples were below the lower limit of quantification for bilirubin, thefraction in the other species was higher (between 55 and 82 percent in the great apes and 100percent in the rhesus macaques) (Table 1; Fig 4).
Lineage-Specific Changes in Biomarkers in Great Apes and Humans
PLOS ONE | DOI:10.1371/journal.pone.0134548 August 6, 2015 10 / 21
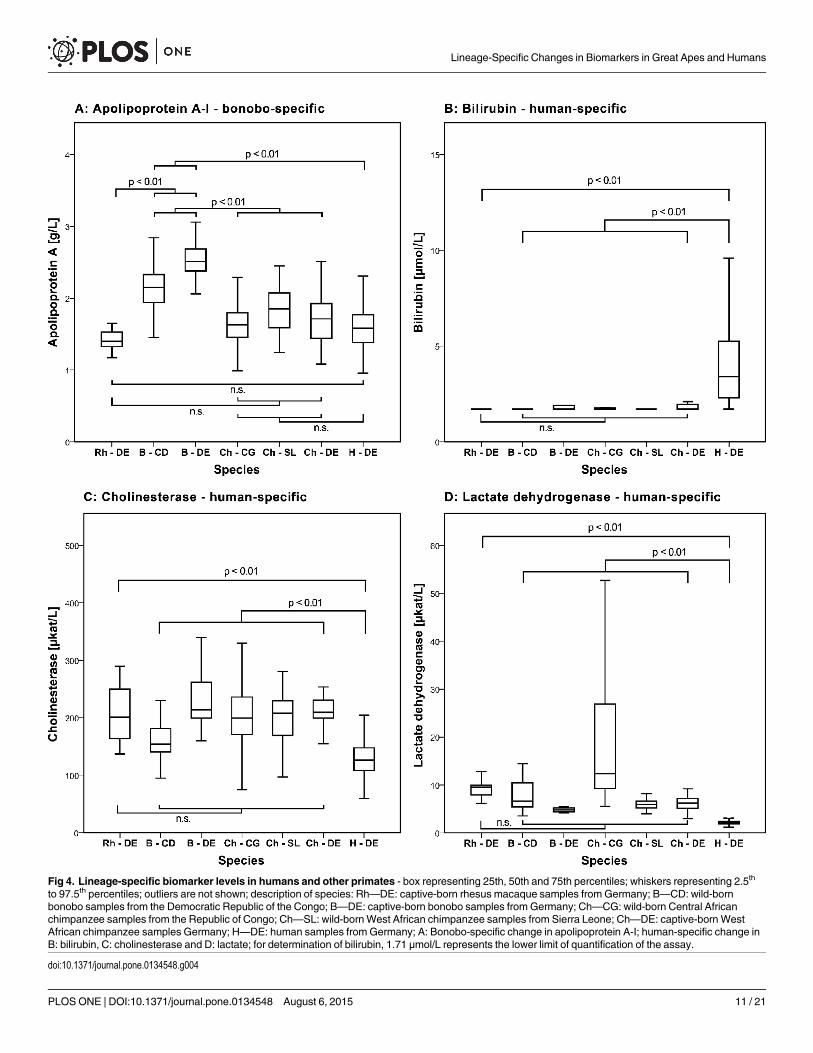
Fig 4. Lineage-specific biomarker levels in humans and other primates - box representing 25th, 50th and 75th percentiles; whiskers representing 2.5th
to 97.5th percentiles; outliers are not shown; description of species: Rh—DE: captive-born rhesus macaque samples from Germany; B—CD: wild-bornbonobo samples from the Democratic Republic of the Congo; B—DE: captive-born bonobo samples from Germany; Ch—CG: wild-born Central Africanchimpanzee samples from the Republic of Congo; Ch—SL: wild-bornWest African chimpanzee samples from Sierra Leone; Ch—DE: captive-born WestAfrican chimpanzee samples Germany; H—DE: human samples from Germany; A: Bonobo-specific change in apolipoprotein A-I; human-specific change inB: bilirubin, C: cholinesterase and D: lactate; for determination of bilirubin, 1.71 μmol/L represents the lower limit of quantification of the assay.
doi:10.1371/journal.pone.0134548.g004
Lineage-Specific Changes in Biomarkers in Great Apes and Humans
PLOS ONE | DOI:10.1371/journal.pone.0134548 August 6, 2015 11 / 21
Genome-wide association studies have shown that the major gene associated with serumbilirubin levels is uridine diphosphoglucuronosyltransferase 1 (UGT1A1) [52–54]. The expres-sion of UGT1A1 largely depends on a microsatellite in the promoter of the UGT1A1 gene, withan inverse relationship between the number of TA repeats and the activity of the gene [55].The genome sequences show differences in TA repeat length with 3 repeats in rhesus macaques(reference assembly rheMac2), 3 to 4 repeats in chimpanzees (chimpanzee resequencing datafrom [56]) and 5–8 repeats in humans (13 human genomes from [57]; Fig 2, S1 Table). Fur-thermore, we found that the transcript expression levels of UGT1A1 in rhesus macaque andchimpanzee livers were 46 and 35 percent higher than in humans (p = 0.15 and 0.27, respec-tively; Fig 2, S2 Table). The microsatellite length in two Neandertal individuals [57] and oneDenisovan [58] are similar to present-day humans outside of Africa in having a TA repeat oflength 6 in the promoter of UGT1A1 (S2 Table).
By protein sequence alignment of UGT1A1, we found one human-specific amino acid sub-stitution F518L (S2 Fig). The substitution lies between a transmembrane domain and di-lysinemotifs in the cytosolic tail that confer retention of UGT1A-proteins to the endoplasmic reticu-lum (ER) and alter the half-life of UGT1A1 protein [59].
UGT1A1 is the main isozyme responsible for the glucuronidation of bilirubin. However, itis also involved in the glucuronidation that aides excretion of phytoalexins which are toxicplant-derived compounds [60]. To assess the effect of a plant- or animal-derived diet onUGT1A1-expression, we determined UGT1A1 expression in liver samples of mice fed tuber ormeat diets that were either cooked or raw (Carmody et al. in preparation). Mice on a raw tuberdiet showed a tendency of higher UGT1A1 expression than mice on either meat or cookedtuber diets (Fig 3).
DiscussionThe dataset presented here is, to our knowledge, the largest screen of biomarkers in wild- andcaptive-born great apes. While this dataset can be used for a variety of analyses, we have chosento concentrate on the identification of lineage-specific changes in biomarker levels.
Large effort has been made to minimize preanalytic influences. All samples, including thosefrom Africa, were frozen immediately after serum extraction. Studies have shown that long-term storage (up to 10 years) does not affect the results for any of the biomarkers we havetested [61]. All analyses were carried out using the same automated analyser.
We note that all great apes had to be sedated before sampling. Ketamine anaesthesia hasbeen shown to influence blood levels of some of the biomarkers we measured (alanine andaspartate aminotransferase and creatine kinase [62, 63], phosphate [64]) whereas bilirubin isnot changed [65, 66]. However, the differences we observe between captive-born and wild-born apes indicate that anaesthesia is not a major factor determining differences in blood-chemistry between groups.
All animals included in this study were deemed healthy by a trained veterinarian. However,we cannot exclude that subclinical infection could explain high values of C-reactive protein inthe bonobos from Lola Ya Bonobo.
Our laboratory analyses were performed using established automated assays optimized foruse in human clinical medicine. We are aware that this may affect results obtained in other spe-cies [10, 11, 67]. The sequence identity of proteins measured in our study lies between 95.1 and100 percent compared to humans for West African chimpanzees and between 87.2 and 100percent for rhesus macaques (S1 Dataset). Results obtained for some antibody-based assays(e.g. immunoassays) may therefore be species-dependent. Furthermore, serum catalytic activity
Lineage-Specific Changes in Biomarkers in Great Apes and Humans
PLOS ONE | DOI:10.1371/journal.pone.0134548 August 6, 2015 12 / 21
as the product of enzymatic concentration and activity of each enzyme may be influenced bydifferences in protein sequence and/or structure.
Our study included serum samples from both male and female individuals. As sex-specificbiomarker traits may affect overall biomarker level distributions, we analyzed our data for gen-der-specific differences. The number of significantly different biomarkers between sexes wasgreatest in humans compared to all other species (S2 Dataset). The reason for this finding isnot clear. The finding is not consistent with the extent of sexual dimorphism [68]. Possibleexplanations include differences in proportions of male and female individuals in our studygroups (female excess among rhesus macaques and captive-born chimpanzees, Table 1) andthe proportion of mature individuals (highest in our human study group).
We find evidence for only few species-specific biomarker differences. Lactate dehydroge-nase, cholinesterase and bilirubin showed human-specific differences and apolipoprotein Ashowed a bonobo-specific difference.
We found many differences in biomarker levels between members of the same species bornand living under different environments. The biomarker levels that showed significant differ-ences between captive- and wild-born individuals include those that are known to be influ-enced by dietary factors (ferritin, folic acid, glucose, the free thyroid hormonestriiodothyronine and thyroxine, vitamin B12) and enzymes whose release into blood is depen-dent upon muscle mass or activity (aspartate transaminase, creatine kinase; S3 Dataset andTable 1) [26]. Except for bilirubin the comparison between captive-born and wild-born apesindicates that environmental differences may explain these lineage-specific differences.
In our study levels of apolipoprotein A-I were specifically higher in bonobos. In agreementwith this result, levels of apolipoprotein A-I and high-density lipoprotein cholesterol have beenfound to be similar in captive-born West African chimpanzees and humans [10]. However, astudy comparing lipid status in free-ranging and captive macaque species and humans foundthat levels varied more between the same species in different environments than between thedifferent macaque species [67]. Further, apolipoprotein A-I was found to be elevated in femalewild-born bonobos, female captive-born chimpanzees, and in female humans whereas this pat-tern was not seen in the remaining species. High-density lipoprotein cholesterol levels, whichare highly correlated with apolipoprotein A-I, are known to be influenced by both diet andexercise in both humans and macaques [19, 26, 69–73]. We therefore cannot exclude that thelineage-specific change in bonobos is due to some environmental factor.
Lactate dehydrogenase showed a human-specific decrease compared to the apes and rhesusmacaques. However, we detected significant variation in serum LDH activity between wild-and captive-born great apes, suggesting that LDH activity is likely to be environmentally influ-enced. As a cytoplasmic enzyme and constituent of all tissues, lactate dehydrogenase is liber-ated into the blood in response to tissue damage, which may also include muscle activity andalarm reactions before blood taking [26]. It is therefore conceivable that the non-human pri-mates in our study group have higher lactate dehydrogenase activity due to a difference inphysical activity.
Serum cholinesterase activity showed a human-specific decrease. The exact function ofserum cholinesterase is unclear [74]. It is abundant in plasma, liver, pancreas, spleen and thewhite matter of the brain and is commonly used in clinical medicine to quantify liver syntheticcapacity [26]. In humans genetic variants with catalytic activities that differ by a factor of tenexist [26]. Cholinesterase activity is furthermore known to be associated with weight, bodymass index (BMI) and muscle mass [75]. Possible explanations for the observed differencesmay include a combination of the above mentioned factors.
The protein sequences of apolipoprotein A-I, serum cholinesterase and lactate dehydroge-nase differ between species (S1 Dataset). It is not known whether these differences change their
Lineage-Specific Changes in Biomarkers in Great Apes and Humans
PLOS ONE | DOI:10.1371/journal.pone.0134548 August 6, 2015 13 / 21
interaction with binding antibodies or their catalytic activity and therefore alter the measure-ment of these biomarkers with the standard assays applied here. For example, in our study apo-lipoprotein A-I was determined with an immunoturbidimetric assay that may be sensitive toprotein differences. The human and chimpanzee apolipoprotein A-I protein sequence is identi-cal while bonobos differ from both by one amino acid. We can therefore not distinguishwhether the lineage-specific changes in apolipoprotein A-I in bonobos, and serum cholinester-ase and lactate dehydrogenase in humans are due to differences in their protein sequence (S1Dataset).
Bilirubin levels were consistently higher in humans than in West and Central African chim-panzees and bonobos (both captive and wild-born), as well as in rhesus macaques. This is inagreement with a small study that showed that bilirubin levels are twice as high in humans asin captive chimpanzees [10].
Serum concentration of bilirubin is a function of extrahepatic formation and intrahepaticexcretion of bilirubin. The magnitude of bilirubin formation depends mainly on erythrocytehalf-life [76, 77]. Since the erythrocytes of chimpanzees and rhesus macaques have a half-lifewhich is about 50 percent shorter than that of human erythrocytes, bilirubin production shouldbe higher in the great apes and rhesus macaques [78, 79]. However, we observe serum bilirubinlevels that are lower in all the non-human primates, suggesting that bilirubin depletion and notbilirubin formation may cause the difference in levels.
To explore whether genetic changes might explain this difference we focused on the geneencoding UDP-glycosyltransferase 1 (UGT1A1) which is the major enzyme involved in the glu-curonidation of bilirubin (99.5 percent of total turnover) and in the excretion of phytoalexinswhich are toxic plant-derived compounds [60, 80, 81]. Levels of bilirubin are highly heritableand association studies have shown that UGT1A1 is the main contributor to these levels [52,53]. The gene has not been found to vary in copy number [82]. However, Gilbert’s syndrome(GS, MIM�143500), an inherited form of mild hyperbilirubinemia, is typically caused by ahomozygous TA insertion in the TATAA element of the 5’ promoter region in Europeans (nor-mal A(TA)6TAA) (UGT1A1�28) [83]. Homozygotes for the A(TA)7TAA sequence have higherlevels of bilirubin whereas bilirubin levels of heterozygotes are between homozygotes and sub-jects carrying the wild type [83, 84].
While the promoter repeat length varies from 5 to 8 in humans, rhesus macaques and chim-panzees show a reduced repeat length of 3 and 3 to 4, respectively. Based on the shorter pro-moter repeat length we would predict that UGT1A1 expression is reduced in humanscompared with non-human primates. Indeed we find RNA expression to be 46 and 35 percenthigher in rhesus macaques and chimpanzees than in humans (Fig 3. And S2 Table). Notably,the UGT1A1 promoter in the Neandertal and Denisovan genomes (S1 Table) carries thesequence A(TA)6TAA, common in humans today. Since the Michaelis constant Km of UDP-glycosyltransferase (the substrate concentration at which the reaction rate is half of the maxi-mum rate) lies at bilirubin levels of 0.26 μmol/l [85], well below the median bilirubin of3.4 μmol/l in humans, lower expression of UGT1A1may well increase serum bilirubin levels.
Protein sequence alignment of UGT1A1 revealed one human-specific amino acid substitu-tion at position F518L (S2 Fig). Interestingly, this substitution is situated between di-lysinemotifs in the cytosolic tail and a transmembrane domain that confer retention of UGT1A-pro-teins to the endoplasmic reticulum (ER) [59]. This amino acid substitution between two ER-retention signals may alter the percentage of protein that stays in the ER and thus the turnoverof UGT1A1 independently of expression differences. Further work is necessary to elucidate ifand to what extent this protein difference and the promoter difference contribute to the alteredbilirubin concentrations in humans.
Lineage-Specific Changes in Biomarkers in Great Apes and Humans
PLOS ONE | DOI:10.1371/journal.pone.0134548 August 6, 2015 14 / 21
In the process of heme degradation, mammals reduce water-soluble biliverdin to the poten-tially toxic [86–91] bilirubin in an energy-dependant step [51]. Because bilirubin is poorly solu-ble in water, it is further conjugated with glucuronic acid by UGT1A1 and transported into thebile, both steps requiring additional energy. Whether this particular mode of heme catabolismserves further purposes remains elusive [92]. Both in vitro [51, 93] and in vivo [94, 95] anti-oxi-dative and neuroprotective [96] properties of bilirubin have been known for many years. Clini-cal studies have shown associations between elevated bilirubin levels and lower incidence ofcardiovascular disease [97], respiratory disease [98], cancer [99] and stroke [100]. However, itis not clear if this association is due to the inherently higher bilirubin levels or whether morebilirubin is degraded due to the disease [92].
Modern human populations derive more of their dietary energy from meat than the greatapes (Leonard, Snodgrass et al. 2007). Improved diet quality due to cooking and consumptionof animal protein and fat has been proposed as one among other factors allowing the increasedbrain size in humans [101, 102]. Our results indicate that expression of UGT1A1 is higher inmice fed a raw plant diet than in mice fed either a meat or cooked-plant diet (Fig 3), consistentwith the role UGT1A1 plays in the detoxification and excretion of plant toxins [60]. Wehypothesise that the consumption of cooked food in the last million years of hominin historymay either have reduced the selective constraint on sufficiently high levels of UGT1A1 expres-sion or even driven reduction in the levels of UGT1A1 expression. The higher level of bilirubinmay be a side-effect of the change in UGT1A1 expression, but may also have come under selec-tion on its own right due to the beneficial effects associated with higher levels of bilirubin. Thechange in bilirubin may thus constitute an example of the wide-ranging consequences of cook-ing in the evolution of humans.
Supporting InformationS1 Dataset. Alignment scores. Alignment scores were derived from the NCBI and UniProtwebsites.(XLSX)
S2 Dataset. Influence of sex on biomarker measurements.(XLSX)
S3 Dataset. Influence of environment on biomarker measurements using wild- vs. captive-born great apes.(XLSX)
S4 Dataset. Supplementary dataset to lineage-specific changes in biomarkers in great apesand humans.(XLSX)
S1 Fig. Divergence of biomarker levels in various great ape species.Distributions of p-valuesin all pairwise comparisons of 8 individuals to 8 individuals between two groups. Brackets ontop and bottom show the results of a two-sided Wilcoxon rank test between distributions thatare informative for environmental effect (zoo vs. wild compared to either zoo vs. zoo or wildvs. wild).(DOCX)
S2 Fig. Alignment of UDP-glucuronosyltransferase (UGT) 1A1 protein in humans andnon-human primates. Red circle indicating human-specific amino acid substitution (F518L);sequences derived from [56, 106–108]; descriptions of protein folding and functional domains
Lineage-Specific Changes in Biomarkers in Great Apes and Humans
PLOS ONE | DOI:10.1371/journal.pone.0134548 August 6, 2015 15 / 21
[59, 109–111].(DOCX)
S1 Table. Variability of TA repeats in TATA box of UDP-glucuronosyltransferase (UGT)1A1 promoter in archaic hominins, humans and non-human primates. Sequences derivedfrom [56–58, 82, 84, 105, 112, 113].(DOCX)
S2 Table. Expression data of genes analyzed in this study. Data derived from [47, 114, 115].(DOCX)
AcknowledgmentsWe thank W. Enard for helpful discussions; A. Bernhard and the staff of Zoo Leipzig (Leipzig,Germany), the German Primate Center (Göttingen, Germany), the Tacugama ChimpanzeeSanctuary (Freetown, Sierra Leone), Ngamba Island Chimpanzee Sanctuary (Uganda), theTchimpounga Chimpanzee Rehabilitation Center (Pointe-Noire, Republic of Congo) and theLola Ya Bonobo sanctuary (Kinshasa, Democratic Republic of Congo) for providing samplesand Konrad Schmidt at the Department of Medical Genetics, Molecular and Clinical Pharma-cology, Divisions of Genetic Epidemiology and Human Genetics of the Innsbruck MedicalUniversity (Innsbruck/Austria) for the analysis of lipoprotein(a).
Author ContributionsConceived and designed the experiments: CR JT SP KP JK. Performed the experiments: CRMDMS CH UC JT SP KP JK. Analyzed the data: CR MDMS CH UC JT SP KP JK. Contrib-uted reagents/materials/analysis tools: MH AFMB CA RA LM. Wrote the paper: CR SP KP JK.
References1. Varki A, Altheide TK. Comparing the human and chimpanzee genomes: searching for needles in a
haystack. Genome research. 2005; 15(12):1746–58. Epub 2005/12/13. doi: 10.1101/gr.3737405PMID: 16339373.
2. Rilling JK. Neuroscientific approaches and applications within anthropology. American journal ofphysical anthropology. 2008;Suppl 47:2–32. Epub 2008/11/13. doi: 10.1002/ajpa.20947 PMID:19003891.
3. Hare B, Wobber V, WranghamR. The self-domestication hypothesis: evolution of bonobo psychologyis due to selection against aggression. Animal Behaviour. 2012; 83(3):573–85.
4. Enard W, Gehre S, Hammerschmidt K, Hölter SM, Blass T, Somel M, et al. A humanized version ofFoxp2 affects cortico-basal ganglia circuits in mice. Cell. 2009; 137(5):961–71. doi: 10.1016/j.cell.2009.03.041 PMID: 19490899
5. O'Bleness M, Searles VB, Varki A, Gagneux P, Sikela JM. Evolution of genetic and genomic featuresunique to the human lineage. Nature Reviews Genetics. 2012; 13(12):853–66. doi: 10.1038/nrg3336PMID: 23154808
6. Konopka G, Friedrich T, Davis-Turak J, Winden K, OldhamMC, Gao F, et al. Human-specific tran-scriptional networks in the brain. Neuron. 2012; 75(4):601–17. doi: 10.1016/j.neuron.2012.05.034PMID: 22920253
7. Varki A. Uniquely human evolution of sialic acid genetics and biology. Proceedings of the NationalAcademy of Sciences. 2010; 107(Supplement 2):8939–46.
8. Enard W, Pääbo S. Comparative primate genomics. Annu Rev Genomics HumGenet. 2004; 5:351–78. PMID: 15485353
9. Burtis CA, Ashwood ER, Bruns DE. Tietz Textbook of Clinical Chemistry and Molecular Diagnostics:Elsevier Health Sciences; 2012.
10. Videan EN, Heward CB, Chowdhury K, Plummer J, Su Y, Cutler RG. Comparison of biomarkers ofoxidative stress and cardiovascular disease in humans and chimpanzees (Pan troglodytes).
Lineage-Specific Changes in Biomarkers in Great Apes and Humans
PLOS ONE | DOI:10.1371/journal.pone.0134548 August 6, 2015 16 / 21
Comparative medicine. 2009; 59(3):287–96. Epub 2009/07/22. PMID: 19619420; PubMed CentralPMCID: PMC2733297.
11. Gagneux P, Amess B, Diaz S, Moore S, Patel T, DillmannW, et al. Proteomic comparison of humanand great ape blood plasma reveals conserved glycosylation and differences in thyroid hormonemetabolism. American journal of physical anthropology. 2001; 115(2):99–109. Epub 2001/06/01. doi:10.1002/ajpa.1061 PMID: 11385598.
12. Smucny DA, Allison DB, Ingram DK, Roth GS, Kemnitz JW, Kohama SG, et al. Changes in bloodchemistry and hematology variables during aging in captive rhesus macaques (Macaca mulatta).Journal of medical primatology. 2001; 30(3):161–73. Epub 2001/08/23. PMID: 11515672.
13. Herndon JG, Tigges J. Hematologic and blood biochemical variables of captive chimpanzees: cross-sectional and longitudinal analyses. Comparative medicine. 2001; 51(1):60–9. Epub 2002/04/03.PMID: 11926304.
14. McClure HM, Keeling ME, Guilloud NB. Hematologic and blood chemistry data for the gorilla (Gorillagorilla). Folia primatologica; international journal of primatology. 1972; 18(3):300–16. Epub 1972/01/01. PMID: 4650701.
15. Stone G, Johnson B, Druilhet R, Garza P, Gibbs C Jr. Immunophenotyping of peripheral blood, rangesof serum chemistries and clinical hematology values of healthy chimpanzees (Pan troglodytes). Jour-nal of medical primatology. 2000; 29(5):324–9. PMID: 11168822
16. Kratzsch J, Fiedler GM, Leichtle A, Brugel M, Buchbinder S, Otto L, et al. New reference intervals forthyrotropin and thyroid hormones based on National Academy of Clinical Biochemistry criteria andregular ultrasonography of the thyroid. Clinical chemistry. 2005; 51(8):1480–6. Epub 2005/06/18. doi:10.1373/clinchem.2004.047399 PMID: 15961550.
17. Wiebe D, Bernert J. Influence of incomplete cholesteryl ester hydrolysis on enzymic measurements ofcholesterol. Clinical chemistry. 1984; 30(3):352–6. PMID: 6697478
18. Siedel J, Hägele E, Ziegenhorn J, Wahlefeld AW. Reagent for the enzymatic determination of serumtotal cholesterol with improved lipolytic efficiency. Clinical chemistry. 1983; 29(6):1075–80. PMID:6851096
19. Sugiuchi H, Uji Y, Okabe H, Irie T, Uekama K, Kayahara N, et al. Direct measurement of high-densitylipoprotein cholesterol in serum with polyethylene glycol-modified enzymes and sulfated alpha-cyclo-dextrin. Clinical chemistry. 1995; 41(5):717–23. PMID: 7729051
20. Matsuzaki Y, Kawaguchi E, Morita Y, Mashige F, Ohisa S, Nakahara K. Evaluation of two kinds ofreagents for direct determination of HDL-cholesterol. J Anal Bio-Sc. 1996; 19:419–27.
21. Armstrong V, Seidel D. Evaluation of a commercial kit for the determination of LDL cholesterol inserum based on precipitation of LDL with dextran sulfate. Ärztl Lab. 1985; 31:325–30.
22. Rifai N, Iannotti E, DeAngelis K, Law T. Analytical and clinical performance of a homogeneous enzy-matic LDL-cholesterol assay compared with the ultracentrifugation-dextran sulfate-Mg2+ method.Clinical chemistry. 1998; 44(6):1242–50. PMID: 9625048
23. Fossati P, Prencipe L. Serum triglycerides determined colorimetrically with an enzyme that produceshydrogen peroxide. Clinical chemistry. 1982; 28(10):2077–80. PMID: 6812986
24. Doumas BT, WatsonWA, Biggs HG. Albumin standards and the measurement of serum albumin withbromcresol green. Clinica chimica acta. 1997; 258(1):21–30.
25. Weichselbaum TE. An accurate and rapid method for the determination of proteins in small amountsof blood serum and plasma. American journal of clinical pathology. 1946; 10:40. PMID: 21027099
26. Thomas L. Labor und Diagnose: Indikation und Bewertung von Laborbefunden für die medizinischeDiagnostik, 7. Auflage; 2008.
27. Talke H, Schubert G. Enzymatic urea determination in the blood and serum in the Warburg opticaltest. KlinischeWochenschrift. 1965; 43:174. PMID: 14258517
28. Town M, Gehm S, Hammer B, Ziegenhorn J, editors. A sensitive colorimetric method for the enzy-matic determination of uric-acid. Journal of Clinical Chemistry and Clinical Biochemistry; 1985: Walterde Gruyter & COGenthiner Strasse 13, D-10785 Berlin, Germany.
29. Wahlefeld AW, Herz G., Bernt E. Modification of the Malloy-Evelyn method for a simple, reliable deter-mination of total bilirubin in serum. Scand J Clin Lab Invest. 1972; 29(Supplement 126, Abstract11.12.).
30. Schmidt F. Enzymatic determination of glucose in biological samples. Klin Wochenschr. 1961;39:1244. PMID: 14498709
31. Henry RJ, Cannon DC, Winkelman JW. Clinical chemistry: principles and technics: bio-science labo-ratories: Harper & Row Publishers; 1974.
Lineage-Specific Changes in Biomarkers in Great Apes and Humans
PLOS ONE | DOI:10.1371/journal.pone.0134548 August 6, 2015 17 / 21
32. Siedel J, Schiefer S, Rosseneu M, Bergeaud R, De Keersgieter W, Pautz B, et al. Immunoturbidi-metric method for routine determinations of apolipoproteins AI, A-II, and B in normo-and hyperlipemicsera compared with immunonephelometry. Clinical chemistry. 1988; 34(9):1821–5. PMID: 3138044
33. Price CP, Trull AK, Berry D, Gorman EG. Development and validation of a particle-enhanced turbidi-metric immunoassay for C-reactive protein. Journal of immunological methods. 1987; 99(2):205–11.PMID: 3584992
34. Eda S, Kaufmann J, RoosW, Pohl S. Development of a new microparticle‐enhanced turbidimetricassay for C‐reactive protein with superior features in analytical sensitivity and dynamic range. Journalof clinical laboratory analysis. 1998; 12(3):137–44. PMID: 9591699
35. Siekmeier R, März W, Scharnagl H, Nauck M, Mayer H, Wieland H, et al. Bestimmung von Lipoprotein(a): Vergleich eines neuen latexverstärkten immunoturbidimetrischen Assay mit einem immunoradio-metrischen Assay. LaboratoriumsMedizin/Journal of Laboratory Medicine. 1996; 20(5):294–300.
36. Bergmeyer H, Horder M, Rey J. Approved recommendation on IFCCmethods for the measurement ofcatalytic enzymes. Part 2: IFCCmethod for aspartate aminotransferase. J Clin Chem Clin Biochem.1986; 24:497–510. PMID: 3734712
37. Bergmeyer H, Horder M, Rej R. Approved Recommendation (1985) on IFCCmethods for the mea-surement of catalytic concentration of enzymes. 3. IFCCmethod for alanine aminotransferase (L-ala-nine-2-oxoglutarate aminotransferase, EC-2612). Journal of Clinical Chemistry and ClinicalBiochemistry. 1986; 24(7):481–95.
38. Schmidt E. Proposal of standard methods for the determination of enzyme catalytic concentrations inserum and plasma at 37°C; Cholinesterase, II. Eur J Clin Chem Clin Biochem. 1992; 30(4):247–56.PMID: 1525259
39. Schumann G, Klauke R. New IFCC reference procedures for the determination of catalytic activityconcentrations of five enzymes in serum: preliminary upper reference limits obtained in hospitalizedsubjects. Clinica chimica acta. 2003; 327(1):69–79.
40. Neumann U, Junius M, Batz H. New substrates for the optical determination of lipase. Eur Patent.1987;(207252).
41. Hoyle N. The application of electrochemiluminescence to immunoassay based analyte measurement.J Biol Chem. 1994; 9:289.
42. Egger M, Punzmann G, Mueller G, Pauselius-Fuchs U. Electrochemiluminescence biochemical bind-ing analysis. Google Patents; 2003.
43. Dieplinger H, Gruber G, Krasznai K, Reschauer S, Seidel C, Burns G, et al. Kringle 4 of human apoli-poprotein[a] shares a linear antigenic site with human catalase. Journal of lipid research. 1995; 36(4):813–22. Epub 1995/04/01. PMID: 7542309.
44. Kronenberg F, Kuen E, Ritz E, Junker R, Konig P, Kraatz G, et al. Lipoprotein(a) serum concentrationsand apolipoprotein(a) phenotypes in mild and moderate renal failure. Journal of the American Societyof Nephrology: JASN. 2000; 11(1):105–15. Epub 2000/01/05. PMID: 10616846.
45. Ernst E, Matrai A. Messung des kolloidosmotischen Druckes. Labor Praxis. 1984; 20.
46. Abel M. Bestimmung und klinische Bedeutung des kolloidosmotischen Druckes bei pädiatrischenPatienten Determination and Clinical Significance of Colloid Osmotic Pressure in Ped. Patients. KlinPadiatr. 1985; 197(5):392–7. PMID: 4068600
47. Blekhman R, Marioni JC, Zumbo P, Stephens M, Gilad Y. Sex-specific and lineage-specific alternativesplicing in primates. Genome research. 2010; 20(2):180–9. doi: 10.1101/gr.099226.109 PMID:20009012
48. Anders S, Huber W. Differential expression analysis for sequence count data. Genome Biol. 2010; 11(10):R106. doi: 10.1186/gb-2010-11-10-r106 PMID: 20979621
49. Carmody R, Dannemann M, Briggs AW, Nickel B, Groopman EE, Wrangham RW, et al. Genetic evi-dence of human adaptation to a cooked diet. In preparation.
50. Schultz AH. The life of primates: Universe Books; 1969.
51. Stocker R, Yamamoto Y, McDonagh AF, Glazer AN, Ames BN. Bilirubin is an antioxidant of possiblephysiological importance. Science (New York, NY). 1987; 235(4792):1043. PMID: 3029864
52. Strassburg CP. Pharmacogenetics of Gilbert’s syndrome. Pharmacogenomics. 2008; 9(6):703–15.doi: 10.2217/14622416.9.6.703 PMID: 18518849
53. Lin J-P, Vitek L, Schwertner HA. Serum bilirubin and genes controlling bilirubin concentrations as bio-markers for cardiovascular disease. Clinical chemistry. 2010; 56(10):1535–43. doi: 10.1373/clinchem.2010.151043 PMID: 20693308
Lineage-Specific Changes in Biomarkers in Great Apes and Humans
PLOS ONE | DOI:10.1371/journal.pone.0134548 August 6, 2015 18 / 21
54. Johnson AD, Kavousi M, Smith AV, Chen M-H, Dehghan A, Aspelund T, et al. Genome-wide associa-tion meta-analysis for total serum bilirubin levels. Human molecular genetics. 2009; 18(14):2700–10.doi: 10.1093/hmg/ddp202 PMID: 19414484
55. Beutler E, Gelbart T, Demina A. Racial variability in the UDP-glucuronosyltransferase 1 (UGT1A1)promoter: A balanced polymorphism for regulation of bilirubin metabolism? Proceedings of theNational Academy of Sciences. 1998; 95(14):8170–4.
56. Prüfer K, Munch K, Hellmann I, Akagi K, Miller JR, Walenz B, et al. The bonobo genome comparedwith the chimpanzee and human genomes. Nature. 2012.
57. Prüfer K, Racimo F, Patterson N, Jay F, Sankararaman S, Sawyer S, et al. The complete genomesequence of a Neanderthal from the Altai Mountains. Nature. 2014; 505(7481):43–9. doi: 10.1038/nature12886 PMID: 24352235
58. Meyer M, Kircher M, Gansauge M-T, Li H, Racimo F, Mallick S, et al. A high-coverage genomesequence from an archaic Denisovan individual. Science. 2012; 338(6104):222–6. doi: 10.1126/science.1224344 PMID: 22936568
59. Barré L, Magdalou J, Netter P, Fournel‐Gigleux S, Ouzzine M. The stop transfer sequence of thehuman UDP‐glucuronosyltransferase 1A determines localization to the endoplasmic reticulum byboth static retention and retrieval mechanisms. FEBS Journal. 2005; 272(4):1063–71. PMID:15691338
60. Bock KW. Vertebrate UDP-glucuronosyltransferases: functional and evolutionary aspects. Biochemi-cal pharmacology. 2003; 66(5):691–6. PMID: 12948849
61. DiMagno EP, Corle D, O'Brien JF, Masnyk IJ, Go VLW, Aamodt R. Effect of Long-Term Freezer Stor-age, Thawing, and Refreezing on Selected Constituents of Serum. Mayo Clinic Proceedings. 1989;64(10):1226–34. PMID: 2593713
62. Lugo‐Roman L, Rico P, Sturdivant R, Burks R, Settle T. Effects of serial anesthesia using ketamine orketamine/medetomidine on hematology and serum biochemistry values in rhesus macaques (Macacamulatta). Journal of medical primatology. 2010; 39(1):41–9. doi: 10.1111/j.1600-0684.2009.00394.xPMID: 19878432
63. Kim CY, Lee HS, Han SC, Heo JD, KwonMS, Ha CS, et al. Hematological and serum biochemical val-ues in cynomolgus monkeys anesthetized with ketamine hydrochloride. Journal of medical primatol-ogy. 2005; 34(2):96–100. PMID: 15860116
64. Rovirosa‐Hernández M, García‐Orduña F, Caba M, Canales‐Espinosa D, Hermida‐Lagunes J, Tor-res‐Pelayo V. Blood parameters are little affected by time of sampling after the application of ketaminein black howler monkeys (Alouatta pigra). Journal of medical primatology. 2011; 40(5):294–9. doi: 10.1111/j.1600-0684.2011.00474.x PMID: 21443563
65. Gvozdenović LV, PopovićM, Jakovljević V, Lukić V. Effect of fentanyl, ketamine and thalamonal onsome biochemical parameters in ethanol-treated and untreated dogs. Human & experimental toxicol-ogy. 1993; 12(4):279–83.
66. Johnstone RE, Kennell E, BrummundW, Shaw L, Ebersole R. Effect of halothane anesthesia on mus-cle, liver, thyroid, and adrenal-function tests in man. Clinical chemistry. 1976; 22(2):217–20. PMID:2391
67. Takenaka A, Matsumoto Y, Nagaya A, Watanabe K, Goto S, Suryobroto B, et al. Plasma cholesterollevels in free-ranging macaques compared with captive macaques and humans. Primates. 2000; 41(3):299–309.
68. Leutenegger W, Kelly JT. Relationship of sexual dimorphism in canine size and body size to social,behavioral, and ecological correlates in anthropoid primates. Primates. 1977; 18(1):117–36.
69. Hajer GR, Dallinga‐Thie GM, Vark‐van der Zee V, Leonie C, Olijhoek JK, Visseren FL. Lipid‐loweringtherapy does not affect the postprandial drop in high density lipoprotein‐cholesterol (HDL‐c) plasmalevels in obese men with metabolic syndrome: a randomized double blind crossover trial. Clinicalendocrinology. 2008; 69(6):870–7. doi: 10.1111/j.1365-2265.2008.03250.x PMID: 18394022
70. Jenkins DJ, Kendall CW, Marchie A, Faulkner DA, Wong JM, de Souza R, et al. Effects of a dietaryportfolio of cholesterol-lowering foods vs lovastatin on serum lipids and C-reactive protein. JAMA: thejournal of the American Medical Association. 2003; 290(4):502–10. PMID: 12876093
71. Kramsch DM, Aspen AJ, Abramowitz BM, Kremendahl T, HoodWB Jr. Reduction of coronary athero-sclerosis by moderate conditioning exercise in monkeys on an atherogenic diet. New England Journalof Medicine. 1981; 305(25):1483–9. PMID: 7300873
72. Lee J, Morris M. The effect of cholesterol feeding on primate serum lipoproteins: I. Low density lipo-protein characterization from rhesus monkeys with high serum cholesterol. Biochemical medicine.1976; 16(2):116–26. PMID: 187177
Lineage-Specific Changes in Biomarkers in Great Apes and Humans
PLOS ONE | DOI:10.1371/journal.pone.0134548 August 6, 2015 19 / 21
73. Stefanick ML, Mackey S, Sheehan M, Ellsworth N, Haskell WL, Wood PD. Effects of diet and exercisein men and postmenopausal women with low levels of HDL cholesterol and high levels of LDL choles-terol. New England Journal of Medicine. 1998; 339(1):12–20. PMID: 9647874
74. Amitay M, Shurki A. The structure of G117Hmutant of butyrylcholinesterase: nerve agents scavenger.Proteins: Structure, Function, and Bioinformatics. 2009; 77(2):370–7.
75. Santarpia L, Grandone I, Contaldo F, Pasanisi F. Butyrylcholinesterase as a prognostic marker: areview of the literature. Journal of cachexia, sarcopenia and muscle. 2013; 4(1):31–9. doi: 10.1007/s13539-012-0083-5 PMID: 22956442
76. Berk PD, Howe RB, Bloomer JR, Berlin NI. Studies of bilirubin kinetics in normal adults. Journal ofClinical Investigation. 1969; 48(11):2176. PMID: 5824077
77. Vitek L, Ostrow JD. Bilirubin chemistry and metabolism; harmful and protective aspects. Current phar-maceutical design. 2009; 15(25):2869–83. PMID: 19754364
78. Rowe AW. Primates: Models for red cell transfusion studies—Cryopreservation and survival of trans-fused red cells in primates. Journal of medical primatology. 1994; 23(8):415–25. PMID: 7602577
79. Vacha J. Red cell life span. Red Blood Cells of Domestic Mammals. 1983:67–132.
80. Bosma PJ, Seppen J, Goldhoorn B, Bakker C, Elferink RO, Chowdhury JR, et al. Bilirubin UDP-glu-curonosyltransferase 1 is the only relevant bilirubin glucuronidating isoform in man. Journal of Biologi-cal Chemistry. 1994; 269(27):17960–4. PMID: 8027054
81. Tukey RH, Strassburg CP. Human UDP-glucuronosyltransferases: metabolism, expression, and dis-ease. Annual Review of Pharmacology and Toxicology. 2000; 40(1):581–616.
82. Hall D, Ybazeta G, Destro-Bisol G, Petzl-Erler M, Di Rienzo A. Variability at the uridine diphosphateglucuronosyltransferase 1A1 promoter in human populations and primates. Pharmacogenetics. 1999;9(5):591. PMID: 10591539
83. Bosma PJ, Chowdhury JR, Bakker C, Gantla S, de Boer A, Oostra BA, et al. The genetic basis of thereduced expression of bilirubin UDP-glucuronosyltransferase 1 in Gilbert's syndrome. New EnglandJournal of Medicine. 1995; 333(18):1171–5. PMID: 7565971
84. Borucki K, Weikert C, Fisher E, Jakubiczka S, Luley C, Westphal S, et al. Haplotypes in the UGT1A1gene and their role as genetic determinants of bilirubin concentration in healthy German volunteers.Clinical biochemistry. 2009; 42(16):1635–41.
85. UdomuksornW, Elliot DJ, Lewis BC, Mackenzie PI, Yoovathaworn K, Miners JO. Influence of muta-tions associated with Gilbert and Crigler-Najjar type II syndromes on the glucuronidation kinetics of bil-irubin and other UDP-glucuronosyltransferase 1A substrates. Pharmacogenetics and Genomics.2007; 17(12):1017–29. PMID: 18004206
86. Chuniaud L, Dessante M, Chantoux F, Blondeau J-P, Francon J, Trivin F. Cytotoxicity of bilirubin forhuman fibroblasts and rat astrocytes in culture. Effect of the ratio of bilirubin to serum albumin. Clinicachimica acta. 1996; 256(2):103–14.
87. Amato M, Kilguss N, Gelardi N, Cashore W. Dose-effect relationship of bilirubin on striatal synapto-somes in rats. Neonatology. 2009; 66(5):288–93.
88. Hoffman DJ, Zanelli SA, Kubin J, Mishra OP, Delivoria-Papadopoulos M. The in Vivo Effect of Bilirubinon the N-Methyl-D-Aspartate Receptor/Ion Channel Complex in the Brains of Newborn Piglets1. Pedi-atric research. 1996; 40(6):804–8. PMID: 8947954
89. Hankø E, Hansen TWR, Almaas R, Lindstad J, Rootwelt T. Bilirubin induces apoptosis and necrosisin human NT2-N neurons. Pediatric research. 2005; 57(2):179–84. PMID: 15611354
90. Grojean S, Koziel V, Vert P, Daval J-L. Bilirubin induces apoptosis via activation of NMDA receptors indeveloping rat brain neurons. Experimental neurology. 2000; 166(2):334–41. PMID: 11085898
91. Rodrigues CM, Solá S, Brites D. Bilirubin induces apoptosis via the mitochondrial pathway in develop-ing rat brain neurons. Hepatology. 2002; 35(5):1186–95. PMID: 11981769
92. Seppen J, Bosma P. Bilirubin, the Gold Within. Circulation. 2012; 126(22):2547–9. doi: 10.1161/CIRCULATIONAHA.112.147082 PMID: 23110861
93. Stocker R, Glazer AN, Ames BN. Antioxidant activity of albumin-bound bilirubin. Proceedings of theNational Academy of Sciences. 1987; 84(16):5918–22.
94. Bélanger S, Lavoie J, Chessex P. Influence of bilirubin on the antioxidant capacity of plasma in new-born infants. Biology of the neonate. 1997; 71(4):233. PMID: 9129792
95. Vítek L, Jirsa M Jr, Brodanová M, Kaláb M, Mareček Z, Danzig V, et al. Gilbert syndrome and ischemicheart disease: a protective effect of elevated bilirubin levels. Atherosclerosis. 2002; 160(2):449–56.PMID: 11849670
Lineage-Specific Changes in Biomarkers in Great Apes and Humans
PLOS ONE | DOI:10.1371/journal.pone.0134548 August 6, 2015 20 / 21
96. Doré S, Takahashi M, Ferris CD, Hester LD, Guastella D, Snyder SH. Bilirubin, formed by activation ofheme oxygenase-2, protects neurons against oxidative stress injury. Proceedings of the NationalAcademy of Sciences. 1999; 96(5):2445–50.
97. Horsfall LJ, Nazareth I, Petersen I. Cardiovascular Events as a Function of Serum Bilirubin Levels in aLarge, Statin-Treated CohortClinical Perspective. Circulation. 2012; 126(22):2556–64. doi: 10.1161/CIRCULATIONAHA.112.114066 PMID: 23110860
98. Horsfall LJ, Rait G, Walters K, Swallow DM, Pereira SP, Nazareth I, et al. Serum bilirubin and risk ofrespiratory disease and death. JAMA: the journal of the American Medical Association. 2011; 305(7):691–7. doi: 10.1001/jama.2011.124 PMID: 21325185
99. Temme EH, Zhang J, Schouten EG, Kesteloot H. Serum bilirubin and 10-year mortality risk in a Bel-gian population. Cancer causes & control. 2001; 12(10):887–94.
100. Perlstein TS, Pande RL, Creager MA, Weuve J, Beckman JA. Serum total bilirubin level, prevalentstroke, and stroke outcomes: NHANES 1999–2004. The American journal of medicine. 2008; 121(9):781–8. e1. doi: 10.1016/j.amjmed.2008.03.045 PMID: 18724968
101. Navarrete A, van Schaik CP, Isler K. Energetics and the evolution of human brain size. Nature. 2011;480(7375):91–3. doi: 10.1038/nature10629 PMID: 22080949
102. LeonardWR, Snodgrass JJ, Robertson ML. Effects of brain evolution on human nutrition and metabo-lism. Annu Rev Nutr. 2007; 27:311–27. PMID: 17439362
103. Finstermeier K, Zinner D, Brameier M, Meyer M, Kreuz E, Hofreiter M, et al. A mitogenomic phylogenyof living primates. PLoS One. 2013; 8(7):e69504. doi: 10.1371/journal.pone.0069504 PMID:23874967
104. Perelman P, JohnsonWE, Roos C, Seuánez HN, Horvath JE, Moreira MA, et al. A molecular phylog-eny of living primates. PLoS genetics. 2011; 7(3):e1001342. doi: 10.1371/journal.pgen.1001342PMID: 21436896
105. Gibbs RA, Rogers J, Katze MG, Bumgarner R, Weinstock GM, Mardis ER, et al. Evolutionary and bio-medical insights from the rhesus macaque genome. Science. 2007; 316(5822):222–34. PMID:17431167
106. Farrell CM, O'Leary NA, Harte RA, Loveland JE, Wilming LG, Wallin C, et al. Current status and newfeatures of the Consensus Coding Sequence database. Nucleic Acids Res. 2014; 42(1):D865–72.Epub 2013/11/13. doi: 10.1093/nar/gkt1059 PMID: 24217909.
107. Harte RA, Farrell CM, Loveland JE, Suner MM,Wilming L, Aken B, et al. Tracking and coordinating aninternational curation effort for the CCDS Project. Database: the journal of biological databases andcuration. 2012; 2012:bas008. Epub 2012/03/22. doi: 10.1093/database/bas008 PMID: 22434842;PubMed Central PMCID: PMC3308164.
108. Pruitt KD, Harrow J, Harte RA, Wallin C, Diekhans M, Maglott DR, et al. The consensus codingsequence (CCDS) project: Identifying a common protein-coding gene set for the human and mousegenomes. Genome research. 2009; 19(7):1316–23. Epub 2009/06/06. doi: 10.1101/gr.080531.108PMID: 19498102; PubMed Central PMCID: PMC2704439.
109. Laakkonen L, Finel M. A molecular model of the human UDP-glucuronosyltransferase 1A1, its mem-brane orientation, and the interactions between different parts of the enzyme. Molecular Pharmacol-ogy. 2010; 77(6):931–9. doi: 10.1124/mol.109.063289 PMID: 20215562
110. Pääbo S, Bhat BM, Wold WS, Peterson PA. A short sequence in the COOH-terminus makes an ade-novirus membrane glycoprotein a resident of the endoplasmic reticulum. Cell. 1987; 50(2):311–7.PMID: 2954653
111. Teasdale RD, Jackson MR. Signal-mediated sorting of membrane proteins between the endoplasmicreticulum and the golgi apparatus. Annual review of cell and developmental biology. 1996; 12(1):27–54.
112. Flicek P, Ahmed I, Amode MR, Barrell D, Beal K, Brent S, et al. Ensembl 2013. Nucleic AcidsResearch. 2013; 41(D1):D48–D55. doi: 10.1093/nar/gks1236
113. Locke DP, Hillier LW, WarrenWC, Worley KC, Nazareth LV, Muzny DM, et al. Comparative anddemographic analysis of orang-utan genomes. Nature. 2011; 469(7331):529–33. doi: 10.1038/nature09687 PMID: 21270892
114. Babbitt CC, Fedrigo O, Pfefferle AD, Boyle AP, Horvath JE, Furey TS, et al. Both noncoding and pro-tein-coding RNAs contribute to gene expression evolution in the primate brain. Genome Biology andEvolution. 2010; 2:67. doi: 10.1093/gbe/evq002 PMID: 20333225
115. DannemannM, Prüfer K, Lizano E, Nickel B, Burbano HA, Kelso J. Transcription factors are targetedby differentially expressed miRNAs in primates. Genome Biology and Evolution. 2012; 4(4):552–64.doi: 10.1093/gbe/evs033 PMID: 22454130
Lineage-Specific Changes in Biomarkers in Great Apes and Humans
PLOS ONE | DOI:10.1371/journal.pone.0134548 August 6, 2015 21 / 21