researchcoastal and marine spatial planning
TRANSCRIPT

Tec h n ica l R epor t # 0 3 .U H I .11RESEARCHC o a s t a l a n d M a r i n e S pat i a l P l a n n i n g
2010 Massachusetts Recreational Boater Survey
Final Report Submitted to the Massachusetts Ocean Partnership
Prepared by
Dan Hellin, Jack Wiggin, and Kristin Uiterwyk Urban Harbors Institute, University of Massachusetts Boston
Kim Starbuck and Nicholas NapoliMassachusetts Ocean Partnership
David Terkla and Chris WatsonDepartment of Environmental, Earth and Ocean Sciences,
University of Massachusetts Boston
Anthony RomanCenter for Survey Research, University of Massachusetts Boston
Leona RoachMarine Consulting Services
Tim WelchEcotrust
June 2011
T h i s r e s e a rc h i s f u n d e d b y t h e G o r d o n a n d B e t t y M o o r e F o u n d a t i o n

Primary Authors:
Dan Hellin, Urban Harbors Institute, University of Massachusetts Boston
Kim Starbuck, Massachusetts Ocean Partnership
David Terkla and Chris Watson, Department of Environmental, Earth and Ocean Sciences, University of Massachusetts Boston
Anthony Roman, Center for Survey Research, University of Massachusetts, Boston
Contributors:
Jack Wiggin and Kristin Uiterwyk, Urban Harbors Institute, University of Mas-sachusetts Boston
Nicholas Napoli, Massachusetts Ocean Partnership
Leona Roach, Marine Consulting Services
Tim Welch, Ecotrust
Editors:
Kim StarbuckLeona RoachKristin UiterwykPrassede Vella, MA Office of Coastal Zone Management
June 2011
This research is funded by the Gordon and Betty Moore Foundation.
Recommended Citation:
Hellin, D., Starbuck, K., Terkla, D., Roman, A., and Watson, C. (2011, June) 2010 Massachusetts Recreational Boater Survey (03.uhi.11). Boston: Massachusetts Ocean Partnership
This report may be downloaded at http://massoceanpartnership.org/wp-content/uploads/2011/06/2010_massachusetts_recreational-tr-uhi-11.pdf
Printed on recycled paper
ABSTRACT
The Massachusetts Ocean Management Plan (Plan) completed in 2009 recog-nized recreational boating as an activity with “significant actual and prospective conflicts among multiple waterway uses in Massachusetts” and included the economic value of recreational boating as a key socio-economic indicator that will be used to inform coastal management. At the time of Plan completion, statistically robust recreational boating data were identified as an important need for comprehensive ocean planning.
To fill this data gap, the 2010 Massachusetts Recreational Boater Survey gath-ered information on boating activity in Massachusetts’ coastal and ocean waters directly from recreational boaters. Researchers sent 10,000 surveys to owners of Massachusetts registered and documented vessels in the spring of 2010 asking for participation in the six month study. Over 22% responded and provided de-tailed information through monthly surveys between May and October about their boating trips including expenditures, recreational activities, and routes. Boaters plotted their spatial data (routes and activity areas) using an innova-tive online open source mapping tool. Using statistical methods and economic models, the demographic and economic information from the sample of boat-ers was generalized to the population of Massachusetts boaters.
Results revealed the economic contribution of this activity to the Massachu-setts economy - an estimated $806 million in 2010. Information gathered through the survey was also compiled into comprehensive maps depicting recreational boating patterns and density, and was used to better understand details of the recreational boating community, such as the most common boat size, the typical age of Bay State boaters, etc.
The research findings will be incorporated into the Massachusetts Ocean Man-agement Plan and can be used by resource managers, the boating industry and others in many ways, such as ensuring boating routes and destinations receive appropriate attention in ocean planning efforts.
Massachusetts Ocean PartnershipThe Nonprofit Center89 South StreetBoston MA 02111www.massoceanpartnership.org
ACKNOWLEDGEMENTS
The following people provided invaluable insight, knowledge, expertise and support during the design, development and implementation of the 2010 Massachusetts Recreational Boater Survey:
Advisory Group:
Nathalie Grady (Massachusetts Marine Trades Association); Peter Caten (Massachusetts Boating and Yacht Clubs Association); David Fronzuto (Massachusetts Harbormasters Association); Dan Pingaro (Sailors for the Sea); Rob Johnston (George Perkins Marsh Institute, Clark University); and Bob Leeworthy (Office of National Marine Sanctuaries, National Oceanic and Atmospheric Administration).
Those who donated prizes for survey participant recruitment:
The Massachusetts Ocean Partnership; the Massachusetts Marine Trades Association; Sea Tow South Shore; Newburyport Marinas; and Kingman Yacht Center.
Others:
Brian Clarridge, Swaati Eklund and John Rogers, The Center for Survey Research
John Weber, Prassede Vella and Dan Sampson, MA Office of Coastal Zone Management
Charles Steinback, Ecotrust
The Donahue Institute (University of Massachusetts); Newburyport Marina; Cape Ann Marina: Boston Harbor Shipyard & Marina; Onset Bay Marina; Hyannis Marina; the Harbormaster of Tisbury; the Harbormasters of Nantucket; and Molly Kile.
The Massachusetts Ocean Partnership initiated and participated in this study as part of a continuing effort to advance the scientific basis of coastal and marine spatial planning.

CONTENTS
1 Introduction ............................................................................................................................................ 1
2 The Project Team .................................................................................................................................... 2
3 Rationale and Goals ................................................................................................................................ 3
4 Key Findings ............................................................................................................................................ 4
4.1 Datasets and Sampling ................................................................................................................. 4
4.2 Database Improvements .............................................................................................................. 5
4.3 Boats and Boaters ......................................................................................................................... 6
4.4 Boating Activity ............................................................................................................................. 8
4.5 Economics ..................................................................................................................................... 9
4.6 Feedback ..................................................................................................................................... 10
5 Methodology ........................................................................................................................................ 11
5.1 Boat Ownership Data .................................................................................................................. 12
5.1.1 Massachusetts Registered Boats ................................................................................. 13
5.1.2 US Coast Guard (USCG) Documented Vessels ............................................................. 13
5.1.3 Acquiring the Databases .............................................................................................. 14
5.1.4 Description of the “Population”................................................................................... 15
5.1.5 Strengths and Weaknesses of the Datasets ................................................................. 19
5.2 Survey Design ............................................................................................................................. 22
5.2.1 Surveys ......................................................................................................................... 22
5.2.2 Web-mapping Application ........................................................................................... 30
5.2.3 Testing .......................................................................................................................... 36
5.3 Sample Design ............................................................................................................................ 36
5.4 Sample Recruitment ................................................................................................................... 38
5.5 Outreach and Recruitment Efforts ............................................................................................. 40
5.6 Recruitment Responses .............................................................................................................. 42
5.7 Implementation .......................................................................................................................... 44
5.8 Participation during the Season ................................................................................................. 49

5.8.1 Initial Survey ................................................................................................................. 49
5.8.2 Monthly Surveys .......................................................................................................... 50
5.8.3 End-of-season Survey................................................................................................... 56
5.8.4 Mapping Application .................................................................................................... 57
5.9 Boater Feedback (during the boating season)............................................................................ 59
5.10 Volunteer Survey ........................................................................................................................ 59
5.11 Out-of-state Boater Pilot Survey ................................................................................................ 60
5.11.1 Cape Cod Canal Data .................................................................................................... 61
5.11.2 US Coast Guard Notice of Arrival/Departure Data ...................................................... 62
5.11.3 Marina Surveys ............................................................................................................ 63
5.11.4 Recommendations for Future Surveys of Out-of-state Boaters .................................. 65
6 Analysis ................................................................................................................................................. 66
6.1 Surveys Analysis .......................................................................................................................... 66
6.1.1 Weighting of Data ........................................................................................................ 66
6.1.2 Data Cleaning and Analysis .......................................................................................... 67
6.2 Economic Contribution Analysis and the IMPLAN Model .......................................................... 69
6.2.1 Contributions to the Economy ..................................................................................... 69
6.2.2 The IMPLAN Modeling System ..................................................................................... 69
6.2.3 Data Cleaning and Analysis .......................................................................................... 70
6.3 Mapping Application Analysis..................................................................................................... 70
6.3.1 Data Cleaning ............................................................................................................... 70
6.3.2 Analysis ........................................................................................................................ 70
7 Results .................................................................................................................................................. 71
7.1 Vessel Information ...................................................................................................................... 71
7.2 Boater Information ..................................................................................................................... 75
7.3 Boating-related Activity .............................................................................................................. 80
7.4 Economic Contribution ............................................................................................................... 91
7.5 Other Boating-related Data ........................................................................................................ 97
7.6 Spatial Data ................................................................................................................................. 98

7.7 Boater Feedback ....................................................................................................................... 105
8 Lessons Learned and Recommendations ........................................................................................... 109
8.1 Timeline .................................................................................................................................... 109
8.2 Advisory Group ......................................................................................................................... 109
8.3 Determining the Population of Boats Using the Waters of Massachusetts ............................. 110
8.4 Sample of Boaters ..................................................................................................................... 110
8.5 Survey Development ................................................................................................................ 111
8.6 Implementation of the Surveys and Mapping Application....................................................... 112
8.7 Incentives to Encourage Participation ...................................................................................... 112
8.8 Outreach ................................................................................................................................... 113
8.9 Data Analysis ............................................................................................................................. 113
9 Next Steps ........................................................................................................................................... 115
Appendix A: Map of Recreational Boating Activity from the Massachusetts Ocean Management Plan. 116
Appendix B: Surveys .................................................................................................................................. 117
Introductory or Recruitment Survey .................................................................................................. 117
Initial Survey ....................................................................................................................................... 118
Monthly Survey .................................................................................................................................. 121
End-of-Season Survey ......................................................................................................................... 126
Feedback Survey ................................................................................................................................. 128
Appendix C: Project Sheet included in the Recruitment Package and Used to Publicize the Survey ....... 129
Appendix D: Generic Press Release Text .................................................................................................. 130
Appendix E: Generalized Text Used for the Monthly E-mails ................................................................... 131
Appendix F: Generalized Text Used for the Second Reminder E-mails .................................................... 132
Appendix G: Additional Spatial Maps ....................................................................................................... 133

Massachusetts Recreational Boater Survey 2010 - Final Report i June 22, 2011
LIST OF TABLES
Table 1: Breakdown of all boats in the database of registered boats by primary use type. ........................ 15
Table 2: Breakdown of pleasure and commercial fishing boats in the database of registered boats by size
class. ................................................................................................................................................ 16
Table 3: Breakdown of documented boats by size class. ............................................................................. 16
Table 4: Breakdown of pleasure and commercial fishing boats in the database of registered boats by size
class and vessel type. ...................................................................................................................... 17
Table 5: Breakdown of pleasure and commercial fishing boats in the database of registered boats by
propulsion type. .............................................................................................................................. 18
Table 6: Breakdown of pleasure and commercial fishing boats in the database of registered boats by fuel
type. ................................................................................................................................................ 18
Table 7: Breakdown of pleasure and commercial fishing boats in the database of registered boats by hull
material. .......................................................................................................................................... 19
Table 8: Description of the surveys that were sent to boat owners............................................................. 23
Table 9: The population of recreational boats in Massachusetts and the sample drawn. ........................... 38
Table 10: The relationship between the unique identifiers and the sampling strata. .................................... 40
Table 11: Results of the recruitment survey. .................................................................................................. 45
Table 12: Timeline of mailings and other communications with boaters during the 2010 boating season. .. 47
Table 13: Results of the initial survey. ............................................................................................................ 50
Table 14: Overall results of the monthly surveys. .......................................................................................... 51
Table 15: Monthly survey results by region.................................................................................................... 53
Table 16: Monthly survey results by boat size................................................................................................ 54
Table 17: Breakdown of how many boaters completed multiple surveys throughout the boating season. .. 55
Table 18: Results of the end-of-season survey. .............................................................................................. 57
Table 19: Summary of spatial data provided by participating boaters. .......................................................... 58
Table 20: Boat type by region based on responses to the initial survey. ....................................................... 71
Table 21: Boat size class by region based on responses to the initial survey. ................................................ 72
Table 22: Boat hull material by region based on responses to the initial survey. .......................................... 72
Table 23: Boat propulsion type by region based on responses to the initial survey. ..................................... 73
Table 24: Boat fuel type by region based on responses to the initial survey. ................................................ 73
Table 25: Boat in-season storage type by region based on responses to the initial survey. .......................... 74

Massachusetts Recreational Boater Survey 2010 - Final Report ii June 22, 2011
Table 26: Boat in-season storage facility type by region based on responses to the initial survey. .............. 74
Table 27: Boat out-of-season storage type by region based on responses to the initial survey. ................... 75
Table 28: Boat out-of-season storage facility type by region based on responses to the initial survey. ....... 75
Table 29: Boater’s sex by region based on responses to the initial survey. NA means “no answer”. ........... 76
Table 30: Mean age of boaters by region based on responses to the initial survey. ..................................... 76
Table 31: Mean number of years respondents had been regular boat operators based on responses to the
initial survey. ................................................................................................................................... 77
Table 32: Mean number of years respondents had owned a boat based on responses to the initial survey.
........................................................................................................................................................ 77
Table 33: Percent of boaters who had taken a boating safety course based on responses to the initial
survey. ............................................................................................................................................. 78
Table 34: Percent of boaters who had taken a navigation course based on responses to the initial survey. 78
Table 35: Percent of boaters with different employment statuses based on responses to the initial survey.
........................................................................................................................................................ 79
Table 36: Percent of boaters with annual household incomes based on responses to the initial survey. ..... 80
Table 37: Percentage of boaters who did or did not visit their boat based on responses to the monthly
surveys. ........................................................................................................................................... 81
Table 38: Percentage of boaters who did or did not take a trip out on the water based on responses to the
monthly surveys. ............................................................................................................................. 82
Table 39: Mean number of days that boaters took their vessel out on the water based on responses to the
monthly surveys. ............................................................................................................................. 82
Table 40: Mean and maximum number of people on board during the reported trip based on responses to
the monthly surveys. ....................................................................................................................... 83
Table 41: Percentage of boaters who trailered their boat to a launch location during the reported trip
based on responses to the monthly surveys. .................................................................................. 84
Table 42: Percentage of boaters who trailered their boats from different location types during the reported
trip based on responses to the monthly surveys. ........................................................................... 84
Table 43: Percentage of boaters who paid a launch fee or a parking fee at a launch site during the reported
trip based on responses to the monthly surveys. ........................................................................... 85
Table 44: Mean amount that boats paid as a launch fee or a parking fee at a launch site during the
reported trip based on responses to the monthly surveys. ............................................................ 86
Table 45: Mean number of miles traveled to reach the site where boaters launched or boarded their vessel
during the reported trip based on responses to the monthly surveys. .......................................... 86

Massachusetts Recreational Boater Survey 2010 - Final Report iii June 22, 2011
Table 47: Percentage of boaters who engaged in specific activities during the monthly reported trip. The
percentages are conditionally-shaded to highlight seasonal variations within each activity type
(high percentage = red, low percentage = green). .......................................................................... 89
Table 48: Spending by coastal and ocean recreational boaters in Massachusetts, 2010. .............................. 92
Table 49: Summary of indirect and induced effects (by category) of coastal and ocean recreational boating
spending in Massachusetts, 2010. .................................................................................................. 93
Table 50: Total jobs supported by coastal and ocean recreational boating spending in Massachusetts, 2010.
........................................................................................................................................................ 94
Table 51: Spending by coastal and ocean recreational boaters in the Southeast Region, 2010. ................... 95
Table 52: Spending by coastal and ocean recreational boaters in the East Central region, 2010. ................. 96
Table 53: The average number of hours under power or sail by size class within a region, and by region. .. 97
Table 54: How boaters rated their 2010 boating activity compared to other years. ..................................... 98
Table 55: Reasons why boaters did not use the online mapping application by percentage of respondents.
...................................................................................................................................................... 105
Table 56: How easy boaters found the online mapping application as a percentage of respondents. ........ 106
Table 57: Boaters’ willingness to participate in future similar boating surveys as a percentage of
respondents. ................................................................................................................................. 106
Table 58: Summary of thoughts and comments made about the online mapping application. .................. 107
Table 59: Summary of thoughts and comments made about the boater survey in general. ....................... 108

Massachusetts Recreational Boater Survey 2010 - Final Report iv June 22, 2011
LIST OF FIGURES
Figure 1: Breakdown of the population of documented and registered vessels by size class. ...................... 16
Figure 2: Number of pleasure and commercial fishing boats in the database of registered boats by type
and size class. .................................................................................................................................. 17
Figure 3: The percent of types of vessel information deemed correct by vessel owners. ............................ 20
Figure 4: The flow diagram captures the logic required to provide the mapping tools to the user. ............. 32
Figure 5: Snapshots of the final recreational boater survey web-mapping application user interface: initial
instruction screen; route questions; and activity area mapping. ................................................... 33
Figure 6: Illustration of the technology stack for the boater survey mapping tool. ...................................... 35
Figure 7: The sample regions were based on county boundaries. Counties are labeled in the figure. ........ 39
Figure 8: The number of completed recruitment surveys and undeliverable recruitment packages received
during the four months following the May 6 mailing. .................................................................... 43
Figure 9: Percent of returns that were found to be eligible by region. ......................................................... 46
Figure 10: Daily website activity and dates of e-mailings. ............................................................................... 48
Figure 11: Daily hits on the “thank you” webpage to which boaters were directed automatically when they
completed a monthly survey and dates of e-mailings. ................................................................... 49
Figure 12: Results of the monthly surveys. ...................................................................................................... 52
Figure 13: Breakdown of how boaters completed multiple monthly surveys. ................................................ 56
Figure 14: Summary of spatial data provided by participating boaters. .......................................................... 59
Figure 15: Percent of boaters with specified annual household incomes. ...................................................... 80
Figure 16: The percentage of visit-related or trip-related spending that occurred “near to” the launch or
boarding location based on responses to the monthly surveys. .................................................... 90
Figure 17: Route data as provided by participants in the boater survey. The lines represent the “last trip of
the month” routes plotted by recreational boaters between May and October 2010. ................. 99
Figure 18: Route data as provided by participants in the boater survey aggregated into 1km x 1km cells.. 100
Figure 19: Route data for each month of the boater survey as provided by participants. ............................ 101
Figure 20: Route data for each month of the boater survey as provided by participants.. ........................... 102
Figure 21: Route data as provided by participants in the boater survey, broken down by boats of 10 feet or
more in length but less than 40 feet (left) and boats greater than 40 feet in length (right). ....... 103
Figure 22: Activity area data as provided by participants in the boater survey. ........................................... 104
Figure 23: Stellwagen Bank National Marine Sanctuary and the route data gathered during the boater
survey. ........................................................................................................................................... 104

Massachusetts Recreational Boater Survey 2010 - Final Report v June 22, 2011
LIST OF ACRONYMS
COTP United States Coast Guard Captain of the Port
CSR Center for Survey Research, University of Massachusetts Boston
CZM Massachusetts Office of Coastal Zone Management
EEA Massachusetts Executive Office of Energy and Environmental Affairs
EEOS Department of Environmental, Earth and Ocean Sciences, University of Massachusetts
Boston
EEZ Exclusive Economic Zone
GIS Geographic Information System
IMPLAN IMpact analysis for PLANning - software
MassGIS Massachusetts Office of Geographic Information
MEP Massachusetts Environmental Police
MMTA Massachusetts Marine Trades Association
MOP Massachusetts Ocean Partnership
MORIS Massachusetts Ocean Resources Information System
NOA/D United States Coast Guard Notice of Arrival/Departure
PWC Personal watercraft / jetski
UHI Urban Harbors Institute, University of Massachusetts Boston
USACE United States Army Corps of Engineers
USCG United States Coast Guard

Massachusetts Recreational Boater Survey 2010 - Final Report 1 June 22, 2011
1 INTRODUCTION With over 155,000 recreational boats in Massachusetts, recreational boating is an important use of the
state’s coastal and ocean waters that must be considered in Massachusetts ocean planning efforts. To
appropriately consider recreational boating activity when planning, it is critical to understand where
boaters go, what they do while boating (i.e. fishing, sightseeing, etc.), and how much they spend on
boating. During the development of the Massachusetts Ocean Management Plan, it became clear that
more information of this type was needed to develop a comprehensive ocean management plan.
The plan, which was developed by Massachusetts Executive Office of Energy and Environmental Affairs
(EEA) in response to the 2008 Oceans Act, is a comprehensive ocean management plan for
Massachusetts’ waters. Using the best available science and stakeholder engagement, the plan was
finalized in December 2009 and is intended to protect critical marine resources and foster sustainable
uses in state waters. The plan also provides a framework for managing, reviewing and permitting
proposed uses of state waters.
As the plan was being developed, the limited amount of information on recreational boating in
Massachusetts represented an impediment to developing a comprehensive statewide coastal and ocean
management plan. To help fill in these data gaps, organizations such as the Massachusetts Marine
Trades Association (MMTA) provided invaluable expert opinion on recreational boating activity, which
was incorporated into the plan (see Appendix A). Although this expert opinion provided great insight
into recreational boating use in state waters, expert opinion alone is not scientifically quantifiable. In
light of this, the plan concluded:
All of these data point to the importance of recreational boating as an existing use across all sectors of the planning area. Recognizing that the resolution of actual and prospective conflicts among multiple waterway uses is a topic of growing management concern in Massachusetts and around the country, the Commonwealth’s Work Group on Ocean Recreational and Cultural Services identified recreational boating as a topic of key importance. Both the Work Group on Ocean Recreational and Cultural Services and the Work Group on Transportation, Navigation, and Infrastructure recommended that a comprehensive spatial map of recreational vessel traffic patterns and concentrations be developed for the planning area. Massachusetts Ocean Management Plan, 2009.
Considering the importance of recreational boating to Massachusetts, the plan also identified the
economic value of recreational boating as one of the five critical socio-economic indicators needed “to
assess the ocean management plan and to identify general trends in the ocean planning area”
(Massachusetts Ocean Management Plan, 2009).
This study is responding to the need identified in the plan to gather additional spatial and economic
recreational boating data using statistically robust sampling methods. Results from this study will
supplement existing information gathered through expert opinion, and will be incorporated in plan
updates and likely inform plan revisions. Recreational boating data are essential for effective ocean
planning efforts as it informs economic valuations and cumulative human-use impact analyses, as well
as provides a better understanding of the tradeoffs in decision-making.

Massachusetts Recreational Boater Survey 2010 - Final Report 2 June 22, 2011
2 THE PROJECT TEAM To continue its work in supporting the Massachusetts Ocean Management Plan, the Massachusetts
Ocean Partnership (MOP) contracted with a team led by the Urban Harbors Institute (UHI) of the
University of Massachusetts Boston to design, develop and implement the 2010 Massachusetts
Recreational Boater Survey. The team consisted of:
The Urban Harbors Institute (University of Massachusetts Boston);
The Massachusetts Ocean Partnership;
The Massachusetts Office of Coastal Zone Management;
The Department of Environmental, Earth and Ocean Sciences (University of Massachusetts
Boston);
The Center for Survey Research (University of Massachusetts Boston);
Marine Consulting Services; and
Ecotrust.
In addition to the core team organizations, an advisory group was formed to help guide the study:
Nathalie Grady (Massachusetts Marine Trades Association);
Peter Caten (Massachusetts Boating and Yacht Clubs Association);
David Fronzuto (Massachusetts Harbormasters Association);
Dan Pingaro (Sailors for the Sea);
Rob Johnston (George Perkins Marsh Institute, Clark University); and
Bob Leeworthy (Office of National Marine Sanctuaries, National Oceanic and Atmospheric
Administration).

Massachusetts Recreational Boater Survey 2010 - Final Report 3 June 22, 2011
3 RATIONALE AND GOALS The overall aim of the 2010 Massachusetts Recreational Boater Survey was to assess the characteristics
of recreational boating in coastal and ocean waters of Massachusetts. This survey had two main goals:
1. To gather temporal, spatial and economic data to supplement existing information on
recreational boating.
The aim was to verify and to expand upon existing temporal and spatial data on recreational
boating in Massachusetts using a scientific methodology. Much of the existing information that
was used in the Massachusetts Ocean Management Plan was based on expert opinion (provided
by a group of knowledgeable boaters) and was therefore largely subjective or anecdotal. The
methodology used in this study was based on accepted survey designs and sampling techniques
that would produce statistically robust data and could be repeated.
This survey also collected data on recreational boating trip-related spending, which were used
to estimate the contribution of coastal and ocean recreational boating activity to a regional
and/or state economy. It is important to note that this survey did not aim to quantify the
overall economic impact of recreational boating. It focused on the spending associated with
boating trips on the water, visits to the boat while docked, and some annual expenses such as
maintenance/storage. Additionally, this survey did not capture spending by out-of-state
boaters, which may be considerable and may support more fulltime-equivalent jobs than were
estimated through this analysis. The economic analyses and results should only be assessed in
conjunction with other economic studies.
The information gathered through this survey could be used be used by resource managers, the
boating industry and others to:
Ensure that boaters' favorite routes and destinations receive appropriate attention
when management decisions are made about Massachusetts' coastal and ocean waters;
Help reduce resource use conflicts;
Improve business planning; and
Assist in the decision-making process associated with coastal and ocean management in
the Commonwealth of Massachusetts.
2. To develop a methodology that could be easily repeated in Massachusetts; adapted for use in
other research efforts; and readily customized to be used elsewhere.
The survey design and the open-source online mapping tool could be used in future recreational
boating studies in Massachusetts or other locations, and/or could be adapted for use in other
research efforts (e.g. studies involving the collection of human use data).

Massachusetts Recreational Boater Survey 2010 - Final Report 4 June 22, 2011
4 KEY FINDINGS This section summarizes the key findings from the study. More information on these findings can be
found throughout the report.
4.1 Datasets and Sampling
Two dataset (one containing details of the boats registered in Massachusetts and the other
containing details of US Coast Guard documented vessels believed to be from Massachusetts)
were combined to produce a list of 155,331 recreational boats in Massachusetts. This defined
the “population” or universe of all boats under consideration for the study.
A sample of 10,000 boats was selected for inclusion in this study. This represented
approximately 6.4% of all recreational boats in Massachusetts.
The selection of these boats favored larger boats and boats that were stored nearer to coastal
waters. This was due to the specific goal of the study to investigate recreational boater use of
coastal and ocean waters. The sampling fractions varied from a low of about 3% of boats from
Western Massachusetts, which is far from any coastal waters, to a high of about 38.1% for
large US Coast Guard documented boats, which were considered highly likely to be used
exclusively in coastal and ocean waters. The sample was designed to attempt to target the
boats most likely to be of interest to the goals of the study. However, all recreational boats in
Massachusetts had a chance of selection into the study. This design was considered both
inclusive and efficient.
Of the 10,000 recruitment surveys that were sent out, 533 were returned with undeliverable
addresses.
Of the remaining 9,467 recruitment surveys that were assumed to be delivered to boat
owners, 2,131 were completed and returned either through the mail or via the web. This
meant an effective return rate of 22.5% for the surveys.
The overall eligibility rate for the returned surveys was 57.9%. In order to remain eligible for
the study, boat owners who completed the recruitment survey also had to meet the following
criteria:
They still owned the specific boat;
They used the boat on salt or brackish water;
The boat was used for recreational purposes (even if this was not its exclusive use); and
They provided a valid e-mail address.
Less than 6% of eligible returns had to be rejected as they stated that they did not have e-mail
or they did not provide an e-mail address.

Massachusetts Recreational Boater Survey 2010 - Final Report 5 June 22, 2011
The eligibility rates ranged from a low of 8.9% for boat owners in Western Massachusetts to a
high of about 84% for documented boats.
A total of 6,880 e-mails were sent over the six months of monthly surveys, with 550 of these
being bounced back. This led to 2,989 completed surveys for an estimated response rate of
47.2%.
It is only possible to suggest an approximate response rate, as there is no true way to
determine exactly how many e-mails arrived in a way that a boat owner saw it and had the
opportunity to respond. If the e-mail did not bounce back, then it was assumed that it did get
through any firewalls, spam filters, etc. and did get to the desired boat owner.
As expected, the response rate by month declined over time from a high of 69% in the May
survey to a low of 33.4% in the October survey. This is not unusual as keeping people
interested and engaged over six months of surveys is a difficult task.
Boaters who had taken an on-water trip were given the opportunity to plot that trip using the
online mapping tool. They also had the option to skip the mapping section. Initially, over 70%
of those who did not choose to skip the mapping application went on to plot a route.
However, this percentage dropped throughout the study until only 50% mapped a route in
October.
The mapping of activity areas, and alternate areas, was generally not well undertaken by
participants: between 28% and 15% of boaters mapped activity areas and only 18% to 7%
mapped alternate areas.
A total of 1,094 routes were mapped along with 339 activity areas and 210 alternate activity
areas.
4.2 Database Improvements
Implementing minor changes to the information required to register a boat in Massachusetts
could dramatically increase the value of the resulting database for research purposes. Making
these types of changes may be possible for a couple of reasons:
1. The Massachusetts Environmental Police (MEP) is part of the Executive Office of Energy
and Environmental Affairs (EEA), which was one of the driving forces behind the
implementation of this study. As the state’s boat registration falls under the jurisdiction
of MEP, intra-agency coordination may facilitate making changes to the registration
process.
2. The MEP has recently started to offer online boat registration and renewal, which would
facilitate electronic information gathering.

Massachusetts Recreational Boater Survey 2010 - Final Report 6 June 22, 2011
If a few additional pieces of information were gathered during the boat registration process,
the resulting database could be greatly enhanced as a tool to survey recreational boaters in
the future and more accurately target this and other research. Additional valuable
information might include:
A current, valid e-mail address.
Whether the boat is used exclusively on freshwater versus saltwater.
Whether the boat is used exclusively for commercial purposes.
Whether the boat is used exclusively as a tender.
Greater details about where the boat is kept.
If the boat is ever used for recreational fishing.
There are two categories of vessels that may be missing from, or under-represented in the
database of boats registered in Massachusetts:
1. Non-motorized vessels that are not required to be registered in Massachusetts. These
would include canoes and kayaks and some (most likely smaller) sailboats. For this
study, this was not a significant issue as canoes and kayaks were not the primary focus
of the research and small sailboats are most commonly used in nearshore waters.
2. The second category is of greater significance. The waters of Massachusetts are
extremely popular with out-of-state boaters. Some are day-trippers who simply pass
through the waters of the state, while others are larger vessels that might spend several
days or weeks in Massachusetts and may have a significant impact on the local economy
in terms of both spending and the jobs supported by the spending activity. At present,
the number of out-of-state boaters using the state’s waters and their economic impact
remains almost entirely unknown.
4.3 Boats and Boaters
Over 89% of the state-registered vessels were less than 26 feet in length with 57% of them
being between 16 and 26 feet. Only 0.2% of registered boats were 40 feet or over.
Less than 3% of USCG documented vessels were less than 26 feet in length. Over 80% were
between 26 and 40 feet and over 17% were 40 or more feet in length.
Over 70% of registered vessels were open boats. Sailboats and cabin cruisers each accounted
for just over 12% of registered boats.
Over 35% of documented vessels were cabin cruisers. No documented vessels were open
boats.
Over 75% of registered vessels were powered by outboard engines. Sterndrives powered
almost 13% of registered boats and a little over 9% were powered by inboard engines.

Massachusetts Recreational Boater Survey 2010 - Final Report 7 June 22, 2011
Only 2% of documented vessels were powered by outboard engines. Almost 95% were
powered by inboard engines. None reported having a sterndrive engine.
Over 92% of registered boats were gas powered compared to less than 21% of documented
boats. Almost 77% of documented vessels were diesel powered.
Both berths and moorings appeared to be common in-season storage types for all boats with
the exception of Western Massachusetts. Boaters in this region generally stored their boats
on trailers or otherwise on land e.g. up on blocks). This type of storage was also common in
Central Massachusetts.
By far the most common out-of-season storage type for boats was on a trailer or otherwise
stored on land. Very few boaters reported that they stored their vessel at berths or on
moorings out of season.
The boat owners who participated in this study were predominantly male.
The mean age of boaters was 58 years old across the whole of Massachusetts.
Boaters reported that, on average, they had operated boats for just over 30 years. Owners of
documented boats had operated boats for longer than registered boat owners (36 years for
documented boat owners compared to between 26 and 31 years for others).
On average, boaters owned their boats for just over 24 years. Again, documented boaters
appeared to have owned boats for slightly longer registered boat owners (28 years compared
to between 22 and 25 years).
Across the state, approximately 53% of boaters reported that they had taken a boating safety
course (e.g. Boat-Ed through the Massachusetts Environmental Police). Owners of
documented boats were most likely to have taken such courses (over 63%). Between 33% and
40% in the Western and Central regions of Massachusetts had taken such a course.
Across the state, almost 54% of boaters reported having taken a navigation course such as
those offered by the US Coast Guard Auxiliary, US Power Squadrons or American Sailing
Association. Almost 81% of owners of documented boats had taken a navigation course. In
Western and Central regions, only a third of registered boat owners reported that they had
taken a navigation course. Elsewhere in Massachusetts, 50% to 56% of registered boat
owners reported having taken such courses.
Almost 59% of respondents were employed full-time. Relatively few respondents reported
being in part-time employment or being unemployed (6% and 4.4% respectively across the
whole state). Just over 30% of boaters were retired.

Massachusetts Recreational Boater Survey 2010 - Final Report 8 June 22, 2011
4.4 Boating Activity
During the peak of the boating season (July and August) between 93% and 95% of visits to a
boat included taking it out on the water. In May, this figure was under 74% and was down to
62% in October. Overall, almost 16% of vessel visits did not involve an on-water trip.
On average, boaters went out on the water on their boat on 7.5 and 7.8 days respectively in
July and August. As expected, this number was lowest at the beginning and end of the season.
If they visited their boat at all in a month, the average number of days per month that boaters
went out on the water was six. Documented boat owners appeared to go out on the water
more often than other boaters (7.6 days per month).
Almost 72% of trips by Western Massachusetts boaters and 60% of trips by Central
Massachusetts boaters involved trailering their boat. This compares with between 28% and
32% of boaters from the three coastal regions. No owners of documented boats reported
trailering them.
The vast majority of trailered trips (80%) originated at the boater’s permanent home with just
under 11% starting at a second home.
Overall, less than 36% of boaters who trailered their boat reported that they had paid a launch
fee or a parking fee associated with launching it from a ramp. This number rose to almost
47% of boaters from Western Massachusetts and 65% of boaters from Central Massachusetts
who trailered their boats.
The average reported launch fee or parking fee associated with launching a boat from a ramp
was $13.94 per trip and ranged from an average of $8.55 to $17.27 depending on the region.
Boaters were asked to report which activities they engaged in on a specific trip each month.
The most popular activities were cruising (over 67%), entertaining friends and family (almost
48%) and fishing (just over 38%).
The majority of activities were more popular during the months of July and August (i.e.
cruising, entertaining, whale watching, scuba diving/snorkeling, general sightseeing,
swimming and waterskiing).
The average number of hours that a boat was under power or sail during the 2010 boating
season was 72.1 hours based on information from 413 boaters. Documented boaters
averaged 178 hours under power or sail. The Northeast and East Central regions were the
next highest, with averages of 64.7 and 62.7 hours respectively. The Southeast had an
average of 50.9 hours. Central and Western Massachusetts were the lowest two regions.

Massachusetts Recreational Boater Survey 2010 - Final Report 9 June 22, 2011
The end-of-season survey asked boaters to report how they rated their boating activity during
the 2010 season as compared to other years. Over 53% of the 455 boaters who responded
said that it had been “somewhat less” to “much less” active than other years. Just over 17%
said that their season had been ”slightly more” to “much more” active compared than normal.
4.5 Economics
It is important to note that by several measures the Massachusetts economy was just
starting to recover from the severe 2008-2009 recession at the time of our survey and thus
the estimates of recreational spending are likely to be below what they would normally be
for a more robust period. Recreational spending is highly discretionary and likely to be one
of the first areas to feel recessionary pressures and one of the last areas to recover.
Based on the data gathered during this study, coastal and ocean recreational boaters in
Massachusetts spent, on average, $529 million on products and/or services of Massachusetts
businesses.
In-state spending by these boat owners took place in a variety of sectors. The highest trip-
related levels of spending were on boat fuel and transient/guest dockage. The highest levels
of non-trip-related spending were on seasonal dockage, mooring and storage; and routine
maintenance.
Another important contribution related to the spending of recreational boaters is the
employment supported by that spending within the state. The $529 million of spending by
coastal and ocean recreational boaters supported over 4,730 fulltime-equivalent jobs within
the state. As this study did not capture spending by out-of-state boaters, this is likely to be an
underestimation.
The total economic contribution of coastal and ocean recreational boating expenditures to
Massachusetts in 2010 was at least almost $806 million.
This is a conservative estimate because it does not include any expenditure by out-of-
state boaters since it was not feasible to survey these visitors.
It also only reflects monthly coastal and ocean boating activity from May through
October in addition to yearly capital and maintenance expenditures.
In addition, as noted earlier, this survey was conducted just as Massachusetts was
coming out of a severe recession and thus overall expenditures are likely to be
considerably lower than during a more prosperous economic period.
As part of the end-of-season survey, over 79% of boaters reported that almost all their non-
trip-related spending (e.g. maintenance, storage, parts and equipment) had occurred in
Massachusetts.

Massachusetts Recreational Boater Survey 2010 - Final Report 10 June 22, 2011
Almost 50% of those who took an on-water trip, or simply visited their boat reported that
almost all of their trip-related spending occurred near where the boat was launched or
boarded. This is important economically as it could represent a significant boost to the local
economy if boaters are travelling to an area to launch or board their vessel and most of their
expenditure occurs near to that location.
As previously noted, the majority of boaters reported that their 2010 boating season had been
“somewhat less” to “much less” active than other years. Just over 17% said that their season
had been “slightly more” to “much more” active than normal.
4.6 Feedback
Those participants who had used the online mapping application were asked how easy they
felt the mapping application had been to use. Of the 258 boaters who responded, 73% felt
that the mapping application had been “somewhat easy” to “very easy” to use. Only 4.5% felt
that the application had been “very difficult” to use.
The boaters were also asked if they would be willing to participate in a similar boating survey
in the future. Of the 458 boaters who responded, over 88% reported that they would be
“somewhat willing” or “very willing” to participate.

Massachusetts Recreational Boater Survey 2010 - Final Report 11 June 22, 2011
5 METHODOLOGY The survey design was based partially on research conducted on behalf of the Florida Fish and Wildlife
Conservation Commission as part of Florida Boating Access Facilities Inventory and Economic Study
(myfwc.com/media/1162720/About_Econ_BAFI_Full_09.pdf or www.uhi.umb.edu/publications.htm).
This study was led by the Urban Harbors Institute and the economic impact assessment was developed
by Dr. Edward Mahoney of the Recreational Marine Research Center at Michigan State University. The
study conducted in Florida focused on the economic impact of trip-related spending in the state and
used an online mapping application to estimate actual, on-water boating activity. However, the
application was developed to gather purely economic information rather than spatial data.
In order to gather spatial data for this study, the team contracted with Ecotrust to develop a more
advanced online mapping application to capture information on the boaters’ routes and areas where
boaters engaged in specific activities (e.g. fishing, whale watching, etc.). The Ecotrust application was
based on previous work that they had done when developing their Open OceanMap spatial data
collection tool.
This study surveyed owners of recreational boats in Massachusetts, with a particular focus on the
frequency of trips taken in coastal waters, the routes taken, the purpose of the trip and the money
spent on the trip. Trips throughout the entire boating season (May through October) were of interest.
In addition, some details of the particular boat owned and some additional information on expenses of
owning a boat (such as repair costs, marina costs, off-season storage costs, etc.) were also of interest.
Due to the diverse and extensive amount of information required, the data could not be gathered
through a single survey, but rather a series of surveys was needed. Once boaters had agreed to
participate, a short initial survey was e-mailed to obtain current information about the boat owned and
demographic information on the boat owner. Then, throughout the boating season, monthly surveys
were e-mailed asking the participating boaters to describe their boating activity in the previous month
and, more specifically the last boating trip that they had undertaken during that month. If boaters had
been asked to report on any trip they had taken in a given month, they would probably have reported
on the longest, most fun or most memorable trip. This would have biased the responses. In order to
account for this, boaters were asked to report specifically on the last trip that they had taken in each
month. This is a common practice in survey design.
Reporting months were originally considered the five months of May through September. Later, a sixth
month (October) was added. Finally, an end-of-season survey was designed to gather information on
general expenses relating to owning the boat. An additional feedback survey was included with the
end-of-season survey to gather views, comments and criticism of the overall survey process. Therefore,
the overall study consisted of a series of nine separate surveys – an initial survey, six monthly surveys,
an end-of-season survey, and the feedback survey.

Massachusetts Recreational Boater Survey 2010 - Final Report 12 June 22, 2011
To thank boaters for their time and encourage participation throughout the six-month period, each
month a random prize drawing was conducted so that one boater who filled out the survey that month
would be awarded $100 and another would receive a free night’s berthing at a marina or a free annual
Sea Tow membership. Monthly prizes were kindly donated by the Massachusetts Marine Trades
Association, Newburyport Marinas, Kingman Yacht Center and Sea Tow South Shore. In addition, at the
end of the study, one person would be randomly chosen to receive the grand prize of $1,000 (donated
by the Massachusetts Ocean Partnership). Each completed survey represented another entry into the
grand prize drawing, so the more surveys a boater completed, the greater the odds of them winning the
grand prize. It was hoped this would keep boaters interested and participating throughout the boating
season.
One of the most important pieces of information desired was to map the route taken by each boater
during the monthly trip they reported. A novel approach was considered in which boaters could actually
draw their trips using a web-based mapping application. This, of course, meant that the surveys and
maps had to be completed online. Therefore, a survey design was constructed in which the surveys
would be available on the web using a web-based survey application (Snap Survey Software). The survey
would then pass the respondent to the mapping application while also passing on needed information
from the survey. This was termed a “handoff.” Therefore, the monthly surveys began with an electronic
Snap survey, which asked questions about boat-related activity during the previous month, as well as
details of the boater’s last on-water trip during that month. Then after answering these questions, the
respondent would be passed directly to the mapping application to plot the actual route taken and
areas where they had engaged in boating-related activities. In the end, the route and activity area data
could be matched with the information from the Snap survey about the trip. An entire web-based
survey design was therefore imperative for conducting all surveys. It took a great deal of development
effort to have the entire process run smoothly for respondents and to get all information required to be
passed from the survey to the mapping software. In the end, a virtual seamless handoff was achieved.
5.1 Boat Ownership Data
This study was based on being able to survey a representative sample of Massachusetts boaters and
then being able to scale up the information provided so that statewide estimates could be calculated. In
order to be able to implement such a methodology, it was critical that there was information available
on what the boating population was and how to contact them. It was also important to have additional
details that allowed for this population to be stratified (i.e. broken down into sub-categories) for
analysis.
There was no existing source of information on who engaged in recreational boating in Massachusetts
but there was available information on who owned a boat. It was therefore possible to design a
sampling strategy based on the boats in the state, rather than on those who participate in recreational
boating.

Massachusetts Recreational Boater Survey 2010 - Final Report 13 June 22, 2011
There were two primary sources of information on boat ownership in Massachusetts – the state’s boat
registration database managed by the Massachusetts Environmental Police (MEP) and the United States
Coast Guard’s (USCG) database of federally documented vessels. It is important to note that in
Massachusetts, a vessel documented with the USCG is exempt from state registration so should not
have appeared in both databases.
5.1.1 Massachusetts Registered Boats
In Massachusetts, “any vessel…. propelled or designed to be propelled by machinery, whether or not such
machinery is permanently or temporarily affixed or is the principal source of propulsion” (MGL Chapter
90B, Section 36A) must be registered with the MEP. This had previously applied only to vessels of
fourteen feet or greater but this was amended to include any vessel that could be mechanically
propelled. This regulation states that the only exemptions to this are “a vessel which has a valid marine
document issued by the Bureau of Customs of the United States government or any federal agency
successor thereto” (e.g. a USCG documented vessel) or a vessel that is registered in another state that is
being used in Massachusetts for less than 60 consecutive days.
Massachusetts boat registration requires information such as:
Name and address;
Length of vessel;
Mooring or storage location;
Primary use (pleasure, commercial fishing, government, livery or enforcement);
Type (open boat, cabin cruiser, personal water craft, sailboat or other);
Hull material (aluminum, fiberglass, inflatable, plastic, steel or wood);
Engine type (inboard, outboard, inboard/outboard [or sterndrive], electric, jetdrive or other);
and
Fuel type (gas or diesel).
This information allowed for any sample to be stratified (e.g. by size) and meant that letters asking
boaters to participate could be addressed directly to the owner. As regular registration renewal is
required by law every two years, it was likely that contact information would be reasonably up-to-date.
5.1.2 US Coast Guard (USCG) Documented Vessels
The USCG’s database of documented vessels is maintained by the National Vessel Documentation
Center. The center’s website states that documentation “provides conclusive evidence of nationality for
international purposes, provides for unhindered commerce between the states, and admits vessels to
certain restricted trades, such as coastwise trade and the fisheries”
(www.uscg.mil/hq/cg5/nvdc/nvdcfaq.asp#01).
In general, for a vessel to be documented it must measure at least five net tons and be wholly owned by
a citizen of the US. Documentation is required for such vessels that are “used in fishing activities on

Massachusetts Recreational Boater Survey 2010 - Final Report 14 June 22, 2011
navigable waters of the US or in the Exclusive Economic Zone (EEZ), or used in coastwise trade….“
(www.uscg.mil/hq/cg5/nvdc/nvdcfaq.asp#01).
USCG documentation is not required for purely recreational vessels. However, a vessel that is
documented rather than state-registered is often viewed by mortgage lenders as a more secure form of
collateral insofar as it allows a first preferred ship’s mortgage to be recorded which is widely recognized.
A certificate of documentation can often facilitate the customs process in foreign ports as it clearly
identifies the nationality of the vessel. In Massachusetts a documented vessel does not need to be
state-registered so a boater need only pay one fee ($100 every two years to state-register a vessel of 40
feet or greater in Massachusetts, compared to an initial fee of $133 to document the vessel with the
USCG with no fees associated with annual renewal). Documented vessels are not exempt from
Massachusetts sales tax so this is not a factor when a Massachusetts boater is deciding between
registering their boat and getting it documented.
The documented vessel database contains information such as the:
Name and address of the “managing owner”;
Length of vessel;
Hailing port – it is important to note that the choice of hailing port is not restricted to where the
owner lives or where the vessel is kept;
Primary service (i.e. use) which includes “recreational”; and
Hull type (wood, steel, fibrous reinforced plastic, aluminum, concrete or other).
Due to the limited information contained in the documented vessel database compared to the state
data, these types of vessels are less easy to stratify and were kept as a separate “class” in this study.
5.1.3 Acquiring the Databases
Both the Massachusetts database of registered boats and the database of USCG documented vessels are
public record. In fact, it is possible to search for details of documented vessels using a number of online
search tools. However, these generally only allow you to search by owner or vessel name. It is also
possible to request specific information by contacting the MEP or the USCG’s National Vessel
Documentation Center. Obviously private information such as social security numbers would be
removed from any data that were provided.
It is important to note that the availability of boat registration data varies from state to state and what
may be available today may be restricted tomorrow. It is also important to note that obtaining such
data may take several months.
For this study, initial efforts to acquire the necessary vessel and owner information were made at both a
state and federal level. However, it became clear that the request of the USCG’s data would likely take
several months to process and that there was no clear system in place at a state level for this data to be
distributed. Due to the limited time available in which to initiate this study in time to capture boating

Massachusetts Recreational Boater Survey 2010 - Final Report 15 June 22, 2011
activity during the state’s 2010 boating season, other avenues were explored. Based on the knowledge
and connections of those involved in the study, it was possible to obtain a Microsoft Access database
containing the state boat registration as of October 2009 and a Microsoft Excel spreadsheet containing
the results of a search of the documented vessel database. The documented vessel database search
results contained information on all documented vessels with an owner address or hailing port in
Massachusetts that had “recreational” listed as its primary service (i.e. primary use).
5.1.4 Description of the “Population”
The database of Massachusetts registered boats as of October 2009 contained records on 145,105
vessels (Table 1). As this study was focused on recreational use, it was envisaged that only registered
boats with a “pleasure” primary use type would be included in the population of registered boats.
However, discussions with the advisory group and others suggested that many of those vessels classified
as “commercial fishing” might also be used for recreational purposes. It was therefore decided to
exclude only those boats listed as “commercial passenger,” “livery” or “other” from the population of
registered boats. This left 143,507 registered “pleasure” or “commercial fishing” boats (i.e. 98.9% of all
vessels in the original database).
Table 1: Breakdown of all boats in the database of registered boats by primary use type.
Vessel Type Number %
Pleasure 141,461 97.5%
Commercia l Fishing 2,046 1.4%
Commercia l Passenger 144 0.1%
Livery 378 0.3%
Other 1,076 0.7%
TOTAL 145,105
The majority of the registered vessels were between 16 and 26 feet in length (53.6%) with 40.2% of
registered boats being less than 16 feet. Only 0.2% of registered boats were 40 feet or over (Table 2).
This differed significantly from the size breakdown of the documented boats (Figure 1).
A total of 11,824 vessels were taken from the US Coast Guard database of documented vessels. These
consisted of all vessels with an owner address or hailing port in Massachusetts that had “recreational”
listed as its primary service (i.e. primary use). Almost 19% of documented vessels were 40 feet or over
in length and 78.5% were between 26 and 40 feet. Only 2.7% of documented vessels were listed as
being less than 26 feet in length (Table 3).

Massachusetts Recreational Boater Survey 2010 - Final Report 16 June 22, 2011
Table 2: Breakdown of pleasure and commercial fishing boats in the database of registered boats by size
class.
Boat Length (ft) Number %
Less than 16 57,624 40.2%
16 to <26 76,881 53.6%
26 to <40 8,700 6.1%
40+ 302 0.2%
TOTAL 143,507
0.0% 0.0% 2.7%
78.5%
18.8%
Missing Less than 16 16 to <26 26 to <40 40+
40.2%
53.6%
6.1%
0.2%
Missing Less than 16 16 to <26 26 to <40 40+
Figure 1: Breakdown of the population of documented (left) and registered vessels by size class.
Table 3: Breakdown of documented boats by size class.
Boat Length (ft) Number %
Miss ing 3 0.0%
Less than 16 1 0.0%
16 to <26 314 2.7%
26 to <40 9,278 78.5%
40+ 2,228 18.8%
TOTAL 11,824
Limited information was available about the types of documented vessels but the registered boat
database did contain such information. As Table 4 shows, 112,436 (78.3%) of the 143,507 registered
boats were open boats and most of these were less than 26 feet in length (Figure 2). Cabin cruisers
made up 9.4% of registered boats and were more commonly found in the larger size classes (26+ feet).
Sailboats made up a small percent of boats under 26 feet. However, small boats that are not designed

Massachusetts Recreational Boater Survey 2010 - Final Report 17 June 22, 2011
to be fitted with an engine do not have to be registered so small sailboats may have been under
represented in the registered boat database. Almost all personal watercraft (PWC) were less than 16
feet in length. While five PWC were classed as being over 26 feet in length, it is thought that these were
most likely due to boater reporting or data entry errors.
Table 4: Breakdown of pleasure and commercial fishing boats in the database of registered boats by size
class and vessel type.
Less than 16 16 to <26 26 to <40 40+
Cabin Cruiser 13 8,738 4,534 168 13,453
Open Boat 47,586 62,590 2,207 53 112,436
PWC 8,425 45 4 1 8,475
Sa i lboat 598 3,555 1,658 42 5,853
Other 1,002 1,953 297 38 3,290
TOTAL 57,624 76,881 8,700 302 143,507
Boat Length (ft)Type TOTAL
-
20,000
40,000
60,000
80,000
100,000
120,000
Cabin Cruiser Open Boat PWC Sailboat Other
Nu
mb
er
of R
egi
ste
red
Bo
ats
Boat Type
Less than 16 ft 16 to 26 ft 26 to 40 ft 40+ ft
Figure 2: Number of pleasure and commercial fishing boats in the database of registered boats by type
and size class.

Massachusetts Recreational Boater Survey 2010 - Final Report 18 June 22, 2011
The majority (64.2%) of registered boats were powered by outboard engines with a further 12.2% being
propelled by inboard/outboard drives (sterndrives). Vessels with jetdrives accounted for 5.5% of the
pleasure and commercial fishing boats in the registered boat database and 87.9% of these vessels were
PWCs. Boats powered by inboard engines only accounted for 5.3% of the vessels in the database (Table
5).
Table 5: Breakdown of pleasure and commercial fishing boats in the database of registered boats by
propulsion type.
Propulsion Type Number %
Outboard 92,085 64.2%
Inboard/Outboard (Sterndrive) 17,442 12.2%
Jetdrive 7,945 5.5%
Inboard 7,543 5.3%
Electric 4,096 2.9%
Airboat 24 0.0%
Other 927 0.6%
No data 13,445 9.4%
TOTAL 143,507
The vast majority of boats (82.8%) in the registered boat database used gas-powered motors. Only 1.5%
of the vessels were diesel powered (Table 6).
Table 6: Breakdown of pleasure and commercial fishing boats in the database of registered boats by fuel
type.
Fuel Type Number %
Gas 118,890 82.8%
Diesel 2,221 1.5%
Other 8,951 6.2%
No data 13,445 9.4%
TOTAL 143,507
The most common hull materials for registered boats were fiberglass (65.7%) and aluminum (22%). A
further 6.2% were inflatables (Table 7). It is likely that many of these 8,962 inflatables were used as
tenders to access larger boats, as 98.7% of them were less than 16 feet in length. In fact, 49% of them
were less than 10 feet in length.

Massachusetts Recreational Boater Survey 2010 - Final Report 19 June 22, 2011
Table 7: Breakdown of pleasure and commercial fishing boats in the database of registered boats by hull
material.
Hull Material Number %
Fiberglass 94,350 65.7%
Aluminum 31,574 22.0%
Inflatable 8,962 6.2%
Plastic 3,875 2.7%
Wood 2,557 1.8%
Steel 119 0.1%
Other 2,070 1.4%
TOTAL 143,507
5.1.5 Strengths and Weaknesses of the Datasets
It is important to remember that this study used both the database of registered boaters and the
documented vessel database for purposes for which they were not designed. However, these datasets
were invaluable for estimating the population of boats in Massachusetts and providing sufficient
information (particularly for the registered boats) to allow for a stratified sampling to be undertaken.
Probably the greatest strength of these datasets was the apparent accuracy of the contact information
for the vessel owners as less than 5.4% of the initial letters mailed to the sample of boat owners were
returned as undeliverable. This may be explained by the fact that the information relating to
documented vessels must be verified annually and boat registration in Massachusetts must be renewed
every two years.
Both databases contain information on the size of vessels and hull material and the database of
registered boats contains additional vessel information (as discussed previously). As part of the study,
the participants were provided with the initial survey, which was pre-populated with information about
their vessel using the two databases. They were asked to correct any incorrect information. Figure 3
clearly shows that the majority of the information contained in the databases was verified by the boat
owners themselves as being correct. A small number of corrections that were made appeared to be
inconsistent with other information that existed about the vessel. These were flagged as possible
correction errors although they were retained for this initial analysis.
As vessel documentation is a national form of registration dating back to the 11th Act of the First
Congress, suggesting changes to the process is beyond the scope of this study. However, implementing
minor changes to the Massachusetts boat registration process could dramatically increase the value of
the resulting database for research purposes, and may be possible for a couple of reasons:

Massachusetts Recreational Boater Survey 2010 - Final Report 20 June 22, 2011
1. The Massachusetts Environmental Police (MEP) is part of the Executive Office of Energy and
Environmental Affairs (EEA), which was one of the driving forces behind the implementation of
this study. As the state’s boat registration falls under the jurisdiction of the MEP, intra-agency
coordination may facilitate making changes to the registration process.
2. The MEP has recently started to offer online boat registration and renewal, which would
facilitate electronic information gathering.
90.0%97.7% 97.2%
86.5% 89.4%
0%
10%
20%
30%
40%
50%
60%
70%
80%
90%
100%
Vessel Type Size Class Hull Material Engine Type Fuel Type
No Change Data Corrected Correction Error?
Figure 3: The percent of types of vessel information deemed correct by vessel owners.
If a few additional pieces of information were gathered during the boat registration process, the
resulting database could be greatly enhanced as a tool to target more accurately this type of study and
other research. Additional valuable information might include:
A current, valid e-mail address.
A valid e-mail address greatly enhances the ability to conduct surveys and greatly reduces the
costs of doing so. Online registration could require a valid e-mail address and printed forms
could ask for this information. While not all boaters have e-mail addresses or even use
computers, less than 6% of otherwise-eligible boaters had to be rejected from this study
because they did not provide a valid e-mail address
Whether the boat is used exclusively on freshwater versus saltwater use.
Since this study was focused on coastal and ocean recreational boat use, identifying those boats
that are used only on freshwater would allow for more targeted sampling for future studies.

Massachusetts Recreational Boater Survey 2010 - Final Report 21 June 22, 2011
Whether the boat is used exclusively for commercial purposes.
While the boat registration form asks the boater to check a box to indicate what the boat is used
for, this use type cannot be assumed to be exclusive. For example, commercial fishing boats can
be used for recreational purposes and recreational boats can be used for charter fishing, as long
as they comply with US Coast Guard safety regulations and are operated by suitably licensed
captains. Identifying those boats that are used only for non-recreational uses would again allow
for more targeted sampling for future studies.
Whether the boat is used exclusively as a tender.
Massachusetts law requires that all vessels that are propelled by, or designed to be propelled
by, machinery be registered with the MEP. One result of this is that over 40% of the 143,507
pleasure and commercial fishing boats in the database as of October 2009 were less than 16
feet in length (see Table 2) and almost 11% were 10 feet or less in length. While this study was
interested in all boating activity, the focus was on coastal and ocean boating. Therefore, being
able to identify those small boats that were only ever used as tenders (e.g. to get to and from a
larger boat kept on a mooring) would allow this type of boat to either be excluded from the
sample or to be under sampled. More resources could then be focused on the vessel types of
greater interest.
Greater details about where the boat is kept.
The boat registration form currently asks for the mooring/storage location. While this is
important information, it would be of greater value if details of the town, type of storage (e.g.
mooring, berth, trailer) and type of facility (e.g. marina, residence) at which the boat is generally
kept both in and out of season were gathered. This information would allow for sampling
strategies to be stratified more accurately based on geographic location.
If the boat is ever used for recreational fishing.
While this study aimed to fill in data gaps associated with recreational boating, there is general
agreement that similar gaps exist with regards to recreational fishing. Massachusetts is
currently implementing a federally-mandated saltwater fishing license, which will help fill in
some of these gaps. However, if a study similar to this one were to be designed to look at boat-
related recreational fishing, having this piece of information would allow for a much more
focused sampling effort.
There are two categories of vessels that may be missing from, or under-represented in these databases:
1. Non-motorized vessels that are not required to be registered in Massachusetts. These would
include canoes and kayaks and some (most likely smaller) sailboats. For this study, this was not
a significant issue as canoes and kayaks were not the primary focus of the research and small
sailboats are generally used in nearshore waters.

Massachusetts Recreational Boater Survey 2010 - Final Report 22 June 22, 2011
2. The second category is of greater significance. The waters of Massachusetts are extremely
popular with out-of-state boaters. Some boaters are day-trippers who simply pass through the
waters of the state, while others are larger vessels that might spend several weeks in
Massachusetts and may have a significant impact on the local economy. At present, the number
of out-of-state boaters using the state’s waters and their economic impact remains almost
entirely unknown. While this type of boating activity was not the focus of this study, some
initial datasets were investigated and one possible methodology was piloted on a very small
scale.
5.2 Survey Design
As the sampling strategy was based on the boats in the two databases, it was important that boaters
were reminded to report activity and spending associated with the specific, randomly selected vessel
and not with any other boats they might own. To that end, each survey stressed that the respondent
should answer based on a specific vessel, and was customized to include the type and size of the
particular vessel of interest.
5.2.1 Surveys
The overall study consisted of a recruitment survey followed by a series of nine separate surveys – an
initial survey, six monthly surveys, an end-of-season survey, and the feedback survey (Table 8).
The surveys can be found in Appendix B. Please note that all but the recruitment survey were only
available as online Snap surveys – the paper versions in the appendix were created solely for this report.
Due to time and budget constraints, a complete survey design protocol was not possible for this study.
Such a design would have required a number of focus groups of boat owners, some cognitive interviews
(conducted with boat owners using early drafts of the surveys to see how they interpret the questions)
and finally a small pilot survey. None of these were possible due to a lack of time for survey preparation
and a lack of resources to pay for these efforts. However, the expertise of the advisory group and their
contacts in the boating community helped to somewhat overcome the time and budgetary constraints.
In light of this, the survey design effort involved the following steps:
1. Draft questions were proposed by the Urban Harbors Institute (UHI) and the Massachusetts
Ocean Partnership (MOP). Many of these were adapted from those used during the 2009
Florida Boating Access Facilities Inventory and Economic Study (as developed by Dr. Edward
Mahoney Recreational of the Marine Research Center at Michigan State University) with
additional input from the advisory group.
2. The Center for Survey Research (CSR) made comments on these questions and offered
suggestions and alternatives.
3. A number of team meetings were held so that issues could be resolved and wording finalized.
4. CSR then formatted the questions as they should appear in a survey and on the web.

Massachusetts Recreational Boater Survey 2010 - Final Report 23 June 22, 2011
5. The questions were then used with volunteer boat owners and with other stakeholders to get
additional input.
6. CSR, UHI and MOP then met to go over the issues raised by the test volunteers and to resolve as
many as possible.
7. CSR created a final survey version.
8. UHI and MOP then signed-off on the final version to be used.
Table 8: Description of the surveys that were sent to boat owners.
3a. Monthly
Survey
3b. Mapping
Component
Delivery
Method
Mail E-mai l E-mai l Redirected
from survey
E-mai l E-mai l
Recipients Sample of
owners of
recreational
boats in MA.
Al l eligible boat
owners
Al l eligible boat
owners
Al l eligible boat
owners who
took their boat
out on the water
Al l eligible boat
owners
Al l eligible boat
owners
Aim To encourage
boaters to
become
potentia l
participants in
the MA
Recreational
Boater Survey
2010 and a l low
for inel igble
participates to
be identi fied
To gather bas ic
demographic
information on
the boaters
and detai ls
about the
speci fic boat of
interest
To gather data
about the
boaters activi ty
and spending
associated
with use of the
speci fic boats
of interest
during each
month with
more detai led
information
about the last
time that they
vis i ted or used
the boats
To gather
spatia l data
about the
boaters activi ty
during the last
on-water trip
that they took
on their boats
To gather data
about the
boaters annual
activi ty and
capita l
expenditure
relating to the
speci fic boats
To gather
feedback from
boaters to be
used to
improve future
s tudies
Ineligible
Participants
Those who:
no longer
owned the
boat of
interest;
used i t
exclus ivley on
freshwater;
used i t
exclus ively for
commercia l
purposes ; or
who did not
have a va l id e-
mai l address
Those who no
longer owned
the boat of
interest
Those who did
not take their
boat out on the
water during
the month
MONTHLY SURVEYS
(May through October)1. Recruitment
Survey2. Initial Survey
4. End-of-season
Survey
5. Feedback
Survey

Massachusetts Recreational Boater Survey 2010 - Final Report 24 June 22, 2011
This process led to useful exchanges and input from a wide variety of interested and knowledgeable
people. Although not a formal systematic approach for question development, it did serve as a good
proxy considering time and resources. The surveys were much improved as a result.
Recruitment Survey
A recruitment package was mailed out to a sample of 10,000 boaters from the combined registered and
documented boaters on May 6, 2010. The package contained information about the study and a
recruitment survey to be filled out by boaters who were interested in participating. This was the only
survey that was sent in the mail; all the subsequent ones were distributed via e-mail linking the
participant to the current, online survey.
As the sampling was based on the vessel rather than the boater, it was important to ensure that the
boater was answering questions about the selected vessel and not another that they might own. To this
end, the recruitment surveys were customized using a mail merge to include the type, size and
registration/documentation number of the specific vessel of interest. So rather than a question asking:
Does your boat have a name?
It asked (for example):
Does your 22-foot Boston Whaler #MS1234AB have a name?
The main aim of the recruitment survey was to encourage boaters to agree to participate and to ensure
that they provided e-mail addresses for future communication. The survey also contained a number of
questions that could be used to determine if a boater was eligible to participate:
Do you currently own a [boat size, make and number]?
As the sampling was based on vessel rather than boater, clearly nobody could remain eligible if
they no longer owned the specific boat. Additionally, some respondents entered comments
such as “Haven’t used it in years and am trying to sell it.” These too were deemed ineligible. In
a couple of instances, a boater had sold the selected vessel and replaced it with another one of
similar size and type. While it may have been possible to include them, it was felt that it would
be impractical based on the compressed timeline.
Do you use your [boat size, make and number] exclusively on freshwater (rivers or lakes)?
While freshwater boating is of great importance in Massachusetts, it had been decided that such
activity was beyond the scope of this study. Therefore, boaters who used their vessels
exclusively in freshwater were deemed ineligible.
Do you use your [boat size, make and number] exclusively for non-recreational purposes (e.g. as
a charter fishing or commercial fishing vessel)?
The focus of this study was on recreational boating in Massachusetts. However, even if a vessel
was classed as “commercial fishing” in the state’s boat registration database, it could also be

Massachusetts Recreational Boater Survey 2010 - Final Report 25 June 22, 2011
used for recreational excursions. Therefore, this question allowed for those vessels that were
never used for recreational purposes to be deemed ineligible.
The survey also included some questions about what other vessels the boater might own. These were
included in an effort to gather some information on boaters who own multiple vessels and in particular,
private ownership of watercraft such as canoes and kayaks that do not have to be registered in
Massachusetts.
Initial Survey
Once boaters had agreed to participate and were deemed eligible (i.e. still owned the boat of interest,
used it on coastal or ocean waters and used it for recreational purposes), they were asked to complete
an initial survey verifying the details of their vessel and to provide some basic demographic and personal
information.
This survey provided an opportunity for registered boat owners to verify or correct the information
extracted from the state’s database of registered boats and for owners of documented vessels to
provide information not contained in the US Coast Guard’s database.
The survey also asked for details on the type of facility at which the vessel was stored (e.g. commercial
marina, private club, municipal facility, private residence) and how it was stored (e.g. at a berth, on a
mooring, in a dry stack/rack, on a trailer) both during and out of season.
In addition, the boaters were asked some basic demographic information: sex, age, employment status
and household income. They were also asked how long they had been a boater, how long they had
owned a boat and whether they had taken any boating safety or navigation courses.
It was useful to have boaters complete this survey prior to completing the monthly boating activity
surveys because it allowed:
For the testing of the system that notified participants that a survey was available and linked
them their customized survey;
The team to identify “bad” e-mail addresses and attempt to correct them; and
The participants to experience filling in a relatively simple online Snap survey before being asked
to attempt the longer, more in-depth monthly surveys.
Monthly Boating Activity
During the 2010 boating season, participating boaters were sent an e-mail at the beginning of the month
that contained a link to take them to their customized online monthly survey. This prompted them to
report on any activity that they had engaged in the previous month associated with the selected boat.
Boaters were reminded to only report on the selected vessel and the survey was customized with the
boat type and length (e.g. 22-foot Boston Whaler).
In each month, the first question determined if participants still owned the vessel. If so, they were then
asked to report the number of days during the previous month they had visited the boat and the

Massachusetts Recreational Boater Survey 2010 - Final Report 26 June 22, 2011
number of nights they had stayed on board. They were also asked how many times they had actually
taken their boat out on the water and how many nights they had been away from their normal berthing
or mooring location.
This study differentiated between a “visit” where a boater was at or on their boat but did not go out on
the water, and a “trip” where the boater went out on the water in their vessel. The reason this was
important was that the advisory group and others associated with recreational boating had suggested
that there is a significant amount of boat-related activity and spending that is not associated with actual
on-water trips.
Boaters who did not take on-water trips but who had visited their boat during the previous month were
then asked to provide some information about the last time in that month that they had visited their
boat. They were asked to provide information about whether it was a day or overnight visit and, if it
were the latter, how many nights they had spent visiting their vessel. They were then asked to report
their estimated expenditure associated with this visit in the following categories:
Boat fuel and oil;
Transient/guest dockage (marina fee);
Launch fees;
Pumpout fees;
Restaurant meals & drinks (including take-out food & drinks);
Groceries;
Auto gas and oil;
Shopping and souvenirs;
Recreation and entertainment;
Lodging (hotel / motel);
Lodging (camping / B&B);
Fishing gear, bait, ice, etc.; and
Other
Finally, they were asked to estimate what percentage of this expenditure had occurred “near to” where
their boat was berthed or moored. The team acknowledges that the term “near to” was somewhat
vague but, after considerable discussion, it was decided that using pre-defined geographic boundaries
(such as counties or municipalities) or a specific distance (e.g. within 20 miles) could be problematic as:
Massachusetts residents do not generally think in terms of counties;
Municipal boundaries are not always clear, and boaters may not be sure in which municipality
they spent money;
Residents frequently use unofficial names for municipalities. For example, Dorchester and
Roxbury are not municipalities but rather are neighborhoods within the City of Boston. People

Massachusetts Recreational Boater Survey 2010 - Final Report 27 June 22, 2011
also may report that they live in East, West or North Falmouth, or even Falmouth Heights or
Woods Hole but these are all part of the Town of Falmouth. The use of dropdown menus in the
survey was considered but with 351 municipalities in Massachusetts this would have been
impractical; and
Using a pre-defined distance would frequently cross municipal (or county) boundaries and it
would be difficult to determine if the boater was reporting “within 20 miles” by road or “as the
crow flies.”
Boaters who reported that they had engaged in an on-water trip were asked similar spending questions
regarding their last on-water trip of the month. In addition to the spending questions, boaters were
asked to report:
The number of people who accompanied them on the trip;
Whether or not they trailered their boat; and if so where from what type of location (e.g.
residence, marina or dry stack facility, commercial storage facility) and what fees were
associated with trailering;
What activities they engaged in during their on-water trip. These included:
Cruising
Entertaining family / friends
Fishing or shellfishing
Hunting
Whale watching
Bird watching
Racing
Sailing
Scuba diving / snorkeling
Sightseeing
Swimming
Waterskiing / wakeboarding
Whether the trip occurred on a public holiday (Memorial Day, 4th of July or Labor Day); and
Whether the trip was taken for something other than purely recreational purposes.
Mapping Component
Boaters who had undertaken an on-water trip were then automatically linked to the online mapping
application. This application allowed them to plot the approximate route of the trip that they had just
reported on and the reason that they had chosen the route. They were then asked to identify areas

Massachusetts Recreational Boater Survey 2010 - Final Report 28 June 22, 2011
where they had engaged in specific activities and to provide information as to what they might have
done if they had not been able to engage in that activity at that specific location. The routes were
captured as lines (polylines) and activity area information was captured as polygons. These, and the
attributes associated with them, could be directly imported into a geographic information system (GIS)
to create aggregate maps.
The online mapping application started by providing some instructional material (with the ability to
open instructions at any time). An online tutorial video was also created to provide additional guidance.
The boaters were asked to plot the routes they had taken during their reported on-water trips. Once
they were satisfied with the routes, they were saved and the boaters were asked which factors were
important when they selected these routes. Options included:
Quickest route to my destination;
I am very familiar with this route;
Safest route to my destination;
Challenging navigation;
Calm waters;
Scenic beauty;
Tranquility;
Absence of other boaters;
Presence of other boaters;
Avoid speed zones;
Access to shoreside facilities/entertainment;
Access to fuel, marina, mooring, etc.;
None of the above. I was just cruising; and
Other.
The boaters were then given the option to map areas where they engaged in specific activities. They
were directed to draw a series of areas (polygons) on the map and for each they could identify the
activity that they engaged in. The options were the same as those offered for the on-water trip
activities but also included “land-based activities” and “other.”
For each activity area, they were asked to report how long they engaged in the activity at that location
and how they ranked the activity compared to other areas in Massachusetts where they had also
engaged in this activity. For each activity, they were asked why they chose the specific location.
Reasons included:

Massachusetts Recreational Boater Survey 2010 - Final Report 29 June 22, 2011
Area reached quickly and/or easily;
I am very familiar with the area;
Calm waters;
Protected waters;
Clean and/or clear waters;
Wildlife viewing opportunities;
Scenic beauty;
Tranquility;
Absence of other boaters;
Presence of other boaters;
Fishing opportunities;
Swimming opportunities;
Natural or undeveloped shoreline;
Access to shoreside facilities/entertainment;
Access fuel, marina, mooring, etc.;
No specific reason; and
Other.
After defining an activity area, the boaters were asked what they might have done if they had not been
able to engage in their activity at their selected location. Options included:
Engaged in another activity at the same location. They were then asked to select from the same
list of activities offered when they first defined their activity areas.
Engaged in another boating activity at another location. They were then asked to select from
the same list of activities offered when they first defined their activity areas and then to draw
the “alternate” activity area.
Engaged in an activity not associated with recreational boating.
Stayed at home.
Other.
This completed the monthly boating activity information gathering.
End-of-season Survey
At the end of the season, the participating boaters were asked to report on additional, non-trip-related
expenditures. This final survey also asked them to estimate their level of boating activity in relation to
other years.

Massachusetts Recreational Boater Survey 2010 - Final Report 30 June 22, 2011
The end-of-season survey was developed largely to capture other expenditure associated with boat
ownership but not specifically related to boating visits or trips that boaters had incurred in the last 12
months. Such expenditures might include:
General maintenance;
Repairs (including parts and labor);
Purchase and installation of new products;
Purchase of boating equipment;
Loan payments;
Taxes;
Insurance;
Registration fees;
Mooring, berthing or marina fees; or
Winter storage costs.
Boaters were also asked to estimate what percentage of their overall, non-trip-related expenditure had
occurred within Massachusetts.
Finally the boaters were asked to estimate the amount of time they spent under power or under sail
during the 2010 boating season and to rate their level of boating activity compared to other years (much
less active than other years; slightly less active; similar to other years etc.).
Feedback Survey
Once boaters had completed the end-of-season survey, they were presented a feedback survey. This
provided an opportunity to comment on the overall survey process and in particular, on their experience
with the mapping application. Boaters were asked to provide thoughts and comments and were asked
if, in theory, they would be willing to participate in similar type surveys in the future.
5.2.2 Web-mapping Application
The web-mapping application was designed to provide the user with the ability to report the trip route
and trip-specific activities during the monthly study period (as defined by the survey component
described above). These spatial data were then indexed to allow cross-referencing to the Snap part of
the survey. For each trip, the boater was asked to map their entire trip by drawing a sequence of points
(polylines). Next, the boater was asked to demarcate areas of activity (e.g. fishing, swimming, water-
skiing) along the route by drawing one or more polygons (closed sequence of lines) bordering the area
of activity. Finally, the boater was asked several questions specific to the route and associated activity
areas.
Other design criteria for the web-mapping application were secure, confidential user access; and the
ability to capture and merge user identification information from the separate Snap survey component.

Massachusetts Recreational Boater Survey 2010 - Final Report 31 June 22, 2011
Development & Design of the Web-mapping Tool
The web-mapping tool was based on Open OceanMap, open-source software developed by Ecotrust for
the collection of marine spatial planning data on the US West Coast. Open OceanMap was originally
built as a desktop application, and recently evolved into a web-based GIS application. Initial discussions
with Ecotrust confirmed that the web-based Open OceanMap framework could be adapted to meet the
needs of the recreational boater survey, and Ecotrust was invited to be a part of the collaborative
development team.
Development of the boater survey application included the web-based graphical user interface client, a
spatial database, and the underlying physical infrastructure required to host these components and
provide web access to the user.
The user interface was designed to provide the user with a mapping tool and associated instructions
that would allow the user to draw routes and activity areas, and answer questions related to these
features. To meet these requirements, the flow diagram (Figure 4) provided below was created to
capture the logic required to provide the following mapping tools to the user:
Welcome and introduction;
Explanation of the mapping components including base layers, navigation and drawing tools;
Route drawing tools, including the ability to continue an unfinished route, edit the route, or
discard the route and redraw a new route;
Answer questions related to the route drawn (not shown below);
Activity area drawing tools, including the ability to continue an unfinished area, edit the area,
discard the area and redraw a new area, draw an alternate activity area, and to draw multiple
areas if desired; and
Answer questions related to the areas drawn.
During development of this flow diagram, wire-frame mockups of the user interface were also
developed to demonstrate visual layouts of the graphical user interface that would match the logic in
the flow diagram, and provide a functional and aesthetically pleasing interface for the user. After these
paper-based products were completed, application development began and evolved based on feedback
from both the technical team as well as the advisory group. Snapshots are provided below showing
samples of the final user interface (Figure 5).
An additional component of the user interface was the reference mapping required for the user to have
a familiar spatial context when plotting their route and activity areas. Primary reference maps included
NOAA charts, and two standard layers provided by Google: satellite imagery and terrain. Point locations
of boat ramps and marinas were also provided as relevant points of reference.

Massachusetts Recreational Boater Survey 2010 - Final Report 32 June 22, 2011
Figure 4: The flow diagram captures the logic required to provide the mapping tools to the user.
One significant advantage to selecting Open OceanMap as the starting point for the boater survey web-
based application was the existing successful development and implementation by Ecotrust of the web-
based Open OceanMap technology stack. As the Open OceanMap stack could be adapted to meet the
needs of the Massachusetts survey, it was possible to focus more intently on the development of the
graphic user interface. One of the many components that was not re-engineered for the boater survey
application was the spatial database: PostGreSQL/PostGIS. The selection of this database also allowed
for the web-based recreational boater survey application to be developed as an open-source tool as
requested by the Massachusetts Ocean Partnership.
Primary design considerations for the physical infrastructure to support the boater survey web-mapping
application included reliability and scalability. To meet these needs, cloud-based servers were specified
and Rackspace (www.rackspacecloud.com) was selected as the vendor. Details related to the
technology stack implemented for the boater application are discussed below.

Massachusetts Recreational Boater Survey 2010 - Final Report 33 June 22, 2011
Figure 5: Snapshots of the final recreational boater survey web-mapping application user interface: initial
instruction screen (top), route questions (middle) and activity area mapping (bottom).

Massachusetts Recreational Boater Survey 2010 - Final Report 34 June 22, 2011
Technical Specifications
The technology stack for the boater survey mapping tool included hardware and software infrastructure,
web-service scripting, and spatial database implementation.
Initial development activities occurred on a single, cloud-based server provided by Rackspace. Ubuntu
9.10 (Karmic Koala) Linux was selected as the operating system. Server specifications were initially set
to the minimum available; 256 MB memory and 10 GB storage. As development activities proceeded,
the server was scaled up on an as-needed basis. To meet the processing and content-delivery
requirements of the final application, server specifications were scaled to 4GB memory and 160GB
storage. Upon completion of development activities, the development server was cloned to create an
additional 4GB production server. During the survey period, both the development and production
server instances were active. After the survey was complete, the development server was scaled back
to 256 MB, and the production server to 512 MB. Both servers remain active for demonstration and
testing purposes only.
Technology Stack
The web-mapping application consisted of a browser client, a server-side survey manager and a
mapserver (Figure 6). Each of these integrated one or more free and open-source software components
to perform its functions, which will be described in more detail.
Browser Client
The browser client included the interactive user interface. OpenLayers provides the interactive
map capable of displaying custom data layers from the mapserver as well as supporting the
drawing and editing of vector features. The larger user interface including the question panels
and other interactive elements were developed using the ExtJS and GeoExt software products.
Survey Manager
The survey manager was developed using the GeoDjango web framework. It managed the state
of each ongoing survey, processed and validated all of the input and finally stored the survey
information in a geo-database. The PostGIS database management system was used for its
close integration with GeoDjango and its robust features for storing and processing spatial data
as well as tabular data collected during the survey.
Mapserver
Custom map tiles including nautical charts and boat ramps were styled and published using the
GeoServer software product and then cached using GeoWebCache. These tiles were then
transferred to CloudFiles to support efficient content delivery that scales to support a large
number of users accessing the tiles at the same time. OpenLayers then is capable of accessing
these map tiles and overlaying them on top of the Google and nautical chart base maps.

Massachusetts Recreational Boater Survey 2010 - Final Report 35 June 22, 2011
Figure 6: Illustration of the technology stack for the boater survey mapping tool.
Issues
Technical assistance was available through a dedicated telephone line and via e-mail. Based on
response to the boater survey helpdesk, most user issues were resolved by additional instructions
related to using the tools provided. Only one participant had difficulty accessing the mapping
application. However, that user did not respond to offers of assistance, which suggests that either the
user stopped responding to the survey, or that the problems were solved by the user.
The handoff from the Snap survey component was not entirely seamless. More rigorous interoperability
standards would likely have resolved this issue, but the rapid development timeframe did not allow
development of these protocols. These issues were resolved during post-processing of the spatial
datasets.
During the initial two months of survey, cursory data review suggested that users were “getting lost”
during the transfer between the two components. The boater survey mapping application was initially
designed to initiate a database record for the user only after the user progressed beyond the “welcome”
page. To resolve this issue, the application was re-programmed to initiate the database record upon the
user accessing the welcome page. Based on these new data, it was discovered that only a small
percentage of users were “getting lost,” and that the other portion of these “lost” users was instead
users who were accessing the welcome page and then (apparently) choosing not to proceed to the
mapping application.
Future activities related to development of boater survey application will be needed to package the
application as a deployable, open-source application. However, to the extent practicable, the

Massachusetts Recreational Boater Survey 2010 - Final Report 36 June 22, 2011
application development was performed such that the application is readily portable as a publically-
available toolkit when appropriate.
5.2.3 Testing
Due to the technology challenges of the study design, and in spite of the compressed timeline, the
complete survey was tested as rigorously as possible by team personnel. All test records were prefixed
with a “T” to ensure that test data could easily be purged from the database. A number of errors were
identified and corrected.
Once these issues had been addressed, further testing was undertaken by members of the advisory
group and by a panel of boaters. Team personnel participated in the boater tests but assumed an
observational role, as it was felt that it was important to see if boaters were able to understand what
was required and to navigate the mapping application based on the guidance provided. Testers were
encouraged to offer as many comments as possible. The online Snap survey was generally found to be
clear and easy to complete although a few wording changes were suggested to clarify some sections. In
general, the mapping application was also found to work correctly and its purpose was understandable.
However, some testers did find that it took a while to become familiar with the tools needed to map
routes and areas and that some aspects of navigating the maps could be improved.
A number of improvements were made to the mapping application based on feedback from the testers.
Additional improvements were identified but these were deemed less of a priority and were therefore
not implemented before the initial monthly surveys were sent. Some features, such as a demonstration
video, were added as an instructional aid in August, 2010.
Immediately prior to the first batch of monthly survey e-mails being sent, the full system was tested live
by team members including the handoff between the online Snap survey and the web-mapping
application during which key information needed to be passed from one to the other. This testing was
set up so that multiple team members were completing the survey and mapping at the same time in an
effort to test the server capabilities. Some problems were encountered and resolved. A final round of
testing revealed that the issues had been addressed and the first round of e-mails asking boaters to
report on their May boating activity were sent on June 9.
It should be noted that a conscious decision was made to try not to send out notices of monthly surveys
immediately prior to weekends so that personnel were available if technical issues arose.
5.3 Sample Design
The sample for this study came from two separate databases. The first was a state database of
registered boaters and the second was a US Coast Guard database of documented vessels. The
statewide registered boat database had 145,105 boats listed. The database included a field for “use
type” that allowed for those vessels that were unlikely to be used for recreational purposes to be
removed. These consisted of:144 “Commercial Passenger (C/P)” vessels that included Duck Tour boats,
water taxis etc.; 378 “Livery (LIV)” vessels, which were predominantly rental boats; and 1,076 “Other

Massachusetts Recreational Boater Survey 2010 - Final Report 37 June 22, 2011
(OTH)” boats which were a mix of things including sailing and boat club boats, marina operations boats,
school boats, research vessels etc. What remained were the “Pleasure (PLS)” boats and those with a
“Commercial Fishing (C/F)” use type. The reasoning for not removing the commercial fishing boats was
that this use type does not necessarily mean that there is a fishing license or endorsement associated
with the vessel. Based on advice from the advisory group and by analyzing the vessel types and sizes, it
was concluded that this class of vessel would likely include those boats that may have been used for a
combination of tuna fishing, commercial charter fishing and recreation. There were 2,046 vessels
classified as being used for commercial fishing in the database. After eliminating the “passenger,”
“livery” and “other” boats, the database contained 143,507 vessels.
Based on advice from the advisory group and members of the Massachusetts Marine Trades
Association, a search was conducted on the US Coast Guard database of documented vessels to identify
all vessels with an owner’s address or vessel hailing port in Massachusetts and with “Recreational” listed
as the Vessel Service Type (i.e. primary use type). The result was a table containing all boats used
primarily for recreation, even if they were endorsed (licensed) to engage in other activities. Finally, all
vessels with an expired or pending status were removed from the search results, leaving a total of
11,824 documented boats.
Combining the registered boats and documented vessels produced a list of 155,331 recreational boats in
Massachusetts. This defined the “population” or universe of all boats under consideration for the study.
An examination of the data made it quickly apparent that sampling boats from these combined
databases required something more than just a simple random sample of boats. The two primary
factors that needed special consideration were the size of the boat and the storage location of the boat.
From this preliminary analysis, it was determined that there were many small boats, especially boats
less than 10 feet in length. It also was determined that many boats were stored in areas of
Massachusetts that were not near any coastal waters and some even kept out of state. A true simple
random sample of boats would lead to a sample that was tilted too much toward boats that may be of
little interest to the goals of the study (i.e. small boats used as tenders or those used only on
freshwater).
Due to this, a stratified sample design was implemented that took account of both size of boat and boat
storage location by region (Figure 7). This is summarized in Table 9. No storage location data existed for
documented boats so these were kept as a separate “class”.
As can be seen, a sample of 10,000 boats was selected for inclusion in this study. This represented
approximately 6.4% of all recreational boats in Massachusetts. The selection of these boats favored
larger boats and boats stored nearer to coastal waters. This was due to the specific goal of the study to
investigate coastal and ocean water use by recreational boaters. The sampling fractions varied from a
low of about 3% of boats from Western Massachusetts, which is far from any coastal water, to a high of
about 38.1% for US Coast Guard documented boats 40 feet long or longer which were considered highly
likely to be used exclusively in coastal waters. The sample was designed to attempt to target the boats

Massachusetts Recreational Boater Survey 2010 - Final Report 38 June 22, 2011
most likely to be of interest to the goals of the study. However, all recreational boats in Massachusetts
had a chance of selection into the study. This design was considered both inclusive and efficient.
Table 9: The population of recreational boats in Massachusetts and the sample drawn.
Boat Size All Boats in MA Sample Drawn Sampling Fraction
Less than 10 feet 4,323 223 0.05158
10 feet – 39 feet 37,595 2,749 0.07312
40 or more feet 115 23 0.20000
Less than 10 feet 3,947 235 0.05954
10 feet – 39 feet 27,972 2,028 0.07250
40 or more feet 99 20 0.20202
Less than 10 feet 3,619 206 0.05692
10 feet -39 feet 27,480 2,000 0.07278
40 or more feet 78 16 0.20513
Al l boat s izes 18,648 700 0.03754
Al l Boat s izes 19,631 600 0.03056
10 feet – 39 feet 9,596 350 0.03647
40 or more feet 2,228 850 0.38151
155,331 10,000 0.06438
1Southeastern MA included Barnstable, Bris tol , Dukes and Nantucket counties .
East Centra l MA included Norfolk, Suffolk and Plymouth counties .
Northeastern MA included Essex and Middlesex counties .
Centra l MA and Out of State included Worcester County and a l l out of s tate addresses .
Western MA included Berkshire, Hampshire, Hampstead and Frankl in counties .
Documented Boats included the entire Coast Guard database for which location was not known.
Region1
Southeastern
East Centra l
Northeastern
Centra l & Out of State
Western
Documented Boats
TOTAL
5.4 Sample Recruitment
From the databases, only the name and address of the boat owner was available. These databases did
not contain information on telephone numbers or e-mail addresses. Therefore, the only viable way to
contact the 10,000 sample boat owners was through the mail. One issue that was critical to address was
that the surveys needed to be completed on the web, so getting boat owner’s e-mail addresses was
necessary. Without these e-mail addresses, the survey could not realistically be done. With the number
of surveys being asked of each boat owner, the only effective way to conduct the series of surveys was
to e-mail each boat owner and include a link to the survey as it became available. Participants simply
clicked on the link to go directly to the newest survey. Once they completed it, they were passed to the
mapping application where they could draw their route. This could all happen seamlessly with simply a
few clicks of a mouse.

Massachusetts Recreational Boater Survey 2010 - Final Report 39 June 22, 2011
Figure 7: The sample regions were based on county boundaries. Counties are labeled in the figure.
Therefore, in May of 2010, all 10,000 sampled boat owners were mailed a very short recruitment survey
and information about the survey. Approximately two weeks later, a postcard reminder was sent to
sampled boat owners asking them to respond to the survey. A telephone number and e-mail address
was included for anyone who wanted to contact the Urban Harbors Institute about the survey.
The purpose of the recruitment survey was twofold. First, it was to determine survey eligibility by
asking three questions. The first question determined that they still owned the boat selected from the
recreational boat databases. Clearly, if they no longer owned the boat they were ineligible to
participate. The second question determined that they used the boat, at least partially, on coastal or
ocean waters. The third question determined if the boat was used exclusively for non-recreational
purposes. If the boat was used exclusively on freshwater and/or for non-recreational purposes, the boat
owner was not eligible to take part in the survey. The recruitment survey also explained the need for a
survey such as this one, why boater participation was so important, and, due to the way in which the
survey was to be administered, why a valid e-mail address was essential. Sample boat owners were
given a choice of a postage-paid mail-back survey to complete and return, or they could access a web-
based version of the survey that they could complete and submit online. After confirming eligibility,
boaters were each assigned a unique six-digit identification code, which would be used to track their
participation in the surveys and ensure mapped data could be attributed to the use of a specific vessel.

Massachusetts Recreational Boater Survey 2010 - Final Report 40 June 22, 2011
The assignment of unique identifiers also meant that it was possible to make the boaters’ responses to
the surveys anonymous. This was achieved simply by not releasing the table that contained both the
unique identifiers and information on the vessels and their owners. This information was only available
to a small number of key team personnel. Without this table, it is nearly impossible to determine the
owner or vessel associated with any one unique identifier.
The unique identifiers also coded the region where each boat was located (apart from documented
vessels, where this information was not available) and the size class of their vessel (apart from boaters
from the Central and Western regions of Massachusetts). See Table 10. Unique identifiers were also
prefixed with a letter to allow for different types of participants to be readily identified. All sampled
boaters who agreed to participate were given an “R” prefix. A number of non-existent boater records
were created to allow team members to monitor the operations of the online survey and mapping
application. These too were given an “R” prefix but the numeric part of their unique identifier started
with a “9“, which allowed for this information to be readily purged from the database. Initial test
records were identified with a “T” and volunteer boaters were identified with a “V”.
5.5 Outreach and Recruitment Efforts
While the value of developing a comprehensive outreach plan to encourage boaters to participate in the
study was recognized, the tight timeframe limited the amount of effort that could be expended on
outreach activities. However, while an extended timeline may have allowed for more comprehensive
outreach to have been undertaken, significant efforts were made both prior to the study and while it
was underway to encourage both initial and on-going participation.
Table 10: The relationship between the unique identifiers and the sampling strata.
Number Region Number Boat Size Number Digits3-6
1 Southeast 1 <10 1-9 Random
2 10 to <40 1-9 Random
3 40+ 1-9 Random
2 East Central 1 <10 1-9 Random
2 10 to <40 1-9 Random
3 40+ 1-9 Random
3 Northeast 1 <10 1-9 Random
2 10 to <40 1-9 Random
3 40+ 1-9 Random
4 Central 1-9 Random 1-9 Random
5 Western 1-9 Random 1-9 Random
6 Documented vessel 2 <40 1-9 Random
3 40+ 1-9 Random
First Digit Second Digit Digits 3-6

Massachusetts Recreational Boater Survey 2010 - Final Report 41 June 22, 2011
The advisory group in particular was extremely helpful in determining the different ways to access
boaters and encourage participation. Attempts to contact boaters and encourage participation occurred
through a variety of means, including:
Flyers: Flyers explaining the study and encouraging participation were e-mailed to members of
the advisory group as attachments. These flyers could be posted on bulletin boards, displayed
on counter tops, etc. Advisory group members were asked to distribute the electronic flyers to
any boating-related mailing lists, or other means of contacting marinas, boating goods stores,
etc. The flyer can be found in Appendix C.
Press releases: At the beginning and in the middle of the boating season, press releases were
sent to a variety of both local and state newspapers, including the Cape Cod Times, Gloucester
Times, the Boston Globe, Patch, the Nantucket Independent. Local newspapers that covered
coastal towns and counties were specifically targeted. These press releases described the
purpose of the study and encouraged boater participation (see Appendix D).
A number of Massachusetts newspapers ran stories including the Gloucester Times, the
Newburyport Daily News, the Lexington Patch, the Swampscott Reporter and the Marblehead
Patch. Various online news sites also picked up the story.
Presentations: Presentations were made at relevant meetings to help spread the word about
the survey. These included the Massachusetts Marine Trades Association’s Board of Directors
Meeting (April 5, 2010) and Annual Meeting (September 9, 2010), the Massachusetts
Harbormasters Association Annual Meeting (April 30, 2010), and the Massachusetts Boating and
Yacht Clubs Association’s Board of Directors Meeting (April 11, 2010) and Membership Meeting
(April 23, 2010).
Website: A dedicated website was created for the survey (www.maboatersurvey.com), which
contained information on the study; copies of outreach materials; information on how to
participate; and listed the prizes that could be won and the organizations that had provided
prizes.
Monthly electronic mailing lists: A paragraph describing the study and encouraging
participation was included in various monthly electronic mailing lists hosted by members of the
advisory group (including Massachusetts Coastal Zone Management’s CZ-mail, Sailors for the
Sea, and the Massachusetts Marine Trades Association). E-mails were distributed to all
members of the mailing list, which likely included those interested in coastal and marine-related
subjects such as boating.
Online discussion board: The press releases described above were also added as conversation
“threads” to a variety of boating and/or coastal-related online discussion boards, such as
“Striper Talk (Striped Bass Fishing, Surfcasting, Boating)”, and “Yack on – the Nantucket Online
Community”.

Massachusetts Recreational Boater Survey 2010 - Final Report 42 June 22, 2011
5.6 Recruitment Responses
Recruitment packages were mailed to 10,000 boat owners on May 6, 2010. Boaters were given the
option of completing the recruitment survey online, or completing the paper version and returning it
using a pre-paid business reply envelope. Those who wished to access the online form were asked to
visit the dedicated Massachusetts Recreational Boater Survey website (www.maboatersurvey.com) and
access their customized survey using the unique identifier that was contained in the mailing.
Throughout the whole recruitment process, only 14.8% (315 boaters) of those who completed the
recruitment survey elected to use the online option. However, the online system had a dual purpose in
that it provided a simple and accessible way for data entry personnel to enter the data contained in the
hard copy survey returns.
Both completed surveys and undeliverable recruitment packages started to arrive within two working
days of the mailing going out. One week after the initial mailing, 660 completed surveys had been
received and 319 recruitment packages had been returned as undeliverable (Figure 8). A number of the
undeliverable packages had been sent to boaters who were no longer at the address in the database but
some were returned with a US Postal Service label containing a forwarding address. When this
occurred, the recruitment package was relabeled and mailed to the new address. The second week
after the initial mailing a further 498 completed surveys had been received, as had 71 more
undeliverable packages. The third week saw 211 surveys and 60 undeliverable packages. In total, 533
recruitment packages were returned as undeliverable. Over 90% of these returns had been received
within 4 weeks of the initial mailing. It took 5 weeks for 90% of the final tally of 1,816 completed
recruitment surveys to be received.
Approximately 2 weeks after the initial mailing, a reminder postcard was sent to 8,281 boaters who
appeared not to have responded.
As completed recruitment surveys were received, the information they contained was entered into the
database being maintained by the Center for Survey Research (CSR). Data entry was done through the
same online portal that had been offered to the sampled boaters when they received the recruitment
packages. Great care was taken to ensure accurate data entry. After the data had been entered, the
completed survey was crosschecked by a second person against a spreadsheet containing the summary
information for each boat and boat owner. The spreadsheet was annotated to show which boaters had
responded. When data entry errors were identified, the details were noted and passed along to CSR to
be corrected. This data entry process required significant personnel time even though the recruitment
survey was relatively short.
Probably the most time consuming process during data entry was deciphering sometimes almost
ineligible handwriting and trying to ensure that e-mail addresses were entered correctly. If an e-mail
address was considered suspect or unclear, the data entry personnel were asked to check the
spreadsheet containing the boater and boat information. This was frequently helpful as it provided the
boater’s name and therefore helped decipher many e-mail addresses. If the e-mail address remained a

Massachusetts Recreational Boater Survey 2010 - Final Report 43 June 22, 2011
mystery, data entry personnel were asked to use internet searches to try to uncover correct addresses.
While this was a somewhat roundabout approach, it was sometimes successful and was deemed
necessary as correct e-mail addresses were essential if boaters were to be able to participate in the
study. This highly time-consuming detective work was not undertaken if a respondent had been found
to be ineligible to participate in the study (i.e. if they no longer owned the specific vessel, if they boated
only on freshwater or if their boat was never used for recreational purposes).
0
100
200
300
400
500
600
700
800
900
1,000
1 2 3 4 5 6 7 8 9 10 11 12
Nu
mb
er
of R
etu
rns
Number of Weeks After Mailing
Completed Surveys Returned by Mail Returned as Undeliverable
Figure 8: The number of completed recruitment surveys and undeliverable recruitment packages received
during the four months following the May 6 mailing.
In future studies, to ensure that e-mail addresses are written in the clearest possible way, a series of
boxes could be provided in which respondents could enter their e-mail address rather than simply a line:
j o h n . d o e @ c o m p a n y . c o m
Entry of recruitment data ceased on July 26. This allowed for late responders to be included in the
survey of July boating activity that was sent out to participants on August 2. While no more boaters
were accepted into the study from late July, completed recruitment surveys continued to be received.
In total 44 additional completed surveys were received after recruitment closed. Of these, 24 would
have been eligible to participate. Interestingly, and somewhat surprisingly, a completed recruitment
survey was received in late March, 2011 – almost ten months after the initial recruitment packages were
mailed to boaters.

Massachusetts Recreational Boater Survey 2010 - Final Report 44 June 22, 2011
Table 11 shows that of the 10,000 mailed recruitment surveys, 533 were returned with undeliverable
addresses. Since this was the only contact information available for these boat owners, they were
declared ineligible for the survey. Of the remaining 9,467 recruitment surveys that were assumed to be
delivered to boat owners, a total of 2,131 were completed and returned either through the mail or via
the web. This meant an effective return rate of 22.5% for the surveys. Although a higher rate would
have been desirable, this was the approximate rate anticipated from such a mailing without more
rigorous efforts to track and contact people that would have significantly increased the cost of this
study. Return rates can be seen as being quite consistent across regions and boat sizes varying from
about 18% to about 27%.
A second important result of the recruitment displayed in Table 11 concerns the eligibility rates. These
rates relate to the number of completed recruitment surveys that indicate the boat owner was eligible
for the series of surveys (i.e. they still owned the boat, used the boat on saltwater and used the boat for
recreational purposes). The overall eligibility rate for the returned surveys was 57.9%. This was
somewhat lower than what was anticipated. The reason becomes quickly apparent. The eligibility rates
were quite diverse ranging from a low of 8.9% for boat owners in Western Massachusetts and a high of
about 84% for large documented boats (Table 11; Figure 9). Indeed, these results confirmed the initial
sample design for lower sample rates in Central and Western regions and higher sample rates for
documented boats. In fact, it could be argued that for future surveys of this type, even lower sample
rates for Central and Western regions should be used, as the eligibility rates for those regions were
significantly lower than any other rates. Overall, the sample design could be made even more efficient
by making use of this vital information.
5.7 Implementation
As previously discussed, due to the requirement for the online mapping part of this study, it was
necessary that this study be conducted using e-mail and the internet. This was also helpful in reducing
costs associated with contacting the participants. In total, 24 waves of communications were sent to
boaters during the study, comprising of perhaps 25,000 individual messages or letters. As it happened,
only three mailings occurred as part of this study:
1. A sample of 10,000 boat owners were initially mailed a recruitment package in May 2010.
2. A postcard reminder asking those who had not replied to fill in the recruitment survey.
3. A letter sent in August thanking boaters for their participation to date and encouraging them to
continue to participate.
Details of the implementation timeline for this study are shown in Table 12.
A limitation of using e-mail and the internet to conduct such a study is that those without e-mail access
become ineligible to participate. It is not possible to determine how many boaters simply decided not
to fill in the recruitment survey as it stated that an e-mail address was necessary to participate.

Massachusetts Recreational Boater Survey 2010 - Final Report 45 June 22, 2011
However, less than 6% of eligible returns had to be rejected as they stated that they did not have e-mail
or they did not provide an e-mail address.
Table 11: Results of the recruitment survey.
Boat SizeSample
Drawn
Bad
Address2
Returned
Surveys
Eligible
Sample
Return
Rate3 %
Eligibility
Rate4 %
Less than 10 feet 223 17 38 29 18.4 76.3
10 feet – 39 feet 2,749 272 640 424 25.8 66.3
40 or more feet 23 5 4 2 22.2 50.0
Less than 10 feet 235 2 41 30 17.6 73.2
10 feet – 39 feet 2,028 87 412 250 21.2 60.7
40 or more feet 20 0 0 0 0.0 0.0
Less than 10 feet 206 0 38 29 18.5 76.3
10 feet -39 feet 2,000 65 414 236 21.4 57.0
40 or more feet 16 0 3 3 18.8 100.0
Al l boat s izes 700 19 141 22 20.7 15.6
Al l Boat s izes 600 21 157 14 27.1 8.9
10 feet – 39 feet 350 15 78 56 23.3 71.8
40 or more feet 850 30 165 139 20.1 84.2
10,000 533 2,131 1,234 22.5 57.9
1 Southeastern MA included Barnstable, Bris tol , Dukes and Nantucket counties .
East Centra l MA included Norfolk, Suffolk and Plymouth counties .
Northeastern MA included Essex and Middlesex counties .
Centra l MA and Out of State included Worcester County and a l l out of s tate addresses .
Western MA included Berkshire, Hampshire, Hampstead and Frankl in counties .
Documented Boats included the entire Coast Guard database for which location was not known.
2 Sample addresses which were returned through the mai l as not del iverable.
3 Rate at which mai led recruitment surveys were completed and returned.
4 Rate at which completed recruitment surveys were el igible to continue in the s tudy.
Western
Documented Boats
TOTAL
Region1
Southeastern
East Centra l
Northeastern
Centra l & Out of State

Massachusetts Recreational Boater Survey 2010 - Final Report 46 June 22, 2011
66.761.8
58.9
15.6
8.9
80.2
0
10
20
30
40
50
60
70
80
90
100
Southeastern East Central Northeastern Central & Out of State
Western Documented Boats
Pe
rce
nt
of E
ligi
ble
Re
turn
s
Region
Figure 9: Percent of returns that were found to be eligible by region.
Even when seemingly valid e-mail addresses were provided, some bounced back when they were used.
While efforts were made to verify these e-mail addresses through alternate sources (including internet
searches using names, addresses etc.) between 5.6% and 9% of e-mails sent each month were bounced
back. It is possible that some of these returns were due to spam filters on the recipients’ computers.
Despite some e-mails not being successfully received by participants, electronic communication appears
to have been successful. As Table 12 shows, participants received a monthly e-mail informing them that
a survey was available. An example of the generalized text for the monthly e-mails can be found in
Appendix E.
When the participating boaters received such an e-mail, they need only click the link to start the survey.
Their unique identifier was coded into the embedded link so that the survey was customized with the
length and make of their specific boat and the reporting month (e.g. “During this survey you will be
asked about your use of your {VESSEL} during {MONTH}, 2010”). In case the boater had any issues or
needed more information, the e-mail also contained a “mailto” link to the study’s dedicated e-mail
address and a reminder of the study’s website.
Approximately a week after the first monthly e-mail, those boaters who had not responded received a
reminder e-mail. Those that still did not respond received a second reminder approximately a week
after they would have received the first. The general text of the second reminder can be found in
Appendix F.

Massachusetts Recreational Boater Survey 2010 - Final Report 47 June 22, 2011
Table 12: Timeline of mailings and other communications with boaters during the 2010 boating season.
5/6/2010 10,000 Recruitment Packages mailed to sample of boaters
5/21/2010 8,281 Postcard Reminders sent to non-respondents
5/25/2010 777 Boat Detail and Demographic Surveys sent
5/26/2010 77 e-mails returned due to bad addresses
6/9/2010 777 May Monthly Surveys sent
6/13/2010 May reminder #1
6/16/2010 308 Boat Detail and Demographic Surveys successfully sent to new recruits
6/18/2010 33 Boat Detail and Demographic Surveys successfully sent to corrected e-mail addresses
6/21/2010 Ineligble boaters e-mailed and thanked
6/22/2010 May reminder #2
6/29/2010 DAY-TO-DAY RECRUITMENT DATA ENTRY STOPPED
7/1/2010 1,200 June Monthly Surveys sent
7/8/2010 June reminder #1
7/16/2010 June reminder #2
7/26/2010 RECRUITMENT CLOSED - Final late eligible participants entered (n=46)
8/2/2010 1,222 July Monthly Surveys sent
8/10/2010 July reminder #1
8/11/2010 1,207 Encouragement Letters mailed
8/18/2010 July reminder #2
8/31/2010 1,208 August Monthly Surveys sent
9/8/2010 August reminder #1
9/16/2010 August reminder #2
9/30/2010 1,201 September Monthly Surveys sent
10/7/2010 September reminder #1
10/25/2010 1,195 End-of-season, Feedback, and October Monthly Surveys sent
11/1/2010 End-of-season, Feedback, October reminder #1
11/12/2010 End-of-season, Feedback, October reminder #2
12/3/2010 SURVEYS CLOSED
During the study, activity on the boater survey website was monitored and is presented in Figure 10.
The red line represents the number of “hits” on the website each day. The blue lines represent the
dates that e-mails were sent notifying participating boaters that each monthly survey was available, with
the initial survey on May 25, 2010. The green lines indicate the dates on which reminder e-mails were
sent to those boaters who had not filled in the current survey.

Massachusetts Recreational Boater Survey 2010 - Final Report 48 June 22, 2011
0
500
1,000
1,500
2,000
2,500
3,000
3,500
4,000
5/6/
2010
5/13
/201
0
5/20
/201
0
5/27
/201
0
6/3/
2010
6/10
/201
0
6/17
/201
0
6/24
/201
0
7/1/
2010
7/8/
2010
7/15
/201
0
7/22
/201
0
7/29
/201
0
8/5/
2010
8/12
/201
0
8/19
/201
0
8/26
/201
0
9/2/
2010
9/9/
2010
9/16
/201
0
9/23
/201
0
9/30
/201
0
10/7
/201
0
10
/14
/20
10
10
/21
/20
10
10
/28
/20
10
11/4
/201
0
11
/11
/20
10
11
/18
/20
10
11
/25
/20
10
Nu
mb
er
of H
its
Survey Reminder Website Hits
Figure 10: Daily website activity and dates of e-mailings.
Upon survey completion, boaters were automatically transferred to the “thank you” page of the
website. This page provided them with a table showing when to expect future surveys, information
about what prizes had been won and those yet to be given away, links to those companies that donated
prizes and a draft map of boating activity around Boston Harbor based on the information gathered
through this study during for May 2010. Only those who completed the survey were redirected to the
“thank you” page and there was no link to it from other pages. By monitoring the hits on that specific
page, it was possible to see how effective the reminder e-mails were. This is shown in Figure 11. Clearly
many boaters filled in the monthly surveys in response to the first e-mail informing them it was
available. However, a number of boaters did not do so until they received one or more reminders. This
suggests that while such reminders may have been somewhat annoying to participants, they did result
in a significant number of additional completed surveys.
While some aspects of this study were technologically challenging and the design, development, testing
and launch of the survey had to be achieved in a highly compressed timeline, there were few technical
hitches during seven months that the survey was running. To test the system regularly, the technical
team created a number of unique identifiers for non-existent boats that were linked to the e-mail
addresses of two team members. By monitoring inboxes for survey alerts and reminders, the team was
able to ensure that broadcast e-mails were being generated and received by participants. This
monitoring effort occurred frequently during the initial phases of the survey but was scaled back in later
months when no issues had been identified and the system appeared to be running smoothly.

Massachusetts Recreational Boater Survey 2010 - Final Report 49 June 22, 2011
0
50
100
150
200
250
6/3/
2010
6/10
/201
0
6/17
/201
0
6/24
/201
0
7/1/
2010
7/8/
2010
7/15
/201
0
7/22
/201
0
7/29
/201
0
8/5/
2010
8/12
/201
0
8/19
/201
0
8/26
/201
0
9/2/
2010
9/9/
2010
9/16
/201
0
9/23
/201
0
9/30
/201
0
10/7
/201
0
10
/14
/20
10
10
/21
/20
10
10
/28
/20
10
11/4
/201
0
11
/11
/20
10
11
/18
/20
10
11
/25
/20
10
Nu
mb
er
of H
its
Monthly Survey Reminder Hits
Figure 11: Daily hits on the “thank you” webpage to which boaters were directed automatically when they
completed a monthly survey and dates of e-mailings.
5.8 Participation during the Season
The recruitment results displayed in Table 11 represent a summary of results from across all months of
the study. No particular survey actually had a sample size indicated by the 1,234 returned recruitment
surveys. The reason for this is that recruitment surveys were coming in throughout the summer months
and in addition, boat owners were selling their boats or dropping out of the study throughout the
summer months. Therefore, each survey had a sample size of boat owners reflective of what was
known at that time. The data collection results will be summarized by type of survey in the following
sections.
5.8.1 Initial Survey
The initial survey was conducted by e-mailing known eligible boat owners in May 2010. The survey
asked questions concerning details about their boat. A total of 1,162 e-mail invites were sent of which
98 were bounced back as undeliverable, meaning that only 1,064 were assumed to get through to
eligible boat owners. Table 13 displays the number of completed initial surveys, stratified by size class
and region.
A total of 649 of the initial surveys were completed on the web. This meant an estimated survey
response rate of 61% (649/1,064). Again, it would be hoped that a higher rate would have been
obtained, but in comparison to response rates of other web surveys, this is considered a very good
result. Nationally, web survey response rates are frequently in the 20% range, so response rates to this

Massachusetts Recreational Boater Survey 2010 - Final Report 50 June 22, 2011
survey must be considered relatively successful. Due to time constraints, an initial e-mail invitation was
sent to everyone with one reminder e-mail that followed about a week later.
5.8.2 Monthly Surveys
The most significant part of this study was the monthly surveys that asked about trips taken during May
through October. It is through these surveys that trip routes were mapped and details about
recreational boat use across the summer and fall were obtained. These data were at the center of why
this study was conducted. Each monthly survey was conducted in the same manner. An initial e-mail
invitation was sent to all known eligible boat owners at the beginning of the month asking about the
prior month. For example, the first monthly survey was e-mailed on June 9 and asked about boat usage
in the month of May. The questions in the survey involved the number of trips taken out on coastal
waters in May, money spent in May on their boat and finally for details concerning the cost and
purposes of the last trip taken that month.
Table 13: Results of the initial survey.
Boat Size Completed Surveys
Less than 10 feet 16
10 feet – 39 feet 216
40 or more feet 1
Less than 10 feet 13
10 feet – 39 feet 127
40 or more feet 0
Less than 10 feet 20
10 feet -39 feet 123
40 or more feet 2
Al l boat s izes 15
Al l Boat s izes 6
10 feet – 39 feet 35
40 or more feet 75
649
1Southeastern MA included Barnstable, Bris tol , Dukes and Nantucket counties .
East Centra l MA included Norfolk, Suffolk and Plymouth counties .
Northeastern MA included Essex and Middlesex counties .
Centra l MA and Out of State included Worcester County and a l l out of s tate addresses .
Western MA included Berkshire, Hampshire, Hampstead and Frankl in counties .
Documented Boats included the entire Coast Guard database for which location was not known.
Documented Boats
TOTAL
Northeastern
Centra l & Out of State
Western
Region1
Southeastern
East Centra l

Massachusetts Recreational Boater Survey 2010 - Final Report 51 June 22, 2011
It was not feasible to ask about each trip taken during the month, as that would have burdened survey
respondents far too much. Asking about a randomly chosen trip during the month was considered, but
that was felt to be far too confusing to survey respondents. Asking about the last trip taken was easy for
respondents to understand and was probably the easiest for them to remember since it was the most
recent trip taken. During months in which there was a major holiday (Memorial Day, Fourth of July and
Labor Day), a question was asked if the reported trip was taken as part of that holiday weekend.
After the initial monthly e-mail invite, two reminder e-mails were sent at approximate week intervals to
anyone who had not yet responded. Therefore, a sample boat owner received up to three e-mails a
month attempting to get them to reply. It was felt that any additional efforts would be considered close
to harassment and probably would have angered a number of boat owners. Therefore, three
notification e-mails were sent at the intervals specified. Table 14 displays the overall results of the
monthly surveys.
Table 14: Overall results of the monthly surveys.
May June July August September October Total
Emai ls Sent 854 1,200 1,222 1,208 1,201 1,195 6,880
Bad Emai ls 77 90 69 100 106 108 550
Surveys Complete 536 556 629 499 406 363 2,989
Percent Complete 69.0 50.1 54.6 45.0 37.1 33.4 47.2
El igible for Map 279 381 509 399 247 155 1,970
Percent Eligible 52.1 68.5 80.9 80.0 60.8 42.7 65.9
As seen in Table 14, a total of 6,880 e-mails were sent over the six months of the boating season, with
550 being bounced back. This led to 2,989 completed surveys for an estimated response rate of 47.2%.
This implies that approximately 47.2% of all boat owners sent e-mails did complete the survey. It is only
possible to suggest an approximate response rate, as there is no true way to determine exactly how
many e-mails did arrive in a way that a boat owner saw it and had the opportunity to respond. It is
simply assumed that if the e-mail did not bounce back, then it did get through any firewalls, spam filters,
etc. and did get to the desired boat owner. As expected, the response rate by month declined over time
(Figure 11) from a high of 69% in the May survey to a low of 33.4% in the October survey. This decline in
response rate was not unexpected as keeping people interested and engaged over six months of surveys
is a difficult task.

Massachusetts Recreational Boater Survey 2010 - Final Report 52 June 22, 2011
-
200
400
600
800
1,000
1,200
May June July August September October
Nu
mb
er
of R
esp
on
ses
Responded to Survey Did Not Respond
Figure 12: Results of the monthly surveys.
Another interesting result displayed in Table 15 is the rate at which people who responded to the survey
actually took their boat out onto the water and were therefore eligible to map a trip. As expected, this
peaked in July and August with over 80% of all survey responders eligible to draw a map. The bordering
months of June and September had lower eligibility rates (68.5% and 60.8% respectively). Finally, the
beginning and end months of May and October were lower still with rates around or below 50%. None
of this is surprising, but it is interesting to quantify these results to such an exact degree.
Tables 15 and 16 display further breakdowns of the monthly survey results by region and size of boat.

Massachusetts Recreational Boater Survey 2010 - Final Report 53 June 22, 2011
Table 15: Monthly survey results by region.
Responded to
Survey
Eligible to
Map
Responded to
Survey
Eligible to
Map
Responded to
Survey
Eligible to
Map
Southeast 195 91 209 134 228 179
East Centra l 119 63 117 81 142 120
Northeast 110 55 113 77 132 105
Centra l 12 7 13 7 14 9
West 5 1 7 5 7 6
Documented 95 62 97 77 106 90
TOTAL 536 279 556 381 629 509
Responded to
Survey
Eligible to
Map
Responded to
Survey
Eligible to
Map
Responded to
Survey
Eligible to
Map
Southeast 186 143 137 84 137 52
East Centra l 109 88 98 52 75 29
Northeast 103 83 83 56 75 32
Centra l 9 4 10 6 9 3
West 6 6 7 3 3 0
Documented 86 75 71 46 64 39
TOTAL 499 399 406 247 363 155
Responded to
Survey
Eligible to
Map
Southeast 1,092 683
East Central 660 433
Northeast 616 408
Central 67 36
West 35 21
Documented 519 389
TOTAL 2,989 1,970
Region
TOTAL
Region
Region
August
May June July
September October

Massachusetts Recreational Boater Survey 2010 - Final Report 54 June 22, 2011
Table 16: Monthly survey results by boat size.
Responded to
Survey
Eligible to
Map
Responded to
Survey
Eligible to
Map
Responded to
Survey
Eligible to
Map
<10 feet 47 23 39 19 43 33
10-39 feet 400 197 430 297 483 391
40+ feet 72 51 67 53 82 70
Centra l & Western1 17 8 20 12 21 15
TOTAL 536 279 556 381 629 509
Responded to
Survey
Eligible to
Map
Responded to
Survey
Eligible to
Map
Responded to
Survey
Eligible to
Map
<10 feet 30 21 30 15 26 9
10-39 feet 385 307 308 191 277 110
40+ feet 69 61 51 32 48 33
Centra l & Western1 15 10 17 9 12 3
TOTAL 499 399 406 247 363 155
Responded to
Survey
Eligible to
Map
<10 feet 215 120
10-39 feet 2,283 1,493
40+ feet 389 300
Central & Western1 102 57
TOTAL 2,989 1,970
Size
August September October
Size
TOTAL
1 This i s the Centra l MA, Western MA and Out of State areas combined and not broken down by s ize due to the
very smal l number of completed surveys across these areas .
Size
May June July
Table 17 breaks down how many boat owners completed multiple surveys across the six months.
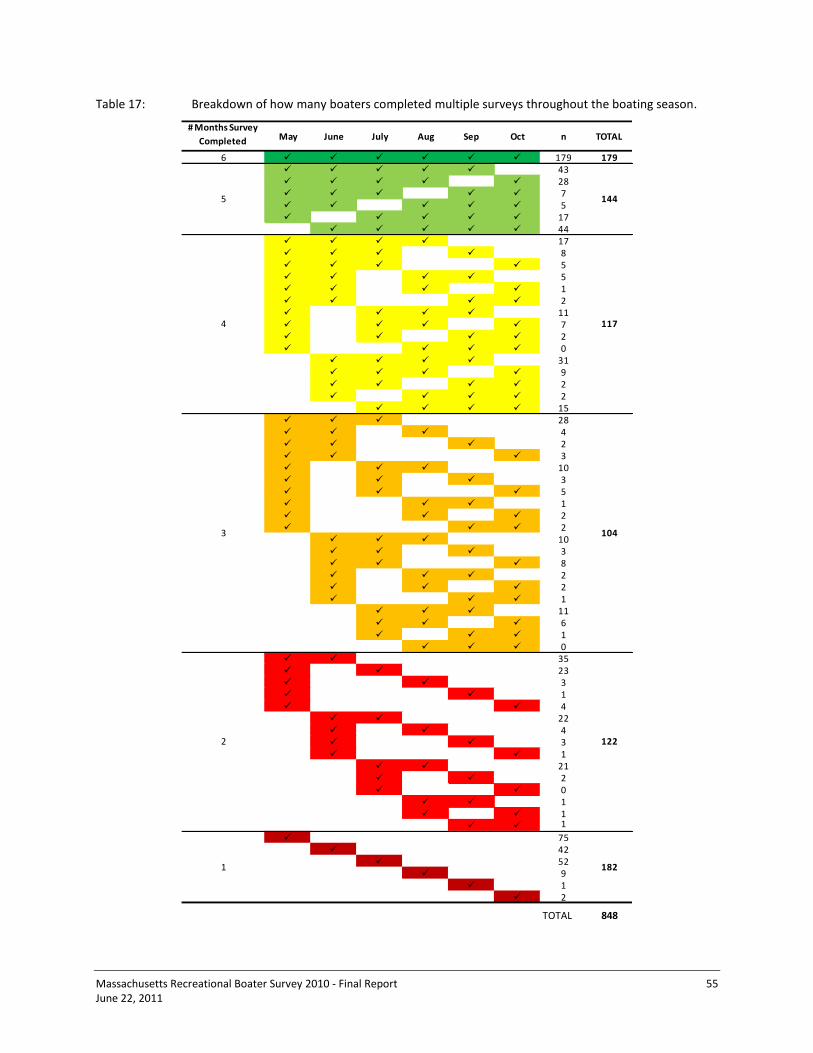
Massachusetts Recreational Boater Survey 2010 - Final Report 55 June 22, 2011
Table 17: Breakdown of how many boaters completed multiple surveys throughout the boating season.
# Months Survey
Completed May June July Aug Sep Oct n TOTAL
6 179 179 43 28 7 5 17
44 17 8 5 5 1 2 11 7 2 0
31 9 2 2
15 28 4 2 3 10 3 5 1 2 2
10 3 8 2 2 1
11 6 1
0 35 23 3 1 4
22 4 3 1
21 2 0
1 1
1
75 42
52 9
1 2
TOTAL 848
2 122
1 182
5 144
4 117
3 104

Massachusetts Recreational Boater Survey 2010 - Final Report 56 June 22, 2011
A total of 848 people completed the survey in at least one of the six months. This means that 72.9% of
all those that are believed to have received at least one successful e-mail invitation, responded to at
least one survey. This response rate is quite high and considered quite successful for a serial web
survey.
0
100
200
300
400
500
600
700
May June July Aug Sept Oct
Nu
mb
er
of R
esp
on
de
nts
All Months 5 of 6 4 of 6 3 of 6 2 of 6 1 of 6
Figure 13: Breakdown of how boaters completed multiple monthly surveys.
5.8.3 End-of-season Survey
The end-of-season survey was sent to all eligible boat owners in November 2010. This survey asked
boat owners about expenses incurred that did not relate to any specific trip, but were more general
expenses associated with boat ownership. Examples of this type of expense were repair costs, storage
costs and equipment costs. For people who completed the survey, they were given the option of
continuing on to do the normal monthly trip survey about any boat trips in October. A total of 458
people responded to the end-of-season survey and 363 of them agreed to complete the October
monthly trip survey. Overall, 1,195 e-mails were sent out, of which 108 bounced back as undeliverable.
Of the remaining 1,087 e-mail invites, 458 people completed the end-of-season survey. This implied an
approximate response rate of 42.1%. Table 18 displays a breakdown of the end-of-season survey results
by region and boat size.

Massachusetts Recreational Boater Survey 2010 - Final Report 57 June 22, 2011
Table 18: Results of the end-of-season survey.
Boat Size Completed Surveys
Less than 10 feet 16
10 feet – 39 feet 154
40 or more feet 0
Less than 10 feet 11
10 feet – 39 feet 89
40 or more feet 0
Less than 10 feet 10
10 feet -39 feet 79
40 or more feet 0
Al l boat s izes 10
Al l Boat s izes 4
10 feet – 39 feet 23
40 or more feet 62
458
1Southeastern MA included Barnstable, Bris tol , Dukes and Nantucket counties .
East Centra l MA included Norfolk, Suffolk and Plymouth counties .
Northeastern MA included Essex and Middlesex counties .
Centra l MA and Out of State included Worcester County and a l l out of s tate addresses .
Western MA included Berkshire, Hampshire, Hampstead and Frankl in counties .
Documented Boats included the entire Coast Guard database for which location was not known.
Documented Boats
TOTAL
Northeastern
Centra l & Out of State
Western
Region1
Southeastern
East Centra l
5.8.4 Mapping Application
Overall statistics related to the boater survey mapping activity are provided in Table 19. In this table,
Snap refers to the survey component; Snap was the software used to develop the survey as a web
application. Thus, the column titled Snap refers to the number of participating boaters (users) who
reported that they undertook a boat trip out on the water during the month listed, and who were
therefore handed off to the boater survey web-based mapping application from Snap. The column
Snap2Map details the number of boaters who (for May and June, see note 1) continued past the
mapping application welcome page or (for the July through October) at least viewed the welcome page.
The column Map Activity describes the number of boaters who continued past the welcome page.
Notice that for the months of May and June, Snap2Map and Map Activity are identical values.

Massachusetts Recreational Boater Survey 2010 - Final Report 58 June 22, 2011
The columns titled Boaters Mapped…. are self-explanatory. The columns under the heading detail the
total quantity of Areas or Alternate Areas drawn; in any one month, a boater could only draw one route,
but could draw any number of areas (including none).
Table 19: Summary of spatial data provided by participating boaters.
Month Snap Areas4Alt
Areas4
May 278 249 89.6% 249 100.0% 178 71.5% 70 28.1% 43 17.3% 86 52
June 380 328 86.3% 328 100.0% 229 69.8% 68 20.7% 44 13.4% 76 45
July 505 496 98.2% 454 91.5% 268 59.0% 87 19.2% 55 12.1% 121 65
August 397 394 99.2% 360 91.4% 226 62.8% 65 18.1% 39 10.8% 86 44
September 246 244 99.2% 222 91.0% 123 55.4% 28 12.6% 19 8.6% 33 20
October 155 152 98.1% 135 88.8% 67 49.6% 20 14.8% 9 6.7% 28 10
TOTALS 1,961 1,863 95.0% 1,748 93.8% 1,091 62.4% 338 19.3% 209 12.0% 430 236
1 "No Activi ty" not tracked in May or June
2 Individual boaters mapping at least one area
3 Individual boaters mapping at least one a l ternate area 4 Total areas mapped
BoatersAreas and
Alternate Areas
Snap2Map1 Map Activity1Boaters Mapped
Routes
Boaters Mapped
Areas2
Boaters Mapped
Alternate3
Throughout the study period, there were a number of boaters who were eligible to map (i.e. had
undertaken an on-water trip) but who did not get passed the mapping application welcome page. This
page gave boaters the opportunity to skip the mapping if they so wished. In May and June “skipping”
was not recorded so it is unclear if boaters simply opted to skip or if there was a problem with the
application. From July onwards additional monitoring was implemented, which showed that the “loss”
between the Snap survey and the mapping application was small. Initially, over 70% of those who did
not choose to skip the mapping application went on to plot a route. However, this percentage dropped
throughout the study so that only 50% mapped a route in October. This attrition may simply be due to
“survey fatigue.”
The mapping of activity areas, and alternate areas, was generally not well undertaken by participants
(Figure 14) with between 28% and 15% of boaters mapping activity areas and only 18% to 7% mapping
alternate areas.

Massachusetts Recreational Boater Survey 2010 - Final Report 59 June 22, 2011
0
50
100
150
200
250
300
350
400
450
500
550
May June July August September October
Nu
mb
er
of B
oat
ers
Eligible to Map Handed Off to Mapping Accessed Map
Mappped Route Mappped Area Mappped Alternate Area
Figure 14: Summary of spatial data provided by participating boaters.
5.9 Boater Feedback (during the boating season)
To ensure that boaters were able to communicate with the project team, a telephone line (with voice-
mail) was dedicated to this study and an e-mail address was created ([email protected]).
Voice-mail and e-mail were generally checked every business day. These avenues of communication
were included in outreach materials, in the online surveys and on the recreational boater survey
website.
During the period that the survey was running, approximately 15 boaters contacted the team either by
telephone or by e-mail. Six enquiries centered on technical problems that boaters were experiencing
with the online mapping application. These were forwarded to relevant team members and were
addressed to the degree possible. Four boaters had misplaced their recruitment packages and needed
additional directions on how to participate. Three boaters asked to be removed from the study. The
remaining boaters who contacted the project team did so to comment on the survey in general or to
clarified or suggest improvements to specific aspects of the survey.
5.10 Volunteer Survey
While the clear focus of this survey was on the boating activity of the sampled boaters, it was felt that
other boaters (or “volunteers” as they were termed in the study) should be given an opportunity to
provide information on their boating activity. Due to the study design, this information could not be
included in any of the analysis associated with the sampled boaters.

Massachusetts Recreational Boater Survey 2010 - Final Report 60 June 22, 2011
Due to time limitations and the need to focus on the primary aim of the study, no significant efforts
were made to solicit input from volunteer boaters. However, the ability for any boater to provide input
was clearly expressed in all outreach materials, which directed interested boaters to the survey website
(www.maboatersurvey.com). From there, volunteer boaters could provide some basic information
about their vessel and then could plot their boating routes.
A total of 43 routes were reported by volunteer boaters. This did not provide enough for any detailed
analysis and as such, the information provided is not discussed further in this report. However, it is
important to note that more comprehensive data could be gathered in this way if a more strategic
outreach campaign was implemented.
5.11 Out-of-state Boater Pilot Survey
Prior to this survey moving beyond the conceptualization phase, it was acknowledged that the lack of
information on out-of-state boater activity represented a significant data gap, but that trying to fill that
gap as part of this study was not feasible. The methodology developed for this study required that a
stratified, random sample of boats be selected from a known “population.” Having a defined population
was critical if it were to be possible to scale-up the economic data to a region or to the state as a whole.
While it is recognized that out-of-state boater activity may have a significant economic impact within
Massachusetts, the inherent mobility of boating and the short distances between New England states
allows for frequent visits to Massachusetts by out-of-state boaters. Thus, identifying and locating out-
of-state boaters is problematic and defining the “population” of such boaters is extremely difficult.
The term “out-of-state boater” may bring to mind large vessels or mega yachts visiting Massachusetts
en route to other destinations such as Canada or Florida – or perhaps those seen tied-up alongside the
dock in Nantucket during the summer. These types of vessels and boaters undoubtedly have the
potential to have a significant impact on the local economy. Additionally, it may be possible to estimate
the numbers of such vessels visiting or transiting Massachusetts waters because they are conspicuous
and require specific shoreside support infrastructure that may limit the number of locations at which
they can berth. However, it is likely that most of the out-of-state boating activity consists of smaller
boats that either cross into Massachusetts waters for a short visit to a local area or are trailered into
Massachusetts and launched at a local boat ramp. While the economic impact associated with any
individual small out-of-state boats may be low, the cumulative impact of them all may be considerable.
As smaller out-of-state boats would be expected to be similar to those from Massachusetts, they are
likely to be used in similar ways and only be identifiable as being from another state through closer
inspection. This makes identifying the population of such vessels highly challenging.
It is also important to note that many out-of-state boaters may enter Massachusetts waters but never
come ashore and never spend any money within the state. As such, their economic impact may be
extremely low or even non- existent. However, large numbers of out-of-state boaters may have other
impacts such as increasing on-water congestion and pollution.

Massachusetts Recreational Boater Survey 2010 - Final Report 61 June 22, 2011
While attempting to fill the data gaps associated with out-of-state boater activity was beyond the scope
of this study, it was decided that a preliminary analysis of some potentially useful existing data sources
would be worthwhile. In addition, once the main study was successfully underway, it was decided that a
very small pilot study should be implemented to assess one potential means of gathering data on out-of-
state boaters and their activity. The aim of this pilot was to test a data-gathering methodology that, if
successful, had the potential to be expanded across the state in a concerted effort to fill some of the
data gaps associated with out-of-state boaters. The pilot study was not expected to result in any
significant amounts of useful data.
5.11.1 Cape Cod Canal Data
The Cape Cod Canal is a 17.4-mile long, 480-foot wide, man-made canal, which bisects the Upper Cape
and the “mainland” Town of Bourne. Saving boaters a 135-mile journey circumnavigating the tip of
Cape Cod, it is a major transit route for both recreational and commercial vessels traveling between
Buzzards Bay and Cape Cod Bay. The canal represents a waterway bottleneck and as such, the
movement of vessels through it must be carefully managed. This is especially true for larger, less
maneuverable vessels.
The canal falls under the jurisdiction of the US Army Corps of Engineers (USACE). The USACE requires all
vessels over 65 feet in length to obtain clearance prior to transiting the canal by contacting the Canal
Marine Traffic Controller via VHF radio or by telephone. As the USACE maintains records of such
transits, this represents a potentially useful source of information about larger vessel movement
between Buzzards Bay and Cape Cod Bay.
Cape Cod Canal Management gathers a number of pieces of information on all vessels of 65-feet or
greater that transit the canal. These include the:
Date of passage;
Vessel type;
Homeport of origin;
Vessel destination;
Draft;
Net tonnage; and
Vessel flag.
In order to assess the value of the information, the project team requested that Cape Cod Canal field
office provide selected data from the permission-to-transit log for vessels exceeding 65 feet in length
overall for the period January 1 through November 28, 2010. Consequently, electronic data on vessel
net tonnage, port of origin, intended destination, vessel class or type and transit date were provided on
February 16, 2011 by the field office.

Massachusetts Recreational Boater Survey 2010 - Final Report 62 June 22, 2011
Minimal large recreational boat activity was reported in the canal during the first four months of 2010
(two transits in total; one in January and one in April). As would be expected, activity began to pick up
in May with 29 transits. Activity continued to increase through June (55 transits) and July (139) before
peaking at 215 transits during August. Numbers then fell significantly in September (97), October (50)
and November (7). In total there were 594 transits made through the canal by 281 different
recreational boats of 65+ feet. Many of the vessels made round trips through the canal while en route
to or from destinations ranging from the Canadian port of Quebec to Key West, Florida.
Vessel traffic through the Cape Cod Canal was highest from May through October peaking in the months
of July and August with 139 and 215 transits respectively. The majority of vessels (52%) were US
flagged. A further 30% were foreign flagged and flag of registry data were incomplete for 17% of
vessels. For those vessels declaring a Port of Origin, the majority hailed from New England and New
York. A Massachusetts port was listed as their next Port of Call for 334 transits.
While the data gathered by the USACE on vessels transiting the Cape Cod Canal are of some interest,
they are of somewhat limited use for this study in that they provide limited data, on a sub-set of
recreational vessels (65-feet or over) that pass through one stretch of water within Massachusetts.
5.11.2 US Coast Guard Notice of Arrival/Departure Data
The boater survey focused on evaluating the population, movement and spending of state-registered
and USCG documented vessels. However, during the summer months a number of vessels operating in
New England waters are foreign flagged (or operate under a “flag of convenience”). As such, they will
appear in neither the state nor the USCG databases. These vessels are most frequently larger sailing or
powerboats with extended cruising ranges and staffed by professional crew. While the fleet size may be
relatively modest, visits by these mega yachts, super yachts and giga yachts may have a significant
economic impact both at a local and statewide level.
Currently, the USCG has reporting requirements for foreign-flagged vessels visiting US ports. When a
foreign-flagged recreational vessel exceeding 300 gross tons intends to enter or transit through a
particular “Captain of the Port (COTP)” zone as demarcated by the USCG, the master of the vessel is
required to file a 96-hour advance Notice of Arrival/Departure (NOA/D) with the USCG prior to entering
the zone. The USCG requires specific information be submitted as part of each NOA/D including: date of
arrival, vessel gross tonnage, last port, destination port, vessel flag, and number of crew and passengers
onboard.
The project team identified two COTP zones as being most pertinent to assessing if NOA/D data could be
used to study out-of-state boater activity in Massachusetts: Sector Boston and Sector Southeast New
England. The team requested (under the Freedom of Information Act of 1974, 5 U.S.C. 552, as
amended) that the USCG provide NOA/D data for recreational vessels over 300 gross tons transiting
either sector for the period of April 1 through October 1, 2010.

Massachusetts Recreational Boater Survey 2010 - Final Report 63 June 22, 2011
There were 257 individual NOA/D filed between April 25 and October 2, 2010. These records listed 140
visits to 13 destination “ports” in Massachusetts: Beverly, Boston, Cape Cod Canal, Cuttyhunk,
Edgartown, Gloucester, Hyannis, Martha’s Vineyard/Vineyard Haven, Nantucket, New Bedford,
Newburyport, Plymouth and Provincetown. Nantucket was the most frequented destination (41 visits),
followed by Boston (38), Martha’s Vineyard (Edgartown, Vineyard Haven and Martha’s Vineyard in
general [32]). The next most frequented location was Provincetown with nine visits.
Between April 25 and October 2, foreign-flagged vessels spent 695 “vessel-days” in Massachusetts ports
(where a “vessel-day” was one vessel spending one day in Massachusetts). These vessels averaged 522
gross tons and had an average of 11 people on board (eight crew and three passengers). Foreign-
flagged vessels had an average stay of five days in Massachusetts waters.
While the data on foreign-flagged vessels are of interest, they do not identify vessels so it is not possible
to determine their overall route within Massachusetts, making the data of limited use for spatial
analysis.
5.11.3 Marina Surveys
One possible means of gathering data on out-of-state boaters is to carry out intercept surveys at boating
facilities. These types of surveys can be both time-consuming and costly, and a full survey was beyond
the scope of this study. However, it was decided that it might be possible to solicit the help of those
who already interact with out-of-state boaters on a regular basis when they are seeking fuel, moorings,
supplies or overnight accommodation – i.e. the staff at marinas and harbormaster’s offices. If
successful, this could provide a more cost-effective way of conducting an intercept survey compared to
deploying dedicated personnel to a number of facilities for extended time periods. To this end, it was
decided that a very small pilot study be developed to test the feasibility of having marina staff ask
boaters to fill in a short survey.
A brief survey was developed, which asked for details about the trip that an out-of-state boater was
undertaking:
Current facility;
Type of vessel (power or sail);
Length of vessel in feet;
Number of people on board (including children and crew);
Average number of boating trips into Massachusetts waters per year;
Hailing / home port:
Last port of call;
Estimated duration of current trip in days;
Estimated number of days in Massachusetts waters during current trip;
Estimated total amount of trip-related spending in Massachusetts on current trip;

Massachusetts Recreational Boater Survey 2010 - Final Report 64 June 22, 2011
Next port of call; and
Ultimate destination at end of current trip.
Boaters were also asked to plot their approximate route within Massachusetts on a map that was
printed on the back of the survey.
Specific destination marinas, or ports, were identified as being best suited for the pilot survey. These
facilities included those located near a state border and/or those that were known as popular, high
volume boating destinations with facilities that catered to out-of-state boaters. Once the facilities were
identified, the management were contacted and asked if they would be willing to participate. Seven
facilities accepted the invitation to assist with the pilot. These facilities were located at various locations
along the Massachusetts coastline.
On July 1, 2010, survey packages containing detailed instructions, promotional flyers and 100 paper
surveys were sent to each of the seven participating facilities for distribution to and collection from
boaters whose vessels were registered outside of Massachusetts.
Recognizing the fact that marinas and harbormaster’s offices can be extremely busy during the boating
season and that conducting surveys is not their primary responsibility, the method of on-site distribution
was at the discretion of the participating facility. Some operators distributed the survey at the fuel dock
frequented by boaters; some included the survey in a package of dockage registration documents, while
others made the survey publicly available in the dock master or harbormaster’s office.
From July through the end of September 2010, the facility operators were periodically contacted to
determine if more surveys were needed or if they had any questions. During each of these
communications, no obstacles were reported. On October 4, 2010, each participating marina was sent
instructions and a pre-paid express mail envelope, and was requested to return all completed out-of-
state boater surveys for analysis.
Due to the small number of facilities selected, this pilot study was not expected to result in enough data
for detailed analysis of out-of-state boater activity or spending. However, if the methods used to
conduct the pilot study proved successful, it might be possible to implement a more comprehensive
study at a future time. However, only 10 completed surveys were received and deemed eligible through
this pilot study and all of these came from one participating facility, suggesting that the methodology
used is not suitable for gathering usable data on out-of-state boaters in Massachusetts.
It appears that there was some confusion about what the facility operators were expected to do, with
some not realizing that they needed to collect the completed surveys. In another case, the completed
surveys were misplaced before they could be returned for analysis. One operator pointed out that at
the height of the season there was simply not enough time to distribute and collect surveys from
boaters.
Due to the lack of success of the pilot, it must be concluded that the methodology used should either be
considerably refined or an alternative methodology be employed.

Massachusetts Recreational Boater Survey 2010 - Final Report 65 June 22, 2011
5.11.4 Recommendations for Future Surveys of Out-of-state Boaters
Assessing out-of-state boater activity and the economic impact of such activity remains an issue. While
some data sources exist, they are of somewhat limited use. Recruiting the help of those who are in
regular contact with the out-of-state boaters also appears to be of limited success as marina and
harbormaster staff are frequently too busy at the height of the boating season to dedicate the necessary
time to informing boaters of a study and encouraging their participation.
An alternative approach could be to have dedicated personnel conduct intercept surveys at marinas,
harbormaster’s offices and boat ramps. This would be one way to acquire information from these
boaters on their activity in Massachusetts and their trip-related spending. However, such surveys can be
expensive and time-consuming.
Another alternative approach could be to develop a postcard that could be widely distributed to out-of-
state boaters by simply displaying them prominently at locations commonly visited by out-of-state
boaters. The postcard could be a simple survey (which would require a drop-box for responses) or could
direct boaters to an out-of-state boater website, which would contain a survey and an adapted version
of the online mapping application so that they could report their boating activity and spending. It is
likely that participation would be enhanced if incentives were offered, perhaps in the form of monthly
prize draws.
While it is likely that with sufficient resources, valuable data could be gathered on out-of-state boater
activity and spending, a significant problem remains. Even if analysis of the data allowed for robust
estimates of out-of-state boater spending (based on boat size / boat type / duration of trip / number of
people on board / a combination of these), this information cannot be scaled up unless the population
of out-of-state boaters can be estimated.
One way of estimating the out-of-state boater population could be to look at the records kept by all
facilities that provide berthing, dockage or moorings to out-of-state boaters. However, record keeping
varies from facility to facility and it would be necessary to standardize the information being gathered.
As has already been seen in the pilot study, facility staff are often too busy to dedicate sufficient time to
a survey, especially when it is not part of their job.
An alternative might be to ask staff to report on the out-of-state boats located at their facility on a few
specific days in a season. This would allow for a snapshot of out-of-state boat types, locations and sizes
to be captured throughout the state. This estimated population could be used to scale up the average
spending estimated through surveys of boaters. Any efforts to utilize facility staff would require
significant outreach to the management of such facilities and follow-up to ensure continued assistance.
Another way to estimate out-of-state boating activity could be to survey a sample of registered boaters
from nearby states, assuming that the majority of out-of-state boaters are from within the region. Such
a survey would depend upon state registration data being available for neighboring states and would
require significant resources.

Massachusetts Recreational Boater Survey 2010 - Final Report 66 June 22, 2011
6 ANALYSIS A full analysis of all the data was beyond the scope of this study. However, a preliminary analysis of the
survey and economic data was undertaken. These analyses are presented in the Results section. The
full analytic data files are available to interested parties through the Massachusetts Ocean Partnership.
6.1 Surveys Analysis
6.1.1 Weighting of Data
The data resulting from these surveys were the direct result of a complex sample involving stratification
and over-sampling of particular strata. As demonstrated earlier, this was necessary to attempt to target
boat owners who were more likely to be eligible to complete the monthly surveys. Without such a
stratified design, far more boat owners would have been ineligible and significantly less data would have
been collected. The net result of this stratification was variable probabilities of selection for boat
owners depending on region and size of boat. These variable probabilities needed to be taken into
account when analyzing survey data. To account for this, weights were placed on each data file. These
weights adjusted both for the variable probabilities of selection and for differential survey non-response
by stratum. The weights, in other words, adjusted the distribution of boats on the analytic data files to
resemble more closely the distribution in the original databases by region and size. Again, it is
important to use these weights in analyses of survey data.
A second consideration must be made when considering weighting these data. The weight placed on
the monthly data files were boat weights. That implies that when summed, they represented an
estimate of the number of recreational boats being used on coastal and ocean waters in Massachusetts.
During each monthly survey, boat owners reported on the last trip taken the previous month, if they
took the boat out on the water. There was a variable on each monthly data file, which reported the
total number of monthly trips reported by each boat owner. For certain analyses, it was better to
analyze trips rather than boats. If this was considered important, then the weight on each data file was
multiplied by the number of reported trips in the data file. This would then become the appropriate trip
weight. These new weights would not sum to the estimated number of recreational boats, but to the
estimated number of boat trips.
In doing this, one assumption that was made must be considered. Boaters were reporting on the “last”
trip taken during the previous month. If the weight was inflated by the number of trips reported for the
previous month, then the assumption was that the last trip was on average similar to the other trips. To
the extent that this assumption was incorrect, then analysis results will be flawed. The only way around
this problem would have been to have the boat owner report on a randomly selected trip from the
previous month. This would have been extremely difficult to do and would have led to reporting errors
which would probably have exceeded the problem of assuming the last trip was in some way average.
Still, this point must be made and considered.

Massachusetts Recreational Boater Survey 2010 - Final Report 67 June 22, 2011
6.1.2 Data Cleaning and Analysis
One of the primary goals of this study was to fill a number of significant data gaps associated with
recreational boating in Massachusetts and to make this information available to both the state and to
interested parties such as the boating community and organizations representing recreational boating
interests. A vast amount of data was gathered as part of this study with the aim that this information
would be used by all interested parties for further analysis. The Urban Harbors Institute and the
University of Massachusetts Boston in general, are looking at ways that these data might be used as the
basis for graduate research in the near future.
Analytic data files were created separately for the initial survey, each monthly trip survey and for the
end-of-season survey. Each of these files contained the appropriate weight as described previously. In
addition, each of these files contained the unique identifier, which indicated a particular sampled boat.
Therefore, these data files can be considered by themselves or merged for different analyses. For
example, the July monthly data file can be analyzed alone to study boater activity in July. The July and
August data files can be appended and analyzed together to study boater activity from those two
months. If this is done, the weight on each file should be divided by two, as two months are being
considered together. Any number of the six monthly can be appended in this manner to look at trips
across the entire boating season. The weight should always be divided by the number of months
combined for analysis in this way.
In addition, the monthly data files can be matched and merged together by unique identifier. In this
way, a longitudinal analysis file can be created to look at what individual boaters did across months. Not
every boater completed a survey for each month, so gaps would be frequent. This was best displayed in
Table 17. Finally, information from the initial and end-of-season surveys can be merged onto monthly
data files, by again using the unique identifier. Once again, gaps would exist as not every boater
completed an initial or an end-of-season survey.
The individual data files should be considered building blocks, which can be appended or merged in
whatever way suits the analyst as best for studying the specific question they want answered.
All statistics were computed using SAS for Windows version 9.2 (SAS Institute Inc., Cary, NC, USA).
Additional analysis was completed using Microsoft Excel.
During the analysis, a number of possible anomalies were identified in the data that boaters had
provided. These were addressed using common techniques and the details of this are described below:
As the sample was based on the boats contained in the two databases, it was important that
boaters reported on the spending and activity associated with the selected boat and not on
another vessel that they owned. Three records were identified where the boat selected was
less than 10 feet in length but the boaters appeared to be reporting on larger vessels. In two of
the cases, this was confirmed in the feedback survey when the boaters stated that they had
reported on their larger vessel and not the one selected. These vessels were removed from all

Massachusetts Recreational Boater Survey 2010 - Final Report 68 June 22, 2011
survey analysis (the initial survey, all monthly surveys and the end-of-season survey).
Additionally, these records were stripped from the spatial data.
One boater listed the number of days that he had visited his boat during July as fifty. This record
was removed from the analysis of July data.
One boater listed the number of days that he had visited his boat during October as forty. This
record was removed from the analysis of October data.
When answering the question about how much boaters had paid in order to launch their
trailered boat at a boat ramp, or for parking at the ramp, one boater reported a launch fee of
$1,200 in October. The next highest launch fee reported at any other point during this study
was $120. This information was therefore assumed to be an error and this launch fee cost was
excluded from any analysis.
The boaters were asked to estimate the total number of hours they had been under power or
sail during the boating season. Four records were identified as being much higher than any
others (ranging from 1,500 to 4,000 hours). These were felt to be erroneous and were excluded
from the analysis.
Boaters were asked for the total number of hours spent on the water during the trip that they
were reporting on. It quickly became apparent that there was confusion over the question
when boaters reported that they spent several days on board a vessel that was less than 10 feet
in length. Based on the way the question was worded, this would have been possible if a boater
was reporting on his dinghy or tender that he used to access a larger vessel over a multi-day
trip. Technically the tender did not return for several days. Due to the confusion, this question
was excluded entirely from any analysis.
In the end-of-season survey, two boaters had reported “other” spending of $9,999. These
responses were almost $3,000 more than the next highest reported expense in this category
and were therefore viewed with some suspicion. Additionally, these two outliers significantly
increased the total expenditure in this category when scaled up to the population. In order to
be somewhat conservative in estimating the economic impact, it was decided that these two
records would be re-assigned with a value based on the average of all “other” spending. This
gave them a spending in this category of $1,019.
It was noticed that some of the “other” trip-related spending being reported in the monthly
surveys would more appropriately be reported as a category of spending in the end-of-season
survey (e.g. repairs, maintenance and parts). As there was a strong possibility that this would
double count expenditure and overestimate overall spending, the “other” category of trip-
related expenditure was not included in the economic analysis.

Massachusetts Recreational Boater Survey 2010 - Final Report 69 June 22, 2011
In the end-of-season survey, boaters were asked to check “yes” or “no” to indicate if they had
spent money in a specific category. If they answered “yes” then they were asked to enter the
amount. However, some boaters checked “yes” and did not enter an amount while others
checked “no” but then entered an amount. It was therefore decided that if a dollar amount was
provided, it was assumed that the boater had intended to check “yes” even if he had not done
so. However, if a boater checked “yes” but left the amount blank, that record was assigned a
spending value equivalent to the mean of all the other spending reported in that category.
6.2 Economic Contribution Analysis and the IMPLAN Model
6.2.1 Contributions to the Economy
Data collected during the survey served as the basis for estimating total expenditures during coastal or
ocean recreational boating activity and the impact of these expenditures on both the Massachusetts
economy and two different sub-regions.
The basic premise was that an initial investment in one sector of an economy (in this case via
recreational boating) spurred additional economic activity in other sectors as the money was re-spent
within the state or county. The total economic contribution of the investment was estimated by tracing
the flow of money between industries and households until all of the initial investment eventually left
the state or county through foreign or domestic trade, or was collected as a tax.
The data collected revealed the dollars spent monthly and seasonally on coastal or ocean recreational
boating related activities by county. These expenditures were then inflated from the sample to reflect
the likely total expenditures of all recreational boaters.
6.2.2 The IMPLAN Modeling System
This analysis used the IMPLAN modeling system to estimate economic contributions generated by the
spending of recreational boaters. IMPLAN is a widely used proprietary software, which combines the US
Bureau of Economic Analysis’ Input-Output Benchmarks data with other federal and regional
employment, wage, and industry data to construct quantitative models of the flow of goods and services
among businesses that purchase materials and services from one another and from employees who use
their increased earnings to purchase additional goods and services from local businesses.
The IMPLAN models for the state and counties reflect the typical expenditure patterns and industry
mixes of Massachusetts and its counties, including specific information about when expenditures leave
the state or county due to foreign and domestic trade and taxes. The spending patterns and foreign and
domestic trade assumptions in the IMPLAN models are based on federal and state government data
sources, including the US Census Bureau Economic Census, the US Bureau of Economic Analysis, and the
US Bureau of Labor Statistics, among other sources.

Massachusetts Recreational Boater Survey 2010 - Final Report 70 June 22, 2011
6.2.3 Data Cleaning and Analysis
For the purposes of the statewide and regional IMPLAN analyses, all monthly expenditures (mostly
vessel operating expenditures) were totaled along with the end of season expenditures (mostly capital
expenditures). As with any survey, some assumptions had to be made about the data in order to
complete the analysis. In the case of the monthly expenditure surveys, it was noted that expenditures
that were classified as “other” were often associated with maintenance or repair of the vessel.
Therefore, these expenditures were not included when conducting the IMPLAN analysis because of the
risk of double-counting the repair and maintenance expenditures reported in the end of the season
survey. The other major decision involved deciding how to treat expenditures in the “other” category
from the end of season survey. Most of these expenditures when examined more closely fell into
standard IMPLAN expenditure categories and so they were allocated to the relevant area for purposes
of the analysis. Expenditures (only $724,000) that could not be classified or that were clearly not related
to recreational boating were not included in the IMPLAN analysis. Finally, as is the case for all
expenditures (monthly and seasonal), spending on government taxes or registration fees was dropped
as this is a leakage out of the economy and is treated as such by IMPLAN.
6.3 Mapping Application Analysis
6.3.1 Data Cleaning
Post-processing activities include conversion of PostGIS datasets into shapefiles or attribute tables for
desktop review and analysis.
The final spatial database was provided as an ESRI-format personal geodatabase and includes only data
associated with valid survey participants. Additional features and data records associated with testing
activities were removed during post-processing.
6.3.2 Analysis
Analysis of the spatial features and associated attributes was performed only as part of the post-
processing database normalization and quality control activities. The results of these analyses have not
been reviewed and are provided solely for demonstration purposes only. More in-depth analysis will be
under taken by the MassGIS.

Massachusetts Recreational Boater Survey 2010 - Final Report 71 June 22, 2011
7 RESULTS
7.1 Vessel Information
The following information consists of a simple analysis of the information that survey participants
provided about their vessels and where they were kept. This information was then scaled up based on
the weighting described previously, so that these numbers represent an estimate for all boats in
Massachusetts. It is important to remember that these numbers differ from those reported early in the
section discussing the vessels in the registered boat database, as these are based on the responses from
both registered and documented boat owners. It is also important to note that the number of
responses from boaters in the Central and Western regions was low so results for those regions may not
accurately reflect the actual situation.
As has been previously suggested by analysis of the registered boat database, the most common vessel
type in Massachusetts was “open vessel”. The survey data suggested that 62.6% of boats were of this
type (Table 20). It is interesting to note that these data suggest the distribution of vessel types is
somewhat different for documented vessels. Almost 62% of documented boat owners reported that
their vessel was a sailboat, as compared to between 10.8% and 16.7% of registered boats owners.
However, a rough analysis of the raw documented vessel data suggested that only around 32% were
sailboats. It is possible that more owners of documented sailboats responded to the survey than
owners of documented powerboats.
Almost all other documented boats were cabin cruisers and it appears that almost no documented
vessels were open boats.
Table 20: Boat type by region based on responses to the initial survey.
Region OpenCabin
CruiserSailboat PWC Other n
Southeast 69.3% 13.2% 13.8% 1.7% 2.1% 230
East Centra l 69.6% 13.4% 11.4% 1.3% 4.3% 140
Northeast 73.2% 10.4% 10.8% 1.4% 4.3% 145
Centra l 66.7% 13.3% 13.3% 0.0% 6.7% 15
Western 66.7% 0.0% 16.7% 0.0% 16.7% 6
Documented 0.0% 35.2% 61.9% 0.0% 2.8% 110
All Massachusetts 62.6% 14.7% 17.7% 1.2% 3.8% 646
The fact that most documented vessels were either sailboats or cabin cruisers may be a reflection of the
fact that documented boats are generally larger vessels (almost 98% of documented boats are over 26
feet in length). There are relatively few Massachusetts registered boats of this size with most of them
being between 16 and 26 feet, or less than 16 feet (Table 21).

Massachusetts Recreational Boater Survey 2010 - Final Report 72 June 22, 2011
Table 21: Boat size class by region based on responses to the initial survey.
Region <16 16-<26 26-<40 40+ n
Southeast 30.0% 58.0% 11.7% 0.2% 230
East Centra l 33.0% 56.3% 10.7% 0.0% 140
Northeast 37.4% 52.6% 9.7% 0.4% 145
Centra l 6.7% 86.7% 6.7% 0.0% 15
Western 33.3% 66.7% 0.0% 0.0% 6
Documented 0.0% 2.2% 80.7% 17.1% 110
All Massachusetts 28.4% 51.6% 18.0% 2.0% 646
By far the most common hull material reported was fiberglass (76.1%). Inflatables accounted for almost
11% of hull types but appeared to be found only in the coastal regions (Table 22). This may reflect the
fact that many of these inflatables were probably used as tenders to access a larger vessel.
Table 22: Boat hull material by region based on responses to the initial survey.
Region Aluminum Fiberglass Inflatable Plastic Steel Wood Other NA n
Southeast 6.3% 79.2% 9.3% 2.3% 0.0% 2.5% 0.4% 0.0% 230
East Centra l 5.4% 71.3% 17.3% 0.7% 0.0% 5.4% 0.0% 0.0% 140
Northeast 15.9% 66.1% 13.7% 2.1% 0.0% 1.4% 0.7% 0.0% 145
Centra l 20.0% 80.0% 0.0% 0.0% 0.0% 0.0% 0.0% 0.0% 15
Western 16.7% 83.3% 0.0% 0.0% 0.0% 0.0% 0.0% 0.0% 6
Documented 0.3% 96.3% 0.0% 0.0% 0.3% 0.6% 0.0% 2.5% 110
All Massachusetts 8.5% 76.1% 10.8% 1.4% 0.0% 2.6% 0.3% 0.3% 646
Once again, the population of documented vessels in Massachusetts differed significantly compared
with registered boats when it comes to the type of engine or method of propulsion. Overall, almost 70%
of vessels were powered by outboard engines (Table 23). However, this did not hold true for only
documented vessels, which were almost entirely powered by inboard engines. Inboards were very
uncommon on registered boats. Once again, the difference between the propulsion systems for
documented vessels versus registered boats may well reflect that documented vessels were generally
larger and outboard engines are more commonly found on smaller, open boats. Inboard/outboard units
(or sterndrives) were the next most common propulsion system for registered boats.
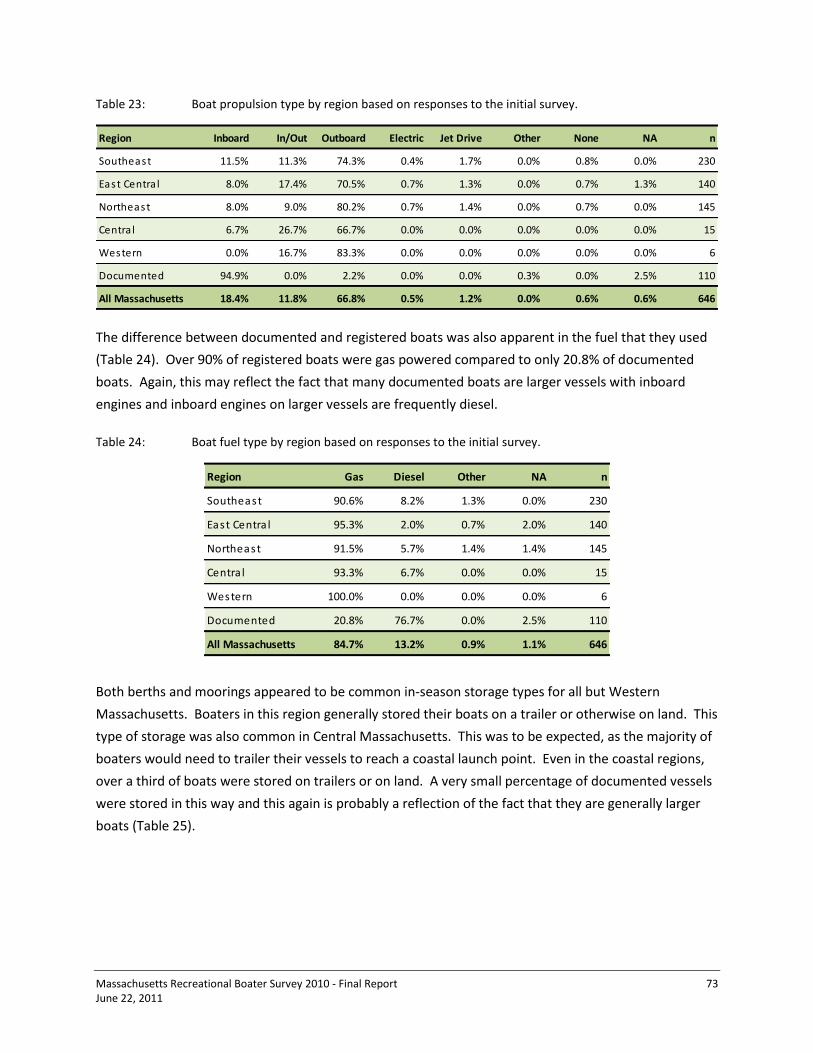
Massachusetts Recreational Boater Survey 2010 - Final Report 73 June 22, 2011
Table 23: Boat propulsion type by region based on responses to the initial survey.
Region Inboard In/Out Outboard Electric Jet Drive Other None NA n
Southeast 11.5% 11.3% 74.3% 0.4% 1.7% 0.0% 0.8% 0.0% 230
East Centra l 8.0% 17.4% 70.5% 0.7% 1.3% 0.0% 0.7% 1.3% 140
Northeast 8.0% 9.0% 80.2% 0.7% 1.4% 0.0% 0.7% 0.0% 145
Centra l 6.7% 26.7% 66.7% 0.0% 0.0% 0.0% 0.0% 0.0% 15
Western 0.0% 16.7% 83.3% 0.0% 0.0% 0.0% 0.0% 0.0% 6
Documented 94.9% 0.0% 2.2% 0.0% 0.0% 0.3% 0.0% 2.5% 110
All Massachusetts 18.4% 11.8% 66.8% 0.5% 1.2% 0.0% 0.6% 0.6% 646
The difference between documented and registered boats was also apparent in the fuel that they used
(Table 24). Over 90% of registered boats were gas powered compared to only 20.8% of documented
boats. Again, this may reflect the fact that many documented boats are larger vessels with inboard
engines and inboard engines on larger vessels are frequently diesel.
Table 24: Boat fuel type by region based on responses to the initial survey.
Region Gas Diesel Other NA n
Southeast 90.6% 8.2% 1.3% 0.0% 230
East Centra l 95.3% 2.0% 0.7% 2.0% 140
Northeast 91.5% 5.7% 1.4% 1.4% 145
Centra l 93.3% 6.7% 0.0% 0.0% 15
Western 100.0% 0.0% 0.0% 0.0% 6
Documented 20.8% 76.7% 0.0% 2.5% 110
All Massachusetts 84.7% 13.2% 0.9% 1.1% 646
Both berths and moorings appeared to be common in-season storage types for all but Western
Massachusetts. Boaters in this region generally stored their boats on a trailer or otherwise on land. This
type of storage was also common in Central Massachusetts. This was to be expected, as the majority of
boaters would need to trailer their vessels to reach a coastal launch point. Even in the coastal regions,
over a third of boats were stored on trailers or on land. A very small percentage of documented vessels
were stored in this way and this again is probably a reflection of the fact that they are generally larger
boats (Table 25).

Massachusetts Recreational Boater Survey 2010 - Final Report 74 June 22, 2011
Table 25: Boat in-season storage type by region based on responses to the initial survey.
Region Berth Mooring Dry StackTrailer/
LandOther n
Southeast 25.1% 34.1% 3.9% 34.0% 2.8% 230
East Centra l 30.0% 28.0% 2.3% 34.9% 4.8% 140
Northeast 22.4% 27.4% 3.6% 38.2% 8.5% 145
Centra l 20.0% 13.3% 0.0% 66.7% 0.0% 15
Western 0.0% 0.0% 0.0% 83.3% 16.7% 6
Documented 33.9% 63.9% 0.0% 2.2% 0.0% 110
All Massachusetts 25.9% 32.6% 2.7% 34.3% 4.5% 646
The most common storage facility type for registered boats was a residence. This could include storage
such as private berths, moorings, or on a trailer in a boater’s driveway. Central and Western regions
were again unique in that over 66% of boats were stored at residences compared to around 45% for
registered boats in other regions (Table 26). Few documented vessels were kept at residences. These
vessels were reasonably evenly split between commercial marinas (31.3%), clubs (26.5%) and municipal
facilities (30.4%). These three types of facilities were also commonly used for in-season storage by
boaters in the three coastal regions.
Table 26: Boat in-season storage facility type by region based on responses to the initial survey.
RegionCommercial
MarinaClub
Municipal
FacilityResidence Other NA n
Southeast 10.3% 12.2% 27.4% 46.8% 3.3% 0.0% 230
East Centra l 15.2% 17.5% 19.7% 43.7% 3.2% 0.7% 140
Northeast 13.2% 19.1% 20.4% 43.1% 3.6% 0.7% 145
Centra l 13.3% 6.7% 6.7% 66.7% 6.7% 0.0% 15
Western 0.0% 16.7% 0.0% 83.3% 0.0% 0.0% 6
Documented 31.3% 26.5% 30.4% 5.6% 1.4% 4.8% 110
All Massachusetts 14.4% 16.6% 22.6% 42.3% 3.2% 0.9% 646
Apart from a few documented vessels and a very few boats in the Southeast region, almost no vessels
appeared to be stored at berths or on a mooring out of season. By far the most common storage type
was on a trailer or otherwise on land. This is to be expected as one need only pass a marina or boatyard
to see numerous, shrink wrapped boats up on blocks for the winter. Between 6.3% and13.3% of
documented vessels and those from coastal regions were reportedly stored in dry stack facilities (Table
27)

Massachusetts Recreational Boater Survey 2010 - Final Report 75 June 22, 2011
Table 27: Boat out-of-season storage type by region based on responses to the initial survey.
Region Berth Mooring Dry StackTrailer/
LandOther NA n
Southeast 0.4% 0.7% 9.0% 79.5% 10.4% 0.0% 230
East Centra l 0.0% 0.7% 6.3% 77.0% 14.6% 1.3% 140
Northeast 0.0% 0.0% 7.6% 76.7% 15.6% 0.0% 145
Centra l 0.0% 0.0% 0.0% 100.0% 0.0% 0.0% 15
Western 0.0% 0.0% 0.0% 100.0% 0.0% 0.0% 6
Documented 4.8% 0.9% 13.3% 52.1% 29.0% 0.0% 110
All Massachusetts 0.7% 0.5% 7.9% 76.5% 14.1% 0.3% 646
The type of out-of-season storage facility was also different for registered and documented boats.
Between 73.5% and 100% of registered boats were stored at residences (Table 28) but this only true for
19.4% of documented vessels. Once again, this is probably because such vessels are generally larger and
cannot easily be stored at residences. Almost 60% of documented boats were stored at commercial
marinas during the winter.
Table 28: Boat out-of-season storage facility type by region based on responses to the initial survey.
RegionCommercial
MarinaClub
Municipal
FacilityResidence Other NA n
Southeast 14.0% 4.6% 1.6% 76.5% 2.9% 0.4% 230
East Centra l 11.4% 2.0% 0.7% 80.8% 5.2% 0.0% 140
Northeast 13.1% 4.1% 0.9% 73.5% 8.3% 0.0% 145
Centra l 13.3% 0.0% 0.0% 80.0% 6.7% 0.0% 15
Western 0.0% 0.0% 0.0% 100.0% 0.0% 0.0% 6
Documented 58.9% 9.3% 0.6% 19.4% 11.8% 0.0% 110
All Massachusetts 17.7% 4.0% 1.0% 71.3% 5.8% 0.1% 646
7.2 Boater Information
The following information consists of a simple analysis of the information that respondents provided
about themselves. This information was then scaled up based on the weighting described previously, so
that these numbers represent an estimate for all boat owners in Massachusetts. Again, it is important
to note that the number of responses from boaters in the Central and Western regions was low, so
results for those regions may not accurately reflect the actual situation.
As is commonly found in other areas of the US, boat owners were predominantly male (Table 29). The
maximum percentage of females was 6.7% in the Southeast region, followed by 4.2% in the Northeast.

Massachusetts Recreational Boater Survey 2010 - Final Report 76 June 22, 2011
Table 29: Boater’s sex by region based on responses to the initial survey. NA means “no answer”.
Region Male Female NA n
Southeast 93.3% 6.7% 0.0% 230
East Centra l 96.8% 2.5% 0.7% 140
Northeast 95.1% 4.2% 0.7% 145
Centra l 100.0% 0.0% 0.0% 15
Western 100.0% 0.0% 0.0% 6
Documented 96.3% 3.7% 0.0% 110
All Massachusetts 95.4% 4.3% 0.3% 646
The mean age of boaters was 58 years old across the whole of Massachusetts. The lowest mean was in
the Western region (50.2 years) and the highest mean was 59.8 years for owners of documented boats
(Table 30). This is slightly higher than the mean age for boaters in the Southeast region.
Table 30: Mean age of boaters by region based on responses to the initial survey.
Region n Mean
Southeast 224 59.7
East Centra l 139 57.5
Northeast 139 56.2
Centra l 15 55.1
Western 5 50.2
Documented 109 59.8
All Massachusetts 631 58.0
On average, owners of documented boats had operated boats for longer than registered boat owners
(36 years for documented boat owners and between 26 and 31 years for others). Boaters from Western
Massachusetts seemed to have the shortest history of being boat operators (Table 31) but the average
for this region was still over two and a half decades.

Massachusetts Recreational Boater Survey 2010 - Final Report 77 June 22, 2011
Table 31: Mean number of years respondents had been regular boat operators based on responses to the
initial survey.
Region n Mean
Southeast 229 30.3
East Centra l 140 30.4
Northeast 144 27.7
Centra l 15 31.0
Western 5 26.0
Documented 110 36.0
All Massachusetts 643 30.3
As would be expected, the mean number of years that boater’s had owned a boat was somewhat less
than the length of time they had operated one. Across Massachusetts, the mean duration of boat
ownership was 5.8 years less than the average length of time people had operated boats. Documented
boaters appeared to have owned boats for slightly longer than registered boat owners from different
regions of Massachusetts (Table 32). Again, the Western region had the lowest mean duration of boat
ownership, but this still spanned over two decades.
Table 32: Mean number of years respondents had owned a boat based on responses to the initial survey.
Region n Mean
Southeast 229 24.9
East Centra l 140 24.9
Northeast 144 22.1
Centra l 15 23.3
Western 5 21.6
Documented 110 28.0
All Massachusetts 643 24.5
Boaters were also asked if they had ever taken a boating safety course (e.g. Boat-Ed through the
Massachusetts Environmental Police). Across the state, approximately 53% of boaters reported that
they had taken such a course (Table 33). Owners of documented boats were most likely to have taken
such courses (63.4%). Again, this may reflect the fact that documented vessels are generally larger
boats. Well over half of boaters in the East Central and Northeast regions had taken such courses. In
the Southeastern region, this number fell to 46.5% of boaters and fell further to 33.3% to 40% in the
Western and Central regions.

Massachusetts Recreational Boater Survey 2010 - Final Report 78 June 22, 2011
Table 33: Percent of boaters who had taken a boating safety course based on responses to the initial
survey.
Region Yes No NA n
Southeast 46.5% 49.3% 4.2% 230
East Centra l 57.2% 35.8% 7.0% 140
Northeast 56.1% 37.0% 7.0% 145
Centra l 40.0% 60.0% 0.0% 15
Western 33.3% 50.0% 16.7% 6
Documented 63.4% 29.0% 7.6% 110
All Massachusetts 52.8% 41.2% 6.0% 646
Similarly, boaters were asked if they had ever taken a navigation course such as those offered by the US
Coast Guard Auxiliary, US Power Squadrons or American Sailing Association. While the percentage of all
boaters who had taken a navigation course was similar to the percentage who had taken a safety course
(53.9% versus 52.8%), significantly more owners of documented vessels had taken navigation courses as
opposed to other regions. Almost 81% of documented boat owners had taken a navigation course
(Table 34). The three coastal regions appeared to be similar with 50.3% to 55.5% having taken such
courses. In Western and Central regions, only a third of boaters reported that they had taken a
navigation course. This pattern may be a reflection of the general boat sizes within regions.
Documented vessels are generally larger and may be used for longer journeys that require better
navigation skills. Boats that are trailered from Central and Western regions will generally be smaller and
possibly only used for shorter, nearshore excursions that may not require advanced navigation skills.
Table 34: Percent of boaters who had taken a navigation course based on responses to the initial survey.
Region Yes No NA n
Southeast 50.3% 48.4% 1.3% 230
East Centra l 55.5% 41.8% 2.7% 140
Northeast 50.5% 47.4% 2.1% 145
Centra l 33.3% 66.7% 0.0% 15
Western 33.3% 50.0% 16.7% 6
Documented 80.9% 19.1% 0.0% 110
All Massachusetts 53.9% 44.1% 2.0% 646
The survey also asked boaters about their employment status. Almost 59% of respondents were
employed full-time. Western Massachusetts had the lowest percentage in full-time employment but
this may be a reflection of the fact that so few boaters from this region responded (Table 35). Overall,

Massachusetts Recreational Boater Survey 2010 - Final Report 79 June 22, 2011
the percentages ranged from 50% to a high of 66.7% for full-time employment. Relatively few boaters
reported that they were in part-time employment or were unemployed - 6% and 4.4% respectively
across the whole state. Just over 30% of boaters were retired. Again, data from Western Massachusetts
may be inaccurate due to low number of responses. In other regions, the percentage of retired boaters
ranged from a low of 26.7% in the Central region, to a high of 34.1% for the Southeast.
Table 35: Percent of boaters with different employment statuses based on responses to the initial survey.
Region Full-time Part-time Unemployed Retired NA n
Southeast 53.4% 9.2% 2.9% 34.1% 0.4% 230
East Centra l 60.6% 4.7% 4.0% 30.7% 0.0% 140
Northeast 62.8% 3.5% 5.0% 27.3% 1.4% 145
Centra l 66.7% 0.0% 6.7% 26.7% 0.0% 15
Western 50.0% 16.7% 16.7% 0.0% 16.7% 6
Documented 60.0% 5.1% 4.8% 30.2% 0.0% 110
All Massachusetts 58.7% 6.0% 4.4% 30.1% 0.8% 646
Boaters were also asked to report their estimated household income for 2009. As Table 36 shows,
14.4% of boaters chose not to provide this information. Overall, 34.3% of boat owners had a household
income of less than $100,000 in 2009, 26.6% earned between $100,000 and $150,000, 11% earned
between $150,000 and $200,000, and 13.6% earned over $200,000. This is illustrated in Figure 15. Data
for Western and Central Massachusetts are questionable due to low response rates. For the three
coastal regions, approximately 33% to 43% of boaters earned less than $100,000 in 2009 and around
58% to 66% earned less than $150,000. Information from documented vessel owners suggests that less
than 40% earned less than $150,000 in 2009 and only 15% earned less than $100,000. Therefore, the
majority of documented vessel owners had an estimated household income of greater than $150,000 in
2009. The fact that documented vessel owners seem to have higher incomes is not surprising as many
of these vessels are larger than average and likely more costly to buy and maintain.

Massachusetts Recreational Boater Survey 2010 - Final Report 80 June 22, 2011
Table 36: Percent of boaters with annual household incomes based on responses to the initial survey.
Region <25K25-
49.9K
50-
74.9K
75-
99.9K
100-
124.9K
125-
149.9K
150-
174.9K
175-
199.9K>200K NA n
Southeast 2.4% 6.8% 11.3% 12.1% 16.1% 9.5% 6.6% 3.8% 14.4% 17.1% 230
East Centra l 0.7% 9.0% 18.2% 16.1% 14.2% 9.0% 4.0% 4.0% 13.0% 11.9% 140
Northeast 1.4% 7.0% 16.0% 9.0% 20.9% 11.2% 6.5% 3.5% 15.5% 9.1% 145
Centra l 6.7% 13.3% 6.7% 26.7% 20.0% 0.0% 6.7% 0.0% 6.7% 13.3% 15
Western 0.0% 0.0% 0.0% 16.7% 50.0% 0.0% 0.0% 16.7% 0.0% 16.7% 6
Documented 0.0% 2.8% 10.1% 1.7% 18.3% 5.9% 17.2% 6.2% 14.1% 23.6% 110
All Massachusetts 1.6% 7.1% 13.6% 12.0% 17.9% 8.8% 6.9% 4.1% 13.6% 14.4% 646
0%
10%
20%
30%
40%
50%
60%
70%
80%
90%
100%
Southeast East Central Northeast Central * Western * Documented All MA
Pe
rce
nta
ge o
f Bo
ate
rs
<25K 25-49.9K 50-74.9K 75-99.9K 100-124.9K 125-149.9K 150-174.9K 175-199.9K >200K
Figure 15: Percent of boaters with specified annual household incomes based on responses to the initial
survey. * = low response numbers.
7.3 Boating-related Activity
The following section contains some initial analysis of the boat-related activity on which participants
were asked to report each month. The economic analysis related to this information can be found later
in the document.
As previously stated, this study was interested in both visits to the boat (without an on-water trip), and
visits to the boat that include an on-water trip. This section differentiates between boat owners just
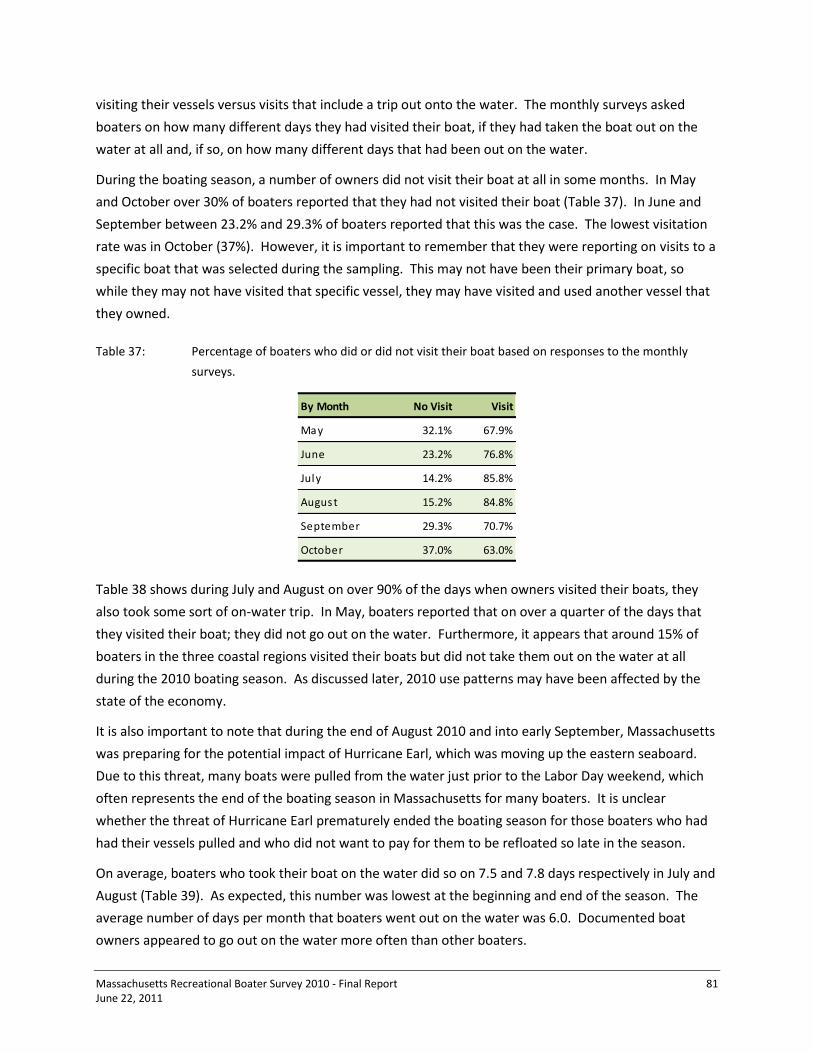
Massachusetts Recreational Boater Survey 2010 - Final Report 81 June 22, 2011
visiting their vessels versus visits that include a trip out onto the water. The monthly surveys asked
boaters on how many different days they had visited their boat, if they had taken the boat out on the
water at all and, if so, on how many different days that had been out on the water.
During the boating season, a number of owners did not visit their boat at all in some months. In May
and October over 30% of boaters reported that they had not visited their boat (Table 37). In June and
September between 23.2% and 29.3% of boaters reported that this was the case. The lowest visitation
rate was in October (37%). However, it is important to remember that they were reporting on visits to a
specific boat that was selected during the sampling. This may not have been their primary boat, so
while they may not have visited that specific vessel, they may have visited and used another vessel that
they owned.
Table 37: Percentage of boaters who did or did not visit their boat based on responses to the monthly
surveys.
By Month No Visit Visit
May 32.1% 67.9%
June 23.2% 76.8%
July 14.2% 85.8%
August 15.2% 84.8%
September 29.3% 70.7%
October 37.0% 63.0%
Table 38 shows during July and August on over 90% of the days when owners visited their boats, they
also took some sort of on-water trip. In May, boaters reported that on over a quarter of the days that
they visited their boat; they did not go out on the water. Furthermore, it appears that around 15% of
boaters in the three coastal regions visited their boats but did not take them out on the water at all
during the 2010 boating season. As discussed later, 2010 use patterns may have been affected by the
state of the economy.
It is also important to note that during the end of August 2010 and into early September, Massachusetts
was preparing for the potential impact of Hurricane Earl, which was moving up the eastern seaboard.
Due to this threat, many boats were pulled from the water just prior to the Labor Day weekend, which
often represents the end of the boating season in Massachusetts for many boaters. It is unclear
whether the threat of Hurricane Earl prematurely ended the boating season for those boaters who had
had their vessels pulled and who did not want to pay for them to be refloated so late in the season.
On average, boaters who took their boat on the water did so on 7.5 and 7.8 days respectively in July and
August (Table 39). As expected, this number was lowest at the beginning and end of the season. The
average number of days per month that boaters went out on the water was 6.0. Documented boat
owners appeared to go out on the water more often than other boaters.
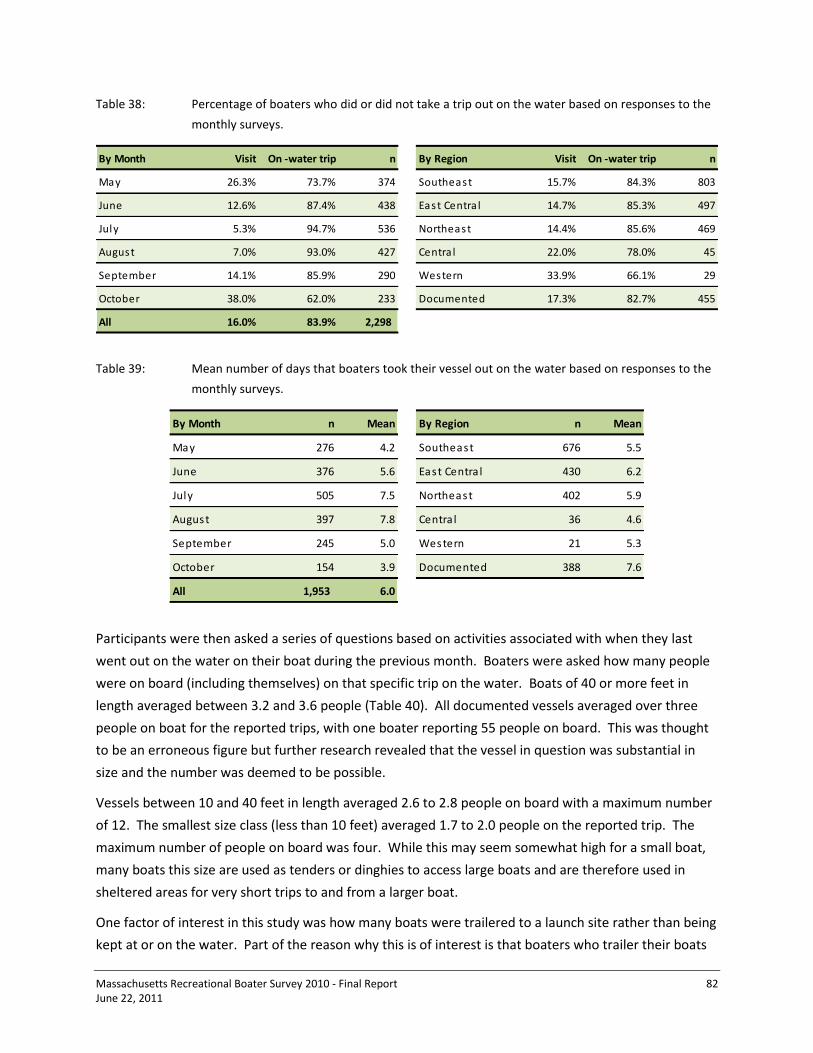
Massachusetts Recreational Boater Survey 2010 - Final Report 82 June 22, 2011
Table 38: Percentage of boaters who did or did not take a trip out on the water based on responses to the
monthly surveys.
By Month Visit On -water trip n By Region Visit On -water trip n
May 26.3% 73.7% 374 Southeast 15.7% 84.3% 803
June 12.6% 87.4% 438 East Centra l 14.7% 85.3% 497
July 5.3% 94.7% 536 Northeast 14.4% 85.6% 469
August 7.0% 93.0% 427 Centra l 22.0% 78.0% 45
September 14.1% 85.9% 290 Western 33.9% 66.1% 29
October 38.0% 62.0% 233 Documented 17.3% 82.7% 455
All 16.0% 83.9% 2,298
Table 39: Mean number of days that boaters took their vessel out on the water based on responses to the
monthly surveys.
By Month n Mean By Region n Mean
May 276 4.2 Southeast 676 5.5
June 376 5.6 East Centra l 430 6.2
July 505 7.5 Northeast 402 5.9
August 397 7.8 Centra l 36 4.6
September 245 5.0 Western 21 5.3
October 154 3.9 Documented 388 7.6
All 1,953 6.0
Participants were then asked a series of questions based on activities associated with when they last
went out on the water on their boat during the previous month. Boaters were asked how many people
were on board (including themselves) on that specific trip on the water. Boats of 40 or more feet in
length averaged between 3.2 and 3.6 people (Table 40). All documented vessels averaged over three
people on boat for the reported trips, with one boater reporting 55 people on board. This was thought
to be an erroneous figure but further research revealed that the vessel in question was substantial in
size and the number was deemed to be possible.
Vessels between 10 and 40 feet in length averaged 2.6 to 2.8 people on board with a maximum number
of 12. The smallest size class (less than 10 feet) averaged 1.7 to 2.0 people on the reported trip. The
maximum number of people on board was four. While this may seem somewhat high for a small boat,
many boats this size are used as tenders or dinghies to access large boats and are therefore used in
sheltered areas for very short trips to and from a larger boat.
One factor of interest in this study was how many boats were trailered to a launch site rather than being
kept at or on the water. Part of the reason why this is of interest is that boaters who trailer their boats

Massachusetts Recreational Boater Survey 2010 - Final Report 83 June 22, 2011
differ significantly from those who keep theirs at a mooring or slip. Those who trailer their boats have
greater flexibility as to what body of water they want to visit as they are able to use boat ramps in
numerous locations. However, they are also dependent on there being a suitable boat ramp in the area
and sufficient support infrastructure to facilitate their trip (e.g. sufficient vehicle and trailer parking).
Table 40: Mean and maximum number of people on board during the reported trip based on responses to
the monthly surveys.
Region Size Class n Mean Max
Southeast <10 43 1.7 4
10 to <40 618 2.6 8
40+ 5 3.2 6
East Centra l <10 33 2.0 4
10 to <40 387 2.8 10
40+ NO DATA
Northeast <10 39 1.7 4
10 to <40 350 2.6 12
40+ 5 3.5 4
Centra l Al l 36 3.1 7
Western Al l 21 2.9 6
Documented <40 98 3.2 8
40+ 288 3.6 55
All Massachusetts 1,923 2.7
Additionally, there are vessel size limitations associated with trailering. In general, it is not practical or
cost effective to trailer large boats to and from launch sites on a regular basis. Large vessels are often
pulled at the end of the boating season to be stored at sites away from the water during the winter.
However, this often requires the use of hydraulic trailers that are generally too expensive to be
individually owned. Also, many boat ramps are not designed to handle boats over a certain size. There
are also significant expenses involved with trailering a boat both in terms of fuel costs associated with
towing a vessel, and the launch fees and trailer parking fees. Because of this, trailering is generally
associated with smaller vessels and a potentially more mobile type of boater.
Table 41 summarizes the information about boaters who trailered their vessel by month and by region.
Across Massachusetts, 28.3% of reported trips involved trailering a boat. There was little variation by
month with September being the lowest at 25.3%, and June being the highest at 30.4%.
There appear to be differences in boat trailering between regions in Massachusetts and documented
boats. Documented vessels are generally large and are clearly not trailered for boat trips. As the

Massachusetts Recreational Boater Survey 2010 - Final Report 84 June 22, 2011
Central and Western regions are further from coastal waters, it would be expected that more vessels
would be trailered from these areas as compared to coastal regions. This was supported by the results:
59.6% of trips by Central region boaters and 71.7% of trips by Western region boaters involved
trailering, compared to between 28% and 31.9% of boaters from the three coastal regions.
Table 41: Percentage of boaters who trailered their boat to a launch location during the reported trip
based on responses to the monthly surveys.
By Month No Trailer Trailer n By Region No Trailer Trailer n
May 70.2% 29.8% 279 Southeast 72.0% 28.0% 683
June 69.6% 30.4% 380 East Centra l 69.0% 31.0% 433
July 72.8% 27.2% 507 Northeast 68.1% 31.9% 406
August 71.5% 28.5% 399 Centra l 40.4% 59.6% 36
September 74.7% 25.3% 247 Western 28.3% 71.7% 21
October 71.1% 28.9% 155 Documented 100.0% 0.0% 388
All 71.7% 28.3% 1,967
The boaters were then asked the type of location from which the boat was trailered. The vast majority
of trailered trips originated at the boater’s permanent home (79.9%) with a further 10.8% starting at a
second home (Table 42). Trailering from marinas or dry stack facilities, friends’ or relatives’ houses or
other types of facilities each accounted for a small percentage of departure locations.
Table 42: Percentage of boaters who trailered their boats from different location types during the reported
trip based on responses to the monthly surveys.
By RegionPremanent
home
Second
home
Marina /
Dry Stack
General
commercial
storage
Friend's /
relative's
house
Other NA n
Southeast 73.6% 17.2% 3.4% 0.0% 2.3% 3.4% 0.0% 195
East Centra l 82.1% 11.4% 2.5% 0.6% 2.2% 1.1% 0.0% 141
Northeast 79.0% 7.4% 4.5% 0.7% 4.3% 2.7% 1.4% 131
Centra l 90.2% 0.0% 0.0% 0.0% 0.0% 9.8% 0.0% 22
Western 100.0% 0.0% 0.0% 0.0% 0.0% 0.0% 0.0% 15
Documented 0.0% 0.0% 0.0% 0.0% 0.0% 0.0% 0.0% 0
All Massachusetts 79.9% 10.8% 3.1% 0.4% 2.6% 2.9% 0.4% 504
An important factor associated with trailering a boat is the fees associated with launching. These may
be in the form of launch fees or fees associated with parking a vehicle and trailer at a launch facility.
Across the state, 37.5% of boaters reported that there were such fees associated with trailering and

Massachusetts Recreational Boater Survey 2010 - Final Report 85 June 22, 2011
launching their boat (Table 43). Not surprisingly, there was little variation throughout the season.
However, only between 30.5% and 38.8% of boaters from coastal regions reported paying fees as
compared with 46.7% to 64.7% of boaters from Western and Central regions respectively.
Table 43: Percentage of boaters who paid a launch fee or a parking fee at a launch site during the reported
trip based on responses to the monthly surveys.
By Month Fee No Fee Yes n By Region Fee No Fee Yes n
May 68.0% 32.0% 73 Southeast 69.5% 30.5% 195
June 65.0% 35.0% 105 East Centra l 61.2% 38.8% 141
July 60.6% 39.4% 126 Northeast 64.6% 35.4% 130
August 60.1% 39.9% 104 Centra l 35.3% 64.7% 22
September 54.8% 45.2% 57 Western 53.3% 46.7% 15
October 70.0% 30.0% 38 Documented 0.0% 0.0% 0
All 62.5% 37.5% 503
Those boaters who had paid fees associated with launching a trailered boat were asked to specify the
amounts paid. The mean cost was $13.94 per trip, with coastal regions ranging between $13.24 and
$17.27 (Table 44). The average amount paid by boaters from Western Massachusetts was $11.87, and
boaters from Central Massachusetts averaged $8.55. The maximum of $120 in the East Central region
was initially flagged as suspect but several other boaters from that region reported fees associated with
launching a trailered boat of $85. It was therefore retained for the analysis.
An important factor associated with boating activity is the distance traveled to the water, as there are
real costs associated with this. Participants were asked to report the number of miles that they drove or
otherwise travelled to reach the place where they launched or boarded their vessel. Not surprisingly,
the coastal regions reported the lowest numbers, with a mean of 14.9 miles for the East Central region,
14.2 miles for the Northeast region and only 9.1 miles for the Southeast region (Table 45). The lower
number for the Southeastern region may reflect the fact that much of this region consists of Cape Cod
and the Island and therefore physical proximity to the water is reduced. Boaters from Central and
Western regions reported an average of 31.2 and 54.5 miles respectively, and documented boaters
averaged 37.4 miles. While the maximum numbers of miles traveled may seem high, it is important to
remember that the maximum represents an extreme and the documented vessel owner who reported a
900-mile trip may have been going to down south to pick up his vessel and bring it back to New England
for the summer.

Massachusetts Recreational Boater Survey 2010 - Final Report 86 June 22, 2011
Table 44: Mean amount that boats paid as a launch fee or a parking fee at a launch site during the
reported trip based on responses to the monthly surveys.
Region Size Class n Mean Max
Southeast <10 NO DATA
10 to <40 61 $13.24 $60.00
40+ NO DATA
East Centra l <10 NO DATA
10 to <40 52 $17.27 $120.00
40+ NO DATA
Northeast <10 NO DATA
10 to <40 41 $14.32 $75.00
40+ NO DATA
Centra l Al l 14 $8.55 $20.00
Western Al l 7 $11.87 $20.00
Documented <40 NO DATA
40+ NO DATA
All Massachusetts 175 $13.94
Table 45: Mean number of miles traveled to reach the site where boaters launched or boarded their vessel
during the reported trip based on responses to the monthly surveys.
By Region n Mean Max
Southeast 673 9.1 163
East Centra l 424 14.9 380
Northeast 398 14.2 400
Centra l 36 31.2 250
Western 21 54.5 300
Documented 378 37.4 900
All 1,930 16.8
Boaters were asked to identify what activities they were engaged in during their last boating trip. It is
important to note that they were asked to check “all that apply” rather than being limited to a primary
activity and that the percentages are based on those who said “yes”, “no” or “no answer” (i.e. “no
answer” was not assumed to be “no”).
Table 46 is conditionally-shaded (red to green = high to low) to compare the relative percentages of
“yes” answers to all others. Overall activity engagement is ranked from general cruising (67.4%),

Massachusetts Recreational Boater Survey 2010 - Final Report 87 June 22, 2011
entertaining friends and family (47.6%), fishing (38.1%), sightseeing (36%), swimming (25.2%), and
sailing (19.3%).
Table 47 illustrates the same information but conditionally-shaded to highlight seasonal variations
within each activity type (red to green = high to low). General water-based activities such as cruising,
general on-board entertaining, and sightseeing appeared to be most popular during the peak season
months of July and August. Those activities that involved direct contact with the water (i.e. scuba
diving, snorkeling, swimming, waterskiing and wakeboarding) were clearly seasonal and were most
popular during the warmest months of July and August. Fishing, one of the more popular activities,
varied little over the season (answer of “yes” by boaters ranged from 37.2% to 40.1%) but appeared to
be slightly more popular earlier in the season. Hunting, while clearly not a common activity, seemed to
be much more common at the end of the season (jumping to 2.5% of activity from 0.7% or less in other
months) which probably reflects the fact that the hunting season for ducks starts in early October.
Whale watching seemed to be popular in May (3.4%) and peaks in July and August at 3.7% and 5.5%
respectively. Bird watching did not vary much over the season but seemed to gradually increase from
10.1% in May to 13.2% in September and October. This late season interest may be tied to fall
migrations.
The survey also asked boaters to estimate how much of their spending had occurred “near” to the site
that they launched or boarded their boat. As discussed earlier, there are many ways in which this
question could have been asked and all have pros and cons. However, what was clear was that most
spending occurred local to where boaters launched or boarded their vessels (Figure 16). This is
important economically as it could represent a significant boost to the local economy if boaters are
travelling to an area to launch or board their vessel and most of their expenditure occurs near to that
location.

Massachusetts Recreational Boater Survey 2010 - Final Report 88 June 22, 2011
Table 46: Percentage of boaters who engaged in specific activities during their monthly reported
trip. Shading is based on overall relative responses (high percentage = red, low percentage = green).
Yes No NA Yes No NA Yes No NA Yes No NA
May 65.1% 19.4% 15.6% 40.0% 32.7% 27.3% 40.1% 38.6% 21.3% 0.0% 57.7% 42.3%
June 67.8% 16.0% 16.2% 52.2% 20.0% 27.8% 39.9% 32.5% 27.6% 0.0% 49.9% 50.1%
July 71.6% 13.7% 14.7% 57.0% 20.1% 22.9% 37.2% 32.7% 30.1% 0.2% 49.8% 50.0%
August 75.2% 10.6% 14.2% 54.3% 17.4% 28.3% 39.0% 31.5% 29.5% 0.7% 47.2% 52.1%
September 60.3% 18.8% 20.9% 37.4% 27.7% 34.9% 34.0% 37.2% 28.8% 0.4% 48.0% 51.7%
October 55.0% 22.8% 22.2% 32.7% 36.8% 30.5% 38.9% 36.7% 24.4% 2.5% 50.7% 46.9%
All 67.4% 15.9% 16.7% 47.6% 24.1% 28.2% 38.1% 34.3% 27.5% 0.5% 50.1% 49.4%
Yes No NA Yes No NA Yes No NA Yes No NA
May 3.4% 55.6% 41.0% 10.1% 52.0% 37.9% 0.2% 57.5% 42.3% 14.6% 48.7% 36.8%
June 1.8% 48.9% 49.3% 11.5% 40.9% 47.7% 1.7% 49.0% 49.3% 21.0% 36.7% 42.3%
July 3.7% 48.8% 47.6% 12.8% 40.4% 46.8% 1.6% 49.0% 49.4% 20.2% 38.1% 41.7%
August 5.5% 43.9% 50.6% 12.0% 38.0% 50.0% 1.2% 47.1% 51.6% 18.4% 36.8% 44.8%
September 2.2% 46.4% 51.4% 13.2% 40.6% 46.1% 1.9% 46.2% 51.9% 21.7% 35.3% 43.0%
October 0.9% 50.7% 48.4% 13.2% 43.2% 43.6% 0.0% 50.9% 49.1% 19.3% 37.6% 43.1%
All 3.2% 48.5% 48.3% 12.1% 41.9% 46.0% 1.2% 49.5% 49.3% 19.4% 38.5% 42.2%
Yes No NA Yes No NA Yes No NA Yes No NA
May 2.4% 56.0% 41.5% 29.6% 39.3% 31.1% 8.1% 52.5% 39.4% 1.9% 56.2% 41.9%
June 2.9% 47.0% 50.1% 33.5% 29.0% 37.5% 28.7% 34.0% 37.3% 2.9% 48.2% 49.0%
July 5.3% 47.0% 47.7% 39.4% 26.0% 34.6% 39.3% 29.9% 30.8% 4.8% 48.1% 47.1%
August 4.8% 43.9% 51.3% 45.8% 20.7% 33.6% 37.7% 27.9% 34.5% 5.2% 44.6% 50.2%
September 1.1% 47.4% 51.5% 30.1% 32.0% 37.9% 13.3% 40.1% 46.6% 0.7% 48.0% 51.4%
October 1.5% 51.4% 47.1% 31.1% 35.8% 33.1% 4.9% 48.7% 46.4% 1.2% 51.5% 47.3%
All 3.3% 48.1% 48.6% 36.0% 29.2% 34.8% 25.2% 36.8% 38.0% 3.1% 48.8% 48.1%
Yes No NA
May 94.6% 5.4% 0.0% 279
June 94.6% 4.7% 0.8% 381
July 95.6% 4.2% 0.2% 507
August 95.1% 4.9% 0.0% 399
September 91.9% 8.1% 0.0% 247
October 81.4% 18.6% 0.0% 155
All 93.1% 6.7% 0.2% 1,968
Month
Month
WHALE WATCHING
SIGHTSEEING SWIMMING WATERSKIING
Month
Month
OTHER
CRUISING ENTERTAINING FISHING/SHELLFISHING HUNTING
BIRD WATCHING RACING SAILING
SCUBA / SNORKELLING
n

Massachusetts Recreational Boater Survey 2010 - Final Report 89 June 22, 2011
Table 47: Percentage of boaters who engaged in specific activities during the monthly reported trip. The
percentages are conditionally-shaded to highlight seasonal variations within each activity type
(high percentage = red, low percentage = green).
Yes No NA Yes No NA Yes No NA Yes No NA
May 65.1% 19.4% 15.6% 40.0% 32.7% 27.3% 40.1% 38.6% 21.3% 0.0% 57.7% 42.3%
June 67.8% 16.0% 16.2% 52.2% 20.0% 27.8% 39.9% 32.5% 27.6% 0.0% 49.9% 50.1%
July 71.6% 13.7% 14.7% 57.0% 20.1% 22.9% 37.2% 32.7% 30.1% 0.2% 49.8% 50.0%
August 75.2% 10.6% 14.2% 54.3% 17.4% 28.3% 39.0% 31.5% 29.5% 0.7% 47.2% 52.1%
September 60.3% 18.8% 20.9% 37.4% 27.7% 34.9% 34.0% 37.2% 28.8% 0.4% 48.0% 51.7%
October 55.0% 22.8% 22.2% 32.7% 36.8% 30.5% 38.9% 36.7% 24.4% 2.5% 50.7% 46.9%
All 67.4% 15.9% 16.7% 47.6% 24.1% 28.2% 38.1% 34.3% 27.5% 0.5% 50.1% 49.4%
Yes No NA Yes No NA Yes No NA Yes No NA
May 3.4% 55.6% 41.0% 10.1% 52.0% 37.9% 0.2% 57.5% 42.3% 14.6% 48.7% 36.8%
June 1.8% 48.9% 49.3% 11.5% 40.9% 47.7% 1.7% 49.0% 49.3% 21.0% 36.7% 42.3%
July 3.7% 48.8% 47.6% 12.8% 40.4% 46.8% 1.6% 49.0% 49.4% 20.2% 38.1% 41.7%
August 5.5% 43.9% 50.6% 12.0% 38.0% 50.0% 1.2% 47.1% 51.6% 18.4% 36.8% 44.8%
September 2.2% 46.4% 51.4% 13.2% 40.6% 46.1% 1.9% 46.2% 51.9% 21.7% 35.3% 43.0%
October 0.9% 50.7% 48.4% 13.2% 43.2% 43.6% 0.0% 50.9% 49.1% 19.3% 37.6% 43.1%
All 3.2% 48.5% 48.3% 12.1% 41.9% 46.0% 1.2% 49.5% 49.3% 19.4% 38.5% 42.2%
Yes No NA Yes No NA Yes No NA Yes No NA
May 2.4% 56.0% 41.5% 29.6% 39.3% 31.1% 8.1% 52.5% 39.4% 1.9% 56.2% 41.9%
June 2.9% 47.0% 50.1% 33.5% 29.0% 37.5% 28.7% 34.0% 37.3% 2.9% 48.2% 49.0%
July 5.3% 47.0% 47.7% 39.4% 26.0% 34.6% 39.3% 29.9% 30.8% 4.8% 48.1% 47.1%
August 4.8% 43.9% 51.3% 45.8% 20.7% 33.6% 37.7% 27.9% 34.5% 5.2% 44.6% 50.2%
September 1.1% 47.4% 51.5% 30.1% 32.0% 37.9% 13.3% 40.1% 46.6% 0.7% 48.0% 51.4%
October 1.5% 51.4% 47.1% 31.1% 35.8% 33.1% 4.9% 48.7% 46.4% 1.2% 51.5% 47.3%
All 3.3% 48.1% 48.6% 36.0% 29.2% 34.8% 25.2% 36.8% 38.0% 3.1% 48.8% 48.1%
Yes No NA
May 94.6% 5.4% 0.0% 279
June 94.6% 4.7% 0.8% 381
July 95.6% 4.2% 0.2% 507
August 95.1% 4.9% 0.0% 399
September 91.9% 8.1% 0.0% 247
October 81.4% 18.6% 0.0% 155
All 93.1% 6.7% 0.2% 1,968
Month
Month
WHALE WATCHING
SIGHTSEEING SWIMMING WATERSKIING
Month
Month
OTHER
CRUISING ENTERTAINING FISHING/SHELLFISHING HUNTING
BIRD WATCHING RACING SAILING
SCUBA / SNORKELLING
n

Massachusetts Recreational Boater Survey 2010 - Final Report 90 June 22, 2011
0%
10%
20%
30%
40%
50%
60%
70%
0%
1-1
0%
11
-20
%
21
-30
%
31
-40
%
41
-50
%
51
-60
%
61
-70
%
71
-80
%
81
-90
%
91
-10
0%
Un
kno
wn
Pe
rce
nta
ge o
f Sp
en
din
g "N
ear
" to
Lau
nch
or
Bo
ard
ing
Loca
tio
n
Visit-related Spending On-water, Trip-related Spending
Figure 16: The percentage of visit-related or trip-related spending that occurred “near to” the launch or
boarding location based on responses to the monthly surveys.

Massachusetts Recreational Boater Survey 2010 - Final Report 91 June 22, 2011
7.4 Economic Contribution
It is important to note that by several measures the Massachusetts economy was just starting to
recover from the severe 2008-2009 recession at the time of this survey and thus the estimates of
recreational spending are likely to be below what they would normally be for a more robust period.
Recreational spending is highly discretionary and likely to be one of the first areas to feel
recessionary pressures and one of the last areas to recover. Massachusetts personal income (the
total amount of wages, salaries, and benefits earned in the state in a given year) was stagnant in real
terms (inflation adjusted) between 2007 and 2008 and fell by 2.15% in 2009 to below $300 million
(inflation adjusted – measured in 2005 dollars). It began to recover in 2010, but was still down 0.4%
in real terms from its 2007 level. This decline was also reflected in overall employment in the
Commonwealth, which was down 3.3% in 2010 from its 2007 level and the unemployment rate,
which had climbed from 4.4% in 2007 to 8.9% in 2010.
Based on the data gathered during this study, coastal and ocean recreational boaters in Massachusetts
spent, on average, $529 million on products and/or services of Massachusetts businesses. Table 48
shows the breakdown of expenditures by major category from the monthly trip and seasonal surveys.
In-state spending by these boat owners took place in a variety of sectors. The highest trip-related levels
of spending were on boat fuel and transient/guest dockage. The highest levels of non-trip-related
spending (i.e., yearly capital and maintenance expenditures) were on seasonal dockage, mooring and
storage; and routine maintenance.
This initial spending by boaters continued to generate economic effects in the state. The IMPLAN
software and data packages for Massachusetts were used to model the later rounds of local spending
that followed the initial expenditures by recreational boaters. Each dollar of direct spending leads to
additional inter-industry purchases by businesses affected by this spending. This is known as the
indirect effect. This direct and indirect spending results in an increase in income for households
providing labor to these industries, which causes them to increase their spending. This is known as the
induced effect. The summation of the indirect and induced effects reveals the additional economic
impact of an increase in direct spending in the economy. In this case (see Table 49), the model showed
that a variety of sectors benefited from these successive rounds of spending, including trade,
transportation and utilities; professional business services; and financial activities.
Thus, the total economic contribution of coastal and ocean recreational boating expenditures to
Massachusetts in 2010 was at least almost $806 million. This is a conservative estimate because it did
not include any expenditure by out-of-state boaters since they were not included in the main study. It
also only reflected monthly coastal and ocean boating activity from May through October in addition to
yearly capital and maintenance expenditures. In addition, as noted earlier, this survey was conducted
just as Massachusetts was coming out of a severe recession and thus overall expenditures were likely to
be considerably lower than during a more prosperous economic period.
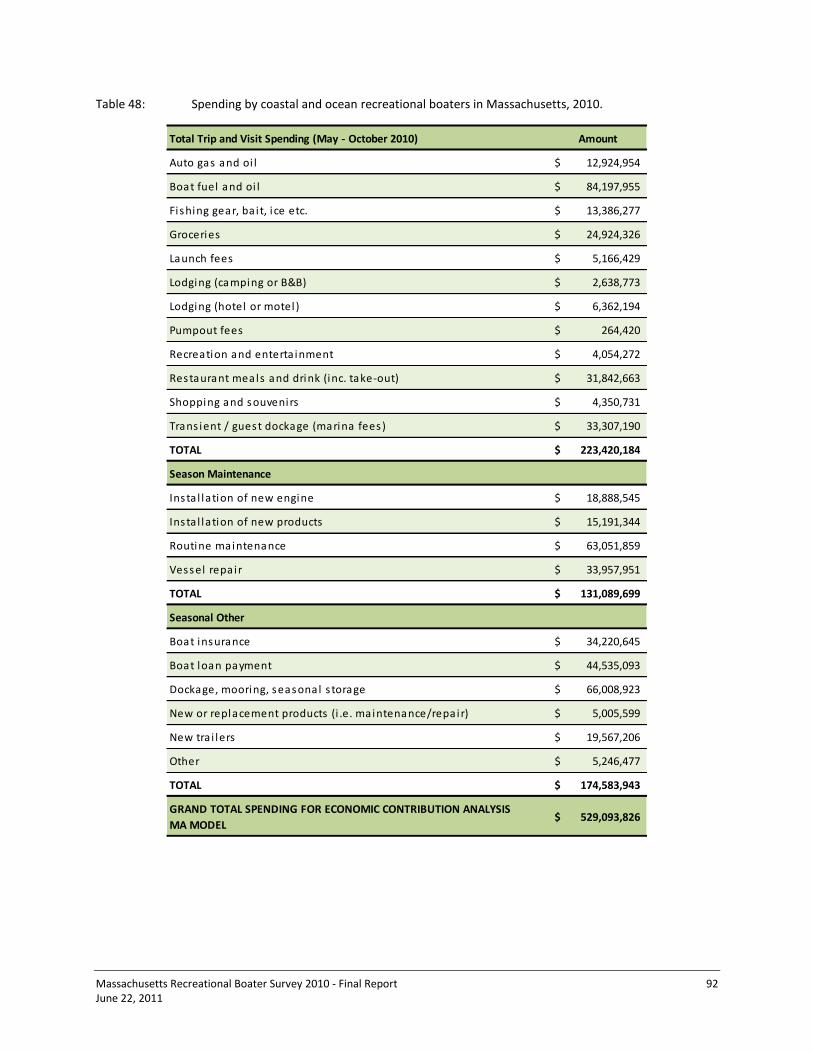
Massachusetts Recreational Boater Survey 2010 - Final Report 92 June 22, 2011
Table 48: Spending by coastal and ocean recreational boaters in Massachusetts, 2010.
Total Trip and Visit Spending (May - October 2010) Amount
Auto gas and oi l 12,924,954$
Boat fuel and oi l 84,197,955$
Fi shing gear, ba i t, i ce etc. 13,386,277$
Groceries 24,924,326$
Launch fees 5,166,429$
Lodging (camping or B&B) 2,638,773$
Lodging (hotel or motel ) 6,362,194$
Pumpout fees 264,420$
Recreation and enterta inment 4,054,272$
Restaurant meals and drink (inc. take-out) 31,842,663$
Shopping and souvenirs 4,350,731$
Trans ient / guest dockage (marina fees) 33,307,190$
TOTAL 223,420,184$
Season Maintenance
Insta l lation of new engine 18,888,545$
Insta l lation of new products 15,191,344$
Routine maintenance 63,051,859$
Vessel repair 33,957,951$
TOTAL 131,089,699$
Seasonal Other
Boat insurance 34,220,645$
Boat loan payment 44,535,093$
Dockage, mooring, seasonal s torage 66,008,923$
New or replacement products (i .e. maintenance/repair) 5,005,599$
New tra i lers 19,567,206$
Other 5,246,477$
TOTAL 174,583,943$
GRAND TOTAL SPENDING FOR ECONOMIC CONTRIBUTION ANALYSIS
MA MODEL529,093,826$

Massachusetts Recreational Boater Survey 2010 - Final Report 93 June 22, 2011
Table 49: Summary of indirect and induced effects (by category) of coastal and ocean recreational boating
spending in Massachusetts, 2010.
NAICS Super Sectors Amount
Construction 2,943,411$
Education and health services 26,027,221$
Financia l Activi ties 32,600,370$
Government 23,955,635$
Information 16,216,932$
Leisure and hospita l i ty 15,118,346$
Manufacturing 24,223,487$
Natura l resources and mining 493,828$
Other services 9,777,484$
Profess ional and bus iness services 48,427,778$
Rea l estate and renta l and leas ing 24,744,756$
Trade, transportation and uti l i ties 52,196,909$
TOTAL 276,726,157$
Another important contribution related to the spending of recreational boaters is the employment
supported by that spending within the state. The $529 million of spending by coastal and ocean
recreational boaters supported over 4,730 fulltime-equivalent jobs within the state. This total reflects
both the jobs directly supported by the spending as well as the jobs created in supplier businesses (by
the indirect and induced expenditures). In terms of sheer numbers of jobs directly supported by coastal
and ocean recreational boating expenditures, the sectors most impacted included: leisure and
hospitality; other services; and trade, transportation and utilities as shown in Table 50. Once again, it is
important to note that this study did not include out-of-state boaters and as such may under estimate
both spending and the number of jobs supported.

Massachusetts Recreational Boater Survey 2010 - Final Report 94 June 22, 2011
Table 50: Total jobs supported by coastal and ocean recreational boating spending in Massachusetts, 2010.
NAICS Super Sectors Number
Construction 24
Education and health services 262
Financia l Activi ties 424
Government 23
Information 43
Leisure and hospita l i ty 1,720
Manufacturing 59
Natura l resources and mining 7
Other services 869
Profess ional and bus iness services 387
Rea l estate and renta l and leas ing 100
Trade, transportation and uti l i ties 821
TOTAL 4,739
There was a sufficient sample of boaters in an agglomeration of some of the coastal counties for a
regional IMPLAN analysis of two key coastal areas to be performed – the Southeast region, consisting of
Barnstable, Bristol, Nantucket, and Dukes counties, and the East Central region, consisting of Norfolk,
Suffolk, and Plymouth counties.
In the Southeast region of the state, recreational boaters spent over $121 million in 2010 on
recreational boating related activities and products (see Table 51).

Massachusetts Recreational Boater Survey 2010 - Final Report 95 June 22, 2011
Table 51: Spending by coastal and ocean recreational boaters in the Southeast Region, 2010.
Total Trip and Visit Spending (May - October 2010) Amount
Auto gas and oi l 1,774,016$
Boat fuel and oi l 25,971,480$
Fi shing gear, ba i t, i ce etc. 3,133,318$
Groceries 5,081,987$
Launch fees 1,325,907$
Lodging (camping or B&B) 97,740$
Lodging (hotel or motel ) 399,293$
Pumpout fees 38,253$
Recreation and enterta inment 726,241$
Restaurant meals and drink (inc. take-out) 7,988,910$
Shopping and souvenirs 855,160$
Trans ient / guest dockage (marina fees) 3,806,935$
TOTAL 51,199,240$
Season Maintenance
Insta l lation of new engine 7,469,774$
Insta l lation of new products 3,107,694$
Routine maintenance 15,408,936$
Vessel repair 6,091,288$
TOTAL 32,077,692$
Seasonal Other
Boat insurance 6,747,709$
Boat loan payment 5,675,408$
Dockage, mooring, seasonal s torage 18,360,398$
New or replacement products (i .e. maintenance/repair) 1,277,125$
New tra i lers 4,875,795$
Other 1,272,353$
TOTAL 38,208,788$
GRAND TOTAL SPENDING FOR ECONOMIC CONTRIBUTION ANALYSIS
SOUTHEAST MODEL121,485,720$
This spending resulted in an additional $51 million in economic activity in the Southeast region, for a
total economic contribution in the region of $172.6 million in 2010. In addition, over 1,000 jobs in the
Southeast region were supported by the direct spending of recreational boaters and the indirect and
induced economic impact of this spending.

Massachusetts Recreational Boater Survey 2010 - Final Report 96 June 22, 2011
In the East Central region, coastal and ocean recreational boaters spent almost $135 million in 2010 on
recreational boating related activities and products (see Table 52).
Table 52: Spending by coastal and ocean recreational boaters in the East Central region, 2010.
Total Trip and Visit Spending (May - October 2010) Amount
Auto gas and oi l 5,390,859$
Boat fuel and oi l 26,490,495$
Fi shing gear, ba i t, i ce etc. 4,757,051$
Groceries 6,031,451$
Launch fees 1,304,463$
Lodging (camping or B&B) 1,869,694$
Lodging (hotel or motel ) 1,323,850$
Pumpout fees -$
Recreation and enterta inment 660,980$
Restaurant meals and drink (inc. take-out) 7,262,474$
Shopping and souvenirs 1,135,140$
Trans ient / guest dockage (marina fees) 17,839,771$
TOTAL 74,066,228$
Season Maintenance
Insta l lation of new engine 2,337,080$
Insta l lation of new products 1,315,545$
Routine maintenance 10,863,307$
Vessel repair 8,568,065$
TOTAL 23,083,997$
Seasonal Other
Boat insurance 7,312,671$
Boat loan payment 11,116,804$
Dockage, mooring, seasonal s torage 12,887,501$
New or replacement products (i .e. maintenance/repair) 1,236,673$
New tra i lers 3,500,379$
Other 1,410,596$
TOTAL 37,464,624$
GRAND TOTAL SPENDING FOR ECONOMIC CONTRIBUTION ANALYSIS
EAST CENTRAL MODEL134,614,849$

Massachusetts Recreational Boater Survey 2010 - Final Report 97 June 22, 2011
This spending lead to an additional $60.2 million in economic activity in the East Central region, for a
total economic contribution in the region of nearly $195 million in 2010. Nearly 1,100 jobs in the East
Central region were supported by this spending of coastal and ocean recreational boaters in 2010.
7.5 Other Boating-related Data
The end-of-season survey was primarily focused on non-trip-related spending directly associated with
owning a boat (discussed above). However, it also asked a few questions about overall activity during
the 2010 boating season. The first question asked boaters to estimate the number of hours they spent
under power or under sail on the specific vessel on which they were reporting. The average number of
hours that a boat was under power or sail during the 2010 boating season was 72.1 hours based on
information from 413 boaters. However, as Table 53 shows, there are significant differences between
documented boaters and the registered boats in different regions of Massachusetts. Documented
boaters averaged 178 hours under power or sail. The Northeast and East Central regions were the next
highest, with averages of 64.7 and 62.7 hours respectively. The Southeast had an average of 50.9 hours.
Central and Western Massachusetts were the lowest two regions. It is important to note that the
numbers of boaters reporting from those regions was very low and the numbers for these two regions
may not be robust.
Table 53: The average number of hours under power or sail by size class within a region, and by region.
Region Size ClassNumber of
RespondentsAverage (hrs) Average (hrs)
Southeast <10 14 28.9 50.9
10 to <40 139 53.7
40+ 0 NO DATA
East Centra l <10 9 29.3 62.7
10 to <40 84 67.8
40+ 0 NO DATA
Northeast <10 7 47.7 64.7
10 to <40 71 66.9
40+ 0 NO DATA
Centra l Al l 6 45.8 45.8
Western Al l 4 36.8 36.8
Documented <40 21 184.2 178.0
40+ 56 155.2
All Massachusetts 412 72.1
As noted in the previous section, the Massachusetts economy was still recovering from the 2008-2009
recession at the time of this study and it would not be surprising if recreational boating activity was

Massachusetts Recreational Boater Survey 2010 - Final Report 98 June 22, 2011
reduced as a result of this. The end-of-season survey therefore asked boaters to report how they rated
their boating activity during the 2010 season as compared to other years. Across the whole of
Massachusetts, just over 17% of the 455 boaters who responded said that their season had been slightly
to much more active compared with over 53% who said that it had been somewhat to much less active
(Table 54). A little over half of documented boaters reported that their boating activity was the same or
more than normal.
Table 54: How boaters rated their 2010 boating activity compared to other years.
Much More
Active
Slightly More
ActiveSimilar
Slightly Less
Active
Much Less
Activen
Southeast 3.6% 8.9% 32.7% 19.6% 35.1% 168
East Centra l 11.1% 7.1% 26.3% 28.3% 27.3% 99
Northeast 7.9% 14.6% 25.8% 20.2% 31.5% 89
Centra l 0.0% 10.0% 20.0% 10.0% 60.0% 10
Western 0.0% 0.0% 50.0% 0.0% 50.0% 4
Documented 9.4% 11.8% 31.8% 22.4% 24.7% 85
All Massachusetts 7.0% 10.1% 29.7% 21.8% 31.4% 455
7.6 Spatial Data
As noted earlier, this study was largely aimed at using a statistically robust sampling method to gather
recreational boating data to supplement the information previously collected through expert opinion.
An enormous amount of survey and spatial data was collected and a full analysis of this information was
beyond the scope of this work. A more in-depth analysis of these data can be undertaken by a number
of entities, including the Massachusetts Office of Coastal Zone Management, MassGIS, graduate
students etc.
This section presents some of the spatial data that were gathered. The 1,094 routes that boaters
reported are shown in Figure 17, with a focus on coastal Massachusetts’ waters.
Figure 17 clearly shows that there are areas of high intensity of boat use in Massachusetts waters. In
order to better illustrate these areas of more intensive use, the route information was aggregated into
1km x 1km cells (Figure 18). Cells with the highest intensity (i.e. the highest number of routes
intersecting the cell) were colored red and less intense use cells were colored blue. White areas had no
routes. This clearly shows that the highest intensities occurred around major boating locations and in
“bottle neck” areas such as both entrances to the Cape Cod Canal and the area between Falmouth and
Martha’s Vineyard.
While no analysis has been undertaken, the route data presented here appears to correlate well with
the information that was gathered by the Massachusetts Marine Trades Association as part of the
Massachusetts ocean planning process (Appendix A).

Massachusetts Recreational Boater Survey 2010 - Final Report 99 June 22, 2011
Figure 17: Route data as provided by participants in the boater survey. The lines represent the “last trip of
the month” routes plotted by recreational boaters between May and October 2010.

Massachusetts Recreational Boater Survey 2010 - Final Report 100 June 22, 2011
Figure 18: Route data as provided by participants in the boater survey aggregated into 1km x 1km cells. The
cells have been shaded to highlight high intensity of boating based on the number of routes that
intersect each cell.
Detailed versions of the route and density maps are available in Appendix G.
Figure 19 covers a broader geographic area and shows the same route data but broken down by month.
While the number of reported routes varies by month, it appears that the number of long distance trips
gradually increases through May, June and July. It appears to peak in August and the start declining
towards the end of the season. Figure 20 shows the same data but focused on eastern Massachusetts.
Both figures show that the most intense boating activity appears to occur in state waters.

Massachusetts Recreational Boater Survey 2010 - Final Report 101 June 22, 2011
Figure 19: Route data for each month of the boater survey (May - October) as provided by participants.

Massachusetts Recreational Boater Survey 2010 - Final Report 102 June 22, 2011
Figure 20: Route data for each month of the boater survey (May - October) as provided by participants.
Zoomed-in map containing the same data as the previous figure.

Massachusetts Recreational Boater Survey 2010 - Final Report 103 June 22, 2011
Figure 21 again shows the routes data gathered during the recreational boater survey but shows the
seasonal boating activity around Massachusetts by boats of 10 feet or more in length but less than 40
feet (left) and boats greater than 40 feet in length (right).
Figure 21: Route data as provided by participants in the boater survey, broken down by boats of 10 feet or
more in length but less than 40 feet (left) and boats greater than 40 feet in length (right).
While there were many routes reported by the smaller of the two size classes, the larger size class
seems to show greater offshore activity with more vessels appearing to head up towards Maine and
down into Long Island Sound.
During the mapping part of the monthly survey, boaters were asked to identify areas in which they
engaged in specific activities. A total of 430 areas were plotted during the boating season (May through
October). Many of the areas were small and there were a large number of different activities reported.
Figure 22 shows a simplified map of the activity areas reported. In this map, only three activity types are
identified with all others (224 areas) aggregated into an “other” category. The individual areas for the
three highlighted activities (sailing, whale watching and fishing) often overlapped so these areas were
dissolved so that overlapping areas were combined to form one area. In total 192 fishing areas were
identified by boaters along with eight sailing areas and seven whale watching areas.
The largest area identified as one used for whale watching is located in the southern part of the
Stellwagen Bank National Marine Sanctuary (shown with a yellow dotted boundary in Figure 22). Figure
23 shows both the sanctuary lines and all the route data for the 2010 boating season.

Massachusetts Recreational Boater Survey 2010 - Final Report 104 June 22, 2011
Figure 22: Activity area data as provided by participants in the boater survey.
Figure 23: Stellwagen Bank National Marine Sanctuary and the route data gathered during the boater
survey.

Massachusetts Recreational Boater Survey 2010 - Final Report 105 June 22, 2011
7.7 Boater Feedback
As part of the end-of-season survey, participating boaters were asked to provide some feedback about
the mapping application and the study. It is hoped that this feedback can be used to refine and improve
the study design and the mapping application so that studies of this type can continue to be used.
The first question was to determine if the participant had used the online mapping application during
any of the months that the study was being conducted. A little over 46% of the participants that
responded to the end of season survey (212 boaters) reported that they had not used the mapping
application. Out of those 46%, just over 8% found that the application did not work on their computers.
Almost 17% reported that they had found the application too complicated or difficult to use, and a
further 21% of respondents did not use their boat during the period over which they were reporting on
(Table 55). A small number of boaters had telephoned or e-mailed the boater survey helpline with
technical difficulties and team personnel endeavored to solve these issues with limited success.
Table 55: Reasons why boaters did not use the online mapping application by percentage of respondents.
Response %
Didn't take boat out 21.0%
Too compl icated / di fficult to use 16.9%
Did not work on my computer 8.2%
Boating activi ty was too compl icated to map 9.4%
Other 43.2%
NA 1.3%
Greater than 43% of respondents answered “other”. If they answered “other”, they were asked to
elaborate on their reasoning. The responses suggested that this question had not been clearly
understood. Of the 65 boaters who provided a reason in the “other” category, 39 provided responses
such as: used onboard GPS; we have adequate navigation material aboard for what we do; and trips did
not warrant using it - familiar territory. It is possible that these boaters had never used the mapping
application and were unsure as to what the question was referring. Nine boaters said that the maps did
not cover the areas where they boated. A further nine either did not know about it or were not
interested in using it. Four boaters reported that their trip was short and not worth mapping, and a
similar number did not map their route as the vessel in question was their dinghy or tender.
Those participants who had used the mapping application were asked how easy they felt the mapping
application had been to use. Of the 258 boaters who responded, 73% felt that the mapping application
had been “somewhat easy” to “very easy” to use (Table 56), and only 4.5% felt that the application had
been “very difficult” to use.

Massachusetts Recreational Boater Survey 2010 - Final Report 106 June 22, 2011
Table 56: How easy boaters found the online mapping application as a percentage of respondents.
Response %
Very easy 30.6%
Somewhat easy 42.4%
Somewhat di fficult 22.5%
Very di fficult 4.5%
The boaters were also asked if they would be willing to participate in a similar boating survey in the
future. Of the 458 boaters who responded, over 88% reported that they would be “somewhat willing”
or “very willing” to do so (Table 57).
Table 57: Boaters’ willingness to participate in future similar boating surveys as a percentage of
respondents.
Response %
Very wi l l ing 41.7%
Somewhat wi l l ing 46.7%
Not very wi l l ing 8.7%
Not at a l l wi l l ing 2.9%
Finally, boaters were asked if they had any thoughts, comments or suggestion about the online mapping
application and the boater survey overall. With regards to the mapping application, a number of people
commented on the fact that it was difficult to use, while others found it easy, once they had got the
hang of it (Table 58). A number of boaters suggested that it was too slow and/or time consuming and
that navigating around the maps and scrolling were not easy. Additional suggestions included: allowing
freehand drawing rather than clicking to create each leg of a route; making it possible for the return leg
of a journey to be automatically drawn for those trips that went out to a location and returned the same
way; and doing away with the route mapping entirely and simply having the names of departure and
destination points.
The latter two items were discussed at length during the development of the application. The
automated return route was thought to be a good idea but was not implemented due to time
constraints. It had been decided that departure and destination points would not accurately capture
the spatial use of Massachusetts waters and remove the flexibility that existed for boaters to zoom in
and select a specific departure point or destination (even down to an individual slip or mooring). This
idea is further complicated by the fact that there are numerous possible departure and destination
locations throughout Massachusetts and neighboring states and that people do not always use the same

Massachusetts Recreational Boater Survey 2010 - Final Report 107 June 22, 2011
name for a particular location. Other suggestions included providing better instructions, to covering
greater detail in the charts, and allowing the application developed to run on mobile devices.
Table 58: Summary of thoughts and comments made about the online mapping application.
Comment Number
Difficul t to use 21
Easy to use 10
Easy once you got the hang of i t 5
Too s low or time consuming 4
Al low freehand drawing rather than cl icking points 2
Set i t up so return journeys can be atomatica l ly generated 4
Scrol l ing / navigation di fficul t 13
Have s tart and end points rather than draw routes 4
Maps need to cover more area 4
Cannot handle compl icated routes (sa i lboats) 3
Better instructions needed 6
Should be des igned for mobi le devices 1
Not appl icable to activi ty 2
Not used 3
Did not work 2
Good job 5
General comments 6
Table 59 summarizes the comments and suggestions made by boaters regarding the overall survey.
Again, some boaters mentioned the difficulty with using the maps as well as the time that it took to do
the mapping. One boater commented that there were simply too many surveys. Seventeen boaters
commented on the fact that they were unclear what value this study would have. However, almost the
same number hoped that the results would be used to help boaters and boating in Massachusetts and
many of these boaters also said that they very much hoped that the results would be made readily
available to the public. In fact, one boater commented that he would not participate in the future
unless the results were made available to him. A number of boaters commented that they had enjoyed
participating in the study and felt that it was important that such work continue.

Massachusetts Recreational Boater Survey 2010 - Final Report 108 June 22, 2011
Table 59: Summary of thoughts and comments made about the boater survey in general.
Comment Number
Make mapping eas ier 5
Too many surveys 1
Time consuming 1
Simpl i fy spending categories 2
Longer dol lar fields 1
Live-aboard not wel l covered 1
Out-of-s tate activi ty not wel l covered 2
If a boat i sn't being used, ask why 1
Financia l questions are not confidentia l and should not be asked 1
Didn't understand the overa l l reason for survey 17
Boat i s a dinghy or tender 23
Enjoyed participating 20
Hope results are made avai lable and are used 16
Good job 19
General comments 24

Massachusetts Recreational Boater Survey 2010 - Final Report 109 June 22, 2011
8 LESSONS LEARNED AND RECOMMENDATIONS This section contains lessons learned throughout the course of this study and recommendations for
similar recreational boating studies that may be undertaken in the future.
8.1 Timeline
This study was developed with a highly compressed timeline. The decision to undertake the
2010 Massachusetts Recreational Boater Survey was made at the very start of January 2010. In
order to capture the boating season it was essential that the survey was operational by early
June (to capture May’s boating activity). Developing such a study involves a large number of
inter-related and inter-dependent tasks. Any delay or failure during any one of these tasks
could have resulted in a knock-on effect that could have delayed the start of the survey meaning
that the whole 2010 boating season could not be captured. While the project was successful,
there was an element of luck involved and the study would have benefit from more time being
spent on a number of tasks. These included:
Survey design and testing – a few questions were clearly not universally understood.
Additional time may have identified these issues and allowed for them to be rectified.
Outreach – a more concerted and intensive outreach effort may have increased boater
participation.
Development of mapping application – a number of improvements were identified
during the development phase but they could not be implemented due to time
constraints. Once the application was up and running, it was decided that making
adjustments at that late stage could lead to problems so these improvements were not
made. A number of these improvements were identified by boaters in the feedback
survey.
To conclude – while the study was a success, it could have been improved upon if more time
had been available.
When developing a realistic timeframe for the study, it should be noted that obtaining the
databases of registered and documented vessels may take a considerable amount of time –
possibly several months.
8.2 Advisory Group
Creating an advisory group with representatives from the various state boating organizations
and other stakeholder groups with knowledge of boating and economics associated with
recreational boating was extremely valuable. Members of the group provided valuable insight
that fed into the study design and process and the development of the surveys. Additionally,
the group also facilitated access to data, recruited boaters to be testers during the development
phase, encouraged boaters to participate, reviewed results and disseminated the results to the
boating community and others.

Massachusetts Recreational Boater Survey 2010 - Final Report 110 June 22, 2011
8.3 Determining the Population of Boats Using the Waters of Massachusetts
The databases containing boats registered in Massachusetts and those vessels documented with
the US Coast Guard provided invaluable information about boats within Massachusetts and it
was from a combination of the two that the sample of 10,000 boat owners were drawn.
The data contained in these data sets allowed for the sample to be stratified by vessel size, and
by region for state-registered boats.
This study could not have been conducted if the database of Massachusetts registered boats
had not been available (as may be the case in other states).
The contact information for boat owners appeared to be good based on the low percentage of
letters that were returned as undeliverable. This may be due to the frequency that boat owners
are required to verify their information or re-register their boat.
One limitation of the USCG database of documented vessels was that it was not possible to
determine which vessels are actually based/used in Massachusetts.
A limitation of the database of Massachusetts registered boats was that it did not include non-
motorized vessels, meaning that it may under-represent vessels such as sailboats.
If additional information were gathered during the Massachusetts boat registration process, the
resulting database would be greatly enhanced as a tool to target more accurately a sample for
this type of study or other research. Additional information should include:
A current and valid e-mail address (if available);
Whether the boat is used only on freshwater versus saltwater;
Whether the boat is used exclusively for commercial purposes;
Whether the boat is only used as a tender;
Greater details on where the boat is stored (i.e. town, type of storage, type of facility for
both in and out of season, etc.); and
If the boat is ever used for recreational fishing.
Neither data set helps in determining out-of-state boater use of Massachusetts waters. The
issue of assessing the impact of out-of-state boaters remains a significant one and requires
further research.
8.4 Sample of Boaters
It was assumed that owners of boats stored in Central and Western Massachusetts were more
likely to use their boats exclusively on freshwater and would therefore be deemed ineligible for
this study as the focus was on coastal and ocean recreational boating. As such, boats in these
regions were under sampled (boats from these regions made up 13% of the sample but
represented 25% of the total population of boats). However, once ineligible boats were

Massachusetts Recreational Boater Survey 2010 - Final Report 111 June 22, 2011
removed from the responses, eligible boats from these regions only accounted for 3% of eligible
boats. Therefore, those conducting studies focused on coastal and recreational boating in the
future should consider under sampling boats stored in Central and Western Massachusetts to an
even greater degree unless the sampling could be focused more effectively on eligible boaters.
While boats 40 feet and over in length were over sampled, the total number of these vessels
compared to those in other size classes was very low. Therefore, once ineligible boaters were
eliminated, the number of eligible boats of 40+ feet in length by region was very low. Future
studies should consider oversampling the largest size class of boats to an even greater degree.
Almost 11% of the 143,507 pleasure and commercial fishing boats registered in Massachusetts
were less than 10 feet in length. As these were believed only to be suitable for use very close to
shore or as a tender or dinghy associated with a larger vessel, this size class was under sampled.
A number of boaters questioned the logic of asking them to report of use of their dinghy when
they answered the feedback survey. Therefore, future studies may want to exclude these very
small vessels from any sample.
The characteristics of the population of documented boats appeared to differ significantly from
registered boats (e.g. documented vessels generally fell into the larger size classes, many more
were sailboats and diesel was the most common type of fuel). These differences suggest that
oversampling documented vessels in future studies should be considered.
8.5 Survey Development
Reviewing previous boating studies, such as the Florida Boating Access Facilities Inventory and
Economic Study, was useful when developing the design and survey questions for this study.
Testing the monthly surveys with a few volunteer boaters was very helpful in identifying
potential issues and any confusion over questions or the web-mapping application. If time had
permitted, additional testing would have been beneficial.
Boaters were given the option of completing the recruitment survey online, or completing the
paper version and returning it using a pre-paid business reply envelope, however only 14.8%
(315 boaters) elected to use the online option. Therefore, it may not have been necessary to
develop the online recruitment survey.
Given that the majority returned their surveys via the mail, the large amount of time and
capacity needed to transfer the information from the paper returns to online forms should be
noted when considering timeframes.
It should be noted that a conscious decision was made to avoid sending out notices of monthly
surveys immediately prior to weekends so that personnel were available if technical issues
arose.

Massachusetts Recreational Boater Survey 2010 - Final Report 112 June 22, 2011
One of the most time-consuming tasks associated with entering mailed in recruitment surveys
was deciphering sometimes almost ineligible handwriting on the recruitment surveys and trying
to ensure that e-mail addresses were entered correctly. In future studies, to ensure that e-mail
addresses are written in the clearest possible way, a series of boxes could be provided for
respondents to enter their e-mail addresses rather than simply a line:
j o h n . d o e @ c o m p a n y . c o m
Various sources had suggested that it was common for boaters to spend time on their vessel
even if they did not go out on the water. As these dockside visits also have an economic impact,
the monthly surveys were developed so that spending information was collected even if no on-
water trip was taken.
8.6 Implementation of the Surveys and Mapping Application
Considerable effort was made to keep each survey as short as possible while ensuring that all
the necessary information was collected.
To accelerate the survey process, multiple “skips” were included so that non-applicable
questions were not asked. For example, if a boater reported that he had not trailered his boat,
all questions associated with trailering were skipped.
Where possible, yes/no radio buttons or check boxes were used.
While boaters generally found the questionnaire part of the monthly surveys easy to complete,
the success of the mapping application varied considerably. Some boaters found it easy to use.
Others found it to be easy to use once they had used it once. Others found it extremely difficult
to use and some found that it was impossible for them to use. This may reflect the fact that for
accuracy sake, a reasonable degree of complexity was required.
The mapping of activity areas was relatively unsuccessful. This may be the result of a number of
factors: it took boaters too long to reach that section of the survey and so they simply skipped it;
the mapping of activity areas was overly complicated; or the idea of activity areas was less clear
to the participants than the idea of plotting their approximate route.
If greater time had been available during the development of the mapping application, a
number of improvements that were suggested by the project team could have been
implemented and may have increased the user-friendliness of the application. However, such
an application requires a degree of complexity that may simply be too much for those less
familiar with computers.
8.7 Incentives to Encourage Participation
In order to encourage on-going participation, regular prize drawings were made for cash and
marine service-related prizes. Boaters who completed a monthly survey were eligible for that

Massachusetts Recreational Boater Survey 2010 - Final Report 113 June 22, 2011
month’s drawing. In addition, each completed survey represented an additional entry into the
end-of-season grand prize drawing for a chance to win $1,000.
Prizes were generously provided by members of the marine industry. The names and logos of
those who gave prizes were added to the Massachusetts Recreational Boater Survey website.
These sponsors also helped spread the word about the study.
The prize winners were also posted on the website. However, to preserve anonymity the names
of the winners were not posted.
It is not possible to determine how effective these prize drawings were in encouraging
participation, but the use of incentives is common practice during studies such as this one and
feedback from some participants suggested that these drawings were appreciated.
Another incentive that was employed was providing a map of some of the initial spatial data
that had been gathered to those who had completed a survey. It was hoped that this would
allow boaters to see what the data would look like and therefore encourage further
participation.
8.8 Outreach
As it was important to encourage on-going boater participation in the study, information about
the study was disseminated through various means (e.g. flyers, a website, presentations to
boating groups, notices in monthly e-mail lists). However, due to the tight timeframe for this
study, a comprehensive outreach plan was not developed or implemented and some outreach
efforts that were undertaken were not followed-up on.
Any future studies, should develop a more aggressive outreach plan. A comprehensive list of
outreach venues (newspapers, relevant radio shows, monthly electronic mailings, boating
organizations’ member meetings, boat shows, boating magazine etc.) should be developed to
ensure that all outreach options are being utilized.
Depending on the budget and timeframe, flyers describing the study should be distributed to
marinas, boat yards, harbormasters offices etc. for posting. For this study, a number of
marinas/boat yards received the flyer via e-mail, but it would probably be more effective to
send a hard copy.
8.9 Data Analysis
The data in this report represents the initial analysis of only some of the data collected through
this study. The complete data collected represent a rich data set that can be mined in various
ways to yield important and interesting results and answer a multitude of questions about
boats, boat owners, boating activity, spatial use of the waters of Massachusetts and numerous
combinations of these.

Massachusetts Recreational Boater Survey 2010 - Final Report 114 June 22, 2011
It is important to remember that the accuracy to which boaters plotted their routes will depend
on the time that they were willing to spend doing so; the degree to which they zoomed in; and
the length/complexity of the route taken. Boaters were often mapping routes covering large
areas and so for example, may not have taken the time to plot their exact route accurately
through the narrow waters of Cape Cod Canal. As such, when the spatial data are viewed in
detail, some routes appear to cross land.
Similarly, interpretation of the spatial data should consider the scale at which it was collected.
This study was conducted statewide and is very useful at showing boating trends and important
boating areas in Massachusetts and adjacent federal waters. However, an analysis of boating
trends and important boating areas in smaller sub-regions should consider whether the scale
and sample size within that sub-region can support conclusions about boating activity.

Massachusetts Recreational Boater Survey 2010 - Final Report 115 June 22, 2011
9 NEXT STEPS The spatial and economic data collected through this study will be provided to the Massachusetts Office
of Coastal Zone Management for inclusion in updating the Massachusetts Ocean Management Plan.
The geodatabase will be maintained by the Massachusetts Ocean Partnership, and the spatial data will
be made available through the Massachusetts Ocean Resources Information System (MORIS).
One of the main goals of this project was to create a study that:
1. Could be repeated in Massachusetts’ coastal and ocean waters;
2. Could be modified to collect information on recreational boating in other locations; and
3. Could be modified to gather other types of spatial information for varying research efforts
(either related to the human use of the ocean, or other types of projects).
This study was the first of its kind focused on recreational boating in Massachusetts. As such, it
provided an essential baseline data on this activity. If funding were available, it would be of great
benefit to repeat this study in the near future, perhaps 2012. Repeating the study will allow for the data
to be compared from year to year. To enhance the effectiveness of the study, the methodology and
mapping application should be modified slightly based on the lessons learned and recommendations.
Considering that approximately 88% of the survey participants who provided feedback indicated that
they would be “somewhat willing” to “very willing” to participate in a similar boating study in the future,
it is believed that a future recreational boating study in Massachusetts would be an even greater
success.
The “open-source” nature of the mapping application also allows for it to be modified for use in other
research efforts, including recreational boating studies in different locations. Considering the current
movement towards ocean planning at a regional level, another clear next step would be to expand the
Massachusetts recreational boating study to the New England region. This would help enhance our
knowledge of regional spatial patterns, the number of boaters visiting Massachusetts (and other New
England states) from out of state, and the regional economic impact of recreational boating.
A critical next step is for the data gathered through this study to be more fully analyzed. The analysis
contained in this report represents an initial analysis of only some of the data. There are multiple ways
in which the boat, boater, economic and spatial data could be cross-referenced and analyzed to provide
insight and answers to a multitude of recreational boating related questions.

Massachusetts Recreational Boater Survey 2010 – Final Report 116 June 22, 2011
APPENDIX A: MAP OF RECREATIONAL BOATING ACTIVITY FROM THE
MASSACHUSETTS OCEAN MANAGEMENT PLAN.

Massachusetts Recreational Boater Survey 2010 – Final Report 117 June 22, 2011
APPENDIX B: SURVEYS
Introductory or Recruitment Survey
Mailed out but with the option for responding online.
Unique ID code: ######
1. Do you currently own a [VESSEL]?
No
Yes
2. Does your [VESSEL] have a name?
Boat Name _______________________ Boat not named
3. Do you use your [VESSEL]……….?
Yes No exclusively on freshwater (rivers or lakes)
exclusively for non-recreational purposes (e.g. as a charter fishing or commercial fishing vessel)
exclusively to access another boat (i.e. it is a dinghy or tender)
4. From where do you most frequently launch your boat, or leave the dock or mooring, when taking trips on your [VESSEL]?
______________________________________ ____________________ ______
Facility / Ramp Name Town State
5. Do you own any other boats?
No
Yes
6. Please indicate below ALL the different boats / watercraft you own including your [VESSEL].
Length Which boat do you Number (Enter range if you have use most often?
Boat Type of this type more than 1 boat) (Please mark only one)
Open motorboat _____ _____
Cabin cruiser _____ _____
Sailboat _____ _____
PWC / jetski _____ _____
Canoe / kayak / rowboat _____ _____
Other Specify: _____________ _____ _____
From this point forward, we will be contacting you via e-mail and directing you to a website where you will be able to participate. For the effort to be successful, we need a working e-mail address:
____________________________________ ____________________________________
E-mail address Alternate e-mail address (optional)
YOUR E-MAIL ADDRESS WILL NOT BE USED FOR ANY OTHER PURPOSE AND WILL NOT BE SHARED WITH ANY THIRD PARTY. AT THE END OF THE STUDY, YOUR E-MAIL ADDRESS WILL BE DELETED FROM OUR RECORDS.
If we have incorrectly identified you as the registered / documented owner of
this boat, please simply check this box and return the survey in the
enclosed envelope. Thank you for your help.

Massachusetts Recreational Boater Survey 2010 – Final Report 118 June 22, 2011
Initial Survey
Online survey only.
SURVEY INSTRUCTIONS
Thank you for your participation in the Massachusetts Recreational Boater Survey 2010.
Please read the following instructions before continuing with the survey. There are only a few questions and it should take less than five minutes to answer them all. For more information about the survey, please go to http://www.maboatersurvey.com.
1. Please don't use your browser's 'back' button. If you need to back up, use the button that appears below each question or screen.
2. The question numbers may not be sequential, depending on your responses.
3. After entering each response, click on the 'next' button to continue.
4. When you finish answering all of the questions, click the 'Submit' button to complete the survey and finalize your entries.
BOAT DETAILS
During this and subsequent surveys, you will be asked about your use of your [VESSEL]. It is critical that your answers are based on your use of this specific vessel, even if it is not the vessel that you use most frequently.
The reason you were asked to participate in this survey is that your [VESSEL] was randomly selected from either the Massachusetts Boat Registration database or the database of U.S. Coast Guard documented vessels.
In the following section, we would like to verify some of the information about your vessel. Please correct any errors using the dropdown menus. If the information is correct, just click on the "Next" button to go on to the next question.
NOTE: The information you provide will ONLY be used to describe the ways people use Massachusetts’ waters for boating. Any corrections you make here will not be changed in either the Massachusetts Boat Registration database or the database of U.S. Coast Guard documented vessels.
If the information is correct, just click on the "Next" button to go on to the next question.
If the following information is incorrect or missing, please select the best option from the dropdown menu on the right.
1a. Is your Vessel Type: [VESSEL TYPE]? If not: DROPDOWN Open motorboat Cabin cruiser Sailboat PWC / jetski Other
1b. Is your Size class: [SIZECLASS]? If not: DROPDOWN Less than 16 feet 16 to 26 feet 26 to 40 feet Over 40 feet
1c. Is your Hull type: [HULL TYPE]? If not: DROPDOWN Aluminum Fiberglass Inflatable Plastic Steel Wood Other

Massachusetts Recreational Boater Survey 2010 – Final Report 119 June 22, 2011
1d. Is your Engine type: [ENGINETYPE]? If not: DROPDOWN Inboard Inboard/Outboard (I/O or stern drive) Outboard Electric Jet Drive Other None
1e. Is your Fuel type: [FUELTYPE]? If not: DROPDOWN Gas Diesel Other
1f. Is your Engine size: [ENGINESIZE]? If not: __________ Horsepower
2. Where do you normally keep your [VESSEL] DURING the boating season?
At a berth (i.e. wetslip or at a dock)
On a mooring
In a dry stack or dry rack storage
On a trailer or otherwise on land
Other
2a. Specify “other”: __________
3. Is the place where you generally keep your [VESSEL] DURING the boating season part of a...?
Commercial marina / boatyard
Private boat or yacht club
Municipal facility or mooring field
A private residence (e.g. your home)
Other
3a. Specify “other”: __________
4. Where do you normally keep your [VESSEL] OUT OF SEASON?
At a berth (i.e. wetslip or at a dock)
On a mooring
In a dry stack or dry rack storage
On a trailer or otherwise on land
Other
4a. Specify “other”: __________
5. Is the place where you generally keep your [VESSEL] OUT OF SEASON part of a...?
Commercial marina / boatyard
Private boat or yacht club
Municipal facility or mooring field
A private residence (e.g. your home)
Other
5a. Specify “other”: __________

Massachusetts Recreational Boater Survey 2010 – Final Report 120 June 22, 2011
PERSONAL INFORMATION
Any information that you are willing to provide for the following optional questions will help in the final analysis for this study. Please note that all data will be aggregated to ensure privacy.
6. Are you…..?
Male
Female
7. What is your current age?
Years _______
8a. For how many years have you regularly operated a boat?
Years operated _______
8a. For how many of those years have you been the owner of a boat?
Years owned __________
9. Have you ever taken a……? Yes No
Boating safety course (e.g. Boat-Ed through the MA Environmental Police)
Navigation course (e.g. U.S. Coast Guard Auxiliary, U.S. Power Squadrons
or American Sailing Association)
10. Are you currently…..?
Employed (full time)
Employed (part time)
Unemployed
Retired
11. What is your best guess of your annual household income from 2009?
Less than $25,000
$25,000 to $49,999
$50,000 to $74,999
$75,000 to $99,999
$100,000 to $124,999
$125,000 to $149,999
$150,000 to $174,999
$175,000 to $199,000
$200,000 or greater
Thank you for your participation! We greatly appreciate your time.
YOU MUST CLICK the Submit button to complete the survey. After you submit your responses, your browser will be directed
to our website, www.maboatersurvey.com. Please feel free to return to this site at any time for information about the
survey.
We will be contacting you soon to ask details about your last trip in May 2010.
If you have any questions, please send an e-mail to [email protected].
Thank you again for your time and cooperation!

Massachusetts Recreational Boater Survey 2010 – Final Report 121 June 22, 2011
Monthly Survey
Online survey only. Customized so that during months with a holiday, boaters were asked if their activity
was associated with that holiday.
SURVEY INSTRUCTIONS
Thank you for your participation in the Massachusetts Recreational Boater Survey 2010. You will be asked a short series of
questions and then will be asked to map your last boat trip. It should take approximately 15-20 minutes to complete the
survey.
For more information about the survey, please go to http://www.maboatersurvey.com.
1. Please don't use your browser's 'back' button. If you need to back up, use the button that appears below each
question or screen.
2. The question numbers may not be sequential, depending on your responses.
3. After entering each response, click on the 'next' button to continue.
4. When you finish the short series of questions, click the 'Submit' button to finalize and save your responses.
MONTHLY BOAT TRIP INFORMATION
During this survey you will be asked about your use of your [VESSEL] during [MONTH], 2010. It is critical that your answers are
based on your use of this specific vessel, even if it is not the boat that you use most frequently.
After the questions about your boating, a map will be displayed and we will ask you to indicate where you went for your last
trip of [MONTH].
Please submit your survey even if you did not take your [VESSEL] out on the water this month, as that information is also
important.
GENERAL MONTHLY ACTIVITY
1. Do you still own your [VESSEL]?
N0 IF NO SKIP TO END OF SURVEY
Yes
2. On how many different days during [MONTH] did you visit your [VESSEL] for recreational or maintenance? For example, if you spent an hour onboard one day and again the following day, please count this as two days.
Number of days __________ IF ZERO SKIP TO END OF SURVEY
3. Did you actually go out on the water on any of these days aboard?
No IF NO SKIP TO QUESTION 22
Yes
4. On how many of these days onboard did you actually go out on the water?
Number of days __________
5. How many nights in total did you spend on your [VESSEL] during [MONTH]?
Number of overnights onboard __________ IF ZERO SKIP TO QUESTION 7
6. Based on your answers above, how many of these nights were spent away from your normal berth or mooring location?
Number of overnights away from usual mooring __________

Massachusetts Recreational Boater Survey 2010 – Final Report 122 June 22, 2011
LAST “ON WATER” BOAT TRIP OF THE MONTH
The following questions ask specifically about the LAST “ON WATER” BOAT TRIP that you made on your [VESSEL] during [MONTH].
Even if you were only out on the water for a short trip, we would like you to answer the following questions.
7. Was the last “on water” boat trip on your [VESSEL] during [MONTH] a day trip or an overnight trip?
Day trip
Overnight trip
8. How many nights were you away from your usual residence on this trip? If you live aboard your boat indicate the number of nights away from your normal berthing location (e.g. slip, mooring etc.).
Number of nights __________
9. How many people (including yourself) were onboard for this trip?
Number of people __________
10. Did you trailer your [VESSEL] to a launch site as part of this trip?
No IF NO SKIP TO QUESTION 14
Yes
11. On this particular trip, where did you begin trailering your [VESSEL] from?
Your permanent home
Your second home
The marina or drystack where your boat kept
A general commercial storage facility
A friend's or relative’s home
Other location
11a. Specify “other”: __________
12. Did you pay a one time launching fee or parking fee while using this launch site?
No
Yes
13. Approximately how much did you pay to launch your vessel and for parking on your last “on water” boat trip? When entering costs in dollars, you do NOT need to enter a dollar sign ($).
Cost in dollars: __________
14. Approximately how many miles did you drive (or otherwise travel) to reach the place where you launched or boarded your [VESSEL]?
Number of Miles: _________________________
15. Please provide information about the site from which you launched or boarded your [VESSEL]:
Name of site _________________________
Address of site _________________________
Town or city _________________________
State _________________________

Massachusetts Recreational Boater Survey 2010 – Final Report 123 June 22, 2011
16. How many hours did you spend on this trip? DO NOT INCLUDE time driving to or from where you launched or boarded your boat.
PLEASE INCLUDE all time between when you headed out on the water to when you finished this trip, even if this
included shoreside excursions.
If less than 1 hour please enter 1.
___________________
17. Did you participate in any of the recreational activities listed below while on this trip?
Yes No
Cruising
Entertaining family/friends
Fishing or shellfishing
Hunting
Whale watching
Bird watching
Racing
Sailing
Scuba diving/snorkeling
Sightseeing
Swimming
Waterskiing/wakeboarding
18. Was this last trip of the month undertaken for something other than purely recreational purposes?
For example you were chartered to take customers out fishing or sightseeing or you were fishing commercially?
No
Yes
19. Was this last trip taken as part of the [Memorial Day Weekend] / [4th of July Weekend] / [Labor Day Weekend]?
No
Yes
LAST “ON WATER” BOAT TRIP OF THE MONTH SPENDING
20. Approximately how much money did you and your party spend in each category below as part of the last “on water” boat trip on your [VESSEL] in [MONTH]? Include both spending in preparation for and during this specific trip. If you did not spend money in a category please leave as blank. When entering costs in dollars, you do NOT need to enter a dollar sign ($).
Amount ($)
Boat fuel and oil __________
Transient/guest dockage (marina fee) __________
Launch fees __________
Pumpout fees __________
Restaurant meals & drinks (including take-out food & drinks) __________
Groceries __________
Auto gas and oil __________
Shopping and souvenirs __________

Massachusetts Recreational Boater Survey 2010 – Final Report 124 June 22, 2011
Recreation and entertainment __________
Lodging (hotel/motel) __________
Lodging (camping/B&B) __________
Fishing gear, bait, ice etc. __________
Other __________
21. Approximately what PERCENT of the total spending you have just listed occurred near to where you launched or boarded your boat on this specific trip?
Your best guess will do.
0% 1-10% 11-20% 21-30% 31-40% 41-50% 51-60% 61-70% 71-80% 81-90% 91-100%
SKIP TO END OF SURVEY
LAST VISIT OF THE MONTH SPENDING
You just indicated you did not take your boat out on the water during [MONTH], but that you did visit your boat during that
month. The following questions ask specifically about the LAST TIME you visited your [VESSEL] during [MONTH].
22. Was the last time you visited your [VESSEL] during [MONTH] a day trip or an overnight trip?
Day trip
Overnight trip
23. How many nights were you away from your usual residence on this trip?
Number of nights __________
24. Approximately how much money did you and your party spend in each category below as part of the lat time you visited your [VESSEL] in [MONTH]? Include both spending in preparation for and during this specific trip. If you did not spend money in a category please leave as blank. When entering costs in dollars, you do NOT need to enter a dollar sign ($).
Amount ($)
Boat fuel and oil __________
Transient/guest dockage (marina fee) __________
Launch fees __________
Pumpout fees __________
Restaurant meals & drinks (including take-out food & drinks) __________
Groceries __________
Auto gas and oil __________
Shopping and souvenirs __________
Recreation and entertainment __________
Lodging (hotel/motel) __________
Lodging (camping/B&B) __________

Massachusetts Recreational Boater Survey 2010 – Final Report 125 June 22, 2011
Fishing gear, bait, ice etc. __________
Other __________
25. Approximately what PERCENT of the total spending you have just listed occurred near to where you visited your boat on this specific trip?
Your best guess will do.
0% 1-10% 11-20% 21-30% 31-40% 41-50% 51-60% 61-70% 71-80% 81-90% 91-100%
SKIP TO END OF SURVEY
PARTICIPANTS WHO NO LONGER OWNED THEIR BOAT WOULD SEE THE FOLLOWING MESSAGE AT THE END OF THE SURVEY:
Thank you for signing on to the Massachusetts Recreational Boater Survey and providing us with this information.
Because you do not currently own the selected vessel, all you need to do is click on the "Next" button, and then click on
"Submit" on the following page. No further information is needed.
If you do own the selected vessel, please click on the "back" arrow at the bottom of this page, change your answer to
"Yes", and complete the survey.
OTHER PARTICIPANTS WHO VISISTED THEIR BOAT BUT DID NOT TAKE AN ON-WATER TRIP WOULD SEE THE FOLLOWING
MESSAGE:
Thank you for signing on to the Massachusetts Recreational Boater Survey and providing us with this information.
Because you did not visit your boat for recreational or maintenance purposes, all you need to do is click on the "Next"
button, and then click on "Submit" on the following page. No further information is needed.
If you did visit your boat for recreational or maintenance purposes, please click on the "back" arrow at the bottom of
this page, enter the correct answer, and complete the survey.
ALL PARTICIPANTS WOULD SEE THIS FINAL MESSAAGE:
Thank you for your participation! We greatly appreciate your time.
YOU MUST click the Submit button to finalize and save your responses.
If you took your boat out on the water you will be asked to map this trip.
If you did NOT take your boat out on the water you will be directed to our website, www.maboatersurvey.com.
If you have any questions, please send an e-mail to [email protected]
Thank you again for your time!

Massachusetts Recreational Boater Survey 2010 – Final Report 126 June 22, 2011
End-of-Season Survey
Online survey only.
BOAT-RELATED SPENDING IN THE LAST 12 MONTHS
The questionnaires that you have completed for the 2010 Massachusetts Recreational Boater Survey so far have asked about individual boat trips.
Now we ask you to estimate spending in the last 12 months for your boat that was not trip-specific (for example: boat loans, winter storage, maintenance, repairs etc.)
1. In the LAST 12 MONTHS, approximately how much did you spend on the maintenance and repair of your [VESSEL] in each of the following categories?
Estimated Amount (to nearest $10)
Routine vessel maintenance, including parts and labor: (e.g., winterize, commission, cleaning, tune ups) __________
Vessel repairs, including parts and labor: (e.g., engine, underwater gear, hull, electronics, canvas, sails, upholstery) __________
Installation of a new engine, including parts and labor: __________
Installation of new products or upgrades, including parts and labor: (e.g., electronics, tops, seats) __________
2. Which of the following non-trip-specific expenditures did you have for your [VESSEL] in the LAST 12 MONTHS? Yes No Estimated Amount (to
nearest $10)
Boat loan payments __________
Boat insurance (e.g., hull, port risk, liability, theft, fire) __________
State registration or USCG documentation fees __________
Taxes (e.g., personal property, excise) __________
Dockage, mooring, seasonal storage __________
New trailers __________
New or replacement products not included in your previous answers: (e.g., parts, sails, supplies, accessories, tender, gear, tackle or safety equipment) __________
3. In the LAST 12 MONTHS, did you have OTHER expenditures for your [VESSEL] that you did not list in the previous two questions?
Yes
No IF NO SKIP TO QUESTION 4
3a. What did you spend money on? ___________________________________
3b. What was the total amount you spent?
Please estimate the amount that you spent to the nearest $10. $_______

Massachusetts Recreational Boater Survey 2010 – Final Report 127 June 22, 2011
4. Approximately what PERCENT of the total spending you have just listed in the previous three questions occurred IN THE STATE OF MASSACHUSETTS?
0% 1-10% 11-20% 21-30% 31-40% 41-50% 51-60% 61-70% 71-80% 81-90% 91-100%
5. Approximately how many hours (total) were you under power or under sail on your [VESSEL] during the 2010 boating season?
Hours __________
6. How would you rate your boating activity on your [VESSEL] in 2010 compared to other years?
Much more active than usual Slightly less active than usual
Slightly more active than usual Much less active than usual
Similar to other years Don’t know

Massachusetts Recreational Boater Survey 2010 – Final Report 128 June 22, 2011
Feedback Survey
Online survey only. This was included at the end of the End-of-Season survey.
PLEASE HELP US IMPROVE THE BOATER SURVEY
The following few questions ask for your feedback.
1. Did you use the online mapping tool for any month you participated?
No
Yes
2. What prevented you from using the online mapping tool? (Check all that apply)
I did not take my boat out on the water
The online mapping tool was too complicated or difficult to use
The online mapping tool did not work on my computer
My boating activity was too complicated to map
Other (Specify in next screen)
2a Please provide any other thoughts, suggestions or comments you might have on the online mapping application.
________________________________________________________________________________________________
3. Was the mapping application ...
Very easy
Somewhat easy
Somewhat difficult, or
Very difficult
3a Please provide any other thoughts, suggestions or comments you might have on the online mapping application?
________________________________________________________________________________________________
4. How willing would you be to participate in a similar boating survey in the future?
Very willing
Somewhat willing
Not very willing
Not at all willing
5. Additional comments on the Massachusetts Recreational Boater Survey 2010 are welcome.
________________________________________________________________________________________________
We thank you for your participation throughout this boating season. If possible, we would appreciate if you would take time to do one last monthly trip survey to report on any boating activity during the month of October.
We would appreciate a response even if you did not take your boat out on the water during the month of October.

Massachusetts Recreational Boater Survey 2010 – Final Report 129 June 22, 2011
APPENDIX C: PROJECT SHEET INCLUDED IN THE RECRUITMENT PACKAGE AND USED
TO PUBLICIZE THE SURVEY

Massachusetts Recreational Boater Survey 2010 – Final Report 130 June 22, 2011
APPENDIX D: GENERIC PRESS RELEASE TEXT Early this summer, letters went out to 10,000 recreational boaters in Massachusetts, inviting them to participate in the Massachusetts Recreational Boater Survey 2010. And now, even those who did not receive a letter about the survey can participate.
The online survey is gathering detailed information on the recreational uses of coastal waters and boaters’ spending habits. The information gathered will serve a number of purposes, including ensuring that boaters’ favorite routes and destinations receive appropriate attention when management decisions are made about Massachusetts’ ocean waters.
The project is being led by the University of Massachusetts Boston's Urban Harbors Institute and the Massachusetts Ocean Partnership, together with Marine Consulting Services and the Massachusetts Office of Coastal Zone Management. The team is working in partnership with the Massachusetts Marine Trades Association, the Massachusetts Boating and Yacht Clubs Association, the Massachusetts Harbormasters Association and Sailors for the Sea.
For more information on the Massachusetts Recreational Boater Survey 2010 and how to participate, visit maboatersurvey.com or call XXX-XXX-XXXX.

Massachusetts Recreational Boater Survey 2010 – Final Report 131 June 22, 2011
APPENDIX E: GENERALIZED TEXT USED FOR THE MONTHLY E-MAILS Dear INDIVIDUAL BOATER’S NAME,
Thank you for agreeing to participate in the MA Recreational Boater Survey. Now that the boating season has started, we would like you to complete a survey about your boating activity during June 2010. The information gathered will ensure that boaters' favorite routes and destinations receive appropriate attention when management decisions are made about Massachusetts' ocean waters.
This survey should only take about 15-20 minutes to complete. We would appreciate a response even if you did not use your boat during June. To start the survey, please click on the link below:
Click here for the survey
The survey should automatically open in your browser. If the link does not work for any reason, please let us know by sending an e-mail to [email protected].
Don't forget, by completing this survey, you will be entered into the end-of-season drawing for the chance to win the grand prize of $1,000. Your name will also be entered into a drawing at the end of the month for a chance to win various prizes, including $100.
Congratulations to the two lucky boaters that won either $100, or OTHER PRIZE for completing the May boater survey. For details on the drawings and great prizes, please visit www.maboatersurvey.com.
Thank you and best wishes for a safe and enjoyable boating season from the 2010 Massachusetts Recreational Boater Survey Team.

Massachusetts Recreational Boater Survey 2010 – Final Report 132 June 22, 2011
APPENDIX F: GENERALIZED TEXT USED FOR THE SECOND REMINDER E-MAILS Dear INDIVIDUAL BOATER’S NAME,
As you know, the Massachusetts Recreational Boater Survey is underway and you kindly agreed to participate. However, we have not yet received your online completed survey about your boating activity (if any) during June. Please take a few moments to complete this survey as soon as you can by clicking the link below. THIS WILL BE YOUR FINAL E-MAIL REMINDER! Thank you!
Click here for the survey
IMPORTANT REMINDERS:
Completed monthly survey will also give you an additional entry into the end-of-season prize drawing with a grand prize of $1,000.
The information that you provide during the 2010 boating season is CRITICAL to ensuring your favorite routes and destinations receive appropriate attention when management decisions are made about the waters of Massachusetts.
After completing the survey, you will redirected to a “thank you” page where you can see a sneak peak of a map that shows some trip routes from data captured by the May monthly survey.
If you are having problems accessing the survey or completing the mapping part of the survey, we would be happy to guide you through it. Please contact us a [email protected] or XXX-XXX-XXXX (during business hours).
Thank you again for participating in this survey.
The MA Recreational Boater Survey Team.

Massachusetts Recreational Boater Survey 2010 – Final Report 133 June 22, 2011
APPENDIX G: ADDITIONAL SPATIAL MAPS

Massachusetts Recreational Boater Survey 2010 – Final Report 134 June 22, 2011