reserach on the state of corruption in croatia bura network of non-governmental organisations for...
TRANSCRIPT
RESERACH ON THE STATE OF CORRUPTION IN CROATIA
BURANetwork of non-governmental organisations
for fight against corruption and the Centre for Citizens’ Initiatives, Poreč

Number of respondents 1,000
MEN474
47%WOMEN526
53%
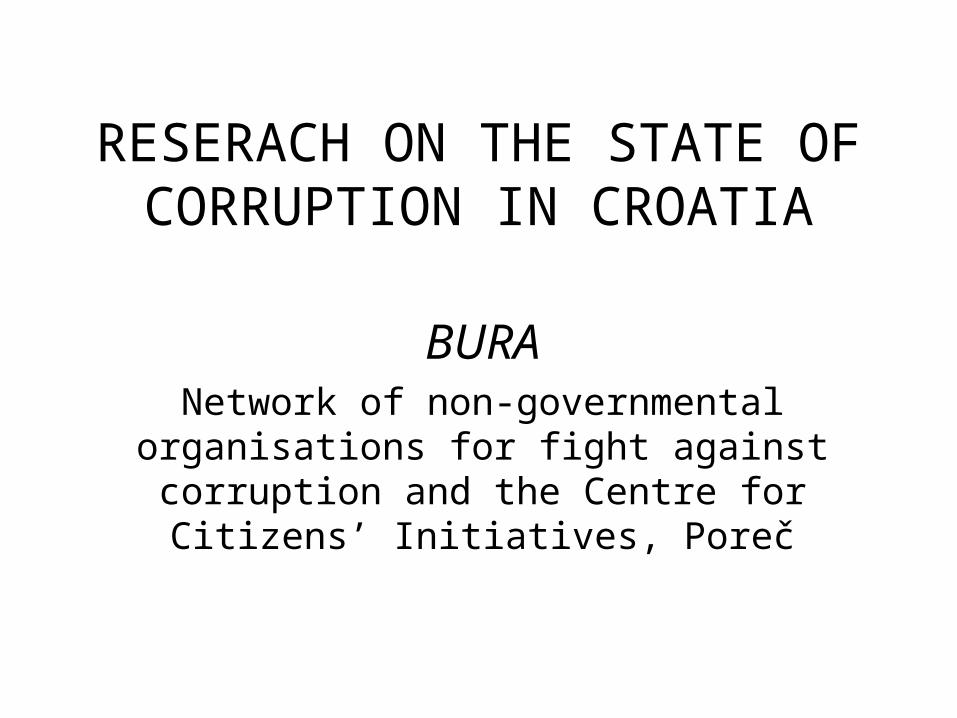
Regions
Region IDalmatia
Region IIKarlovac, Primorje
Region III
North
Region IV
Posavina
Region VSlavonijaVirovitica
Region VIZagreb
Region VII
Istra
Number of respondents per regions
20320%
10310%
12913%
11111%
15916%
24725%
485%
REGION I 20%
REGION II 10%
REGION III 13%
REGION IV 11%
REGION V 16%
REGION VI 25%
REGION VII 5%
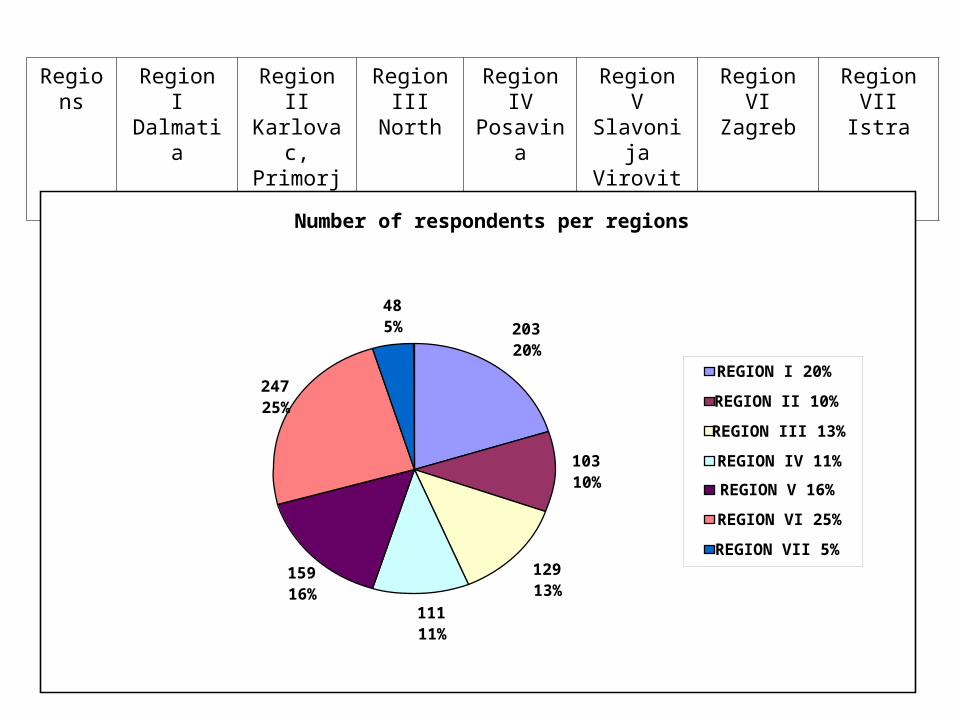
Age groups of respondents
18-3429%
35 - 5436%
55 - 7428%
75 -7%
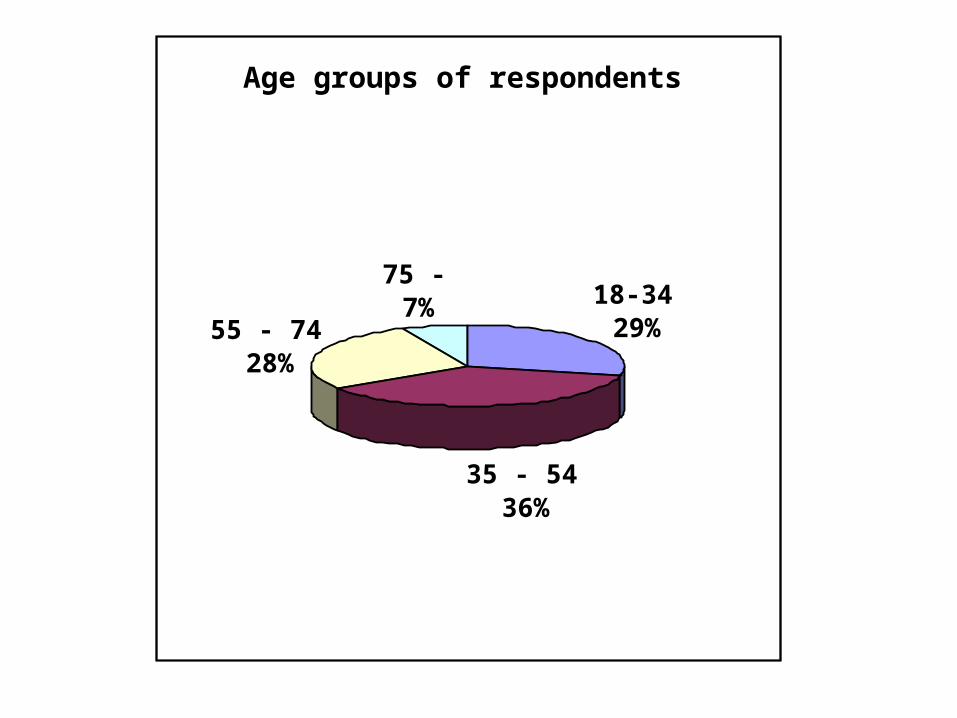
Respondents according to age and sex
148 181122
23
143 183 154
46
0
200
400
600
800
1000
18-34 35-54 55-74 75+
age
nu
mb
er
MEN WOMEN
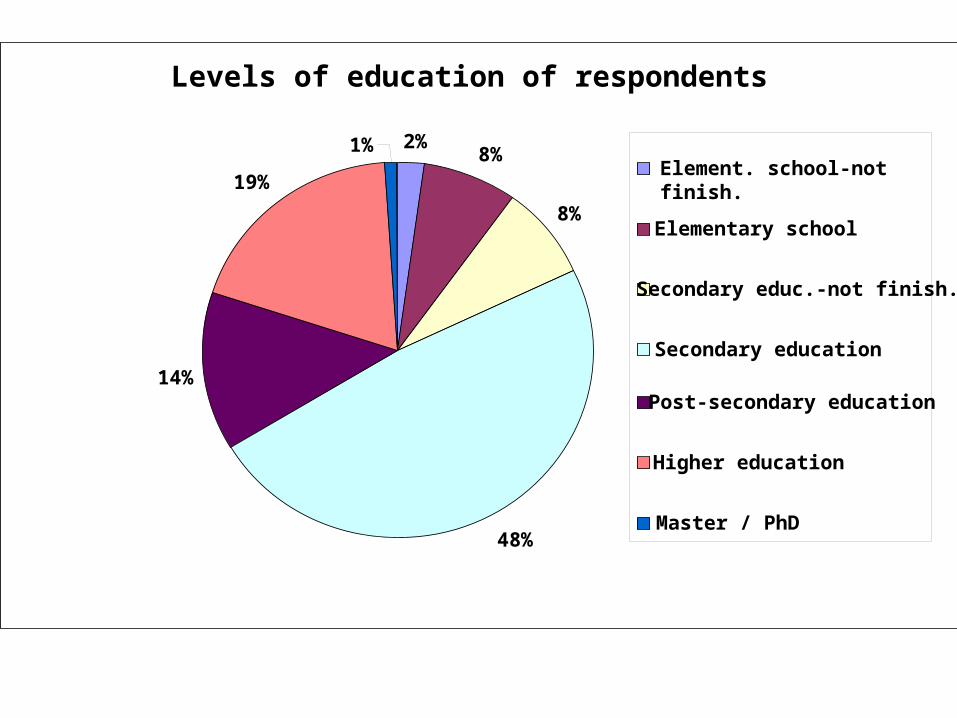
Levels of education of respondents
2%8%
8%
48%
14%
19%
1%Element. school-not finish.
Elementary school
Secondary educ.-not finish.
Secondary education
Post-secondary education
Higher education
Master / PhD

Employment status (in %)
122 5 7
13
37
3 5
23
0
20
40
60
80
100
unemplo
yed
moonlig
hting
studen
t
part-t
ime
defin
ed ti
me
undefin
ed ti
me
agric
ulture
/sel
f-em
ploye
d
entre
preneu
r
retir
emen
tPer
cen
tag
e o
f re
spo
nd
ents
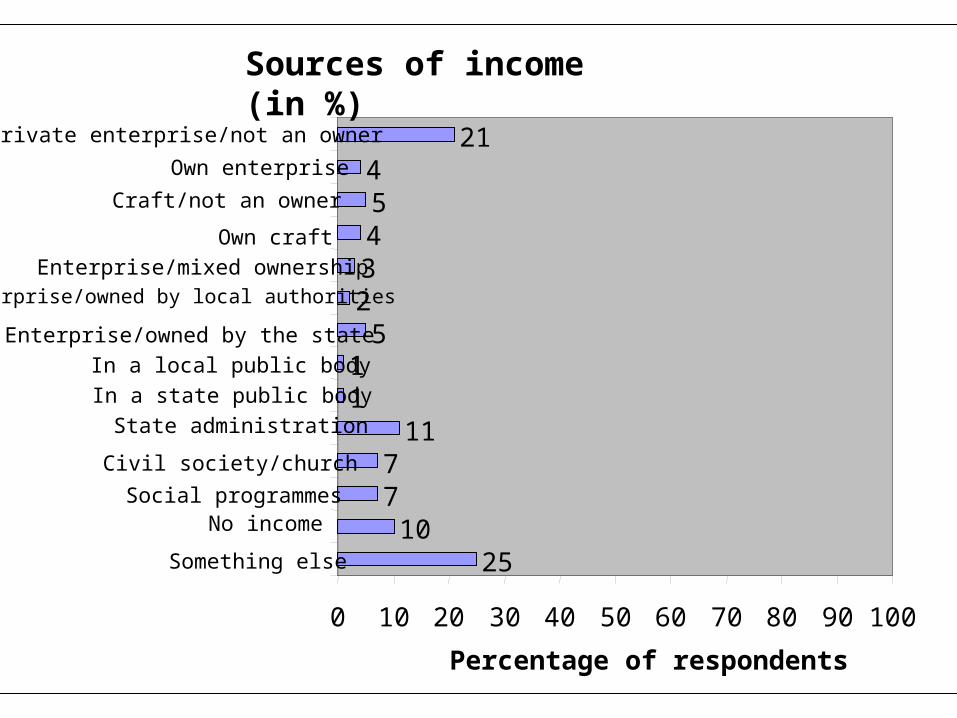
Sources of income (in %)
2510
77
1111
523454
21
0 10 20 30 40 50 60 70 80 90 100
Something else
No incomeSocial programmes
Civil society/church
State administration
In a state public body
In a local public body
Enterprise/owned by the state
Enterprise/owned by local authorities
Enterprise/mixed ownership
Own craft
Craft/not an owner
Own enterprise
Private enterprise/not an owner
Percentage of respondents

Family status (in %)
2
9
4
0
0
4
24
7
50
14
0 20 40 60 80 100
something else
widowed
divorced
homeless
social welfare
single parent
with parents/children
cohabitation
married
single
percentage of respondents
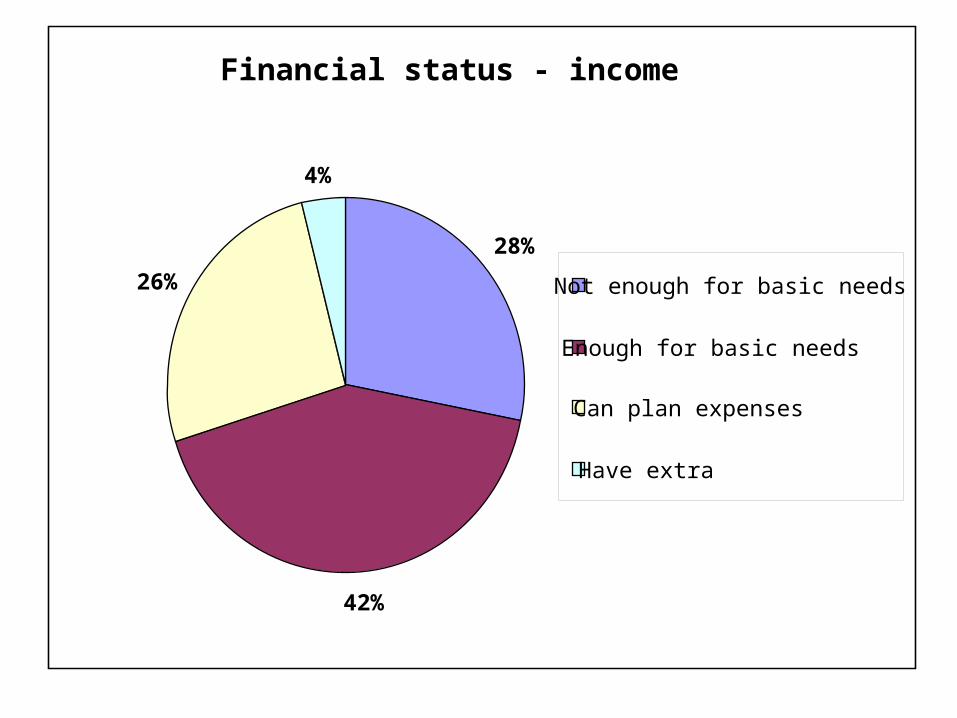
Financial status - income
28%
42%
26%
4%
Not enough for basic needs
Enough for basic needs
Can plan expenses
Have extra

MOST COMMON ANSWERS “YES” %
When representatives of state bodies tolerate activities of organised crime in exchange for money or a favour 96,21
When a responsible person in a public body asks me a favour or money for positive outcome of my matter 94,71
When a doctor or medical personnel receives money or other valuables or a favour for medical services in a public institution94,61
When a person with access to information, during tender procedure in a public procurement process, offers me information on competition in exchange for money or other valuables 93,91
When a court, in exchange for material gain, brings a verdict which is not founded in law 93,71
MOST COMMON ANSWERS “NO”
When a civil servant receives a small gift for timely execution of my matter in line with law 27,64
When a responsible civil servant delays the decision on my matter 23,85
When employment in a public body is given to a person of same political orientation as the political party in power 22,75
When I am scared to report corruption because of the fear of retribution 16,87
When I reach the responsible civil servant, during public tender, and get information on other competitors 16,67
MOST COMMON ANSWERS “I DON’T KNOW”
When data collected by the secret services end up on newspaper covers 14,57
When systems of secret services are used for denunciation of political opponents 14,47
When I cannot get to information on public bodies’ responsibilities during deciding on my matter and which are the steps which public bodies must take in all similar cases
12,48
When a public official or a civil servant (employed in e.g. health care, education, social welfare, police etc.) pardons someone because he/she is a “good person” or a recognised expert in his/her field
12,38
When I reach the responsible civil servant, during public tender, and get information on other competitors10,78

Index of corruption
4,304,56
5,255,475,585,64
6,026,096,106,126,256,396,546,54
6,937,177,257,347,397,457,56
7,777,847,96
8,188,23
0 1 2 3 4 5 6 7 8 9 10
Citizens’ associationsPresident of the state
Religious communitiesInternational organisations
Investment fundsArmy
BanksSMEs
Social welfareInsurance companies
EducationIntelligence agencies
Big international companiesMedia
CustomsState attorney
Big domestic companiesInspection
PoliceLocal representative bodies
ParliamentState public administrationLocal public administration
Health careJudiciary
Political parties
Grade
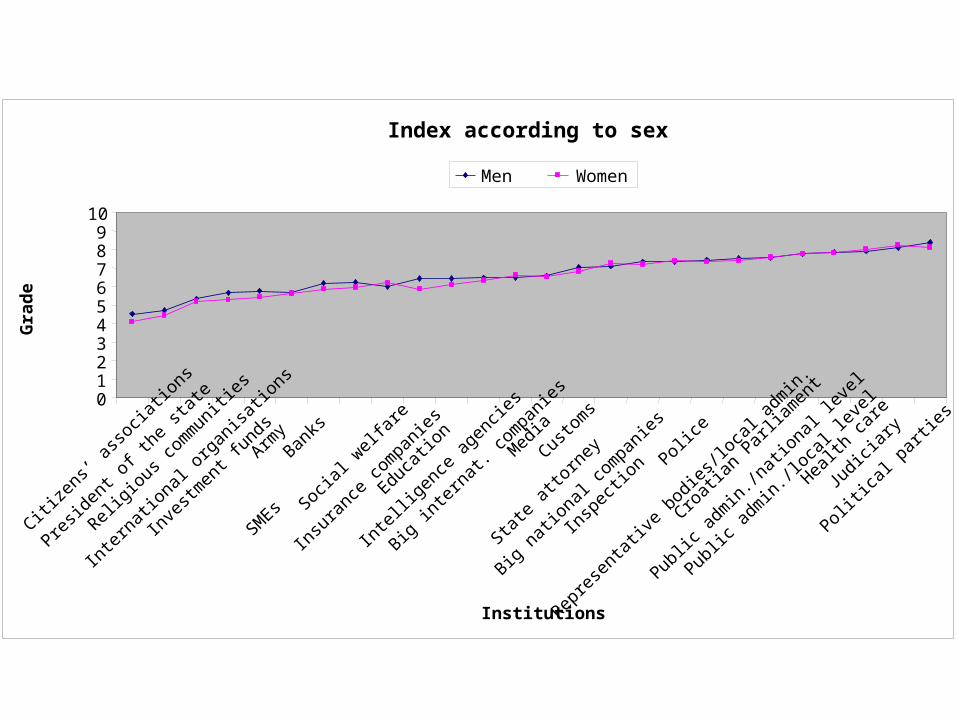
Index according to sex
0123456789
10
Citizen
s’ as
socia
tions
Presid
ent o
f the
stat
e
Religio
us co
mm
unitie
s
Inte
rnat
ional
orga
nisat
ions
Inve
stmen
t fun
dsArm
yBan
ks
SMEs
Social
welf
are
Insu
ranc
e co
mpa
nies
Educa
tion
Inte
lligen
ce a
genc
ies
Big int
erna
t. co
mpa
nies
Med
ia
Custo
ms
State
atto
rney
Big na
tiona
l com
panie
s
Insp
ectio
nPoli
ce
Repre
sent
ative
bod
ies/lo
cal a
dmin.
Croat
ian P
arlia
men
t
Public
adm
in./n
ation
al lev
el
Public
adm
in./lo
cal le
vel
Health
care
Judic
iary
Politic
al pa
rties
Institutions
Gra
de
Men Women
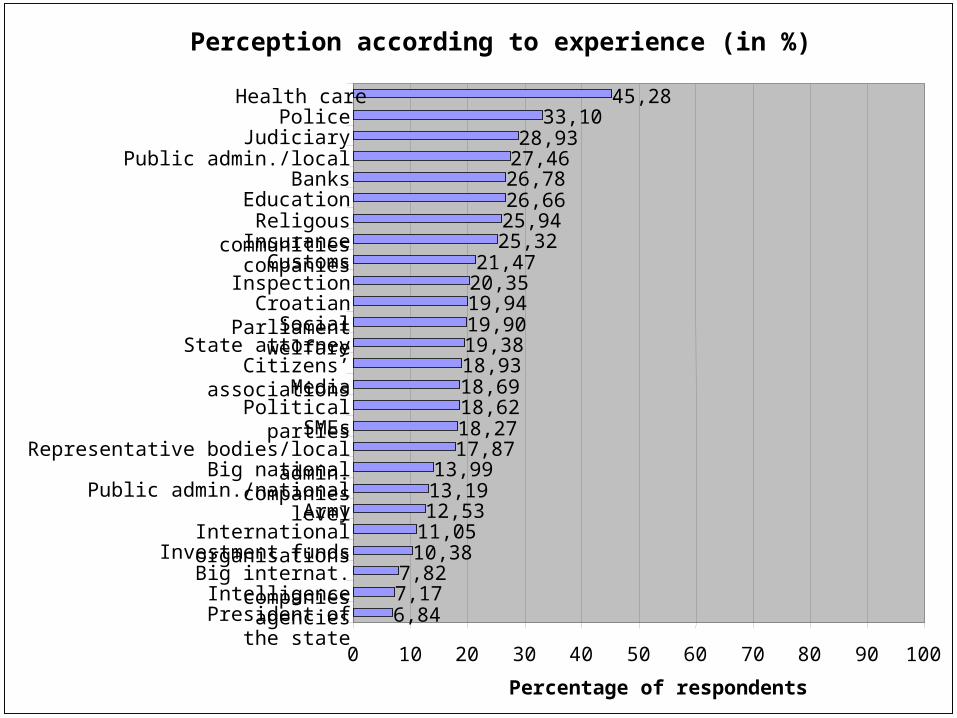
Perception according to experience (in %)
6,847,177,82
10,3811,0512,5313,1913,99
17,8718,2718,6218,6918,9319,3819,9019,9420,3521,47
25,3225,9426,6626,7827,4628,93
33,1045,28
0 10 20 30 40 50 60 70 80 90 100
President of the state
Intelligence agenciesBig internat. companies
Investment fundsInternational organisations
ArmyPublic admin./national level
Big national companiesRepresentative bodies/local admin.
SMEsPolitical parties
MediaCitizens’ associations
State attorneySocial welfare
Croatian ParliamentInspection
CustomsInsurance companiesReligous communities
EducationBanks
Public admin./localJudiciary
PoliceHealth care
Percentage of respondents
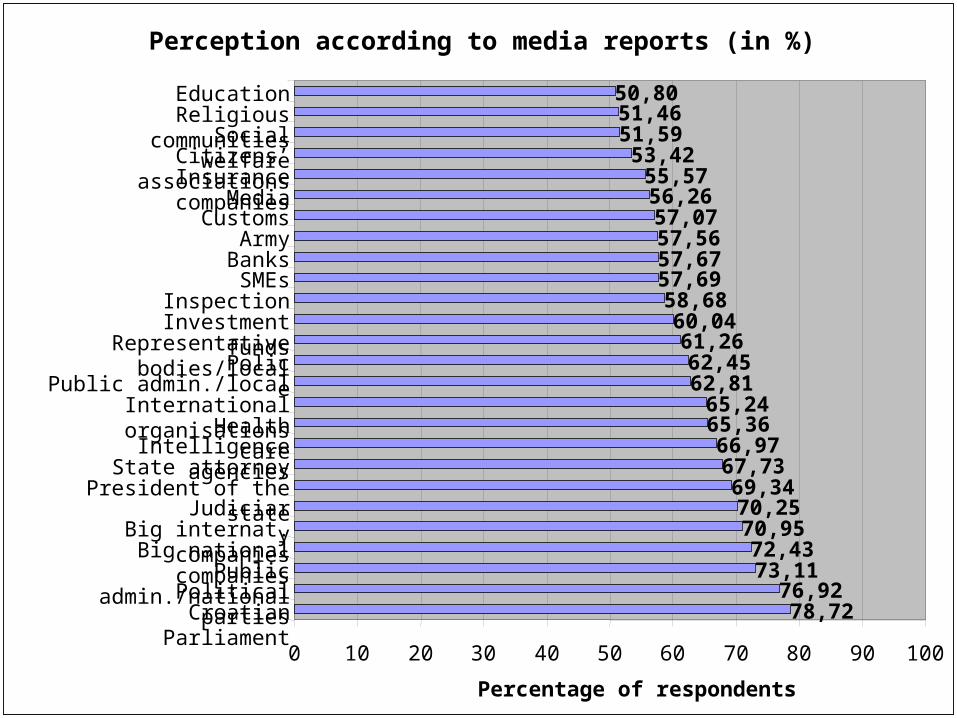
Perception according to media reports (in %)
78,7276,92
73,1172,43
70,9570,25
69,3467,7366,97
65,3665,24
62,8162,45
61,2660,04
58,6857,6957,6757,5657,0756,2655,57
53,4251,5951,4650,80
0 10 20 30 40 50 60 70 80 90 100
Croatian ParliamentPolitical parties
Public admin./nationalBig national companiesBig internat. companies
JudiciaryPresident of the state
State attorneyIntelligence agencies
Health careInternational organisations
Public admin./localPolice
Representative bodies/localInvestment funds
InspectionSMEsBanksArmy
CustomsMedia
Insurance companiesCitizens’ associations
Social welfareReligious communities
Education
Percentage of respondents

Corruption index - Region I
3,633,70
5,235,265,31
5,575,595,615,665,765,76
6,316,436,436,46
6,776,956,997,117,23
7,407,667,83
8,198,24
8,43
0 1 2 3 4 5 6 7 8 9 10
President of the stateCitizens associations
Investment fundsEducation
ArmyInternational organisations
Religious communitiesInsurance companies
SMEsSocial welfare
BanksMedia
CustomsBig internat. companies
Intelligence agenciesBig national companies
State attorneyPolice
InspectionCroatian Parliament
Public admin./nationalRepresentative bodies/local
Public admin./localHealth care
JudiciaryPolitical parties
Grade

Corruption index - Region II
4,284,34
5,445,73
5,915,956,126,316,336,436,506,526,556,726,726,88
7,197,267,437,507,547,55
7,737,757,83
8,21
0 1 2 3 4 5 6 7 8 9 10
Citizens’ associationsPresident of the state
Religious communitiesArmy
Investment fundsInternational organisations
BanksIntelligence agencies
EducationMedia
Insurance companies
SMEsCustoms
PoliceSocial welfareState attorney
InspectionBig internation. companies
Representatives bodies/localCroatian Parliament
Public admin./nationalBig national companies
Public admin./localJudiciary
Health carePolitical parties
Grade
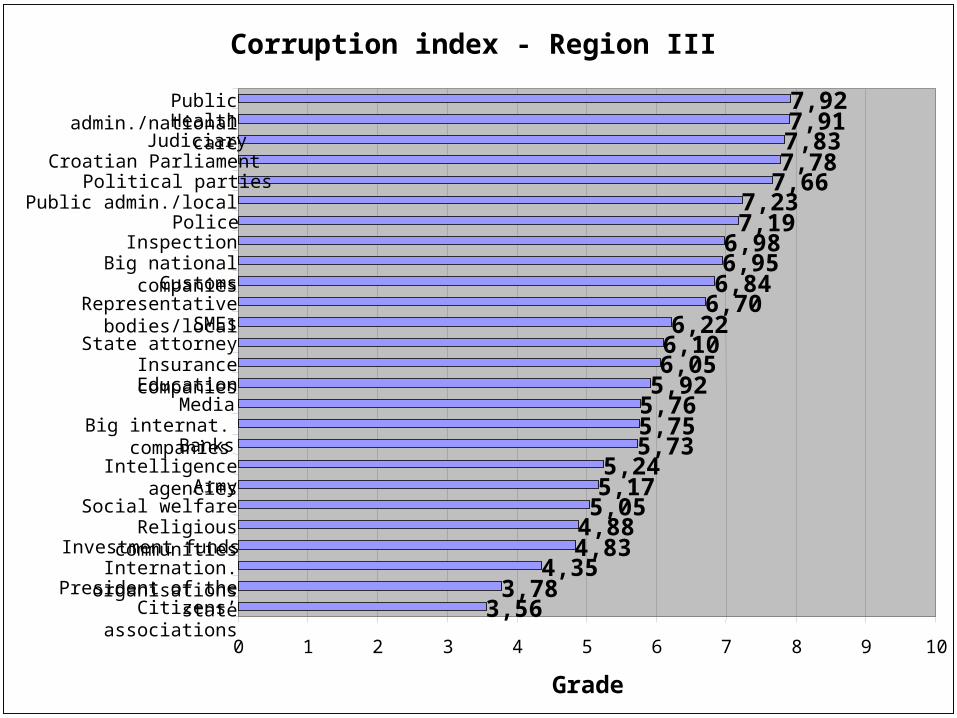
Corruption index - Region III
3,563,78
4,354,834,885,055,175,24
5,735,755,765,926,056,106,22
6,706,846,956,98
7,197,23
7,667,787,837,917,92
0 1 2 3 4 5 6 7 8 9 10
Citizens’ associationsPresident of the state
Internation. organisationsInvestment funds
Religious communitiesSocial welfare
ArmyIntelligence agencies
BanksBig internat. companies
MediaEducation
Insurance companiesState attorney
SMEsRepresentative bodies/local
CustomsBig national companies
InspectionPolice
Public admin./localPolitical parties
Croatian ParliamentJudiciary
Health carePublic admin./national
Grade
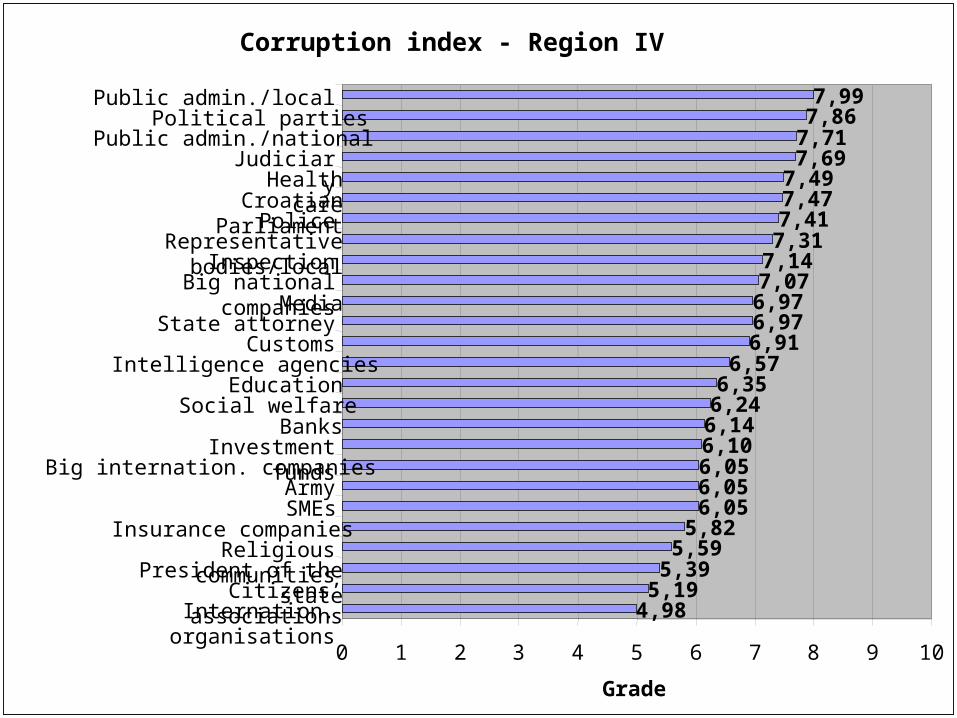
Corruption index - Region IV
4,985,19
5,395,59
5,826,056,056,056,106,146,246,35
6,576,916,976,977,077,147,317,417,477,49
7,697,717,867,99
0 1 2 3 4 5 6 7 8 9 10
Internation. organisationsCitizens’ associationsPresident of the state
Religious communitiesInsurance companies
SMEsArmy
Big internation. companiesInvestment funds
BanksSocial welfare
EducationIntelligence agencies
CustomsState attorney
MediaBig national companies
InspectionRepresentative bodies/local
PoliceCroatian Parliament
Health careJudiciary
Public admin./nationalPolitical parties
Public admin./local
Grade

Corruption index - Region V
4,785,04
5,275,755,89
6,126,236,286,32
6,626,676,856,896,93
7,317,36
7,617,677,777,837,92
8,138,218,328,348,51
0 1 2 3 4 5 6 7 8 9 10
Citizens’ associationsReligious communitiesPresident of the state
Internation. organisationsInvestment funds
ArmyInsurance companies
SMEsBanks
Social welfareBig internation. companies
EducationIntelligence agencies
MediaCustoms
Big national companiesInspection
Representative bodies/localPublic admin./local
State attorneyPolice
Public admin./nationalCroatian Parliament
JudiciaryHealth care
Political parties
Grade

Corruption index - Region VI
4,624,855,01
5,675,73
6,046,116,13
6,366,426,436,586,67
6,957,327,40
7,617,617,717,777,807,827,83
8,208,36
8,60
0 1 2 3 4 5 6 7 8 9 10
Citizens’ associationsPresident of the state
Religious communitiesArmy
Investment fundsInternation. organisations
BanksSMEs
EducationInsurance companies
Social welfareIntelligence agencies
MediaBig internation. companies
CustomsCroatian Parliament
Representative bodies/localBig national companies
PoliceState attorney
InspectionHealth care
Public admin./nationalPublic admin./local
Political partiesJudiciary
Grade
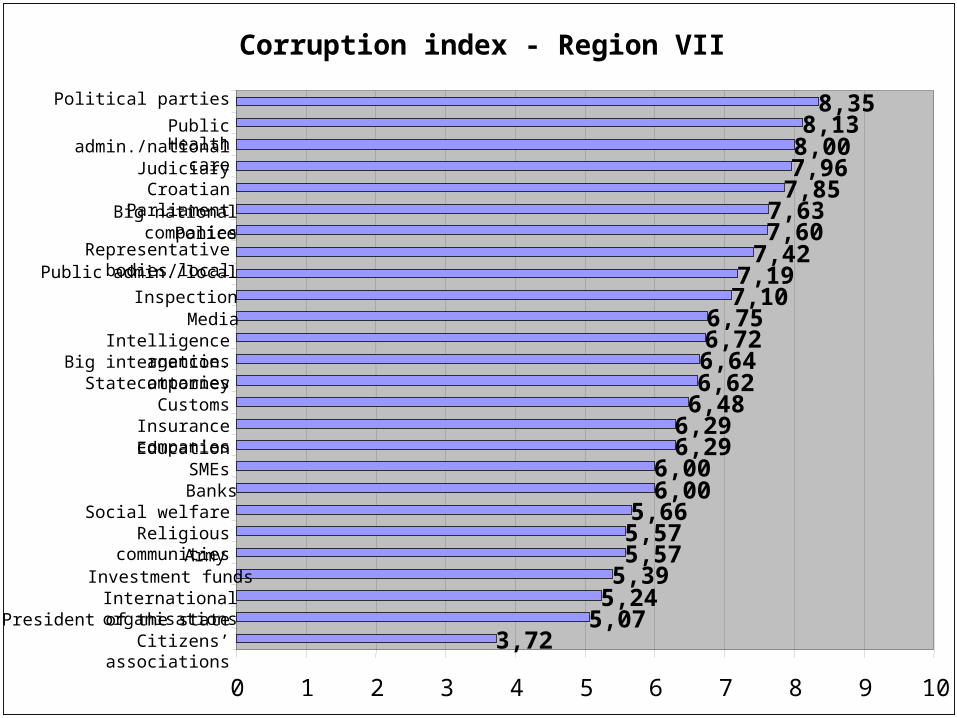
Corruption index - Region VII
3,725,075,245,395,575,575,66
6,006,00
6,296,29
6,486,626,646,726,75
7,107,19
7,427,607,63
7,857,968,008,13
8,35
0 1 2 3 4 5 6 7 8 9 10
Citizens’ associationsPresident of the state
International organisationsInvestment funds
ArmyReligious communities
Social welfareBanksSMEs
EducationInsurance companies
CustomsState attorney
Big internation. companiesIntelligence agencies
MediaInspection
Public admin./localRepresentative bodies/local
PoliceBig national companies
Croatian ParliamentJudiciary
Health carePublic admin./national
Political parties
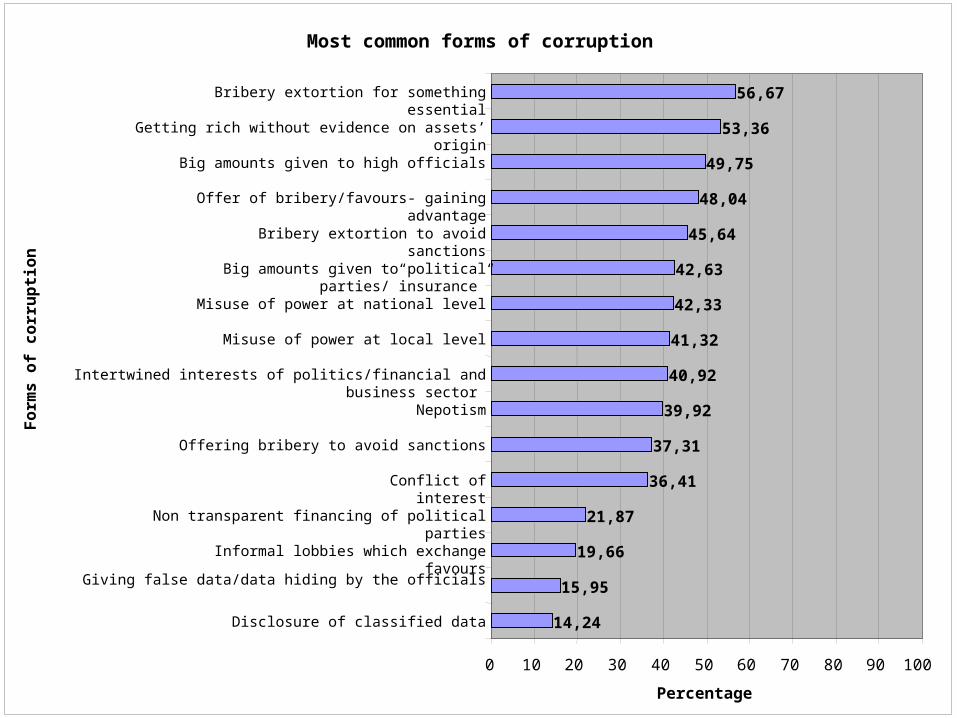
Most common forms of corruption
14,24
15,95
19,66
21,87
36,41
37,31
39,92
40,92
41,32
42,33
42,63
45,64
48,04
49,75
53,36
56,67
0 10 20 30 40 50 60 70 80 90 100
Disclosure of classified data
Giving false data/data hiding by the officials
Informal lobbies which exchange favours
Non transparent financing of political parties
Conflict of interest
Offering bribery to avoid sanctions
Nepotism
Intertwined interests of politics/financial and business sector
Misuse of power at local level
Misuse of power at national level
Big amounts given to political parties/”insurance”
Bribery extortion to avoid sanctions
Offer of bribery/favours- gaining advantage
Big amounts given to high officials
Getting rich without evidence on assets’ origin
Bribery extortion for something essential
Fo
rms
of
co
rru
pti
on
Percentage
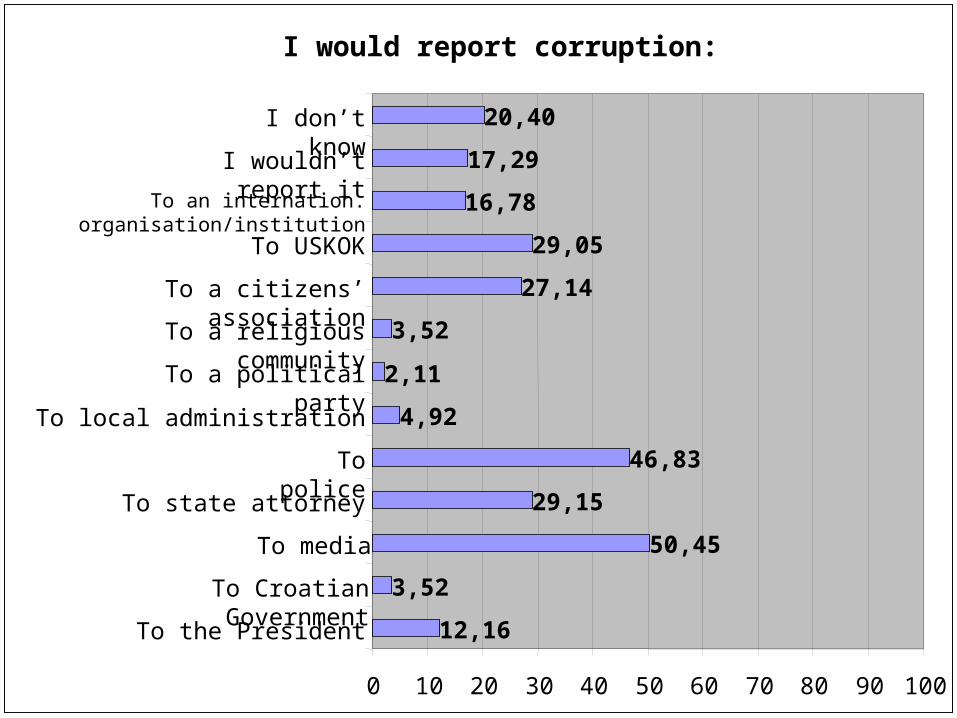
I would report corruption:
12,16
3,52
50,45
29,15
46,83
4,92
2,11
3,52
27,14
29,05
16,78
17,29
20,40
0 10 20 30 40 50 60 70 80 90 100
To the President
To Croatian Government
To media
To state attorney
To police
To local administration
To a political party
To a religious community
To a citizens’ association
To USKOK
To an internation. organisation/institution
I wouldn’t report it
I don’t know
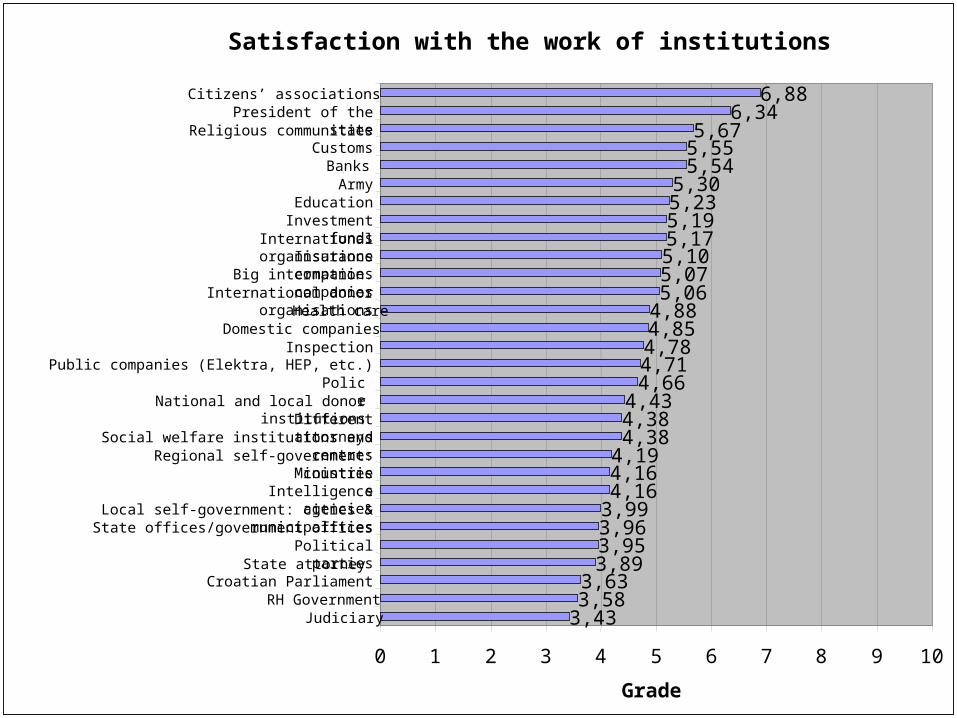
Satisfaction with the work of institutions
3,433,583,63
3,893,953,963,994,164,164,194,384,384,43
4,664,714,784,854,885,065,075,105,175,195,235,30
5,545,555,67
6,346,88
0 1 2 3 4 5 6 7 8 9 10
JudiciaryRH Government
Croatian ParliamentState attorneyPolitical parties
State offices/government officesLocal self-government: cities & municipalities
Intelligence agenciesMinistries
Regional self-government: countiesSocial welfare institutions and centres
Different attorneysNational and local donor institutions
PolicePublic companies (Elektra, HEP, etc.)
InspectionDomestic companies
Health careInternational donor organisations
Big internation. companiesInsurance companies
International organisationsInvestment funds
EducationArmy
BanksCustoms
Religious communitiesPresident of the stateCitizens’ associations
Grade
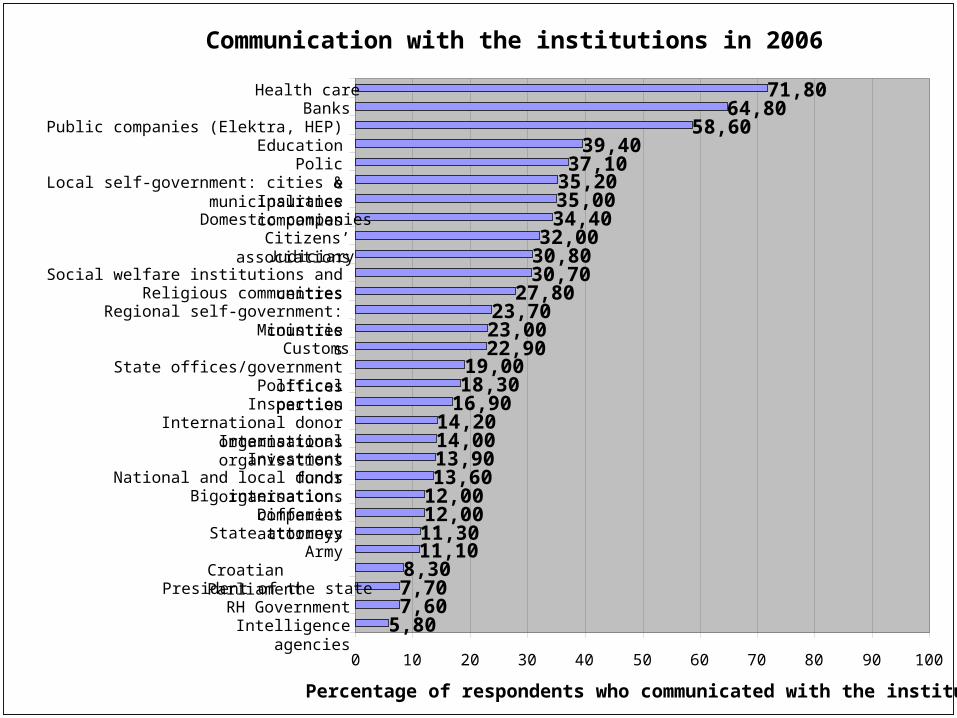
Communication with the institutions in 2006
5,807,607,708,30
11,1011,3012,0012,0013,6013,9014,0014,20
16,9018,3019,00
22,9023,0023,70
27,8030,7030,8032,00
34,4035,0035,2037,10
39,4058,60
64,8071,80
0 10 20 30 40 50 60 70 80 90 100
Intelligence agenciesRH Government
President of the stateCroatian Parliament
ArmyState attorney
Different attorneysBig internation. companies
National and local donor organisationsInvestment funds
International organisationsInternational donor organisations
InspectionPolitical parties
State offices/government officesCustoms
MinistriesRegional self-government: counties
Religious communitiesSocial welfare institutions and centres
JudiciaryCitizens’ associationsDomestic companies
Insurance companiesLocal self-government: cities & municipalities
PoliceEducation
Public companies (Elektra, HEP)Banks
Health care
Percentage of respondents who communicated with the institutions