reservoir dynamics with insar temple university
TRANSCRIPT
1 | US DOE Geothermal Program eere.energy.gov
Public Service of Colorado Ponnequin Wind Farm
Geothermal Technologies Program 2013 Peer Review
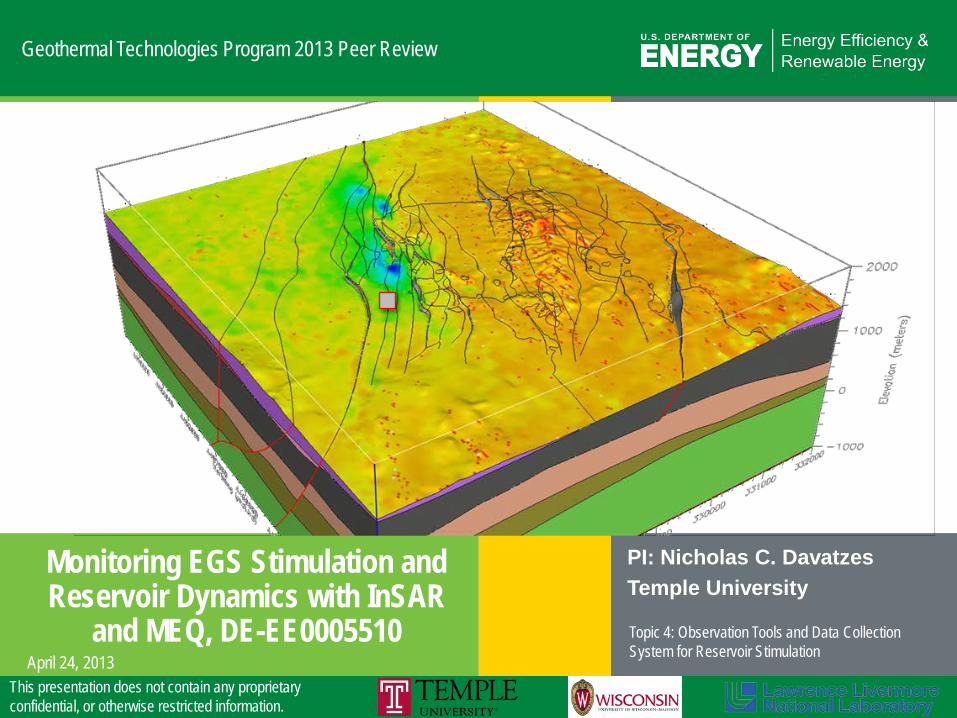
Monitoring EGS Stimulation and Reservoir Dynamics with InSAR
and MEQ, DE-EE0005510
PI: Nicholas C. Davatzes Temple University Topic 4: Observation Tools and Data Collection System for Reservoir Stimulation
April 24, 2013 This presentation does not contain any proprietary confidential, or otherwise restricted information.

2 | US DOE Geothermal Program eere.energy.gov
Relevance/Impact of Research
Currently, no tool effectively provides direct monitoring of the progress of fluid pressure into the natural fracture network or surrounding formation.
• Objectives: – Improve monitoring of fluid pathways and subsurface permeability change
to optimize injection/production design. – Explore the relationship of both seismic and aseismic deformation to fluid
pressure and flow fields. – Develop integrated geologic/geomechanical model that matches seismic
and aseismic responses to pumping.
• Impact: LCOE improvements primarily result from better definition of the reservoir geometry and pressure field – Improved management of injection/production strategies to more efficiently
sweep heat and minimize fluid losses to the formation – Improved siting of new wells/reduced potential of failed wells by assessing
the fluid volume in communication with existing wells – Assessing stimulation potential by determining the proximity of tight wells
to the reservoir – Avoiding development of short circuits

3 | US DOE Geothermal Program eere.energy.gov
Technical Approach
Goal: Map the evolution of the stimulated zone and pore pressure distribution in reservoir during stimulation and production phases of EGS.
• Previous production at Brady displays associated seismicity and clearly defined surface deformation. – Assemble comprehensive dataset of historical seismicity and surface
deformation. – Develop integrated geology and geomechanics model using FEM model. – Model link between injection/production, pore pressure, and associated
deformation/seismicity. – Estimate stimulation volume and fluid flow from EGS using seismicity and
surface deformation. – Provide procedure/toolkit to industry.
Team: Surface deformation and seismic: Feigl, Mellors, Foxall Geology, geomechanics: Davatzes, Wang (Ali) Integration and management: Davatzes
4 | US DOE Geothermal Program eere.energy.gov
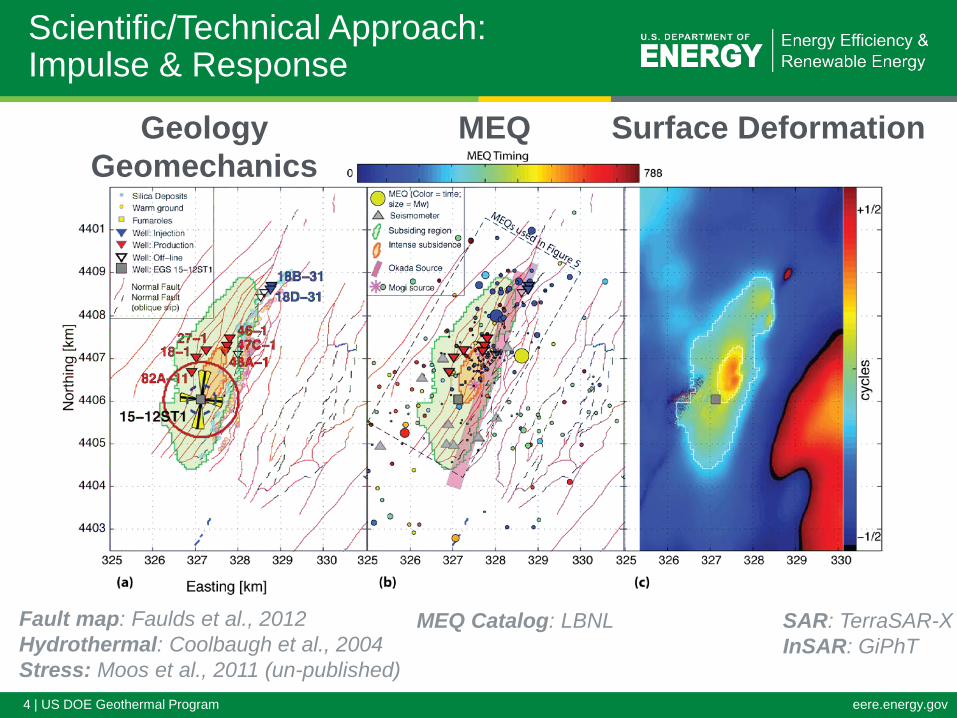
Scientific/Technical Approach: Impulse & Response
Fault map: Faulds et al., 2012 Hydrothermal: Coolbaugh et al., 2004 Stress: Moos et al., 2011 (un-published)
Geology Geomechanics
MEQ Surface Deformation
MEQ Catalog: LBNL SAR: TerraSAR-X InSAR: GiPhT

5 | US DOE Geothermal Program eere.energy.gov
Scientific/Technical Approach: Impulse & Response Time Series
• Fluid injection is coupled to deformation
• Impulse: – Injection/production
history
• Response: – InSAR: Surface
deformation field – MEQs: Coulomb Friction
Failure criterion
• Process is modeled analytically and in FEM (COMSOL & ABAQUS) – Geology, Structure – Physical Properties – Boundary Stresses

6 | US DOE Geothermal Program eere.energy.gov
Scientific/Technical Approach: Impulse & Response
Outcomes
Properties, B./I. C.
Impulse Response
Uncertainty Uniqueness
Workflow of Integrated Analysis

7 | US DOE Geothermal Program eere.energy.gov
Summary planned and actual Accomplishments, Results and Progress
• Planned activities are summarized in the Gantt Chart
• Project timeline has been extended to match delay in Brady EGS Demonstration Project (NCE = 3 Quarters)
• Key data and initial analyses in place for monitoring EGS demonstration:
– rapid acquisition of TerraSAR-X scenes
– Improved seismic velocity model
8 | US DOE Geothermal Program eere.energy.gov
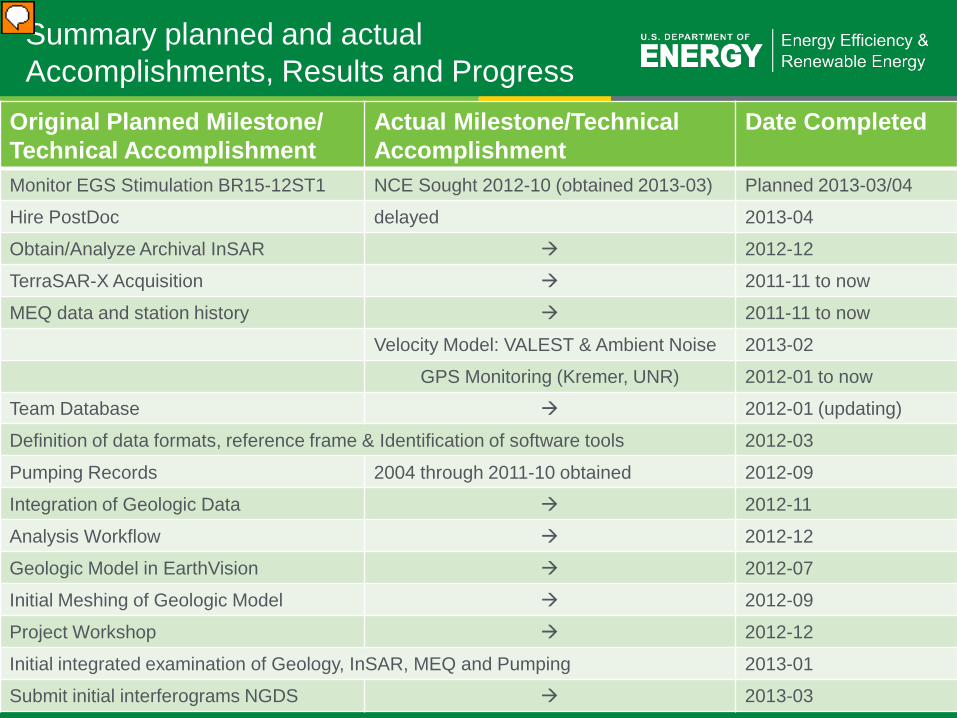
Summary planned and actual Accomplishments, Results and Progress
Original Planned Milestone/ Technical Accomplishment
Actual Milestone/Technical Accomplishment
Date Completed
Monitor EGS Stimulation BR15-12ST1 NCE Sought 2012-10 (obtained 2013-03) Planned 2013-03/04
Hire PostDoc delayed 2013-04
Obtain/Analyze Archival InSAR 2012-12
TerraSAR-X Acquisition 2011-11 to now
MEQ data and station history 2011-11 to now
Velocity Model: VALEST & Ambient Noise 2013-02
GPS Monitoring (Kremer, UNR) 2012-01 to now
Team Database 2012-01 (updating)
Definition of data formats, reference frame & Identification of software tools 2012-03
Pumping Records 2004 through 2011-10 obtained 2012-09
Integration of Geologic Data 2012-11
Analysis Workflow 2012-12
Geologic Model in EarthVision 2012-07
Initial Meshing of Geologic Model 2012-09
Project Workshop 2012-12
Initial integrated examination of Geology, InSAR, MEQ and Pumping 2013-01
Submit initial interferograms NGDS 2013-03

9 | US DOE Geothermal Program eere.energy.gov
Summary Slide: Table of Key Technical Accomplishments
FY2012 Milestone/Tech Accom FY2013 Milestone/Tech Accom Analysis of Surface Deformation
- Acquired ALOS scenes - Acquisition of TerraSAR-X scenes - GPS monitoring (added task)
- Continue TerraSAR-X acquisition - Monitor stimulation of 15-12ST1
Result (status) - Initial models of subsidence in vicinity of production from 1992 to present: ~20 years - GPS data acquisition since 2012
- Time series analysis of InSAR
Analysis of Seismicity
- Acquired MEQ catalog from LBNL - Velocity Model (added task)
- Complete updated velocity model - Begin advanced analysis
Result - Catalog background - Initial locations and moment release - Velocity model (VELEST & Ambient noise)
- Continue to refine velocity model as new MEQs are aquired - Advanced analysis on-going
Geological Database
- EGS project analysis - Acquired and formatted production/injection data
- Expand pumping records pre 2004 - Continue acquisition of new pumping data including stimulation
Result - Geologic & Geomechanical model (formations, fractures, stress, phys. prop.)
- Integrated pumping record
Analysis Framework
- Established Analysis Workflow - Established data standards
Establish workflow to enable “semi-automation” of joint analysis of InSAR and MEQ via poroelastic modeling
Result - Initial time series of Impulse-Response - Established relative of aseismic and seismic processes to pumping activity
- Build Workflow tools for analysis - Robust time series comparison

10 | US DOE Geothermal Program eere.energy.gov
Technical Results: Spatial Correspondence (88 Days)

11 | US DOE Geothermal Program eere.energy.gov
Summary Technical Results: Findings and Implications Impulse and Response: • Deformation is highly episodic (both surface displacements and MEQ) • Most deformation is aseismic, and energy release through MEQs is too small to
significantly contribute to the surface deformations • The most intense Surface Deformations and MEQ activity are not co-located • MEQs are generally below the reservoir as inferred from wells and from modeling of
surface deformations, but outside the region of maximum subsidence • Both effective normal stress decrease due to injection and solid stress change due to
contraction caused by production induce MEQs, thus confusing their association with the permeable fracture network.
Brady Reservoir: • The region of active pumping represents only a narrow vertical conduit of enhanced
permeability tapping a deeper, extensive fault-hosted reservoir • The orientation of the subsidence zone and elastic deformation source relative to the
average fault strike suggest that multiple fault segments are combine to host the reservoir and the clear locus is the common bend (and associated branching) of these fault segments.
• Differences between modeled volume change at depth and cumulative volume extraction suggest a significant component of flow into the reservoir to support production.

12 | US DOE Geothermal Program eere.energy.gov
Impact of Technical Results: Brady Reservoir and EGS
• Deformation sources consistent with upwelling of hot water evidenced by isothermal temperature profiles (Shevenell et al., 2012) along fracture zone localized at bend in Brady Fault
• Recharge preferentially along fault strike and consistent with SHmax direction
• Well 15-12ST1 is well-positioned to connect through hot, untapped rock to the current set of producing wells
Isot
herm
al

13 | US DOE Geothermal Program eere.energy.gov
Future Directions
Milestone or Go/No-Go Status & Expected Completion Date Task 1: InSAR: obtain scenes from WINSAR archive Complete: 2012, Q4
Task 1: InSAR: software tools to streamline analysis Started (2014, Q2)
Task 1: InSAR: complete analysis of archived Initial analysis of archived pairs: 2013, Q1 (2014, Q2): time series analysis
Task 1: InSAR: Analysis of TerraSAR-X scenes Initial analysis of selected pairs: 2013, Q1 (2015, Q3): time series analysis
Task 2: MEQ: catalog of events with error estimates Started (2014, Q2) Task 2: MEQ: software tools to streamline analysis Started (2014, Q2) Monitor EGS Experiment 2013, Q3 Task 3: Modeling: Complete geologic and reservoir database
Database complete: 2012, Q4
Task 3: Modeling: software tools to streamline analysis
Started (2014, Q2)
Task 4: Phase 1 Report; Go/No-Go Decision (2014, Q3) Task 5: Brady Prototype passed to ORMAT (2016, Q1)

14 | US DOE Geothermal Program eere.energy.gov
• The Reservoir Monitoring using InSAR and MEQ project: – Strong research team and dedicated field operator – Benefits from a 20-year record of reservoir deformation in the shallow
subsurface (<1-2 km) and pumping records – Is integrated with an EGS demonstration project – Uses multiple mechanisms for monitoring fluid migration, change in
stress, and deformation during EGS reservoir management including pre-, syn-, and post- stimulation behavior of the stimulated volume
– Independently evaluates the relationship between MEQ and stimulation – Provides a database documenting these effects in response to both EGS
stimulation and reservoir management practice – Provides rapid development of technology to monitor and guide
stimulation during development of an EGS including evaluation of the longevity of the EGS flow pathways
– Provides an integrated reservoir model with higher resolution than can be achieved from monitoring well responses alone
– Ensures technology transfer is ensured by development of a prototype at the operating Brady’s geothermal field & open-source code development
Mandatory Summary Slide: Key Attributes of MEQ and InSAR Study

15 | US DOE Geothermal Program eere.energy.gov
Timeline:
Budget:
• Management Activities and Approaches: • Annual Science Team – Industry Workshop (1st in December 2012) • Twice-Monthly technical conference calls (including participation by the
industry partner, ORMAT, and coordination with EGS Demonstration) • Project organization through formal Work Flow
• Established common data formats, reference frame, metadata • Hierarchy of identified software tools including import/export filters, etc. • Cloud project database
– Established NCE to sync project timeline with Brady EGS Demonstration – Once data from the EGS demonstration is available research activity and the
spending rate will also increase (facilitated by hiring of PostDoc + Summer research time)
Project Management
Federal Share Cost Share Planned
Expenses to Date
Actual Expenses to
Date
Value of Work Completed to
Date
Funding needed to
Complete Work
$1,463,000 $77,000 $645,000 $298,000 $366,500 $1,242,000
Planned Start Date
Planned End Date
Actual Start Date
Actual /Est. End Date
10/1/11 9/30/14 4/1/12 12/31/15
End of FY2013-Q1
16 | US DOE Geothermal Program eere.energy.gov
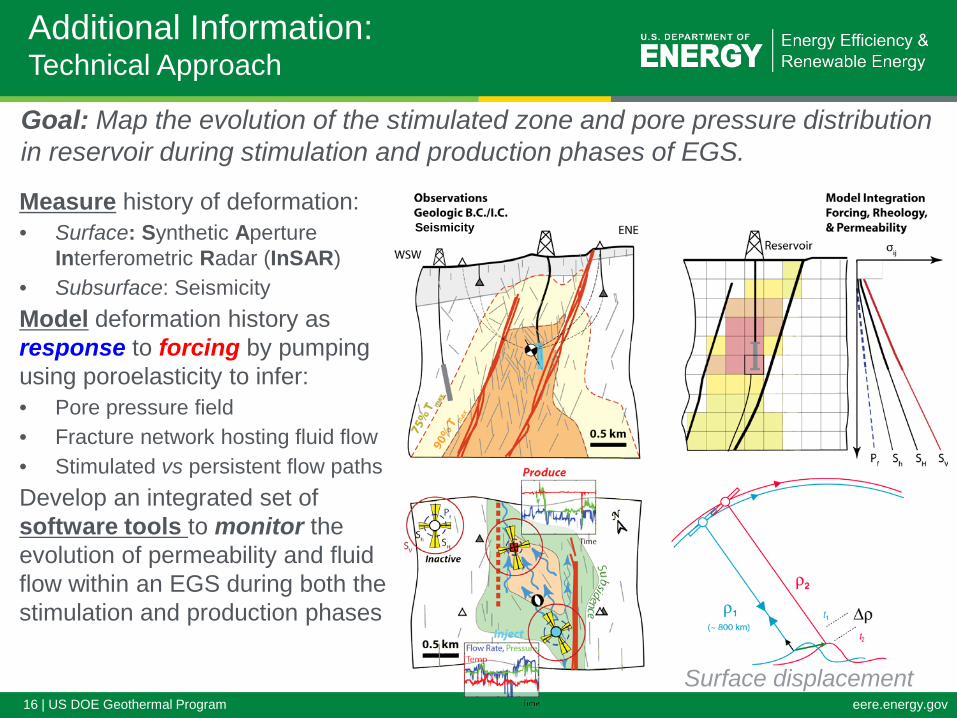
Additional Information: Technical Approach
Measure history of deformation: • Surface: Synthetic Aperture
Interferometric Radar (InSAR) • Subsurface: Seismicity Model deformation history as response to forcing by pumping using poroelasticity to infer: • Pore pressure field • Fracture network hosting fluid flow • Stimulated vs persistent flow paths Develop an integrated set of software tools to monitor the evolution of permeability and fluid flow within an EGS during both the stimulation and production phases
Goal: Map the evolution of the stimulated zone and pore pressure distribution in reservoir during stimulation and production phases of EGS.
Surface displacement
Seismicity