reservoir simulation and near-well bore modelling to aid ... · heriot -watt university . research...
TRANSCRIPT
Heriot-Watt University Research Gateway
Heriot-Watt University
Reservoir simulation and near-well bore modelling to aid scale management in a lowtemperature development with multilateral wellsIshkov, Oleg; Mackay, Eric James; Vazquez, Oscar; Jordan, Myles Martin
Published in:Proceedings - SPE International Symposium on Oilfield Chemistry
Publication date:2015
Document VersionEarly version, also known as pre-print
Link to publication in Heriot-Watt University Research Portal
Citation for published version (APA):Ishkov, O., Mackay, E. J., Vazquez, O., & Jordan, M. M. (2015). Reservoir simulation and near-well boremodelling to aid scale management in a low temperature development with multilateral wells. In Proceedings -SPE International Symposium on Oilfield Chemistry (Vol. 1, pp. 415-439). Society of Petroleum Engineers .
General rightsCopyright and moral rights for the publications made accessible in the public portal are retained by the authors and/or other copyright ownersand it is a condition of accessing publications that users recognise and abide by the legal requirements associated with these rights.
If you believe that this document breaches copyright please contact us providing details, and we will remove access to the work immediatelyand investigate your claim.

Download date: 22. Jun. 2018
SPE 173739
Reservoir Simulation and Near-Well Bore Modelling to Aid Scale Management in a Low Temperature Development with Multilateral Wells O. Ishkov, E.J. Mackay, O. Vazquez, Heriot-Watt University; M.M. Jordan, Nalco Champion
Copyright 2014, Society of Petroleum Engineers This paper was prepared for presentation at the SPE International Symposium on Oilfield Chemistry held in The Woodlands, Texas, USA, 13–15 April 2015. This paper was selected for presentation by an SPE program committee following review of information contained in an abstract submitted by the author(s). Contents of the paper have not been reviewed by the Society of Petroleum Engineers and are subject to correction by the author(s). The material does not necessarily reflect any position of the Society of Petroleum Engineers, its officers, or members. Electronic reproduction, distribution, or storage of any part of this paper without the written consent of the Society of Petroleum Engineers is prohibited. Permission to reproduce in print is restricted to an abstract of not more than 300 words; illustrations may not be copied. The abstract must contain conspicuous acknowledgment of SPE copyright.
Abstract This paper presents results of a reservoir and near wellbore modelling study to assist with the evaluation of inorganic scale risk management for a cold sandstone reservoir in the Norwegian sector of the North Sea. Reservoir temperature is in the range 32-48°C and poses a challenge to manage the scale risk. The field is heavily supported by aquifer water, and the development includes five production wells and seven seawater injection wells. The small number of high-cost, highly productive subsea multilateral wells with long horizontal sections, some with sliding sleeves to enhanced flow management, coupled with a high barium sulphate scaling tendency (up to 350ppm barium concentration in the formation water) requires effective scale management. This paper addresses questions of timing and nature of seawater breakthrough, when scale inhibitor squeeze treatments will be required, what is the impact of any reservoir reactions between the formation water and injected seawater on the scale risk at the production wells, what squeeze placement profiles look like under a range of squeeze treatment scenarios (various injection rates and sleeve position options). The treatment of multilateral wells by bullhead scale squeeze treatments is not a subject extensively covered in the literature, so the focus of this paper is to understand the impact on squeeze treatment life of bullhead deployment as a function of pump rate with both laterals open and the impact on treatment lifetime and treatment cost of selective placement into each lateral by treating one lateral at a time via activation of the sliding sleeve mechanism. The paper draws on a wide range of technical inputs to make scale management decisions including: thermodynamic modelling techniques, reservoir simulation of fluid mixing and reaction, laboratory-generated coreflood data to assess chemical selection for scale inhibitor squeeze, and squeeze treatment design drawing on all the information outlined above. Sharing the scale management technical challenges associated with such low temperatures and treating multilateral wells provides an example of the factors that should be taken into account during project design in similar fields under development in Northern Norway, offshore West Africa and offshore Brazil.
Introduction Sandstone reservoir located in the Norwegian sector of the North Sea contains oil with an overlying gas cap and lies approximately 1100 metres beneath the sea surface. Reservoir temperature is relatively low 32 – 48°C and poses a challenge from the risk of mineral scale point of view. Reservoir pressure is low as well – in the range of 120 –180 bara. Water injection requires volumes greater than the water volumes expected to be produced. Produced water (PW) volumes are estimated to be 12 000 sm3/day, while total injection is designed to be 20 000 sm3/day. Regulatory requirement for that particular area in the Norwegian sector of the North Sea is "Zero discharge" policy which dictates that there will be no produced water discharge during normal operation.
2 SPE SPE-173739
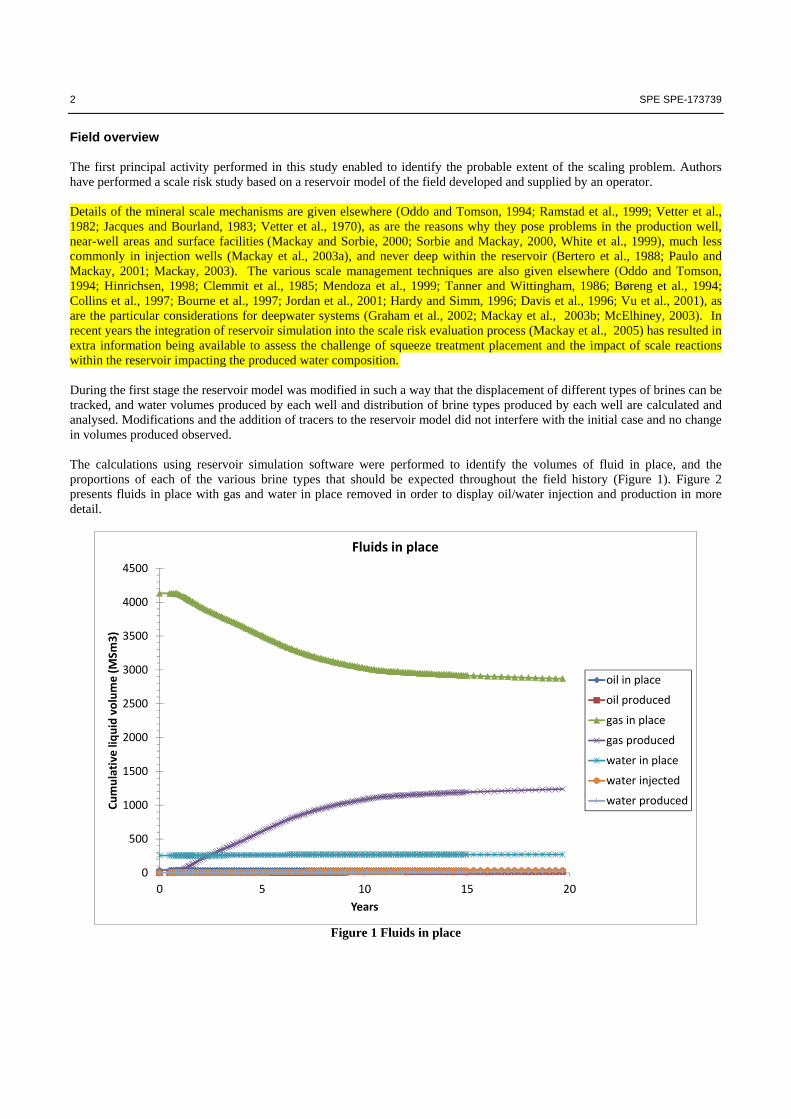
Field overview The first principal activity performed in this study enabled to identify the probable extent of the scaling problem. Authors have performed a scale risk study based on a reservoir model of the field developed and supplied by an operator. Details of the mineral scale mechanisms are given elsewhere (Oddo and Tomson, 1994; Ramstad et al., 1999; Vetter et al., 1982; Jacques and Bourland, 1983; Vetter et al., 1970), as are the reasons why they pose problems in the production well, near-well areas and surface facilities (Mackay and Sorbie, 2000; Sorbie and Mackay, 2000, White et al., 1999), much less commonly in injection wells (Mackay et al., 2003a), and never deep within the reservoir (Bertero et al., 1988; Paulo and Mackay, 2001; Mackay, 2003). The various scale management techniques are also given elsewhere (Oddo and Tomson, 1994; Hinrichsen, 1998; Clemmit et al., 1985; Mendoza et al., 1999; Tanner and Wittingham, 1986; Børeng et al., 1994; Collins et al., 1997; Bourne et al., 1997; Jordan et al., 2001; Hardy and Simm, 1996; Davis et al., 1996; Vu et al., 2001), as are the particular considerations for deepwater systems (Graham et al., 2002; Mackay et al., 2003b; McElhiney, 2003). In recent years the integration of reservoir simulation into the scale risk evaluation process (Mackay et al., 2005) has resulted in extra information being available to assess the challenge of squeeze treatment placement and the impact of scale reactions within the reservoir impacting the produced water composition. During the first stage the reservoir model was modified in such a way that the displacement of different types of brines can be tracked, and water volumes produced by each well and distribution of brine types produced by each well are calculated and analysed. Modifications and the addition of tracers to the reservoir model did not interfere with the initial case and no change in volumes produced observed. The calculations using reservoir simulation software were performed to identify the volumes of fluid in place, and the proportions of each of the various brine types that should be expected throughout the field history (Figure 1). Figure 2 presents fluids in place with gas and water in place removed in order to display oil/water injection and production in more detail.
Figure 1 Fluids in place
0
500
1000
1500
2000
2500
3000
3500
4000
4500
0 5 10 15 20
Cumulative liquid volume (M
Sm3)
Years
Fluids in place
oil in place
oil produced
gas in place
gas produced
water in place
water injected
water produced
SPE SPE-173739 3
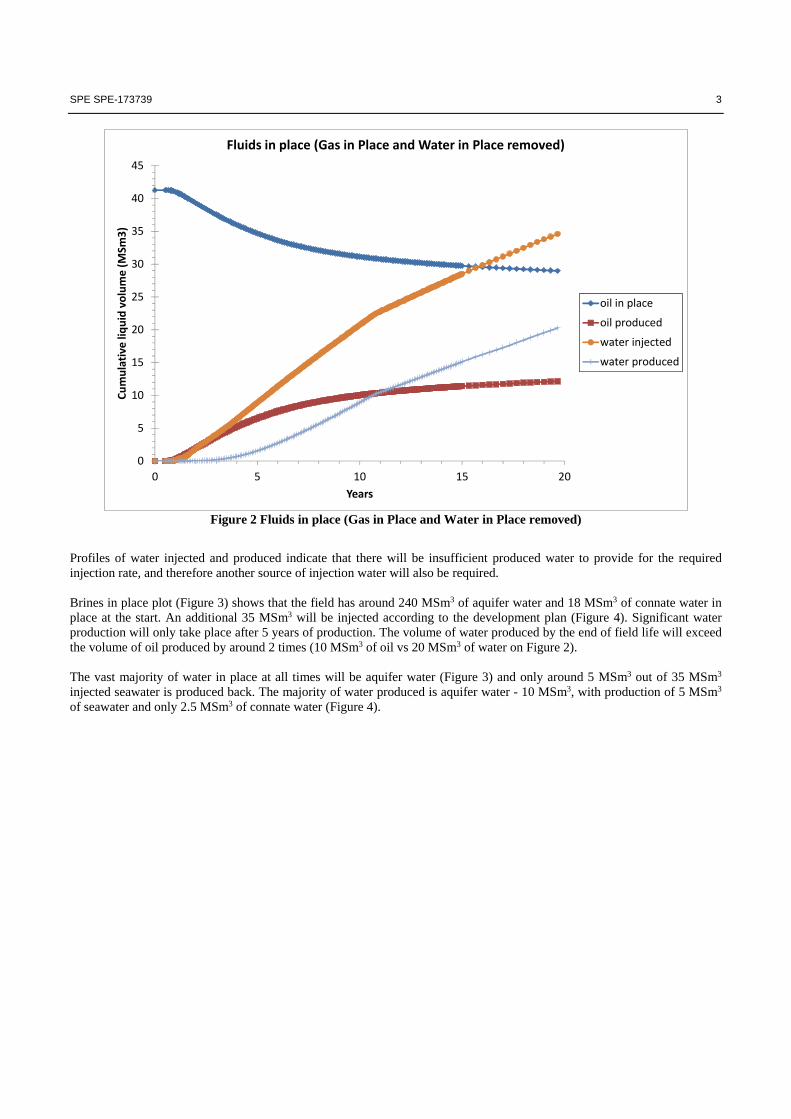
Figure 2 Fluids in place (Gas in Place and Water in Place removed)
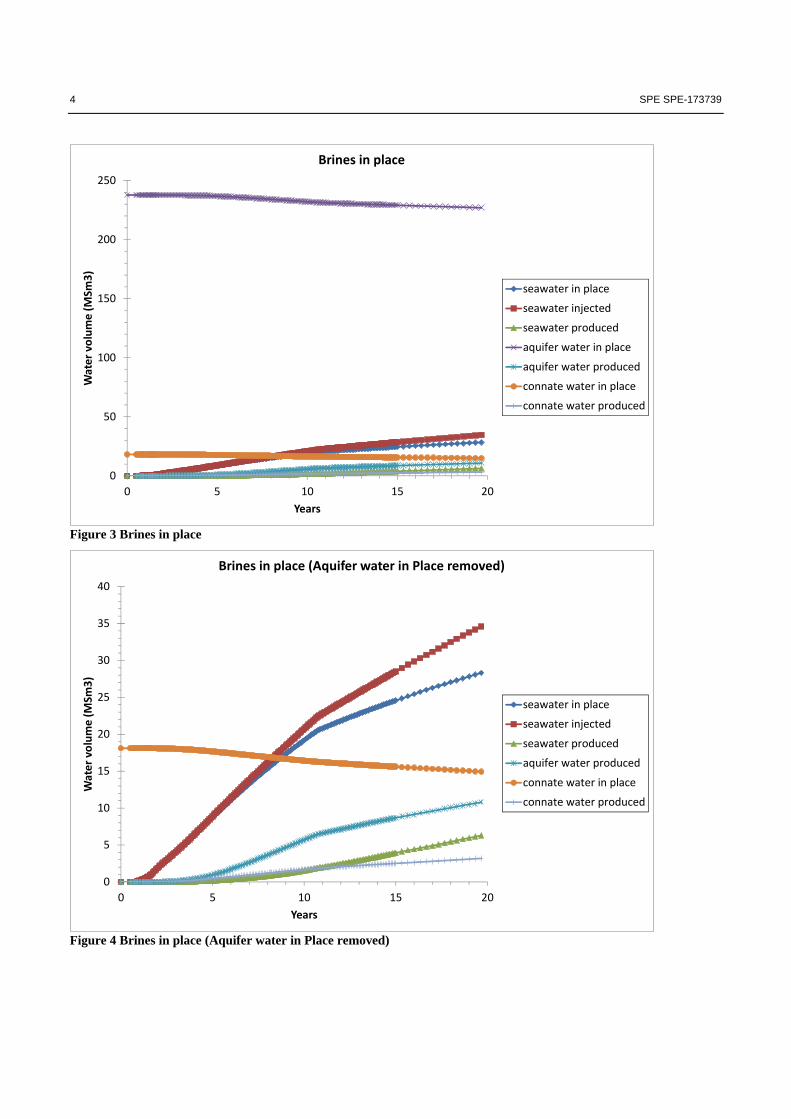
Profiles of water injected and produced indicate that there will be insufficient produced water to provide for the required injection rate, and therefore another source of injection water will also be required. Brines in place plot (Figure 3) shows that the field has around 240 MSm3 of aquifer water and 18 MSm3 of connate water in place at the start. An additional 35 MSm3 will be injected according to the development plan (Figure 4). Significant water production will only take place after 5 years of production. The volume of water produced by the end of field life will exceed the volume of oil produced by around 2 times (10 MSm3 of oil vs 20 MSm3 of water on Figure 2). The vast majority of water in place at all times will be aquifer water (Figure 3) and only around 5 MSm3 out of 35 MSm3 injected seawater is produced back. The majority of water produced is aquifer water - 10 MSm3, with production of 5 MSm3 of seawater and only 2.5 MSm3 of connate water (Figure 4).
0
5
10
15
20
25
30
35
40
45
0 5 10 15 20
Cumulative liquid volume (M
Sm3)
Years
Fluids in place (Gas in Place and Water in Place removed)
oil in place
oil produced
water injected
water produced
4 SPE SPE-173739
Figure 3 Brines in place
Figure 4 Brines in place (Aquifer water in Place removed)
0
50
100
150
200
250
0 5 10 15 20
Water volume (MSm
3)
Years
Brines in place
seawater in place
seawater injected
seawater produced
aquifer water in place
aquifer water produced
connate water in place
connate water produced
0
5
10
15
20
25
30
35
40
0 5 10 15 20
Water volume (MSm
3)
Years
Brines in place (Aquifer water in Place removed)
seawater in place
seawater injected
seawater produced
aquifer water produced
connate water in place
connate water produced
SPE SPE-173739 5
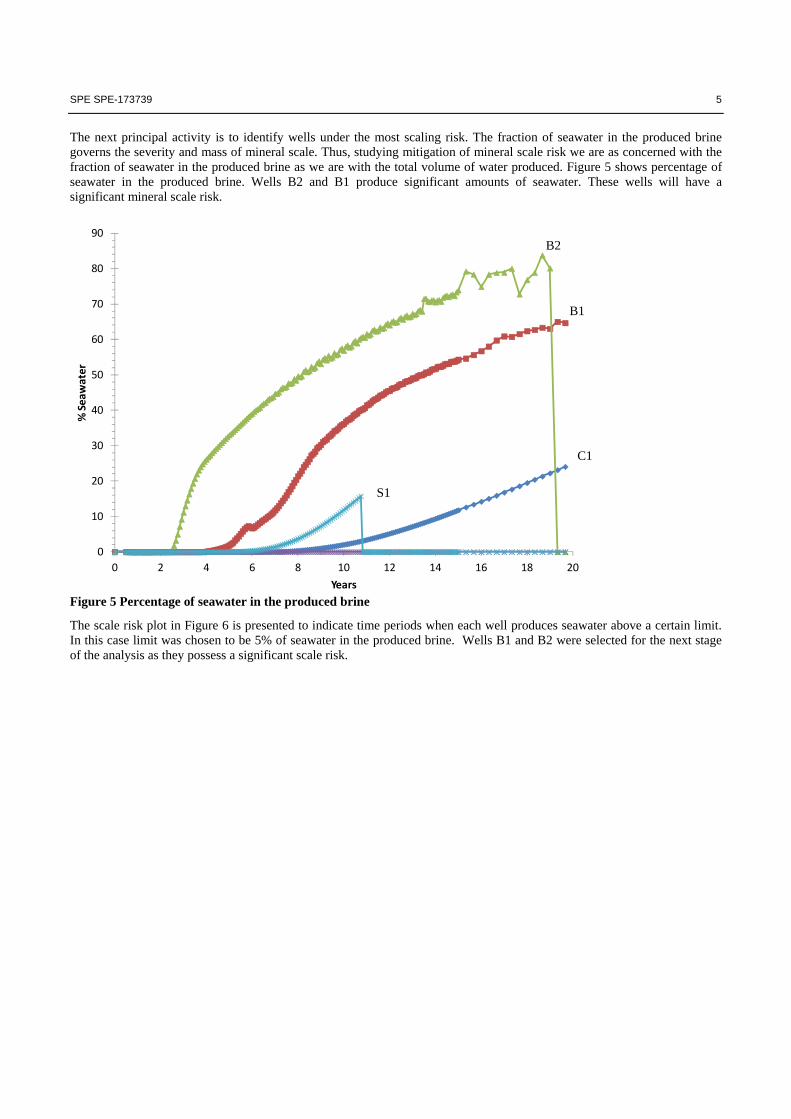
The next principal activity is to identify wells under the most scaling risk. The fraction of seawater in the produced brine governs the severity and mass of mineral scale. Thus, studying mitigation of mineral scale risk we are as concerned with the fraction of seawater in the produced brine as we are with the total volume of water produced. Figure 5 shows percentage of seawater in the produced brine. Wells B2 and B1 produce significant amounts of seawater. These wells will have a significant mineral scale risk.
Figure 5 Percentage of seawater in the produced brine
The scale risk plot in Figure 6 is presented to indicate time periods when each well produces seawater above a certain limit. In this case limit was chosen to be 5% of seawater in the produced brine. Wells B1 and B2 were selected for the next stage of the analysis as they possess a significant scale risk.
0
10
20
30
40
50
60
70
80
90
0 2 4 6 8 10 12 14 16 18 20
% Seawater
Years
B2
B1
C1
S1

6 SPE SPE-173739
Figure 6 Scaling risk
B1 is the biggest producer with 5.5 SMm3 of total oil produced (Figure 7), the second largest oil producer is C1 with 3 SMm3 of total oil produced.
Figure 7 Well total oil production
Well B1 being the biggest oil producer does not mean that it produces the largest volumes of water; in fact it is the third water producer with 4 SMm3 (Figure 8).
0
1
2
3
4
5
6
0 2 4 6 8 10 12 14 16 18 20
Well index
Years
0
1
2
3
4
5
6
0 2 4 6 8 10 12 14 16 18 20
total oil production (MSm
3)
Years
Total oil production
B1
B2
C1
S1
B1
C1
B2
SPE SPE-173739 7
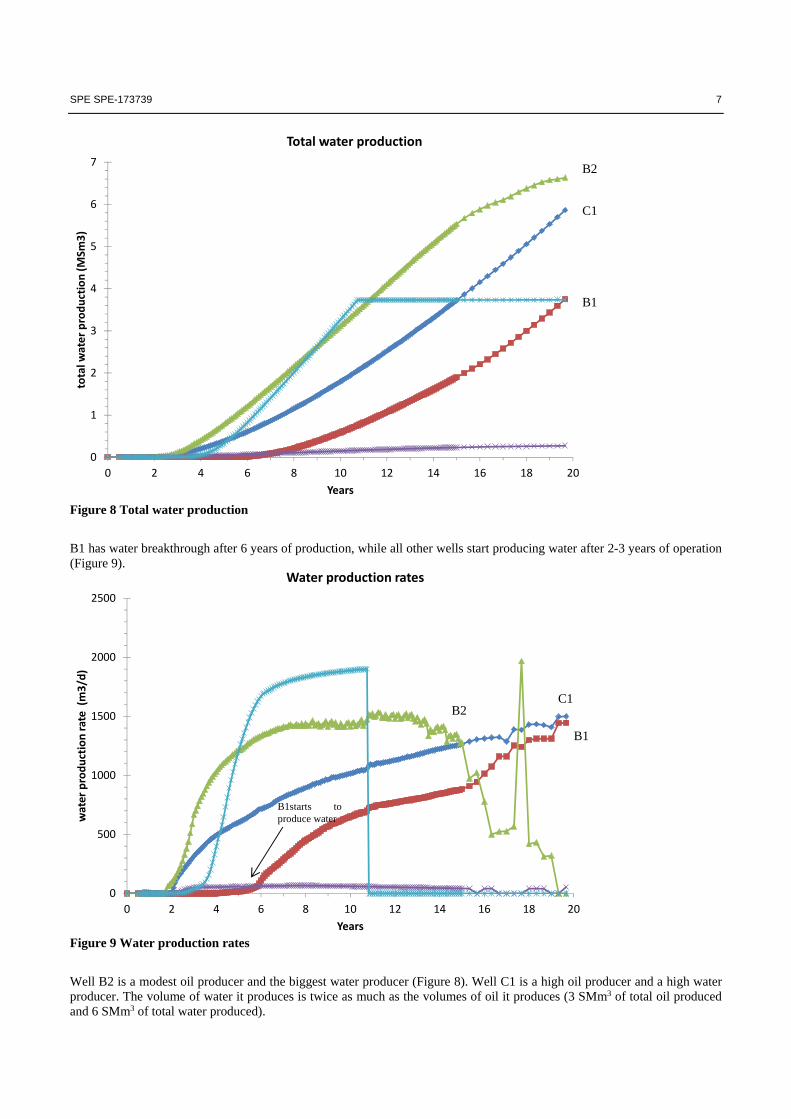
Figure 8 Total water production
B1 has water breakthrough after 6 years of production, while all other wells start producing water after 2-3 years of operation (Figure 9).
Figure 9 Water production rates
Well B2 is a modest oil producer and the biggest water producer (Figure 8). Well C1 is a high oil producer and a high water producer. The volume of water it produces is twice as much as the volumes of oil it produces (3 SMm3 of total oil produced and 6 SMm3 of total water produced).
0
1
2
3
4
5
6
7
0 2 4 6 8 10 12 14 16 18 20
total w
ater production (MSm
3)
Years
Total water production
0
500
1000
1500
2000
2500
0 2 4 6 8 10 12 14 16 18 20
water production rate (m3/d)
Years
Water production rates
B2
C1
B1
B1
B1starts to produce water
B2 C1
8 SPE SPE-173739
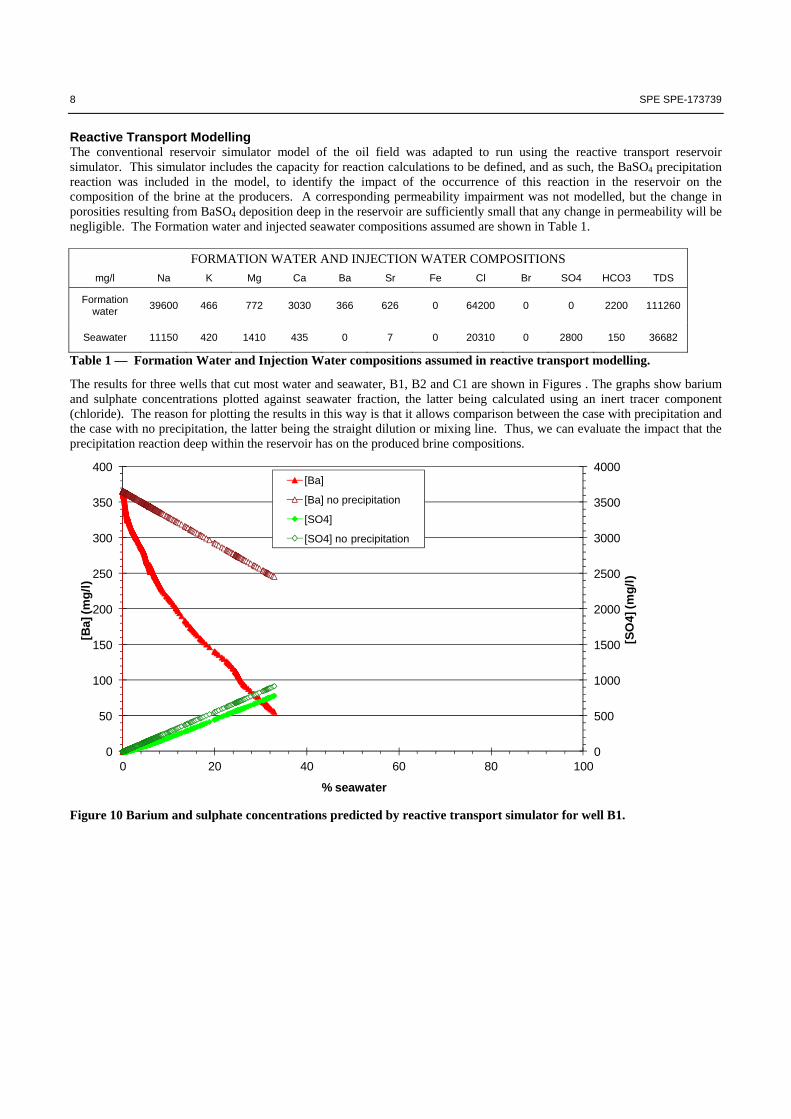
Reactive Transport Modelling The conventional reservoir simulator model of the oil field was adapted to run using the reactive transport reservoir simulator. This simulator includes the capacity for reaction calculations to be defined, and as such, the BaSO4 precipitation reaction was included in the model, to identify the impact of the occurrence of this reaction in the reservoir on the composition of the brine at the producers. A corresponding permeability impairment was not modelled, but the change in porosities resulting from BaSO4 deposition deep in the reservoir are sufficiently small that any change in permeability will be negligible. The Formation water and injected seawater compositions assumed are shown in Table 1.
FORMATION WATER AND INJECTION WATER COMPOSITIONS
mg/l Na K Mg Ca Ba Sr Fe Cl Br SO4 HCO3 TDS
Formation water
39600 466 772 3030 366 626 0 64200 0 0 2200 111260
Seawater 11150 420 1410 435 0 7 0 20310 0 2800 150 36682
Table 1 — Formation Water and Injection Water compositions assumed in reactive transport modelling.
The results for three wells that cut most water and seawater, B1, B2 and C1 are shown in Figures . The graphs show barium and sulphate concentrations plotted against seawater fraction, the latter being calculated using an inert tracer component (chloride). The reason for plotting the results in this way is that it allows comparison between the case with precipitation and the case with no precipitation, the latter being the straight dilution or mixing line. Thus, we can evaluate the impact that the precipitation reaction deep within the reservoir has on the produced brine compositions.
Figure 10 Barium and sulphate concentrations predicted by reactive transport simulator for well B1.
0
500
1000
1500
2000
2500
3000
3500
4000
0
50
100
150
200
250
300
350
400
0 20 40 60 80 100
[SO
4] (m
g/l
)
[Ba]
(mg
/l)
% seawater
[Ba]
[Ba] no precipitation
[SO4]
[SO4] no precipitation
SPE SPE-173739 9
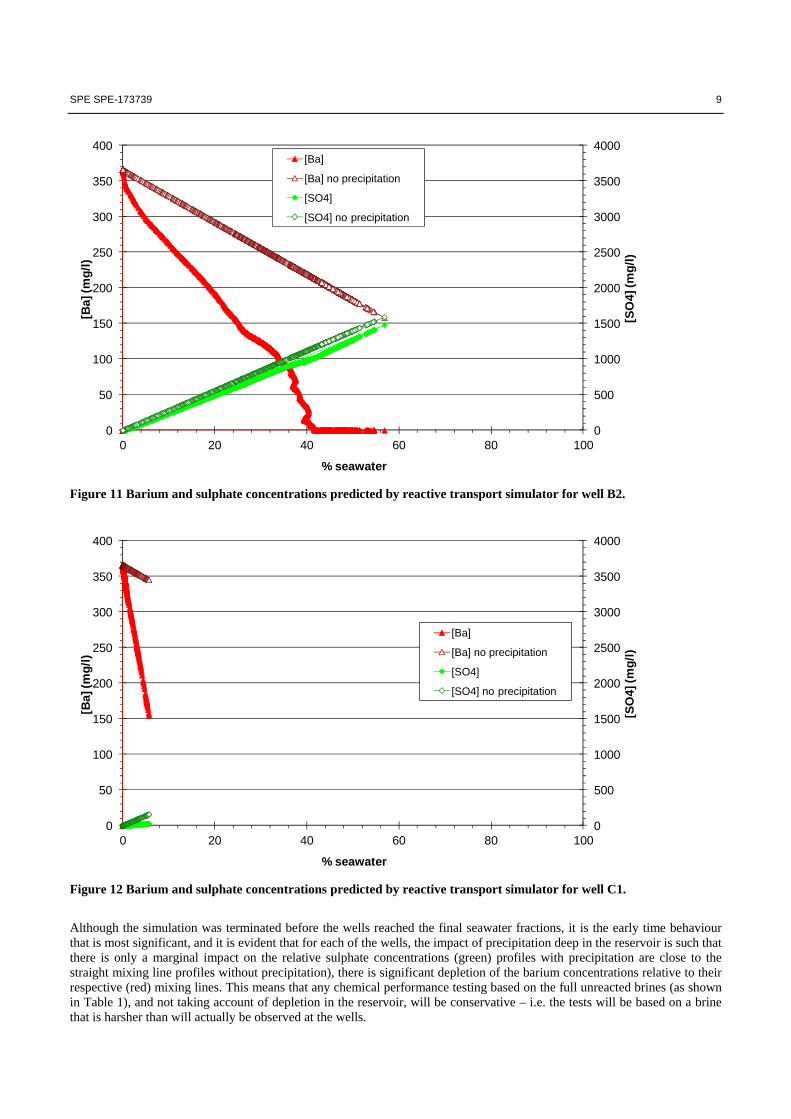
Figure 11 Barium and sulphate concentrations predicted by reactive transport simulator for well B2.
Figure 12 Barium and sulphate concentrations predicted by reactive transport simulator for well C1.
Although the simulation was terminated before the wells reached the final seawater fractions, it is the early time behaviour that is most significant, and it is evident that for each of the wells, the impact of precipitation deep in the reservoir is such that there is only a marginal impact on the relative sulphate concentrations (green) profiles with precipitation are close to the straight mixing line profiles without precipitation), there is significant depletion of the barium concentrations relative to their respective (red) mixing lines. This means that any chemical performance testing based on the full unreacted brines (as shown in Table 1), and not taking account of depletion in the reservoir, will be conservative – i.e. the tests will be based on a brine that is harsher than will actually be observed at the wells.
0
500
1000
1500
2000
2500
3000
3500
4000
0
50
100
150
200
250
300
350
400
0 20 40 60 80 100
[SO
4] (m
g/l
)
[Ba]
(mg
/l)
% seawater
[Ba]
[Ba] no precipitation
[SO4]
[SO4] no precipitation
0
500
1000
1500
2000
2500
3000
3500
4000
0
50
100
150
200
250
300
350
400
0 20 40 60 80 100
[SO
4] (m
g/l
)
[Ba]
(mg
/l)
% seawater
[Ba]
[Ba] no precipitation
[SO4]
[SO4] no precipitation

10 SPE SPE-173739
Well results The reservoir simulation model of the field was adapted and analysed to study the progression of the mixing zone towards the production wells in question, with a view to identifying what sections of the wells faced a scaling risk, and when the risk is the greatest. This field is heavily supported by aquifer water and includes five production wells. The volume in the aquifer may restrict total breakthrough of seawater. However, individual well B1 and B2 produce high fractions of seawater (60% and 80% respectively). Well B2 is chosen to be presented in this paper as it is the biggest water producer, and well B1 as it is a multi-lateral well. For each of the selected wells a scale inhibitor squeeze placement calculation was performed using the reservoir model in to order to investigate injection profiles. No adsorption of scale inhibitor was modelled at this stage. Results per well are presented in this section of the paper.
Well B2
Well B2 produces over 1SMm3 of oil and over 6.5SMm3 of water over 19 years, with water breakthrough after 0.5 years from start or approximately in the 2nd year of field production (Figure 7, Figure 8). This well is the greatest water producer. Water rises to 1400 m3/d, level for 10 years and declines after a further 4 years (Figure 9). B2 is the first well to experience seawater breakthrough. The seawater fraction reaches 85% (Figure 5). Seawater first breaks through at the heel of the well, not the toe (Figure 13). A bullhead squeeze at 5 bpm in year 2 would be adequate to ensure good placement in the heel and midsection of the well, but the toe is unprotected (Figure 14). The toe region likely has a higher pressure than the heel, which is supported by the fact of cross-flow during the shut-in period (red lines in Figure 14). The later squeeze treatment in year 4 (2 years after the first one) shows seawater in the toe section with poor squeeze placement, and at this time 7 bpm is required to overcome cross-flow (Figure 15).
Figure 13 Seawater connection flows B2
Time
SW fraction
Toe
Heel

SPE SPE-173739 11
Figure 14 Well B2 connection flows for squeeze treatment at 1 Nov 2017
Figure 15 Well B2 connection flows for squeeze treatment at 1 Nov 2019 (2 years after the first one)
Well B1 Well B1 is a multi-lateral well. Overall well B1 produces over 5.5 SMm3 of oil and around 4 SMm3 of water over 19 years, with water breakthrough after 5 years from the start of operation or approximately in the 5th year of field production (Figure 7, Figure 8). This well is the largest oil producer and is a medium water producer. Water gradually rises to 1300 m3/d (Figure
0
10
20
30
40
50
60
70
80
90
100
‐400
‐300
‐200
‐100
0
100
200
300
0 500 1000
Seaw
ater fraction, %
flow rate (SM
3/day) ‐ve injection +ve production
Completion length, m
shut‐in
3 bpm
5 bpm
7 bpm
shut‐in
Qwat before SQZ
Qwat after SQZ
Qwat after 1y
Qoil before SQZ
Qoil after 1y
Seawater % before SQZ
Seawater % after 1y
0
10
20
30
40
50
60
70
80
90
100
‐400
‐300
‐200
‐100
0
100
200
300
0 500 1000
Seaw
ater fraction, %
flow rate (SM
3/day) ‐ve injection +ve production
Completion length, m
shut‐in
3 bpm
5 bpm
7 bpm
shut‐in *
Qwat before SQZ
Qwat after SQZ
Qwat after 1y
Qoil before SQZ
Qoil after 1y
Seawater % before SQZ
Seawater % after 1y
12 SPE SPE-173739
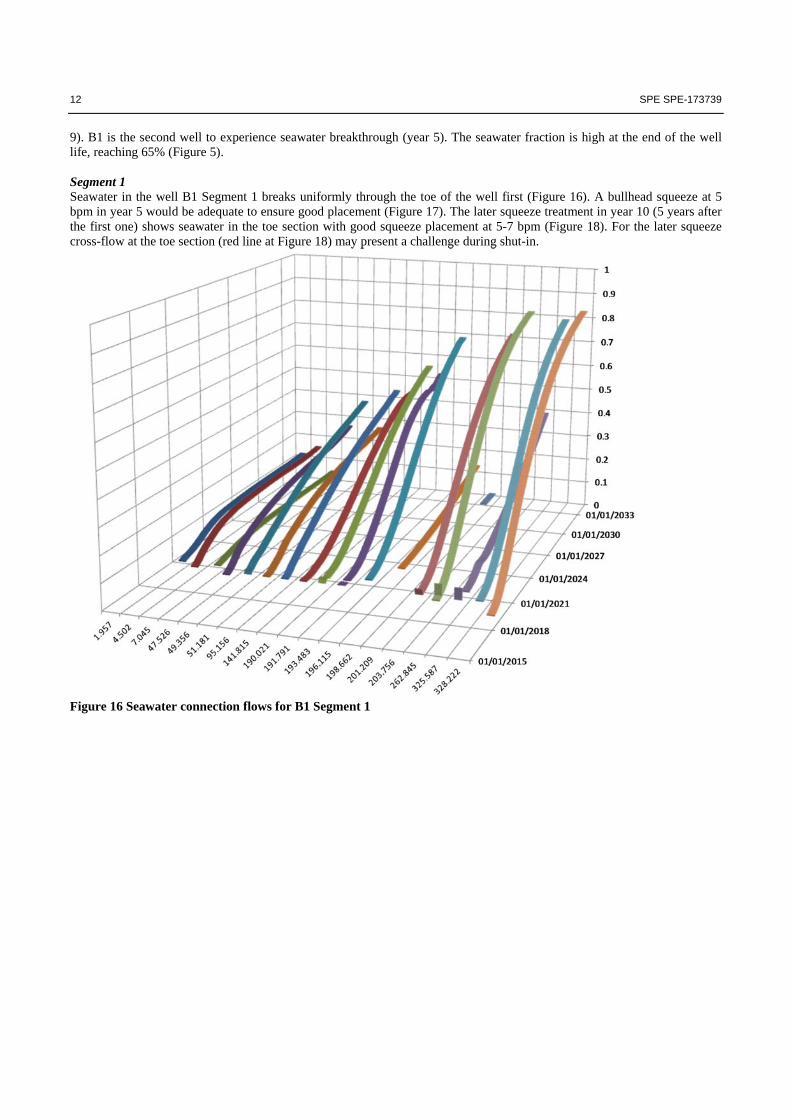
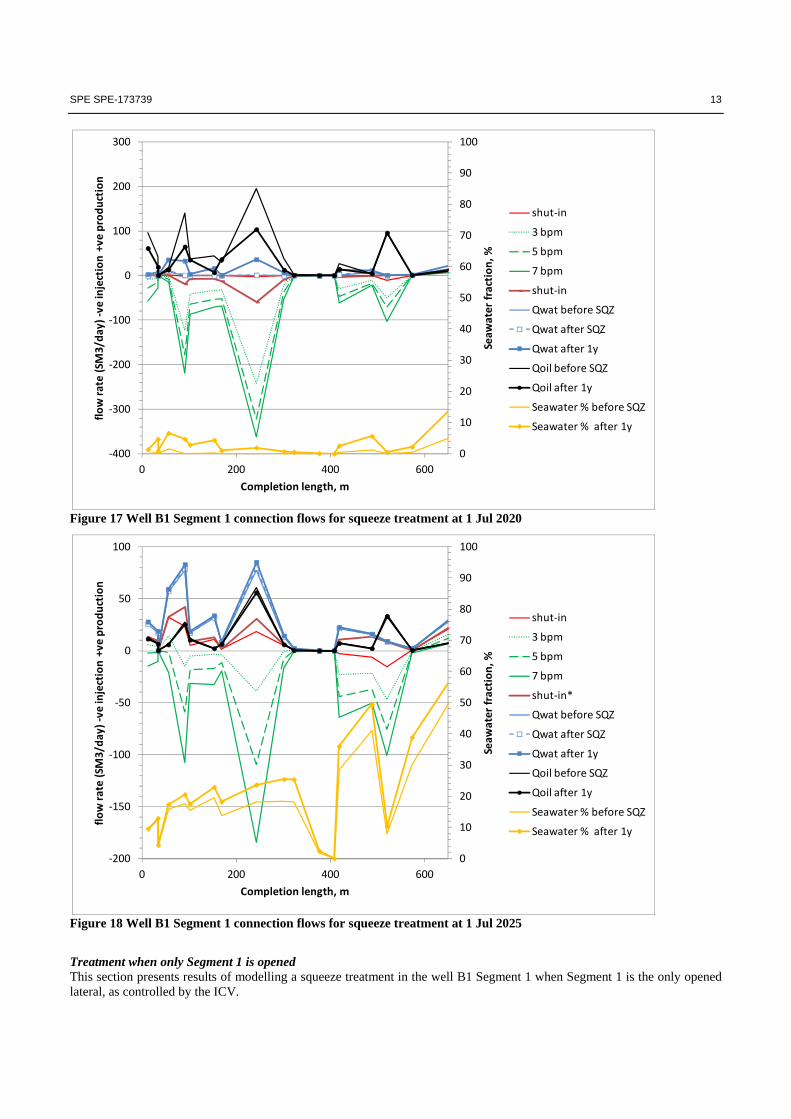
9). B1 is the second well to experience seawater breakthrough (year 5). The seawater fraction is high at the end of the well life, reaching 65% (Figure 5). Segment 1 Seawater in the well B1 Segment 1 breaks uniformly through the toe of the well first (Figure 16). A bullhead squeeze at 5 bpm in year 5 would be adequate to ensure good placement (Figure 17). The later squeeze treatment in year 10 (5 years after the first one) shows seawater in the toe section with good squeeze placement at 5-7 bpm (Figure 18). For the later squeeze cross-flow at the toe section (red line at Figure 18) may present a challenge during shut-in.
Figure 16 Seawater connection flows for B1 Segment 1
SPE SPE-173739 13
Figure 17 Well B1 Segment 1 connection flows for squeeze treatment at 1 Jul 2020
Figure 18 Well B1 Segment 1 connection flows for squeeze treatment at 1 Jul 2025
Treatment when only Segment 1 is opened This section presents results of modelling a squeeze treatment in the well B1 Segment 1 when Segment 1 is the only opened lateral, as controlled by the ICV.
0
10
20
30
40
50
60
70
80
90
100
‐400
‐300
‐200
‐100
0
100
200
300
0 200 400 600
Seaw
ater fraction, %
flow rate (SM
3/day) ‐ve injection +ve production
Completion length, m
shut‐in
3 bpm
5 bpm
7 bpm
shut‐in
Qwat before SQZ
Qwat after SQZ
Qwat after 1y
Qoil before SQZ
Qoil after 1y
Seawater % before SQZ
Seawater % after 1y
0
10
20
30
40
50
60
70
80
90
100
‐200
‐150
‐100
‐50
0
50
100
0 200 400 600
Seaw
ater fraction, %
flow rate (SM
3/day) ‐ve injection +ve production
Completion length, m
shut‐in
3 bpm
5 bpm
7 bpm
shut‐in*
Qwat before SQZ
Qwat after SQZ
Qwat after 1y
Qoil before SQZ
Qoil after 1y
Seawater % before SQZ
Seawater % after 1y
14 SPE SPE-173739
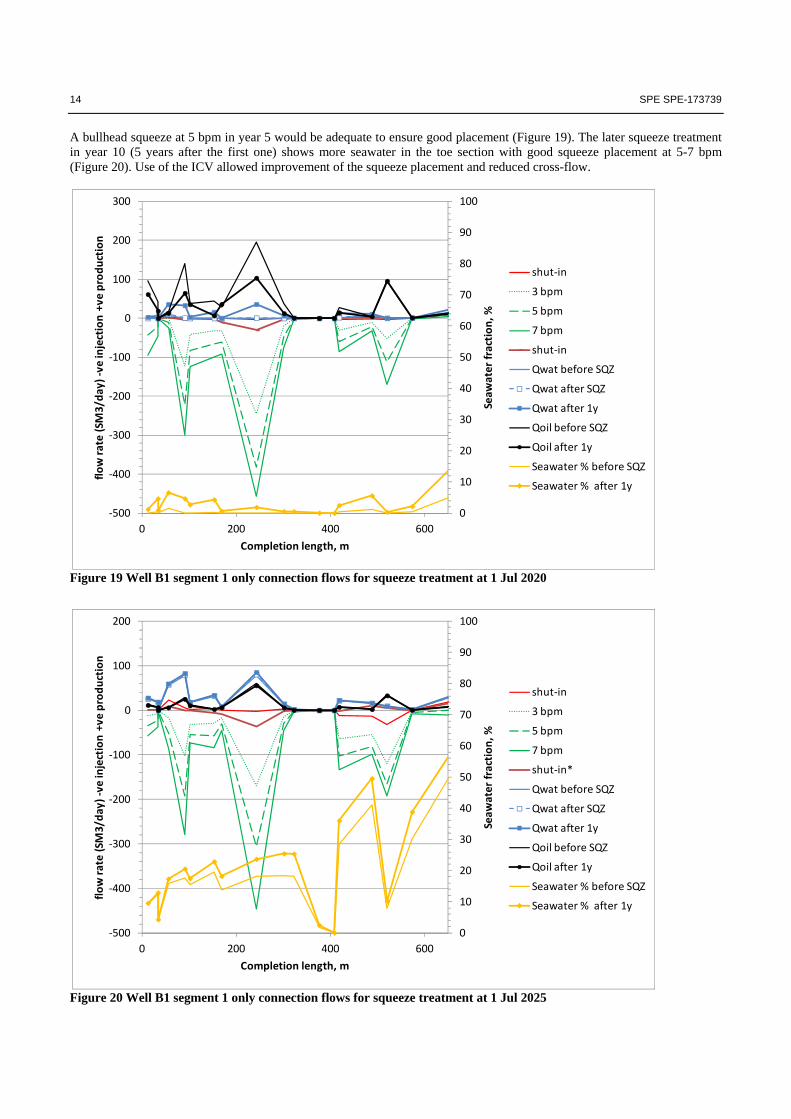
A bullhead squeeze at 5 bpm in year 5 would be adequate to ensure good placement (Figure 19). The later squeeze treatment in year 10 (5 years after the first one) shows more seawater in the toe section with good squeeze placement at 5-7 bpm (Figure 20). Use of the ICV allowed improvement of the squeeze placement and reduced cross-flow.
Figure 19 Well B1 segment 1 only connection flows for squeeze treatment at 1 Jul 2020
Figure 20 Well B1 segment 1 only connection flows for squeeze treatment at 1 Jul 2025
0
10
20
30
40
50
60
70
80
90
100
‐500
‐400
‐300
‐200
‐100
0
100
200
300
0 200 400 600
Seaw
ater fraction, %
flow rate (SM
3/day) ‐ve injection +ve production
Completion length, m
shut‐in
3 bpm
5 bpm
7 bpm
shut‐in
Qwat before SQZ
Qwat after SQZ
Qwat after 1y
Qoil before SQZ
Qoil after 1y
Seawater % before SQZ
Seawater % after 1y
0
10
20
30
40
50
60
70
80
90
100
‐500
‐400
‐300
‐200
‐100
0
100
200
0 200 400 600
Seawater fraction, %
flow rate (SM3/day) ‐ve injection +ve production
Completion length, m
shut‐in
3 bpm
5 bpm
7 bpm
shut‐in*
Qwat before SQZ
Qwat after SQZ
Qwat after 1y
Qoil before SQZ
Qoil after 1y
Seawater % before SQZ
Seawater % after 1y
SPE SPE-173739 15
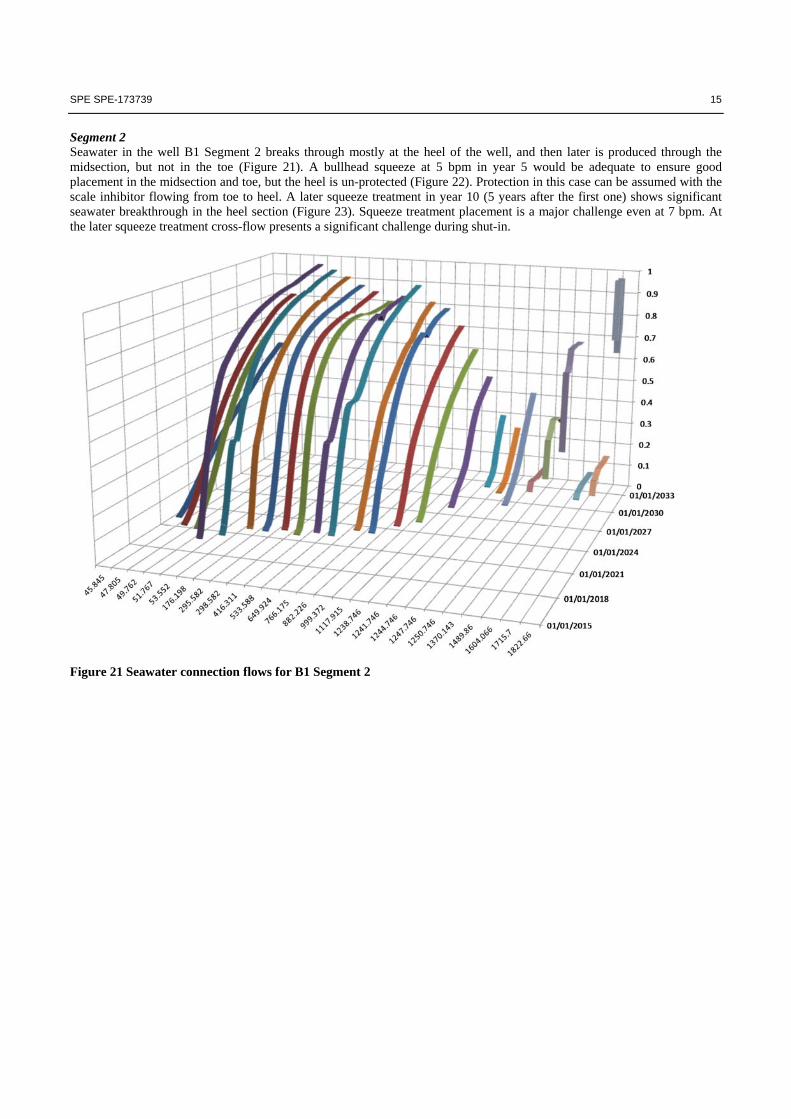
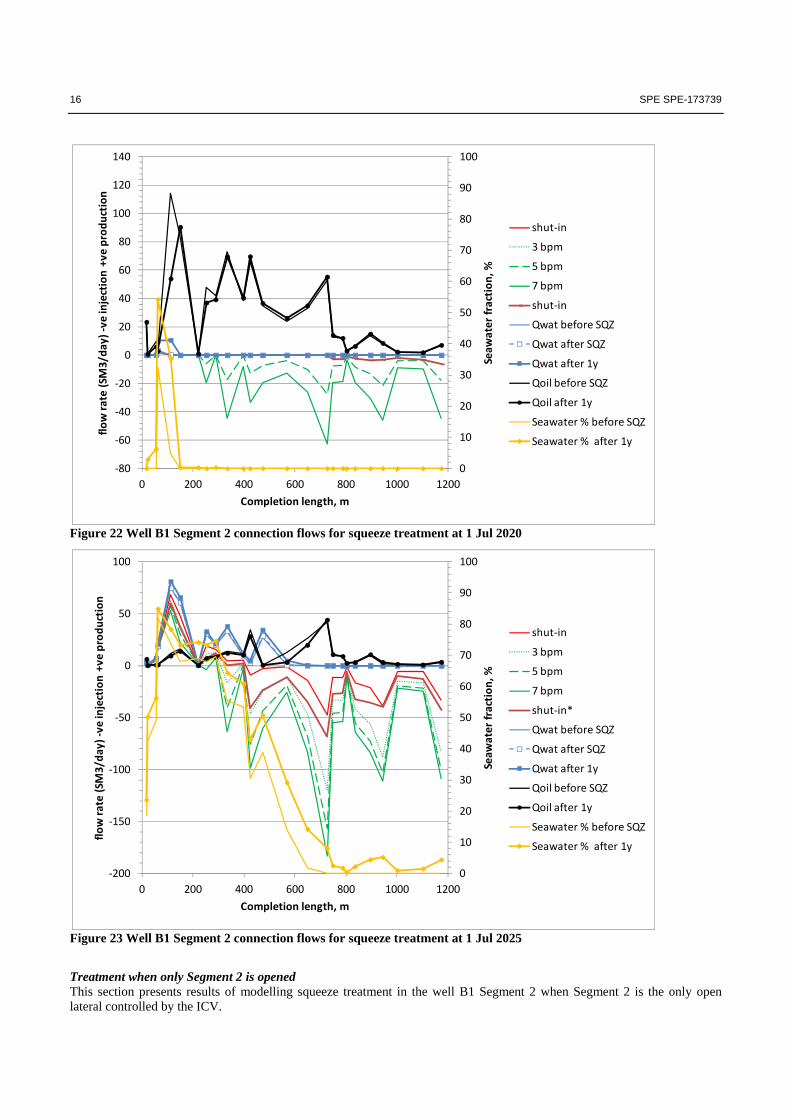
Segment 2 Seawater in the well B1 Segment 2 breaks through mostly at the heel of the well, and then later is produced through the midsection, but not in the toe (Figure 21). A bullhead squeeze at 5 bpm in year 5 would be adequate to ensure good placement in the midsection and toe, but the heel is un-protected (Figure 22). Protection in this case can be assumed with the scale inhibitor flowing from toe to heel. A later squeeze treatment in year 10 (5 years after the first one) shows significant seawater breakthrough in the heel section (Figure 23). Squeeze treatment placement is a major challenge even at 7 bpm. At the later squeeze treatment cross-flow presents a significant challenge during shut-in.
Figure 21 Seawater connection flows for B1 Segment 2
16 SPE SPE-173739
Figure 22 Well B1 Segment 2 connection flows for squeeze treatment at 1 Jul 2020
Figure 23 Well B1 Segment 2 connection flows for squeeze treatment at 1 Jul 2025
Treatment when only Segment 2 is opened This section presents results of modelling squeeze treatment in the well B1 Segment 2 when Segment 2 is the only open lateral controlled by the ICV.
0
10
20
30
40
50
60
70
80
90
100
‐80
‐60
‐40
‐20
0
20
40
60
80
100
120
140
0 200 400 600 800 1000 1200Seaw
ater fraction, %
flow rate (SM
3/day) ‐ve injection +ve production
Completion length, m
shut‐in
3 bpm
5 bpm
7 bpm
shut‐in
Qwat before SQZ
Qwat after SQZ
Qwat after 1y
Qoil before SQZ
Qoil after 1y
Seawater % before SQZ
Seawater % after 1y
0
10
20
30
40
50
60
70
80
90
100
‐200
‐150
‐100
‐50
0
50
100
0 200 400 600 800 1000 1200
Seaw
ater fraction, %
flow rate (SM
3/day) ‐ve injection +ve production
Completion length, m
shut‐in
3 bpm
5 bpm
7 bpm
shut‐in*
Qwat before SQZ
Qwat after SQZ
Qwat after 1y
Qoil before SQZ
Qoil after 1y
Seawater % before SQZ
Seawater % after 1y
SPE SPE-173739 17
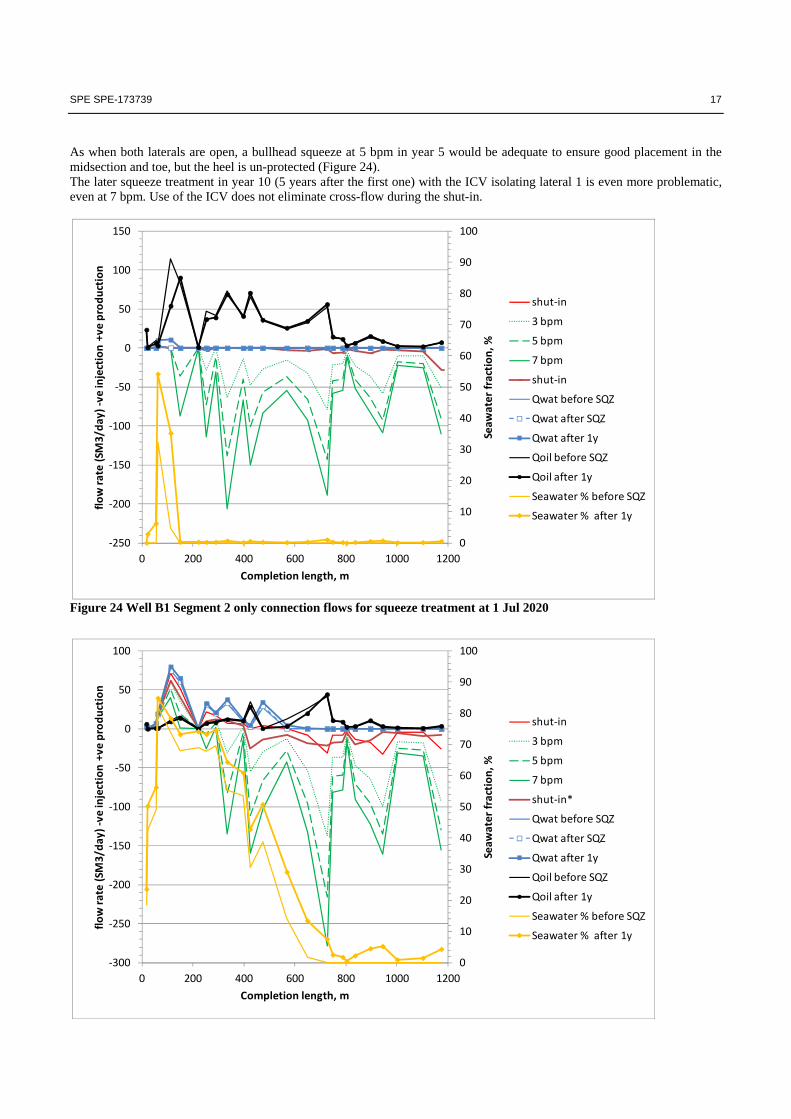
As when both laterals are open, a bullhead squeeze at 5 bpm in year 5 would be adequate to ensure good placement in the midsection and toe, but the heel is un-protected (Figure 24). The later squeeze treatment in year 10 (5 years after the first one) with the ICV isolating lateral 1 is even more problematic, even at 7 bpm. Use of the ICV does not eliminate cross-flow during the shut-in.
Figure 24 Well B1 Segment 2 only connection flows for squeeze treatment at 1 Jul 2020
0
10
20
30
40
50
60
70
80
90
100
‐250
‐200
‐150
‐100
‐50
0
50
100
150
0 200 400 600 800 1000 1200
Seaw
ater fraction, %
flow rate (SM
3/day) ‐ve injection +ve production
Completion length, m
shut‐in
3 bpm
5 bpm
7 bpm
shut‐in
Qwat before SQZ
Qwat after SQZ
Qwat after 1y
Qoil before SQZ
Qoil after 1y
Seawater % before SQZ
Seawater % after 1y
0
10
20
30
40
50
60
70
80
90
100
‐300
‐250
‐200
‐150
‐100
‐50
0
50
100
0 200 400 600 800 1000 1200
Seaw
ater fraction, %
flow rate (SM
3/day) ‐ve injection +ve production
Completion length, m
shut‐in
3 bpm
5 bpm
7 bpm
shut‐in*
Qwat before SQZ
Qwat after SQZ
Qwat after 1y
Qoil before SQZ
Qoil after 1y
Seawater % before SQZ
Seawater % after 1y

18 SPE SPE-173739
Figure 25 Well B1 Segment 2 connection flows for squeeze treatment at 1 Jul 2025
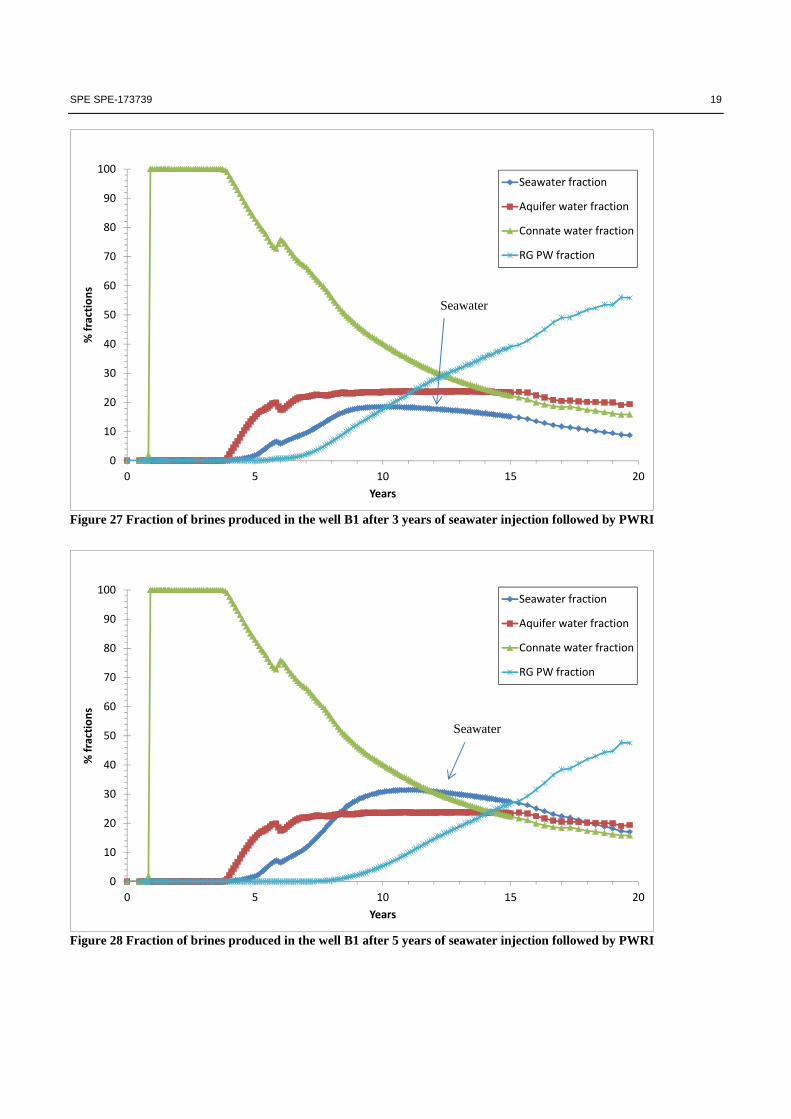
Produced Water Re-Injection (PWRI) This section reports results of the impact of replacing seawater with PWRI. In order to provide enough water volumes for pressure support the field development plan required the model to be run with the injection water being made up using seawater and produced water from another formation. Three scenarios were considered with the following sequence of injection: seawater is injected for either 1 year, 3 years or 5 years before the start-up of PWRI. In the plots of fractions of produced brines (Figure 26 - Figure 31) Produced Water is associated with produced water from another formation. Injection water was made of 100% seawater in all cases. Therefore observations need to be focused on contrast between the breakthrough of Injection water (Seawater) and Produced Water (consisting of 100% water form a neighbor formation).
Figure 26 Fraction of brines produced in the well B1 after 1 year of seawater injection followed by PWRI
0
10
20
30
40
50
60
70
80
90
100
0 5 10 15 20
% fractions
Years
Well RMP1 tracers producedSeawater fraction
Aquifer water fraction
Connate water fraction
RG PW fraction
Seawater
SPE SPE-173739 19
Figure 27 Fraction of brines produced in the well B1 after 3 years of seawater injection followed by PWRI
Figure 28 Fraction of brines produced in the well B1 after 5 years of seawater injection followed by PWRI
0
10
20
30
40
50
60
70
80
90
100
0 5 10 15 20
% fractions
Years
Well RMP1 tracers produced
Seawater fraction
Aquifer water fraction
Connate water fraction
RG PW fraction
0
10
20
30
40
50
60
70
80
90
100
0 5 10 15 20
% fractions
Years
Well RMP1 tracers produced
Seawater fraction
Aquifer water fraction
Connate water fraction
RG PW fraction
Seawater
Seawater
20 SPE SPE-173739
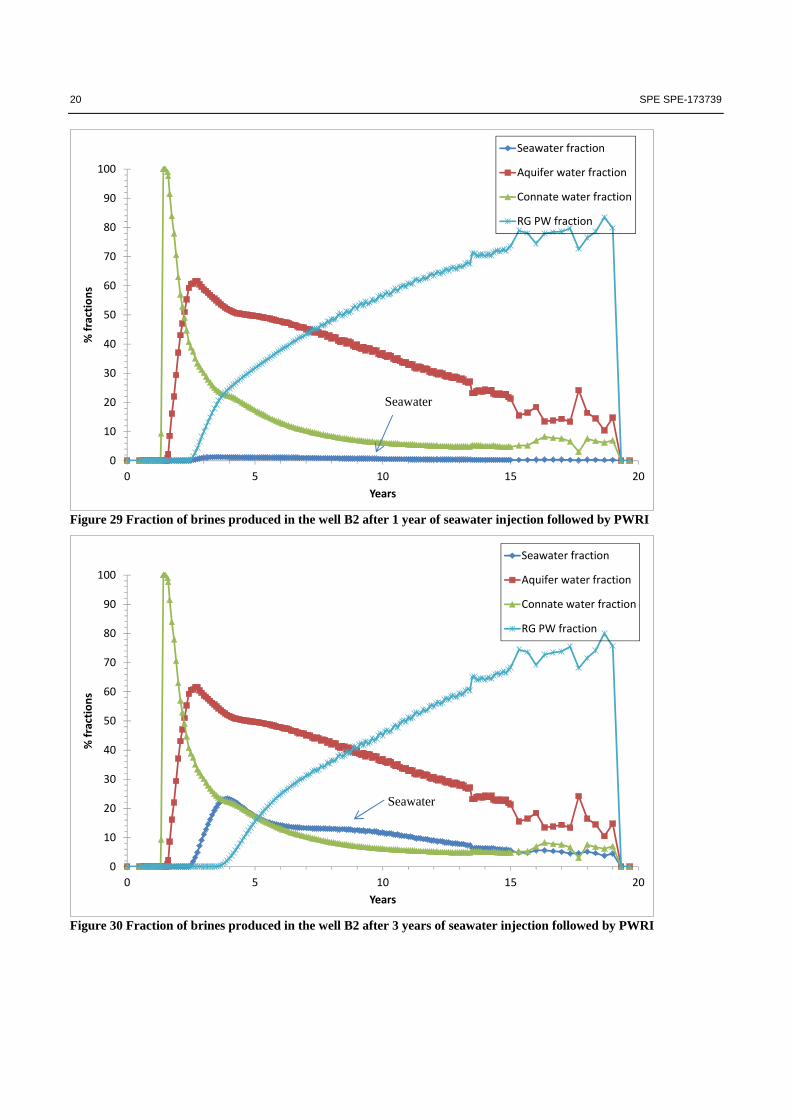
Figure 29 Fraction of brines produced in the well B2 after 1 year of seawater injection followed by PWRI
Figure 30 Fraction of brines produced in the well B2 after 3 years of seawater injection followed by PWRI
0
10
20
30
40
50
60
70
80
90
100
0 5 10 15 20
% fractions
Years
Well RMP2 tracers produced Seawater fraction
Aquifer water fraction
Connate water fraction
RG PW fraction
0
10
20
30
40
50
60
70
80
90
100
0 5 10 15 20
% fractions
Years
Well RMP2 tracers produced Seawater fraction
Aquifer water fraction
Connate water fraction
RG PW fraction
Seawater
Seawater
SPE SPE-173739 21
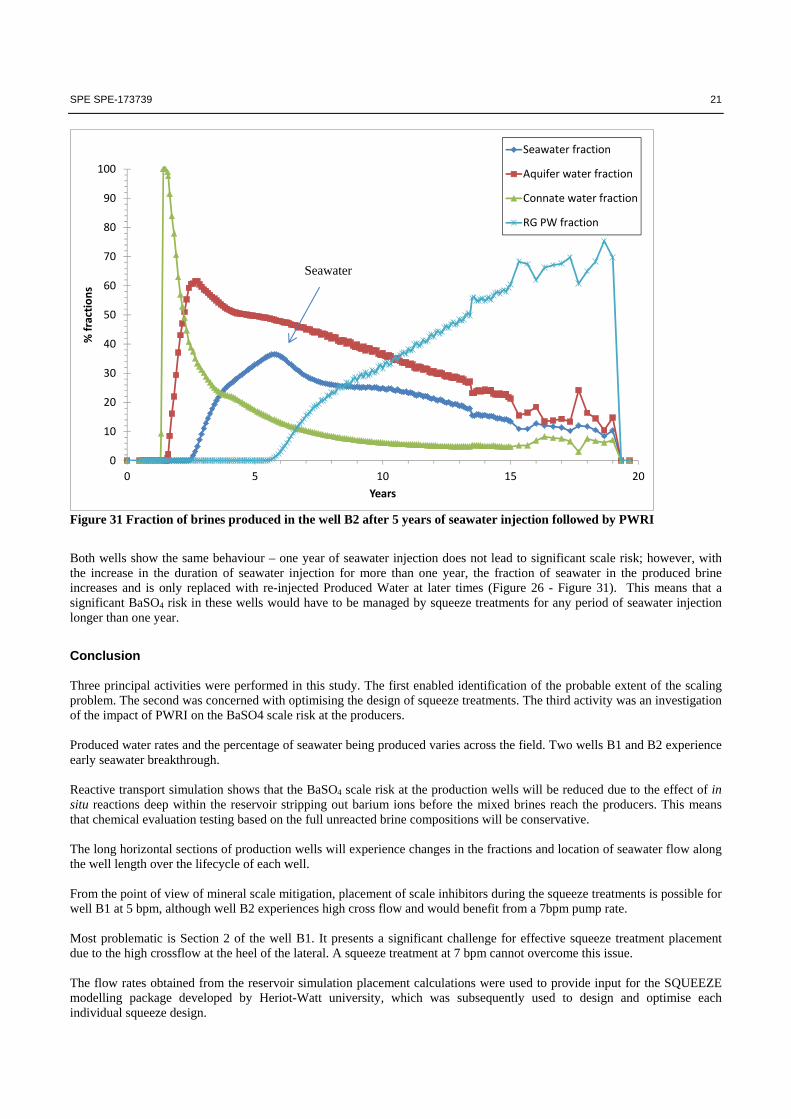
Figure 31 Fraction of brines produced in the well B2 after 5 years of seawater injection followed by PWRI
Both wells show the same behaviour – one year of seawater injection does not lead to significant scale risk; however, with the increase in the duration of seawater injection for more than one year, the fraction of seawater in the produced brine increases and is only replaced with re-injected Produced Water at later times (Figure 26 - Figure 31). This means that a significant BaSO4 risk in these wells would have to be managed by squeeze treatments for any period of seawater injection longer than one year.
Conclusion Three principal activities were performed in this study. The first enabled identification of the probable extent of the scaling problem. The second was concerned with optimising the design of squeeze treatments. The third activity was an investigation of the impact of PWRI on the BaSO4 scale risk at the producers. Produced water rates and the percentage of seawater being produced varies across the field. Two wells B1 and B2 experience early seawater breakthrough. Reactive transport simulation shows that the BaSO4 scale risk at the production wells will be reduced due to the effect of in situ reactions deep within the reservoir stripping out barium ions before the mixed brines reach the producers. This means that chemical evaluation testing based on the full unreacted brine compositions will be conservative. The long horizontal sections of production wells will experience changes in the fractions and location of seawater flow along the well length over the lifecycle of each well. From the point of view of mineral scale mitigation, placement of scale inhibitors during the squeeze treatments is possible for well B1 at 5 bpm, although well B2 experiences high cross flow and would benefit from a 7bpm pump rate. Most problematic is Section 2 of the well B1. It presents a significant challenge for effective squeeze treatment placement due to the high crossflow at the heel of the lateral. A squeeze treatment at 7 bpm cannot overcome this issue. The flow rates obtained from the reservoir simulation placement calculations were used to provide input for the SQUEEZE modelling package developed by Heriot-Watt university, which was subsequently used to design and optimise each individual squeeze design.
0
10
20
30
40
50
60
70
80
90
100
0 5 10 15 20
% fractions
Years
Well RMP2 tracers produced Seawater fraction
Aquifer water fraction
Connate water fraction
RG PW fraction
Seawater
22 SPE SPE-173739
References 1 Mackay, E.J. and Sorbie, K.S.: “Brine Mixing in Waterflooded Reservoirs and the Implications for Scale Prevention” paper SPE
60193 presented at the SPE 2nd International Symposium on Oilfield Scale, Aberdeen, Scotland, 26-27 January 2000. 2 Sorbie, K.S. and Mackay, E.J.: “Mixing of Injected, Connate and Aquifer Brines in Waterflooding and its Relevance to Oilfield
Scaling” Journal of Petroleum Science and Engineering (July 2000) 27 (1-2) 85-106. 3 Oddo, J.E. and Tomson, M.T.: “Why Scale Forms in the Oil Field and Methods to Prevent It,” SPE Production and Facilities (Feb.
1994) 47-54. 4 Ramstad, K., Tydal, T., Ellersten, E. and Jakobsen, T.: “Precipitation and Deposition of CaCO3. Laboratory Studies and Field
Experience,” presented at the 1999 NIF Tenth International Oil Field Chemicals Symposium, Fagernes, Norway, Mar. 1-3. 5 Vetter, O.J., Kandarpa, V. and Harouaka, A.: “Prediction of Scale Problems due to Injection of Incompatible Waters,” JPT (Feb.
1982) 273-284. 6 Jacques, D.F. and Bourland, B.I.: “A Study of Solubility of Strontium Sulfate,” SPEJ (Apr. 1983) 292-300. 7 Vetter, O.J., Kandarpa, and Phillips, R.C.: “Prediction of Deposition of Calcium Sulfate Scale Under Down-Hole Conditions,” JPT
(Oct. 1970) 273-2841299-1308. 8 White, R., Brookley, J. and Menzies, N.: “Practical Experiences of Gel Diversion Technique and an Overview of Scale Management
for the Alba Field”, SPE Symposium on Oilfield Scale: Field Applications and Novel Solutions, Aberdeen, Scotland, 27 - 28 January 1999.
9 Mackay, E.J., Collins, I.R., Jordan, M.M. and Feasey, N.: “PWRI: Scale Formation Risk Assessment and Management” paper SPE 80385, presented at the SPE 5th International Symposium on Oilfield Scale, Aberdeen, Scotland, 29-30 January 2003.
10 Bertero, L, Chierici, G L, Gottardi, G, Mesini, E. and Mormino, G: “Chemical Equilibrium Models: Their Use in Simulation the Injection of Incompatible Waters”, SPE Reservoir Engineering, (February 1988) 288-294.
11 Paulo, J. and Mackay, E.J.: “Modelling of In-Situ Scale Deposition” presented at the 12th International Oil Field Chemical Symposium, Geilo, Norway, 1-4 April 2001.
12 Mackay, E.J.: “Predicting In-Situ Sulphate Scale Deposition and the Impact on Produced Ion Concentrations”, Trans IChemE (March 2003) 81 (A) 326-332.
13 Hinrichsen, C.J.: “Preventing Scale Deposition in Oil Production Facilities: An Industry Review” paper N°61 presented at NACE Corrosion 98, Houston, Texas, 1998.
14 Clemmit, A.F., Hunton, A.G., and Riley, B.: “The Dissolution of Scales in Oilfield Systems,” paper SPE 14010 presented at the 1985 Offshore Europe Conference, Aberdeen, Scotland, Sep. 10-13.
15 Mendoza, A., Graham, G. M. and Sorbie, K.S.: “Sulphate Scale Dissolution: Examination of the Factors Controlling the Effectiveness of EDTA and DTPA based on Scale Dissolvers and their Comparative Effectiveness against Different Sulphate Minerals” presented at the 10th NIF International Oil Field Chemical Symposium, Fagernes, Norway, 28 February - 3 March 1999.
16 Tanner, R.N. and Wittingham, K.P.: “Scale Control During Waterflooding Operations: A Field Appraisal of Inhibitor Requirements and Performance”, SPE 14127, 1986 SPE International Meeting on Petroleum Engineering held in Beijing, China March 17-20.
17 Børeng, R., Sorbie, K.S. and Yuan, M.D.: “The Underlying Theory and Modelling of Scale Inhibitor Squeezes in Three Offshore Wells on the Norwegian Continental Shelf,” presented at the 1994 NIF International Oil Field Chemicals Symposium, Geilo, Norway, Mar. 20-23.
18 Collins, I.R., Stewart, N.J., Wade, S.R., Goodwin, S.G., Hewartson, J.A., Deignan, S.D.: “Extending Scale Squeeze Lifetimes Using a Chemical Additive: From the Laboratory to the Field”, presented at the 1997 Solving Oilfield Scaling Conference, 23-24 January.
19 Bourne, H.M, Booth, S.L. and Brunger, A.: “Combining Innovative Technologies To Maximize Scale Squeeze Cost Reduction”, SPE 50718, presented at SPE International Symposium on Oilfield Chemistry, Houston, 16-19 February 1999.
20 Jordan, M.M., Sjuraether, K., Collins, I.R., Feasey, N.D. and Emmons, D.: “Life Cycle Management of Scale Control within Subsea Fields and its Impact on Flow Assurance, Gulf of Mexico and the North Sea Basin” paper SPE 71557 presented at the SPE Annual Technical Conference and Exhibition, New Orleans, Louisiana, 30 September - 3 October 2001.
21 Hardy, J A, and Simm, I, “Low Sulfate Seawater Mitigates Barite Scale”, Oil and Gas Journal, December 2, 1996. 22 Davis, R., Lomax, I. and Plummer, M.: “Membranes Solve North Sea Waterflood Sulfate Problems” Oil and Gas Journal, 59-64, 25
November 1996. 23 Vu, V.K., Hurtevent, C. and Davis, R.A.: “Eliminating the Need for Scale Inhibition Treatments for Elf Exploration Angola's Girassol
Field” paper SPE 60220 presented at the SPE 3rd International Symposium on Oilfield Scale, Aberdeen, Scotland, 30-31 January 2001.
24 Graham, G.M., Mackay, E.J., Dyer, S.J. and Bourne, H.M.: “The Challenges for Scale Control in Deepwater Production Systems: Chemical Inhibition and Placement” paper No 02316 presented at the Annual Spring Meeting of NACE International, CORROSION/2002, Denver, Colorado, April 7-14, 2002.
25 Mackay, E.J., Jordan, M.M. and Torabi, F.: “Predicting Brine Mixing Deep Within the Reservoir, and the Impact on Scale Control in Marginal and Deepwater Developments” paper SPE 85104, SPE Prod. & Facilities (Aug 2003) 18 (3) 210-220.
26 McElhiney, J.E.: “Deepwater Project Economics Demand Sulfate Removal to Ensure Scale-Free Operation”, Offshore (May 2003) 27 Mackay, E.J., Jordan, M.M., Feasey, N., Shah, D., Kumar, P. and Ali, S.: “Integrated Risk Analysis for Scale Management in
Deepwater Developments” paper SPE 87459, SPE Prod. & Facilities (May 2005) 20 (2) 138-154.