resident relocation survey - norc.org relocation survey/wave 4 panel report... · this report...
TRANSCRIPT

The Experiences of Leaseholders Relocating Under the Chicago HousingAuthority's Plan for Transformation:Findings from 2002 to 2009 NORC National Opinion Research Center at the University of Chicago Funded by a grant from: The John D. and Catherine T. MacArthur Foundation
August, 2010
Resident Relocation Survey

Table of Contents
Executive Summary ............................................................................................................................... 3
Introduction ............................................................................................................................................ 5
Section 1. The Leaseholder Panel ............................................................................................... 7
Section 2. Housing and Neighborhood ...................................................................................... 9
Relocating to Permanent Housing ..................................................................................... 10 Building Maintenance, Property Manager, Condition of Housing Unit .............. 11 Amenities Available and Working in the Housing Unit ............................................ 12 Neighborhood Services ........................................................................................................... 13 Neighborhood Problems ........................................................................................................ 14
Section 3. Leaseholder Employment ...................................................................................... 15
All Leaseholders, from Wave 3 (2006) to Wave 4 (2009) ....................................... 16 Phase III Leaseholders, from 2003 (Wave 1) to 2009 (Wave 4) .......................... 21
Section 4. Children in the Household ..................................................................................... 25
Description of the Focal Child Sample ............................................................................. 26 School and Activities ................................................................................................................ 27 Overall Health and Outdoor Play ........................................................................................ 29 Neighborhood Safety ............................................................................................................... 31 Age Differences .......................................................................................................................... 32 Age Differences in Rates of Asthma................................................................................... 32 Age Differences in Outdoor Play and Neighborhood Safety ................................... 33
Section 5. Economic Hardship .................................................................................................. 37
Section 6. Leaseholder Health .................................................................................................. 39
Change across Time ................................................................................................................. 39 Comparisons to National Data ............................................................................................. 41 Comparisons to National Data Changes Over Time ................................................... 42

Page | ii Findings from 2002 to 2009
Section 7. Overall Satisfaction with Relocation .................................................................. 45
Opportunities .............................................................................................................................. 45 Benefits .......................................................................................................................................... 46
Section 8. Baseline Characteristics and Health of Deceased Respondents ............... 49
Deceased Respondents ........................................................................................................... 49 Socio‐Demographic Characteristics of the Deceased ................................................ 50 Health of the Deceased ........................................................................................................... 51
List of Tables Table 1.1. Demographic Characteristics of the Phase II and Phase III Leaseholders ............................. 7 Table 2.1. Percent of Leaseholders Permanently Settled ................................................................................ 10 Table 2.2. Building Maintenance ............................................................................................................................... 11 Table 2.3. Property Manager ....................................................................................................................................... 11 Table 2.4. Condition of Current Unit Compared to Original Unit ................................................................. 12 Table 2.5. Current Neighborhood Compared to Original Neighborhood ................................................. 12 Table 2.6. Amenities Available and Working in Leaseholder’s Unit ........................................................... 13 Table 2.7. Availability of Services in Neighborhood .......................................................................................... 13 Table 2.8. Use of Services in Neighborhood ........................................................................................................ 14 Table 2.9. Neighborhood Problems .......................................................................................................................... 14 Table 3.1. Percent Change from 2006 (W3) to 2009 (W4) in Employment Status .............................. 16 Table 3.2. Proportion of Leaseholders by 2006 (W3) and 2009 (W4) Employment status ............. 17 Table 3.3. 2009 (W4) Leaseholder Employment Status by 2006 (W3) Leaseholder Employment
Status ............................................................................................................................................................... 17 Table 3.4. Reason for not working in 2009 (W4) by 2006 (W3) Employment Status ........................ 20 Table 3.5. Employment Recall .................................................................................................................................... 21 Table 3.6. Employment Status by Interview Year .............................................................................................. 21 Table 3.7. Potentially Exempt Leaseholders by Wave ...................................................................................... 23 Table 4.1. Households with Children Under Age 18 ......................................................................................... 25 Table 4.2. Ages of Focal Children .............................................................................................................................. 26 Table 4.3. Percent Female and Relationship of Focal Children .................................................................... 27 Table 4.4. School Attendance ...................................................................................................................................... 27 Table 4.5. Interactions with Child’s School ........................................................................................................... 28 Table 4.6. Activities ......................................................................................................................................................... 29 Table 4.7. Overall Health and Asthma ..................................................................................................................... 30 Table 4.8. Distribution of Asthma across Waves ................................................................................................ 30 Table 4.9. Outdoor Play ................................................................................................................................................. 31 Table 4.10. Neighborhood Safety ................................................................................................................................. 32

Table 4.11. Percent Distribution by Age Category ................................................................................................ 32 Table 4.12. Age Distribution of Children with Asthma. * ................................................................................... 33 Table 4.13. Outdoor Play by Age Category............................................................................................................... 34 Table 4.14. Neighborhood Safety by Age Category .............................................................................................. 35 Table 5.1. Economic Hardships Experienced ....................................................................................................... 38 Table 5.2. Change in Hardships Reported by Wave........................................................................................... 38 Table 6.1. Percent Reporting Fair or Poor Health at Waves 2 and 4 by Age Category ....................... 40 Table 6.2. Nervous, Tense, or on Edge at Wave 2 and Wave 4 by Age Category ................................... 40 Table 6.3. Sad or Blue at Wave 2 and Wave 4 by Age Category .................................................................... 41 Table 6.4. Fair or Poor Health: National Comparison ....................................................................................... 41 Table 6.5. Nervous, Tense, or on Edge: National Comparison ...................................................................... 42 Table 6.6. Sad or Blue: National Comparison ....................................................................................................... 42 Table 6.7. Sad or Blue: Comparisons of Change over Time ............................................................................ 43 Table 7.1. Life Improvement Opportunity Perception Changes from Wave 3 to Wave 4 ................. 46 Table 7.2. Changes in the Perception of Possibilities to do Beneficial Things from Wave 3 to 4 ... 47 Table 8.1. Number and Percent of Deceased by Phase .................................................................................... 50 Table 8.2. Age Characteristics at Baseline ............................................................................................................. 50 Table 8.3. Demographic Characteristics at Baseline ......................................................................................... 51 Table 8.4. Self‐Reported Health and Frequency of Nervousness and Sadness. ..................................... 51 Table 8.5. Average Number of Health Problems ................................................................................................. 52 Table 8.6. Types of Health Problems ....................................................................................................................... 52
List of Charts Chart 7.1. Do you now feel better, worse, or about the same about opportunities to improve your
life? .................................................................................................................................................................... 45 Chart 7.2. Has relocation made it possible for you to do things to benefit you or your family? ..... 46

Page | 2 Findings from 2002 to 2009

Findings from 2002 to 2009 Page | 3
Executive Summary In 2000, the Chicago Housing Authority (CHA) began the Plan for Transformation, an ambitious plan to rehabilitate or replace substandard high-rise public housing developments in Chicago. During the Plan for Transformation, CHA leaseholders were temporarily relocated to other housing either in the private market or in other public housing units. With support from the John D. and Catherine T. MacArthur Foundation, NORC at the University of Chicago has been conducting the Resident Relocation Survey (RRS). The RRS collects data from current and former CHA leaseholders who relocated from their original CHA units in either 2002 (Phase II) or 2003 (Phase III). This report presents findings from Waves 1 through 4 of data collection. The findings are based on the panel, which consists of 517 leaseholders who participated in all four waves of the survey.
The topics presented in this report include: characteristics of the leaseholders, housing and neighborhood, employment, children in the household, economic hardship, leaseholder health, baseline characteristics of currently deceased respondents, and overall satisfaction with relocation. The questionnaire topics asked of Phase II and Phase III leaseholders varied for Waves 1 and 2 of the survey. In the early data collections for the RRS, the survey focused more on the relocation process (such as working with a relocation counselor, finding an apartment, the moving process). Later data collections shifted toward a focus on the quality of the housing and neighborhoods, household children and other issues related to the impact of relocation on the leaseholders and their families. Thus, some of the findings presented include only Phase III or only the later waves of the survey. For most of the report, only the leaseholders who responded that their permanent choice was subsidized housing are included (n=499). By 2009, more than 90% of leaseholders reported being permanently settled in the housing of their choice.
Across waves, most leaseholders reported favorably on the maintenance of the building and on the quality of their housing unit and neighborhood as compared to where they lived before relocation. Although drug problems in the leaseholders’ neighborhoods decreased across waves, problems with vacant housing increased. Reports of increases in vacant housing may be related to the recent economic downturn.
Among all leaseholders between Waves 3 and 4, employment decreased by 2.2% between 2006 and 2009. Although part-time employment increased during this time, the decrease of full-time employment among leaseholders was almost three times as large. The employment status of leaseholders (full-time, part-time, unemployed or not in the labor market) between 2006 and 2009 was somewhat volatile, with 38% of leaseholders reporting a change in their employment status between 2006 and 2009.
Among Phase III leaseholders, for whom employment information since Wave 1 is available, employment has remained stable over time. However, the composition of unemployment changed, with more leaseholders out of the labor market in 2009 than in previous interview years, and fewer leaseholders looking for work. Long term employment among leaseholders was rare. Only 12% of Phase III leaseholders reported any type of employment in all four interview periods. At the same time, there was a large number (47%) of Phase III leaseholders not reporting employment in any of the four interview periods.
More children in Wave 4 were participating in activities than in Wave 2. Leaseholder reports on the overall health of children are similar across waves. However, there was an increase in the

Page | 4 Findings from 2002 to 2009
percent of children with asthma. In comparing the safety of their current neighborhood to the neighborhood they lived in before relocation, leaseholders showed a decline across Waves 2 and 4 in feelings of safety in their current neighborhoods. There was an increase in the number of children not playing outdoors, but this may also be related to the average increase in age among children of the leaseholders.
Reports of economic hardships were relatively stable over time. An improvement found was that fewer leaseholders report having had their phone service disconnected/lost phone service in Wave 4 as compared to Wave 2. Given the economic downturn, the relative stability in leaseholder reports of economic hardship may be viewed as a positive finding.
A significantly greater proportion of RRS leaseholders were in fair or poor health compared to national levels. These differences were the same at all age groups and at both time periods (Wave 2 and Wave 4). Compared to national levels, significantly more RRS leaseholders were sad and nervous than the general population. Middle and older aged leaseholders saw a significant decline in the change in high levels of sadness when compared to national levels. For other age groups there seemed little change in the differences between the two groups over time.
Perceptions of life improvement opportunities and benefits of relocation improved across survey waves. There were a considerably higher proportion of leaseholders who more positively perceive life improvement opportunities as a result of the relocation in 2009 (Wave 4) than in 2006 (Wave 3). Further, there were a considerably higher proportion of leaseholders in 2009 than in 2006 who felt that the relocation made it possible to do things that would benefit them or their families.
To understand differences between leaseholders who are in the RRS panel and those who are not, we examined the baseline characteristic of leaseholders who passed away since Wave 1 (baseline) interviews. Seventy leaseholders, or 6% of respondents, passed away since the baseline interviews. The deceased had a greater number of health problems than those who had not passed away and were older on average. Most of the deceased had been married at some time but were not married at the time of the baseline survey. More than two thirds of the deceased had not completed high school. Only 4% of the deceased were employed and 34% were disabled.
Findings from 2002 to 2009 Page | 5
Introduction This report presents findings from analyses across four waves of the Resident Relocation Survey (RRS). The National Opinion Research Center (NORC) at the University of Chicago conducts the RRS with funding and support from the John D. and Catherine T. MacArthur Foundation. The RRS collects data from current and former Chicago Housing Authority (CHA) leaseholders on their relocation experiences as part of the CHA’s Plan for Transformation, an ambitious plan to rehabilitate or replace substandard high-rise public housing in Chicago. During this process, leaseholders were temporarily relocated to other housing either in the private market or in other public housing developments. The RRS was first conducted in 2002 with the population of leaseholders relocating as part of Phase II of the Plan for Transformation. In 2003, 2006 and 2009, a sample of the Phase II leaseholders were interviewed as part of the first, second and third follow-up surveys. In 2003, a sample of Phase III leaseholders was selected and a baseline interview conducted. The Phase III sample was re-interviewed in 2004, 2006 and 2009. In a departure from prior rounds of data reporting, the baseline and subsequent follow-up surveys are now referred to as Waves 1 through 4 respectively in this report. Throughout the report, this may be abbreviated to W1 for Wave 1, W2 for Wave 2, and so on.1
Initially, the goal of the RRS was to monitor leaseholder progress through the relocation process. For residents, the relocation process started with written notification 180 days prior to the planned closing of a public housing building and ended with relocation to temporary or permanent housing along with access to supportive follow-up services. As relocation progressed, the focus of the survey shifted away from the process of relocation to include broader issues affecting the relocated leaseholders. Question were added that concern the quality of the leaseholder’s housing and neighborhood, safety, economic hardship, leaseholder health, the well-being of children, need for social services and satisfaction with the relocation process.
Between Waves 1 and 4 of the RRS approximately seven years have elapsed for Phase II and six years for Phase III. The report presents data across waves for the following topics:
Characteristics of the Leaseholder Panel
Housing and Neighborhood
Employment
Children in the Household
Economic Hardship
Leaseholder Health
Overall Satisfaction with Relocation
Baseline Characteristics and Health of Deceased Respondents
1 Additional information about the Resident Relocation Survey, including survey questionnaires and reports, is available at the NORC website: http://www.norc.org/projects/Resident+Relocation+Surveys.htm.

Page | 6 Findings from 2002 to 2009
There were 517 leaseholders who participated in all waves of data collection. The analyses presented in this report have been weighted for different selection probabilities. Only leaseholders reporting their permanent housing choice as subsidized housing (n=499) are included in analysis, with the exception of Section 1, which presents results on all panel leaseholders. In reporting the data, unless additional precision was required due to the subtlety of the findings, frequencies have been rounded to the nearest whole number, percents are rounded to the nearest whole percent, and means and correlations are rounded to two decimal places. As a result of rounding of numbers, on occasion the sum of responses to a variable will deviate from the total N for that variable. For example, percentages across categories may not always sum to 100. Selected statistical tests have been conducted to compare groups, such as leaseholders across different waves of the survey. All significant findings are significant at the p<.05 level or above. Because of changes to the questionnaire over time to reflect a broader range of issues, the years of data available varies depending on topic and phase. Details specific to analysis of each topic are described in each section of this report.

Findings from 2002 to 2009 Page | 7
Section 1. The Leaseholder Panel This section presents basic demographic information about the panel of leaseholders who participated in all four waves of the Resident Relocation Survey. In the adult roster and child roster, leaseholders were asked for information about themselves and about the adults and the children ages 17 and under living in the household.
A total of 517 leaseholders are in the RRS panel, having completed every wave of the survey. Forty-eight percent of the panel members are from the Phase II group (initially relocated in 2002) of leaseholders; 52% are from Phase III (initially relocated in 2003). Table 1.1 below presents basic information about the panel of leaseholders for each wave of the survey.
Table 1.1. Demographic Characteristics of the Phase II and Phase III Leaseholders Wave 1 Wave 2 Wave 3 Wave 4
Mean age in years 43.56 44.56 46.36 49.22 Age range 22-84 23-90 23-95 27-92
Percent female 91 90 91 90 Percent graduated from H.S/GED 48 49 51 51
Percent income below $8,000 65 66 61 55
Percent employed 29 29 30 29 Mean household size 3.30 3.32 3.22 3.13
Percent households with children 67 66 62 55
Percent African-American/Black 93 94 94 94
Mean years in current unit 4.44 3.33 2.54 2.88
Percent CHA as permanent choice 43 68 54 39
Percent lease compliant 95 94 98 95 Note: Employment data for Waves 1 and 2 are available for only Phase III. Household size for Wave 1 is available only for Phase III. Mean years in current unit is available only for Phase III at baseline and item nonresponse is high for this variable at the baseline interview. The question wording on permanent housing choice and lease compliance was not identical across waves and phases.
Eighteen leaseholders (4%) in the panel indicated that their permanent housing choice in Wave 4 was an unsubsidized living situation. Since the majority of leaseholders chose to live in subsidized living arrangements and because those who chose unsubsidized housing will no longer be under the purview of the CHA, most of the remaining analyses in this report exclude the small number of leaseholders whose permanent housing choice was unsubsidized housing. Those leaseholders who were living in unsubsidized housing in Wave 4 but whose permanent choice was to be in subsidized housing are included in the analyses (n=499).

Page | 8 Findings from 2002 to 2009
Findings from 2002 to 2009 Page | 9
Section 2. Housing and Neighborhood The Resident Relocation Survey asked leaseholders about the quality of the housing units and neighborhoods to which they had been relocated. The topics on housing units and neighborhoods that leaseholders were asked about included:
The property manager, building maintenance, condition of housing unit
Amenities available and working in the housing unit (stove, refrigerator, kitchen sink, heat, laundry facilities)
Amenities available in the neighborhood and leaseholder use of those amenities (bank, currency exchange, grocery store, library, place for health care, park/green space)2
Neighborhood problems (drinking in public, selling or using drugs, teenagers causing disturbance, litter, graffiti, vacant housing)
The questions on housing and neighborhood were asked of Phase II leaseholders starting in Wave 3 (2006) and were asked of Phase III leaseholders starting in Wave 2 (2004). To examine changes over the longest period of time, these analyses focus on the Phase III panel members and comparisons of Waves 2 and 4. Further, leaseholders who stated in the most recent survey that their permanent housing choice is unsubsidized housing are excluded from the analyses. Two hundred fifty-six Phase III leaseholders are in the panel, having participated in every RRS survey since the Baseline.3
The RRS tracks changes in the quality of leaseholders’ new housing and neighborhoods. We expect that, as the relocation process proceeds, leaseholders would experience improvements in the quality of their housing and neighborhoods.
Key findings: The percentage of leaseholders who are permanently settled (that is, in the housing they
indicated as their permanent choice) has increased steadily since the start of relocation, from 34% in Wave 1 (baseline survey) to 92% in Wave 4 (third follow-up).
Across waves, most leaseholders have reported that their current building is “very well” or “well” maintained and that the landlord or property manager treats them “the same” as other tenants. There were no significant differences in reports across Waves 2 and 4.
Most leaseholders reported at both Waves 2 and 4 that their current apartment was better than their original unit and their current neighborhood was better than the neighborhood where their original unit was located. There were no significant differences in reports across waves.
The percentage of leaseholders who reported that their units had a working stove and refrigerator and laundry facilities in the unit or building increased between Waves 2 and 4.
2 Leaseholders were asked about the availability of public aid offices in the neighborhood starting in Wave 3. Since Wave 2 data are not available for this item, it is excluded from the analyses. 3 Although 256 Phase III leaseholders are in the panel, the base n for each statistic displayed in the tables in this section and for the paired t-tests will sometimes be lower because of item nonresponse. That is, although the panel members participated in each wave of the survey they may not have answered every question.

Page | 10 Findings from 2002 to 2009
In reporting on the services available in the neighborhood, more leaseholders reported the availability of a library and park/green space in Wave 4 than in Wave 2; fewer leaseholders reported the availability of a currency exchange in Wave 4 than in Wave 2. Significantly more leaseholders indicated in Wave 4 that they use the neighborhood bank as compared to Wave 2.
Fewer leaseholders reported selling or using drugs to be a “big” or “somewhat” of a problem in Wave 4 than in Wave 2. However, reports of problems with vacant housing increased between waves.
Relocating to Permanent Housing Has the proportion of leaseholders who are permanently settled in the housing of their choice increased over time?
As a result of relocation, leaseholders moved from their original CHA units to other units in the public or private market. Although some leaseholders relocated to their permanent choice of housing immediately (generally if they chose a Housing Choice Voucher or HCV), other leaseholders lived temporarily in public or private housing while waiting to relocate to the housing of their choice. With each wave of the RRS, more leaseholders reported that they were living in permanent housing (Table 2.1).4 While only about a third of leaseholders reported being permanently settled at the baseline survey (Wave 1), more than 9 out of 10 leaseholders were permanently settled by Wave 4.
Table 2.1. Percent of Leaseholders Permanently Settled
Wave 1
% Base n=246
Wave 2 %
Base n=256
Wave 3 %
Base n=255
Wave 4 %
Base n=242 Permanently settled 34 51 63 92
4 In each wave, leaseholders were asked what their permanent housing choice was and where they were in the process of relocation (that is, the type of housing they were currently living in). Their permanent housing choice was compared to the type of housing they were currently in to determine whether they were permanently settled. Since permanent housing choices may change and leaseholders may relocate from one type of housing to another, it is possible that a leaseholder who was considered permanently settled in one wave may be considered temporarily settled in a subsequent wave.

Findings from 2002 to 2009 Page | 11
Building Maintenance, Property Manager, Condition of Housing Unit Has the maintenance of the buildings leaseholders live in improved over time?
Has the treatment of leaseholders by property managers improved over time?
How do the leaseholders’ current housing units and neighborhoods compare to the housing units and neighborhoods they lived in before relocation?
Leaseholders were asked how well the landlord or building manager maintained the building where they live. They judged the quality of building maintenance similarly in Waves 2 and 4. The large majority of respondents felt that their buildings were “very well” or “well” maintained (see Table 2.2). Further, across waves, most leaseholders felt that they were treated the same as other tenants in the building (see Table 2.3). Fewer than 10% indicated that they were treated worse.
Table 2.2. Building Maintenance How well does your landlord or property manager maintain the place where you live? Would you say the building is…
Wave 2 %
Wave 4 %
Very well maintained 39 37 Well maintained 43 46 Poorly maintained 12 13 Very poorly maintained 6 4
NOTE: Base n=252.
Table 2.3. Property Manager Do you feel like your landlord or property manager treats you the same as other tenants, or are you treated better, or worse than other tenants?
Wave 2 %
Wave 2 %
Wave 4 %
Wave 4 %
The same 72 82 74 79 Better 8 8 12 13 Worse 9 10 8 8 No other tenants 11 - 7 -
NOTE: Base n with “no other tenants” included =241; base n with “no other tenants” excluded=203. Within a row, cells sharing a superscript letter are significantly different at p<.05, paired t-test. T-test conducted with leaseholders who indicated “no other tenants” in either round are excluded from the analysis. Leaseholders who had moved out of their original units were asked to compare their current unit to their original units. Across waves, most leaseholders reported that their current unit was better than their original unit. Although the percentage of leaseholders reporting that their current unit was in better condition was slightly higher in Wave 4 as compared to Wave 2, the different was not significant (see Table 2.4).

Page | 12 Findings from 2002 to 2009
Table 2.4. Condition of Current Unit Compared to Original Unit Overall, would you say this apartment is better, worse, or about the same as your original unit?
Wave 2 %
Wave 4 %
Better 67 74
Worse 10 10 About the same 23 16
NOTE: In Wave 2, leaseholders were asked about “your last apartment” instead of about “your original unit.” Base n=201. Within a row, cells sharing a superscript letter are significantly different at p<.05, paired t-test.
Leaseholders were also asked to compare their current neighborhood to the neighborhood where their original unit was. As Table 2.5 shows, well over half of leaseholders reported in each wave that their current neighborhood was better than the neighborhood where their original unit was. However, the change in reporting of “better” between Waves 2 and 4 was not significant.
Table 2.5. Current Neighborhood Compared to Original Neighborhood Is this neighborhood better, worse, or about the same as the neighborhood where your original unit was?
Wave 2 %
Wave 4 %
Better 62 68 Worse 10 5 About the same 28 27
NOTE: Base n=139. Within a row, cells sharing a superscript letter are significantly different at p<.05, paired t-test.
Amenities Available and Working in the Housing Unit Has the availability of working amenities (such as stove and refrigerator) within leaseholders’ apartments at move-in improved over time?
Leaseholders reported on whether each of five amenities was available and working in their current unit when they moved in. Table 2.6 reveals several improvements in the quality of the leaseholders’ housing units between Waves 2 and 4. In Wave 2, only about three-quarters of leaseholders reported having a working stove and refrigerator upon move-in; only half had laundry facilities in their building or unit. By Wave 4 nearly all leaseholders reported that the units to which they moved had a working stove and refrigerator and nearly three-quarters reported having laundry facilities in their building or unit. A small percentage of leaseholders, less than 10%, report across waves that they did not have adequate heat.

Findings from 2002 to 2009 Page | 13
Table 2.6. Amenities Available and Working in Leaseholder’s Unit Please tell me if each of the following were available and working in your unit when you moved in.
Wave 2 %
Wave 4 % Base n
A cooking stove with an oven? 75a 99a 205 A refrigerator? 75a 99a 205 A kitchen sink? 97 99 205 Adequate heat? 91 93 205 Laundry facilities in your building or unit? 51a 74a 204
NOTE: In Waves 2 and 3, leaseholders were first asked if each amenity was available and working, available but not working, or not available at move-in. If the amenity was either not working or not available, the leaseholder was then asked if it was available and working now. These two questions were combined into one question for Wave 4, in which leaseholders reported whether each amenity was available and working, available but not working, or not available in their current unit. Within a row, cells sharing a superscript letter are significantly different at p<.05, paired t-test.
Neighborhood Services Have the availability and use of neighborhood services increased over time?
Leaseholder reports reveal several improvements in the services available in their neighborhoods (see Table 2.7). Between Waves 2 and 4, the percentage of leaseholders reporting that a bank, library, and park or green space was available increased. The availability of currency exchanges, institutions providing financial services at a fee that are found predominantly in lower-income neighborhoods, decreased between waves. As Table 2.8 shows, the percentage of leaseholders using a neighborhood bank increased across waves.
Table 2.7. Availability of Services in Neighborhood
I am interested in what services are available in this neighborhood?
Wave 2 %
(Base n)
Wave 4 %
(Base n)
Bank 79 (226)
85 (226)
Currency exchange 96a (254)
86a (254)
Grocery store 83 (255)
85 (255)
Library 74a (221)
84a (221)
Health care 81 (200)
75 (200)
Public aid office - 66
(257)
Park or green space 85a (239)
92a (239)
NOTE: Use of a“public aid office” was asked about in Wave 4 but not Wave 2; this item has been excluded from the table. Within a row, cells sharing a superscript letter are significantly different at p<.05, paired t-test.

Page | 14 Findings from 2002 to 2009
Table 2.8. Use of Services in Neighborhood
I am interested in… whether or not you or other members of your household use [service]?
Wave 2 %
(Base n)
Wave 4 %
(Base n) Base n
Bank 24a 43a 160 Currency exchange 86 86 210 Grocery store 90 86 188 Library 73 76 145 Health care 58 65 124 Park or green space 74 71 191
Note: Use of a “public aid office” was asked about in Wave 4 but not Wave 2; this item has been excluded from the table. Within a row, cells sharing a superscript letter are significantly different at p<.05, paired t-test.
Neighborhood Problems Have problems in leaseholders’ neighborhoods decreased over time?
Although many leaseholders reported that their current neighborhoods were better than their original neighborhoods (Table 2.5), they still reported a number of neighborhood problems. The severity of these problems (judged as “big” or “somewhat” of a problem) changed little between Waves 2 and 4. Table 2.9 shows that problems with selling or using drugs decreased. However, there were no significant improvements in the other neighborhood problems asked about. Further, reports of vacant housing being “big” or “somewhat” of a problem increased between Waves 2 and 4.5
Table 2.9. Neighborhood Problems Big/somewhat of a problem
Wave 2 %
Wave 4 %
Base n
Drinking in public 44 39 248 Selling or using drugs 62a 52a 241 Teenagers causing disturbance 45 50 247 Litter 50 51 254 Graffiti 26 24 252 Vacant housing 25a 34a 248
NOTE: Although the table displays the combined percentage of leaseholders who answered either “big” or “somewhat” of a problem, the t-tests were conducted on the disaggregated data. Within a row, cells sharing a superscript letter are significantly different at p<.05, paired t-test.
5 The increase in vacant housing may be due to the rising number of foreclosures in recent years, but this possibility was not empirically tested.

Findings from 2002 to 2009 Page | 15
Section 3. Leaseholder Employment To examine leaseholders’ employment patterns over time, two sets of analyses were conducted. First, data from Wave 3 (2006) and Wave 4 (2009) surveys for both Phase II and Phase III leaseholders were analyzed. Although these analyses only cover the previous three years, the larger number of leaseholders (including the full panel of both Phase II and Phase III leaseholders, n=555) allows for a more robust result.
The second set of analyses includes the Phase III leaseholders and includes data from all four waves of data collection (n=256). Although fewer leaseholders are included in these analyses due to these data not having been collected for Phase II leaseholders, the additional data collection points allows us to examine the work history of these leaseholders in more detail.
Key Findings:
All leaseholders from Wave 3 to Wave 4
Employment among leaseholders decreased by 2.2% between Wave 3 (2006) and Wave 4 (2009). Although part-time employment increased during this time, the decrease of full-time employment among leaseholders was almost three times as large.
The employment status6 of leaseholders between 2006 and 2009 was somewhat volatile, with 38% of leaseholders reporting a change in their employment status between 2006 and 2009.
Leaseholders working part-time appeared to be the most susceptible to employment status volatility; 60% of leaseholders who reported working part-time in 2006 were no longer working part-time in 2009. However, a quarter of leaseholders working part-time in 2006 reported working full-time in 2009.
Many leaseholders who reported unemployment in 2006 subsequently left the labor market in 2009 (26.5% of the unemployed), half of whom reported leaving due to health related issues.
Phase III leaseholders from Wave 2 to Wave 4
Unemployment among Phase III leaseholders remained stable between Wave 1(2003) and Wave 4 (2009). However, the composition of unemployment changed, with more leaseholders out of the labor market in 2009 than in previous interview years, and fewer leaseholders looking for work.
Long term employment among leaseholders was rare. Only 12% of Phase III leaseholders reported any type of employment in all four interview periods. At the same time, a large number (47%) of Phase III leaseholders did not report employment in any of the four interview periods.
There was little stability in either full-time or part-time employment. Very few leaseholders maintained employment throughout the six year period (12%) and even fewer (9%) maintained the same employment status (full-time or part-time) during the six-year period.
6 Employment status could be reported as working full-time, working part-time, not working and looking for work (unemployed), or not working and not looking for work (not in the labor market).
Page | 16 Findings from 2002 to 2009
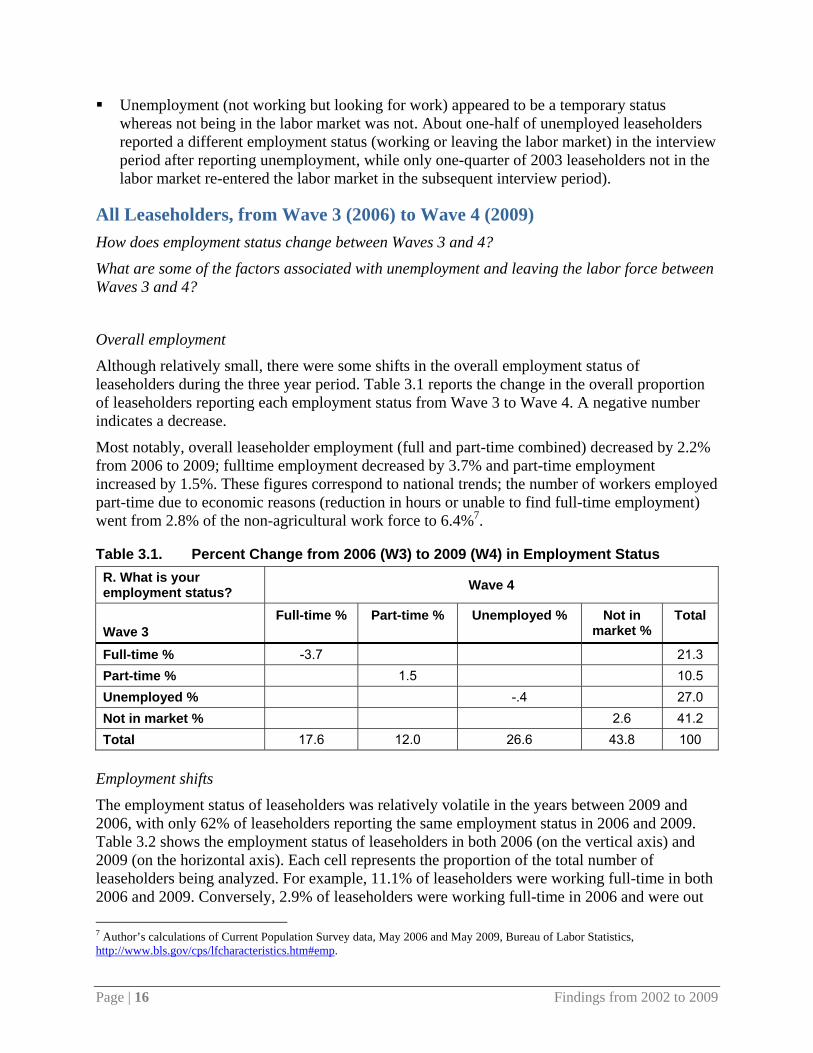
Unemployment (not working but looking for work) appeared to be a temporary status whereas not being in the labor market was not. About one-half of unemployed leaseholders reported a different employment status (working or leaving the labor market) in the interview period after reporting unemployment, while only one-quarter of 2003 leaseholders not in the labor market re-entered the labor market in the subsequent interview period).
All Leaseholders, from Wave 3 (2006) to Wave 4 (2009) How does employment status change between Waves 3 and 4?
What are some of the factors associated with unemployment and leaving the labor force between Waves 3 and 4?
Overall employment
Although relatively small, there were some shifts in the overall employment status of leaseholders during the three year period. Table 3.1 reports the change in the overall proportion of leaseholders reporting each employment status from Wave 3 to Wave 4. A negative number indicates a decrease.
Most notably, overall leaseholder employment (full and part-time combined) decreased by 2.2% from 2006 to 2009; fulltime employment decreased by 3.7% and part-time employment increased by 1.5%. These figures correspond to national trends; the number of workers employed part-time due to economic reasons (reduction in hours or unable to find full-time employment) went from 2.8% of the non-agricultural work force to 6.4%7.
Table 3.1. Percent Change from 2006 (W3) to 2009 (W4) in Employment Status R. What is your employment status? Wave 4
Wave 3 Full-time % Part-time % Unemployed % Not in
market % Total
Full-time % -3.7 21.3 Part-time % 1.5 10.5 Unemployed % -.4 27.0 Not in market % 2.6 41.2 Total 17.6 12.0 26.6 43.8 100 Employment shifts
The employment status of leaseholders was relatively volatile in the years between 2009 and 2006, with only 62% of leaseholders reporting the same employment status in 2006 and 2009. Table 3.2 shows the employment status of leaseholders in both 2006 (on the vertical axis) and 2009 (on the horizontal axis). Each cell represents the proportion of the total number of leaseholders being analyzed. For example, 11.1% of leaseholders were working full-time in both 2006 and 2009. Conversely, 2.9% of leaseholders were working full-time in 2006 and were out 7 Author’s calculations of Current Population Survey data, May 2006 and May 2009, Bureau of Labor Statistics, http://www.bls.gov/cps/lfcharacteristics.htm#emp.

Findings from 2002 to 2009 Page | 17
of the labor market in 2009. The shaded cells along the diagonal indicate a stable employment situation, leaseholders who reported the same employment status in 2006 and 2009.
Table 3.2. Proportion of Leaseholders by 2006 (W3) and 2009 (W4) Employment status R. What is your employment status? Wave 4
Wave 3 Full-time % Part-time % Unemployed % Not in market % Total
Full-time % 11.1 3.4 3.9 2.9 21.3 Part-time % 2.6 4.2 2.4 1.3 10.5 Unemployed % 3.2 2.6 14.0 7.1 27.0 Not in market % 0.6 1.8 6.3 32.5 41.2 Total 17.6 12.0 26.6 43.8 100
In the following sections, each of the four employment groups is addressed. Using the 2006 data as the baseline, the changes in employment of the leaseholders in each employment status group are investigated. Table 3.3 presents these results; the rows represent 2006 employment status while the columns the leaseholders’ employment status in 2009. For example, from the table we see that 52% of leaseholders working full-time in 2006 were still working full-time in 2009. Conversely, 13.7% of those working full-time in 2006 were out of the labor market in 2009. In particular, the reasons provided by leaseholders who were working in 2006 but not working in 2009 are examined to better understand potential barriers to maintaining employment. The breakdown of reasons for not working is presented in Table 3.4 at the end of the section.
Table 3.3. 2009 (W4) Leaseholder Employment Status by 2006 (W3) Leaseholder Employment Status
R. What is your employment status? Wave 4
Wave 3 Full-time % Part-time % Unemployed % Not in market % Total*
Full-time % 52.0 16.0 18.3 13.7 100 Part-time % 24.7 40.1 23.0 12.3 100 Unemployed % 12.0 9.6 51.9 26.5 100 Not in market % 1.6 4.3 15.3 78.8 100
Full-time employed leaseholders (n=118)
From 2006 to 2009, full-time employment decreased by 3.7% (from 21.3% in 2006 to 17.6% in 2009). Among those employed full-time in 2006, the majority remained employed with 52% of full-time workers in 2006 remaining full-time workers in 2009, and 16.0% working part-time in 2009.
Eighteen percent (n=22) of leaseholders with full-time jobs in 2006 were unemployed (looking for work) in 2009. Several reasons for unemployment were given, however, over one-half of these unemployed leaseholders (58%) indicated that they had looked but were unable to find a job in 2009. Sixteen percent of these leaseholders indicated that they were temporarily laid off, and another 17% indicated that they had difficulty getting transportation to where jobs were. While the inability to find permanent work is likely related to the economic conditions of the

Page | 18 Findings from 2002 to 2009
Chicago area (unemployment doubled between 2006 and the first half of 2009),8 the transportation difficulties reported may be related to the relocation9.
Only 13.7% (n=16) of full-time employed leaseholders had left the labor market (not working and not looking for work) in 2009, primarily due to health related issues; 61% of full-time employed leaseholders in 2006 who had left the labor market by 2009 indicated that they were disabled or had a health condition that prevented them from maintaining a job. Seventeen percent of leaseholders who had been employed full-time in 2006 but had left the labor market in 2009 indicated that that had looked but had been unable to find a job.
Part-time employed leaseholders (n=58)10
Leaseholders employed part-time were slightly less stable than full-time working leaseholders. Among those employed part-time in 2006, the majority (64.8%) remained employed with 24.7% of part-time workers in 2006 becoming full-time workers in 2009. This part-time to full-time shift in employment status is one of the employment changes most frequently reported by leaseholders in the 2009 data.
While many part-time working leaseholders were working full-time in 2009, there was a substantial portion of leaseholders who were working part-time in 2006 but were unemployed in 2009 (23.0%, n=13). Among these leaseholders, 40% reported looking, but having been unable to find work and 20% report being temporarily laid off.
A smaller number of leaseholders employed part-time in 2006 report having left the labor market at some point between 2006 and 2009 (12.3%, n=7). Consistent with leaseholders who have left the labor market in general, three-quarters (75%, n=5) of part-time workers who have left the labor market by 2009 report that they are disabled or have health problems that prevent them from maintaining a job.
Unemployed leaseholders (n=149)
Leaseholders who are not currently employed but looking for work are considered unemployed (as opposed to those who are not employed and not looking for work). The unemployment rate among leaseholders remained relatively steady in 2009. As compared to Chicago MSA unemployment rates for 2006 (4.5%) and the first half of 2009 (9.4%)11 the unemployment rate among leaseholders is considerably higher. When put in the context of the significant increase the Chicago MSA saw in the same period, the steady unemployment rate among leaseholders may be seen as a success.
Just over half (51.9%) of the leaseholders who were unemployed in 2006 remained unemployed in 2009. The primary reason given for unemployment was that the leaseholder had looked but had been unable to find a job (58%). Although leaseholders may have reported unemployment in both the 2006 and 2009 data collection periods, 44% of the leaseholders had at least one employment spell in the three year period, illustrating that unemployment can be both chronic 8 Author’s calculations of data collected by the Illinois Department of Employment Security, 2006 and 2009, http://lmi.ides.state.il.us/laus/historicalMonthly.htm. 9 Seventeen percent equals four leaseholders; two from traditional CHA developments and two with a HCV lease. 10 Due to the small number of part-time employed leaseholders, the findings reported about these leaseholders should be interpreted with caution. 11 Author’s calculations of data collected by the Illinois Department of Employment Security, 2006 and 2009, http://lmi.ides.state.il.us/laus/historicalMonthly.htm.

Findings from 2002 to 2009 Page | 19
(single, longer periods of unemployment) and acute (shorter spells of unemployment punctuated by periods of employment).
One of the largest shifts in employment status between 2006 and 2009 is the large proportion of leaseholders who, after reporting unemployment in 2006, subsequently left the labor market by 2009. Over 26% of the 2006 unemployed leaseholders reported having left the labor market in 2009. Half (53%) of these leaseholders report a disability or a health issue that prevented them from maintaining employment, and only 8% of these leaseholders reported enrollment in school or job training as the reason they are not in the labor market. Other reasons, including retirement (7%) and being at home (keeping house, or at home caring for a child or adult, 20%) were also provided.
Encouragingly, over 20% of leaseholders unemployed in 2006 reported either full (12.0%) or part -time (9.6%) employment in 2009. Fifty-six percent of 2006 unemployed leaseholders who became employed by 2009 reported that the reason they were unemployed in 2006 was that they had looked for employment but had been unable to find it. Another 12% of these leaseholders were in some type on schooling or job training in 2006, and 9% reported that they were temporarily laid off in 2006.
Leaseholders not in the labor market (n=227)
The vast majority of leaseholders who were not in the labor market in 2006 remain out of the labor market in 2009 (78.8%, n=179). Seventy-nine percent (n=141) of these leaseholders (who were not in the labor market in either 2006 or 2009) report having a disability or a health condition that prevents them from maintaining employment, and 12% (n=27) report being retired. Interestingly, ten percent of leaseholders who were out of the labor market in both 2006 and 2009 reported at least one employment spell between those years.
Twenty-one percent (n=48) of the 2006 out-of-the-labor-market leaseholders report moving into the labor market at some point before 2009, although the majority of these leaseholders (n=33) were unemployed (and looking for work) in 2009. Having looked but been unable to find work (39%) and a health condition that prevented them from maintaining a job (26%) were the two most frequently reported reasons for unemployment in 2009.
Only six percent (n=13) of leaseholders who were out of the labor market in 2006 had reentered the labor market and were employed in 2009. Most of these leaseholders were employed part-time (77%) and only a few full-time (31%). In 2006, leaseholders who reported being out of the labor market most frequently reported that a heath or disability related issues had kept them out of the labor market (38%).

Page | 20 Findings from 2002 to 2009
Table 3.4. Reason for not working in 2009 (W4) by 2006 (W3) Employment Status Wave 3 Employment status
Full-time (n=38)
Part-time (n=20)
Unemployed (n=117)
Not in market (n=214 )
Reason for not working in Wave 4
Unemp %
NLM %
Unemp %
NLM %
Unemp %
NLM %
Unemp %
NLM %
Looked, couldn’t find job 58 17 40 58 5 39 1
Difficulty getting transportation 17 13 8 2
Lack skills or education 6 6 5 3 1 Felony record 1 8 Temporarily laid off 16 20 6 5 1 Retired 5 12 7 12 Disabled, health problem 61 13 75 7 53 26 79
In school or job training 4 6 13 1 8 5 2 Keeping house, at home caring for child or adult
4 11 6 13 20 13 4
Disparities between retrospective data from 2009 and concurrent data from 2006
In the 2009 wave of the survey leaseholders were asked to provide retrospective reports on all of the jobs they had since their relocation. The above analyses were conducted using concurrent data, respondent reports of current employment status in 2006 collected at the 2006 interview and reports of 2009 employment status collected at the 2009 interview. To assess the reliability of the 2009 retrospective data on 2006 employment, the leaseholders’ concurrent reports of employment from 2006 were compared to the retrospective data on 2006 employment collected in 2009.12
Table 3.5 presents the relationship between the retrospective and concurrent data. Errors in retrospective reports may result from forgetting to report an employment spell or incorrectly reporting the dates of an employment spell. As expected, there were a number of leaseholders whose retrospective reports of 2006 employment differ from the concurrent reports collected in 2006. Sixteen percent of leaseholders had a discrepancy between their reported work status in 2006 and what they reported in 2009, although for the majority of respondents (84%), their concurrent and retrospective reports of 2006 employment status were in agreement.
12 Concurrent reports of 2006 employment status were determined using the 2006 roster questions on employment. Retrospective reports of 2006 employment status were determined from the employment history collected in the 2009 interview. If a leaseholder reported in the employment history that they were working during the month when their 2006 data collection interview took place, they were considered employed at the time of the 2006 interview. If they did not report employment during that month, they were considered unemployed at the time of the 2006 interview.
Findings from 2002 to 2009 Page | 21
Table 3.5. Employment Recall Wave 4
Wave 3 Recall working Recall not working Total Wave 3 working 148 (25.9%) 33 (5.8%) 181 Wave 3 not working 58 (10.2%) 332 (58.1%) 390 Total 206 362 571
Phase III Leaseholders, from 2003 (Wave 1) to 2009 (Wave 4) How does employment status change from Wave 1 to Wave 4?
Overall employment
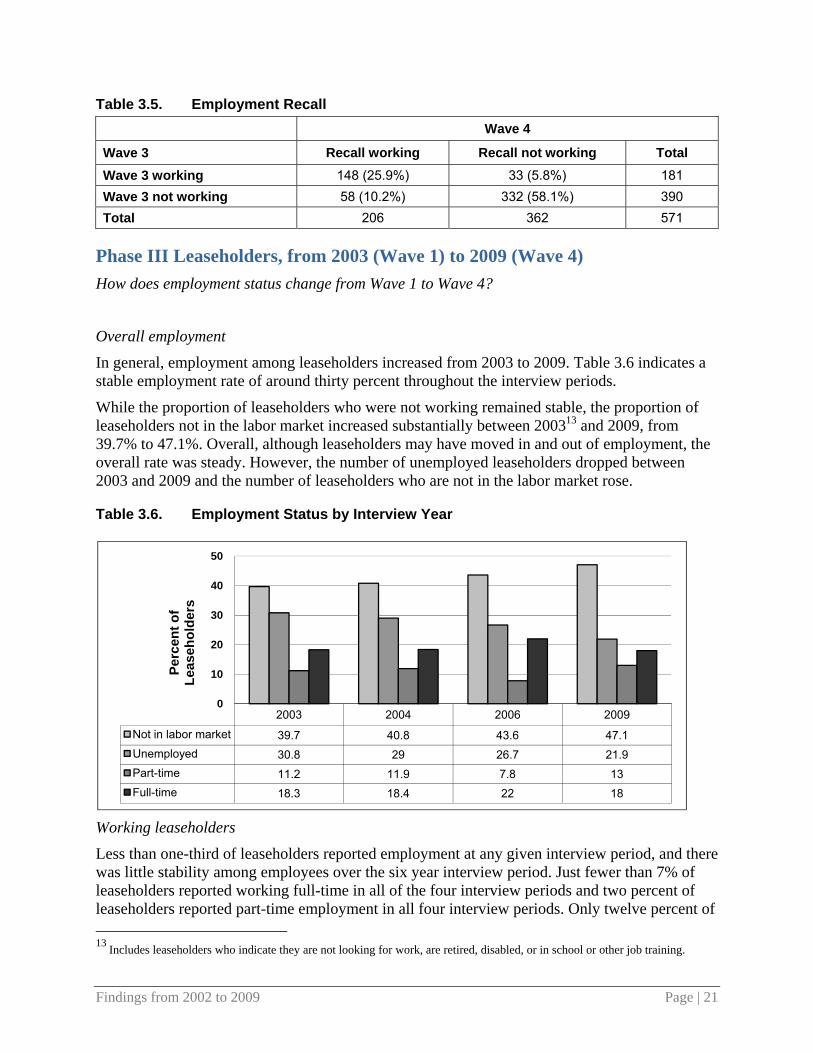
In general, employment among leaseholders increased from 2003 to 2009. Table 3.6 indicates a stable employment rate of around thirty percent throughout the interview periods.
While the proportion of leaseholders who were not working remained stable, the proportion of leaseholders not in the labor market increased substantially between 200313 and 2009, from 39.7% to 47.1%. Overall, although leaseholders may have moved in and out of employment, the overall rate was steady. However, the number of unemployed leaseholders dropped between 2003 and 2009 and the number of leaseholders who are not in the labor market rose.
Table 3.6. Employment Status by Interview Year
Working leaseholders
Less than one-third of leaseholders reported employment at any given interview period, and there was little stability among employees over the six year interview period. Just fewer than 7% of leaseholders reported working full-time in all of the four interview periods and two percent of leaseholders reported part-time employment in all four interview periods. Only twelve percent of 13 Includes leaseholders who indicate they are not looking for work, are retired, disabled, or in school or other job training.
2003 2004 2006 2009
Not in labor market 39.7 40.8 43.6 47.1Unemployed 30.8 29 26.7 21.9Part-time 11.2 11.9 7.8 13Full-time 18.3 18.4 22 18
0
10
20
30
40
50
Perc
ent o
f Le
aseh
olde
rs

Page | 22 Findings from 2002 to 2009
Phase III leaseholders reported employment (part or full-time) in all four interview periods, with an additional eighteen percent reporting employment in at least three of the four periods. However, over half of leaseholders (53%) reported employment in at least one of the interview periods; the remaining 47% of leaseholders reported no employment in any of the interview periods.
Long term, 36% of leaseholders reporting full-time employment in 2003 reported continued full-time employment through 2009. However, an almost equal amount (30%) of leaseholders reported being out of the labor market in 2004, 2006, or 2009. Among the remaining leaseholders that reported working full-time in 2003, the majority lapsed into unemployment during at least one of the subsequent interviews (47%).
One of the patterns evident throughout the survey period was that very few leaseholders regained any type of employment (full or part-time) in subsequent interview periods after losing full-time employment. Most often, these leaseholders would report unemployment in the periods following the loss of a full-time job. Of the 29 leaseholders reporting part-time employment in 2003, 28% reported part-time employment in 2009, and only 31% of leaseholders working part-time in 2003 reported working part or full-time throughout the six-year survey period.
Unemployed leaseholders
Unemployment among leaseholders is common, ranging from almost a third of the leaseholders in 2003 to a fourth in 2009. Forty-seven percent of leaseholders report unemployment in at least one of the four interview periods. However, chronic unemployment among leaseholders appears to be relatively rare, with very few leaseholders (6%) remaining unemployed for the entire six-year survey period and an additional 9% reporting unemployment in three of the four interview periods.
Of the leaseholders who reported unemployment in an interview, about half continued to report unemployment in the subsequent interview. About a quarter of the unemployed leaseholders reported either full or part-time employment; the remaining quarter reported leaving the labor market. Longer term outcomes are similar. Among unemployed leaseholders in 2003, just over a third report working either part or full-time in at least one of the subsequent interview periods. However, 22% of 2003 unemployed leaseholders report leaving the labor market in at least one of the three subsequent interview periods.
Leaseholders not in the labor market
There was a large group of Phase III leaseholders not in the labor market in all of the interview periods. Ten percent of leaseholders reported that they were not in the labor market in all four interview periods, and an additional 9% reported being out of the labor market in three of the four interview periods. The majority of leaseholders reported being out of the labor market at some point; 59% of leaseholders reported being out of the labor market during at least one of the four interview periods.
If a leaseholder reported that they were out of the labor market in 2003, they were likely to remain out of the labor market or unemployed; 26% of lease holders not in the labor market in 2003 remained out of the labor market in all four interview periods. Only 25% of leaseholders who were out of the labor market in 2003 reported employment in any subsequent interview period.

Findings from 2002 to 2009 Page | 23
Exempt Leaseholders
In each round of interviewing there was a proportion of the sample that may be exempt from CHA or HCV work requirements. These leaseholders include those who are retired (over the age of 62), are in school or job training, are disabled, or are at home caring for a child or someone else with a health condition (and there is another adult in the household working). While the survey does not ask specifically if the leaseholder is exempt, the responses given to employment roster questions give an indication of potential exemption. Table 3.7 presents the number of potentially employment exempt leaseholders by interview year.
Table 3.7. Potentially Exempt Leaseholders by Wave Survey Wave
W1 W2 W3 W4
% of sample Exempt 35.8 45.6 41.1 44.8 Number of Leaseholders 124 156 264 296

Page | 24 Findings from 2002 to 2009
Findings from 2002 to 2009 Page | 25
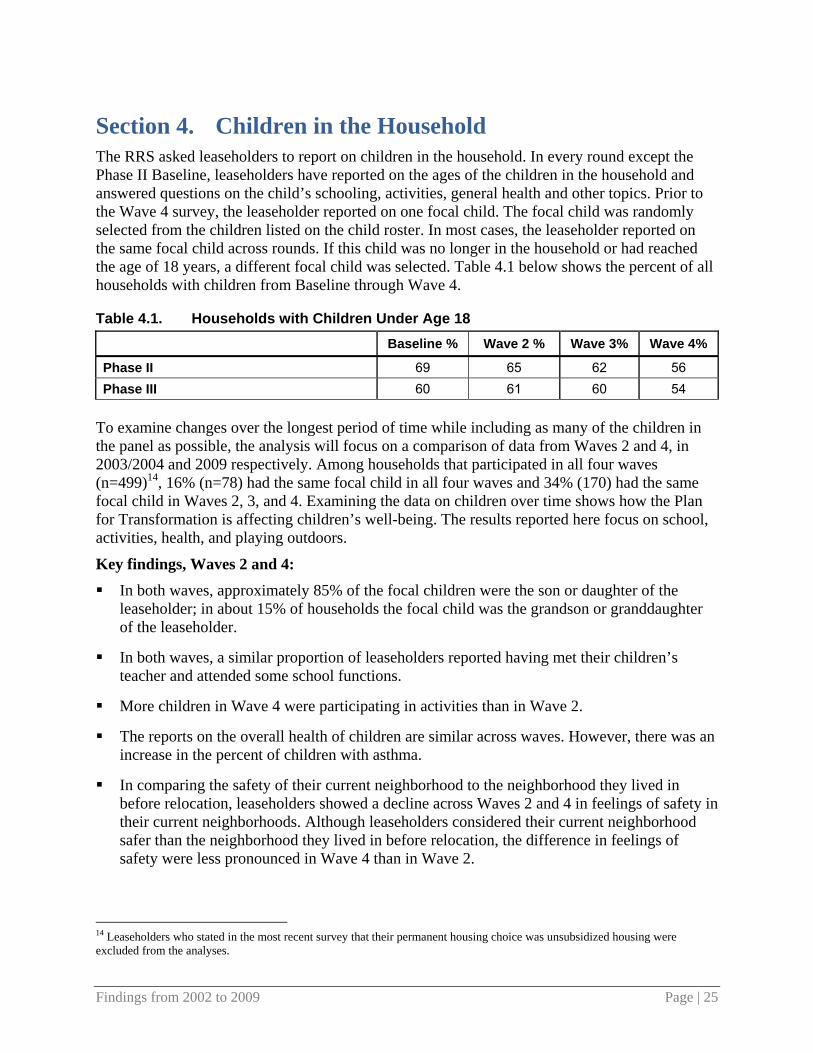
Section 4. Children in the Household The RRS asked leaseholders to report on children in the household. In every round except the Phase II Baseline, leaseholders have reported on the ages of the children in the household and answered questions on the child’s schooling, activities, general health and other topics. Prior to the Wave 4 survey, the leaseholder reported on one focal child. The focal child was randomly selected from the children listed on the child roster. In most cases, the leaseholder reported on the same focal child across rounds. If this child was no longer in the household or had reached the age of 18 years, a different focal child was selected. Table 4.1 below shows the percent of all households with children from Baseline through Wave 4.
Table 4.1. Households with Children Under Age 18 Baseline % Wave 2 % Wave 3% Wave 4%
Phase II 69 65 62 56 Phase III 60 61 60 54
To examine changes over the longest period of time while including as many of the children in the panel as possible, the analysis will focus on a comparison of data from Waves 2 and 4, in 2003/2004 and 2009 respectively. Among households that participated in all four waves (n=499)14, 16% (n=78) had the same focal child in all four waves and 34% (170) had the same focal child in Waves 2, 3, and 4. Examining the data on children over time shows how the Plan for Transformation is affecting children’s well-being. The results reported here focus on school, activities, health, and playing outdoors.
Key findings, Waves 2 and 4: In both waves, approximately 85% of the focal children were the son or daughter of the
leaseholder; in about 15% of households the focal child was the grandson or granddaughter of the leaseholder.
In both waves, a similar proportion of leaseholders reported having met their children’s teacher and attended some school functions.
More children in Wave 4 were participating in activities than in Wave 2.
The reports on the overall health of children are similar across waves. However, there was an increase in the percent of children with asthma.
In comparing the safety of their current neighborhood to the neighborhood they lived in before relocation, leaseholders showed a decline across Waves 2 and 4 in feelings of safety in their current neighborhoods. Although leaseholders considered their current neighborhood safer than the neighborhood they lived in before relocation, the difference in feelings of safety were less pronounced in Wave 4 than in Wave 2.
14 Leaseholders who stated in the most recent survey that their permanent housing choice was unsubsidized housing were excluded from the analyses.
Page | 26 Findings from 2002 to 2009
There was an increase in the number of children not playing outdoors, but this may be related to age.
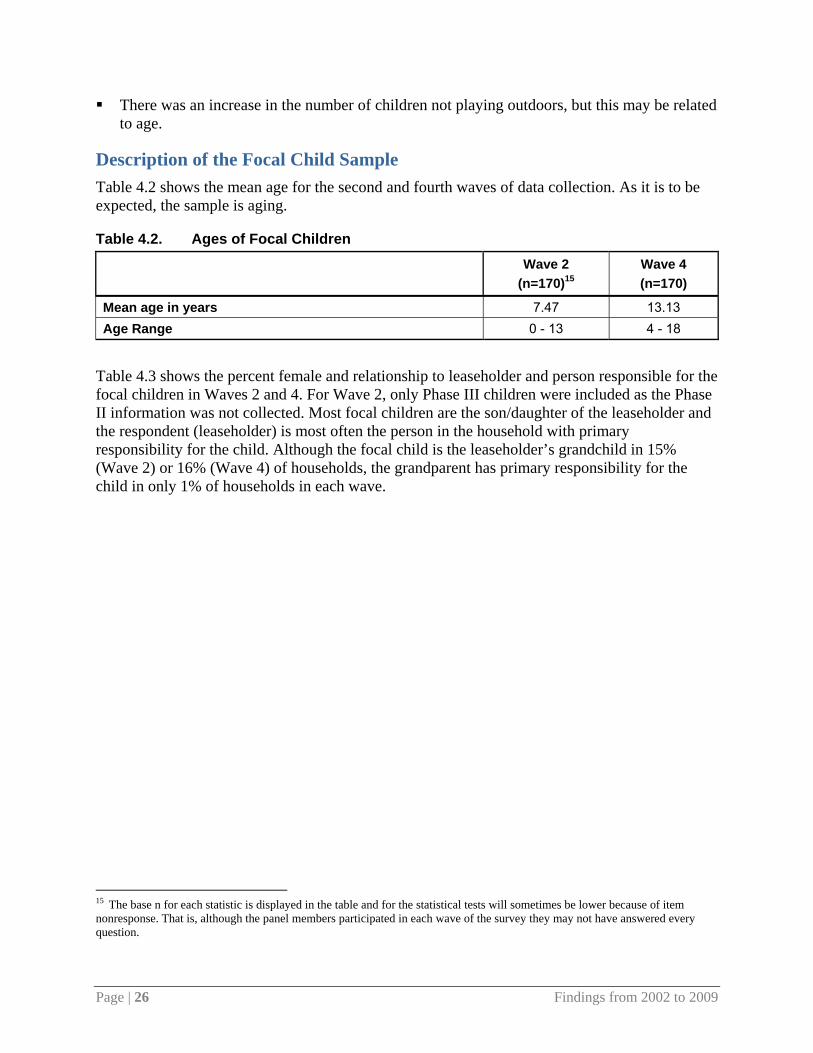
Description of the Focal Child Sample Table 4.2 shows the mean age for the second and fourth waves of data collection. As it is to be expected, the sample is aging.
Table 4.2. Ages of Focal Children
Wave 2
(n=170)15 Wave 4 (n=170)
Mean age in years 7.47 13.13 Age Range 0 - 13 4 - 18
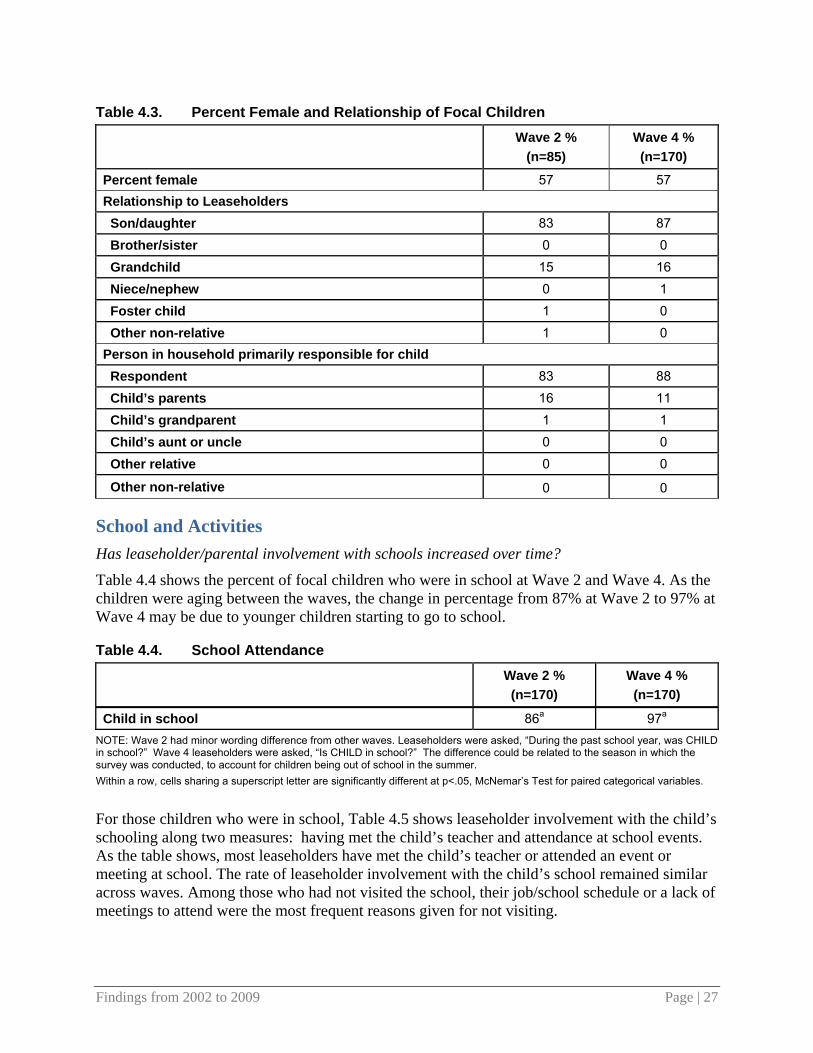
Table 4.3 shows the percent female and relationship to leaseholder and person responsible for the focal children in Waves 2 and 4. For Wave 2, only Phase III children were included as the Phase II information was not collected. Most focal children are the son/daughter of the leaseholder and the respondent (leaseholder) is most often the person in the household with primary responsibility for the child. Although the focal child is the leaseholder’s grandchild in 15% (Wave 2) or 16% (Wave 4) of households, the grandparent has primary responsibility for the child in only 1% of households in each wave.
15 The base n for each statistic is displayed in the table and for the statistical tests will sometimes be lower because of item nonresponse. That is, although the panel members participated in each wave of the survey they may not have answered every question.
Findings from 2002 to 2009 Page | 27
Table 4.3. Percent Female and Relationship of Focal Children Wave 2 %
(n=85) Wave 4 % (n=170)
Percent female 57 57 Relationship to Leaseholders Son/daughter 83 87 Brother/sister 0 0 Grandchild 15 16 Niece/nephew 0 1 Foster child 1 0 Other non-relative 1 0 Person in household primarily responsible for child Respondent 83 88 Child’s parents 16 11 Child’s grandparent 1 1 Child’s aunt or uncle 0 0 Other relative 0 0
Other non-relative 0 0
School and Activities Has leaseholder/parental involvement with schools increased over time?
Table 4.4 shows the percent of focal children who were in school at Wave 2 and Wave 4. As the children were aging between the waves, the change in percentage from 87% at Wave 2 to 97% at Wave 4 may be due to younger children starting to go to school.
Table 4.4. School Attendance
Wave 2 % (n=170)
Wave 4 % (n=170)
Child in school 86a 97a NOTE: Wave 2 had minor wording difference from other waves. Leaseholders were asked, “During the past school year, was CHILD in school?” Wave 4 leaseholders were asked, “Is CHILD in school?” The difference could be related to the season in which the survey was conducted, to account for children being out of school in the summer. Within a row, cells sharing a superscript letter are significantly different at p<.05, McNemar’s Test for paired categorical variables.
For those children who were in school, Table 4.5 shows leaseholder involvement with the child’s schooling along two measures: having met the child’s teacher and attendance at school events. As the table shows, most leaseholders have met the child’s teacher or attended an event or meeting at school. The rate of leaseholder involvement with the child’s school remained similar across waves. Among those who had not visited the school, their job/school schedule or a lack of meetings to attend were the most frequent reasons given for not visiting.

Page | 28 Findings from 2002 to 2009
Table 4.5. Interactions with Child’s School
Wave 2 % (n=85)
Wave 4 % (n=85)
Met child’s teacher 90 91 Percent attended events or meetings at school 73 72 Reasons for not visiting child’s school Job/school schedule 36 37 Younger children 8 4 Too busy 0 20 No meetings to attend 40 32 Other reason 20a 30a
NOTE: Questions on interactions with the child’s school were not asked for Phase II Wave 2. Questions on reasons for not visiting school were open-ended until Wave 4. These responses could have been coded into the “other” category. The coded open-ended responses were collapsed to capture all that applied. Uncodeable responses were removed from analysis. Within a row, cells sharing a superscript letter are significantly different at p<.05, McNemar’s Test for paired categorical variables.
Table 4.6 shows results for information collected regarding activities and the mean number of activities. The table also shows the reasons why children do not participate in activities. While more children were participating in activities in Wave 4, the mean number of activities participated in remains about the same. The child’s lack of interest in activities increased substantially between the two waves; lack of interest was the most common reason given in Wave 4 for not participating in activities. Although reports that no activities were available decreased, reports of being wait-listed increased. Reports of safety concerns also increased; this was the second most frequent reason given for the child’s lack of participation in activities.

Findings from 2002 to 2009 Page | 29
Table 4.6. Activities
Wave 2 % (n=170)
Wave 4 % (n=170)
Does child participate in activities? 41a 69a Mean number of activities 3.57 2.97 Reasons for not participating in activities (n=85) (n=85) Not interested 9b 34b None available 24c 19c Transportation 3 4 Cannot afford the fees 12 15 Waiting list 3d 11d Disability 5e 4e Child feels unwelcome 0 7 Safety concerns 3f 23f Language 2 4 Not old enough 43g 19g Other reason 9h 15h
NOTE: Phase II Wave 2 was different in wording from other waves. There was no yes/no filter question and no instruction to read the categories aloud. They were also asked about what the child currently participates in, whereas later surveys asked about the past school year. Phase III in Waves 2, 3 and 4 had a yes/no filter prior to the question on activities. The yes/no question referred to sports teams, music, dance or language classes, youth groups, clubs, and mentioned outside of school hours and weekends. The show card for Phase II in Wave 2 did not include language programs or youth groups or clubs. Estimates of whether child participated and number of activities participated in are based on determining whether any activities were selected and then the number of activities selected. For the section on reasons for not participating, only Phase III children in Wave 2 were included (n=85) as Phase II children were not asked these questions. Within a row, cells sharing a superscript letter are significantly different at p<.05, McNemar’s Test for paired categorical variables.
Overall Health and Outdoor Play Has the health of household children improved over time?
Has the safety of the places children play outdoors improved over time?
Has the level of outdoor play increased over time?
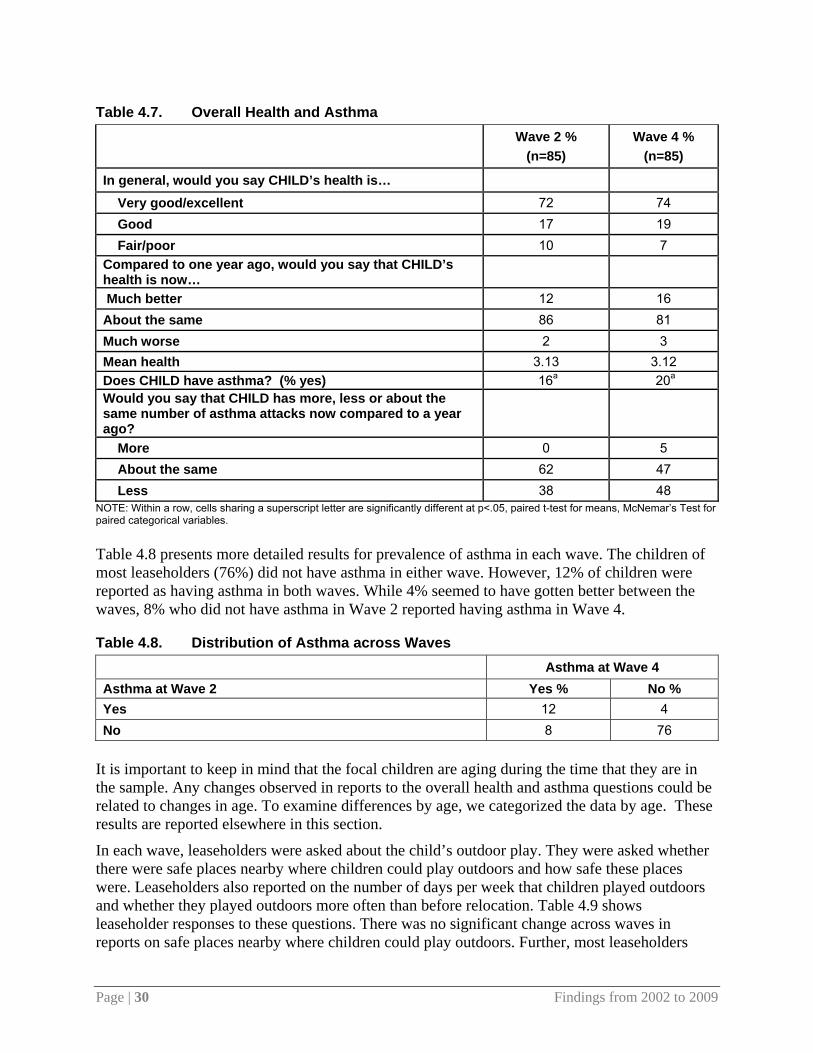
Leaseholders were asked to report on the focal child’s overall health, whether the child had asthma, and any improvements in overall health or asthma attacks compared to a year ago. Table 4.7 shows leaseholders’ responses to these questions. The overall health of children was about the same for both waves, with most children reported to be in very good or excellent health. The mean health was determined, with a range from 1 (poor health) to 5 (excellent health). The results showed no significant differences between waves. There was, however, a significant increase in the percent with asthma.
Page | 30 Findings from 2002 to 2009
Table 4.7. Overall Health and Asthma
Wave 2 %
(n=85) Wave 4 %
(n=85)
In general, would you say CHILD’s health is… Very good/excellent 72 74 Good 17 19 Fair/poor 10 7 Compared to one year ago, would you say that CHILD’s health is now… Much better 12 16 About the same 86 81 Much worse 2 3 Mean health 3.13 3.12 Does CHILD have asthma? (% yes) 16a 20a Would you say that CHILD has more, less or about the same number of asthma attacks now compared to a year ago?
More 0 5 About the same 62 47 Less 38 48
NOTE: Within a row, cells sharing a superscript letter are significantly different at p<.05, paired t-test for means, McNemar’s Test for paired categorical variables. Table 4.8 presents more detailed results for prevalence of asthma in each wave. The children of most leaseholders (76%) did not have asthma in either wave. However, 12% of children were reported as having asthma in both waves. While 4% seemed to have gotten better between the waves, 8% who did not have asthma in Wave 2 reported having asthma in Wave 4.
Table 4.8. Distribution of Asthma across Waves Asthma at Wave 4 Asthma at Wave 2 Yes % No % Yes 12 4 No 8 76
It is important to keep in mind that the focal children are aging during the time that they are in the sample. Any changes observed in reports to the overall health and asthma questions could be related to changes in age. To examine differences by age, we categorized the data by age. These results are reported elsewhere in this section.
In each wave, leaseholders were asked about the child’s outdoor play. They were asked whether there were safe places nearby where children could play outdoors and how safe these places were. Leaseholders also reported on the number of days per week that children played outdoors and whether they played outdoors more often than before relocation. Table 4.9 shows leaseholder responses to these questions. There was no significant change across waves in reports on safe places nearby where children could play outdoors. Further, most leaseholders

Findings from 2002 to 2009 Page | 31
reported that the outdoor places were safe or very safe. Differences in the mean level of safety reported were tested, but no significance was found. However, a significantly smaller proportion of children played outdoors in Wave 4 compared to Wave 2; the average number of days that focal children played outdoors declined significantly as well.
Table 4.9. Outdoor Play
Wave 2 %
(n=85) Wave 4 %
(n=85) Are there safe places nearby where children can play outdoors? (% yes) 80 74
How safe are the places where CHILD plays outdoors?* Very safe 47 31 Safe 53 66 Unsafe 0 3 Very unsafe 0 0 Mean feeling of safety* 2.47 2.29 Does not play outdoors** 1a 6a When the weather is good, how many days, in an average week, does CHILD play outdoors?
Mean days 5.57b 4.89b
[Compared to where you lived before you relocated], how often does CHILD play outdoors?
More often 33 38 About the same 28 36 Less often 39 26 Does not play outdoors** 9c 22c
NOTE: *Excludes those who did not play outdoors and was only asked of leaseholders who said there were safe places to play. **Includes not applicable response category Within a row, cells sharing a superscript letter are significantly different at p<.05, McNemar’s Test for paired categorical variables, paired t-test for means
Neighborhood Safety How have perceptions of the safety of leaseholders’ current and original neighborhoods changed over time?
Table 4.10 below displays leaseholder responses to a question on the safety of their current neighborhood as compared to the neighborhood they lived in before relocation. In Wave 2, most leaseholders thought their current neighborhood was safer than the one in which they had previously lived. In Wave 4, however, most thought it was about the same. The mean safety measure ranges from 1 (less safe) to 3 (more safe). The average feeling of safety compared to the previous neighborhood did not change significantly across waves.

Page | 32 Findings from 2002 to 2009
Table 4.10. Neighborhood Safety Would you say that your current neighborhood is… Wave 2% (n=85) Wave 4% (n=85)
More safe 46a 32a About the same 30c 54c Less safe 24b 13b Mean safety 2.21 2.19
NOTE: Within a row, cells sharing a superscript letter are significantly different at p<.05, McNemar’s Test for paired categorical variables
Age Differences Since characteristics of child health and outdoor play may change with the child’s age, comparisons across waves are done for children matched by age. Children of three age groups, three to seven years, eight to 12 years, and 13 to 17 years, are compared. How do health and outdoor play change over time for children in these age groups?
In order to determine the effects of age differences in changes over time, the panel children were categorized into age groups to allow the Wave 2 children to be compared to the Wave 4 children. Table 4.11 shows the distribution of the panel children by age category. For example, a child who was 4 years old in the second wave and in category 2 (ages 3 to 7), would be 10 years old at Wave 4 and in category 3 (ages 8 to 12). This was done to see if the differences between the waves could be a result of the children getting older. As there were no children over age 17 in Wave 2 or under age 3 in Wave 4, only the three middle age groups were examined. Statistical tests were not performed due to the small number of cases.
Table 4.11. Percent Distribution by Age Category Age Category Wave 2 % (n=12) Wave 4 % (n=16)
Under age 3 10 0 3 to 7 37 7 8 to 12 49 36 13 to 17 3 53 Over age 17 0 3
NOTE: In Wave 2, only children in Phase III were asked the questions on health and safety. So these results are limited to Phase III leaseholders only.
Age Differences in Rates of Asthma In Wave 2, 16% of leaseholders reported that their children had asthma. In Wave 4, that number had increased significantly to 20%. Table 4.12 shows the distribution of children with asthma by age category. Along with Table 4.8, the table below shows that most of the same children who had asthma in the past are the ones who were reported to have asthma in the most current wave of the survey.

Findings from 2002 to 2009 Page | 33
Table 4.12. Age Distribution of Children with Asthma. * Wave 2 % (n=85) Wave 4 % (n=85)
Under age 3 6 0 3 to 7 37 5 8 to 12 56 35 13 to 17 0 60 Over age 17 0 0
NOTES: These results should be interpreted with care because of the low number of cases.
Age Differences in Outdoor Play and Neighborhood Safety Table 4.13 shows the results for outdoor play by age category. Among the youngest age group examined (ages 3 to 7), there was a decline in the percent that felt there were safe places for the children to play outdoors. For the two older groups, there was an increase. The mean safety rating was determined. The measure ranged from 1 (very unsafe) to 5 (very safe). There was a lower mean safety at Wave 4 for all three age groups. This difference appears due not to leaseholders’ judgment that the neighborhoods were unsafe/very unsafe as relatively few leaseholders gave these low ratings. Rather, more leaseholders judged the neighborhoods to be “safe” rather than “very safe” in Wave 4 as compared to Wave 2, which lowered the mean ratings of safety.

Page | 34 Findings from 2002 to 2009
Table 4.13. Outdoor Play by Age Category
Wave 2 % Wave 4 %
Are there safe places nearby where children can play outdoors? (% yes)
Ages 3 to 7 89 71
Ages 8 to 12 75 74
Ages 13 to 17 67 73 How safe are the places where CHILD plays outdoors?* Ages 3 to 7 Very safe 50 40 Safe 50 60 Unsafe 0 0 Very unsafe 0 0 Ages 8 to 12 Very safe 42 21 Safe 58 71 Unsafe 0 8 Very unsafe 0 0 Ages 13 to 17 Very safe 50 38 Safe 50 62 Unsafe 0 0 Very unsafe 0 0 Mean safety Ages 3 to 7 2.50 2.40 Ages 8 to 12 2.42 2.13 Ages 13 to 17 2.50 2.39 Does not play outdoors Ages 3 to 7 0 0 Ages 8 to 12 0 8 Ages 13 to 17 0 3
NOTES: *Excludes those who did not play outdoors. Table 4.14 shows the results for neighborhood safety by age group. At Wave 2, it seemed that most people felt their current neighborhood was more safe or at least the same as their old one. In Wave 4, the younger age group seemed to think that the current neighborhood was safer. But for the middle and older ages, most leaseholders reported that the neighborhoods were about the same. Very few thought the neighborhoods were less safe. The mean rating of neighborhood safety was determined to examine differences between the two waves. The variable was recoded to range from 1 (less safe) to 3 (more safe). The means for the age groups do not suggest great changes in how safe the leaseholders consider their new neighborhood to be in comparison to where they lived before moving.
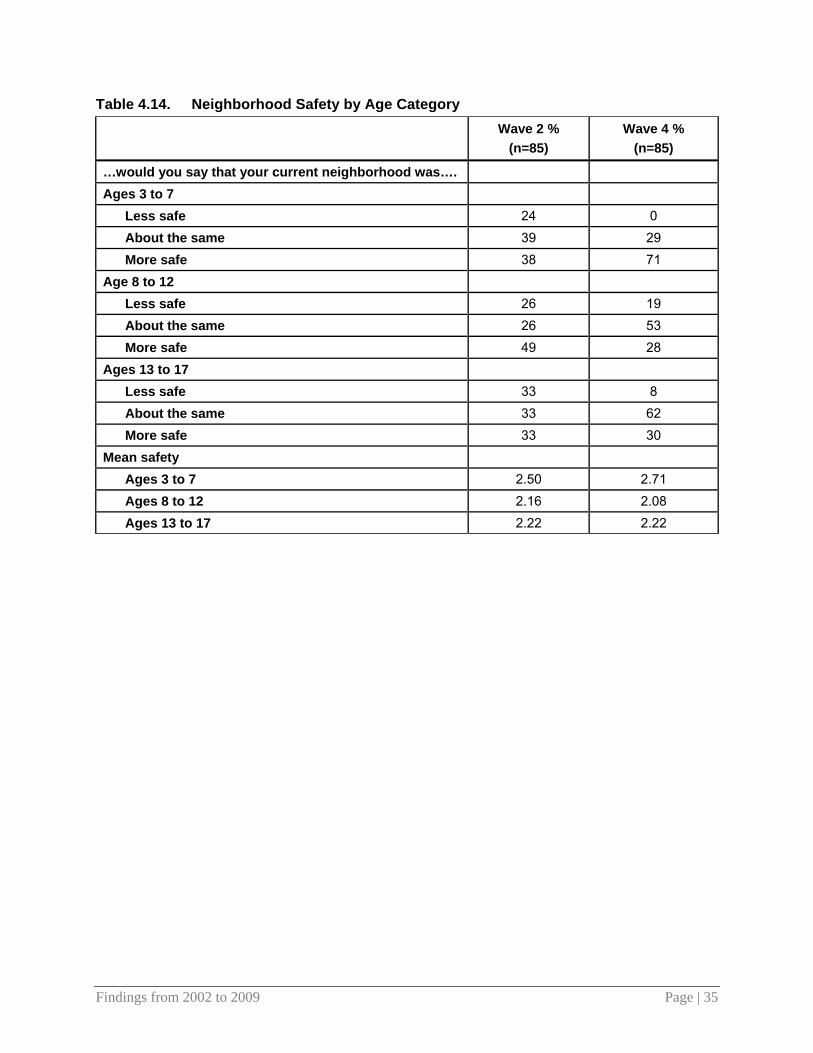
Findings from 2002 to 2009 Page | 35
Table 4.14. Neighborhood Safety by Age Category
Wave 2 % (n=85)
Wave 4 % (n=85)
…would you say that your current neighborhood was…. Ages 3 to 7 Less safe 24 0 About the same 39 29 More safe 38 71 Age 8 to 12 Less safe 26 19 About the same 26 53 More safe 49 28 Ages 13 to 17 Less safe 33 8 About the same 33 62 More safe 33 30 Mean safety Ages 3 to 7 2.50 2.71 Ages 8 to 12 2.16 2.08 Ages 13 to 17 2.22 2.22

Page | 36 Findings from 2002 to 2009

Findings from 2002 to 2009 Page | 37
Section 5. Economic Hardship The Resident Relocation Survey asked leaseholders about the economic hardships they may have experienced. For Phase III, the questions were first asked in the Wave 2 questionnaire. For Phase II, they were asked starting with Wave 3. In the surveys, leaseholders were asked whether they had experienced any of the following hardships in the last 12 months.
Gas or electricity turned off because could not pay bill
Telephone disconnected/gone without a phone because could not afford it
Could not pay rent
Belongings repossessed because could not pay the bill
Without money to buy food
To examine changes over the longest period of time, these analyses focus on the Phase III panel members and comparisons of Waves 2 and 4. Further, leaseholders who stated in the most recent survey that their permanent housing choice is unsubsidized housing are excluded from the analyses. Two hundred fifty-six Phase III leaseholders are in the panel, having participated in every RRS survey since the Baseline.16
Key Findings We expected that, as the relocation process proceeds, leaseholders would experience fewer hardships. However, it is possible that the recent economic downturn, with rises in foreclosures and unemployment, could adversely affect the economic situation of the leaseholders. Despite this, the data suggest that leaseholder’s economic situation has been relatively stable.
Fewer leaseholders reported having had their phone service disconnected/lost phone service in Wave 4 as compared to Wave 2. In this regard, leaseholders’ economic situation has improved.
For other economic hardships asked about (having utilities turned off, not being able to pay rent, belongings repossessed, without money to buy food) the percentage reporting having experienced those hardships did not change significantly over time.
Close to half of leaseholders reported experiencing none of the hardships in either wave. However, a small number of leaseholders (5%) reported experiencing two or more hardships in both waves.
Are leaseholders experiencing fewer economic hardships over time?
Table 5.1 shows the percentage of respondents reporting each hardship in Wave 2 and Wave 4. There was a significant decrease in reports of having the telephone disconnected or going without a telephone. The decline in problems paying rent was nearly significant.
16 Although 256 Phase III leaseholders are in the panel, the base n for each statistic displayed in the table and for the paired t-tests will sometimes be lower because of item nonresponse. That is, although the panel members participated in each wave of the survey they may not have answered every question.

Page | 38 Findings from 2002 to 2009
Table 5.1. Economic Hardships Experienced Wave 2
% Yes (Base n)
Wave 4 % Yes
(Base n)
Has your gas or electricity been turned off in the last 12 months because you couldn’t afford to pay the bill?
12 (213)
16 (213)
Has your phone been disconnected, or have you gone without a phone at any time in the last 12 months because you could not afford it?
28a (246)
21a (246)
Was there any time in the last 12 months that you could not pay your rent?
9 (248)
5 (248)
Were any of your belongings ever repossessed in the last 12 months because you could not pay the bill?
1 (256)
2 (256)
Was your family ever without enough money to buy food in the last 12 months?
12 (254)
15 (254)
NOTE: Within a row, cells sharing a superscript letter are significantly different at p<.05, p<.07 for question on rent, paired t-test.
The mean number of hardships reported was similar across waves (mean = 0.59 for Wave 2 and 0.56 for Wave 4, p<.05). Just under half of leaseholders reported no hardships in either Wave 2 or Wave 4 (46%, See Table 5.2). About three-quarters of leaseholders reported one or fewer hardships at both time points; the remaining one-quarter of leaseholders experienced two or more hardships in at least one of the waves. About 5% of leaseholders reported two or more hardships in both waves.
Table 5.2. Change in Hardships Reported by Wave % (Base n)
Wave 4
None 1 2 3 or more
Wave 2
None 46 10 3 2 1 11 8 1 1 2 5 5 2 1 3 or more 1 1 1 1

Findings from 2002 to 2009 Page | 39
Section 6. Leaseholder Health This section presents findings on changes in the leaseholders’ general and emotional health over time, with comparisons to national data on health. Only Waves 2 and 4 were compared because the questions on current health status were first asked of Phase II leaseholders in the second wave. Leaseholders were asked about:
• Whether their health in general was excellent, very good, good, fair or poor
• How often they had days when they were nervous, tense, or on edge
• How often they had days when they were sad and blue
Key Findings A significantly greater proportion of leaseholders were in fair or poor health compared to
national levels. These differences were the same at all age groups and at both time periods (Wave 2 and Wave 4).
Compared to national levels, significantly more leaseholders reported being sad or blue and nervous, tense, or on edge. Except for one age group, there seemed little change in the differences between the two groups over time.
Middle- and older-aged leaseholders saw a significant decline in the change in high levels of sadness when compared to national levels. That is, over time, the levels of sadness went down for older RRS respondents, resulting in a significantly decreased difference between the RRS sample and the national sample in terms of reported sadness.
Change across Time
Self-Reported Health Is the percentage of respondents reporting poor health at Wave 4 significantly greater than the percentage of respondents reporting poor health at Wave 2?
We examined RRS data to determine if there were more leaseholders at Wave 4 reporting fair or poor health compared to Wave 2.17 Table 6.1 shows these results. For the younger and older age groups18, there was no significant change in the proportion of leaseholders reporting fair or poor health. However, among those age 37 to 48 at Wave 2, there was a significant increase in the number in fair or poor health six years later. 19
17 The number of cases does not match across waves due to missing data on age and health information. 18 Age was determined using date of birth and not self-reported age. We found inconsistencies between Wave 4 date of birth and self-reported age for four respondents. For cases with these discrepancies we checked the date of birth for previous waves and imputed the correct ages. 19 We grouped leaseholders into three age groups. The age categories were determined by the Wave 2 distribution. At Wave 2, the range in ages of the panel leaseholders was 23-90 and the mean age was 44. In order to account for aging, we grouped leaseholders into Wave 4 age groups that were six years older than the Wave 2 age groups. For example, leaseholders who were 35 years old at wave 2 were placed into the youngest age group for the Wave 2 grouping (younger than 37), but in the middle age group for Wave 4 (43-54) as they would have aged approximately six years.

Page | 40 Findings from 2002 to 2009
Table 6.1. Percent Reporting Fair or Poor Health at Waves 2 and 4 by Age Category Fair/Poor Health Wave 2 Wave 4 Age at W2 Base n % Base n %
Younger than 37 153 18 160 26 37 - 48 170 31a 169 41a 49 and older 173 57 170 63
NOTE: Rows sharing a superscript (a, b, etc) are significantly different at the p<.05 level. McNemar’s test for paired categorical data was used for the analysis as the sample is dependent.
Emotional Wellbeing20 Are Wave 4 leaseholders significantly more tense, nervous, or on edge than Wave 2 leaseholders? Also, are Wave 4 leaseholders significantly more sad or blue than those at Wave 2?
Nervous, Tense, or on Edge
The RRS asked leaseholders how often they had days when they were nervous, tense, or on edge. Leaseholders who responded very or fairly often were grouped into one category and compared to those who responded that they only occasionally or hardly ever feel nervous, tense, or on edge. Again, the results were broken down by age category (see Table 6.2). There were no significant changes over time in the percentage frequently experiencing these emotions.
Table 6.2. Nervous, Tense, or on Edge at Wave 2 and Wave 4 by Age Category Fairly or Very Often Nervous, Tense, or on Edge Wave 2 Wave 4
Age at W2 Base n % Base n %
Younger than 37 70 19 78 20 37 - 48 88 31 86 23 49 and older 94 32 92 22
NOTE: Within a row, cells sharing a superscript letter are significantly different at p<.05, McNemar's test for paired categorical.
Sad or Blue
The RRS also asked leaseholders how often they were sad or blue. Leaseholders could respond very or fairly often, occasionally, or hardly ever. Those who experienced these emotions very or fairly often were included into one group signifying high levels. For leaseholders between the ages of 37 and 48 at Wave 2, there was a significant decline in the percent reporting high levels of being sad or blue between Wave 2 and Wave 4 (see Table 6.3).
20 Only Phase III leaseholders in the second wave were asked the questions on emotional wellbeing.
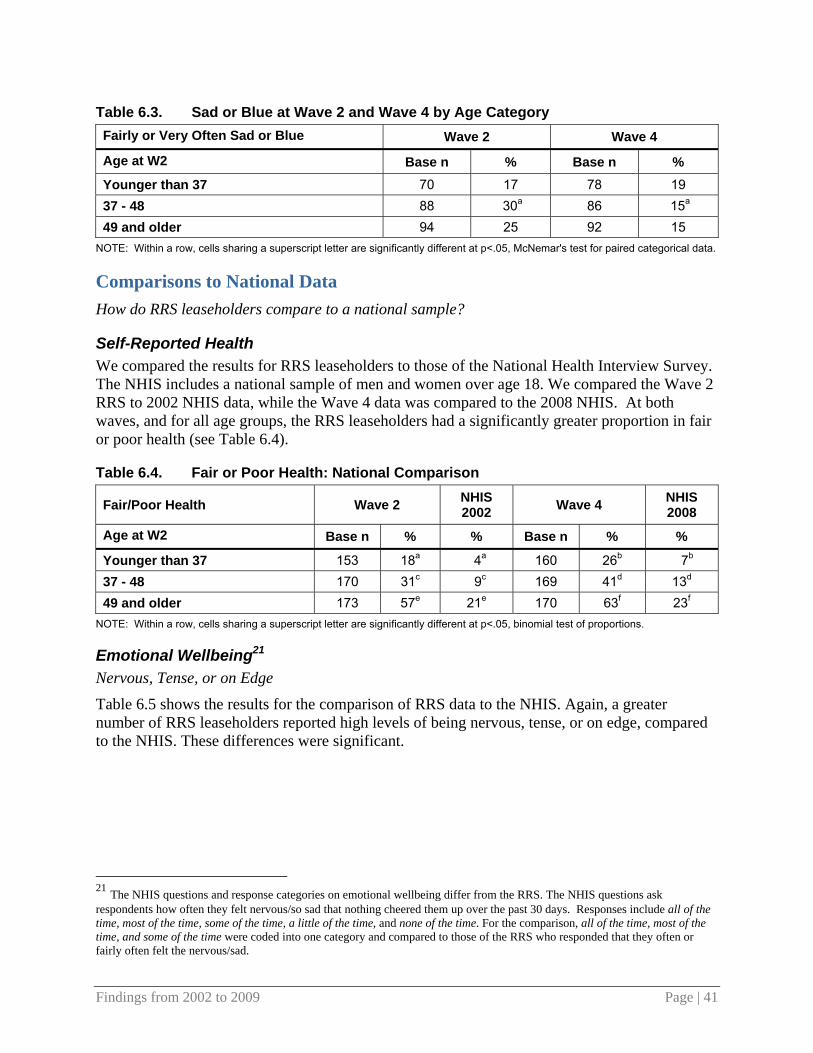
Findings from 2002 to 2009 Page | 41
Table 6.3. Sad or Blue at Wave 2 and Wave 4 by Age Category Fairly or Very Often Sad or Blue Wave 2 Wave 4
Age at W2 Base n % Base n % Younger than 37 70 17 78 19 37 - 48 88 30a 86 15a 49 and older 94 25 92 15
NOTE: Within a row, cells sharing a superscript letter are significantly different at p<.05, McNemar's test for paired categorical data.
Comparisons to National Data How do RRS leaseholders compare to a national sample?
Self-Reported Health We compared the results for RRS leaseholders to those of the National Health Interview Survey. The NHIS includes a national sample of men and women over age 18. We compared the Wave 2 RRS to 2002 NHIS data, while the Wave 4 data was compared to the 2008 NHIS. At both waves, and for all age groups, the RRS leaseholders had a significantly greater proportion in fair or poor health (see Table 6.4).
Table 6.4. Fair or Poor Health: National Comparison
Fair/Poor Health Wave 2 NHIS 2002 Wave 4 NHIS
2008 Age at W2 Base n % % Base n % %
Younger than 37 153 18a 4a 160 26b 7b 37 - 48 170 31c 9c 169 41d 13d 49 and older 173 57e 21e 170 63f 23f
NOTE: Within a row, cells sharing a superscript letter are significantly different at p<.05, binomial test of proportions.
Emotional Wellbeing21 Nervous, Tense, or on Edge
Table 6.5 shows the results for the comparison of RRS data to the NHIS. Again, a greater number of RRS leaseholders reported high levels of being nervous, tense, or on edge, compared to the NHIS. These differences were significant.
21 The NHIS questions and response categories on emotional wellbeing differ from the RRS. The NHIS questions ask respondents how often they felt nervous/so sad that nothing cheered them up over the past 30 days. Responses include all of the time, most of the time, some of the time, a little of the time, and none of the time. For the comparison, all of the time, most of the time, and some of the time were coded into one category and compared to those of the RRS who responded that they often or fairly often felt the nervous/sad.

Page | 42 Findings from 2002 to 2009
Table 6.5. Nervous, Tense, or on Edge: National Comparison Fairly or Very Often Nervous, Tense, or on Edge Wave 2 NHIS
2002 Wave 4 NHIS 2008
Age at W2 Base n % % Base n % %
Younger than 37 70 19a 15a 78 20b 17b 37 - 48 88 31c 16c 86 23d 17d 49 and older 94 32e 15e 92 22f 15f
NOTE: Within a row, cells sharing a superscript letter are significantly different at p<.05, binomial test of proportions.
Sad or Blue Table 6.6 reports the results for comparisons in proportion sad for the RRS and NHIS samples. At each age group, there was a significantly greater number of RRS leaseholders reporting that they often or fairly often feel sad or blue, compared to national levels.
Table 6.6. Sad or Blue: National Comparison
Fairly or Very Often Sad or Blue Wave 2 NHIS 2002 Wave 4 NHIS
2008
Age at W2 Base n % % Base n % %
Younger than 37 70 17a 10a 78 19b 11b 37 - 48 88 30c 11c 86 15d 12d 49 and older 94 25e 11e 92 15 13f
NOTE: Within a row, cells sharing a superscript letter are significantly different at p<.05, binomial test of proportions.
Comparisons to National Data Changes Over Time Is there a greater change in health over time among RRS leaseholders than at the national level?
We wanted to determine if the differences between the RRS leaseholders and the national sample were the same across time. That is, were our leaseholders getting sicker or more nervous or sad at the same rate as everyone else? We performed paired t-tests for overall health and emotional wellbeing. The only condition that showed significant differences was feeling sad or blue. These results are reported in Table 6.7.
Among older RRS leaseholders, there was a significant decline in the proportion who were sad and blue. The decline in number of sad and blue people was greater for RRS leaseholders than for those at the national level. In fact, there was an increase in the proportion of sad and blue people in the general population. However, while the numbers of sad RRS leaseholders have gone down, they were still significantly higher than the national levels.

Findings from 2002 to 2009 Page | 43
Table 6.7. Sad or Blue: Comparisons of Change over Time
Fairly or Very Often Sad or Blue Wave 2 NHIS 2002 Wave 4 NHIS
2008
Age at W2 Base n % % Base n % %
Younger than 37 70 17 10 78 19 11 37 - 48 88 30a 11b 86 15a 12b 49 and older 94 25c 11d 92 15c 13d
NOTE: Within a row, cells sharing a superscript letter are significantly different at p<.05, For cells sharing a symbol (*, +), the difference across time is significantly different at the p<.05 level within the data group (i.e. RRS or NHIS), using a paired t-test for analysis.

Page | 44 Findings from 2002 to 2009
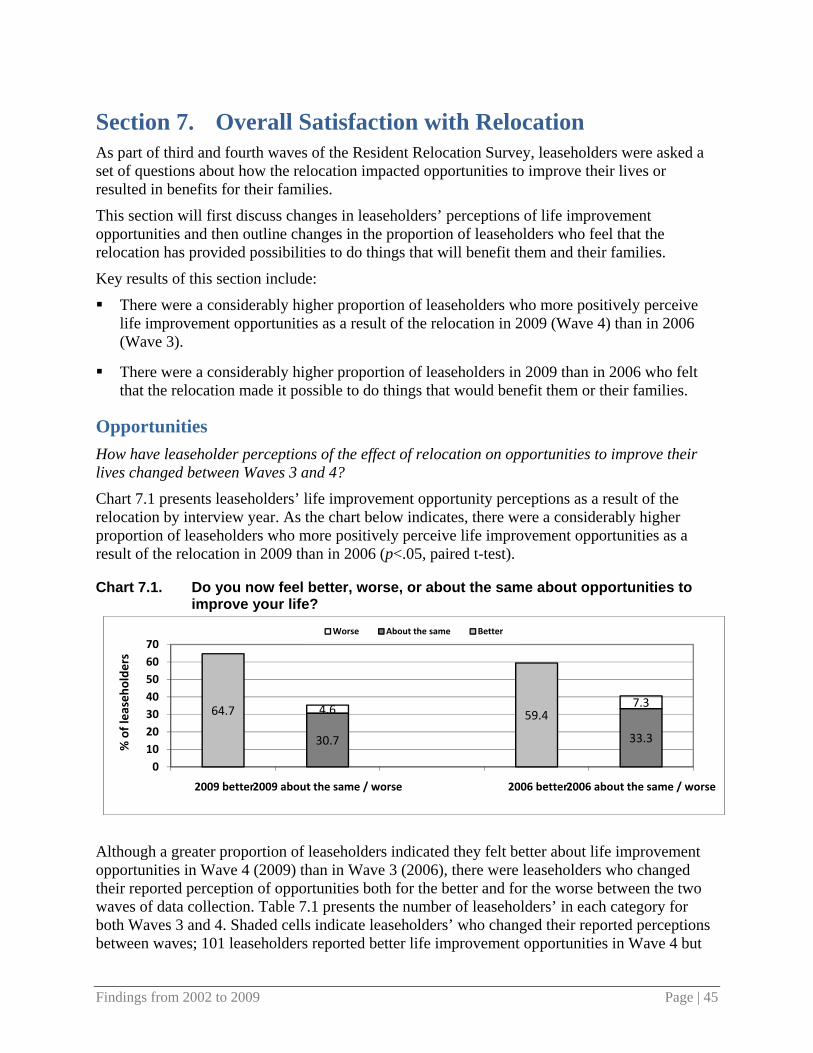
Findings from 2002 to 2009 Page | 45
Section 7. Overall Satisfaction with Relocation As part of third and fourth waves of the Resident Relocation Survey, leaseholders were asked a set of questions about how the relocation impacted opportunities to improve their lives or resulted in benefits for their families. This section will first discuss changes in leaseholders’ perceptions of life improvement opportunities and then outline changes in the proportion of leaseholders who feel that the relocation has provided possibilities to do things that will benefit them and their families.
Key results of this section include:
There were a considerably higher proportion of leaseholders who more positively perceive life improvement opportunities as a result of the relocation in 2009 (Wave 4) than in 2006 (Wave 3).
There were a considerably higher proportion of leaseholders in 2009 than in 2006 who felt that the relocation made it possible to do things that would benefit them or their families.
Opportunities How have leaseholder perceptions of the effect of relocation on opportunities to improve their lives changed between Waves 3 and 4?
Chart 7.1 presents leaseholders’ life improvement opportunity perceptions as a result of the relocation by interview year. As the chart below indicates, there were a considerably higher proportion of leaseholders who more positively perceive life improvement opportunities as a result of the relocation in 2009 than in 2006 (p<.05, paired t-test).
Chart 7.1. Do you now feel better, worse, or about the same about opportunities to improve your life?
Although a greater proportion of leaseholders indicated they felt better about life improvement opportunities in Wave 4 (2009) than in Wave 3 (2006), there were leaseholders who changed their reported perception of opportunities both for the better and for the worse between the two waves of data collection. Table 7.1 presents the number of leaseholders’ in each category for both Waves 3 and 4. Shaded cells indicate leaseholders’ who changed their reported perceptions between waves; 101 leaseholders reported better life improvement opportunities in Wave 4 but
64.7 59.4
30.7 33.3
4.6 7.3
010203040506070
2009 better2009 about the same / worse 2006 better2006 about the same / worse
% of leaseho
lders
Worse About the same Better
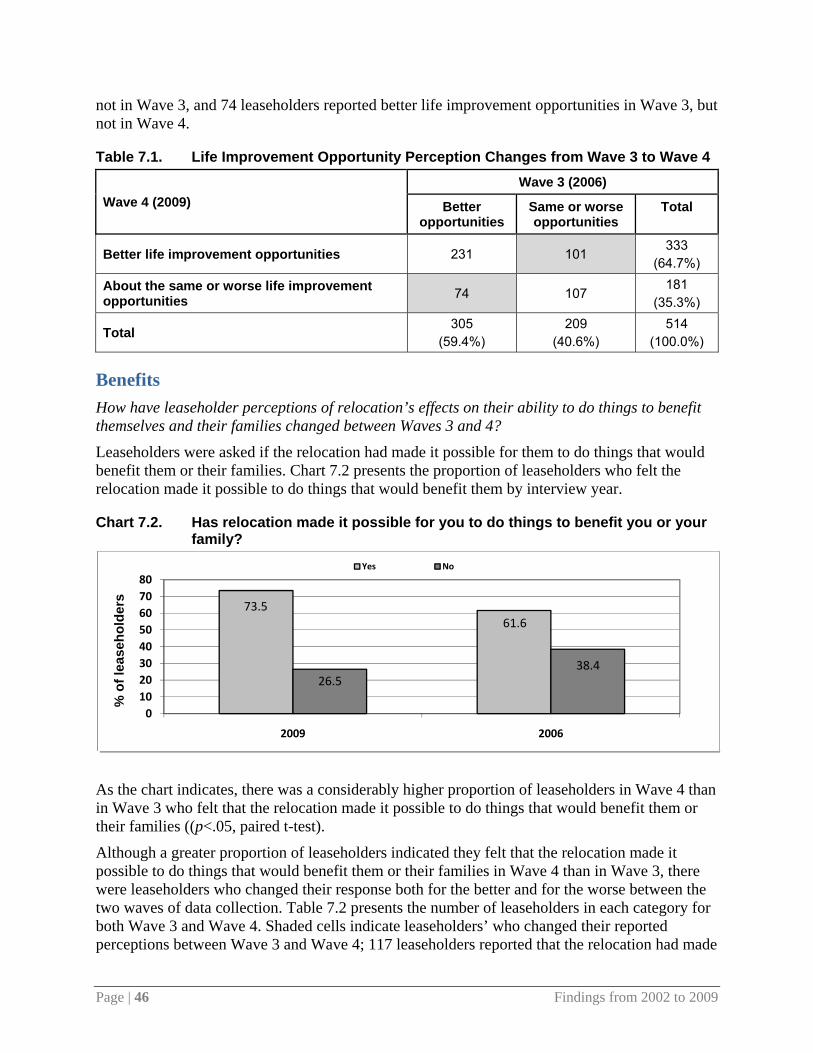
Page | 46 Findings from 2002 to 2009
not in Wave 3, and 74 leaseholders reported better life improvement opportunities in Wave 3, but not in Wave 4.
Table 7.1. Life Improvement Opportunity Perception Changes from Wave 3 to Wave 4
Wave 4 (2009) Wave 3 (2006)
Better opportunities
Same or worse opportunities
Total
Better life improvement opportunities 231 101 333
(64.7%)
About the same or worse life improvement opportunities 74 107
181 (35.3%)
Total 305 (59.4%)
209 (40.6%)
514 (100.0%)
Benefits How have leaseholder perceptions of relocation’s effects on their ability to do things to benefit themselves and their families changed between Waves 3 and 4?
Leaseholders were asked if the relocation had made it possible for them to do things that would benefit them or their families. Chart 7.2 presents the proportion of leaseholders who felt the relocation made it possible to do things that would benefit them by interview year.
Chart 7.2. Has relocation made it possible for you to do things to benefit you or your family?
As the chart indicates, there was a considerably higher proportion of leaseholders in Wave 4 than in Wave 3 who felt that the relocation made it possible to do things that would benefit them or their families ((p<.05, paired t-test).
Although a greater proportion of leaseholders indicated they felt that the relocation made it possible to do things that would benefit them or their families in Wave 4 than in Wave 3, there were leaseholders who changed their response both for the better and for the worse between the two waves of data collection. Table 7.2 presents the number of leaseholders in each category for both Wave 3 and Wave 4. Shaded cells indicate leaseholders’ who changed their reported perceptions between Wave 3 and Wave 4; 117 leaseholders reported that the relocation had made
73.561.6
26.538.4
01020304050607080
2009 2006
% o
f lea
seho
lder
s
Yes No
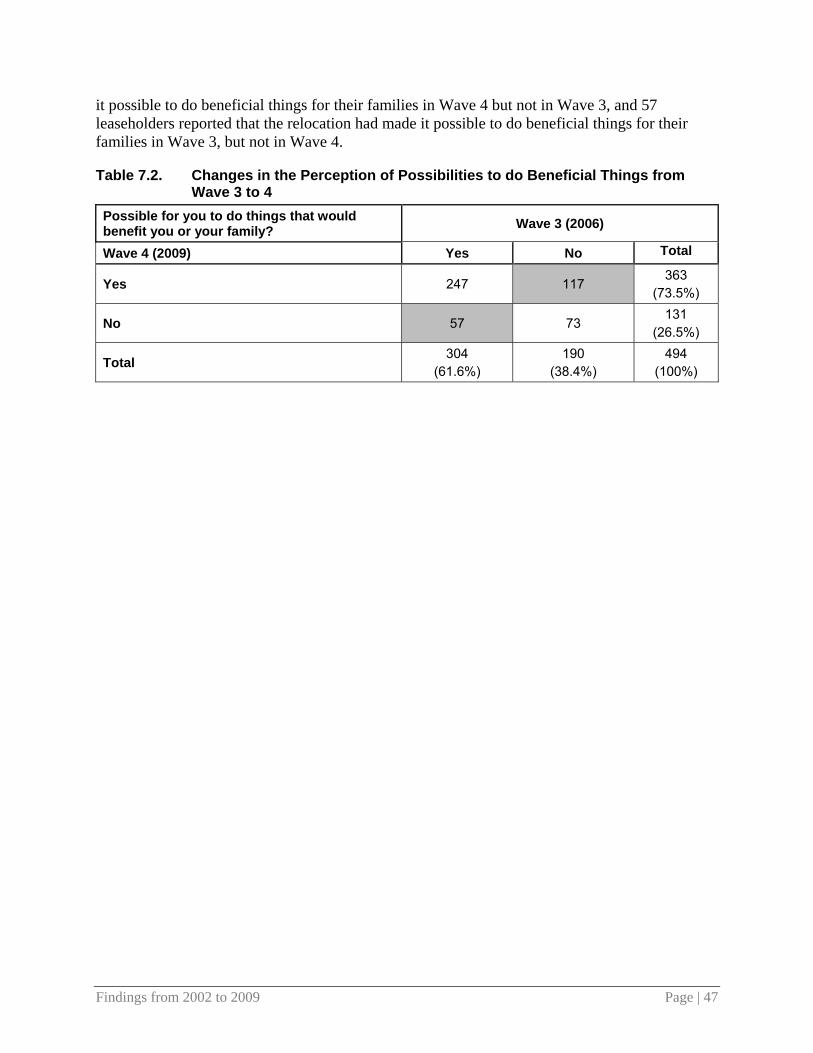
Findings from 2002 to 2009 Page | 47
it possible to do beneficial things for their families in Wave 4 but not in Wave 3, and 57 leaseholders reported that the relocation had made it possible to do beneficial things for their families in Wave 3, but not in Wave 4.
Table 7.2. Changes in the Perception of Possibilities to do Beneficial Things from Wave 3 to 4
Possible for you to do things that would benefit you or your family? Wave 3 (2006)
Wave 4 (2009) Yes No Total
Yes 247 117 363
(73.5%)
No 57 73 131
(26.5%)
Total 304 (61.6%)
190 (38.4%)
494 (100%)

Page | 48 Findings from 2002 to 2009

Findings from 2002 to 2009 Page | 49
Section 8. Baseline Characteristics and Health of Deceased Respondents22
Since the baseline interviews, 70 leaseholders have passed away .23 This section presents the baseline characteristics of the deceased respondents as well as those who are still alive. Attention is given to baseline self-reported health and types of health problems experienced.24 This may shed light on any potential differences between baseline respondents who are now deceased and those who have not passed away.
Key Findings Seventy leaseholders or 6% of respondents passed away since the baseline interviews.
More than half of the deceased (57%) were in Phase III.
At baseline, 13% of the deceased were under age 40 and 7% were younger than 30 years. The deceased group was older than the leaseholders who are not deceased.
As compared to the respondents who were not deceased at the time of the Wave 4 interview, the deceased respondents were:
• Older at the baseline survey.
• More likely to be male.
• More likely to ever have been married.
• Less likely to have completed high school or to have had at least some college education.
• Less likely to be employed.
• Experienced more health problems.
Deceased Respondents Table 8.1 shows the percent of deceased for each phase. At baseline there were 875 Phase II and 363 Phase III respondents, with a total of 1238 cases. About 6% (n=70) have passed away – 30 were in Phase II and 40 were in Phase III. There was a significantly greater number of deceased
22 Data from the Phase II and Phase III baseline datasets were used as some deceased leaseholders were not included in the panel dataset. There were 916 leaseholders from Phase II and 363 from Phase III for a total of 1238 cases.
23 There were 92 deceased leaseholders from the original sample. Among those, 14 were not included in analyses as they were replacement cases or they did not complete the baseline interview. That resulted in 78 valid deceased cases. At baseline, 41 respondents completed both the Phase II and Phase III baseline interviews. These leaseholders were initially part of Phase II of the Plan for Transformation but subsequently were placed by the CHA in Phase III. For these cases, only the Phase III data were used. Eight deceased cases were in both surveys. The final number of deceased cases is 70. 24 Only Phase III leaseholders were asked the baseline questions on health.

Page | 50 Findings from 2002 to 2009
in Phase III than Phase II; mean age was also higher among the deceased in Phase III as compared to Phase II.25
Table 8.1. Number and Percent of Deceased by Phase Phase II Phase III Total
Base n n % Base n N % Base n n % Deceased 875 30 3a 363 40 12a 1239 70 6 Not Deceased 875 845 97 363 323 88 1239 1169 94
NOTE: Table presents unweighted number of cases and weighted percentage. Within a row, cells sharing a superscript letter are significantly different at p<.05, Chi-squared test.
Socio-Demographic Characteristics of the Deceased How do the respondents who are deceased differ in their demographic characteristics from respondents who were not deceased as of the Wave 4 survey?
Table 8.2 presents age data for the deceased and non-deceased respondents. Deceased respondents were significantly older than those who have not passed away. However, 13% of the deceased were under age 40 at baseline and 7% were under age 30.
Table 8.2. Age Characteristics at Baseline
Age Deceased
(n=70) Not Deceased
(n=1169)
Mean age 57.59a 43.31a Standard deviation 17.60 13.94 Minimum 19 18 Maximum 92 88
NOTE: Within a row, cells sharing a superscript letter are significantly different at p<.05,
There were significantly more men among the deceased than the rest of the baseline population (see Table 8.3). At baseline, significantly more deceased were married or had been married in the past than those who had not passed away. Conversely, more non-deceased leaseholders were never married. This could be tied to the older age of the deceased.
While the majority of both groups did not graduate from high school, there were significantly more high school dropouts among the deceased. On the other hand, significantly more non-deceased baseline respondents had some college experience. Only 4% of the deceased were employed compared to 29% of those who have not passed away and the difference is significant. While both groups were poor, with most respondents making an income of less than $8,000, there were significantly more deceased respondents who were poor than the other group.
25 Significance tests were performed and significant results are discussed. However, these results should be interpreted with caution because of the low number of deceased cases. The health results are especially limiting as they only include Phase III respondents.
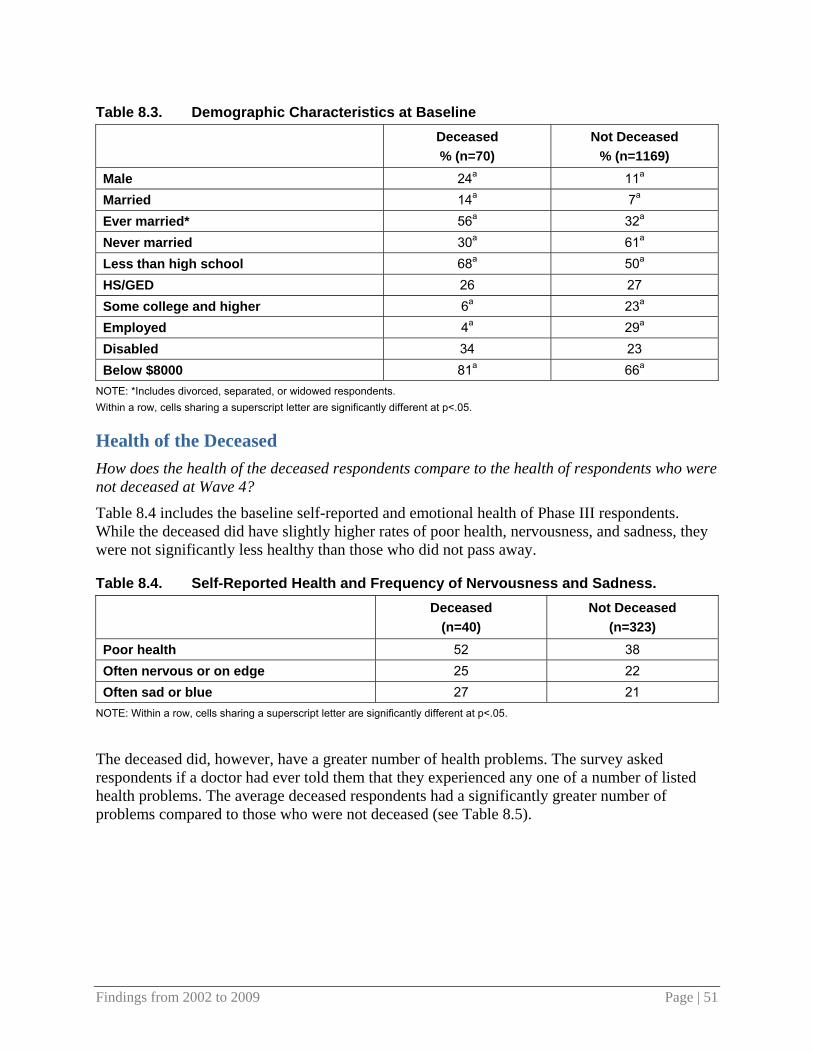
Findings from 2002 to 2009 Page | 51
Table 8.3. Demographic Characteristics at Baseline
Deceased % (n=70)
Not Deceased % (n=1169)
Male 24a 11a Married 14a 7a Ever married* 56a 32a Never married 30a 61a Less than high school 68a 50a HS/GED 26 27 Some college and higher 6a 23a Employed 4a 29a Disabled 34 23 Below $8000 81a 66a
NOTE: *Includes divorced, separated, or widowed respondents. Within a row, cells sharing a superscript letter are significantly different at p<.05.
Health of the Deceased How does the health of the deceased respondents compare to the health of respondents who were not deceased at Wave 4?
Table 8.4 includes the baseline self-reported and emotional health of Phase III respondents. While the deceased did have slightly higher rates of poor health, nervousness, and sadness, they were not significantly less healthy than those who did not pass away.
Table 8.4. Self-Reported Health and Frequency of Nervousness and Sadness.
Deceased
(n=40) Not Deceased
(n=323) Poor health 52 38 Often nervous or on edge 25 22 Often sad or blue 27 21
NOTE: Within a row, cells sharing a superscript letter are significantly different at p<.05.
The deceased did, however, have a greater number of health problems. The survey asked respondents if a doctor had ever told them that they experienced any one of a number of listed health problems. The average deceased respondents had a significantly greater number of problems compared to those who were not deceased (see Table 8.5).
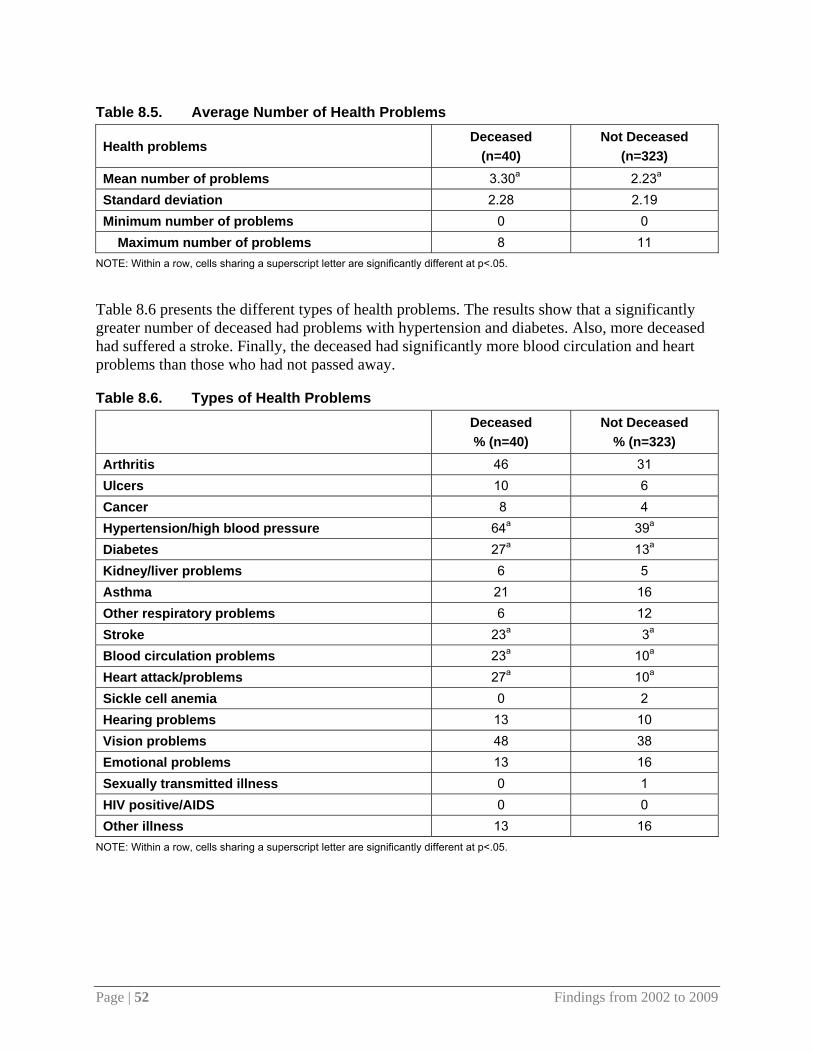
Page | 52 Findings from 2002 to 2009
Table 8.5. Average Number of Health Problems
Health problems Deceased
(n=40) Not Deceased
(n=323) Mean number of problems 3.30a 2.23a Standard deviation 2.28 2.19 Minimum number of problems 0 0 Maximum number of problems 8 11
NOTE: Within a row, cells sharing a superscript letter are significantly different at p<.05.
Table 8.6 presents the different types of health problems. The results show that a significantly greater number of deceased had problems with hypertension and diabetes. Also, more deceased had suffered a stroke. Finally, the deceased had significantly more blood circulation and heart problems than those who had not passed away.
Table 8.6. Types of Health Problems
Deceased % (n=40)
Not Deceased % (n=323)
Arthritis 46 31 Ulcers 10 6 Cancer 8 4 Hypertension/high blood pressure 64a 39a Diabetes 27a 13a Kidney/liver problems 6 5 Asthma 21 16 Other respiratory problems 6 12 Stroke 23a 3a Blood circulation problems 23a 10a Heart attack/problems 27a 10a Sickle cell anemia 0 2 Hearing problems 13 10 Vision problems 48 38 Emotional problems 13 16 Sexually transmitted illness 0 1 HIV positive/AIDS 0 0 Other illness 13 16
NOTE: Within a row, cells sharing a superscript letter are significantly different at p<.05.