residual stress analysis of drive shafts after induction ... · pdf fileresidual stress...
TRANSCRIPT

Materials Research.
Residual Stress Analysis of Drive Shafts After Induction Hardening
Guilherme Vieira Braga Lemosa*, Thomas Karl Hirschb,
Alexandre da Silva Rochaa, Rafael Menezes Nunesa
aPost-Graduation Program in Mining, Metallurgical and Materials Engineering – PPGE3M, Federal University of Rio Grande do Sul – UFRGS, Av. Osvaldo Aranha, 99, Sala 610, Porto Alegre, RS, Brazil
bStiftung Institut für Werkstofftechnik – IWT, Badgasteiner Straße 3, Bremen, Germany
Received: June 24, 2013; Revised: April 18, 2014
Typically, for automotive shafts, shape distortion manifests itself in most cases after the induction hardening by an effect known as bending. The distortion results in a boost of costs, especially due to machining parts in the hardened state to fabricate its final tolerances. In the present study, residual stress measurements were carried out on automotive drive shafts made of DIN 38B3 steel. The samples were selected in consequence of their different distortion properties by an industrial manufacturing line. One tested shaft was straightened, because of the considerable dimensional variation and the other one not. Firstly, the residual stress measurements were carried out by using a portable difractometer, in order to avoid cutting the shafts and evaluate the original state of the stresses, and afterwards a more detailed analysis was realized by a conventional stationary diffractometer. The obtained results presented an overview of the surface residual stress profiles after induction hardening and displayed the influence of the straightening process on the redistribution of residual stresses. They also indicated that the effects of the straightening in the residual stresses cannot be neglected.
Keywords: residual stresses, X-ray diffraction, induction hardening, bending, DIN 38B3
1. IntroductionThe major amount of fatigue cracks is initiated at the
surface or subsurface regions1-5. In fact, the surface area is the region that generally supports the largest load applied during operation being susceptible to adverse environmental conditions. It also may contain defects and residual stresses from the fabrication processes4. The presence of residual stresses can affect the distortion behavior and the ability to sustain applied loads while maintaining structural integrity6.
It is renowned that the induction hardening has been used to increase the hardness, the wear resistance and also to create a martensitic layer in specific areas7. However, it is acknowledged that heat treatment of components not only cause a favorable effects on the material properties but also undesirable dimensional changes which are required to be removed by additional steps in the process (grinding and finishing). These dimensional variations and changes of shape are usually designated as “distortion”8. Each step of the production process can influence distortion, generate a potential distortion and residual stresses which need to be evaluated to guarantee the fatigue resistance of the final component1.
2. Material and MethodsAccording to the final product as an automotive drive
shaft and residual stresses associated with it, sampling was done after induction hardening where the distortion was shown trough of bending. Within a group of samples of the same batch, some were subjected to a step of straightening
while others have reached the final product after a heat treatment without bending. In consequence, two groups of samples were selected: one of them was called IH (only induction hardened and then no bend noted) and the other one was called S (which was also hardened but mainly straightened after an excessive bending). Figure 1 illustrates a schematic diagram of the process and the final conditions analyzed1.
Considering the geometry of the shafts, shown in Figure 2 it is possible to understand the locations where the cuts were made, the subdivisions after cutting, notch and regions of stress measurement. With respect to the measurements of residual stresses, the first way of measurements (samples without cutting) was carried out by the portable diffractometer to guarantee the original state of residual stress. The second way (after cutting) was chosen and performed with a conventional stationary diffractometer in the specific areas as Region 1 (Part 1), Region 2 (Part 2), Region 3 (Part 3) and Region 4 (Part 4). The diameter was 23.3 mm (except in the Areas 0, 1 and 2 which show notch) and the total length around 720 mm1.
The heat treatment of induction hardening for both shafts (IH and S), was conducted with the mode of operation called scanning and rotation. The induction coil ran the whole length while the component was rotating around its own axis.
For the straightening step, which is a specific step to the samples S according with the company’s information, there were mechanical arms on a machine responsible for correcting the excessive dimensional variations, verified by a *e-mail: [email protected]

Lemos et al. Materials Research
laser ray system, with at least 4 attempts to achieve the final drive shaft with the recommended tolerances. These shape distortions have occurred mainly at the center of the samples (Region 2 and Region 3) and were fixed out by mechanical straightening as already mentioned before.
Table 1 shows the chemical composition of the material as a result of an analysis with optical emission spectrometer - Spectrolab model LAVMB08B.
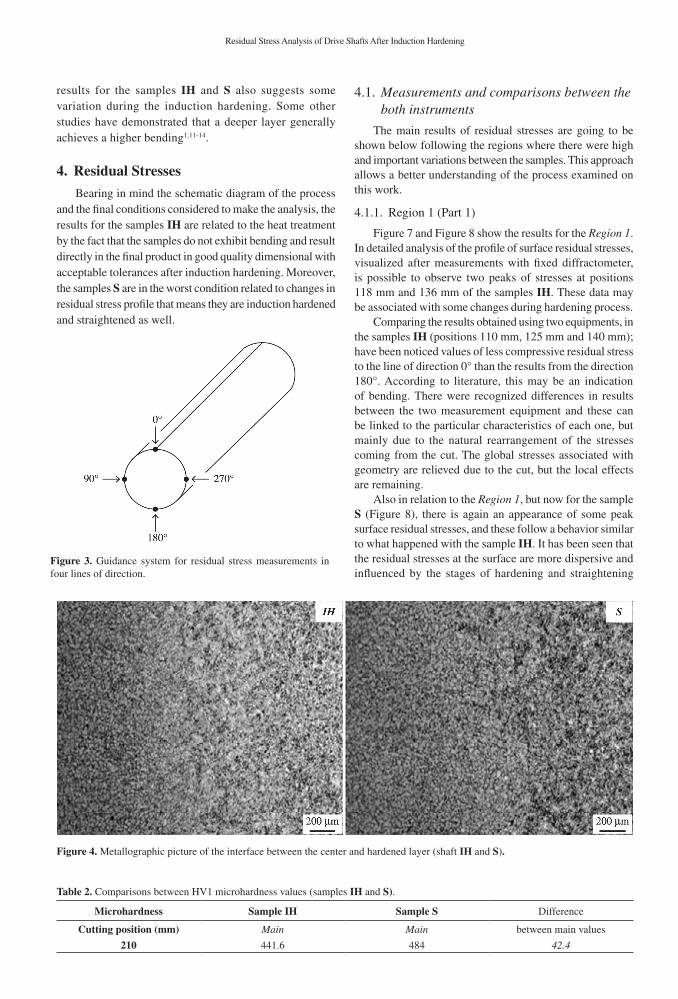
The samples in their original overall length were market immediately after hardening process, but before the cutting as revealed in the Figure 3. This procedure was completed considering all the lines of direction (0°, 90°, 180° and 270°) in order to preserve this orientation of the shafts after cutting and to relate the results of residual stress with both different X-ray equipment (conventional stationary and portable).
With detail to metallographic analysis, the samples were subjected to cutting by EDM, a method that does not cause considerable microstructural variations and big changes in the profile of residual stresses. Following a standard procedure the surface was prepared, chemically attacked with 2% Nital and after that the metallography was done.
The microhardness profiles and analysis of effective case depth were made with a MicroMet 5114 Microindentation Hardness Tester using a load of 1 kg for 74 measurements (from surface to center) according to the standard DIN 50190/2.
In the analysis of the surface residual stresses, done by X-ray diffraction, the samples were measured using ψ diffractometer equipped with X-ray tubes Cr-K and primary
opening with 2 mm diameter. The diffraction lines {211} α-Iron were recorded for 11 tilt angles in the range of 45° < ψ < –45°. The calculation of residual stress was through by the sin2 ψ method with E = 210 000 MPa and ν = 0.281,9. For measurements with the portable diffractometer (before cutting) only 3 measurements were performed in different positions and for the stationary conventional diffractometer (after cutting), 26 measurements were done with 2 mm of distance between them.
3. Results
3.1. Metallographic analysis
The metallographic analysis between the center and the hardened layer is shown in Figure 4. There were verified small variations that may have come from a non-standard heat treatment from an industrial manufacturing line for the same shafts investigated1. There are some indications that the amount of retained austenite (white) is different in both shafts even if it is not quantitatively evaluated on this current research.
3.2. Microhardness profile
The microhardness profile is shown in Figure 5. The HV1 values were similar but not exactly identical for both samples (IH and S). Since the distribution of hardness in the samples is mainly due to the temperature distribution, microstructure and quenching conditions10 and with the final results reached it is noted that heat treatment was not under the same conditions and parameters for the two conditions studied1.
With the values in Table 2, the main values for microhardness were calculated, it is obvious that the samples S reached higher values than the results for the samples IH and the difference between them was 42.4 HV.
3.3. Effective case depth
Figure 6 displays measurements of effective case depth for the two shafts analyzed as follows: 210 mm, 415 mm and 535 mm (cutting regions). Since the components are taken from the same lot and went through the same manufacturing processes, the difference between the
Figure 1. Schematic diagram of the process and conditions analyzed.
Figure 2. Schematic drawing of the shaft.
Table 1. Results of chemical analysis (mass %).
C Si Mn P Cr Ni Al Ti V B
IH 0.31 0.27 0.808 0.0159 0.088 0.069 0.0202 0.0435 0.0029 0.0027
S 0.31 0.27 0.797 0.0161 0.086 0.067 0.0189 0.0436 0.0026 0.0026
Residual Stress Analysis of Drive Shafts After Induction Hardening
results for the samples IH and S also suggests some variation during the induction hardening. Some other studies have demonstrated that a deeper layer generally achieves a higher bending1,11-14.
4. Residual Stresses
Bearing in mind the schematic diagram of the process and the final conditions considered to make the analysis, the results for the samples IH are related to the heat treatment by the fact that the samples do not exhibit bending and result directly in the final product in good quality dimensional with acceptable tolerances after induction hardening. Moreover, the samples S are in the worst condition related to changes in residual stress profile that means they are induction hardened and straightened as well.
4.1. Measurements and comparisons between the both instruments
The main results of residual stresses are going to be shown below following the regions where there were high and important variations between the samples. This approach allows a better understanding of the process examined on this work.
4.1.1. Region 1 (Part 1)
Figure 7 and Figure 8 show the results for the Region 1. In detailed analysis of the profile of surface residual stresses, visualized after measurements with fixed diffractometer, is possible to observe two peaks of stresses at positions 118 mm and 136 mm of the samples IH. These data may be associated with some changes during hardening process.
Comparing the results obtained using two equipments, in the samples IH (positions 110 mm, 125 mm and 140 mm); have been noticed values of less compressive residual stress to the line of direction 0° than the results from the direction 180°. According to literature, this may be an indication of bending. There were recognized differences in results between the two measurement equipment and these can be linked to the particular characteristics of each one, but mainly due to the natural rearrangement of the stresses coming from the cut. The global stresses associated with geometry are relieved due to the cut, but the local effects are remaining.
Also in relation to the Region 1, but now for the sample S (Figure 8), there is again an appearance of some peak surface residual stresses, and these follow a behavior similar to what happened with the sample IH. It has been seen that the residual stresses at the surface are more dispersive and influenced by the stages of hardening and straightening
Figure 3. Guidance system for residual stress measurements in four lines of direction.
Figure 4. Metallographic picture of the interface between the center and hardened layer (shaft IH and S).
Table 2. Comparisons between HV1 microhardness values (samples IH and S).
Microhardness Sample IH Sample S Difference
Cutting position (mm) Main Main between main values
210 441.6 484 42.4

Lemos et al. Materials Research
cannot be neglected and may affect the fatigue life in automotive shafts. The findings of the current investigation can be summarized as follows:
• Theinductionhardeningprocesswasnotthesamefor the shafts considered;
• The additional step of straightening changesthe surface residual stress behavior. Samples straightened showed higher microhardness values, deeper effective case depth and, therefore, these factors contributed to this specific and excessive distortion of shape. It has been seen that there is a considerable influence of each process on the redistribution and changes of surface residual stresses.
AcknowledgmentsThis work is part of the results from BRAGECRIM and
the authors would like to thank CAPES, CNPq, FINEP and DFG for financial support to execute this project.
Figure 5. Microhardness profile (sample IH and S).
Figure 6. Effective case depth (samples IH and S).
Figure 7. Profile of surface residual stresses of the sample IH with measurements in four lines of direction (0°, 90°, 180° and 270°).
Figure 8. Profile of surface residual stresses of the sample S with measurements in four lines of direction (0°, 90°, 180° and 270°).
Figure 9. Profile of surface residual stresses of the sample IH with measurements in four lines of direction (0°, 90°, 180° and 270°).
Figure 10. Profile of surface residual stresses of the sample S with measurements in four lines of direction (0°, 90°, 180° and 270°).
with the values showing a significant variation over the measurement points. Thus, it is possible to say that the level of residual stress is highly variable.
4.1.2. Region 3 (Part 3)
Figure 9 (sample IH) and Figure 10 (sample S) are presenting the surface residual stress profile from areas in the center of the shaft. The straightening process was good to correct the dimensional deviations in the shafts. On other hand, this method makes more intense the redistribution of surface residual stress with the values being more dispersive. Predominantly in this Region 3 there are high stresses modifications between the automotive shafts studied. In practice, in real conditions of service, the largest variation of surface residual stress profile is dangerous, can compromising the fatigue life and may lead to catastrophic fracture1.
5. ConclusionsThe results of the present study showed that there are
important differences for each group of samples which

Residual Stress Analysis of Drive Shafts After Induction Hardening
References1. Lemos GVB. Análise de tensões residuais em eixos automotivos
do aço DIN 38B3 temperados por indução. [Dissertação]. Porto Alegre: Universidade Federal do Rio Grande do Sul; 2012.
2. Dias VW. Estudo comparativo entre processos de revenimento. [Dissertação]. Porto Alegre: Universidade Federal do Rio Grande do Sul; 2010.
3. Weiss K, Rudnev VI, Cook R, Loveles D and Black M. Induction tempering of steel. Advanced Materials & Processes. 1999; 156(2):H19-H23.
4. Soares MB. Influência das tensões residuais no comportamento em fadiga e fratura de ligas metálicas. [Dissertação]. São Paulo: Universidade de São Paulo; 1998.
5. Withers PJ and Bhadeshia HKDH. Residual stress. Part 1: measurement techniques. Materials Science Technology . 2001; 17(4) :355-365. h t tp : / /dx.doi .org/10.1179/026708301101509980
6. Fajdiga G, Glodez S and Kramar J. Pitting formation due to surface and subsurface initiated fatigue crack growth in contacting mechanical elements. Wear. 2007; 262(9-10):1217-1224. http://dx.doi.org/10.1016/j.wear.2006.11.016
7. Rudnev VI, Cook R, Loveles D, Black M and Murray J. Induction hardening basics for iron and steel. Modern Application News. 2000; 58-61.
8. Brinksmeier E, Sölter J and Grote C. Distortion engineering: identification of causes for dimensional and form deviations of bearing rings. CIRP Annals: Manufacturing Technology. 2007; 56(1):109-112. http://dx.doi.org/10.1016/j.cirp.2007.05.028
9. Hauk V. Structural and residual stresses analysis by non-destructive methods. Aachen: Elsevier; 1997.
10. Rudnev D, Loveless R, Cook R and Black M. Handbook of induction heating. New York: Marcel Dekker; 2003.
11. Rocha AS, Nunes RM, Souza TF, Soares CAT, Stephan H, Tekkaya AE et al. Experimental characterization and simulation of a wire drawing process and related distortion potentials. In: 3rd International Conference on Distortion Engineering; 2011; Bremen, Germany.
12. Totten GE. Heat treatment handbook: metallurgy and technologies. USA: CRC Press; 2006.
13. Nunes RM. Estudo de distorção de barras cilíndricas de aço ABNT 1045 em uma rota de fabricação envolvendo trefilação combinada e têmpera por indução. [Dissertação]. Porto Alegre: Universidade Federal do Rio Grande do Sul; 2012.
14. Rocha AS, Nunes RM and Hirsch TK. Analysis by design of experiments of distortion potentials in drawn and induction hardened wire. Materials Research. 2012; 15(2):266-276. http://dx.doi.org/10.1590/S1516-14392012005000020