residual stress and its role in failure - k. n. toosi...
TRANSCRIPT

Residual stress and its role in failure
This article has been downloaded from IOPscience. Please scroll down to see the full text article.
2007 Rep. Prog. Phys. 70 2211
(http://iopscience.iop.org/0034-4885/70/12/R04)
Download details:
IP Address: 213.233.174.211
The article was downloaded on 19/12/2010 at 14:34
Please note that terms and conditions apply.
View the table of contents for this issue, or go to the journal homepage for more
Home Search Collections Journals About Contact us My IOPscience

IOP PUBLISHING REPORTS ON PROGRESS IN PHYSICS
Rep. Prog. Phys. 70 (2007) 2211–2264 doi:10.1088/0034-4885/70/12/R04
Residual stress and its role in failure
P J Withers
School of Materials, University of Manchester, Grosvenor St., Manchester, M1 7HS, UK
E-mail: [email protected]
Received 15 January 2007, in final form 17 September 2007Published 27 November 2007Online at stacks.iop.org/RoPP/70/2211
Abstract
Our safety, comfort and peace of mind are heavily dependent upon our capability to prevent,predict or postpone the failure of components and structures on the basis of sound physicalprinciples. While the external loadings acting on a material or component are clearly important,There are other contributory factors including unfavourable materials microstructure, pre-existing defects and residual stresses. Residual stresses can add to, or subtract from, theapplied stresses and so when unexpected failure occurs it is often because residual stresseshave combined critically with the applied stresses, or because together with the presence ofundetected defects they have dangerously lowered the applied stress at which failure will occur.Consequently it is important that the origins of residual stress are understood, opportunitiesfor removing harmful or introducing beneficial residual stresses recognized, their evolutionin-service predicted, their influence on failure processes understood and safe structural integrityassessments made, so as to either remove the part prior to failure, or to take corrective actionto extend life. This paper reviews the progress in these aspects in the light of the basic failuremechanisms.
(Some figures in this article are in colour only in the electronic version)
This article was invited by Professor C J Humphreys.
0034-4885/07/122211+54$90.00 © 2007 IOP Publishing Ltd Printed in the UK 2211

2212 P J Withers
Contents
Page1. Introduction 22132. Basic principles of residual stress 2213
2.1. Eigenstrains 22132.2. Classifications of residual stress 2214
3. Destructive methods of residual stress measurement 22173.1. Sectioning 22173.2. Hole drilling 22193.3. Slotting methods 22193.4. Contour method 22193.5. Microscale stress measurement for microdevices and coatings 2220
4. Non-destructive methods of stress measurement 22214.1. X-ray diffraction methods 22224.2. Synchrotron x-ray diffraction methods 22234.3. Neutron diffraction methods 22244.4. Other methods 2225
5. Origins of residual stress 22275.1. Plastic deformation 22275.2. Thermal origins 22275.3. Phase transformation 22305.4. Welding and other localized heat treatments 22315.5. Composites and multiphase materials 2233
6. Stress engineering, mitigation and stress relief 22336.1. Annealing/post-weld heat treatment 22346.2. Stress introduction strategies 22356.3. Pre-stretching/stress levelling and shakedown 22376.4. Misfit management for stress control 2239
7. Effect of residual stress on failure 22407.1. Plastic collapse 22417.2. Fracture 22417.3. Fatigue and thermal fatigue 22467.4. Transformation fatigue of smart structures 22517.5. Creep cavitation cracking 22527.6. Stress corrosion 2252
8. Assessment of structural integrity 22538.1. Assessment strategies and codes 22538.2. Designing against fatigue 2255
9. Summary and future directions 2256Acknowledgments 2257References 2257

Residual stress and its role in failure 2213
1. Introduction
The prediction, prevention or postponement of failure in components and structures uponthe basis of sound physics is not just an interesting topic for research, but is essential forthe safe execution of our daily lives (James 1998, Miller 2003). There are many ways inwhich failure can occur including brittle fracture, plastic collapse, fatigue, creep and stresscorrosion cracking. While the external loadings acting on a material or component are clearlyimportant, other factors often play a determining role. In fact when predicting whether andwhen failure will occur it is often the case that the external loading is the most easily consideredfactor. Other contributory factors include unfavourable microstructure, the likelihood of pre-existing defects and residual stresses. The science of fracture mechanics was established toapply the theories of elasticity and plasticity, to consider the effect of microscopic defectsand thereby to predict the macroscopic strength and failure mode. Compared with the roleof defects, the role of residual stress on failure has received relatively little attention. Thisprobably reflects historical difficulties associated with their measurement and prediction. Theirprediction a priori is difficult because they are a product of almost every processing stage inmanufacturing and subsequently evolve during life in-service. Their measurement is hamperedby the fact that they leave no outward sign. They can add to, or subtract from, stresses appliedduring service. Consequently, when unexpected failure occurs it is often because residualstresses have combined critically with the applied stresses, or because they, together with thepresence of unknown defects or poor microstucture, have dangerously lowered the stress atwhich failure will occur.
In view of the above, it is clearly important that the origins of residual stress arerecognized, means for predicting their evolution in-service developed, and their influenceon failure processes understood. In this way residual stresses can be incorporated into safestructural integrity assessments, leading either to removal of the part prior to failure, or tocorrective reparative action when necessary. This review is intended to provide an overviewfor physical scientists of the current understanding of residual stresses, including methodsfor their measurement and prediction. Given that the physical mechanisms underpinning thefracture and strength of solids have not been reviewed in this journal since the excellent paperby Orowan (1948) and much has happened in the interim, the basic foundations of modernfracture mechanics are briefly introduced on the way to examining the effect of residual stresson different failure mechanisms.
2. Basic principles of residual stress
2.1. Eigenstrains
Residual stresses are those stresses which are retained within a body when no external forcesare acting. Residual stresses arise because of misfits (incompatibilities) between differentregions of the material, component or assembly. Perhaps the simplest residual stress fieldis that due to an oversized sphere placed inside a spherical cavity in a large homogeneousbody of the same material. This might occur by cooling a body containing a sphere havinga smaller coefficient of thermal expansion, but the same elastic constants. For solely elasticaccommodation, the included sphere experiences uniform residual compression and the stressin the matrix falls off with distance, r , from the centre of the sphere according to 1/r3. Thesolution to this particular problem was solved by Lame in 1862. Eshelby (1957) developed amore general formulation, the solution of which describes the residual stress arising from theplacement of an arbitrarily misfitting inclusion, �, having the same elastic constants as the
2214 P J Withers
matrix. This approach can be generalized to describe any residual stress field by consideringit as arising from a distribution of inelastic strains within the sample. In essence this is ratherlike superimposing the stress fields arising from a continuous distribution of infinitesimal pointsources, each behaving like anisotropically misfitting spheres. This distribution of inelasticstrain ε∗
kl(x) is often termed the eigenstrain distribution (Mura 1987) and relates directly to theoverall residual stress σij (x) or elastic strain:
σij (x) = −Cijkl
{∫ ∞
−∞Cpqmnε
∗mn(x
′)Gkp,ql(x − x′) dx ′ + ε∗kl(x)
}. (1)
Here Cijkl are the elastic stiffness coefficients, and the Green’s function Gkp(x−x′) representsthe displacement component in the k direction at x when a body force is applied at x′ in the p
direction in an infinitely extended material (Gij,l(x − x′) = ∂/∂xl.(Gij (x − x′)). For any fieldlocation x the integration in terms of x ′ needs to be carried out only over the misfitting region.(i.e. where the eigenstrain is non-zero). Using (1) it is relatively straightforward to calculatethe residual stress field that arises for a given eigenstrain; this represents the forward problem.However, in practice a solution to the much more difficult inverse problem is often desired;namely, we would like to infer the underlying eigenstrain distribution from an incomplete(since they are determined only at a finite number of points with associated measurementerrors) knowledge of the residual elastic strains or residual stresses (Korsunsky et al 2004,Ueda and Yuan 1993). Once a suitable eigenstrain distribution has been found, the completeresidual stress field can be reconstructed through the solution of the forward problem. Mostimportantly, a knowledge of the eigenstrain distribution fully characterizes the residual stressfield allowing its evolution to be predicted, for example as a result of material removal, crackpropagation or heat treatment. Since residual stresses are self-equilibrating, the basic physicallaws of solid mechanics demand stress and moment balance of residual stress everywherewithin the body.
2.2. Classifications of residual stress
Residual stresses can be classified according to the manner in which they arise (e.g. Withersand Bhadeshia 2001), the scale over which they equilibrate (e.g. Noyan and Cohen 1987),or their effect on behaviour (e.g. Bouchard and Withers 2006). The misfits that causeresidual stresses can be introduced in many ways. Perhaps the most common origins arenon-uniform plastic flow, steep thermal gradients and phase transformations as indicated infigure 1.
Across any section through the body the component of the residual stresses normal tothe section must balance; the length over which they do so in any direction is defined as thecharacteristic length, lo. From a measurement perspective, the residual stress component isclassified according to three characteristic length scales. Continuum level stresses that neglectthe underlying microstructure are defined as type I stresses. Typically they equilibrate overa length scale comparable to the extent of the component, or structure, in that direction andare also termed macrostresses. These might arise from plastic bending of a bar for example(as shown in figures 1 and 11). While for microelectronic machines, electronic devices as wellas for long cracks in engineering components, the length scale of these stresses can be verysmall, the key point is that they can be described by continuum mechanics. Microstructurallyrelated stresses that equilibrate on a scale of a few grain diameters are generally termedintergranular stresses or type II microstresses; these tend to arise from inhomogeneity at thegrain scale, for example from differences in slip behaviour from grain to grain. At a finer scalestill are type III microstresses arising from heterogeneous behaviour at the atomic scale, these

Residual stress and its role in failure 2215
Figure 1. Residual stresses arise from misfits, either between different regions of a material orbetween different phases within the material. Examples of different types of residual macro- andmicro-residual stress are illustrated schematically. In each case the process is indicated on theleft, the misfit in the centre and the resulting stress pattern on the right-hand side (Withers andBhadeshia 2001).
might arise from line defects (dislocations), point defects such as might arise from radiationdamage or doping with atoms of a different size.
While the misfit may arise at a particular scale, the occurrence of many misfits at that scalemay have a cumulative effect such that they give rise to stresses at a longer scale. For example,a single edge dislocation inserts a half-plane of atoms into a crystal creating a very local type IIIstress field, while the stress free shapes of the grains in a polycrystal are altered by the passageof many dislocations through their interior on differently oriented slip-planes causing type IIintergranular misfit stresses as they are constrained by one another (figure 1). At a larger scalestill, the cumulative presence of many geometrically necessary dislocations (Ashby 1970) cangive rise to plastic strain gradients and thereby macroscale misfits and stresses of type I. Ina glass type II stresses cannot arise. Here the doping of a glass surface with one K atomcreates a type III microstress, but multiple ion exchange using molten salt baths introducesmany atoms into the near surface region leading to substantial long-range compressive stressin-plane (Kistler 1962, Matthew et al 2003).
The average stress in each phase of a composite can have many of the characteristics ofa long-range stress field, while being a microscale effect. To illustrate this type of residualstress consider the cooling of a matrix (phase 1) containing a single inclusion of another phase(phase 2). Except in the unlikely event that the two phases had the same coefficients of thermalexpansion, this would create a type II stress. For a single spherical inclusion the stress fieldis that derived by Lame (section 2.1). The stress field is essentially insignificant beyond afew particle diameters from the inclusion. However, if the matrix contains many inclusionsof phase 2 then the stress normal to a plane would self-equilibrate over areas larger than somecharacteristic size, Ao. But it is not possible to measure the stresses over an area, except at a freesurface where the residual stress normal to the surface is zero by definition. Integrating over

2216 P J Withers
Figure 2. Neutron strain measurements of the mean Al and SiC longitudinal 111 lattice straincomponents in (a) the aligned whiskers, and (b) the matrix, for an Al/5%SiCW, composite monitoredover a thermal cycle. The arrows show the heating (solid) and cooling (dashed) curves (Witherset al 1987).
a characteristic sampling volume Vo large enough to include representative volume fractions(f1 and f2) of each phase (Noyan and Cohen 1987)∫
Vo
σ1(x, y, z) dV1+σ2(x, y, z) dV2 = f1〈σ1〉 + f2〈σ2〉 = 0, (2)
where 〈σ1〉 and 〈σ2〉 are termed mean phase microstresses by the present author (Withers 1988,Hutchings et al 2005). Since the total stress averages to zero over macroscopic length scales,the stress is correctly classified as a type II stress field and would be invisible to destructivestress measurement techniques. However, the average stresses in the two phases would benon-zero, being compressive in one and tensile in the other. Consequently, methods, such asdiffraction techniques, which sample just one phase would measure a tensile or compressivestress even if the evaluation volume was greater than Vo. As a result they are sometimesmistaken for macrostresses when measuring stress by diffraction (even being termed pseudo-macrostresses (Cullity 1978)). A good example of this effect is provided by the elastic strainsthat arise as a two phase composite is heated/cooled (Saigal et al 1992, Withers 1995) asillustrated in figure 2.
All too often those making stress measurements have failed to consider what lengthscales and types of residual stress are important from a materials or component performanceviewpoint. Unwittingly this can lead to inappropriate measurements and interpretations.
From a physics viewpoint, it is conceptually satisfying to consider the whole threedimensional stress field within a component, as well as the internal misfits (eigenstrains)and externally applied constraints from which they arise. From such a complete knowledgeof the system it is then relatively simple to determine how the component responds and thestresses redistribute if the conditions are changed. However, such detailed information aboutthe whole system can be costly or impractical to obtain. Engineers therefore often concentrateon the stress field local to a region of interest (sub-domain) and try to determine its effecton known or postulated defects (cracks, voids, etc) in the sub-domain. They have foundit useful, from a structural integrity assessment viewpoint, to decompose the residual stressprofile across a region of concern into membrane (i.e. the uniformly distributed stress giving thesame integrated force, f over the sub-domain), σm, through-section bending, σb, relating to the

Residual stress and its role in failure 2217
Figure 3. (a) By definition the net force, F, and moments (M1, M2, M3) over any cut plane arisingfrom a residual stress field must balance as shown here for a seam welded pipe, (b) the force andmoments need not balance however within a sub-domain of interest (where a crack might arisefor example), (c) here the hoop stress field acting on the wall section can be decomposed into themembrane, bending and locally equilibrating components after (Bouchard and Withers 2006).
local bending moment mz and non-linear locally equilibrated, σle, components (Lidbury 1984)as illustrated in figure 3. As shown in section 6.1 this approach is useful because the localdriving force for a crack or flaw can often be expressed simply in terms of the additive effectsof these three components.
3. Destructive methods of residual stress measurement
Destructive methods of residual stress measurement rely on the fact that when a cut is introducedthe object deforms as the necessary components of tractions due to the residual stress fieldreduce to zero at the newly formed surface. Common to all these methods is the reconstructionof the original stress field or eigenstrain distribution, from the observed distortion. Central tothis is the assumption that the redistribution that takes place as a consequence of cutting does soentirely elastically, introducing no further misfit. Many cutting methods if undertaken carefully(e.g. drilling, water jet cutting, electrodischarge machining and focused ion beam milling) canlead to minimal alteration of the eigenstrain except very local to the cut. However, when nearyield stresses are present, removal of constraint may lead to plastic deformation invalidating thetechnique. The Standard Test Method for Determining Residual Stresses by the Hole-Drilling(ASTM E837) specifies that when hole drilling the stresses found should be below 50% ofyield. While corrections can be made for this effect for bulk residual stresses up to about 90%of yield (Beghini et al 1994), this is rarely done in practice.
3.1. Sectioning
One of the earliest ways proposed for measuring residual stresses involves the completeexcavation of blocks upon which strain gauges are attached. It is normally assumed thatthe block is sufficiently small that the residual stress is completely relaxed. An importantquestion is therefore raised as to the maximum size of block for which stresses having a givencharacteristic length, ly , would be essentially relaxed. An answer to this question is obtainedby considering a structure with an idealized sinusoidal stress variation (figure 4) and cuttingout a block of dimensions yo, zo. Clearly the stresses normal to the cut surface must fall tozero at z = 0 on making the cut. To estimate the effect this has on the stresses remaining in the

2218 P J Withers
Figure 4. The relaxation of a sinusoidal stress in the z direction having characteristic length, ly , inthe y direction when a block of length zo is excised, can be estimated by superimposing a sinusoidalvariation of opposite sign at the surface of the block.
interior in the block, one should consider the stress field caused by applying a similar sinusoidalvariation, but of opposite sign, to the surface of an unstressed block of the same dimensions.This stress will tend to decay to zero towards the interior (figure 4). Superimposing the twostress fields reduces the stress at the surface to zero. With the stresses in the interior given byequation (3a) (Nishioka et al 1974, Timoshenko and Goodier 1982).1D sine fluctuation:
σzz(z) =[
1 −(
2π
lyz + 1
)exp
(−2π
lyz
)]A cos
2πx
ly. (3a)
2 perpendicular sine fluctuations:
σzz(z) = [1 − (kz + 1) exp(−kz)]A cos2πx
lxcos
2πy
ly(3b)
where
k =√(
2πx
lx
)2
+
(2πy
ly
)2
.
From this it is clear that for a 1D sinusoidal fluctuation the stress has attained 10% of the bulkvalue by a depth 0.1ly and 80% by 0.5ly . As a result, if the block is equal to the 0.2ly or lythen the centre of the block will be stressed to 10% or 80% of the original stress, respectively.Consequently, provided the block is less than 0.2ly the original stress can be taken to relaxcompletely and the determination of the stress is relatively straightforward. For more complex2D stress fluctuations the effect of the surface falls off more rapidly towards the interior(equation (3b)), requiring shorter blocks for the stress to be stress free.
For excision from a relatively thin (plane stress) plate provided the stress is completelyrelaxed, the original principal stresses can be inferred from strains measured using a standardthree gauge rectangular rosette (0◦, 45◦ and 90◦) from (Schajer 2001):
σmax, σmin = −E
2
(ε3 + ε1
1 − ν∓
√(ε3 − ε1)2 + (ε3 + ε1 − 2ε2)2
1 + ν
), (4)
where σmax and σmin are the maximum and the minimum principal stresses, and ε1, ε2 and ε3 arethe readings from the three strain gauges of the rosette. Schajer (2001) differentiates betweenexcision, for which the removed block is small thus becoming stress free, and sectioning,for which only partial strain relaxations occur and for which more sophisticated analyses arenecessary.

Residual stress and its role in failure 2219
3.2. Hole drilling
The hole-drilling method involves drilling a shallow hole around which the local surfacedeformations are measured by a specially designed strain-gauge rosette. Provided the stressis essentially constant over the drill depth the residual stress that originally existed at the holelocation can then be calculated from the measured strain relaxations ε1, ε2 and ε3 around itusing
σmax, σmin = −E
2
(ε3 + ε1
(1 + ν)a∓
√(ε3 − ε1)2 + (ε3 + ε1 − 2ε2)2
b
), (5)
where a and b are dimensionless calibration constants depending on the diameter and depth ofthe hole (Schajer 1988). It is the most mature (Mathar 1934, Rendler and Vigness 1966) andwidely employed destructive method.
Depth profiling can be undertaken by drilling incrementally while the strains around thehole are recorded. The sensitivity of the method falls off rapidly with increasing depth. Asa consequence the diameter to depth ratio of 1 is a practical limit. Recent bench-marking(Grant and Lord 2002) has been undertaken comparing four techniques for analysing themeasured strain data: the uniform stress, equivalent uniform stress (Vishay 1993), powerseries (Schajer 1981) and Integral methods (Schajer 1988). This has shown that the integralmethod is most applicable for non-uniform stress fields, in particular those where the stressvaries rapidly with depth.
A number of variants in methodology have been developed to extend the hole-drillingmethod to larger depths. The ring-core method (Milbradt 1951) involves attaching a speciallydesigned strain-gauge rosette. Instead of drilling a hole through the centre of the speciallydesigned rosette, an annular groove is milled around a gauge. This creates an essentiallyunconstrained island in the material. Because of this full stress relief at the rosette locationoccurs and equation (5) can be used to infer the stress. Schajer (2001) asserts that in contrast tohole-drilling, the method can be used even when the bulk residual stresses approach the materialyield stress because of the lower levels of stress concentration. The deep hole method is amore recent variant (Leggatt et al 1996). It is an extension of the geological method developedby (Hooker et al 1974) in which a small reference hole is drilled through the thickness to therequired depth. Then a larger diameter core is removed concentric with the reference hole.Changes in the diameter of the reference hole as a function of depth can then be related directlyto the in-plane stress distribution.
3.3. Slotting methods
The slotting method, also called the crack compliance method (Gruver and Buessem 1971,Vaidyanathan and Finnie 1971, Nowell 1999, Prime and Hill 2002), generally provides ameasure of the stress perpendicular to the slot and is applicable when there is little stressvariation parallel to the line of the slot. A slot is cut incrementally and the change in gaugeslocated on both the top (close to the crack) and bottom surfaces recorded. The former has moresensitivity when the slot is shallow and the latter more sensitivity when it is deep (Prime 1999).Various procedures exist for reconstructing the original stress profile (Cheng et al 1991).
3.4. Contour method
This new technique involves making a planar wire electrodischarge cut completely through arigidly held specimen (Prime 2000, 2001). Upon cutting, the relaxation of the out-of-plane

2220 P J Withers
(a) (b)
–100
0
100
200
300
–200
–300
Figure 5. (a) Longitudinal displacement (exaggerated, see 70 µm scalebar) measured on the cutsurface of a new roller straightened rail (after EDM cutting), (b) the component of longitudinalresidual stress in the sample (before EDM cutting) inferred by returning the cut surface to flatness(Kelleher et al 2003).
(a) (b)
Figure 6. (a) Experimentally determined lateral displacement field obtained by image correlationanalysis prior, and subsequent, to slitting superimposed on a SEM image of the slit (slit width300 nm) (Sabate et al 2006) in a 300 nm thick Si3N4 micromachined membrane and (b) 1 µm Alfilm deposited on a 0.6 µm thick Si micromachined cantilever with deflection recorded by SEMsecondary image (McCarthy et al 2000). (a) Reprinted with permission from Sabate et al (2006).Copyright 2006, American Institute of Physics. (b) Reprinted with permission from McCarthyet al (2000). Copyright 2000 Elsevier.
stress component causes the surface to deviate from planarity (figure 5(a)). By measuringthe profile of the newly created surface, the original out-of-plane residual stress can then beuniquely calculated using a finite element model in which the distorted surface is forced backinto a planar state.
3.5. Microscale stress measurement for microdevices and coatings
Many of the destructive methods described above are now being extended down to themicroscale through the availability of dual beam focused ion beam (FIB) micromachining.Using a FIB instrument it is possible to cut, slit, excavate and machine at the nanoscale. Forexample, slotting has been used to examine the stresses in microelectromechanical systems(MEMS) (Sabate et al 2006), as well as in diamond-like films (Kang et al 2003). Deformationis deduced from images acquired before and after cutting via the movement of markers or

Residual stress and its role in failure 2221
by image tracking of the surface. Figure 6(a) shows the lateral deformation on cutting athrough-thickness slot in a 300 nm thick CVD deposited Si3N4 membrane. These membranesare used as mechanical supports in a wide range of membrane-based sensors. Such films aretypically subjected to ion implantation, to reduce the level of tensile residual stresses. Theslotting technique gave residual stresses of 950±40 MPa and 345±10 MPa prior to, and after,ion implantation. Coating stresses have also been estimated from the deflection of thin filmcantilevers (figure 6(b) (McCarthy et al 2000).
4. Non-destructive methods of stress measurement
Diffraction is perhaps the most important non-destructive means of determining residual stressfields within crystalline materials and engineering components. The principle is simple; thecrystalline lattice is used like an atomic strain gauge. Not long after the Braggs had developedLaue’s idea that a crystal would act as a diffraction grating to determine crystal structures in1912, the potential of using the same technique to determine changes in lattice spacing, i.e. tomeasure elastic strain, was appreciated. The underlying equation is Bragg’s equation:
λ = 2dhkl sin θ, (6)
which relates the lattice plane spacing dhkl for the (hkl) reflection to the incident wavelengthλ and the diffraction angle θ , which is equal to half the scattering angle (2θ ). Increases ordecreases in the lattice plane spacing are recorded as angular shifts (θ in radians) in thediffraction peak positions:
εhkl = dhkl − dohkl
dohkl
= −cotθθ, (7)
where dohkl is the strain-free lattice spacing (often referred to as d-zero). Lattice strain is
largely insensitive to the plastic component of strain. This is because dislocation generationand motion is the main mechanism of plastic deformation and while the passage of a dislocationthrough a crystallite causes a permanent shape change once it has passed through, it leaves thelattice spacing unaltered. Of course plasticity does have a second order effect, both due to theconstraint of the deformed grain on its neighbours (intergranular type II stress (section 2.2)),and the strain field local to each dislocation contained within it (type III stress). The (elastic)lattice strain can be related directly to stress using appropriate elastic constants. However,since there are many other factors besides stress that can lead to changes in the measuredlattice spacing (e.g. local changes in composition, changes in temperature or geometricaleffects associated with the sample), great care needs to be exercised during interpretation oflattice spacings in terms of strain (Withers et al 2007).
Three main types of radiation are available with wavelengths suitable for measuring atomiclattice spacings, namely, electron, x-ray photon and neutron beams. The three beams cantravel very different distances into crystalline materials before attenuation becomes significant(table 1) and so their uses are quite different.
The stiffness tensor, C, allows one to determine the stress tensor from the strain tensor.However conversion from elastic lattice strain to stress is complicated by the fact that, exceptfor tungsten which is isotropic, different lattice planes, hkl, have different stiffnesses (e.g. Nye1985, Tome 2001). As a result, in a polycrystal under load all the different grain familiesconstrain one another and are thus differently stressed and elastically strained even prior to theonset of plasticity. These integranular stresses and strains depend on the degree of single crystalanisotropy as well as the texture (degree of preferred orientation of the grains). Diffraction byits very nature selects just one grain family, namely, the one having the appropriate hkl planes
2222 P J Withers
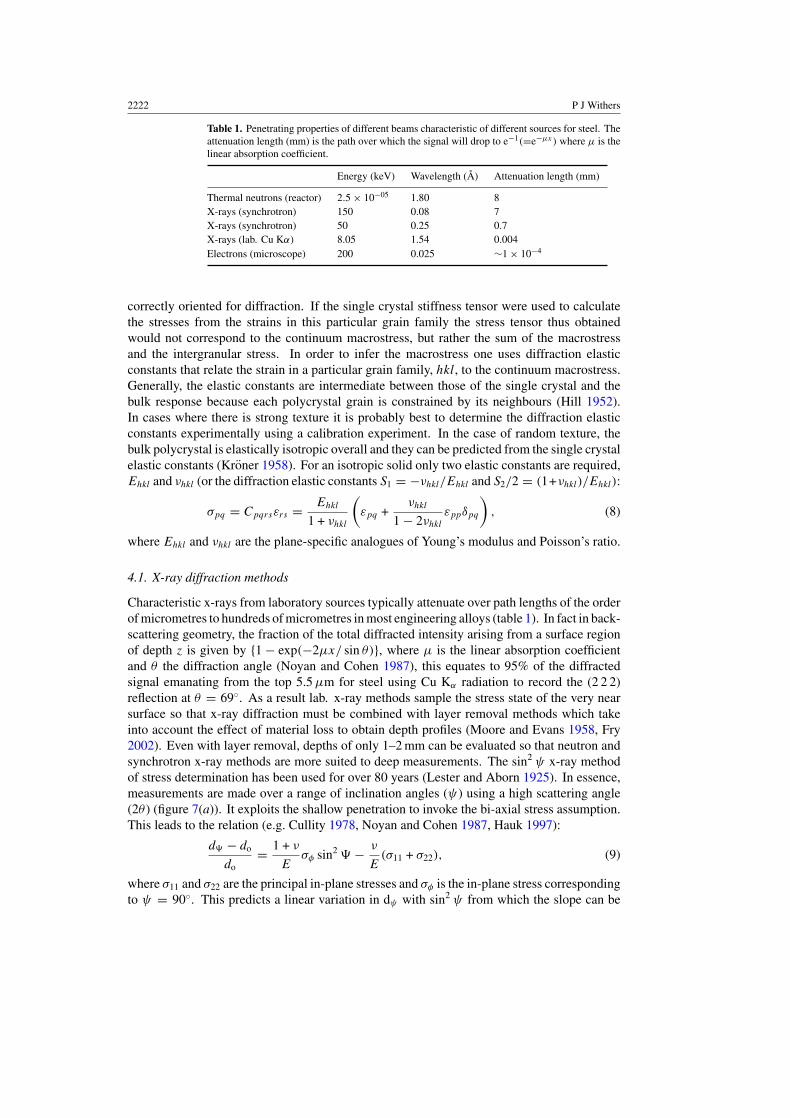
Table 1. Penetrating properties of different beams characteristic of different sources for steel. Theattenuation length (mm) is the path over which the signal will drop to e−1(=e−µx) where µ is thelinear absorption coefficient.
Energy (keV) Wavelength (Å) Attenuation length (mm)
Thermal neutrons (reactor) 2.5 × 10−05 1.80 8X-rays (synchrotron) 150 0.08 7X-rays (synchrotron) 50 0.25 0.7X-rays (lab. Cu Kα) 8.05 1.54 0.004Electrons (microscope) 200 0.025 ∼1 × 10⁻⁴
correctly oriented for diffraction. If the single crystal stiffness tensor were used to calculatethe stresses from the strains in this particular grain family the stress tensor thus obtainedwould not correspond to the continuum macrostress, but rather the sum of the macrostressand the intergranular stress. In order to infer the macrostress one uses diffraction elasticconstants that relate the strain in a particular grain family, hkl, to the continuum macrostress.Generally, the elastic constants are intermediate between those of the single crystal and thebulk response because each polycrystal grain is constrained by its neighbours (Hill 1952).In cases where there is strong texture it is probably best to determine the diffraction elasticconstants experimentally using a calibration experiment. In the case of random texture, thebulk polycrystal is elastically isotropic overall and they can be predicted from the single crystalelastic constants (Kroner 1958). For an isotropic solid only two elastic constants are required,Ehkl and νhkl (or the diffraction elastic constants S1 = −νhkl/Ehkl and S2/2 = (1+νhkl)/Ehkl):
σpq = Cpqrsεrs = Ehkl
1 + νhkl
(εpq +
νhkl
1 − 2νhkl
εppδpq
), (8)
where Ehkl and νhkl are the plane-specific analogues of Young’s modulus and Poisson’s ratio.
4.1. X-ray diffraction methods
Characteristic x-rays from laboratory sources typically attenuate over path lengths of the orderof micrometres to hundreds of micrometres in most engineering alloys (table 1). In fact in back-scattering geometry, the fraction of the total diffracted intensity arising from a surface regionof depth z is given by {1 − exp(−2µx/ sin θ)}, where µ is the linear absorption coefficientand θ the diffraction angle (Noyan and Cohen 1987), this equates to 95% of the diffractedsignal emanating from the top 5.5 µm for steel using Cu Kα radiation to record the (2 2 2)reflection at θ = 69◦. As a result lab. x-ray methods sample the stress state of the very nearsurface so that x-ray diffraction must be combined with layer removal methods which takeinto account the effect of material loss to obtain depth profiles (Moore and Evans 1958, Fry2002). Even with layer removal, depths of only 1–2 mm can be evaluated so that neutron andsynchrotron x-ray methods are more suited to deep measurements. The sin2 ψ x-ray methodof stress determination has been used for over 80 years (Lester and Aborn 1925). In essence,measurements are made over a range of inclination angles (ψ) using a high scattering angle(2θ ) (figure 7(a)). It exploits the shallow penetration to invoke the bi-axial stress assumption.This leads to the relation (e.g. Cullity 1978, Noyan and Cohen 1987, Hauk 1997):
d − do
do= 1 + ν
Eσφ sin2 − ν
E(σ11 + σ22), (9)
where σ11 and σ22 are the principal in-plane stresses and σφ is the in-plane stress correspondingto ψ = 90◦. This predicts a linear variation in dψ with sin2 ψ from which the slope can be

Residual stress and its role in failure 2223
ψ=0
0 40 80 120 160 200 240 280 320-1400
-1200
-1000
-800
-600
-400
-200
0
200
400
Res
idua
l Str
ess
(MP
a)Depth (µm)
725oC 650oC 350oCAs-peened
(a)
(b)
Figure 7. (a) Schematic illustrating the sin2 ψ technique whereby the in-plane stress can be deducedfrom the variation in atomic lattice spacing as the ψ angle is increased. Only grains with the relevantlattice plane spacing normal to the dashed line diffract at any given angle, (b) residual stress as afunction of depth for as-peened Udimet 720Li Ni superalloy and after thermal exposures for 10 hat temperatures between 350 and 725 ◦C measured by x-ray and layer removal. (Kim et al 2005).
used to determine the in-plane stress, σψ . The great advantage of this method is that sincethe strain-free lattice spacing, which is difficult to determine in practice, is a multiplier tothe slope it can be replaced by dψ=0 without significant error (elastic strains are typicallysignificantly less than 1%). A good example of the technique is provided by measurementsof the relaxation of shot peening stresses by elevated temperature exposure of Ni superalloy(figure 7(b) (Kim et al 2005). There are cases where significant gradients in out-of-planestress can arise over the penetration depth (lII < penetration depth), for example, in particulatecomposites and two phase materials (Watts and Withers 1997). Such stress gradients havebeen shown to introduce curvature into the sin2 plot (Noyan and Cohen 1987).
4.2. Synchrotron x-ray diffraction methods
Third generation synchrotron sources such as the European Synchrotron Radiation Facility(ESRF) and the Advanced Photon Source (APS) provide intense beams of high energy x-raysthat are much more penetrating than characteristic lab. x-rays opening up new opportunitiesfor residual strain measurement (Lebrun et al 1995, Daymond and Withers 1996, Websteret al 1996). As a result synchrotron x-ray beamlines are expanding the envelope of sub-surface residual strain measurements, both in terms of spatial resolution (e.g. 0.5 µm strainmeasurement grain by grain in electronic structures (MacDowell et al 2001)), and the extent anddetail that can be mapped. Either single diffraction peaks can be acquired using monochromaticradiation as a function of diffraction angle, or complete diffraction profiles can be acquired at agiven angle (figure 8(a)) using an energy sensitive detector. Analogous to monochromatic andwhite beam time-of-flight methods for neutron diffraction, the former typically achieves thebest diffraction peak resolution, as well as providing the opportunity to insert an analyser crystalbefore the diffracted beam reaches the detector. This significantly reduces the sensitivity of thediffraction peak shifts to incomplete gauge filling as occurs when the gauge enters or leavesthe sample (Withers 2003). The latter records many diffraction peaks simultaneously and sois well suited to dynamic in situ residual stress studies for example looking shape memoryrelated transitions. It has the added advantage that it is less sensitive to textural changes and

2224 P J Withers
-0.75
-0.50
-0.25
0.00
0.25
0.50
0.75
1.00
-0.75
-0.50
-0.25
0.00
0.25
0.50
0.75
1.00
y(m
m)
-0.5 0.0 0.5
-0.5 0.0 0.5
x (mm)
-41
72
185
299
412
525
638
752
865
-0.6
-0.4
-0.2
0.0
0.2
0.4
0.6
0.8
1.0
-0.6
-0.4
-0.2
0.0
0.2
0.4
0.6
0.8
1.0
y(m
m)
-0.5 0.0 0.5 1.0
-0.5 0.0 0.5 1.0
x (mm)
-349
-291
-233
-176
-118
-60
-2
40
(111)
14012010060 80C
ount
s (a
rb u
nits
)
Energy,keV
(311)(220)
(200)
(222)
Wavelength,Å0.31 0.21 0.16 0.100.12 0.09
(a)
(b) (c)
Figure 8. (a) Typical spectrum collected on beamline ID15A at the ESRF in energy-dispersivemode at 2θ = 5◦ for the specimen studied in (b, c), (b) elastic crack opening (y direction) stresses(in MPa) mapped using a 25 µm beam in a 12 mm thick Al–Li compact tension fatigue cracked testspecimen 100% over-loaded to a stress intensity of 2Kmax = 13.2 MPa m1/2 and (c) the residualstresses after unloading to Kmin = 0.6 MPa m1/2 caused by the overload event. The crack isapproximately located at (0,0) (Steuwer et al 2007).
all the diffraction peak positions can be refined simultaneously to provide a measure of thebulk elastic strain for which the elastic constants representative of the bulk can be used to inferstress. Typically the diffraction angles are small due to the short wavelengths associated withthe high energies needed for bulk studies.
Figures 8(b) and (c) exemplify what can be achieved showing how a 100% overload eventduring fatigue cycling introduces residual stresses in the vicinity of the fatigue crack at themid-plane of a 12 mm thick Al–Li alloy compact tension sample at a lateral spatial resolution(25 µm). Note that the crack is located at approximately x = 0 mm indicating compressiveresidual strains in figure 8(c), both across the crack flanks (x < 0 mm) and just ahead of thecrack (x > 0 mm). This is also shown in the linescans shown in figure 31. Grain size restraintsmean that this lies close to the spatial limit of what can be achieved using powder diffractionmethods to study crack-tip stress fields deep within materials (Steuwer et al 2007).
4.3. Neutron diffraction methods
Thermal neutron beams are very penetrating (table 1) on account of the fact that the particlesare chargeless. Their potential for residual strain measurement has been recognized since theearly 1980s (Allen et al 1981, Pintschovius et al 1981). Because neutron fluxes are typicallyorders of magnitude less than synchrotron x-ray photon fluxes; experiments are best suited toacquiring line profiles or limited 2D scans using millimetre sized gauge volumes, rather thandetailed 2D/3D maps at sub-millimetre resolution. Single peak measurements can be made

Residual stress and its role in failure 2225
(a)(b)
Figure 9. (a) Stacked neutron diffraction patterns over part of the time-of-flight range collectedfor superelastic NiTi samples deformed at 160 MPa confining pressure. The changing relativeproportion of the austenite and martensite phase is apparent in the changing peak intensities, whilethe increasing elastic strain in each phase is visible as a shift in peak position (Covey-Crump et al2006) and (b) the repartitioning of phase specific strains in oriented γ and γ ′ grains in polycrystallineNi-base superalloy, CM247 LC having 65% volume fraction of the γ ′ phase, during the tertiarystage of creep at 425 MPa and 900 ◦C (Ma et al 2005).
using a monochromatic beam (suited to reactor sources), or multiple peak profiles acquiredsimultaneously at set angles in ‘time-of-flight’ mode, typically at pulsed spallation neutronsources (Hutchings et al 2005). In the latter case the wavelength of each detected neutron isinferred from its time-of-flight, t , and the path length, Ln, from moderator to detector;
λ = ht/mnLn, (10)
where mn is the mass of the neutron and h Planck’s constant. Because thermal neutrons arehighly penetrating, samples can be studied in situ under complex environmental conditionswhich are inaccessible or too hostile for other methods. For example much work hasbeen done under hydrostatic pressures, elevated temperatures and loading cycles (seefigure 9).
4.4. Other methods
There are many other means of evaluating the residual stress. These rely on the fact that someother property is related to the stress, e.g. Raman excitation or photoluminescence (Mollis andClarke 1990, Young 2001), magnetic response in magnetoelasticity (Hyde et al 2000, Buttleand Scruby 2001, Han et al 2002) (e.g. Barkhausen noise, magnetic permeability, etc) orelectrical properties (Schoenig et al 1995, Blaszkiewicz et al 1996, Blodgett and Nagy 2004),speed of sound in acoustoelasticity (Pao et al 1984, Guz and Makhort 2000), optical propertiesin photoelasticity (Patterson 2001) and temperature change due to adiabatic heating inthermoelasticity (Wong 2001, Quinn et al 2004). On the plus side many of these are non-destructive, portable and relatively cheap to apply. However, in most of these cases it is

2226 P J Withers
Figure 10. (a) Hardness and coercivity for 4360 steel following homogenization at 1000 ◦C, waterquenching and tempering (Buttle et al 1987). (b) In-plane anisotropy of Barkhausen emissionmeasurements made as a function of applied uniaxial stress for steel subjected to various peaktemperatures and cooling rates in order to simulate heat affected zone microstructures (Buttle andScruby 2001). Note how the martensitic phase is largely insensitive to stress.
difficult to derive their quantitative relationship to stress from first principles; instead thesemethods tend to rely on calibration experiments to extract the relationship between measuredvariables and stress (e.g. magnetics, Raman) and to account for microstructural and chemicaldependencies.
By way of an example consider the magnetic response. The interaction between theatomic moments in the lattice causes their alignment into magnetic domains (ferromagnetism),which in turn generates a small strain in the lattice (magnetostriction). This couplingbetween strain and domain orientation means that under stress, it becomes energeticallyfavourable for the orientation distribution of magnetic domains to change, so that in steel(positive magnetostriction), the magnetization vector points towards the tensile axis therebyreducing the magnetoelastic energy. However, this redistribution of domains tends to increasemagnetostatic energy so that a balance between these terms is achieved. The changes inmagnetic domain distribution mean that magnetic hysteresis, permeability and remanence areall functions of the stress tensor. Critically other factors such as texture, phase transformations,the presence of alloying elements, plastic strain and geometrical effects can also affect theresponse necessitating careful interpretation and meaning that it is not possible to quantifythe relationship between primary magnetic parameters and stress without experimentation. Agood example is provided by the magnetic behaviour of 4360 (0.5% C) steel as a functionof tempering following water quenching from 1000 ◦C (Buttle et al 1987). As quenched, thelargely martensitic structure exhibits a high coercivity (figure 10(a)). With increasing growth offerrite and precipitation of cementite the coercivity falls significantly. An added complicationin the magnetic case is that it is not generally possible to measure primary magnetic parameters(coercivity, remanance, etc) at a point within a component and thereby evaluate stress. Rather,less direct measures of the magnetic response, such as Barkhausen noise (BN), stress inducedmagnetic anisotropy and directional effective permability are recorded (Buttle and Scruby,2001). These are instrument specific and this is hampering the development of an unambiguous,universally agreed approach to magnetic stress measurement. BN comprises essentially

Residual stress and its role in failure 2227
electromagnetic pulses arising from irreversible domain wall movements under an appliedmagnetic field (Tiitto 1977, Buttle et al 1987). It depends upon the domain distribution andhence the stress state. The domain wall pinning sites can be dislocations, second phases orgrain boundaries. Consequently this technique is particularly sensitive to the microstructureand mechanical properties of the material (Buttle and Scruby 2001) (figure 10(b)). Because ofthe difficulties associated with unequivocal interpretation of the signals in terms of particularstress components, many of these methods are best suited to specific applications, where thelikely microstructural effects have been well characterized.
5. Origins of residual stress
5.1. Plastic deformation
In a real material plastic deformation is never completely homogenous. Deformation at theatomic scale takes place by the movement of discrete line defects (dislocations) through thecrystallite. Of course there are many other reasons why deformation may be inhomogeneous,for example at the intergranular level due to differences in slip behaviour between differentlyoriented grains, termed plastic anisotropy (Clausen et al 1999, Pang et al 1999), or thedifference between different phases (Noyan and Cohen 1985, Withers and Clarke 1998), or atthe macroscale due to local differences in the yield stress, the existence of stress concentrators(e.g. holes, geometrical features, etc), or to the external application of non-uniform loads.Probably the simplest way to introduce a residual stress plastically into a body such as a baris to bend it beyond the elastic limit. This was one of the first residual stress distributionsto be evaluated by neutron diffraction (Pintschovius and Jung 1983) (see figure 11). Forgeometrical reasons the total strain across the bar must vary linearly as represented by thedashed line. Within the elastic region the lattice strain and strain gauge response agree. Oncethe yield stress is exceeded on the outer surfaces the plastic zones expand inwards; such thatthe elastic strain represented by the lattice strain and the plastic strain equal the total strain.The resulting plastic strain misfit between the outer regions and the elastically strained interioris maintained on elastic unloading such that the bar remains permanently bent, as recorded bythe strain gauge and a characteristic zig-zag residual strain profile results. The compressivelystrained (LHS) region has tensile residual strains while the tensilely strain region (RHS) iscompressively strained.
5.2. Thermal origins
Thermal misfit stresses arise due to temperature gradients within a body. Consider forexample, rapid cooling (quenching); the exterior which cools fastest would contract naturallydue to the decrease in temperature were it not for the resistance offered by the warmerinterior. This generates tensile stresses in the exterior and compressive stresses in the interior.Normally, these stresses are transient disappearing when the body as a whole reaches the sametemperature. If on the other hand the gradients are sufficiently severe (thereby generatingsignificant stresses), or the yield stress of the interior very low (due to the elevated temperature),then non-uniform plastic deformation may occur in regions where the yield stress is exceeded.Once cooled to a uniform temperature these permanent misfits generate a characteristic residualstress. This method is used commercially to introduce compressive in-plane surface stressesin thermally toughened glass. The sequence of stress profiles as the glass is cooled rapidlyfrom above the glass transition temperature is shown in figure 12(a). Once cooled theseresidual stresses are not evident from the appearance of the glass, but radically affect the

2228 P J Withers
-4 -2 0 2 4
Position (mm)
-4000
Str
ain(
10-6
)
-6000
4000
2000
0
-2000
6000
Straingauge
Calc
X-ray
Plastic PlasticElastic8000
-8000
Neutron
Plasticstrain
Plasticstrain
Load
ed
Unload
ed
Figure 11. Lattice strain variation across an aluminium alloy bar loaded with a bending moment(163 Nm) exceeding the yield point of the material: filled symbols denote measurements underload, open symbols measurements after the load had been released; the dashed line denotes theengineering strain under load and the dashed–dotted line the residual strain predicted on the basisof elastic–plastic bending (Pintschovius and Jung 1983).
failure behaviour of the glass leading to a characteristic mosaic crack that runs through theinterior of the glass pane. Because it is the elastic strain energy that provides the energy toproduce such a network of cracks, the residual stress can be estimated from the average size ofthe pieces (Bilby 1980). Using a typical value for the fracture energy R ≈ 10 J m−2, and theresidual mid-plane tensile stress σ T ≈ 50 MPa (figure 12(a)), then the stored elastic energyper square metre, ∼ (1 − ν)(σ T2
/E)d , of a plate of thickness d is equal to the work (4R/x)d
needed to shatter it into pieces of size x. This simple analysis gives t σ T2x a constant, or
equivalently fragment mass ∼x2 ∼ 1/σ T4as shown in figure 12(b), with a typical fragment
size around 10 mm. Similar stresses are introduced in age-hardenable Al alloys as a necessaryconsequence of the quenching stage used as part of the precipitation hardening sequence.These stresses can cause distortion when the billet is machined to final shape. This representsa serious problem in the aerospace industry.
Thermal misfit stresses are generated at a finer scale (type II level) whenever a twophase material is heated or cooled (figure 2) no matter how evenly it is cooled. This isalso true for single phase non-cubic crystal structure materials because thermal expansion isanisotropic at the single crystal level (Nye 1985). These stresses can combine with preferredgrain orientations introduced by deformation processing to give rise to severe thermal cycling

Residual stress and its role in failure 2229
16s
8s
5s
2s
0s
12s
40
-40
-80
-120
0Str
ess,
MP
a
140
105
7056
42
28
14
Mid
-pla
ne s
tres
s, M
Pa
0.04 1.80.18 0.36 0.72
4.8mm
5.5mm
Sheet
9.5mm
6.3mm
3.2mm
Plate
Fragment mass/thickness (g/mm)
(σT)4m/t=const
Time
(a) (b)
Figure 12. (a) Temporal evolution of thermal stresses across a 6.1 mm plate plate during quenchingfrom 738◦C (Narayana and Gardon 1969), (b) correlation between mid-plane tensile stress andfragment mass in thermally quenched glass (Barsom 1968).
Figure 13. The effect of 850 thermal cycles between 50 and 600 ◦C on α-uranium bars 25 mmin diameter, originally smooth and of equal length. The different extent of their distortion is dueto differences in preferred polycrystal orientation arising from their original mode of fabrication(from left to right, as-cast, hot rolled, cold swaged) (Pugh 1958).
distortion effects in uranium (figure 13). Similarly hexagonal lithium aluminium silicate hasexpansion coefficients of +6.5 × 10⁻⁶ and −2.0 × 10⁻⁶ K−1 across and perpendicular to thebasal plane, meaning that as a polycrystal it has a very low thermal expansion coefficient overallmaking it a good choice for ceramic hobs as used on domestic cookers (Newey and Weaver1990). By engineering a fine grain size it is possible to minimize the scale of the intergranularthermal stresses and limit the size of intrinsic flaws which tend to scale as the grain size fromwhich failure might initiate.

2230 P J Withers
5.3. Phase transformation
Newnham states (Newnham 1998); ‘One of the qualities that distinguishes living systems frominanimate matter is the ability to adapt to changes in the environment. Smart materials have theability to perform both sensing and actuating functions and are, therefore, capable of imitatingthis rudimentary aspect of life.’ Many ‘smart’ materials rely on solid state transformationsthat occur displacively. Displacive transformations are characterized by a rapid distortionof the crystal lattice from one structure to another, thereby generating a misfit between thetransformed and untransformed regions which may give rise to residual stresses (Mori andWithers 2001) as well as a sudden macroscopic shape change. The most well known exampleof a displacive transformation is provided by the martensitic transformation in steel. In orderto minimize the residual stress (elastic energy) the martensite nucleates as lenticular plateswith a twinned structure.
Currently, there is much interest in the potential of ‘smart’ materials that switch ortransform under:
• deformation, including TRIP steels (Cherkaoui et al 1998, Oliver et al 2002, Zrnik et al2005), superelastic (Vaidyanathan et al 1999) and shape memory materials (figure 14)(Dunand et al 1996, Berveiller et al 2004, Hornbogen 2004, Kaouache et al 2004, Oliveret al 2005),
• temperature (thermally activated shape memory materials) (figure 15(a)) (Liu et al 2005,Karaca et al 2003),
• electric fields (ferroelectrics, piezoelectrics (figures 15(b) and (c)) (Huber and Fleck 2001,Hall et al 2005, Li et al 2005)) and
• magnetic fields (Inoue et al 2002).
Potential applications include (Van Humbeeck 1999); robust spectacle frames, mobile phoneantennae, ear phones (these all exploit the superelastic effect), heat-recoverable couplings,heat-to-shrink fasteners, dematable connectors (based on the thermal shape memory effect(see figure 15(a))), medical devices such as stents and thermally, electrically and magneticallyactivated domain switching in actuators and dampers.
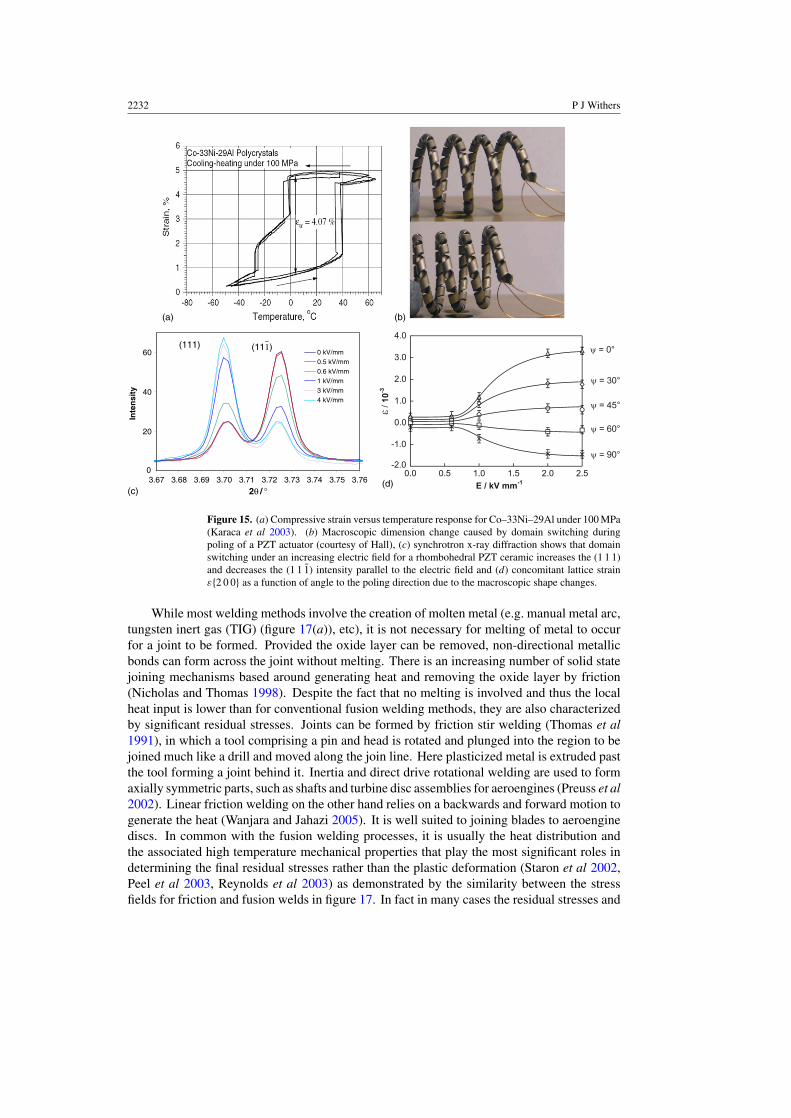
Diffraction is well suited to the monitoring of such transformations and for assessing theirrelated residual stresses. This is because the phase selectivity of diffraction allows the trackingof both the extent of the transformation, through the integrated intensity of the transformingphase reflections, and the associated residual stress levels through the peak shifts (figure 9(a)).Synchrotron and neutron diffraction have the advantage that the transformation can be studiedin the bulk, where the constraint is largest. This is well illustrated by the work of Vaidyananthanet al (1999) on superelastic Ni–Ti (figure 14), and Hall et al (2005) on lead zirconate titanate(PZT) (figure 15). In the former, The austenite is randomly oriented in the unloaded conditionand remains so at least till superelastic straining begins. Upon further increasing the load,the remaining austenite exhibits increasing texture as martensite is formed because of itspreferential transformation (figure 14(c)). In the ferroelectric example, the reorientation ofthe spontaneous polarization, through an angle of either 71◦ or 109◦, results in an increasein the fraction of ferroelectric domains oriented along the electric field direction (ψ = 0◦).Consequently, the relative intensity of the (1 1 1) diffraction peak increased relative to thatof the (1 1 1) peak in the XRD patterns recorded at ψ = 0◦ (figure 15(c)). The oppositeeffect is observed in the patterns obtained at ψ = 90◦. The domain switching process isalmost complete for the {1 1 1} grain family at a field of 2.5 MV m−1. On the microscopiclevel, the poling strain of a grain, εP, caused by ferroelectric domain switching, depends on itsorientation, ψ , relative to the direction of the applied electric field. Each grain experiences a

Residual stress and its role in failure 2231
0.010.050.0250
1000
800
600
400
200
Macro compressive strain
appl
ied
com
pres
sive
str
ess
(MP
a)
0.020.005 0.0150 0.025
0.2
0.4
0.6
0.8
1
mar
tens
ite v
olum
e fr
actio
n
unloading
loading
200
8
6
4
2
Degrees from loading axis
Mar
tens
ite (
100)
tim
es r
ando
m
0
40 8060
martensite 540 MPa
martensite 480 MPa
1.2
1
0.8
0.6
1.4
Aus
tens
ite (
100)
tim
es r
ando
m
austensite 569 MPa
austensite 8 MPa
Superelastic strain
Superelasticstrain
Figure 14. (a) Superelastic deformation in Ni–Ti, (b) extent of austenite to martensitetransformation as a function of superelastic strain and (c) (1 0 0) martensite (——) and austenite(- - - -) diffraction peak intensity distributions with increased loading as determined by neutrondiffraction (Vaidyanathan et al 1999).
misfit strain, ε∗, and hence residual stress given by the difference between its individual polingstrain, εP, and the macroscopic strain of the polycrystal, 〈ε〉.
ε∗ = εP − 〈ε〉. (11)
These results show that the strain of a grain along 〈2 0 0〉, which would be unaffectedby changes in its ferroelectric domain population in a ‘free’ (unconstrained) state, developsa large tensile component along the macroscopic polar axis on poling (figure 15(d)). Thiselastic strain along 〈2 0 0〉 is directly related to the preferred orientation caused by ferroelectricdomain switching in the surrounding grains, which on average become elongated.
5.4. Welding and other localized heat treatments
In section 5.2 it was pointed out that whenever a material is exposed to severe thermal gradientsthere is an opportunity for non-uniform plastic deformation: this situation is characteristic ofwelding. The local thermal excursion usually causes plastic strain in the weld metal andbase-metal regions near the weld (figure 16) (Masubuchi 2003). These give rise to residualstresses as well as to local shrinkage and distortion. It should also be borne in mind that thematerials microstructure is likely to be sub-optimal locally in that the parent microstructurehas usually been optimized to peak condition by careful processing, while the extreme localthermal excursion is likely to have led to a less favourable microstructure from a performancepoint of view (e.g. softer or less tough). Given this and the fact that joints are often sites ofstress concentration these residual stresses are commonly a cause of cracking and prematurefailure of welded structures. Typically, the residual stress in the weld is largest along the lengthof the weld in the weld metal and heat affected zone, often being limited by the yield stress asthe weld metal cools (figure 16).
Given the very large number of variables involved in welding (torch properties, liquidmetal behaviour, solidification, material softening, thermal contact to jig, jigging constraint,etc) it is not currently possible to predict the stresses caused by welding a priori (Zacharia et al1995). Instead the process physics is usually simplified (e.g. neglecting the behaviour of themelt, simplifying the heat input, etc). Consequently thermocouple measurements are normallyused to determine parameters such as torch efficiency and the efficacy of heat transfer fromthe welded joint. In addition post-mortem measurements of the fusion zone have been used tohelp determine certain welding parameters (Kumar and DebRoy 2004).
2232 P J Withers
0
20
40
60
3.67 3.68 3.69 3.70 3.71 3.72 3.73 3.74 3.75 3.76
2θ / °
Inte
nsi
ty
0 kV/mm0.5 kV/mm0.6 kV/mm1 kV/mm3 kV/mm4 kV/mm
(111) (111)
(a)
(c)(d)
(b)
Figure 15. (a) Compressive strain versus temperature response for Co–33Ni–29Al under 100 MPa(Karaca et al 2003). (b) Macroscopic dimension change caused by domain switching duringpoling of a PZT actuator (courtesy of Hall), (c) synchrotron x-ray diffraction shows that domainswitching under an increasing electric field for a rhombohedral PZT ceramic increases the (1 1 1)and decreases the (1 1 1) intensity parallel to the electric field and (d) concomitant lattice strainε{2 0 0} as a function of angle to the poling direction due to the macroscopic shape changes.
While most welding methods involve the creation of molten metal (e.g. manual metal arc,tungsten inert gas (TIG) (figure 17(a)), etc), it is not necessary for melting of metal to occurfor a joint to be formed. Provided the oxide layer can be removed, non-directional metallicbonds can form across the joint without melting. There is an increasing number of solid statejoining mechanisms based around generating heat and removing the oxide layer by friction(Nicholas and Thomas 1998). Despite the fact that no melting is involved and thus the localheat input is lower than for conventional fusion welding methods, they are also characterizedby significant residual stresses. Joints can be formed by friction stir welding (Thomas et al1991), in which a tool comprising a pin and head is rotated and plunged into the region to bejoined much like a drill and moved along the join line. Here plasticized metal is extruded pastthe tool forming a joint behind it. Inertia and direct drive rotational welding are used to formaxially symmetric parts, such as shafts and turbine disc assemblies for aeroengines (Preuss et al2002). Linear friction welding on the other hand relies on a backwards and forward motion togenerate the heat (Wanjara and Jahazi 2005). It is well suited to joining blades to aeroenginediscs. In common with the fusion welding processes, it is usually the heat distribution andthe associated high temperature mechanical properties that play the most significant roles indetermining the final residual stresses rather than the plastic deformation (Staron et al 2002,Peel et al 2003, Reynolds et al 2003) as demonstrated by the similarity between the stressfields for friction and fusion welds in figure 17. In fact in many cases the residual stresses and

Residual stress and its role in failure 2233
Figure 16. Schematic representation of changes of (b) temperature and (c) longitudinal thermalresidual stresses during bead-on-plate welding (Masubuchi 2003).
microstructure can be well predicted using thermal models that neglect the plastic deformationcompletely, but consider the heat thus generated in much the same way as a torch inputs heatinto a traditional welding process (Richards et al 2006, Steuwer et al 2006). A review of weldmodelling issues is provided by Zacharia et al (1995).
5.5. Composites and multiphase materials
Composites are inherently heterogeneous and so there are many opportunities for misfits to arise(Withers et al 1989). Amongst others, these may be due to differences in the elastic behaviour(Allen et al 1992), plastic deformation (Cheskis and Heckel 1968, Wilson and Konnan 1964)and coefficient of thermal expansion (see figure 2) (Withers et al 1987, Saigal et al 1992).In many aspects of mechanical performance, it is the heterogeneity in the stress between thephases that is critical in characterizing composite behaviour. As discussed in section 2.2 greatcare must be taken when selecting an appropriate method to measure the residual stresses sincethey arise at all length scales. If the gauge volume is small then the stress in an individual fibre(type II stresses) may be measured, for example using micrometre resolution Raman analysis(Huang and Young 1994) or synchrotron diffraction (Sinclair et al 2005). If the gauge is large(∼mm), but sensitive only to a single phase, such as the case for neutron diffraction, the averagemean phase stress is measured (Allen et al 1992), while destructive methods tend to measurethe phase independent macrostress (Cowley and Beaumont 1997, Retraint and Lu 2000) anexception to this being the finescale cutting of a 200 µm tungsten fibre Kanthal matrix systemdescribed in (Prime and Hill 2004).
6. Stress engineering, mitigation and stress relief
Residual stresses are often regarded as unwanted and detrimental. However, as reviewed byHurrell et al (Hurrell et al 2006) in respect of power plant, there are many ways either to reducepotentially harmful residual stresses, or to introduce beneficial residual stresses to prolong life.

2234 P J Withers
(a)
(b)
Figure 17. Comparison of the through-thickness longitudinal stresses measured by synchrotrondiffraction in (a) 3 mm thick conventional Al 2024 TIG fusion welded plate (Withers and Webster2001), and (b) the AA6082 side of a 3 mm thick Al 5083/Al 6082 friction stir welded jointusing a tool with a 6 mm pin and 18 mm diameter shoulder rotating at 840 rpm and travellingat 100 mm min−1 (Steuwer et al 2006). Being a dissimilar weld the stresses on the non-age-hardenable 5083 side of the weld are somewhat different in magnitude. In both welds the weldstarted around x = 10 mm.
6.1. Annealing/post-weld heat treatment
Residual stresses are commonly relaxed by stress relief annealing. Indeed, post-weld heattreatments (PWHT) are routinely applied to welds in safety critical plant. Ideally the wholebody is uniformly exposed using slow heat-up/cool-down rates that are slow (1 ◦C h/25 mmthickness in steel (Hurrell et al 2006)). At least two stress relief mechanisms are important;plasticity caused by the reduced yield stress at elevated temperature which occurs essentiallyinstantaneously as the temperature increases, and creep mechanisms which occur over a longerperiod of time. It should be noted that because plastic strain is deviatoric in nature, thehydrostatic component of the misfit cannot be relieved by local plastic flow but requires largerscale rearrangement. Usually the aim is to relieve stress without significantly altering theunderlying microstructure. If the temperature is too high then recrystallization might occurchanging properties such as the yield stress which may not be desirable. For a given situation,precise estimation of the rate and nature of the three dimensional relaxation of misfit andthereby residual stress requires numerical modelling as well as a detailed appreciation ofthe available mechanisms. At an engineering level, it is useful to have simple relations

Residual stress and its role in failure 2235
0.40 5 10 15 25 30 35
0.5
0.7
0.6
Cold work, %
Fra
ctio
n o
fres
idua
l str
ess
reta
ined
shot peenedlaser peened
0.8
1.0
0.9
gravity peened
Figure 18. Correlation of cold work and fraction of near surface residual stress retained in shotpeened, laser peened and gravity peened IN718 after 10 min at 670 ◦C (Prevey 2000).
for identifying suitable post-weld heat treatments for relaxing, perhaps, unknown levels ofresidual stress. Holzapfel et al (1998) took a simple empirical approach based on the Avramirelation to obtain an approximate measure of the extent of stress relaxation at a peenedsurface. Taking stress relaxation to be caused by thermally activated processes, it can beapproximated by
σ rs(T , t)
σ rso
= exp
(−
[C exp
(−H
kT
)t
]m)(12)
with σ rs(T , t) the residual stress value after annealing at temperature T (in K) for the timet (min), σ rs
o the initial near surface residual stress, H the activation enthalpy for the actualresidual stress relaxation process (=3.3 eV for AISI 4140 stainless steel), m (=0.122) anexponent, C (=1.22×10²¹ min−1) a rate constant and k the Boltzmann constant. This relationmay have wider utility in estimating the rate of relief of a local maximum stress. For stainlesssteel this relation gives a 50% reduction after 5 h at 750 K or 8 min at 800 K (note Tm = 1750 K).For some specific materials and conditions, for example certain steels used in pressure vesseldesign specified PWHT guidelines exist, e.g. (ASME 2004). In certain cases it is not practicalto treat the whole component. Local PWHT is not as effective as global treatment; care mustbe taken to ensure a sufficiently large region is heated. For a weld or weld repair to a tube theheating band surrounding the weld is recommended to be greater than 2.5
√(Rt) where R and
t are the tube diameter and thickness, respectively (Hurrell et al 2006). There is some evidencethat in situations such as peening where there may be significant levels of cold work, that thestored energy may affect the thermal stability of the residual stresses (figure 18). This needsto be borne in mind if relations such as equation (12) are being used to assess the longevity ofbeneficial residual stresses, and highlights the wisdom of validating PWHT procedures withactual measurements to assure their effectiveness.
6.2. Stress introduction strategies
One of the most effective means of prolonging the fatigue life of a component is by placing thesurface in residual in-plane compression (figure 19(a)). Most commonly this is achieved by theintroduction of plasticity local to the surface region. Traditionally this has been achieved byshot peening, whereby the surface is repeatedly impacted by hard millimetre sized ‘shot’. Eachimpact introduces local plasticity and the net effect is a compressive residual in-plane stress
2236 P J Withers
(a) (b)
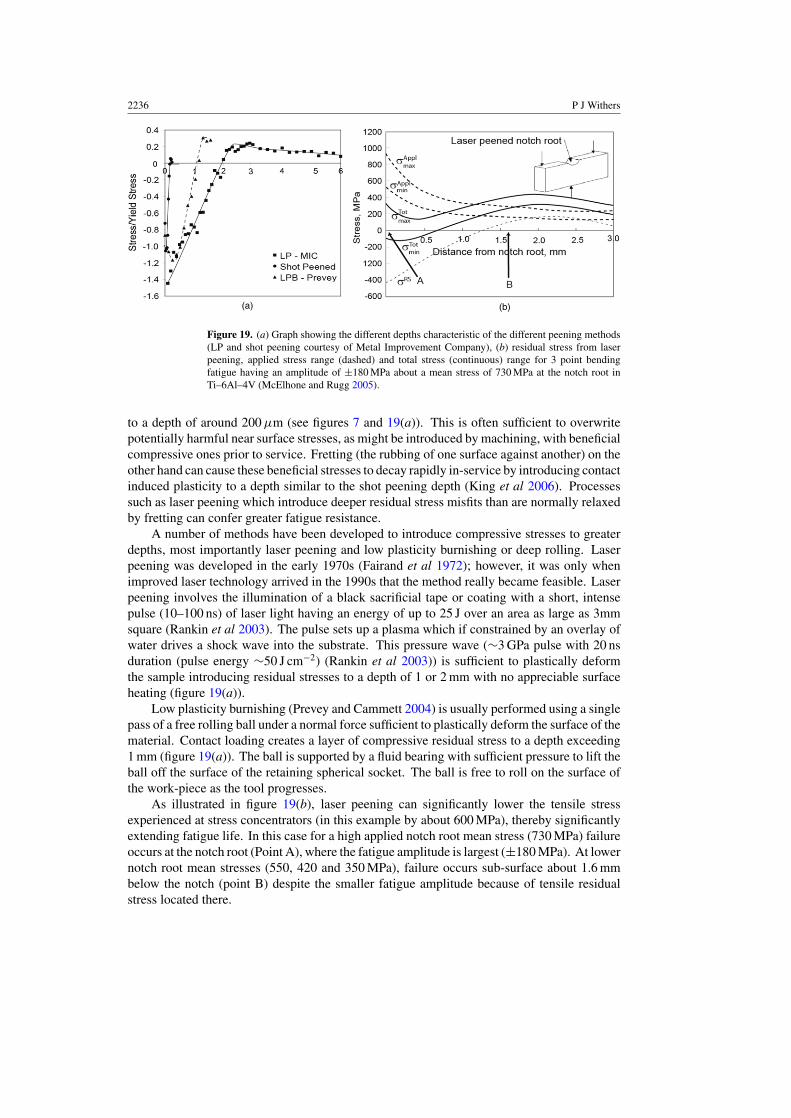
Figure 19. (a) Graph showing the different depths characteristic of the different peening methods(LP and shot peening courtesy of Metal Improvement Company), (b) residual stress from laserpeening, applied stress range (dashed) and total stress (continuous) range for 3 point bendingfatigue having an amplitude of ±180 MPa about a mean stress of 730 MPa at the notch root inTi–6Al–4V (McElhone and Rugg 2005).
to a depth of around 200 µm (see figures 7 and 19(a)). This is often sufficient to overwritepotentially harmful near surface stresses, as might be introduced by machining, with beneficialcompressive ones prior to service. Fretting (the rubbing of one surface against another) on theother hand can cause these beneficial stresses to decay rapidly in-service by introducing contactinduced plasticity to a depth similar to the shot peening depth (King et al 2006). Processessuch as laser peening which introduce deeper residual stress misfits than are normally relaxedby fretting can confer greater fatigue resistance.
A number of methods have been developed to introduce compressive stresses to greaterdepths, most importantly laser peening and low plasticity burnishing or deep rolling. Laserpeening was developed in the early 1970s (Fairand et al 1972); however, it was only whenimproved laser technology arrived in the 1990s that the method really became feasible. Laserpeening involves the illumination of a black sacrificial tape or coating with a short, intensepulse (10–100 ns) of laser light having an energy of up to 25 J over an area as large as 3mmsquare (Rankin et al 2003). The pulse sets up a plasma which if constrained by an overlay ofwater drives a shock wave into the substrate. This pressure wave (∼3 GPa pulse with 20 nsduration (pulse energy ∼50 J cm−2) (Rankin et al 2003)) is sufficient to plastically deformthe sample introducing residual stresses to a depth of 1 or 2 mm with no appreciable surfaceheating (figure 19(a)).
Low plasticity burnishing (Prevey and Cammett 2004) is usually performed using a singlepass of a free rolling ball under a normal force sufficient to plastically deform the surface of thematerial. Contact loading creates a layer of compressive residual stress to a depth exceeding1 mm (figure 19(a)). The ball is supported by a fluid bearing with sufficient pressure to lift theball off the surface of the retaining spherical socket. The ball is free to roll on the surface ofthe work-piece as the tool progresses.
As illustrated in figure 19(b), laser peening can significantly lower the tensile stressexperienced at stress concentrators (in this example by about 600 MPa), thereby significantlyextending fatigue life. In this case for a high applied notch root mean stress (730 MPa) failureoccurs at the notch root (Point A), where the fatigue amplitude is largest (±180 MPa). At lowernotch root mean stresses (550, 420 and 350 MPa), failure occurs sub-surface about 1.6 mmbelow the notch (point B) despite the smaller fatigue amplitude because of tensile residualstress located there.

Residual stress and its role in failure 2237
500
0.5
Depth (mm)
-200
-100
0
100
200
300
400
3.0 0 1 2 3 4 52.52.01.51.0
Res
idua
l str
ess
(MP
a) 250 MPa
385 MPa420 MPa
As-rolled
0
No of cycles(104)
450
400
350
300
250
Res
idua
l str
ess
(MP
a)
90
Dis
loca
tion
dens
ity (
1010
cm
-2)
60
65
70
75
80
85
Dislocation density
Residual stress
(a) (b)
Figure 20. (a) Effect of different stress amplitudes after 10 000 cycles on rolled mild steel EN3b,(b) effect of the number of ±250 MPa cycles on residual stress and dislocation density, as measuredby diffraction peak line profile analysis (Walker et al 1995).
6.3. Pre-stretching/stress levelling and shakedown
Mechanical deformation has been identified as a means of reducing the shape misfits betweenregions and thus of reducing levels of residual stress. Most methods involve either local orglobal plasticity. There has been interest in vibrational stress relief (VSR) procedures by whichthe component is vibrated at stresses below the elastic limit. It has been suggested that thisprocedure can relieve residual stresses and thereby lead to reduced distortion upon machining.In particular attention has been focused on weld stresses treated by VSR either post-welding(Munsi et al 2001b) or during welding where microstructural changes in the weld region havealso been observed (Munsi et al 2001a). Although there have been a number of companiesoffering this treatment, to date documentary evidence is mixed; sometimes indicating relief,in other cases showing no effect. Mechanisms proposed for stress relief include local plasticdeformation, for example in low yield stress weld metal (Aoki et al 2005), ‘energy’ absorption(Claxton and Lupton 1991) and phase transformation (Munsi et al 2001c). In many cases thestress amplitude applied is large (∼200–400 MPa) (Walker et al 1995) introducing significantplastic strain (figure 20(b). Indeed Sendek (1997) suggests that amplitudes of at least 50% ofyield are necessary for relaxation of type I stresses, although for steels at least, lower levelsmay activate type II stresses due to martensitic phase changes. There is also some evidence thatexposure to low frequency alternating magnetic fields can cause a levelling of the dislocationdistributions and thus aid stress relief (Wu et al 2003).
It is indisputable that significant local or global plastic straining under external loadingcan be effective at relaxing residual stress (Sauer 1964, Burdekin 1969, Smith and Garwood1990, Prime and Hill 2002). This is because the plastic strains typically introduced by suchtreatments are much larger than the initial eigenstrains (∼tenths of a per cent) associated withresidual stresses and so largely control the final stress state. For example, the residual stressesintroduced in plate as a result of the Al7050 T74 designation heat treatment (solution heat-treated at 470 ◦C for 1 h, water quenched and then aged for 5 h at 120 ◦C and at 177 ◦C for10 h) are about half the quoted yield stress (414 MPa) corresponding to a maximum eigenstrainaround 0.3%. The +51 Temper designation involves a uniaxial 1.5–3% stretch, and as is clearfrom figure 21, this largely eliminates the original eigenstrain variation by preferential plasticextension in the tensile (central) region until the stresses are approximately level across theplate (essentially no remaining eigenstrain) and the plate then stretches uniformly therebyreducing the residual stresses to a tenth of their original level on removal of the load.

2238 P J Withers
(a) (b)
Figure 21. Residual stresses in 7050-T74 Al plate in the rolling and transverse directions (a) priorto and (b) after a stress relief stretch as measured by the crack compliance technique (Prime andHill 2002). Note the different stress scales used in (a) and (b).
Figure 22. (a) Residual strains around a 4% cold expanded 12 mm hole (quarter not shown forclarity) in an 11 mm thick 7010-T7651Al plate measured by synchrotron diffraction at the ESRF(the 6-fold symmetry may be due to texture in the plate—courtesy P J Webster and D J Hughes),(b) Hoop strains measured laterally from the bore by synchrotron diffraction in a pre-cracked 4%cold expanded specimen (shown inset) unloaded, moderately loaded (125 MPa) and heavily loaded(250 MPa) showing the cracks to be held closed at 125 MPa (Stefanescu et al 2004).
Beneficial long-range residual stresses can be introduced by non-uniform plasticdeformation using processes such as autofrettage for gun barrels (Hearn 1977, Webster andEzeilo 2001), cold-hole expansion of fastener holes (Stefanescu et al 2004), over-pressurizingpressure vessels (Leggatt and Davey 1988), etc. All are based around the same principle;namely to permanently enlarge a hole or cavity such that plastically deformed material isconstrained by neighbouring elastically deformed material thereby creating a compressivehoop stress on the misfitting region local to the cavity (figure 22(a)). The compressive residualstress limits the extent of tensile loading experienced in-service by the material around thecavity thereby inhibiting the nucleation and growth of fatigue cracks (see figure 22(b)).
Local plastic deformation can alter the residual stress state during fatigue cycling and thismust be taken into account when predicting life. A good example is provided by the shakedown

Residual stress and its role in failure 2239
700
200
300
400
500
600
100 101 102 103 104 105 10610-∞
TransLong
BotTop
No of complete cycles
Com
pres
sive
str
ess
(MP
a)
Hal
f cyc
le
σmax=±700MPaAppl
Figure 23. The effect of bending fatigue on the residual stress introduced into AISI 4140 steelby peening. During the first half cycle the top surface was loaded in longitudinal compression to700 MPa; the bottom in tension to the same load.
of peening induced compressive stresses during cycles which include a compressive loadingphase. As shown in figure 7 peening can introduce compressive in-plane stresses approachingthe yield stress, and this combined with the Bauschinger effect (a tendency of a lowering ofthe yield stress upon reversing the direction of loading), can mean that a relatively low appliedcompressive stress can cause local plasticity in the near surface region (Holzapfel et al 1998).This reduces the misfit and thereby the residual stress during the compressive part of the firstcycle (see figure 23). Cao et al (1994) building on the work by Kodama (1972) identifiedtwo distinct stages for the relaxation. The first stage has been termed previously ‘elasticshakedown’ and it occurs over the first loading cycle in figure 23. It arises because the residualstresses combine with the applied stresses to cause local plastic yielding. Holzapfel (Holzapfelet al 1998) also noted that the extent of in-plane stress relaxation was greater parallel to theapplied load than perpendicular to it. The second stage is characterized by a slow decreaseof the residual stress, and has been ascribed in part to cyclic softening. Analytical (Holzapfelet al 1998, Zhuang and Halford 2001) and numerical (Meguid et al 2005) models to describethe plastic relaxation have been developed for the fatigue of shot peening stresses.
6.4. Misfit management for stress control
As we have seen many processes generate the plastic misfits (eigenstrains) that cause residualstress. By understanding how they are generated, in certain circumstances it is possible toprevent such misfits arising. A good example of this is the management of the misfits generatedduring welding by thermal or mechanical tensioning to produce low residual stress welds. Ithas long been known that thermal and mechanical tensioning techniques can reduce residualstresses and the tendency for buckling. The first application of temperature gradients to achievereduced residual stresses was probably by Greene and Holzbaur (1946) on longitudinal buttwelds in ship hull structures in 1946. The basic principles behind weld tensioning may besummarized as follows. The tensile residual stress peak usually found in the vicinity of theweld line (e.g. figure 16) is produced during cooling of the weld and arises from the compressiveplastic flow local to the weld zone that occurs when it is much hotter than the parent material

2240 P J Withers
-100
-50
0
50
100
150
200
250
300
Str
ess
(MP
a)
0 20 40 60 80 100
Distance from weldline (mm)
5%
10%
20%
30%
Figure 24. Longitudinal residual stress profiles at the mid-length of a friction stir weld between1 m long Al7449 12 mm thick plates, as a function of applied tensioning level (% of RT yield stress)determined using high energy x-ray diffraction. Note for reasons of clarity the full width (153 mm)of the plates is not shown (Altenkirch et al 2007).
(see above). All tensioning methods rely on controlling the accumulation of this plastic misfit.A number of thermal techniques have been proposed including global heating (Burak et al1977), localized cooling, referred to as heat-sink welding (HSW) (Barber et al 1981, Yanget al 2000) and localized heating (McGuire and Groom 1979, Michaleris and Sun 1997, Dydoet al 1998, Dydo and Cheng 1999, Dull et al 2001). Mechanical tensioning systems havealso been used, for example, Yang et al (1998) used a pair of rollers placed either sides ofthe weld to mechanically compress the weld locally on cooling, reducing both residual stressand buckling distortion, while Altenkirch et al (2007) have studied global tensioning duringwelding to reduce the stresses (figure 24).
7. Effect of residual stress on failure
Just as residual stresses can operate over a range of scales, from below the grain scale tothe scale of the complete structure, failure can also occur at the materials level, or at thefull structural level. The former tends to be associated with the micromechanisms of failureat the microstructural scale and is the focus of the materials scientist, the latter associatedwith structural integrity at the continuum level and lies within the domain of the materials orstructural engineer. For example, the nucleation of cavities at elevated temperature under creepdriven by residual stress is a materials failure mechanism (see section 7.5), only when manycavities have linked up to form a long crack does it threaten to lead to structural failure. Infact in section 7.3 cracks are categorized either as short microstructurally dependent cracks, orlong cracks described by continuum engineering fracture mechanics. As discussed below, shortrange (type II or III) residual stresses can combine with materials microstructural influencesto initiate and seriously accelerate the growth of short cracks. These short cracks tend to beprecursors to larger cracks that are the concern of the structural failure assessment approachescovered in section 8. As discussed below, for composites and smart materials, failure at thematerials level can lead to significant changes in the structural performance. In the formercase for example, fibre/matrix interfacial debonding, if correctly engineered, can significantlyimprove the fatigue crack resistance (section 7.3). For shape memory based actuators,increasing irreversibility of the transformation with cycling, can significantly degrade their

Residual stress and its role in failure 2241
response (section 7.4). As a consequence, performance optimization is dependent on a goodknowledge of both the likely residual stresses and the basic materials physics and engineeringacross the relevant microstructural and continuum scales.
7.1. Plastic collapse
In simple terms plastic collapse occurs when the stress exceeds the yield criterion over a sub-domain of the component. Engineers tend to define primary and secondary stresses based onwhether they affect structural plastic collapse. The former are required to satisfy equilibriumexternally (Roche 1989) and arise from imposed loading, including dead weights, internalpressures, etc although very long-range residual stresses such as fit-up stresses in pipeworkare sometimes included. Secondary stresses on the other hand are shorter range stresses (weldresidual stresses, etc) caused by misfit (eigen) strains within the body. Upon loading to plasticcollapse primary stresses are redistributed, but not relieved. In contrast during general yielding,large scale plastic deformation tends to overwrite the eigenstrains associated with the secondarystresses. As a result secondary stresses do not contribute to plastic collapse (Lidbury 1984).It should be noted that in certain cases residual stresses which are self-equilibrating over theentire structure may still result in plastic collapse in the net section around a crack-like flaw.This can occur when the flaw is small compared with the spatial extent (Lo) of the residualstress distribution, or there is significant elastic follow-up (see below) from the surroundingstructure. In these cases, the residual stress should be treated as a primary stress.
7.2. Fracture
Common to all fast fractures is the catastrophic propagation of a crack from an initialmicroscopic defect or flaw. Historically, Griffith (1920) made a major step forwards whenhe realized that rather than consider the stress field around the tip of a growing crack (which isinfinite anyway for a perfectly sharp crack in an elastic medium) it is more helpful to considerthe energy associated with crack propagation. For a crack length 2a in the centre of a platethickness t under a far-field mode I1 (one) crack opening stress σ∞, as the crack grows strainenergy, U(=−C · t ·σ 2
∞πa2/E′), is released, but in forming the crack energy, S (=2G · t · a),must be expended, where E′ is the Young’s modulus, E, under plane stress conditions (σzz = 0)and E/(1 − ν2) under plane strain conditions (εzz = 0). G, the energy to create unit area ofcrack, is a material property, which for glass is very small (∼15 J m−2), essentially equal to thesurface energy required to create the new surface, compared with copper (∼106 J m−2) whichabsorbs a lot of energy by local plasticity as the crack grows (Ashby and Jones 1980). For asmall crack, the energy released will be less than the energy absorbed and the crack will bestable. As the crack extends the quadratic dependence of the strain energy means that there isa critical crack length at which the energy release rate (per unit increase of crack area) is equalto the rate of release of stored elastic strain energy.
∂S
∂a+
∂U
∂a= 0 giving 2Gc = C
σ 2∞πac
E′ . (13)
At this point the crack becomes critical and the crack will grow catastrophically under thisstress level. The energy release rate per unit area of crack created at this point is defined as thecritical energy release rate or toughness, Gc and ac the critical flaw size for the applied stress.From a design viewpoint one might ensure that the working stress is sufficiently small that the
1 The I indicates mode I loading; i.e. a (crack opening) load acting normal (along y) to the crack faces.

2242 P J Withers
critical flaw size is well within detectable limits by NDT. Equation (13) leads to
Yσ∞√
πac =√
E′Gc, (14)
where Y is a geometrical factor (quoted in handbooks (Tada et al 1985, Fett and Munz 1997))often close to 1. The left-hand side of equation (14) gives the combination of stress and flawsize that is critical for crack growth. The right-hand side depends only on materials propertiesand is sometimes called the critical stress intensity factor Kc (plane stress) or Kc (plane stress)for crack growth.
Returning to the underlying stress field, Irwin (1957) employed Westergaard’s analysis(1939), to express the stress field for a crack, length 2a, at the centre of an infinitely wide plate,loaded under mode I as
σxx(r, θ)
σyy(r, θ)
σxy(r, θ)
= K√
2πrcos
θ
2
1 − sin θ2 sin 3θ
2
1 + sin θ2 sin 3θ
2
sin θ2 cos 3θ
2
+ (other terms), (15)
where KI = σ∞√
πa, r is the distance from the crack-tip, θ is the angle from the x-axis (crackpropagation direction) to the point r and the other terms in the series expansion are small nearthe crack tip. Consequently, in the vicinity of the crack (the important ‘K’ dominant region),the stress intensity factor, KI, describes the linear dependency of the local stress field on thefar-field stress σ∞ and the square root dependence on the crack length. In this way the energyand stress field approaches can be brought together (Y = 1 for this geometry), because whenKI equals the critical stress intensity, KIc, (sometimes called the fracture toughness) crackadvance will occur spontaneously.
As mentioned above, for a material displaying some ductility, plastic flow local to thecrack is the largest contributor to the toughness, Gc. As a consequence, as the specimenthickness, B, increases at first the toughness increases linearly because the volume for plasticflow increases (e.g. Roylance 1996). However, the ease of yielding and hence the plastic zoneradius rp decreases as the level of multi-axial constraint increases and hence the extent ofyielding is less under plane strain than plane stress;
rp ≈ K2I
πσ 2y
under plane stress,
≈ K2I
3πσ 2y
under plane strain. (16)
This means that the plane strain fracture toughness, KIc, is smaller than that for plane stress, Kc
(figure 25). The former can be regarded as a material constant and plane strain can be assumedif the plastic zone size is less than 1/25 of the thickness (B > 2.5 (KIc/σy)
2). Equation (15)predicts an infinite stress at the crack tip; in order to account for stress redistribution arisingfrom plasticity for r < rp the notional crack length can be modified to a + rp (Knott 1973).
The applicability of KI to describe the tendency for crack advance (the basis of linearelastic fracture mechanics) extends only to situations of ‘small-scale’ yielding where most ofthe structure is elastically loaded and the plastic zone is small compared both to the size of the K
dominant region (otherwise K cannot represent the stress intensity) and the uncracked ligament(otherwise plastic collapse would occur). These conditions are satisfied for the assessment ofmany defect scenarios. However, in cases where the plasticity preceding fracture is less thanthat corresponding to general yield, but cannot be classified as small-scale, researchers tend touse either a crack opening displacement approach (COD) or the J -integral (Rice 1968), which

Residual stress and its role in failure 2243
Figure 25. Schematic of the variation in fracture toughness as a function of specimen thickness,after (Said 2006).
is the rate of change of potential energy for a non-linear elastic solid per unit length of crackgrowth. Conveniently, J is equal to Gc for a linear elastic material.
The question of how to incorporate residual stresses when considering crack propagationis fairly simple for an essentially linear elastic brittle material:
KTotal = KAppl + KRS if KAppl + KRS � 0,
KTotal = 0 ifKAppl + KRS < 0, (17)
where KRS is the stress intensity contribution from the residual stress. For example, a paneof soda glass typically has a toughness (KIC) of approximately 1 MPa m1/2 which means thatin tension a failure strength of 50 MPa would be achieved in the presence of edge cracksof size ∼0.3 mm (Y = 1.12 for this geometry). If residually stressed to −100 MPa at thesurface (figure 12), this would increase the failure strength to 150 MPa in tension. Note thatthe strength of macroscopically defect-free glass is of order 2000 MPa so that the balancingtensile residual stresses in the defect-free interior are unlikely to cause failure.
In the previous example the surface defects were small enough relative to the characteristiclength scale (lo—see section 2.2) of the residual stress field that it was possible to treat theresidual stress at the surface as if it were an externally applied primary load (see section 5.1)and therefore essentially unaffected by the presence of the defect. In general however thepresence of a crack can have a significant effect on the residual stress. This redistribution ofthe residual stress is important from a structural integrity assessment viewpoint. For example,one might need to know whether a residual stress field will delay or induce catastrophic failurefrom a given size of defect under a specific level of applied stress is reached, or to determinewhen a crack growing sub-critically (a < ac) by a fatigue process is on the point of becomingcritical.
In situations where linear elastic fracture mechanics are valid individual components ofdisplacement, strain and stress are additive and the stress intensity for a crack in a residuallystressed body can be calculated as shown in figure 26. Here KRS
I can be considered as the sumof the stress intensity factor, KA, arising from a residually stress free body for which crackopening tractions, p(x), have been applied equal to the residual stresses, σ RS(x), that wouldhave originally existed on the crack plane were there no crack and the stress intensity, KB,for the cracked residually stressed body for which surface tractions have been applied to thecrack to ensure no displacement. Since KB is zero KRS
I = KA which means that the stress

2244 P J Withers
= +
KRSI KA KB= +
σRS(x)
p(x) -p(x)a
Figure 26. Determination of KRSI by means of the superposition principle where the bold arrows
indicate the surface tractions applied to the crack and the dashed arrows the residual stresses,originally uniform along the length of the bar.
intensity contributed by residual stress on a crack can be calculated by replacing the stressesthat originally existed along the crack plane, σ RS(x), with equivalent surface tractions, p(x)
acting on the crack faces (e.g. Anderson 2005). The magnitude of the stress intensity is mostconveniently calculated from the crack face surface tractions using weight functions. For athrough-thickness crack length a, the stress intensity factor is given by
KRSI (a) =
∫ a
0σ RS(x)wp{a, x} dx, (18)
where the weight function, wp{a, x}, is the stress intensity arsing from a unit force appliedto the crack face at x. Weight functions depend only on the geometry of the crack bodyand the boundary conditions. This approach is cost-effective from a non-destructive testing(NDT)/stress measurement viewpoint since it focuses only on a sub-domain so that the wholesystem need not be characterized. Further, it allows one to consider how one might simulate thelocal conditions in a large or complex component in parallel small-scale test-piece experimentsfor safety or lifetime assessments.
In figure 26 the body is unconstrained. In practice the body under consideration is likely tobe under a mixture of imposed loading and imposed displacement constraint. A key questionthen becomes; ‘How does the residual stress field redistribute as a crack propagates?’ Ifthe stress, or the defining eigenstrain (see section 2.1) is known everywhere this questioncan be answered unequivocally, but it is much harder to estimate if the stress is known onlyover a sub-domain. In essence this relates to the spring effect, also termed elastic follow-up(Roche 1989). This describes how the stresses redistribute locally during crack propagation(and/or local plasticity) due to the constraining effects of the remainder of the body and anyexternal tractions. This effect is illustrated in figure 27 for three elastically extended bars.By definition, upon plastic yielding the primary load in body A remains undiminished as aresult of inelastic deformations. By contrast, the secondary stress in body B is necessary tosatisfy compatibility (material continuity) for an elastic material and may disappear as a resultof inelastic deformation. Only in exceptional cases do residual stresses act as ideal secondaryloads. As a result, it is possible to replicate the conditions locally in a sub-domain in a test-piece only if both the local residual stress redistribution and the extent of elastic follow-up(represented by the spring constant for body C in figure 27) are incorporated in the model as afunction of crack growth, deformation or damage. This effect is illustrated by the influence ofconstraint on the stress intensity factor for a given residual stress component in figure 28(b).

Residual stress and its role in failure 2245
Str
ess
Strain
Ela
stic
A:Primary
B:S
econdary
C:Mixed
B
ε
ε
Figure 27. Classical illustration of A: primary (fixed load); B: secondary (fixed displacement) andC: realistic constraint conditions after (Roche 1989).
(a) (b)
Figure 28. (a) Idealised membrane, bending and locally equilibrated stress profiles in a finitewidth plate, normalized by the peak stress and plate width, t , (b) stress intensity factors normalizedby σmax
√πa for a crack growing through thickness, for unrestrained (continuous) and restrained
(dashed) remote boundary conditions (see inset) (courtesy of Bouchard). The restrained cos(4πx/t)
stress intensity has been derived by the author using the approach outlined in (Tada 1970).
In cases where LEFM is applicable, the superposition principle means that the effects ofthe membrane (m), bending (b) and locally equilibrating (le) components in the sub-domain(see section 2.2) can be considered separately (Dong and Hong 2002). The significance ofthis lies in the fact that for a given geometry KIm, and KIb can be found in handbooks (Tadaet al 1985). Figure 28 shows the variation in KI for the membrane, bending and two locallyequilibrating components for a through-thickness edge crack growing in a thick plate, afterTada et al (1985). It is evident that, except at short crack lengths, the effect of restraint whichaffects elastic follow-up can be very important when considering how the crack-driving forcechanges with crack length. Stress intensity factors for the locally equilibrating part, σle(x),are only available for simple stress distributions. The locally fluctuating part is often complexbut can be deconstructed into a Fourier series. As is clear from figure 28, the influence ofshorter wavelength components tend to fall off increasingly with crack length. For the cosinefunctions shown KI approaches zero at approximately 1.5lten in the restrained case . Moregenerally, it has been found that the KI becomes essentially insignificant when the depth ofa surface breaking crack exceeds about twice the length of the local residual stress tensilezone (a > 2lten) for self-equilibrating stress fields having a wavelength less than 0.8t or so

2246 P J Withers
(Bouchard and Withers 2006). Because the shorter wavelength fluctuations in σle tend to haveless effect on the stress intensity, simple representations are often sufficient. In fact the locallyequilibrating component is often ignored completely and the stress intensity factor consideredsimply in terms of the membrane and bending components (Green and Knowles 1992, Li et al2000, Stacey et al 2000, Lee et al 2005). It is clear from figure 28 that this should not be donefor a < 2lten unless the magnitude of the locally equilibrating stress is significantly smallerthan the bending or membrane components.
For an elastic–plastic body a more complex analysis is required which cannot be evaluatedby a simple linear addition of the various K terms resulting from the residual and appliedstress components. In the post-yield region, finite element methods may be used to calculatethe contour integral J which can be modified to include thermal/residual strains. A number ofsimplified assessment procedures have been developed, for example to use J defined earlier(Kumar et al 1985):
J Total = {√J
ApplEl +
√J RS
}2+ J
ApplPl . (19)
Here JEl and JPl represent the linear elastic (small-scale yielding) and fully plastic J (seeKumar et al 1981). This provides a reasonable estimate only for local yielding because thecrack-driving force due to residual stress is taken to be a secondary stress and is thus assumedonly to contribute to the elastic part of the J -integral and is taken not to change with increasingload. The tendency for the eigenstrains causing residual stress to be overwritten in cases ofextensive plasticity mean that the residual stress effect on the total K or J fades as a function ofload, L (see section 7.1). Schemes have been developed to address this loss of residual stressat high loads via for example a ‘load interaction factor’ (ρ) (Milne et al 1988); alternativelynumerical models (Zien 1983, Lei et al 2000) can be used to estimate the J Tot.
In all cases the length scale of the residual stress should also be considered. If it issmaller than the plastic zone, rp (equation 16), then it is likely that the residual stress will havelittle effect on the fracture behaviour because crack-tip plasticity will obliterate the underlyingeigenstrains.
7.3. Fatigue and thermal fatigue
Fatigue is the deleterious change in properties that occurs due to the repeated application ofsub-critical stresses or strains. Fatigue crack growth can be broken down into nucleation andpropagation of damage (e.g. Suresh 1991). During the nucleation stage microstructural changescause permanent damage prior to the formation of microscopic cracks. The propagation stagebegins once these microscopic flaws have grown and coalesced to form dominant macroscopiccracks. These may then propagate stably prior to rapid growth leading to fast fracture. Inpractice the extent of the nucleation stage is rather difficult to define; it is most easily describedas encompassing all the damage and crack growth events that occur below the sensitivitythreshold of NDT (1 mm say). This stage is taken to include; microstructurally small flawshaving the microstructural scale (e.g. grain size), mechanically small flaws comparable tothe near-tip plasticity, physically small cracks that are too small to detect by NDT but largerthan the crack-tip plasticity; and finally chemically small cracks that might be expected toconform to LEFM, but below a given crack size grow anomalously due to scale dependentenvironmental stress corrosion effects (Suresh and Ritchie 1984). The key point is that allthese short cracks propagate at rates faster than would be expected under LEFM. These cracksapparently deviate from the principle of similitude, namely the idea that the crack-tip conditionscan be uniquely defined by the stress intensity factor whatever the size of the sample. Thisprinciple is fundamental to the transfer of results on the test-piece to the engineering structure.

Residual stress and its role in failure 2247
They deviate because as short cracks they can take advantage of local microstructural orenvironmental conditions favouring crack advance, for example, for short cracks crack growthmay be accelerated due to locally high type II stresses (section 2.2) not accounted for in acontinuum LEFM approach.
For convenience fatigue is divided into two types (Ashby and Jones 1980), low cyclefatigue (LCF) and high cycle fatigue (HCF). LCF describes fatigue at stresses above the yieldpoint and typically involves less than 10 000 cycles to failure. This usually occurs duringcycling controlled by the imposed total strain, such as the thermal cycling of a constrainedstructure. Analogous to the static high load case, residual stress often has little effect on LCFlife as the eigenstrains responsible for the residual stresses tend to be drowned-out within thefirst cycle or so by the large amplitude of the oscillating plastic strains. This is exemplified bya reduction of 70% of the compressive residual stress introduced by deep rolling after half thefatigue life under LCF (R = −1; σmax = 320 MPa) for 304 stainless steel having yield, σ0.2,and ultimate tensile, σuts, stresses of 245 and 650 MPa, respectively (Altenberger et al 1999)and almost complete relaxation of the residual stresses introduced by shot peening in SAE1045 ferritic steel (R = −1; σmax = 450 MPa) with (σ0.2 = 480, σuts = 740 MPa) (Martinet al 1998).
HCF involves larger numbers of cycles at stresses that would not of their own be sufficientfor plastic straining to occur. HCF is generally stress controlled and includes rotating orvibrating systems. It can be very sensitive to residual stress. Just as KI is a key parameter forassessing the likelihood of static fracture, the stress intensity range, KI = KImax − KImin, isimportant for fatigue, as well as Kmax and load ratio R = σmin/σmax.
Large engineering structures usually contain cracks (or are assumed to contain cracks justbelow the minimum detectable size), defects or stress concentrators. In such circumstances,one needs to know how many cycles, that is how long in time, it will take for one of these cracksto grow to such an extent that catastrophic fracture can occur according to (equation (14)).The crack growth rate per cycle, da/dN , versus log(K) has been found to have a sigmoidalform comprising three distinct stages; I near threshold, K th, that is K is just large enoughto propagate a fatigue crack (this regime is strongly dependent on R ratio), II a linear regiondescribed as the Paris regime (Paris and Erdogan 1963) and governed by equations (20a)
da
dN= A(K)m, (20a)
where A and m are constants dependent on stress ratio, R, microstructure and the environment.Beyond this linear region, stage III corresponds to a ‘high growth’ rate regime sensitive toKmax as the conditions for static fracture are approached. Traditionally much attention isconcentrated on stage II because once a crack has initiated much of the useable fatigue life ofa component will be in stage II, since crack growth is typically too rapid to tolerate in stageIII. Figure 29(a) demonstrates that a macro residual stress changes R and Kmax, but does notnormally affect K (case A). However, if the residual stress is sufficient for the crack facesto come into contact over part of the fatigue cycle, then the crack-tip stress intensity will bepartially shielded from further changes in the applied loading. Finite element modelling work(Beghini and Bertini 1990, Korsunsky and Withers 1997) suggests that depending on the formand magnitude of the compressive residual stress field, the crack faces come into increasingcontact gradually below some applied KAppl value, but that once contact is made the stressat the crack tip varies little with changing externally applied load. As a result an adequaterepresentation of the range of stress experienced at the crack tip can be obtained by settingKEff
min to the value of K at which the crack faces start to touch. In the idealized case B plotted infigure 29(a) this is taken to be when KAppl +KRS = 0. Compressive residual stresses mean thatresidual stress induced closure effects can occur even under significant tensile applied stresses,

2248 P J Withers
Figure 29. (a) Schematic showing how residual stresses directly affect the crack-tip stress intensityKEff
max and R ratio. Only in case B do the residual stresses affect the stress intensity range Keff ,due to residual stress induced crack closure, this acts to limit the exposure of the crack-tip to thefull applied KAppl, (b) K vs Kmax plot for Al 7475 T7351 alloy tested in the LT orientation fortwo crack growth rates (Sadanada et al 1999).
although as illustrated closure becomes less likely as the mean stress becomes more tensile.Retardation by residual stress induced closure is well illustrated by the results of Ruschau et al(1999) who found that laser shock peened Ti–6Al–4V aerofoils tested in bending (R = 0.1) asnotched samples exhibited little notch sensitivity with a fatigue life twice that of the unpeenedor shot peened samples. Unlike the baseline samples for which crack propagation representedjust a few per cent of the total life, propagation comprised nearly 100% of fatigue life withsome cracks arresting completely. This was ascribed to the fact that the deep compressiveresidual stresses were found to hold the crack shut for 85% of the fatigue cycle, significantlyreducing Keff . Little benefit over the baseline was found testing at R = 0.8 because at thehigher Kmin levels the crack remained open throughout the cycle.
Recently, the dependency of crack growth rate on static loads, represented by Kmax, aswell as cyclic amplitude, K , has been expressed (Vasudevan and Sadanada 1995, Donaldet al 1998);
da
dN= C(K)q(Kmax)
g. (20b)
In the same vein Vasudevan et al (1995, 2001) have recast the well known dependency of K th
on R in terms of two thresholds K th∗ and KTh∗max defining the threshold conditions for crack
propagation. Further as shown in figure 29(b) using data for Al7475 they suggest that thereare limiting K∗ and K∗
max for all crack growth rates not just at threshold (here taken to be1 × 10−7 mm cycle−1). The key point from this viewpoint is that Kmax is taken to play a rolethroughout crack growth. As illustrated in figure 30(a), Vasudevan et al (2001) suggest thatmany fatigue crack growth rate retardation effects can be explained in terms of the effect ofvarious types of residual stress on Kmax without the need to invoke traditional crack-tip closuremechanisms2 to shield the crack-tip from the full stress amplitude (Keff < KAppl). Thismay be the dominant effect of residual stresses on fatigue when K
Applmin + KRS > 0 such that
residual stress induced closure cannot occur.For tension–tension fatigue, local compressive residual stresses ahead of the crack-tip arise
from reverse plastic flow on unloading (figure 31(a)). If a tensile overload is applied the sizeof the compressive zone is believed to increase (Allison 1979) which has been used to explain
2 Traditional crack closure mechanisms include crack face plasticity, asperities from oxides or corrosion, surfaceroughness and transformations.

Residual stress and its role in failure 2249
Figure 30. (a) Schematic illustration of the role of residual stress on crack growth rate, da/dN ,for long and short cracks in terms of Kmax after (Vasudevan et al 2001); a similar schematiccould be drawn to show the effect of residual stress induced closure on crack growth rate via itseffect on Keff .
(a)(b)
Figure 31. (a) Idealised sketch of the crack-tip opening stress field and forward and reverse plasticzones in fatigue and (b) the stress field in an as-fatigued and cracked Al compact tension specimenalong the plane of the crack at 2Kmax(=13.2 MPa m1/2) and Kmin(=0.6 MPa m1/2) immediatelyafter overload measured by synchrotron diffraction using a 25 µm gauge size (Steuwer et al 2007).
transient retarded crack growth (figure 31) (Wheeler 1972, Garwood and Boulton 1979). Thiseffect is exploited in the use of warm pre-stressing to increase fracture toughness of crackedcomponents (Smith and Garwood 1990).
High spatial resolution x-ray diffraction measurements have been used to study the stateof stress in the vicinity of a fatigue crack tip under plane stress (Croft et al 2005, Steuwer et al2007). No strong evidence was found for a significant compressive residual stresses at Kmin
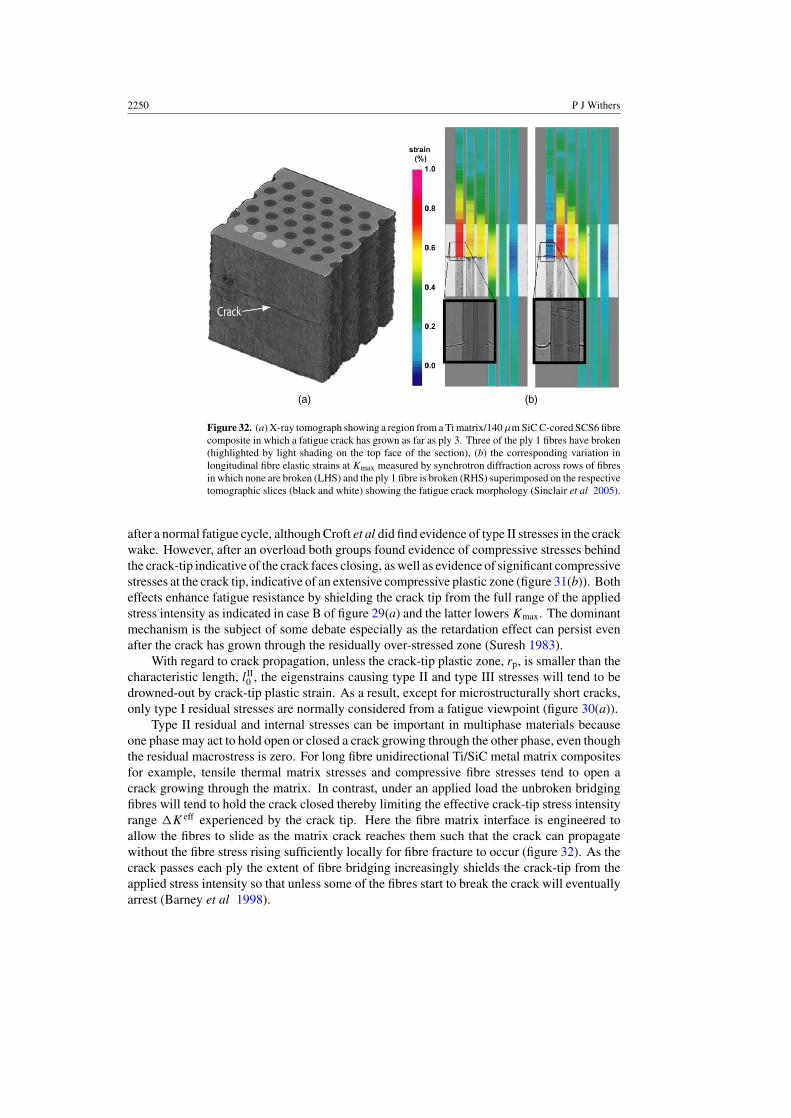
2250 P J Withers
(a) (b)
Figure 32. (a) X-ray tomograph showing a region from a Ti matrix/140 µm SiC C-cored SCS6 fibrecomposite in which a fatigue crack has grown as far as ply 3. Three of the ply 1 fibres have broken(highlighted by light shading on the top face of the section), (b) the corresponding variation inlongitudinal fibre elastic strains at Kmax measured by synchrotron diffraction across rows of fibresin which none are broken (LHS) and the ply 1 fibre is broken (RHS) superimposed on the respectivetomographic slices (black and white) showing the fatigue crack morphology (Sinclair et al 2005).
after a normal fatigue cycle, although Croft et al did find evidence of type II stresses in the crackwake. However, after an overload both groups found evidence of compressive stresses behindthe crack-tip indicative of the crack faces closing, as well as evidence of significant compressivestresses at the crack tip, indicative of an extensive compressive plastic zone (figure 31(b)). Botheffects enhance fatigue resistance by shielding the crack tip from the full range of the appliedstress intensity as indicated in case B of figure 29(a) and the latter lowers Kmax. The dominantmechanism is the subject of some debate especially as the retardation effect can persist evenafter the crack has grown through the residually over-stressed zone (Suresh 1983).
With regard to crack propagation, unless the crack-tip plastic zone, rp, is smaller than thecharacteristic length, lII
0 , the eigenstrains causing type II and type III stresses will tend to bedrowned-out by crack-tip plastic strain. As a result, except for microstructurally short cracks,only type I residual stresses are normally considered from a fatigue viewpoint (figure 30(a)).
Type II residual and internal stresses can be important in multiphase materials becauseone phase may act to hold open or closed a crack growing through the other phase, even thoughthe residual macrostress is zero. For long fibre unidirectional Ti/SiC metal matrix compositesfor example, tensile thermal matrix stresses and compressive fibre stresses tend to open acrack growing through the matrix. In contrast, under an applied load the unbroken bridgingfibres will tend to hold the crack closed thereby limiting the effective crack-tip stress intensityrange Keff experienced by the crack tip. Here the fibre matrix interface is engineered toallow the fibres to slide as the matrix crack reaches them such that the crack can propagatewithout the fibre stress rising sufficiently locally for fibre fracture to occur (figure 32). As thecrack passes each ply the extent of fibre bridging increasingly shields the crack-tip from theapplied stress intensity so that unless some of the fibres start to break the crack will eventuallyarrest (Barney et al 1998).

Residual stress and its role in failure 2251
Fatigue failure often initiates from the surface of a component and hence considerableadvantage can be achieved by surface modification of the near surface residual stress. Increasesin fatigue lifetimes of a factor of 10 are not uncommon in materials containing high compressivenear surface stresses, as might be introduced by peening (Nikitin et al 2004). In such situationsa key question is the extent to which residual stress affects the nucleation and propagation ofthe fatigue cracks. Here it should be remembered that in many cases such as shot peening,the treatment affects the local hardness/microstructure and surface finish which can also havea strong effect on the nucleation of surface cracks making it difficult to quantify the effectof residual stress alone. The evidence for compressive stresses delaying and even arrestingpropagation is less ambiguous (e.g. Ruschau et al 1999). De los Rios et al (1995) found for316 stainless that both initiation and growth were delayed by shot peening although initiationwas the more affected, with propagation becoming increasingly important at high stresses andlow fatigue lifetimes. However no attempt was made to separate the microstructural and stresseffects on initiation. In common with Ruschau et al (1999) who looked at fatigue of laserpeened materials (see above), Bernardt et al (1995) found propagation rather than nucleationto be most strongly retarded by cold-hole expansion.
Contact fatigue is an umbrella term that includes a wide range of contact induced surfacemodifying processes, including fretting, sliding contact, rolling contact, conforming contactetc. In many cases the tolerance to such processes can be increased by the prior introductionof compressive near surface residual stresses. However, contact fatigue processes will tend tointroduce or modify the near surface eigenstrain by local plasticity. If the plastically affecteddepth is greater than the depth of the original eigenstrain then the former may drown out thelatter which is typically tenths of a per cent. As a consequence it is important that the protectiveresidual stress process introduces compressive stresses to a greater depth than is modified bythe contact process so that the compressive residual stress is relatively stable and will offerprotection against the propagation of fatigue cracks. From this standpoint, laser peening anddeep rolling are attractive because they can introduce compressive stresses to depths greaterthan a millimetre (King et al 2006). This greater depth also confers a greater resistance toforeign object damage (Prevey et al 2001). It should be remembered that not all contactsituations are detrimental. One area where contact fatigue introduces beneficial compressiveresidual stresses is on the surface of railway rails (Kelleher et al 2005).
7.4. Transformation fatigue of smart structures
Recently there has been considerable interest in the use of transforming materials, such asferroelectrics and shape memory materials for actuators and smart devices. In such cases thecomponent is repeatedly cycled between states and the residual stresses repeatedly relievedand regenerated. Eggeler et al (2004), distinguished between structural and functional fatigue.The former encompasses microstructural damage that accumulates during cyclic loading andeventually leads to fatigue failure. The term ‘functional fatigue’ indicates degradation of theshape memory effects. Functional fatigue is associated with an increase of residual strain(with plastic and pseudo-plastic components) which corresponds to an incomplete reversetransformation. The structural fatigue of pseudo-elastic shape memory alloys is governed bythe initiation and growth of surface cracks. These materials are damage tolerant because thestress induced transformation limits stresses and thus stress intensity factors which drive crackgrowth. Fatigue in ferroelectric actuator materials has also been studied; significant effectswere found once the electric loading approached the coercive field (Lupascu and Rodel 2005).
In other systems, notably transformation toughened ceramics the transformation is usedonce only to achieve inelastic deformation near the crack-tip. For partially stabilized zirconia

2252 P J Withers
(a) (b) (c)
Figure 33. (a) Maps of the crack opening residual elastic strains across a stainless steel specimenfatigue pre-cracked to 3.5 mm (inset with scan area marked in yellow) before (LHS) and after (RHS)a 4500 h of thermal exposure at 550 ◦C measured by synchrotron diffraction, (b) comparison ofthe fracture surface with finite element predictions of creep cavitation damage level after thermalexposure, where 1 indicates the initiation of a creep crack (Turski et al 2007). Note that creepdamage does not occur near the sample edge because of the lack of hydrostatic constraint.
the fatigue enhancement depends on a combination of shear and dilatational strain achievedby the tetragonal to monoclinic transformation (Garvie et al 1975). The shear is analogousto plastic shear whilst the dilatation introduces compressive residual stresses near the crack(where the stresses are highest) that might cause residual stress induced crack closure therebyreducing K , or simply reduce Kmax.
7.5. Creep cavitation cracking
Creep, is the inelastic deformation under load of materials over long periods, that wouldcause only elastic deformation if imposed for short periods. This is an important deformationmechanism at elevated temperatures. If the accumulated creep strains exhaust the creepductility of the material, cracks will initiate. The failure mode is often characterized bythe growth of cavities on grain boundaries (Bouchard et al 2004). Welds and the adjacentheat affected parent material are generally the regions most susceptible to creep continuumdamage in fabricated steel structures. Creep strain and ultimately cracking can be driven byresidual stresses, for example, as a means of thermal relaxation of weld residual stress in areaswith poor material creep ductility at the operating temperature and creep deformation rate. Inthis context a highly tri-axial stress state—such as can be present in certain weld types—canreduce the creep ductility relative to the uniaxial response substantially. The occurrence of socalled reheat cracking has been detected in welded AISI Type 316H austenitic stainless steelcomponents operating at elevated temperatures and pressures in the boilers of UK advancedgas cooled nuclear reactor plants (Coleman et al 1998). Turski et al (2007) studied thisusing a pre-strained compact tension style 316H stainless steel sample (inset in figure 33(a))to generate a tensile residual stress prior to introducing a 3.5 mm fatigue ‘pre-crack’. Uponexposure to 550 ◦C for 4500 h significant stress relaxation was observed to occur by creepcavitation with no external load applied (figure 33(b)). Good agreement was found with thedamage levels predicted by FE (figure 33(c) made on the basis of a stress relaxation and creepductility exhaustion model.
7.6. Stress corrosion
It is commonly the case that aqueous exposure in combination with otherwise benign levelsof applied stress can cause serious cracking to occur, often intergranularly. Stress corrosion

Residual stress and its role in failure 2253
0
200
400
600
800
1000
1200
1400
Baseline Salt FOD Salt+FOD
Str
ess
(MP
a)
Untreated
Shot peened
LPB
Figure 34. Fatigue strength at 107 cycles for 0.5 mm notched SCC study of 300 M steel in thepresence of a neutral 3.5% salt solution for untreated, shot peened and low plasticity burnishedconditions (Prevey et al 2005).
cracking is a particular worry for the oil, petrochemical and power generation industries. As anear surface phenomena, stress corrosion is particularly amenable to prevention by control ofthe near surface stress state and significant (×100 (Prevey and Cammett 2004)) increases in theresistance to stress corrosion have been achieved by the various peening methods. Figure 34shows that in contrast to shot peening, low plasticity burnishing (introducing 1.25 mm deepcompressive stresses) was found to confer good resistance under 0.5 mm notched SCC andforeign object damage (FOD) testing (Prevey et al 2005). As a microstructural mechanism, itis possible that both type I and type II stresses can contribute to stress corrosion cracking.
8. Assessment of structural integrity
8.1. Assessment strategies and codes
Structural integrity has been described3 as the ‘science and technology of the margin betweensafety and disaster’ of engineering structures. In essence it is the demonstration to anappropriate level of confidence of the fitness for service of a particular component, structureor plant. Several codes and procedures have been defined for its assessment. The fractureassessment procedure summarized in BS 7910:1999 is based on the use of the failure assessmentdiagram (FAD). The FAD provides a simple way of considering the competing tendencies forfracture (vertical axis) due to the stress intensity (KTotal
I ) and plastic collapse (horizontal axis)due to the load (L). The respective axes, Kr , and, Lr , of the FAD (figure 35) are normalized bythe appropriate material toughness (KIc under linear elastic fracture conditions) and the plasticlimit load of the cracked structure, LL. The boundary between safe and unsafe conditions canbe defined in a number of ways:
Option 1 is to use a general curve given by (Milne et al 1988):
Kr = (1 − 0.14L2r )[0.3 + 0.7 exp(−0.65L6
r )] for Lr � Lmaxr
Kr = 0 for Lr > Lmaxr . (21)
Option 2 is to use a material specific curve.
3 Dr S G Roberts, University of Oxford at an EPSRC Structural Integrity Workshop, 2004.

2254 P J Withers
1
1.2
1.41.21.00.80.40.200
0.2
0.4
0.6
0.6
1.6
1.4
0.8
Normalised load, L r
Nor
mal
ised
str
ess
inte
nsity
, Kr 1P (Full scale)
1S (Full scale)
S1/93 (1/4 scale)P1/93 (1/4 scale)
SK1 (1/4 scale)3S (Full scale)3P (Full scale)2S (Full scale)2P (Full scale)
SK3 (1/4 scale)
Safe
Unsafe
Figure 35. FAD diagram for centre cracked plate Al specimens with (S) and without (P) variouslevels of residual stress (1S: σRS
max = 23%σy , 2S: σRSmax = 44%σy , 3S: σRS
max = 48%σy , SK3:σRS
max = 16%σy , S1/93: σRSmax = 57%gσy ) calculated using option 1 (Stacey et al 2000).
The cut-off for plastic collapse, Lmaxr , is often taken as 1/2(σy + σuts)/σy except where
higher values can be justified (Milne et al 1988).Secondary stresses (including many types of residual stress) by definition only affect the
vertical position (Kr) on the FAD (equation (21)). As discussed in section 7.2, methods forincorporating the effects of extensive plasticity at high Lr on Kr have been developed (Milneet al 1988, Stacey et al 2000) which bring KTotal (or J Total) closer to KAppl as Lr becomeslarge. This is because the relatively small eigenstrains causing the residual stress tend tobecome overwritten by larger local plastic strains.
Three assessment levels for incorporating residual stress are used, in order of increasingsophistication and prior knowledge and hence decreasing conservatism (Stacey et al 2000).
Level 1 can best be thought of as a screening procedure. It entails making very conservativeassumptions about the treatment of the applied and residual stresses. For example, an as-welded residual stress distribution is normally assumed to be a membrane stress equal to theyield strength.Level 2 is the usual assessment method for structural applications in cases where the residualstress profile is known or can be estimated. The level 2 method gives realistic predictions forsituations, where ductile tearing is limited and involves predicting the total KTotal taking intoaccount applied and residual stresses for example using equations (18) and (19).Level 3 this procedure is appropriate to ductile materials which exhibit stable tearing and caninvolve a full J -integral numerical analysis (see section 7.2), to yield a plot of Kr versus Lr .
Data on residual stresses may be obtained from published literature, measurementsor numerical modelling. Standard residual stress distributions for common welded jointgeometries are included in BS 7910:1999 Annex Q, British Energy R6 Rev.4 section IV.4 andAPI 579 appendix E. These distributions were obtained by fitting upper bounds to publisheddata, and are available for butt welds, T-joints, girth welds in tubes and repair welds and havealso been expressed as mathematical formulations (Stacey et al 2000). Guidelines for the effect

Residual stress and its role in failure 2255
of post-weld heat treatment are also given (BS 7910:1999). Test results are plotted againstthe R6 option 1 FAD in figure 35 for a centre cracked Al plate containing various levels ofresidual stress (% of yield stress). The figure shows that, in general, conservative predictionswere obtained with failure occurring on the unsafe side of the FAD curve.
The R6 FAD is based on elastic-perfectly plastic behaviour. As such it is conservativefor materials that harden with straining. The Electrical Power Research Institute approachinvolves considering elastic–plastic, JEl, and fully plastic, JPl, situations separately (Shih andHutchinson 1976, Kumar et al 1981). J -based failure assessment diagrams analogous tofigure 35 have been developed; these depend on geometry and so are more involved than theR6 procedure.
8.2. Designing against fatigue
There are two basic methods for designing with fatigue, one emphasizing nucleation, the otherthe propagation of fatigue cracks (Suresh 1991):
Total life approaches. Here the number of stress (or strain) denoted S, cycles to failure,denoted N , in uncracked samples is measured under prescribed conditions to give so-calledS–N curves. Since crack initiation is a major fraction of the fatigue life of smooth specimens,in many cases this is equivalent to designing to prevent crack nucleation. For HCF, life istypically characterized by the stress range, whereas for lives under LCF attention has focusedon the strain range. The stress life approach arose out of work by Wohler (1860) who definedan endurance limit. This is a stress below which the component might have an infinite life(at least 107 cycles). Not all materials exhibit an endurance limit. The number of reversals tofailure, 2Nf , can often be related to the stress amplitude σ by Basquins Law;
σ
2. = C1(2Nf)
a, (22a)
where C1 and a are constants, the latter varying between −1/8 and −1/15 (Ashby and Jones1980). Residual stress effects are usually explained in terms of mean stress effects. For LCF,strain based approaches are more relevant. Here the plastic strain amplitude is related to thenumber of reversals via the Coffin–Manson equation:
εPl
2= C2(2Nf)
b, (22b)
where b lies around −0.5. Given that the elastic strain amplitude is given by εEl = σ/E,where E is Young’s modulus, then the total strain amplitude can be expressed:
εTot
2= εPl
2+
εEl
2= C2(2Nf)
b +C1
E(2Nf)
a. (22c)
At short fatigue lives, plastic strain amplitude is dominant with ductility an important issue,whereas for long lives rupture strength is critical.Defect-tolerant approaches. Here fracture mechanics is applied on the assumption that thecomponent is inherently flawed. The maximum flaw size may be measured or a limit placedon it by the detection sensitivity. The useful life is then determined on the basis of the timeto propagate such a crack predicted using empirical growth laws, until it reaches some criticalsize. The approach is valid for small-scale yielding.
The two methods can be applied using a safe-life approach in which the componentis withdrawn from service after some fraction of the predicted life of the component.Alternatively, a fail-safe approach can be taken in which failure of the component is toleratedprovided the integrity of the structure is not compromised. An example of this philosophy

2256 P J Withers
is the leak-before-break approach in which pressure vessels are designed such that a crackwill fully penetrate the wall and release the pressure before a defect is large enough to causecatastrophic fast fracture.
9. Summary and future directions
The last two decades has seen a marked improvement in the level to which residual stresses canbe measured both near surface and at depth. This is due to the building of dedicated neutrondiffraction strain measurement facilities, the emergence of third generation synchrotron sourcescapable of producing narrow beams of penetrating high energy x-rays, the refinement of manydestructive techniques of stress measurement such as incremental and deep hole drilling andcrack compliance, and a better understanding of the physics of less direct methods of stressmeasurement such as magnetoelastic methods. At the same time, there has been a significantimprovement in the capability of computational methods to predict the generation and evolutionof residual stresses during processing, assembly and through-life. Taken together these toolsare greatly increasing our understanding of residual stress levels and their stability under awide range of environmental conditions. This is enabling us to control the behaviour of a widerange of materials by tailoring the state of residual stress at the appropriate scale.
A good example is provided by the design of weld filler metals with phase transformationtemperatures tailored to control the state of stress and distortion in the welded components(Yamamoto et al 2002). In this case synchrotron diffraction has been used to confirm theevolution of the transformation products in real-time as a function of temperature and coolingrate (Elmer et al 2000, Stone et al 2008), while neutron diffraction has been used to comparethe weld residual stresses in welded joints using the new filler metals to those for conventionalbenchmark fillers (Francis et al 2007). Similarly, smart ferroelectric and shape memorymaterials for actuators and morphable structures are being developed with the help of the insitu measurement of phase transformation strains under magnetic, electric and applied loads.
With the development of microelectromechanical systems and nanomaterials, newmeasurement techniques, both destructive and non-destructive, suited to the evaluation ofresidual stresses at micrometre and even sub-micrometre levels will be required to understandand manipulate the behaviour of these devices. At the highest resolutions, methods in whichdiffraction patterns are inverted computationally can be used to derive strain information atthe nanometre scale. Strain breaks the inversion symmetry giving rise to fine detail at eachdiffraction spot (Pfeifer et al 2006). For example the 2D variation in strain in a 100 nm by 1 µmsingle crystal Si of an electronic device has been mapped in this way to a spatial resolution ofaround 8 nm (Minkevich et al 2007).
The engineering of stress near surface is another area for the future. Recent processdevelopments have increased the number of methods by which residual stresses can beintroduced near surface over depths ranging from 10 µm to many millimetres. Oftencompressive near surface stresses are balanced by tension sub-surface or laterally. Boththe efficacy and the longevity of the performance benefits can be affected by the depth ofthe compressive stress and balancing tensile regions, the stored plastic work as well as themaximum compressive stress. As a result, more work needs to be done to better understandthe optimum profiles for prolonged component life under a variety of environments (fatigue,fretting, thermal exposure).
At a structural engineering level there is still a large cultural gap between those involvedin residual stress measurements and those making structural integrity assessments. While thescience of fracture mechanics has developed to predict the effect of measured, or presumedworst case, defects on the structural integrity of structures, the science of predicting the effect

Residual stress and its role in failure 2257
of residual stress on structural performance is much less advanced. This is partly because upuntil recently the level of residual stress in a body was, except in a few cases, purely speculative.Consequently, advances in the methodology for incorporating residual stresses have not yetbenefited from the advances in residual stress measurement and prediction. Consequently, it isnow time that a major effort is directed at understanding how residual stresses, along with thepresence of known or worst case defects combine to limit life. This is important if unnecessaryconservatism is to be reduced leading to longer lives and leaner designs without compromisingsafety.
Finally, while it is common practise at present for potentially harmful residual stresses tobe removed (stress relieved) or beneficial stresses deliberately introduced (e.g. by peening) toincrease operating safety margins, it is currently rare for residual stresses to be used directly aspart of lifing assessments. If residual stresses are to be intelligently exploited in the future usingarguments based on structural integrity assessments that can take full value of their benefit,then it is essential that residual stress levels are known not just at start of life, but also as afunction of the environmental conditions to which a component is exposed, both within andoutside normal operating conditions. Non-destructive methods are particularly useful in thisregard, especially those which can be made on the component in situ, as are better models forpredicting the evolution of residual stress. If these challenges can be met then residual stressescan bring significant safety and economic benefits to new designs in the future.
Acknowledgments
I am grateful for lengthy discussions with A H Sherry, P J Bouchard, D Nowell, J F Knottand L Edwards as well as the comments of the referees. I am indebted to my PhD and post-doctoral workers as well as instrument scientists at international facilities for their help. Alsothe support of a Royal Society-Wolfson Merit Award is acknowledged.
References
API 579: Recommended Practice for Fitness-For-Service (Washington, DC: American Petroleum Institute)Allen A J, Andreani C, Hutchings M T and Windsor C G 1981 Measurement of internal stress within bulk materials
using neutron diffraction NDT Int. 15 249–54Allen A J, Bourke M, Dawes S, Hutchings M T and Withers P J 1992 The analysis of internal strains measured by
neutron diffraction in Al/SiC MMCs Acta Metall. 40 2361–73Allison J E 1979 Measurement of crack-tip stress distributions by x-ray diffraction Fracture Mechanics; STP 677
(Philadelphia: ASTM)Altenberger I, Scholtes B, Martin U and Oettel H 1999 Cyclic deformation and near surface microstructures of shot
peened or deep rolled austenitic stainless steel AISI 304 Mater. Sci. Eng. A 264 1–16Altenkirch J, Steuwer A, Peel M J, Richards D and Withers P J 2007 The effect of tensioning and sectioning on the
development of residual stresses in AA7749 aluminium friction stir welds Mater. Sci. Eng. A submittedAnderson T L 2005 Fracture Mechanics: Fundamentals and Applications (Boca Raton, FL: CRC Press)Aoki S, Nishimura T and Hiroi T 2005 Reduction method for residual stress of welded joint using random vibration
Nucl. Eng. Des. 235 1441–5Ashby M F 1970 The deformation of plastically non-homogeneous materials Phil. Mag. 21 399–424Ashby M F and Jones D R H 1980 Engineering Materials—An Introduction to Their Properties and Applications
(Oxford: Pergamon)ASME 2004 ASME Boiler and Pressure Vessel Code Section III, Div. 1. Rules for construction of pressure vessels
(UW-40 Proceures for PWHT)Barber T E, Brust F W, Mishler H W and Kanninen M F 1981 Controlling residual stresses by heat sink welding
Electrical Power Research Institute ReportBarney C, Ibbotson A and Bowen P 1998 Experimental characterization of fibre failure and its influence on crack
growth resistance in fibre reinforced titanium metal matrix composites Mater. Sci. Technol. 14 658–68

2258 P J Withers
Barsom J M 1968 Fracture of tempered glass J. Am. Ceram. Soc. 51 75–8Beghini M and Bertini L 1990 Fatigue crack propagation through residual stress fields with closure phenomena Eng.
Fract. Mech. 36 379–87Beghini M, Bertini L and Raffaelli P 1994 Numerical-analysis of plasticity effects in the hole-drilling residual-stress
measurement J. Test. Eval. 22 522–9Bernardt M, Bui-Quoc T and Burlat M 1995 Effect of re-coldworking on fatigue life enhancement of a fastener hole
Fatigue Fract. Eng. Mater. Struct. 18 765–75Berveiller S, Inal K, Kubler R, Eberhardt A and Patoor E 2004 Experimental approach of the martensitic transformation
in shape-memory alloys and TRIP steels J. Physique IV 115 261–8Bilby B A 1980 Tewksbury lecture—putting fracture to work J. Mater. Sci. 15 535–56Blaszkiewicz M, Albertin L and Junke W 1996 The eddy current technique for determining residual stresses in steels
Mater. Sci. Forum 210 179–85Blodgett M P and Nagy P R 2004 Eddy current assessment of near surface residual stresses in shot peened nickel-base
superalloys J. Nondestr. Eval. 23 107–23Bouchard P J and Withers P J 2007 Identification of residual stress length scales and their implications for fracture
assessments Int. J. Fract. submittedBouchard P J, Withers P J, Macdonald S and Hennan R 2004 Quantification of creep cavitation damage mapping
around a crack in a pressure vessel stainless steel Acta Mater. 52 23–34Burak Y I, Besedina L P, Romanchuk Y P, Kazimirov A A and Morgun V P 1977 Controlling longitudinal plastic
shrinkage of metal during welding Autom. Weld. USSR 30 21–4Burdekin F M 1969 Heat Treatment of Welded Structures (Cambridge: The Welding Institute)Buttle D J and Scruby C 2001 Residual stresses: measurement using magnetoelastic effects Encyclopedia of Materials:
Science and Technology ed K H J Buschow et al (Oxford: Elsevier)Buttle D J, Scruby C B, Briggs G A D and Jakubovics J P 1987 The measurement of stress in steels of varying
microstructure by magnetoacoustic and Barkhausen emission Proc. R. Soc. A 414 469–97Cao W, Khadhraoui M, Brenier B, Guedou J Y and Castex L 1994 Thermomechanical relaxation of residual-stress in
shot peened nickel-base superalloy Mater. Sci. Technol. 10 947–54Cheng W, Finnie I and Vardar O 1991 Measurement of residual stresses near the surface using the crack compliance
method J. Eng. Mater. Technol. 113 199–204Cherkaoui M, Berveiller M and Sabar H 1998 Micromechanical modeling of martensitic transformation induced
plasticity TRIP in austenitic single crystals Int. J. Plast. 14 597–626Cheskis H P and Heckel R W 1968 In-situ measurements of deformation behaviour of individual phases in composites
by x-ray diffraction Metal Matrix Composites ASTM STP 438 (Philadelphia: American Society for Testing andMaterials)
Clausen B, Lorentzen T, Bourke M A M and Daymond M R 1999 Lattice strain evolution during tensile loading ofstainless steel Mater. Sci. Eng. A 259 17–24
Claxton R A and Lupton A 1991 Vibratory stress relieving of welded fabrications Weld. Met. Fabr. 59 541–4Coleman M C, Miller D A and Stevens R A 1998 Reheat cracking strategies to assure integrity of type 316 welded
components Proc. Int. Conf. on Integrity of High Temp. Welds (London) (London: PEP)Covey-Crump S J, Holloway R F, Schofield P F and Daymond M R 2006 A new apparatus for measuring mechanical
properties at moderate confining pressures in a neutron beamline J. Appl. Crystallogr. 39 222–9Cowley K D and Beaumont P W R 1997 The measurement and prediction of residual stresses in carbon-fibre/polymer
composites Compos. Sci. Technol. 57 1445–55Croft M, Zhong Z, Jisrawi N, Zakharchenko I, Holtz R L, Skaritka J, Fast T, Sadananda K, Lakshmipathy M and
Tsakalakos T 2005 Strain profiling of fatigue crack overload effects using energy dispersive x-ray diffractionInt. J. Fatigue 27 1408–19
Cullity B D 1978 Elements of X-Ray Diffraction (Reading, MA: Addison-Wesley)Daymond M R and Withers P J 1996 A Synchrotron radiation study of transient internal strain changes during the
early stages of thermal cycling in an Al/SiCW MMC Scr. Mater. 35 1229–34De Los Rios E R, Walley A, Milan M T and Hammersley G 1995 Fatigue crack initiation and propagation on shot-
peened surfaces in A316 stainless steel: I. J. Fatigue 17 493–9Donald J K, Bray G H and Bush R W 1998 Introducing the Kmax sensitivity concept for correlating fatigue crack
propagation High Cycle Fatigue of Structural Materials ed W O Soboyejo and T S Srivatsan (Warrendale, PA:TMS)
Dong P and Hong J K 2002 Recommendations for determining residual stresses in fitness-for-service assessment WRCBull. 476 1–61
Dull R M, Dydo J R and Russell J J 2001 Transient thermal tensioning for control of buckling distortion 82nd AnnualAWS Convention (Cleveland)

Residual stress and its role in failure 2259
Dunand D C, Mari D, Bourke M A M and Roberts J A 1996 NiTi and NiTi-TiC composites. 4 Neutron diffractionstudy of twinning and shape memory recovery Met. Mater. Trans. A 27 2820–36
Dydo J R, Chen Y and Cheng W 1998 Development and experimental verification of angular distortion models inwelded thin panels Defense Manufacturing Conf. (New Orleans)
Dydo J R and Cheng W 1999 Finite element modeling of angular distortion in stiffened thin-section panels Proc. 9thInt. Conf. on Computer Technology in Welding (Detroit)
Eggeler G, Hornbogen E, Yawny A, Heckmann A and Wagner M 2004 Structural and functional fatigue of NiTi shapememory alloys Mater. Sci. Eng. A 378 24–33
Elmer J W, Wong J and Ressler T 2000 In situ observation of phase transformations during solidification and coolingof austenitic stainless steel welds using time-resolved x-ray diffraction Scr. Mater. 43 751–7
Eshelby J D 1957 The Determination of the elastic field of an ellipsoidal inclusion and related problems Proc. R. Soc.A 241 376–96
Fairand B P, Williams D N, Wilcox B A and Gallaghe W J 1972 Laser shock-induced microstrutural and mechanicalproperty changes in 7075 aluminum J. Appl. Phys. 43 3893–5
Fett T and Munz D 1997 Stress Intensity Factors and Weight Functions (Southampton, UK: Computational MechanicsPublications)
Francis J A, Kundu S, Bhadeshia H K D H, Stone H J, Rogge R B, Withers P J and Karlsson L 2007 Transformationtemperatures and welding residual stresses in ferritic steels Proc. PVP2007 (San Antonio)
Fry A T 2002 Residual stress measurement: XRD depth profiling using successive material removal NPLGarvie R C, Hannick R H and Pascoe R T 1975 Ceramic steel? Nature 258 703–4Garwood S J and Boulton C F 1979 Cumulative damage in welded steel structures CEGB ReportGrant P V and Lord J D 2002 An evaluation of four hole drilling analysis techniques with respect to non-uniform
residual stress fields NPLGreen D and Knowles J 1992 The treatment of residual stress in fracture assessment of pressure vessels PVP Pressure
Vessel Fracture, Fatigue and Life Management (New York: ASME)Greene T W and Holzbaur A A 1946 Controlled low-temperature stress relieving Weld. J. Res. Suppl. 11 171s–85sGriffith A A 1920 The phenomena of rupture and flow in solids Phil. Trans. R. Soc. A 221 163–97Gruver R M and Buessem W R 1971 Residual stresses in cylindrical rods as measured by dimensional changes after
slotting Am. Ceram. Soc. Bull. 50 749–51Guz A N and Makhort F G 2000 The physical fundamentals of the ultrasonic nondestructive stress analysis of solids:
I. Appl. Mech. 36 1119–49Hall D A, Steuwer A, Cherdhirunkorn B, Withers P J and Mori T 2005 Micromechanics of residual stress and texture
development due to poling in polycrystalline ferroelectric ceramics J. Mech. Phys. Solids 53 249–60Han S, Brennan F P and Dover W D 2002 Development of the alternating current stress measurement model for
magnetostriction behaviour of mild steel under orthogonal magnetic fields for stress measurement J. StrainAnal. 37 21–31
Hauk V 1997 Structural and Residual Stress Analysis by Non-destructive Methods (Oxford: Elsevier)Hearn E J 1977 Mechanics of Materials (Oxford: Pergamon)Hill R 1952 The elastic behaviour of a crystalline aggregate Proc. Phys. Soc. Lond. A 65 349Holzapfel H, Schulze V, Vohringer O and Macherauch E 1998 Residual stress relaxation in an AISI 4140 steel due
quasistatic and cyclic loading at higher temperatures Mater. Sci. Eng. A 248 9–18Hooker V E, Aggson J R and Bickel D L 1974 Improvements in the Three-Component Borehole Deformation Gage
and Overcoring Techniques (Washington, DC: US Department of the Interior)Hornbogen E 2004 Thermo-mechanical fatigue of shape memory alloys J. Mater. Sci. 39 385–99Huang Y and Young R J 1994 Analysis of the fragmentation test for carbon-fibre epoxy model composites by means
of Raman spectroscopy Compos. Sci. Technol. 52 505–17Huber J E and Fleck N A 2001 Multi-axial electrical switching of a ferroelectric: theory versus experiment J. Mech.
Phys. Solids 49 785–811Hurrell P, Watson C T, Everett D and Bate S 2006 Review of residual stress mitigation methods for application in
nuclear power plant Proc. PVP 2006 (Vancouver, BC)Hutchings M T, Withers P J, Holden T M and Lorentzen T 2005 Introduction to the Characterisation of Residual
Stresses by Neutron Diffraction (Boca Raton, FL/London: CRC Press/Taylor and Francis)Hyde T R, Evans J T and Shaw B A 2000 Effect of stress and heat treatment on magnetic Barkhausen emission in
case carburized steels Mater. Eval. 58 985–90Inoue K, Yamaguchi Y, Ohoyama K, Note R and Enami K 2002 Martensitic and magnetic transformations of Ni2MnGa-
based shape-memory alloys Appl. Phys. A 74 S1061–5Irwin G R 1957 Analysis of stresses and strains near the end of a crack traversing a plate J. Appl. Mech. 24
361–4
2260 P J Withers
James M N 1998 Engineering materialism and structural integrity J. Eng. Des. 9 329–42Kang K J, Yao N, He M Y and Evans A G 2003 A method for in situ measurement of the residual stress in thin films
by using the focused ion beam Thin Solid Films 443 71–7Kaouache B, Berveiller S, Inal K, Eberhardt A and Patoor E 2004 Stress analysis of martensitic transformation in
Cu–Al–Be polycrystalline and single-crystalline shape memory alloy Mater. Sci. Eng. A 378 232–7Karaca H E, Karaman I, Lagoudas D C, Maier H J and Chumlyakov Y I 2003 Recoverable stress-induced martensitic
transformation in a ferromagnetic CoNiAl alloy Scr. Mater. 49 831–6Kelleher J, Buttle D J, Mummery P M and Withers P J 2005 Mapping residual stress in railway rails ICRS7 Mater.
Sci. Forum 490–1 165–70Kelleher J, Prime M B, Buttle D, Mummery P M, Webster P J, Shackleton J and Withers P J 2003 The measurement
of residual stress in railway rails by diffraction and other methods J. Neutron Res. 11 187–93Kim S-B, Evans A, Shackleton J, Bruno G, Preuss M and Withers P J 2005 Stress relaxation of shot-peened
Udimet 720Li under solely elevated temperature exposure and under isothermal fatigue Mater. Met. Trans.A 36 3041–53
King A, Steuwer A, Woodward C and Withers P J 2006 Effects of fatigue and fretting on residual stresses introducedby laser shock peening Mater. Sci. Eng. A 435–6 12–18
Kistler S S 1962 Stresses in glass produced by nonuniform exchange of monovalent ions J. Am. Ceram. Soc. 45 59–68Knott J F 1973 Fundamentals of Fracture Mechanics (London: Butterworths)Kodama S 1972 The behavior of residual stress during fatigue stress cycles Proc. Int. Conf. on Mechanical Behavior
of Metals II (Kyoto) (Kyoto: Society of Materials Science)Korsunsky A M, Regino G and Nowell D 2004 Variational determination of eigenstrain sources of residual stress: I.
Conf. on Computational and Experimental Engineering and Science (Madeira)Korsunsky A M and Withers P J 1997 Investigation of residual stress induced crack closure and its effects on fatigue
in metal matrix composites Key Eng. Mater. 127 1183–90Kroner E 1958 Berechnung der elastischen konstanten des vielkristalls aus den konstanten des einkristalls Z. Phys.
151 404–18Kumar A and Debroy T 2004 Guaranteed fillet weld geometry from heat transfer model and multivariable optimization
Int. J. Heat Mass Transfer 47 5793–806Kumar V, German M D and Shih C F 1981 An engineering approach for elastic–plastic fracture analysis Electrical
Power Research Institute Report Palo AltoKumar V, Schumacher B I and German M D 1985 Development of a procedure for incorporating secondary stresses
in the engineering approach Electric Power Research Institute ReportLebrun J L, Gergaud P, Ji V and Belassel M 1995 Interests of synchrotron-radiation for internal-stress analysis
J. Physique IV 4 265–8Lee H Y, Nikbin K M and O’Dowd N P 2005 A generic approach for a linear elastic fracture mechanics analysis of
components containing residual stress Int. J. Pressure Vessels Piping 82 797–806Leggatt R H and Davey T G 1988 Measurements of the reduction due to proof loads of residual stresses in simulated
pressure vessels Mechanical Relaxation of Residual Stresses (Philadelphia: ASTM)Leggatt R H, Smith D J, Smith S D and Faure F 1996 Development and experimental validation of the deep hole
method for residual stress measurement J. Strain Anal. Eng. Des. 31 177–86Lei Y, O’Dowd N P and Webster G A 2000 Fracture mechanics analysis of a crack in a residual stress field Int. J. Fract.
106 195–216Lester H H and Aborn R H 1925 Behaviour under stress of iron crystal in steel Army Ordnance 6 120–7Lester H H and Aborn R H 1925 Behaviour under stress of iron crystal in steel Army Ordnance 6 200–7Lester H H and Aborn R H 1925 Behaviour under stress of iron crystal in steel Army Ordnance 6 283–7Lester H H and Aborn R H 1925 Behaviour under stress of iron crystal in steel Army Ordnance 6 364–9Li J Y, Rogan R C, Ustundag E and Bhattacharya K 2005 Domain switching in polycrystalline ferroelectric ceramics
Nat. Mater. 4 776–81Li P N, Lei, Y., Zhong Q P and Li X R 2000 A Chinese structural integrity assessment procedure for pressure vessels
containing defects Int. J. Pressure Vessels Piping 77 945–52Lidbury D P G 1984 The significance of residual stresses in relation to the integrity of LWR pressure vessels Int. J.
Pressure Vessels Piping 17 197–328Liu Y N, Yang H, Liu Y, Jiang B H, Ding J and Woodward R 2005 Thermally induced fcc 〈−〉 hcp martensitic
transformation in Co–Ni Acta Mater. 53 3625–34Lupascu D C and Rodel J 2005 Fatigue in bulk lead zirconate titanate actuator materials: a review Adv. Eng. Mater.
7 882–98Ma S, Brown D, Bourke M A M, Daymond M R and Majurndar B S 2005 Microstrain evolution during creep of a
high volume fraction superalloy Mater. Sci. Eng. A 399 141–53
Residual stress and its role in failure 2261
Macdowell A A, Celestre R S, Tamura N, Spolenak R, Valek B, Brown W L, Bravman J C, Padmore H A, Batterman B Wand Patel J R 2001 Submicron x-ray diffraction Nucl. Instrum. Methods Phys. Res. A 467–8 936–43
Martin U, Altenberger I, Scholtes B, Kremmer K and Oettel H 1998 Cyclic deformation and near surfacemicrostructures of normalized shot peened steel SAE 10451 Mater. Sci. Eng. A 246 69–80
Masubuchi K 2003 Residual stresses and distortion in welds Encyclopedia of Materials: Science and Technologyed K H J Buschow et al (Oxford: Elsevier)
Mathar J 1934 Determination of initial stresses by measuring the deformation around drilled holes Trans. ASME 56249–54
Matthew B A, Green D J and Glass S J 2003 Fracture behavior of engineered stress profile soda lime silicate glassJ. Non-Cryst. Solids 321 10–19
McCarthy J, Pei Z, Becker M and Atteridge D 2000 FIB micromachined submicron thickness cantilevers for the studyof thin film properties Thin Solid Films 358 146–51
McElhone M and Rugg D 2005 Experimental evaluation of the fatigue performance of aero-engine fan blade dovetailsAeroMat (Florida) (Cleveland, OH: ASM)
McGuire P A and Groom J J 1979 computational analysis and experimental evaluation for residual stresses frominduction heating EPRI Battelle Memorial Institute
Meguid S A, Shagal G, Stranart J C, Liew K M and Ong L S 2005 Relaxation of peening residual stresses due tocyclic thermo-mechanical overload J. Eng. Mater. Technol.—Trans. ASME 127 170–8
Michaleris P and Sun X 1997 Finite element analysis of thermal tensioning techniques mitigating weld bucklingdistortion Weld. J. 76 451s–7s
Milbradt K P 1951 Ring method determination of residual stresses Proc. Soc. Exp. Stress Anal. 9 63–74Miller K J 2003 Structural integrity—whose responsibility? Proc. Inst. Mech. Eng. Part L—J. Mater.-Des. Appl. 217
1–21Milne I, Ainsworth R A, Dowling A R and Stewart A T 1988 Assessment of the integrity of structures containing
defects Int. J. Pressure Vessels Piping 32 3–104Minkevich A A, Gailhanou M, Micha J-S, Charlet B, Chamard V and Thomas O 2007 Inversion of the diffraction
pattern from an inhomogeouly strained crystal using an iterative algorithm Phys. Rev. B 76 104106Mollis S E and Clarke D R 1990 Measurement of stresses using fluorescence in an optical microprobe: stresses around
indentations in a chromium-doped sapphire J. Am. Ceram. Soc. 73 3189–94Moore M G and Evans W P 1958 Mathematical correction for stress in removed layers in x-ray diffraction residual
stress analysis SAE Trans. 66 340–5Mori T and Withers P J 2001 Residual stresses: interphase stresses Encyclopedia of Materials: Science and Technology
ed K H J Buschow (Oxford: Elsevier)Munsi A, Waddell A J and Walker C A 2001a The effect of vibratory stress on the welding microstructure and residual
stress distribution Proc. Inst. Mech. Eng. L 215 99–111Munsi A, Waddell A J and Walker C A 2001b Modification of residual stress by post-weld vibration Mater. Sci.
Technol. 17 601–5Munsi A S M Y, Waddell A J and Walker C A 2001c Vibratory stress relief—an investigation of the torsional stress
effect in welded shafts J. Strain Anal. 36 453–65Mura T 1987 Micromechanics of Defects in Solids (The Hague: Nijhoff)Narayanaswamy O S and Gardon R 1969 Calculation of residual stresses in glass J. Am. Ceram. Soc. 52 554–8Newey C W A and Weaver G H 1990 Materials Principles and Practice (London: Open University, Butterworths)Newnham R E 1998 Phase transformations in smart materials Acta Crystallogr. A 54 729–37Nicholas E D and Thomas W M 1998 A review of friction processes for aerospace applications Int. J. Mater. Product
Technol. 13 45–55Nikitin I, Scholtes B, Maier H J and Altenberger I 2004 High temperature fatigue behavior and residual stress stability
of laser-shock peened and deep rolled austenitic steel AISI 304 Scr. Mater. 50 1345–50Nishioka K, Hanabusa T and Fujiwara H 1974 Theory of x-ray residual stress analysis Scr. Metall. 8 1349–50Nowell D 1999 Strain changes caused by finite width slots, with particular reference to residual stress measurement
J. Strain Anal. Eng. Des. 34 285–94Noyan I C and Cohen J B 1985 An x-ray diffraction study of the residual stress–strain distributions in shotpeened
two-phase brass Mater. Sci. Eng. 75 179–93Noyan I C and Cohen J B 1987 Residual Stress—Measurement by Diffraction and Interpretation (New York: Springer)Nye J F 1985 Physical Properties of Crystals—Their Representation by Tensors and Matrices (Oxford: Clarendon)Oliver E C, Mori T, Daymond M R and Withers P J 2005 Orientation dependence of martensite variants during loading
of Fe–Pd shape memory alloy Scr. Mater. 53 609–12Oliver E C, Withers P J, Daymond M R, Ueta S and Mori T 2002 Neutron-diffraction study of stress-induced martensitic
transformation in TRIP steel Appl. Phys. A 74 S1143–5

2262 P J Withers
Orowan E 1948 Fracture and strength of solids Rep. Prog. Phys. 12 185–232Pang J W L, Holden T M, Turner P A and Mason T E 1999 Intergranular stresses in Zircaloy-2 with rod texture Acta
Mater. 47 373–83Pao Y H, Sachse W and Fukuoka H 1984 Acoustoelasticity and ultrasonic measurements of residual-stresses Phys.
Acoust. 17 61–143Paris P and Erdogan F 1963 A critical analysis of crack propagation laws J. Basic Eng. 85 528–34Patterson E 2001 Photoelasticity Encyclopedia of Materials: Science and Technology ed K H J Buschow et al (Oxford:
Elsevier)Peel M, Steuwer A, Preuss M and Withers P J 2003 Microstructure, mechanical properties and residual stresses as a
function of welding speed in aluminium AA5083 friction stir welds Acta Mater. 51 4791–801Pfeifer M A, Williams G J, Vartanyants I A, Harder R and Robinson I K 2006 Three-dimensional mapping of a
deformation field inside a nanocrystal Nature 442 63–6Pintschovius L and Jung V 1983 Residual stress measurements by means of neutron diffraction Mater. Sci. Eng.
61 43–50Pintschovius L, Jung V, Macherauch E, Schafer R and Vohringer O 1981 Determination of residual stress distributions
in the interior of technical parts by means of neutron diffraction Residual Stress and Stress Relaxation;Proceedings of the 28th Army Materials Research Conf. (Lake Placid, July) ed E Kula and V Weiss (NewYork: Plenum)
Preuss M, Pang J W L, Withers P J and Baxter G J 2002 Inertia welding nickel-based superalloy: II: Residual stressdevelopment Metal. Mater. Trans. A 33 3227–34
Prevey P, Jayaraman N, Ontko N, Shepard M, Ware R and Coate J 2005 Mechanical Suppression of SCC and CorrosionFatigue In 300M Steel Landing Gear (Lambda Technologies)
Prevey P S 2000 The effect of cold work on the thermal stability of residual compression in surface enhanced IN71820th ASM Materials Solution Conf. (St Louis, MI)
Prevey P S and Cammett J T 2004 The influence of surface enhancement by low plasticity on the corrosion fatigueperformance of AA7075: I. J. Fatigue 24 975–82
Prevey P S, Shepard M J and Smith P R 2001 The effect of low plasticity burnishing LPB on the HCF performanceand FOD resistance of Ti–6Al–4V 6th National Turbine Engine HCF Conf. (Jacksonville, FL)
Prime M 1999 Residual stress measurement by successive extension of a slot: the crack compliance method Appl.Mech. Rev. 52 75–96
Prime M 2000 The contour method; simple 2D mapping of residual stresses Int. Conf. Res. Stress 6 ed G A Webster(Oxford: Institute of Materials)
Prime M B 2001 Cross sectional mapping of stresses by measuring the contour after a cut J. Mater. Eng. Technol.—Trans. ASME 123 162–8
Prime M B and Hill M R 2002 Residual stress, stress relief and inhomogeneity in Al plate Scr. Mater. 46 77–82Prime M B and Hill M R 2004 Measurement of fiber-scale residual stress variation in a metal-matrix composite
J. Compos. Mater. 38 2079–95Pugh S F 1958 The mechanism of growth of uranium on thermal cycling in the alpha-range J. Inst. Met. 86 497–503Quinn S, Dulieu-Barton J M and Langlands J M 2004 Progress in thermoelastic residual stress measurement Strain
40 127–33Rankin J E, Hill M R and Hackel L A 2003 The effects of process variations on residual stress in laser 7049 T73
aluminum alloy Mater. Sci. Eng. A 349 279–91Rendler N J and Vigness I 1966 Hole-drilling strain-gage method of measuring residual stresses Exp. Mech.
6 577–86Retraint D and Lu J 2000 Study of residual stress distribution by the combination of three techniques in an aluminium
based MMC ECRS 5: Proc. 5th European Conf. on Residual Stresses Mater. Sci. Forum 347–9 498–503Reynolds A P, Tang W, Gnaupel-Herold T and Prask H 2003 Structure, properties, and residual stress of 304L stainless
steel friction stir welds Scr. Mater. 48 1289–94Rice J R 1968 A path independent integral and the approximate analysis of strain concentration by notches and cracks
J. Appl. Mech. 35 379–86Richards D G, Prangnell P B, Withers P J, Williams S W, Wescott A and Oliver E C 2006 Geometry effects when
controlling residual stresses welds by mechanical tensioning ECRS7 Mater. Sci. Forum 524–5 71–6Roche R L 1989 Practical procedure for stress classification Int. J. Pressure Vessels Piping 37 27–44Roylance D 1996 Mechanics of Materials (New York: Wiley)Ruschau J J, John R, Thompson S R and Nicholas T 1999 Fatigue crack nucleation and growth rate behavior of laser
shock peened titanium: I. J. Fatigue 21 S199–209Sabate N, Vogel D, Gollhardt A, Keller J, Michel B, Cane C, Gracia I and Morante J R 2006 Measurement of residual
stresses in micromachined structures in a microregion Appl. Phys. Lett. 88 254–9

Residual stress and its role in failure 2263
Sadanada K, Vasudevan A K, Holtz R L and Lee E U 1999 Analysis of overload effects and related phenomena: I.J. Fatigue 21 S233–46
Said G 2006 Study on ASTM E399 and ASTM E1921 standards Fatigue Fract. Eng. Mater. Struct. 29 606–14Saigal A, Kupperman D S and Majumdar S 1992 Residual strains in titanium matrix high temperature composites
Mater. Sci. Eng. A 150 59–66Sauer G 1964 Stretching as a method to reduce residual stresses of 1st step Z. Metallk. 55 811–15Schajer G S 1981 Application of finite element calculations to residual stress measurements J. Eng. Mater. Technol.
103 157–63Schajer G S 1988 Measurement of non-uniform residual stresses using the hole-drilling method (part I) J. Eng. Mater.
Technol. 103 338–43Schajer G S 1988 Measurement of non-uniform residual stresses using the hole-drilling method (part II) J. Eng. Mater.
Technol. 103 344–9Schajer G S 2001 Residual stresses: destructive measurements Encyclopedia of Materials Science and Technology
ed K H J Buschow et al (Oxford: Elsevier)Schoenig F C, Soules J A, Chang H and Dicello J J 1995 Eddy current measurement of residual stresses induced by
shot peening in titanium Ti–6Al–4V Mater. Eval. 53 22–6Sendek P 1997 Vibration treatment—effective method of improving the dimensional stability of welded structures:
investigation and prectice Weld. Surf. Rev. 8 221–8Shih C F and Hutchinson J W 1976 Fully plastic solitions and large-scale yielding estimates for plane stress crack
problems J. Eng. Mater. Technol., Trans. ASME 98 289–95Sinclair R, Preuss M and Withers P J 2005 Imaging and strain mapping fibre by fibre in the vicinity of a fatigue crack
in a Ti/SiC fibre composite Mater. Sci. Technol. 21 27–34Smith D J and Garwood S J 1990 The significance of prior overload on fracture-resistance—a critical-review Int. J.
Pressure Vessels Piping 41 255–96Stacey A, Barthelemy J Y, Leggatt R H and Ainsworth R A 2000 Incorporation of residual stresses into the SINTAP
defect assessment procedure Eng. Fract. Mech. 67 573–611Staron P, Kocak M and Williams S 2002 Residual stresses in friction stir welded Al sheets Appl. Phys. A 74 S1161–2Stefanescu D, Steuwer A, Owen R A, Nadri B, Edwards L, Fitzpatrick M E and Withers P J 2004 Elastic strains around
cracked cold expanded fastener holes measured using the synchrotron x-ray diffraction technique J. Strain Anal.39 459–69
Steuwer A, Peel M and Withers P J 2006 Dissimilar friction stir welds in AA5083-AA6082. The effect of processingparameters on residual stress Mater. Sci. Eng. A 441 187–96
Steuwer A, Rahman M, Fitzpatrick M E, Edwards L and Withers P J 2007 The evolution of residual and crack-tipstresses during a fatigue overload Acta Mater. submitted
Stone H J, Bhadeshia H K D H and Withers P J 2008 In situ monitoring of weld transformations to control weldresidual stresses MecaSENS Conf. (Austria, 2007) Mater. Sci. Forum submitted
Suresh S 1983 Mechanisms of fatigue crack growth retardation following overloads Eng. Fract. Mech. 18 577–93Suresh S 1991 Fatigue of Materials (Cambridge: Cambridge University Press)Suresh S and Ritchie R O 1984 Propagation of short fatigue cracks Int. Met. Rev. 29 445–76Tada H 1970 Westergaard stress functions for several periodic crack problems Eng. Fract. Mech. 2 177–80Tada H, Paris P and Irwin G 1985 The Stress Analysis of Cracks Handbook (St Louis, MO: Del Research Corporation)Thomas W M, Nicholas E D, Needham J C, Murch M G, Temple-Smith P and Dawes C J 1991 Friction stir butt
welding International Patent Specification PCT/GB92/02203; GB Patent Specification 9125978.8; US PatentSpecification 5460317
Tiitto S 1977 Influence of microstructure on magnetization transitions in steel Acta Polytech. Scand.—Appl. Phys. Ser.119 3–80
Timoshenko S P and Goodier J N 1982 Theory of Elasticity (New York: McGraw-Hill)Tome C 2001 Elastic behaviour of polycrystals Encyclopedia of Materials: Science and Technology ed K H J Buschow
(Oxford: Elsevier)Turski M, Spindler M W, Bouchard P J and Withers P J 2007 Residual stress driven creep cracking in type 316 stainless
steel Acta Mater. submittedUeda Y and Yuan M G 1993 Prediction of residual-stresses in butt welded plates using inherent strains J. Eng. Mater.
Technol.—Trans. ASME 115 417–23Vaidyanathan R, Bourke M A M and Dunand D C 1999 Phase fraction, texture and strain evolution in superelastic
NiTi and NiTi-TiC composites investigated by neutron diffraction Acta Mater. 47 3353–66Vaidyanathan S and Finnie I 1971 Determination of residual stresses from stress intensity factor measurements J. Basic
Eng. 93 242–6Van Humbeeck J 1999 Non-medical applications of shape memory alloys Mater. Sci. Eng. A 275 134–48
2264 P J Withers
Vasudevan A K and Sadanada K 1995 Classification of fatigue crack growth behavior Met Trans. A 26 1221–34Vasudevan A K, Sadanada K and Glinka G 2001 Critical parameters for fatigue: I. J. Fatigue 23 S39–53Vishay Measurements Group 1993 Measurement of Residual Stresses by the Hole drilling Strain Gauge MethodWalker C A, Waddell A J and Johnston D J 1995 Vibratory stress relief—an investigation of the underlying processes
Proc. Inst. Mech. Eng. E 209 51–8Wanjara P and Jahazi M 2005 Linear friction welding of Ti–6Al–4V: processing, microstructure, and mechanical-
property inter-relationships Metall. Mater. Trans. A 36 2149–64Watts M R and Withers P J 1997 The interpretation of x-ray stress measurements of metal matrix composites using
computer modelling techniques 11th Int. Conf on Composite Materials (Gold Coast, Australia) ed M L Scottet al (Cambridge, UK: Woodhead Publishing)
Webster G A and Ezeilo A N 2001 Residual stress distributions and their influence on fatigue lifetimes Int. J. Fatigue23 S375–83
Webster P J, Wang X D and Mills G 1996 Through thickness strain scanning using synchrotron radiation Mater. Sci.Forum 228 227–32
Westergaard H M 1939 Bearing pressures and cracks Trans. ASME 61 A49–53Wheeler O E 1972 Spectrum loading and crack growth J. Basic Eng. 94 181–6Wilson D V and Konnan Y A 1964 Work hardening of a steel containing a coarse dispersion of cementite particles
Acta Metall. 12 617–28Withers P J 1988 The development of the Eshelby model and its application to metal matrix composites PhD Thesis
University of CambridgeWithers P J 1995 Neutron strain measurement of internal strain in metal and ceramic composites Key Eng. Mater.
108–10 291–314Withers P J 2003 Use of synchrotron x-ray radiation for stress measurement Analysis of Residual Stress by Diffraction
using Neutron and Synchrotron Radiation ed M E Fitzpatrick and A Lodini (London: Taylor and Francis)Withers P J and Bhadeshia H K D H 2001 Residual stress: II. Nature and origins Mater. Sci. Technol. 17 366–75Withers P J and Clarke A P 1998 A neutron diffraction study of load partitioning in continuous Ti/SiC composites
Acta Mater. 46 6585–98Withers P J, Jensen D J, Lilholt H and Stobbs W M 1987 The evaluation of internal stresses in a short fibre metal
matrix composite by neutron diffraction Proc. ICCM VI/ECCM2 (London) ed F L Matthews (Oxford: Elsevier)Withers P J, Preuss M, Steuwer A and Pang J W L 2007 Methods for the obtaining the strain-free lattice parameter
when using diffraction to determine residual stress J. Appl. Crystallogr. 40 891–904Withers P J, Stobbs W M and Pedersen O B 1989 The application of the eshelby method of internal stress determination
for short fibre metal matrix composites Acta Met. 37 3061–84Withers P J and Webster P J 2001 Neutron and synchrotron x-ray strain scanning Strain 37 19–31Wohler A 1860 Versuche zur Ermittlung der auf die Eisenbahnwagenachsen einwirkenden Krafte und die
Widerstandsfahigkeit der Wagen-Achsen Z. Bauwesen X 583–616Wong A K 2001 Stress distribution: analysis using thermoelastic effect Encyclopedia of Materials: Science and
Technology ed K H J Buschow et al (Oxford: Elsevier)Wu S, Zhao H Y, Lu A L, Fang H Z and Tang F 2003 A micro-mechanism model of residual stress reduction by low
frequency alternating magnetic field treatment J. Mater. Process. Technol. 132 198–202Yamamoto J, Muramatsu Y, Zenitani S, Hayakawa N and Hiraoka K 2002 Control of welding residual stress by low-
temperature transformation welding consumables—influence of restraint of joint and transformation-temperatureon residual stress Proc. 6th Int. Conf. on Trends in Welding Research (Pine Mountain) pp 902–5
Yang Y P, Dong P, Tian X and Zhang Z 1998 Prevention of hot cracking of high strength aluminum alloy by mechanicalrolling Proc. 5th Int. Conf. Trends in Welding Research (Pine Mountain)
Yang Y P, Dong P, Zhang J and Tian X 2000 A hot-cracking mitigation technique for welding high-strength aluminumalloy Weld. J. 79 9S–17S
Young R J 2001 Residual stresses: measurement by Raman shifts Encyclopedia of Materials: Science and Technologyed K H J Buschow et al (Oxford: Elsevier)
Zacharia T, Vitek J M, Goldak J A, Debroy T A, Rappaz M and Bhadeshia H 1995 Modeling of fundamental phenomenain welds Modelling Simul. Mater. Sci. Eng. 3 265–88
Zhuang W Z and Halford G R 2001 Investigation of residual stress relaxation under cyclic stress Int. J. Fatigue23 S31–37
Zien H M 1983 Fracture-mechanics J-integral calculations in thermo-elasto-plasticity Comput. Struct. 17 775–81Zrnik J, Muransky O, Lukas P, Sittner P and Novy Z 2005 In-situ neutron diffraction analysis of phase transformation
kinetics in TRIP steel New Frontiers of Processing and Engineering in Advanced Materials Mater. Sci. Forum502 339–44