resistance in mice islets against diet-induced obesity and ... · barbosa aguila, carlos alberto...
TRANSCRIPT

Renin-Angiotensin System Blockers Protect PancreaticIslets against Diet-Induced Obesity and InsulinResistance in MiceEliete Dalla Corte Frantz, Camila Crespo-Mascarenhas, Andre Rodrigues C. Barreto-Vianna, MarciaBarbosa Aguila, Carlos Alberto Mandarim-de-Lacerda*
Laboratory of Morphometry, Metabolism and Cardiovascular Disease, Biomedical Center, Institute of Biology, State University of Rio de Janeiro, Rio de Janeiro,Rio de Janeiro, Brazil
Abstract
Background: The associations between obesity, hypertension and diabetes are well established, and the renin-angiotensin system (RAS) may provide a link among them. The effect of RAS inhibition on type 2 diabetes is stillunclear; however, RAS seems to play an important role in the regulation of the pancreas and glucose intolerance ofmice fed high-fat (HF) diet.Methods: C57BL/6 mice fed a HF diet (8 weeks) were treated with aliskiren (50 mg/kg/day), enalapril (30 mg/kg/day)or losartan (10 mg/kg/day) for 6 weeks, and the protective effects were extensively compared among groups bymorphometry, stereological tools, immunostaining, Western blotting and hormonal analysis.Results: All RAS inhibitors significantly attenuated the increased blood pressure in mice fed a HF diet. Treatmentwith enalapril, but not aliskiren or losartan, significantly attenuated body mass (BM) gain, glucose intolerance andinsulin resistance, improved the alpha and beta cell mass and prevented the reduction of plasma adiponectin.Furthermore, enalapril treatment improved the protein expression of the pancreatic islet Pdx1, GLUT2, ACE2 andMas receptors. Losartan treatment showed the greatest AT2R expression.Conclusion: Our findings indicate that ACE inhibition with enalapril attenuated several of the deleterious effects ofthe HF diet. In summary, enalapril appears to be responsible for the normalization of islet morphology and function,of alpha and beta cell mass and of Pdx1 and GLUT2 expression. These protective effects of enalapril were attributed,primarily, to the reduction in body mass gain and food intake and the enhancement of the ACE2/Ang (1-7) /Masreceptor axis and adiponectin levels.
Citation: Frantz EDC, Crespo-Mascarenhas C, Barreto-Vianna ARC, Aguila MB, Mandarim-de-Lacerda CA (2013) Renin-Angiotensin System BlockersProtect Pancreatic Islets against Diet-Induced Obesity and Insulin Resistance in Mice. PLoS ONE 8(7): e67192. doi:10.1371/journal.pone.0067192
Editor: Bridget Wagner, Broad Institute of Harvard and MIT, United States of America
Received February 22, 2013; Accepted May 15, 2013; Published July 22, 2013
Copyright: © 2013 Frantz et al. This is an open-access article distributed under the terms of the Creative Commons Attribution License, which permitsunrestricted use, distribution, and reproduction in any medium, provided the original author and source are credited.
Funding: The present work received financial support by the agencies CNPq (Brazilian Council of Science and Technology, www.cnpq.br) [grant numberE26/110.549/2010, C.A.M.L.] and FAPERJ (Rio de Janeiro State Foundation for Scientific Research, www.faperj.br) [grant number 302154/2011-6,C.A.M.L.]. The funders had no role in study design, data collection and analysis, decision to publish, or preparation of the manuscript.
Competing interests: Marcia B. Aguila is a PLOS ONE Editorial Board member. This does not alter the authors' adherence to all the PLOS ONE policieson sharing data and materials.
* E-mail: [email protected]
Introduction
Obesity is strongly associated with both type 2 diabetesmellitus (T2DM) and hypertension, a combination that hasbecome a major public health problem because of its epidemicproportions worldwide [1]. The renin-angiotensin system (RAS)is overexpressed when associated with obesity and itscomorbidities and has emerged as an important target forpharmacological treatment [2,3].
Classically, the RAS is known for its role in body fluid andcardiovascular homeostasis. The RAS consists primarily of an
enzymatic cascade through which angiotensinogen isconverted to angiotensin (Ang) I, which is then converted toAng II, through the action of renin and the angiotensin-converting enzyme (ACE) [4]. ACE also inactivates bradykinin[5], and Ang II mediates its specific functions via type 1 andtype 2 receptors, i.e., AT1R and AT2R. Most of these functionsare mediated by AT1R, including the potent vasoconstriction,proinflammatory, pro-oxidative, proliferative and hypertrophiceffects. Moreover, advances in cell and molecular biology haveallowed the recognition of other active elements of the RASmetabolism. Ang (1-7) may be formed primarily from Ang II
PLOS ONE | www.plosone.org 1 July 2013 | Volume 8 | Issue 7 | e67192

(directly) and Ang I (indirectly) by the action of ACE 2, ahomolog of ACE [6]. Through its G-protein-coupled receptorMas, Ang (1-7) induces responses in opposition to those ofAng II, including vasodilation, antihypertrophic effects, andantiproliferative properties [7,8].
Over the past few years, RAS components have been foundin almost every tissue, including the heart, blood vessels,kidney, brain, pancreas, adipose tissue and skeletal muscles[2]. Furthermore, a large body of evidence indicates that RASactivation has been closely correlated to both insulin resistanceand beta cell dysfunction [9]. The mechanism behind thisdeleterious effect appears to be related to the negativeregulation, exerted by Ang II through AT1R, of several steps ofthe insulin signaling cascade [10]. In addition, hyperglycemiaincreases the expression of RAS components in pancreaticislets, which leads to insulin secretion modulation in beta cells,decreased adiponectin, impaired insulin sensitivity in targettissues [11], inhibited GLUT4 translocation and increasedlevels of reactive oxygen species, inflammation, and ectopic fatstorage [12].
The increase in the ACE2/Ang (1-7) /Mas receptor axis couldbe associated with diminished insulin resistance by inducingthe activation of insulin signaling pathways and counteractingthe inhibitory effects of ACE/Ang II/AT1R [7]. ACE2 genetherapy improves glycemic control in diabetic mice through amechanism mediated by the Ang (1-7) /Mas receptor becauseof its proven ability to potentiate the action of bradykinin [13].There is evidence that bradykinin itself may have an effect onenhancing insulin action and signaling [14]. Moreover, it isremarkable to note that, together with results from the beta cellinjury, stands out the key role of the Pdx1(pancreatic-duodenalhomeobox 1) in prenatal development of the pancreas, as wellas the postnatal maintenance of the insulin production, and thetranscriptional expression of GLUT (glucose transporter) 2[15–17].
The present study aimed to compare the effect of blockades,using a direct renin inhibitor, an ACE inhibitor, and an AT1Rantagonist, at different points in the RAS on glucoseintolerance and pancreatic injury in a mice model of insulinresistance and obesity.
Materials and Methods
Animals and dietMale C57BL/6 mice (12 weeks old) were maintained on a 12
h light/dark cycle (light on at 1 a.m.; light off at 1 p.m.), in ahumidity- (60 ± 10%) and temperature- (21 ± 2 °C) controlledroom. Animal care and procedures were in accordance with theconventional guidelines for experimentation with animals(National Institutes of Health Publication No. 85-23, revised in1996) and were approved by the Animal Ethics Committee ofthe State University of Rio de Janeiro (Protocol Number CEA/21/2011).
The mice were fed ad libitum a standard chow (SC, n=15)diet (14% protein, 10% fat, and 76% carbohydrates, totalenergy 15 kJ/g) or a high-fat (HF, n=60) diet (14% protein, 50%fat and 36% carbohydrates, total energy 21 kJ/g). The dietswere manufactured by PragSolucoes (Jau, Sao Paulo, Brazil)
and were consistent with the recommendations of theAmerican Institute of Nutrition (AIN 93M) [18]. After eightweeks of diet, the animals fed HF chow were randomlyallocated into four groups, and each group received one of thefollowing treatments over six weeks (the drugs were mixed intothe diets, as follow):
a) HF group (n=15), untreated;b) HF-A group (n=15), HF diet treated with aliskiren (50
mg/kg/day), Rasilez, Novartis;c) HF-E group (n=15), HF diet treated with enalapril maleate
(30 mg/kg/day), Renitec, Merck;d) HF-L group (n=15), HF diet treated with losartan (10
mg/kg/day), Cozaar, Merck.
Both the SC and HF groups continued to have free access totheir diet during the entire experimental period (eight weeksplus six weeks). Fresh chow was provided daily, and their foodintake was evaluated. Energy intake was measured as theproduct of food consumption by the energy content of the diet.The body mass (BM) of the animals was measured weekly.
Blood pressureThe animals were trained for two weeks in constraint
conditions before the measurement of the blood pressure (BP)to minimize their stress. Twice a month, systolic BP wasmeasured by tail-cuff plethysmography in conscious mice(Letica LE 5100; Panlab, Barcelona, Spain).
Glucose and insulin toleranceAn oral glucose tolerance test (OGTT) was made after 6 h of
food deprivation (1 a.m. -7 a.m.). Glucose (1.0 g/kg) wasadministered by orogastric gavage, and caudal vein bloodsamples were collected before and at 15, 30, 60 and 120 minafter glucose administration. Blood glucose concentrationswere measured using an Accu-Chek Go glucometer (RocheDiagnostics).
An intraperitoneal insulin tolerance test (IPITT) wasperformed after 4 h of food deprivation (1 a.m. -5 a.m.). Insulin(0.5 U/kg, Humalog Insulin Lispro, Lilly) was administeredintraperitoneally, and caudal vein blood samples were collectedbefore and at 15, 30, 60, 120 min after the injection. Bloodglucose concentrations were measured using an Accu-ChekGo glucometer (Roche Diagnostics).
The area under the curve (AUC) was calculated for OGTTand IPITT from 0 to 120 minutes using the trapezoid rule(GraphPad Prism version 6.02 for Windows, GraphPadSoftware, La Jolla, CA, USA) to assess glucose intoleranceand insulin sensitivity, respectively.
Tissue extractionAfter 14 weeks on the diet (including the 6 weeks of
treatment), the animals were fasted overnight (food-deprivedfrom 01:00 to 07:00 h) and then deeply anaesthetized (sodiumpentobarbital, 150 mg/kg intraperitoneal). Blood samples werecollected, and the plasma was separated by centrifugation (120g for 15 min), used to measure fasting plasma glucose, andstored at -20 ºC until further analyses could be performed. Thepancreas was completely dissected (n=6), or the islets were
Renin-Angiotensin System and Pancreatic Islets
PLOS ONE | www.plosone.org 2 July 2013 | Volume 8 | Issue 7 | e67192

isolated by collagenase digestion (n=9). When dissected, thepancreas was weighed and then rapidly fixed in freshlyprepared fixative solution [4% (w/v) formaldehyde and 0.1 Mphosphate buffer, pH 7.2] for analysis by light microscopy(n=6).
Metabolic dataThe plasma concentrations of insulin and glucagon were
evaluated using the Milliplex mouse metabolic hormone panelkit NMHMAG-44K, while the concentrations of adiponectinwere evaluated with MADPK-71K-1ADPN with Luminex xMAPequipment (Millipore, Billerica, MA, USA). The homeostasismodel assessment of insulin resistance (HOMA-IR) index, asimple assessment of insulin sensitivity, was calculated by thefollowing formula: [fasting plasma glucose (mmol/L) × insulin(µUI/L)]/22.5 [19].
PancreasIslet morphometry. Fixed pancreas samples were
embedded in Paraplast plus (Sigma Aldrich, St. Louis, USA),sectioned into 5-μm-thick sections, and stained withhematoxylin and eosin. From the digital images of thepancreatic slides (TIFF format, 36-bit color, 1280×1024 pixels,LC Evolution camera and Olympus BX51 microscope), thesmallest and largest diameters from each islet were measuredto calculate the mean diameter (Image-Pro Plus version 7.01,Media Cybernetics, Silver Spring, MD, USA). At least 150 isletsper group were measured, as described previously [20].
Next, the pancreatic fat density was estimated by a 36 testpoint test (PT) system superimposed on the tissue image bySTEPanizer [21], as Vv[fat] = Pp/PT, where Pp represents thepoints that fall on fat cells in a sample of ten random fields peranimal.
Immunohistochemistry. For glucagon and insulinimmunohistochemistry, deparaffinized and hydrated tissuesections were treated with citrate buffer, pH 6.0, at 60 °C forantigen retrieval and then with a 3% hydrogen peroxidesolution in methanol to block endogenous peroxidase activity.The pancreas sections were incubated overnight with rabbitanti-glucagon (A0565, Dako; 1:100), or guinea pig anti-insulin(A0564, Dako; 1:100), followed by incubation with biotinylatedsecondary antibodies and streptavidinperoxidase conjugates(HistostainPlus Kit, Invitrogen, CA, USA). The sections werewashed in PBS, revealed with liquid diaminobenzidine(HistostainPlus Kit, Invitrogen, CA, USA), and counterstainedwith hematoxylin.
Alpha and Beta cell masses. The islet volume density(Vv[islet]) and islet mass (M[islet]): Vv[islet] were estimated bypoint-counting using the ratio of the number of points that fellupon the pancreatic islet (Pp[islet]) and the total number oftest-points in a test system made up of 36 test-points (PT):Vv[islet] = Pp[islet]/PT (%), assessed by STEPanizer [21].Subsequently, M[islet] was obtained by multiplying the isletvolume density by the pancreatic mass.
Alpha cell volume density (Vv[alpha cell]) and alpha cellmass (M[alpha cell]): Vv[alpha cell] were estimated using theglucagon-positive areas of the islets and was expressed as apercentage of the islet (Image-Pro Plus version 7.01, Media
Cybernetics, Silver Spring, MD, USA). Thus, alpha cell masswas estimated as the product of Vv[alpha cell] and M[islet] [20].
Beta cell volume density (Vv[beta cell]) and beta cell mass(M[beta cell]): Vv[beta cell] were estimated by image analysisusing the density threshold selection tool applied to islets withinsulin-positive areas. Vv[beta cell] was expressed as apercentage of the islets (Image-Pro Plus version 7.01, MediaCybernetics, Silver Spring, MD, USA). Thus, the beta cell masswas estimated as the product of Vv[beta cell] and M[islet] [22].
Islet isolation. Islets were isolated by the collagenasemethod [23]. Briefly, the pancreas was cannulized via the bileduct and inflated in situ with cold Hanks’ solution(supplemented with foetal bovine serum 1 mg/mL) containing0.8 mg/mL collagenase (C9263, Sigma Aldrich, St. Louis,USA). The pancreas was removed, placed into a tube andincubated in a 37 ºC water bath for 15 min to allow thedigestion of the exocrine tissue. Afterwards, the tubes werevigorously shaken for approximately 15 seconds. Thecollagenase digestion was terminated by the addition of coldHanks’ solution. The digest was then washed three times byfilling the vial with Hanks’ solution. The islets were collectedmanually under a stereomicroscope (Luxeo 4D StereozoomMicroscope, Labomed, CA, USA) with a Pasteur pipette andimmediately homogenized in extraction buffer (urea, 7 M;EDTA, 5 mM; Triton X-100, 1%; protease and phosphataseinhibitors).
Western blotting analysisThe isolated pancreatic islet homogenate was centrifuged at
11,000 rpm at 4 ºC for 10 min, and the supernatant wascollected. The lysate protein concentration was determinedusing a BCA protein assay kit (Thermo Scientific, Rockford, IL,USA). After denaturation, proteins were separated bypolyacrylamide gel electrophoresis (SDS-PAGE) andtransferred to a nitrocellulose membrane (AmershamBiosciences, Piscataway, NJ, USA). The membrane was thenblocked by incubation in 6% (w/v) non-fat dry milk in TBS-TTris-buffered saline [20 mmol/L Tris/HCl (pH 7.4) and 500mmol/L NaCl] and sequentially incubated overnight at 4°C withthe following primary antibodies: Pdx1 (anti-rabbit, AB3503;Chemicon; 1:1000), GLUT2 (anti-rabbit, 07-1402; Millipore;1:1000), Renin (anti-mouse, SC137252; Santa CruzBiotechnology; 1:1000), ACE (anti-rabbit, ab11734; Abcam;1:500), AT1R (anti-rabbit, SC579; Santa Cruz Biotechnology;1:1000), AT2R (anti-goat, SC48452; Santa CruzBiotechnology; 1:1000), ACE 2 (anti-rabbit, ab108252; Abcam;1:500) and Mas receptor (anti-rabbit, SC135063; Santa CruzBiotechnology; 1:1000). Following incubation with the primaryantibody, the membrane was incubated with the secondaryantibody for 1 h at room temperature. The membrane wasdeveloped using ECL western blotting detection reagents, andimages of the blot were obtained with Bio-Rad’s MolecularImaging ChemiDoc XRS Systems (Bio-Rad, Hercules, CA,USA). The intensity of the chemiluminescent bands wasquantified using ImageJ software, version 1.44 (NIH,imagej.nih.gov/ij, USA). The blots were stripped and reprobedfor beta actin (anti-mouse, SC81178; Santa Cruz
Renin-Angiotensin System and Pancreatic Islets
PLOS ONE | www.plosone.org 3 July 2013 | Volume 8 | Issue 7 | e67192

Biotechnology; 1:1000) as a loading control to normalize theblot data.
Statistical analysisThe data were tested for normality and homoscedasticity of
the variances. The differences among the groups were testedby one-way analysis of variance (ANOVA), followed by theHolm-Sidak post-hoc test. In all cases, P<0.05 was consideredstatistically significant (GraphPad Prism version 6.02 forWindows, GraphPad Software, La Jolla, CA, USA).
Results
Body mass and food behaviorThe animals started the study with no significant difference in
their initial BM (Figure 1). After two weeks on their respectivediets, the HF group demonstrated a higher BM than the SCgroup (+17%, P<0.001), and the difference in BM continued toincrease up +31% in the HF group compared to SC group ateight weeks of diet consumption (P<0.0001). After six weeks oftreatment, HF-E group showed a significant decrease in BM,25% less than the HF group (P<0.0001). However, the HF-Aand HF-L groups continued to be heavier than the SC group(+21% and +28%, respectively, P<0.0001) and the HF-E group(+24% and +31%, respectively, P<0.0001) (Figure 1).
The average weekly food intake was constant in each groupover the period of six weeks of treatment, but the food intakewas diminished in the HF-E group compared to the othergroups (P<0.05). The energy intake was greater in the HFgroup than in the SC group (+35%; P<0.01), as indicated bycalculating the energy provided by the diets based on theirenergy density (Table 1). Compared to the mice in the SCgroup after six weeks of treatment, the mice in the HF-A grouphad increased their energy intake by 31% (P<0.05), and themice in the HF-L group had increased their energy intake by44% (P<0.01). In the six-week treatment period, the mice in theHF-E group decreased their energy intake by 25% compared tothe mice in the HF group (P<0.05), by 23% compared to themice in the HF-A group (P<0.05), and by 30% compared to themice in the HF-L group (P<0.01) (Table 1).
After four weeks of the diets, the BP was significantlyincreased in the animals fed HF diets, compared to that of theSC group (+10%, P<0.05). The difference continued toincrease and reached 15% higher at 14 weeks (P<0.01)(Figure 2). All of the treatments that decreased BP hadreached values similar to the SC group by the end of theexperiment (Figure 2).
Glucose and InsulinThe OGTT results were similar in both the SC and HF-E
groups (Figure 3A and B). Compared to the SC group, theOGTT result was higher in the following groups: HF (+24%,P<0.01), HF-A (+17%, P<0.05), and HF-L (+19%, P<0.05)(Figure 3B). Compared to the HF group, enalapril amelioratedglucose tolerance, based on the lower levels of insulinnecessary to clear the plasma glucose (-17%, P<0.01), thelower absolute fasting glucose levels, and the decreased rate
of change after glucose overload administration in the first 15to 30 minutes observed in the HF-E group (Figure 3A).
Compared to the SC group, the AUC total values to theIPITT were higher in the following groups: HF (+33%, P<0.01),HF-A (+23%, P<0.05), and HF-L (+21%, P<0.05) (Figure 3Cand D). These results imply that these latter groups were lessinsulin sensitive, with consequent abnormally high glucoseconcentrations from 15 to 30 minutes compared with SCanimals (Figure 3C). This is the typical feature of the isletdysfunction in the insulin resistance state. The HF-E group hasshown a better insulin sensitivity in comparison to the HFgroup, since the AUC to the IPITT was smaller in the HF-Egroup than in the HF group (-21%, P<0.01) (Figure 3D).
Metabolic parametersCompared to the SC group, hyperinsulinemia and
hyperglycemia were observed in the HF, HF-A, and HF-Lgroups (Table 1), which is consistent with the findings ofglucose intolerance in the OGTT and insulin resistance in theIPITT (Figure 3). Consequently, the HF, HF-A, and HF-Lgroups showed both higher fasting plasma glucose and insulinlevels and higher HOMA-IR compared to the SC group(P<0.01). However, enalapril markedly reduced the fastingplasma insulin (-27%, P<0.05) and glucose levels (-21%,P<0.001), resulting in a 48% lower HOMA-IR than the HFgroup (P<0.001) (Table 1).
Additionally, fasting plasma glucagon concentrations werehigher in the HF (+126%; P< 0.001), HF-A (+75%; P<0.05),and HF-L (+108%; P<0.01) groups than in the SC group (Table1), indicating that insulin resistance contributes to the
Table 1. Food behavior, carbohydrate metabolism andhormones.
Data SC HF HF-A HF-E HF-LFood behavior Food intake (g/week per mouse)
15.6 ± 0.6 16.0 ± 0.9 15.6 ± 0.912.0 ±0.5[a,b,c]
17.1 ± 0.5[d]
Energy intake(kJ/week permouse)
248.0 ±9.9
334.8 ±19.3[a]
325.8 ±19.0[a]
251.2 ±9.8[b,c]
357.4 ±10.6[a,d]
Carbohydrate metabolism
Glucose (mg/dL)126.1 ±8.3
168.8 ±7.1[a]
153.8 ±5.8[a]
133.2 ±4.3[b]
153.0 ±5.5[a]
HOMA-IR 5.3 ± 0.713.8 ±1.5[a]
10.2 ±1.0[a]
7.3 ± 0.5[b] 10.4 ± 0.7[a]
Hormones
Insulin (µUI/L) 15.2 ± 1.630.8 ±2.6[a]
23.6 ±1.9[a]
21.8 ± 1.6[b] 26.4 ± 2.0[a]
Glucagon(pg/mL)
18.8 ± 4.142.3 ±3.7[a]
32.8 ±4.0[a]
24.3 ± 2.7[b]39.0 ±3.6[a,d]
Adiponectin(µg/mL)
17.6 ± 1.010.1 ±0.5[a]
12.0 ±0.4[a]
17.3 ±0.7[b,c]
13.1 ±1.0[a,d]
Values represent means ± SEM, n=8 per group. P<0.05 when compared with theSC group [a], HF group [b], HF-A group [c] and HF-E group [d] (one-way ANOVAand post-hoc Holm-Sidak test).
Renin-Angiotensin System and Pancreatic Islets
PLOS ONE | www.plosone.org 4 July 2013 | Volume 8 | Issue 7 | e67192

dysregulation of glucagon secretion in altered glycemic states.The concentrations in the HF-E group was less elevated, andthis difference was significant compared to the HF group(-43%; P<0.05) (Table 1).
Compared to the SC group, adiponectin levels were lower inthe HF (-43%; P<0.0001), HF-A (-32%; P<0.0001), and HF-L(-26%; P<0.001) groups, but not in the HF-E group.Adiponectin levels were not different between the HF-E and SCgroups, but the differences between the HF-E group and theother HF groups were significant: +71% compared to the HFgroup (P<0.0001), +44% compared to the HF-A group
(P<0.0001), and +32% compared to the HF-L group (P<0.001)(Table 1). Adiponectin increases insulin sensitivity by severalmechanisms, and these results are thus consistent withprevious results regarding insulin resistance.
PancreasThe islets were affected by the consumption of the HF diet
(Table 2). All groups fed the HF diet, including the treatedgroups, showed an accumulation of fat within the pancreas inthe interlobular, intralobular, and perilobular spaces. Thisaccumulation was 230% greater in the HF group than in the SC
Figure 1. BM evolution over the course of the experimental period. Weeks 1–8 correspond to the period of the induction ofobesity and insulin resistance, and weeks 8–14 correspond to the treatment phase. Values are means ± SEM, n=15. Significantdifferences between the groups are indicated using symbols (P<0.05), as determined by a one-way ANOVA and a post-hoc Holm-Sidak test: a ≠ SC; b ≠ HF; c ≠ HF-A, and d ≠ HF-E.doi: 10.1371/journal.pone.0067192.g001
Renin-Angiotensin System and Pancreatic Islets
PLOS ONE | www.plosone.org 5 July 2013 | Volume 8 | Issue 7 | e67192

group (P<0.0001) (Figure 4). In addition, the HF diet led to islethypertrophy. Compared to the SC group, the islet meandiameter was 23% greater in the HF-E group (P<0.01).However, the islet mean diameter was 15% smaller in the HF-Egroup than in the HF group (P<0.01) (Table 2). The volumedensity of the islets correlated with the islet hypertrophy thatwas observed in the HF groups. Each of the HF, HF-A, andHF-L groups showed a greater volume density of islets thanthat of the SC group (P<0.01). However, the HF-E grouprecuperated the volume density of islets close to that of the SCgroup (Table 2).
The masses of alpha and beta cells in the islets were greaterin the HF, HF-A, and HF-L groups than in the SC group(P<0.01). Only the HF-E group recuperated the masses ofalpha and beta cells close to those of the SC group. Comparedto the HF group, the alpha cell mass was 57% lower and thebeta cell mass was 45% lower in the HF-E group (P<0.001 inboth masses) (Table 2).
ImmunohistochemistryThe SC group showed small islets with a regular pattern of
islet distribution. In comparison to the SC group, the HF, HF-A,
Figure 2. Systolic blood pressure evolution. Data are reported as the means ± SEM, n=8; P<0.05, one-way ANOVA and post-hoc of Holm-Sidak test: a ≠ SC; b ≠ HF; c ≠ HF-A, and d ≠ HF-E.doi: 10.1371/journal.pone.0067192.g002
Renin-Angiotensin System and Pancreatic Islets
PLOS ONE | www.plosone.org 6 July 2013 | Volume 8 | Issue 7 | e67192

and HF-L groups showed increased glucagon (Figure 5A) andinsulin (Figure 6A) immunoreactivity in alpha and beta cells,respectively. In these groups, the islets showed alpha cells inboth the core and periphery and a thickening of the layer ofnon-beta cells, with disorganization in the distribution of theendocrine cells (Figure 5B). In addition, supporting the findingsof insulin secretion and islet hypertrophy, the beta cell massincreased in the HF, HF-A, and HF-L groups (Table 2), and thedisorganized histoarchitecture was consistent with thedysfunction of beta cells and insulin resistance (Figure 6B).
The appearance of the alpha and beta cell distributions wassimilar between the SC group and the HF-E group (Figures 5Cand 6C), which is consistent with the findings on the plasmainsulin and glucagon levels in these groups.
Western blotting analysesThe protein expressions in the HF groups were expressed as
a percentage of the protein expression in the SC group. AllWestern blotting data were normalized to beta actin, which was
Figure 3. Glucose metabolism. Oral glucose tolerance test curves (A), and their respective area under the curves (AUC) (B);Intraperitoneal insulin tolerance test curves (C), and their respective AUC (D). Data are reported as the means ± SEM, n=8; P<0.05,one-way ANOVA and post-hoc of Holm-Sidak test: a ≠ SC; b ≠ HF.doi: 10.1371/journal.pone.0067192.g003
Renin-Angiotensin System and Pancreatic Islets
PLOS ONE | www.plosone.org 7 July 2013 | Volume 8 | Issue 7 | e67192

used as a loading control. Beta actin expression did not differamong the SC, HF and HF-treated groups (data not shown).
Pdx1and GLUT2. The islet expression of Pdx1 and GLUT2was lower in the HF group (P<0.001 and 0.0001, respectively),in the HF-A group (P<0.05 and 0.001, respectively), and in theHF-L group (P<0.05 and 0.001, respectively) than in the SCgroup (Figure 7). The Pdx1 and GLUT2 expression levels werenot different between the HF-E and the SC groups.
RAS classical axis: Renin, ACE, AT1R and AT2R. Reninexpression was higher in the treated groups, similar to the HFgroups, than in the SC group (P<0.0001, in all cases) (Figure8A and B). This result indicates that the islet RAS is upregulated in animal models of insulin resistance and obesitythat are induced by diet.
ACE expression was lower in the HF-A group (P<0.01)compared to the HF group (Figure 8A and C). This result ismost likely due to renin activity inhibition by aliskiren. However,ACE expression was higher in the HF, HF-E and HF-L groupscompared to SC and HF-A groups (P<0.01) (Figure 8C).
AT1R expression in the treatment groups was similar to thatof the SC group and significantly different from that of the HFgroup (P<0.01) (Figure 8A and D). Unlike AT1R, AT2Rexpression increased in all treated groups relative to the HFgroup (P<0.01); however, the peak levels were higher in theHF-L group (P<0.0001) (Figure 8A and E).
Table 2. Pancreatic stereology, alpha and beta cellmasses.
Data SC HF HF-A HF-E HF-LPancreas
Mass (mg)278.3 ±15.8
351.8 ±25.1
318.5 ±24.6
272.8 ±18.2
340.5 ±17.6
Fat (%) 3.7 ± 0.312.1 ±1.5[a]
10.0 ± 0.6[a] 7.4 ± 0.3[a,b] 10.3 ± 0.5[a]
Islet Volumedensity (%)
10.5 ± 0.417.0 ±0.7[a]
13.9 ±0.7[a,b]
12.7 ± 0.5[b]15.5 ±0.5[a,d]
Mass (mg) 29.1 ± 1.657.1 ±5.0[a]
46.2 ± 2.2[a] 34.4 ± 3.2[b]57.7 ±2.3[a,d]
Diameter (µm) 86.9 ± 3.9125.6 ±5.7[a]
111.5 ±1.8[a]
106.8 ±1.6[a,b]
119.8 ±3.7[a]
Alpha cellmass
Glucagon (%) 9.5 ± 0.315.3 ±0.7[a]
12.7 ± 1.4[a] 10.5 ± 1.2[b] 12.7 ± 0.7[a]
Mass (mg) 2.8 ± 0.2 8.6 ± 0.5[a] 5.8 ± 0.5[a,b] 3.5 ± 0.2[b,c] 7.3 ± 0.3[a,d]
Beta cellmass
Insulin (%) 70.3 ± 1.0 74.7 ± 1.0[a 72.4 ± 0.7 69.0 ± 1.6[b] 75.2 ± 1.4[d]
Mass (mg) 20.5 ± 1.242.7 ±4.2[a]
33.5 ± 1.4[a]23.6 ±1.8[b,c]
41.2 ±2.2[a,d]
Values represent means ± SEM, n=6 per group. Where indicated, P<0.05 usingone-way ANOVA and post hoc Holm-Sidak test [a] when compared with the SCgroup; [b] when compared with the HF group; [c] when compared with the HF-Agroup and [d] when compared with the HF-E group.
ACE2/Mas receptor axis. The HF-A and HF-L groups hadACE2 expression levels similar to those of the HF group andlower than those of the SC group (P<0.01). Only treatment withenalapril caused an increase of ACE2 expression (P<0.0001vs. HF group) (Figure 9A and B).
The Mas receptor expression was significantly lower in theHF, HF-A, and HF-L groups than in the SC group (P<0.01). Inaddition, Mas receptor expression was highest in the HF-Egroup (Figure 9A and C).
Discussion
The present study compared RAS blockers, including adirect renin inhibitor, an ACE inhibitor and an AT1R antagonist,in a mice model of diet-induced obesity and insulin resistance.All treatments significantly attenuated the increased BP in HFmice. However, HF mice treated with enalapril, in addition to areduction in both energy intake and BM, showed improvedglucose tolerance and insulin sensitivity (as indicated by theimprovement of fasting plasma insulin and glucose, as well ashigher serum adiponectin), enhanced islet remodeling,normalization of both alpha and beta cell masses, andsustained beta cell function (Pdx1 and GLUT2 expression),compared to the HF group. Among the different mechanismsthat may explain these findings, primarily the decreased energyintake and BM, the increase of the ACE2/ Mas receptor axis isa prime candidate. Our current results may contribute tounderstanding the role of systemic and local RAS in modulatingAng (1-7) and of the physiological effects of insulin in responseto a HF diet.
The HF diet yielded overweight C57BL/6 mice with thehighest BP and high expression levels of components of theRAS, among all the groups. In other words, the expression ofrenin, ACE and AT1R were increased in HF mice, proving theactivation of classical RAS intra-islets. Ang II may beresponsible for triggering inflammation by inducing oxidativestress [24], abnormalities of islet blood flow regulation,lipotoxicity and by negatively modulating insulin signaling [10],resulting in insulin resistance and endocrine pancreasdysfunction. In addition, HF mice showed the worst expressionof the ACE2/Mas receptor axis. ACE2 is expressed in the liver,adipose tissue, pancreas and skeletal muscle, which constitutethe primary organs implicated in insulin resistance [25,26] andexhibits its tissue-protective effects not only by decreasing AngII but also by producing Ang (1-7). In fact, the genetic deletionof specific Ang (1-7) /Mas receptors leads to a metabolicsyndrome-like state in mice, implying a close relationshipbetween these axes and glucose metabolism [13,27].
There is substantial cross-talk between the insulin and Ang IIsignaling cascades, offering a potential mechanism for Ang II toimpair insulin sensitivity [10]. Mice fed a HF diet have greaterislet mass, accumulation of fat within the pancreas,hyperglycemia, and high plasma insulin and beta cell mass,resulting in a high HOMA-IR. There is mounting evidence thatthe acute exposure of pancreatic beta cells to high glucoseconcentrations results in a substantial increase in insulinrelease, whereas chronic exposure results in desensitization tosecretions to the point of suppression [28]. This suppression
Renin-Angiotensin System and Pancreatic Islets
PLOS ONE | www.plosone.org 8 July 2013 | Volume 8 | Issue 7 | e67192
contributes to a progressive decline in beta cell function thatcan lead to adverse pancreatic islet remodeling by processescommonly referred to as glucotoxicity, progressing into T2DM[29].
These events result in increased intra-islet insulinconcentrations and the dysregulation of glucagon secretion,increasing alpha cell turnover and ultimately releasing moreglucagon into circulation [30]. This is demonstrated by the rise
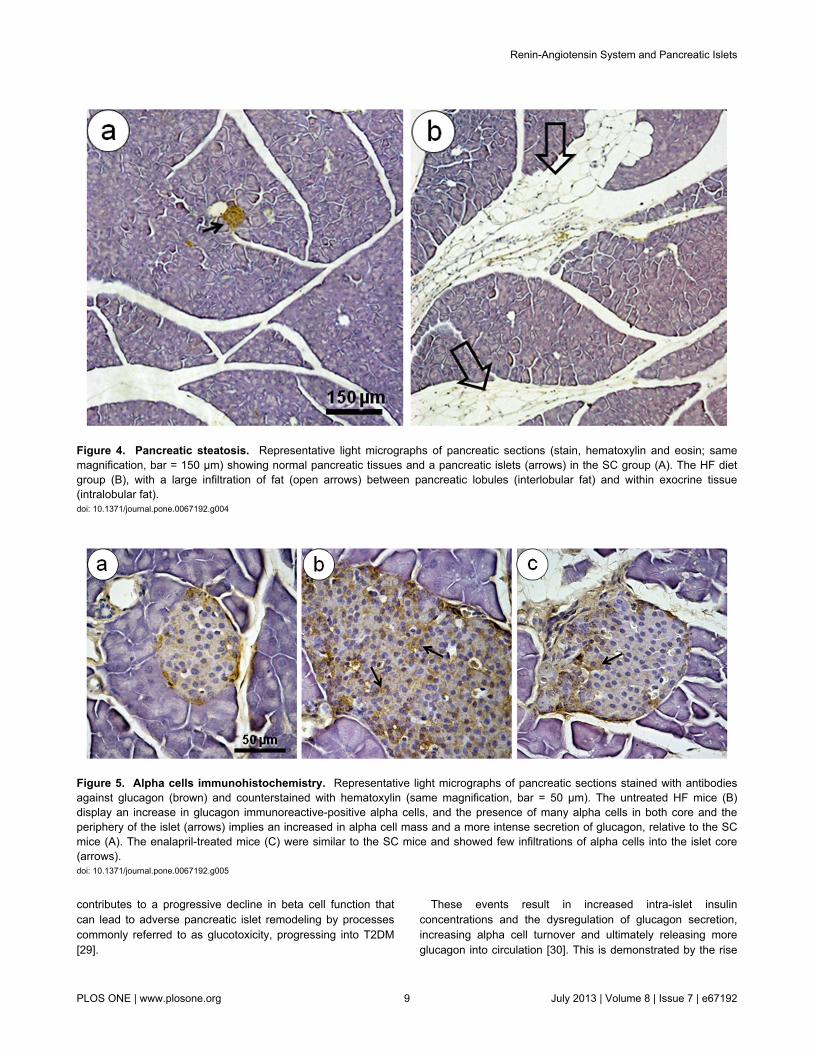
Figure 4. Pancreatic steatosis. Representative light micrographs of pancreatic sections (stain, hematoxylin and eosin; samemagnification, bar = 150 µm) showing normal pancreatic tissues and a pancreatic islets (arrows) in the SC group (A). The HF dietgroup (B), with a large infiltration of fat (open arrows) between pancreatic lobules (interlobular fat) and within exocrine tissue(intralobular fat).doi: 10.1371/journal.pone.0067192.g004
Figure 5. Alpha cells immunohistochemistry. Representative light micrographs of pancreatic sections stained with antibodiesagainst glucagon (brown) and counterstained with hematoxylin (same magnification, bar = 50 µm). The untreated HF mice (B)display an increase in glucagon immunoreactive-positive alpha cells, and the presence of many alpha cells in both core and theperiphery of the islet (arrows) implies an increased in alpha cell mass and a more intense secretion of glucagon, relative to the SCmice (A). The enalapril-treated mice (C) were similar to the SC mice and showed few infiltrations of alpha cells into the islet core(arrows).doi: 10.1371/journal.pone.0067192.g005
Renin-Angiotensin System and Pancreatic Islets
PLOS ONE | www.plosone.org 9 July 2013 | Volume 8 | Issue 7 | e67192

in fasting plasma glucagon and alpha cell mass in the presentstudy. Furthermore, we have observed hypertrophies and moreirregularly shaped islets in the HF group. The disorganizedhistoarchitecture shown in this group is consistent withhyperinsulinemia and hyperglucagonemia and is characterizedby alpha cell infiltration, a finding typically observed in diabeticanimal models [31]. In addition, the lower levels of adiponectinobserved in mice fed a HF diet, impairs insulin sensitivitythrough several mechanisms, including an increase in energyexpenditure and fatty acid oxidation, an augmentation of thehepatic glucose output and a reduction in muscular glucoseutilization [12].
This adverse islet remodeling is implicated in progressivebeta cell dysfunction and determines the course of obesity-related insulin resistance. In the present study, HF mice hadweak Pdx1 expression. In the mature pancreas, Pdx1expression is linked to insulin-producing beta cells, genetranscription activation (glucose-stimulated insulin secretion)and sustained mature beta cell function. Preclinical studiesdemonstrated increased DNA methylation and decreasedexpression of Pdx1 in the development of T2DM [32]. Inaddition, Pdx1 also regulates the expression of GLUT2, both ofwhich play a role in insulin resistance. In the present study, theHF diet reduced GLUT2 expression in hypertrophied islets.GLUT2 is a glucose sensor that triggers glucose-stimulatedinsulin secretion under physiological conditions in beta cells[33]; therefore, its decline indirectly suggests a worsening ofbeta cell function and insulin secretion.
The effectiveness of the doses administered to the treatmentgroups has been tested in previous studies in rodents (aliskiren[34], enalapril [35] and losartan [36]). Aliskiren administered toHF diet mice was efficient in reducing BP but did notsignificantly reverse the metabolic changes or adverse isletremodeling; it only partially enhanced the alpha cell mass and
Mas receptor expression. As the initial limiting step in Ang IIsynthesis, renin represents a target for the complete inhibitionof the RAS. However, the renin expression in islet tissue wasincreased by aliskiren, most likely due to inhibition of plasmarenin activity [37]. In addition, renin inhibitors attenuate theproduction of all angiotensin derivatives from renin, inhibitingboth their positive and negative effects on the metabolism.These findings suggest that the suppression of insulinresistance by aliskiren may require the use of higher dosesthan those used to treat high BP and cardiovascular injury [34],although aliskiren was efficient in renin inhibition in islets, asdemonstrated by the observed reductions in ACE and AT1Rlevels.
Enalapril was the most successful treatment for the reductionof BM and insulin resistance in diet-induced obesity. The lossof body mass due to enalapril treatment is not an unexpectedfinding [38,39]. On the other hand, large randomized clinicaltrials suggest that ACE inhibitors improve insulin resistanceand reduce the incidence of new-onset type 2 diabetes in high-risk patients with cardiovascular disease [40–43]. The data ofthe present study provide additional support for a role for theRAS in the control of energy balance and the potential forbeneficial effects of ACE inhibitors as a therapeutic strategy forpatients with obesity and concomitant hypertension.Furthermore, enalapril is most likely working through otherpathways that modulate the reduction in BM gain (e.g.,increased adiponectin that enhanced fatty acid oxidation,improved insulin and peroxisome proliferator-activated receptor(PPAR) gamma signaling, or increased expression of FAS) thatcorroborates with the decreased food intake [44,45].
Increased adiponectin levels have been associated withenhanced insulin sensitivity [45] and enalapril markedlyattenuated the glucose and insulin resistance in mice in the HFgroup. We examined the effects of enalapril on endocrine
Figure 6. Beta cell immunohistochemistry. Photomicrographs show islets with immunoperoxidase (brown)-stained insulin(counterstained with hematoxylin, same magnification, bar = 50 µm). The SC group (A) shows smaller islets than the untreated HFgroup and a normal pattern of islet distribution, with beta cells restricted to the core of this structure. The untreated HF group (B)shows an increase in insulin immunoreactive-positive beta cells, representing an augmentation of beta cell mass, pancreatic isletshypertrophy, and a complete disarrangement of beta and non-beta cell distributions (arrows). Treatment with enalapril (C) displays apartial restoration of normal patterns of islet cell distributions (arrows) and islet size.doi: 10.1371/journal.pone.0067192.g006
Renin-Angiotensin System and Pancreatic Islets
PLOS ONE | www.plosone.org 10 July 2013 | Volume 8 | Issue 7 | e67192

pancreas morphology and function, including alpha and betacell masses, the distribution of the cells into islets and Pdx1and GLUT2 expressions. All of these parameters wereimproved in the mice of the HF-E group compared to the miceof the HF group. Enalapril significantly attenuated the increaseof both alpha and beta cell masses, islet hypertrophy, and theislet cell disarray in the mice in the HF group. Additionally,enalapril significantly restored the Pdx1 and GLUT2 proteinlevels in the mice in the HF group, indicating the maintenanceof beta cell function and glucose-stimulated insulin secretion.This result agrees with the idea that the ability of ACE inhibitorsto augment insulin-stimulated glucose transport activity ininsulin-resistant skeletal muscle is mediated primarily by theaction of bradykinin, with little or no contribution from thedecrease in Ang II action [46]. ACE inhibitors have at least twoeffects at the tissue level: inhibit the conversion of Ang I to AngII and decreases the degradation of bradykinin [5]. It has beenshown that the acute administration of captopril to insulin-resistant rats augmented the early steps of the insulin-signaling
cascade [46] and this effects was reproduced by acutetreatment with bradykinin, mediated through its B1 and B2receptors [14], but not reproduced with losartan and eprosartan[5,46].
Our study shows that enalapril produces an increase in theexpression of ACE2 and Mas receptors in the islet. There aretwo counter-regulatory peptides, Ang II and Ang (1-7),produced by the balance between ACE and ACE2 [47].Therefore, a decreased ACE/ACE2 activity ratio by long-termtreatment of enalapril stimulates generation of circulating Ang(1-7), and is followed by weight loss [48]. A lipolytic effect ofAng (1-7) has been recovered by administration of a Masreceptor blocker [47], and ACE-deficient mice had less bodymass and fat than controls [49]. Additionally, ACE2 genetherapy improves glycemic control in diabetic mice byimproving beta cell function through a mechanism mediated byAng (1-7) [26]. It has been shown that an increase in circulatingAng (1-7) via a Mas receptor-dependent mechanism stimulatesadiponectin release [50] and provides consequent beneficial
Figure 7. Representative Western blotting analysis of pancreatic islets for Pdx1 and GLUT2 expression (A) and theirdensitometry analysis (B – Pdx1; C – GLUT2). Average values were measured, and equal protein loading was confirmed byprobing blots with beta actin antibodies. Each is, expressed as a percentage of the SC counterpart. Data are reported as the means± SEM, n=9; P<0.05, one-way ANOVA and post-hoc of Holm-Sidak test: [a] compared to SC; [b] compared to untreated HF; [c]compared to HF-A, and [d] compared to HF-E.doi: 10.1371/journal.pone.0067192.g007
Renin-Angiotensin System and Pancreatic Islets
PLOS ONE | www.plosone.org 11 July 2013 | Volume 8 | Issue 7 | e67192

effects on glucose utilization in peripheral tissues. Theseresults provide evidence that the increased expression of theACE2/Mas receptor axis by enalapril contributed to the above-mentioned protection against BM gain and the maintenance ofthe pancreatic islet functionality.
In the current study, losartan had no impact on bodycomposition or food intake. However, any interpretations fromstudies on AT1R blockers should be considered carefully, as anumber of AT1R blockers (e.g., irbesartan, telmisartan) arealso partial PPAR gamma agonists; PPAR gamma plays anintegral role in adipose differentiation and physiology [51].Accordingly, our recent report suggested that telmisartanprevents BM gain and the normalization of islet morphologyand function in mice fed a HF diet [51]. Only telmisartanactivates PPAR gamma signaling, compared with losartan [52].In addition, in the present study, losartan did not improveglucose homeostasis, adiponectin levels or pancreaticremodeling; instead, it normalized BP, as was also shown in
obese hypertensive patients treated with losartan with impairedfasting glucose [53].
Animals treated with losartan had the highest AT2Rexpression in islets. In this way, the ability of Ang II to stimulateAT2R in the presence of and inhibitor of AT1R provided theadditional activation of AT2R, generating a positive regulatoryfeedback. However, chronic exposure may cause receptordesensitization by high concentrations of Ang II. The role ofAT2R stimulation in the pathogenesis of insulin resistance isstill unclear [54]. Studies have shown that both AT1R andAT2R may modulate fat mass expansion through theupregulation of adipose tissue lipogenesis (AT2R) and thedownregulation of lipolysis (AT1R) [55]. Additionally, AT2Rdeficient mice are protected against obesity that is induced byadipose tissue angiotensinogen overexpression, showing thatAT2R plays a major role in mediating local Ang II action on fatmass enlargement [56]. Mice lacking AT2R fail to decreaseadiponectin, increase whole-body lipid oxidation, or reducetheir insulin resistance when fed a HF diet, indicating that
Figure 8. Western blotting analysis illustration (A) of pancreatic islets for renin (B), ACE (C), AT1R (D), and AT2R (E)expressions. Average values were measured, and equal protein loading was confirmed by probing blots with beta actin antibodies.Each is expressed as a percentage of the SC counterpart. Data are reported as the means ± SEM, n=9; P<0.05, one-way ANOVAand post-hoc of Holm-Sidak test: a ≠ SC; b ≠ HF; c ≠ HF-A and d ≠ HF-E.doi: 10.1371/journal.pone.0067192.g008
Renin-Angiotensin System and Pancreatic Islets
PLOS ONE | www.plosone.org 12 July 2013 | Volume 8 | Issue 7 | e67192

AT2R-mediated Ang II signaling plays a crucial role in thecontrol of energy metabolism and in glucose homeostasis [55].
The ACE2 and Mas receptors expression levels in isletswere lower in HF-L mice than in either SC or HF-E mice. Thisagrees with reports that the reduced activity of the counter-regulatory ACE2/ Ang (1-7) /Mas axis results in glucoseintolerance and reduced insulin sensitivity [57]. Mas receptor-deficient mice and/or mice with ACE2 ablation showed insulinresistance that was not eliminated by AT1R blockers but couldbe eradicated by Ang (1–7) [25,27]. Thus, losartan did notcause any changes in ACE2/ Ang (1-7) /Mas receptor axis [47].Furthermore, ACE/ACE2 activity ratio increased due toincreased Ang II generation and reduced generation ofcirculating Ang (1-7) that favored insulin resistance; anopposite ratio was found in enalapril treatment.
The effects of a RAS inhibitor on glucose homeostasis havebeen controversial and depend on the experimental model ofobesity and insulin resistance, the time of starting the drugtreatment, and differences in the dosage and duration of drugtreatment. One of the limitations of the current study is that we
did not measure plasma or tissue concentrations of Ang (1-7).However, this drawback does not exclude the results found bythis work, as demonstrated by the G protein-coupled receptorexpression, Mas, the specific receptor mediator of actions ofAng (1-7).
Conclusion
The present study compared RAS blockers in mice fed HFdiets and concluded that enalapril treatment greatly affectedBM, energy intake and glucose tolerance, the normalization ofthe islet structure, both alpha cell and beta cell masses, andoverall function (Pdx1 and GLUT2 expression). Thus, thecurrent study provides evidence that enalapril protects thepancreatic islets against adverse remodeling in diet-inducedobese mice with insulin resistance. The main findings includethe following: (i) a reduction in food and energy intake thatresults in a small BM gain; (ii) an increase of adiponectinlevels; (iii) an increase in the activity of the counter-regulatoryACE2/Ang (1-7) /Mas axis. In addition, losartan does not
Figure 9. Western blotting analysis (A) of pancreatic islet for ACE2 (B), and Mas receptor (C) expression. Average valueswere measured, and equal protein loading was confirmed by probing blots with beta actin antibodies and is expressed as apercentage of the SC counterpart. Data are reported as the means ± SEM, n=9; P<0.05, one-way ANOVA and post-hoc of Holm-Sidak test: a ≠ SC; b ≠ HF; c ≠ HF-A and d ≠ HF-E.doi: 10.1371/journal.pone.0067192.g009
Renin-Angiotensin System and Pancreatic Islets
PLOS ONE | www.plosone.org 13 July 2013 | Volume 8 | Issue 7 | e67192

improve neither beta cell function nor insulin responsiveness inthe HF mice, but increases the AT2R expression in islets. Thisindicates a role for AT2R in obesity-related disorders,principally regarding energy metabolism and insulin resistance.Further experimental and clinical studies are needed to clarifythe precise mechanisms of RAS blockers, whether alone or incombination with other drugs, in cases of hypertensionassociated with T2DM. ACE inhibitors may be a promisingtherapeutic agent for obesity and its complications.
Acknowledgements
The authors thank Junia Carolina dos Santos Silva for herassistance with experiments and Thatiany Marinho and AlinePenna for their technical assistance.
Author Contributions
Conceived and designed the experiments: EDF CML.Performed the experiments: EDF CCM ARBV. Analyzed thedata: EDF MBA CML. Contributed reagents/materials/analysistools: MBA CML. Wrote the manuscript: EDF CML.
References
1. Richard D, Boisvert P (2009) 11th Annual International Symposium inObesity: 'Obesity in a modern world: when pleasure meetshomeostasis'. Int J Obes 33 Suppl 2: S1-S2. doi:10.1038/ijo.2008.259.
2. Passos-Silva DG, Verano-Braga T, Santos RA (2013) Angiotensin-(1-7): beyond the cardio-renal actions. Clin Sci (Lond) 124: 443-456.doi:10.1042/CS20120461.
3. Luther JM, Brown NJ (2011) The renin-angiotensin-aldosterone systemand glucose homeostasis. Trends Pharmacol Sci 32: 734-739. doi:10.1016/j.tips.2011.07.006. PubMed: 21880378.
4. Peach MJ (1977) Renin-angiotensin system: biochemistry andmechanisms of action. Physiol Rev 57: 313-370. PubMed: 191856.
5. Henriksen EJ, Jacob S, Kinnick TR, Youngblood EB, Schmit MB et al.(1999) ACE inhibition and glucose transport in insulinresistant muscle:roles of bradykinin and nitric oxide. Am J Physiol Endocrinol Metab277: R332-R336.
6. Donoghue M, Hsieh F, Baronas E, Godbout K, Gosselin M et al. (2000)A novel angiotensin-converting enzyme-related carboxypeptidase(ACE2) converts angiotensin I to angiotensin 1-9. Circ Res 87: E1-E9.doi:10.1161/01.RES.87.1.1. PubMed: 10969042.
7. Giani JF, Mayer MA, Munoz MC, Silberman EA, Hocht C et al. (2009)Chronic infusion of angiotensin-(1-7) improves insulin resistance andhypertension induced by a high-fructose diet in rats. Am J PhysiolEndocrinol Metab 296: E262-E271. PubMed: 19001546.
8. Santos RA, Simoes e Silva AC, Maric C, Silva DM, Machado RP et al.(2003) Angiotensin-(1-7) is an endogenous ligand for the G protein-coupled receptor Mas. PNAS 100: 8258-8263. doi:10.1073/pnas.1432869100. PubMed: 12829792.
9. Leung PS (2003) Pancreatic renin-angiotensin system: a novel targetfor the potential treatment of pancreatic diseases? JOP4: 89-91.PubMed: 12629265.
10. Velloso LA, Folli F, Perego L, Saad MJ (2006) The multi-faceted cross-talk between the insulin and angiotensin II signaling systems. Diabetes/Metab Res Rev 22: 98-107. doi:10.1002/dmrr.611.
11. van der Zijl NJ, Moors CC, Goossens GH, Blaak EE, Diamant M (2012)Does interference with the renin-angiotensin system protect againstdiabetes? Evidence and mechanisms. Diabetes Obes Metab 14:586-595. doi:10.1111/j.1463-1326.2012.01559.x. PubMed: 22226145.
12. de Kloet AD, Krause EG, Woods SC (2010) The renin angiotensinsystem and the metabolic syndrome. Physiol Behav 100: 525-534. doi:10.1016/j.physbeh.2010.03.018. PubMed: 20381510.
13. Munoz MC, Giani JF, Burghi V, Mayer MA, Carranza A et al. (2012)The Mas receptor mediates modulation of insulin signaling byangiotensin-(1-7). Regulat Peptides 177: 1-11.
14. Barros CC, Haro A, Russo FJ, Schadock I, Almeida SS et al. (2012)Altered glucose homeostasis and hepatic function in obese micedeficient for both kinin receptor genes. PLOS ONE 7: e40573. doi:10.1371/journal.pone.0040573. PubMed: 22829877.
15. Babu DA, Deering TG, Mirmira RG (2007) A feat of metabolicproportions: Pdx1 orchestrates islet development and function in themaintenance of glucose homeostasis. Mol Genet Metab 92: 43-55. doi:10.1016/j.ymgme.2007.06.008. PubMed: 17659992.
16. Bernardo AS, Hay CW, Docherty K (2008) Pancreatic transcriptionfactors and their role in the birth, life and survival of the pancreatic betacell. Mol Cell Endocrinol 294: 1-9. doi:10.1016/j.mce.2008.07.006.PubMed: 18687378.
17. Navarro-Tableros V, Fiordelisio T, Hernandez-Cruz A, Hiriart M (2007)Physiological development of insulin secretion, calcium channels, andGLUT2 expression of pancreatic rat beta-cells. Am J Physiol EndocrinolMetab 292: E1018-E1029. PubMed: 17148757.
18. Reeves PG, Nielsen FH, Fahey GC Jr. (1993) AIN-93 purified diets forlaboratory rodents: final report of the American Institute of Nutrition adhoc writing committee on the reformulation of the AIN-76A rodent diet.J Nutr 123: 1939-1951. PubMed: 8229312.
19. Matthews DR, Hosker JP, Rudenski AS, Naylor BA, Treacher DF et al.(1985) Homeostasis model assessment: insulin resistance and beta-cell function from fasting plasma glucose and insulin concentrations inman. Diabetologia 28: 412-419. doi:10.1007/BF00280883. PubMed:3899825.
20. Mandarim-de-Lacerda CA, Fernandes-Santos C, Aguila MB (2010)Image analysis and quantitative morphology. Methods Mol Biol 611:211-225. doi:10.1007/978-1-60327-345-9_17. PubMed: 19960334.
21. Tschanz SA, Burri PH, Weibel ER (2011) A simple tool for stereologicalassessment of digital images: the STEPanizer. J Microsc 243: 47-59.doi:10.1111/j.1365-2818.2010.03481.x. PubMed: 21375529.
22. Frantz ED, Aguila MB, Pinheiro-Mulder Ada R, Mandarim-de-LacerdaCA (2011) Transgenerational endocrine pancreatic adaptation in micefrom maternal protein restriction in utero. Mech Ageing Dev 132:110-116.
23. Lacy PE, Kostianovsky M (1967) Method for the isolation of intact isletsof Langerhans from the rat pancreas. Diabetes 16: 35-39. PubMed:5333500.
24. Yuan L, Li X, Xu GL, Qi CJ (2010) Effects of renin-angiotensin systemblockade on islet function in diabetic rats. J Endocrinol Invest 33:13-19.
25. Takeda M, Yamamoto K, Takemura Y, Takeshita H, Hongyo K et al.(2012) Loss of ACE 2 Exaggerates High-Calorie Diet-Induced InsulinResistance by Reduction of GLUT4 in Mice. Diabetes 62: 223-233.PubMed: 22933108.
26. Bindom SM, Hans CP, Xia H, Boulares AH, Lazartigues E (2010)Angiotensin I-converting enzyme type 2 (ACE2) gene therapy improvesglycemic control in diabetic mice. Diabetes 59: 2540-2548. doi:10.2337/db09-0782. PubMed: 20660625.
27. Santos SH, Fernandes LR, Mario EG, Ferreira AV, Porto LC et al.(2008) Mas deficiency in FVB/N mice produces marked changes in lipidand glycemic metabolism. Diabetes 57: 340-347. PubMed: 18025412.
28. Lowell BB, Shulman GI (2005) Mitochondrial dysfunction and type 2diabetes. Science 307: 384-387. doi:10.1126/science.1104343.PubMed: 15662004.
29. Bonora E (2008) Protection of pancreatic beta-cells: is it feasible? NutrMetab Cardiovasc Dis 18: 74-83. doi:10.1016/j.numecd.2007.05.004.PubMed: 18096375.
30. Liu Z, Kim W, Chen Z, Shin YK, Carlson OD et al. (2011) Insulin andglucagon regulate pancreatic alpha-cell proliferation. PLOS ONE 6:e16096. doi:10.1371/journal.pone.0016096. PubMed: 21283589.
31. Janssen SW, Hermus AR, Lange WP, Knijnenburg Q, van der Laak JAet al. (2001) Progressive histopathological changes in pancreatic isletsof Zucker Diabetic Fatty rats. Exp Clin Endocrinol Diabetes 109:273-282. doi:10.1055/s-2001-16347. PubMed: 11507651.
32. Yang BT, Dayeh TA, Volkov PA, Kirkpatrick CL, Malmgren S et al.(2012) Increased DNA methylation and decreased expression of PDX-1
Renin-Angiotensin System and Pancreatic Islets
PLOS ONE | www.plosone.org 14 July 2013 | Volume 8 | Issue 7 | e67192

in pancreatic islets from patients with type 2 diabetes. Mol Endocrinol26: 1203-1212. doi:10.1210/me.2012-1004. PubMed: 22570331.
33. Folli F, Okada T, Perego C, Gunton J, Liew CW et al. (2011) Alteredinsulin receptor signalling and beta-cell cycle dynamics in type 2diabetes mellitus. PLOS ONE 6: e28050. doi:10.1371/journal.pone.0028050. PubMed: 22140505.
34. Dong YF, Liu L, Kataoka K, Nakamura T, Fukuda M et al. (2010)Aliskiren prevents cardiovascular complications and pancreatic injury ina mouse model of obesity and type 2 diabetes. Diabetologia 53:180-191. doi:10.1007/s00125-009-1575-5. PubMed: 19894030.
35. Pereira LM, Bezerra DG, Machado DL, Mandarim-de-Lacerda CA(2004) Enalapril attenuates cardiorenal damage in nitric-oxide-deficientspontaneously hypertensive rats. Clin Sci (Lond) 106: 337-343. doi:10.1042/CS20030268.
36. Chu KY, Lau T, Carlsson PO, Leung PS (2006) Angiotensin II type 1receptor blockade improves beta-cell function and glucose tolerance ina mouse model of type 2 diabetes. Diabetes 55: 367-374. doi:10.2337/diabetes.55.02.06.db05-1022. PubMed: 16443769.
37. Staessen JA, Li Y, Richart T (2006) Oral renin inhibitors. Lancet 368:1449-1456. doi:10.1016/S0140-6736(06)69442-7. PubMed: 17055947.
38. Masuo K, Mikami H, Ogihara T, Tuck ML (2001) Weight reduction andpharmacologic treatment in obese hypertensives. Am J Hypertens 14:530-538. doi:10.1016/S0895-7061(00)01279-6. PubMed: 11411732.
39. Santos EL, de Picoli Souza K, da Silva ED, Batista EC, Martins PJ etal. (2009) Long term treatment with ACE inhibitor enalapril decreasesbody weight gain and increases life span in rats. Biochem Pharmacol78: 951-958. doi:10.1016/j.bcp.2009.06.018. PubMed: 19549507.
40. Barzilay JI, Davis BR, Cutler JA, Pressel SL, Whelton PK et al. (2006)Fasting glucose levels and incident diabetes mellitus in oldernondiabetic adults randomized to receive 3 different classes ofantihypertensive treatment: a report from the Antihypertensive andLipid-Lowering Treatment to Prevent Heart Attack Trial (ALLHAT). ArchIntern Med 166: 2191-2201. doi:10.1001/archinte.166.20.2191.PubMed: 17101936.
41. Yusuf S, Sleight P, Pogue J, Bosch J, Davies R et al. (2000) Effects ofan angiotensin-converting-enzyme inhibitor, ramipril, on cardiovascularevents in high-risk patients. The Heart Outcomes Prevention EvaluationStudy Investigators. NEJM 342: 145-153. doi:10.1056/NEJM200001203420301. PubMed: 10639539.
42. Hansson L, Lindholm LH, Niskanen L, Lanke J, Hedner T et al. (1999)Effect of angiotensin-converting-enzyme inhibition compared withconventional therapy on cardiovascular morbidity and mortality inhypertension: the Captopril Prevention Project (CAPPP) randomisedtrial. Lancet 353: 611-616. doi:10.1016/S0140-6736(98)05012-0.PubMed: 10030325.
43. Shindler DM, Kostis JB, Yusuf S, Quinones MA, Pitt B et al. (1996)Diabetes mellitus, a predictor of morbidity and mortality in the Studiesof Left Ventricular Dysfunction (SOLVD) Trials and Registry. Am JCardiol 77: 1017-1020. doi:10.1016/S0002-9149(97)89163-1. PubMed:8644628.
44. Santos EL, de Picoli Souza K, da Silva ED, Batista EC, Martins PJ etal. (2009) Long term treatment with ACE inhibitor enalapril decreasesbody weight gain and increases life span in rats. Biochem Pharmacol78: 951-958. doi:10.1016/j.bcp.2009.06.018. PubMed: 19549507.
45. Weisinger RS, Stanley TK, Begg DP, Weisinger HS, Spark KJ et al.(2009) Angiotensin converting enzyme inhibition lowers body weight
and improves glucose tolerance in C57BL/6J mice maintained on ahigh fat diet. Physiol Behav 98: 192-197. doi:10.1016/j.physbeh.2009.05.009. PubMed: 19465040.
46. Carvalho CR, Thirone AC, Gontijo JA, Velloso LA, Saad MJ (1997)Effect of captopril, losartan, and bradykinin on early steps of insulinaction. Diabetes 46: 1950-1957. doi:10.2337/diabetes.46.12.1950.PubMed: 9392479.
47. Oh YB, Kim JH, Park BM, Park BH, Kim SH (2012) Captopril intakedecreases body weight gain via angiotensin-(1-7). Peptides 37: 79-85.doi:10.1016/j.peptides.2012.06.005. PubMed: 22743141.
48. Santos RA, Ferreira AJ, Esac Simoes (2008) Recent advances in theangiotensin-converting enzyme 2-angiotensin(1-7)-Mas axis. ExpPhysiol 93: 519-527. doi:10.1113/expphysiol.2008.042002. PubMed:18310257.
49. Jayasooriya AP, Mathai ML, Walker LL, Begg DP, Denton DA et al.(2008) Mice lacking angiotensin-converting enzyme have increasedenergy expenditure, with reduced fat mass and improved glucoseclearance. PNAS 105: 6531-6536. doi:10.1073/pnas.0802690105.PubMed: 18443281.
50. Santos SH, Braga JF, Mario EG, Porto LC, Rodrigues-Machado MG etal. (2010) Improved lipid and glucose metabolism in transgenic ratswith increased circulating angiotensin-(1-7). Arterioscler Thromb VascBiol 30: 953-961. doi:10.1161/ATVBAHA.109.200493. PubMed:20203301.
51. Souza-Mello V, Gregorio BM, Cardoso-de-Lemos FS, de Carvalho L,Aguila MB et al. (2010) Comparative effects of telmisartan, sitagliptinand metformin alone or in combination on obesity, insulin resistance,and liver and pancreas remodelling in C57BL/6 mice fed on a veryhigh-fat diet. Clin Sci (Lond) 119: 239-250. doi:10.1042/CS20100061.
52. Kintscher U (2012) And in the end -- Telmisartan directly binds toPPARgamma. Hypert Res 35: 704-705.
53. Perlstein TS, Henry RR, Mather KJ, Rickels MR, Abate NI et al. (2012)Effect of angiotensin receptor blockade on insulin sensitivity andendothelial function in abdominally obese hypertensive patients withimpaired fasting glucose. Clin Sci (Lond) 122: 193-202.
54. Ohshima K, Mogi M, Jing F, Iwanami J, Tsukuda K et al. (2012) DirectAngiotensin II Type 2 Receptor Stimulation Ameliorates InsulinResistance in Type 2 Diabetes Mice with PPARgamma Activation.PLOS ONE 7: e48387. doi:10.1371/journal.pone.0048387. PubMed:23155382.
55. Yvan-Charvet L, Even P, Bloch-Faure M, Guerre-Millo M, Moustaid-Moussa N et al. (2005) Deletion of the angiotensin type 2 receptor(AT2R) reduces adipose cell size and protects from diet-inducedobesity and insulin resistance. Diabetes 54: 991-999. doi:10.2337/diabetes.54.4.991. PubMed: 15793237.
56. Yvan-Charvet L, Quignard-Boulange A (2011) Role of adipose tissuerenin-angiotensin system in metabolic and inflammatory diseasesassociated with obesity. Kidney Int 79: 162-168. doi:10.1038/ki.2010.391. PubMed: 20944545.
57. Mario EG, Santos SH, Ferreira AV, Bader M, Santos RA et al. (2012)Angiotensin-(1-7) Mas-receptor deficiency decreases peroxisomeproliferator-activated receptor gamma expression in adipocytes.Peptides 33: 174-177. doi:10.1016/j.peptides.2011.11.014. PubMed:22119778.
Renin-Angiotensin System and Pancreatic Islets
PLOS ONE | www.plosone.org 15 July 2013 | Volume 8 | Issue 7 | e67192