resolving the evolution of extant and extinct ruminants with high
TRANSCRIPT
Resolving the evolution of extant and extinctruminants with high-throughput phylogenomicsJared E. Deckera, J. Chris Piresb, Gavin C. Conanta, Stephanie D. McKaya, Michael P. Heatonc, Kefei Chend, Alan Cooperd,Johanna Vilkkie, Christopher M. Seaburyf, Alexandre R. Caetanog, Gary S. Johnsonh, Rick A. Brennemani,Olivier Hanottej,k, Lori S. Eggertb, Pamela Wienerl, Jong-Joo Kimm, Kwan Suk Kimn, Tad S. Sonstegardo,Curt P. Van Tassello, Holly L. Neibergsp, John C. McEwanq, Rudiger Brauningq, Luiz L. Coutinhor, Masroor E. Babars,Gregory A. Wilsont, Matthew C. McClurea, Megan M. Rolfa, JaeWoo Kima, Robert D. Schnabela, and Jeremy F. Taylora,1
Divisions of aAnimal Sciences, bBiological Sciences, and hDepartment of Veterinary Pathobiology, University of Missouri, Columbia MO 65211; cUnitedStates Department of Agriculture, Agricultural Research Service, Meat Animal Research Center, Clay Center NE 68933; dAustralian Centre for AncientDNA, School of Earth and Environmental Sciences, University of Adelaide, Adelaide SA 5005, Australia; eAgrifood Research Finland MTT, FIN-31600,Jokioinen, Finland; fVeterinary Pathobiology, Texas A&M University, College Station TX 77843; gEmbrapa Recursos Geneticos e Biotecnologia,Brasilia-DF, C.P. 02372, 70770-900, Brasil; iHenry Doorly Zoo, Omaha NE 68107; jInternational Livestock Research Institute, P.O. Box 30709, Nairobi00100, Kenya; kSchool of Biology, University of Nottingham, Nottingham NG7 2RD, United Kingdom; lThe Roslin Institute, and R(D)SVS, University ofEdinburgh, Roslin, Midlothian EH25 9PS, United Kingdom; mSchool of Biotechnology, Yeungnam University, Gyeongsan, Republic of Korea;nDepartment of Animal Science, Chungbuk National University, Cheongju, Republic of Korea; oUnited States Department of Agriculture, AgriculturalResearch Service, Bovine Functional Genomics Laboratory, Beltsville MD 20705; pDepartment of Animal Sciences, Washington State University,Pullman WA 99164; qAnimal Genomics, AgResearch, Invermay, PB 50034, Mosgiel, New Zealand; rDepartamento de Zootecnia, ESALQ-USP, Av. PaduaDias, 11, Piracicaba, SP 13418-900, Brasil; sDepartment of Livestock Production, University of Veterinary and Animal Sciences, Lahore 54000, Pakistan;and tCanadian Wildlife Service, 200 4999 98th Avenue Northwest, Edmonton AB, Canada T6B 2X3
Edited by James E. Womack, Texas A&M University, College Station, TX, and approved September 14, 2009 (received for review April 29, 2009)
The Pecorans (higher ruminants) are believed to have rapidlyspeciated in the Mid-Eocene, resulting in five distinct extantfamilies: Antilocapridae, Giraffidae, Moschidae, Cervidae, and Bo-vidae. Due to the rapid radiation, the Pecoran phylogeny hasproven difficult to resolve, and 11 of the 15 possible rootedphylogenies describing ancestral relationships among the Antilo-capridae, Giraffidae, Cervidae, and Bovidae have each been arguedas representations of the true phylogeny. Here we demonstratethat a genome-wide single nucleotide polymorphism (SNP) geno-typing platform designed for one species can be used to genotypeancient DNA from an extinct species and DNA from species di-verged up to 29 million years ago and that the produced genotypescan be used to resolve the phylogeny for this rapidly radiatedinfraorder. We used a high-throughput assay with 54,693 SNP locideveloped for Bos taurus taurus to rapidly genotype 678 individ-uals representing 61 Pecoran species. We produced a highly re-solved phylogeny for this diverse group based upon 40,843genome-wide SNP, which is five times as many informative char-acters as have previously been analyzed. We also establish amethod to amplify and screen genomic information from extinctspecies, and place Bison priscus within the Bovidae. The quality ofgenotype calls and the placement of samples within a well-supported phylogeny may provide an important test for validatingthe fidelity and integrity of ancient samples. Finally, we con-structed a phylogenomic network to accurately describe the rela-tionships between 48 cattle breeds and facilitate inferencesconcerning the history of domestication and breed formation.
ancient DNA � Pecorans � domestication
The Pecorans are one of the most diverse groups of mammals,ranging in size from the diminutive duiker (adult weight 9–24
kg, shoulder height 0.45–0.51 m) to the giant giraffe (adultweight 500–1,250 kg, shoulder height 4.5–5.8 m). They areindigenous to all continents except South America and Australia(1) and live in a wide variety of environments. The ruminants arebelieved to have rapidly radiated in the Mid-Eocene (1), and dueto this rapid radiation, the Pecoran phylogeny has provendifficult to resolve, with 11 of the 15 possible rooted phylogeniesdescribing relationships among the Antilocapridae, Giraffidae,Cervidae, and Bovidae having been argued as representations ofthe true phylogeny (2, 3). A supermatrix analysis of nucleotidesequence data from 16 genes has resolved some of the nodeswithin the Pecoran ‘‘Tree of Life (3)’’ and has provided the most
strongly supported available phylogeny to which we compare theresults of our analyses. However, many of the nodes within thisphylogeny either have little support or are completely unresolved(e.g., the genus Caprinae), and extinct taxa have yet to bephylogenetically placed with confidence (e.g., aurochs). Theseweakly supported phylogenies have hampered evolutionary stud-ies and conservation efforts for this intriguingly diverse group.
The number and location of prehistoric domestication eventsfor the extinct aurochs (Bos primigenius) has also been contro-versial (4–8), and the ancestry of many of the derived modernbreeds of cattle is unknown. Genome-wide single nucleotidepolymorphism (SNP) data captured using high-throughput as-says provide a method to perform rapid genomic surveys andhave recently been used to resolve the history of human popu-lations (9, 10). However, these studies were restricted to a singlespecies, and the remarkable power of these analyses (with�500,000 informative sites) was not fully captured becausepopulation relationships depicted using neighbor-joining treesfail to identify multiple ancestral relationships for historicallyadmixed populations. We report an inter-generic, large-scalephylogenomic analysis which applied a genome-wide SNP assaydeveloped for one species to many distantly related species. Wealso report the application of a genome-wide SNP assay tocapture data for ancient DNA samples.
ResultsGenotype Fidelity. We have genotyped 16,353 animals represent-ing 61 cattle breeds and 70 species, as divergent from Bos taurusas the Savannah elephant (Table S1), with the Illumina Bo-vineSNP50 BeadChip (11, 12) according to Illumina protocols(13). To examine the quality of genotype calls in these outgroupspecies, we first sequenced the SNP site and flanking regions for
Author contributions: J.E.D. designed research; J.E.D., S.D.M., K.C., A.C., M.C.M., M.M.R.,J.W.K., R.D.S., and J.F.T. performed research; M.P.H., K.C., A.C., J.V., C.M.S., A.R.C., G.S.J.,R.A.B., O.H., L.S.E., P.W., J.-J.K., K.S.K., T.S.S., C.P.V.T., H.L.N., L.L.C., M.E.B., and G.A.W.contributed new reagents/analytic tools; J.E.D., J.C.P., G.C.C., J.C.M., R.B., R.D.S., and J.F.T.analyzed data; and J.E.D. and J.F.T. wrote the paper.
The authors declare no conflict of interest.
This article is a PNAS Direct Submission.
Freely available online through the PNAS open access option.
1To whom correspondence should be addressed. E-mail: [email protected].
This article contains supporting information online at www.pnas.org/cgi/content/full/0904691106/DCSupplemental.
18644–18649 � PNAS � November 3, 2009 � vol. 106 � no. 44 www.pnas.org�cgi�doi�10.1073�pnas.0904691106
rs17871403 in 14 species, with pronghorn the most divergent ofthe sequenced species (Table S2). This SNP was chosen becauseit has been well characterized in cattle and is a member of a SNPpanel that is widely used for parentage analysis (14). Of thegenotypes produced by the BovineSNP50 assay (Illumina) forthis SNP in these species, 99.13% were concordant with thesequence when we allowed for genotype ambiguity (i.e., WW andSS) (see Methods). One of the six genotyped North Americanmountain goats and one of the eight genotyped caribou haddiscordant BovineSNP50 and sequence-based genotype calls(Table S2). This analysis of a single SNP across multiple speciessuggests a genotyping error rate for BovineSNP50 loci of only0.87%.
We next aligned all 40,843 SNP probe sequences, which are 50bases in length, to the international sheep genomics consortium(www.sheephapmap.org) genome assembly (available at https://isgcdata.agresearch.co.nz/ and in an annotated form at http://www.livestockgenomics.csiro.au/sheep/oar1.0.php) and foundthat only 26,098 (63.9%) could be uniquely aligned, primarilydue to the incomplete status of the assembly. Of these SNP, 829had an unknown base (N) identified at the position of the SNP,and for the remaining 25,269 SNPs, there were 308,518 geno-types called in 17 sheep. Genotype calls were in agreement withthe genotype predicted from the respective sequence base for298,311 genotypes (96.7%). There were 1,834 heterozygousgenotypes and 8,373 genotypes that were homozygous for anallele not predicted by the sequence assembly. This suggests a
BovineSNP50 genotyping error rate of between 2.7 and 3.3% inthe outgroup species.
Finally, when minor allele frequencies (MAF) averaged over40,843 SNPs were plotted against average genotype call rates,samples from outgroup species with the lowest call rates hadhigher than expected MAF (Fig. S1). This appears to be indic-ative of DNA quality issues since, for example, DNA for theCapra ibex samples was extracted from irradiated blood samplesthat had been stored under refrigeration for several years. Onremoving these samples, there was almost no correlation be-tween MAF and call rate (Fig. S1). This indicates that as geneticdistance from cattle increases and call rate decreases, spuriousheterozygote and alternate homozygote genotype calls rarelyarise, indicating support for the quality of these data.
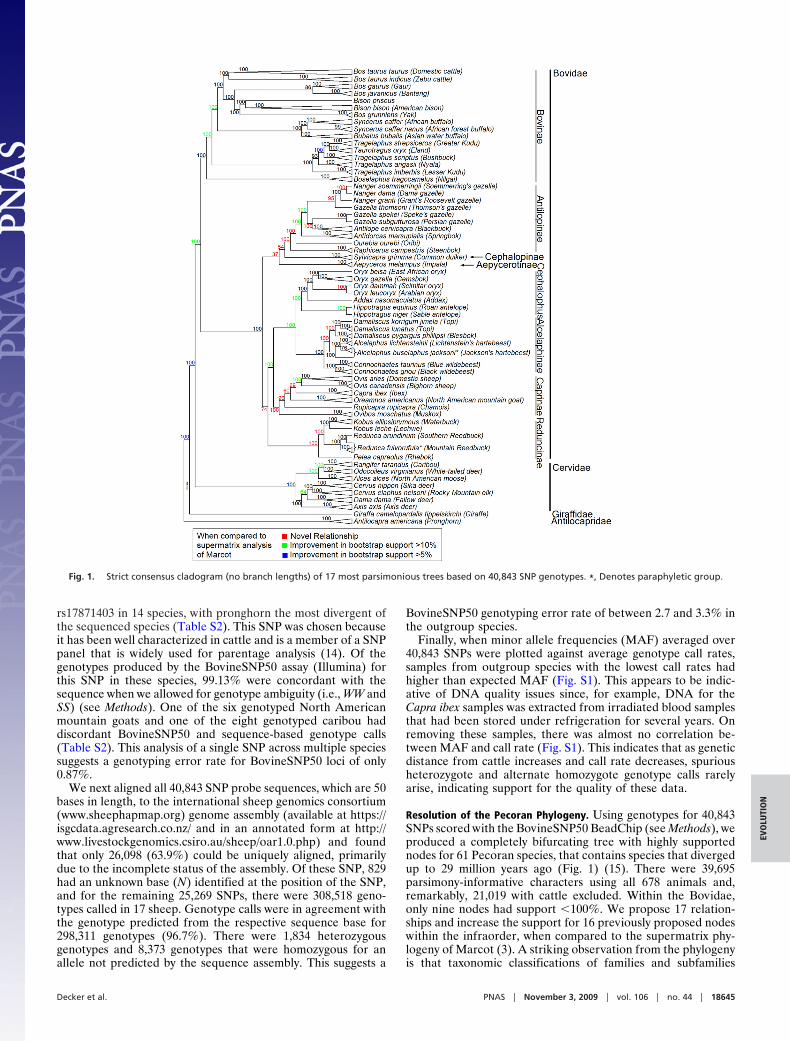
Resolution of the Pecoran Phylogeny. Using genotypes for 40,843SNPs scored with the BovineSNP50 BeadChip (see Methods), weproduced a completely bifurcating tree with highly supportednodes for 61 Pecoran species, that contains species that divergedup to 29 million years ago (Fig. 1) (15). There were 39,695parsimony-informative characters using all 678 animals and,remarkably, 21,019 with cattle excluded. Within the Bovidae,only nine nodes had support �100%. We propose 17 relation-ships and increase the support for 16 previously proposed nodeswithin the infraorder, when compared to the supermatrix phy-logeny of Marcot (3). A striking observation from the phylogenyis that taxonomic classifications of families and subfamilies
Fig. 1. Strict consensus cladogram (no branch lengths) of 17 most parsimonious trees based on 40,843 SNP genotypes. *, Denotes paraphyletic group.
Decker et al. PNAS � November 3, 2009 � vol. 106 � no. 44 � 18645
EVO
LUTI
ON
mirror the topology of the cladogram, since higher taxa formmonophyletic groups. This is an improvement over earlierphylogenies, as previously questionable groupings are nowshown to be monophyletic.
Ancient DNA Samples. Currently, PCR-based and non-PCR-basedmultiple strand displacement amplification (MDA) approachesare used to perform whole genome amplification (16, 17). MDArequires high-quality DNA over 2 kb in length and was found tobe inefficient for the ancient bison DNA. Consequently, we useda universal linker-based PCR amplification performed with theGenomePlex Whole Genome Amplification kit (Sigma-Aldrich)to amplify the minute amounts of damaged DNA preserved inbone samples from two ancient Russian Bison priscus specimensand test whether the Illumina iSelect platform could be used toanalyze samples derived from extinct species. The first, sampleBS662, was collected from permafrost deposits at AlyoshkinaZaimka, Siberia, and is approximately 20,000 years old (18). Thesecond, ACAD012, was collected from Sur’ya 5 cave in the UralMountains and has been accelerator mass spectrometry radio-carbon dated to 34,460 � 290 years BP. Due to the low amountsof DNA from the ancient specimens and the short DNAfragment lengths produced in the whole genome amplification ofdegraded ancient samples, the genotype call rates for thesesamples were much lower than for modern bison (Table S1).However, when these ancient samples were included in theBovini phylogeny (Fig. 1), BS662 was basal to the modern Bisonbison clade as expected, but ACAD012 fell within the modernHereford cattle clade. When we sequenced several overlappingfragments that had been individually amplified from the hyper-variable mitochondrial control region of sample ACAD012, weidentified variability within the overlapping regions. This isconsistent with the sample having been contaminated withmodern DNA or being extremely degraded, as also suggested byour genotype data and consequently the sample was removedfrom the study. A replicate whole genome amplification (libraryidentification KCMU02) was produced from the B. priscussample used to generate BS662, and when this sample wasincluded in the data set, it was sister to BS662, and both remainedsister to modern bison within the phylogeny. However, in thepreparation of this library, we avoided the initial DNA frag-mentation step within the amplification protocol that appearedto greatly improve the quality and quantity of produced geno-types, as KCMU02 produced a higher genotype call rate (54.9 vs.45.8%) and far lower heterozygosity (11.5 vs. 39.6%) than didBS662 (Table S3). While only 76.1% of the 12,279 genotypes thatwere called in both samples were identical, 99.7% of the ho-mozygous genotypes, the only genotype class that has thepotential to be phylogenetically informative (see Methods), wereidentical between the replicates.
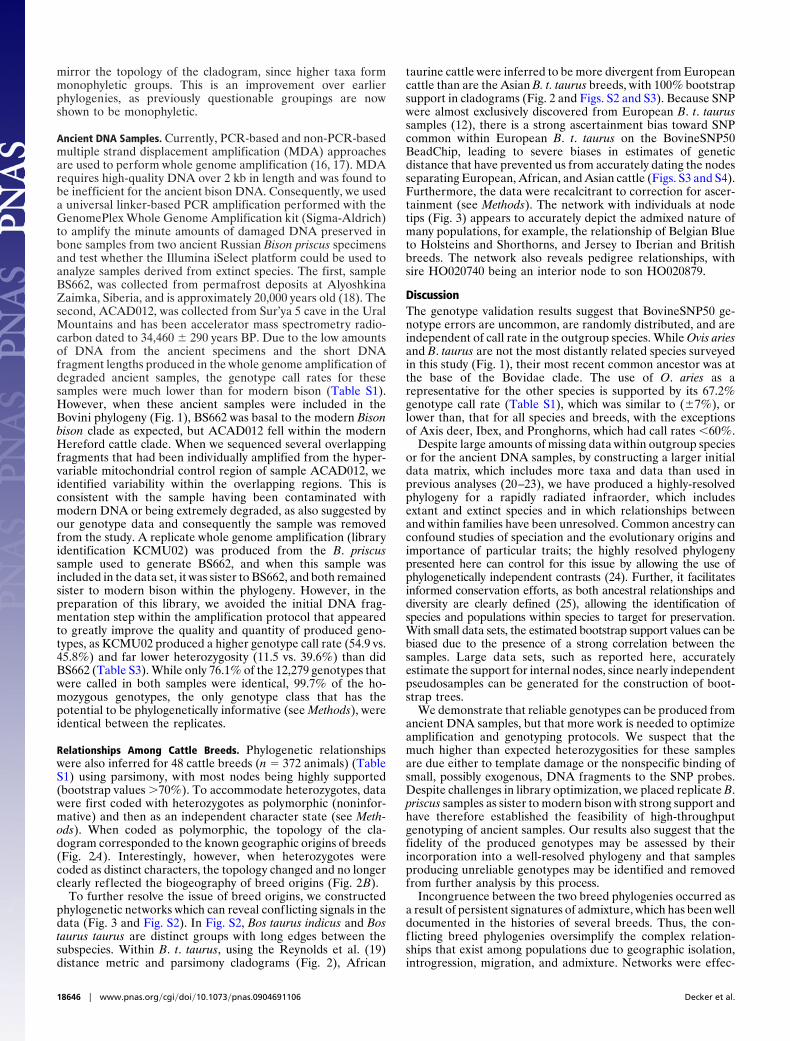
Relationships Among Cattle Breeds. Phylogenetic relationshipswere also inferred for 48 cattle breeds (n � 372 animals) (TableS1) using parsimony, with most nodes being highly supported(bootstrap values �70%). To accommodate heterozygotes, datawere first coded with heterozygotes as polymorphic (noninfor-mative) and then as an independent character state (see Meth-ods). When coded as polymorphic, the topology of the cla-dogram corresponded to the known geographic origins of breeds(Fig. 2A). Interestingly, however, when heterozygotes werecoded as distinct characters, the topology changed and no longerclearly reflected the biogeography of breed origins (Fig. 2B).
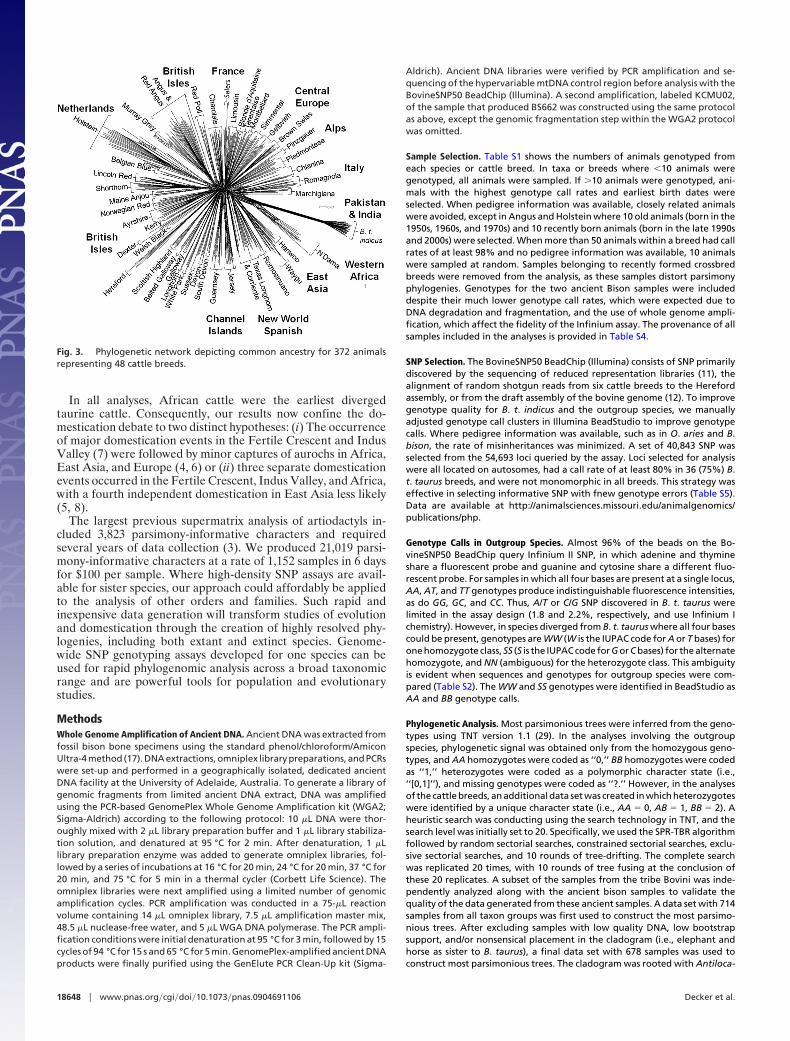
To further resolve the issue of breed origins, we constructedphylogenetic networks which can reveal conflicting signals in thedata (Fig. 3 and Fig. S2). In Fig. S2, Bos taurus indicus and Bostaurus taurus are distinct groups with long edges between thesubspecies. Within B. t. taurus, using the Reynolds et al. (19)distance metric and parsimony cladograms (Fig. 2), African
taurine cattle were inferred to be more divergent from Europeancattle than are the Asian B. t. taurus breeds, with 100% bootstrapsupport in cladograms (Fig. 2 and Figs. S2 and S3). Because SNPwere almost exclusively discovered from European B. t. taurussamples (12), there is a strong ascertainment bias toward SNPcommon within European B. t. taurus on the BovineSNP50BeadChip, leading to severe biases in estimates of geneticdistance that have prevented us from accurately dating the nodesseparating European, African, and Asian cattle (Figs. S3 and S4).Furthermore, the data were recalcitrant to correction for ascer-tainment (see Methods). The network with individuals at nodetips (Fig. 3) appears to accurately depict the admixed nature ofmany populations, for example, the relationship of Belgian Blueto Holsteins and Shorthorns, and Jersey to Iberian and Britishbreeds. The network also reveals pedigree relationships, withsire HO020740 being an interior node to son HO020879.
DiscussionThe genotype validation results suggest that BovineSNP50 ge-notype errors are uncommon, are randomly distributed, and areindependent of call rate in the outgroup species. While Ovis ariesand B. taurus are not the most distantly related species surveyedin this study (Fig. 1), their most recent common ancestor was atthe base of the Bovidae clade. The use of O. aries as arepresentative for the other species is supported by its 67.2%genotype call rate (Table S1), which was similar to (�7%), orlower than, that for all species and breeds, with the exceptionsof Axis deer, Ibex, and Pronghorns, which had call rates �60%.
Despite large amounts of missing data within outgroup speciesor for the ancient DNA samples, by constructing a larger initialdata matrix, which includes more taxa and data than used inprevious analyses (20–23), we have produced a highly-resolvedphylogeny for a rapidly radiated infraorder, which includesextant and extinct species and in which relationships betweenand within families have been unresolved. Common ancestry canconfound studies of speciation and the evolutionary origins andimportance of particular traits; the highly resolved phylogenypresented here can control for this issue by allowing the use ofphylogenetically independent contrasts (24). Further, it facilitatesinformed conservation efforts, as both ancestral relationships anddiversity are clearly defined (25), allowing the identification ofspecies and populations within species to target for preservation.With small data sets, the estimated bootstrap support values can bebiased due to the presence of a strong correlation between thesamples. Large data sets, such as reported here, accuratelyestimate the support for internal nodes, since nearly independentpseudosamples can be generated for the construction of boot-strap trees.
We demonstrate that reliable genotypes can be produced fromancient DNA samples, but that more work is needed to optimizeamplification and genotyping protocols. We suspect that themuch higher than expected heterozygosities for these samplesare due either to template damage or the nonspecific binding ofsmall, possibly exogenous, DNA fragments to the SNP probes.Despite challenges in library optimization, we placed replicate B.priscus samples as sister to modern bison with strong support andhave therefore established the feasibility of high-throughputgenotyping of ancient samples. Our results also suggest that thefidelity of the produced genotypes may be assessed by theirincorporation into a well-resolved phylogeny and that samplesproducing unreliable genotypes may be identified and removedfrom further analysis by this process.
Incongruence between the two breed phylogenies occurred asa result of persistent signatures of admixture, which has been welldocumented in the histories of several breeds. Thus, the con-flicting breed phylogenies oversimplify the complex relation-ships that exist among populations due to geographic isolation,introgression, migration, and admixture. Networks were effec-
18646 � www.pnas.org�cgi�doi�10.1073�pnas.0904691106 Decker et al.
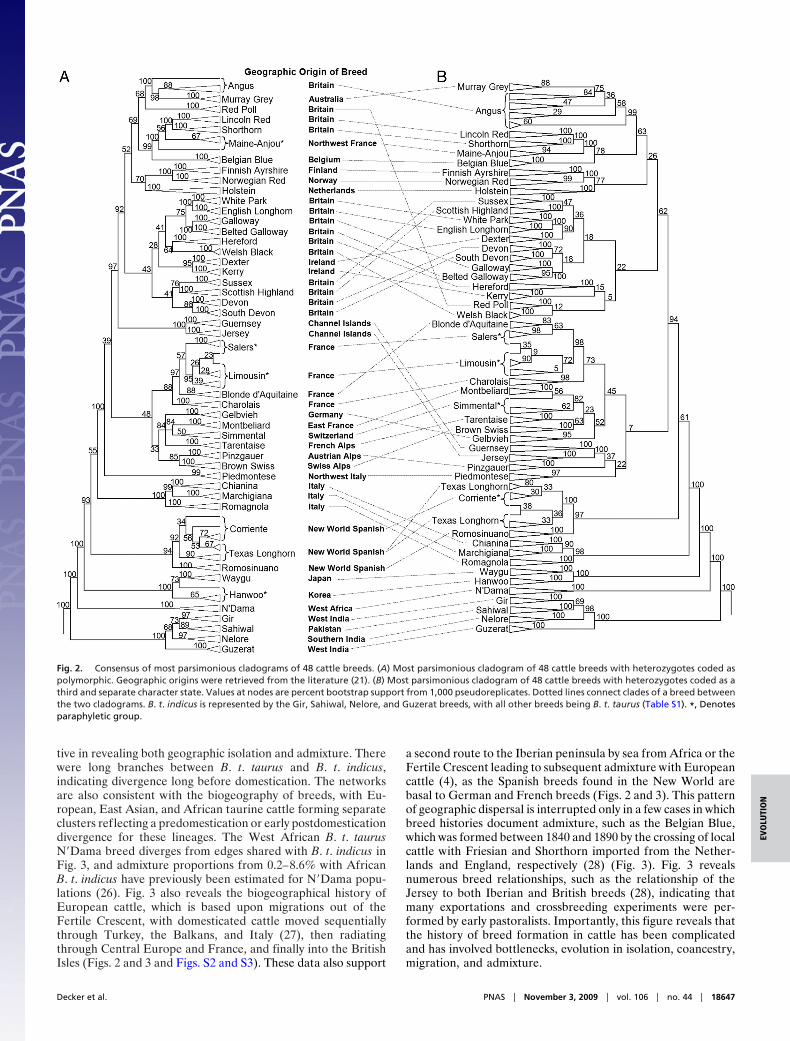
tive in revealing both geographic isolation and admixture. Therewere long branches between B. t. taurus and B. t. indicus,indicating divergence long before domestication. The networksare also consistent with the biogeography of breeds, with Eu-ropean, East Asian, and African taurine cattle forming separateclusters reflecting a predomestication or early postdomesticationdivergence for these lineages. The West African B. t. taurusN�Dama breed diverges from edges shared with B. t. indicus inFig. 3, and admixture proportions from 0.2–8.6% with AfricanB. t. indicus have previously been estimated for N�Dama popu-lations (26). Fig. 3 also reveals the biogeographical history ofEuropean cattle, which is based upon migrations out of theFertile Crescent, with domesticated cattle moved sequentiallythrough Turkey, the Balkans, and Italy (27), then radiatingthrough Central Europe and France, and finally into the BritishIsles (Figs. 2 and 3 and Figs. S2 and S3). These data also support
a second route to the Iberian peninsula by sea from Africa or theFertile Crescent leading to subsequent admixture with Europeancattle (4), as the Spanish breeds found in the New World arebasal to German and French breeds (Figs. 2 and 3). This patternof geographic dispersal is interrupted only in a few cases in whichbreed histories document admixture, such as the Belgian Blue,which was formed between 1840 and 1890 by the crossing of localcattle with Friesian and Shorthorn imported from the Nether-lands and England, respectively (28) (Fig. 3). Fig. 3 revealsnumerous breed relationships, such as the relationship of theJersey to both Iberian and British breeds (28), indicating thatmany exportations and crossbreeding experiments were per-formed by early pastoralists. Importantly, this figure reveals thatthe history of breed formation in cattle has been complicatedand has involved bottlenecks, evolution in isolation, coancestry,migration, and admixture.
Fig. 2. Consensus of most parsimonious cladograms of 48 cattle breeds. (A) Most parsimonious cladogram of 48 cattle breeds with heterozygotes coded aspolymorphic. Geographic origins were retrieved from the literature (21). (B) Most parsimonious cladogram of 48 cattle breeds with heterozygotes coded as athird and separate character state. Values at nodes are percent bootstrap support from 1,000 pseudoreplicates. Dotted lines connect clades of a breed betweenthe two cladograms. B. t. indicus is represented by the Gir, Sahiwal, Nelore, and Guzerat breeds, with all other breeds being B. t. taurus (Table S1). *, Denotesparaphyletic group.
Decker et al. PNAS � November 3, 2009 � vol. 106 � no. 44 � 18647
EVO
LUTI
ON
In all analyses, African cattle were the earliest divergedtaurine cattle. Consequently, our results now confine the do-mestication debate to two distinct hypotheses: (i) The occurrenceof major domestication events in the Fertile Crescent and IndusValley (7) were followed by minor captures of aurochs in Africa,East Asia, and Europe (4, 6) or (ii) three separate domesticationevents occurred in the Fertile Crescent, Indus Valley, and Africa,with a fourth independent domestication in East Asia less likely(5, 8).
The largest previous supermatrix analysis of artiodactyls in-cluded 3,823 parsimony-informative characters and requiredseveral years of data collection (3). We produced 21,019 parsi-mony-informative characters at a rate of 1,152 samples in 6 daysfor $100 per sample. Where high-density SNP assays are avail-able for sister species, our approach could affordably be appliedto the analysis of other orders and families. Such rapid andinexpensive data generation will transform studies of evolutionand domestication through the creation of highly resolved phy-logenies, including both extant and extinct species. Genome-wide SNP genotyping assays developed for one species can beused for rapid phylogenomic analysis across a broad taxonomicrange and are powerful tools for population and evolutionarystudies.
MethodsWhole Genome Amplification of Ancient DNA. Ancient DNA was extracted fromfossil bison bone specimens using the standard phenol/chloroform/AmiconUltra-4 method (17). DNA extractions, omniplex library preparations, and PCRswere set-up and performed in a geographically isolated, dedicated ancientDNA facility at the University of Adelaide, Australia. To generate a library ofgenomic fragments from limited ancient DNA extract, DNA was amplifiedusing the PCR-based GenomePlex Whole Genome Amplification kit (WGA2;Sigma-Aldrich) according to the following protocol: 10 �L DNA were thor-oughly mixed with 2 �L library preparation buffer and 1 �L library stabiliza-tion solution, and denatured at 95 °C for 2 min. After denaturation, 1 �Llibrary preparation enzyme was added to generate omniplex libraries, fol-lowed by a series of incubations at 16 °C for 20 min, 24 °C for 20 min, 37 °C for20 min, and 75 °C for 5 min in a thermal cycler (Corbett Life Science). Theomniplex libraries were next amplified using a limited number of genomicamplification cycles. PCR amplification was conducted in a 75-�L reactionvolume containing 14 �L omniplex library, 7.5 �L amplification master mix,48.5 �L nuclease-free water, and 5 �L WGA DNA polymerase. The PCR ampli-fication conditions were initial denaturation at 95 °C for 3 min, followed by 15cycles of 94 °C for 15 s and 65 °C for 5 min. GenomePlex-amplified ancient DNAproducts were finally purified using the GenElute PCR Clean-Up kit (Sigma-
Aldrich). Ancient DNA libraries were verified by PCR amplification and se-quencing of the hypervariable mtDNA control region before analysis with theBovineSNP50 BeadChip (Illumina). A second amplification, labeled KCMU02,of the sample that produced BS662 was constructed using the same protocolas above, except the genomic fragmentation step within the WGA2 protocolwas omitted.
Sample Selection. Table S1 shows the numbers of animals genotyped fromeach species or cattle breed. In taxa or breeds where �10 animals weregenotyped, all animals were sampled. If �10 animals were genotyped, ani-mals with the highest genotype call rates and earliest birth dates wereselected. When pedigree information was available, closely related animalswere avoided, except in Angus and Holstein where 10 old animals (born in the1950s, 1960s, and 1970s) and 10 recently born animals (born in the late 1990sand 2000s) were selected. When more than 50 animals within a breed had callrates of at least 98% and no pedigree information was available, 10 animalswere sampled at random. Samples belonging to recently formed crossbredbreeds were removed from the analysis, as these samples distort parsimonyphylogenies. Genotypes for the two ancient Bison samples were includeddespite their much lower genotype call rates, which were expected due toDNA degradation and fragmentation, and the use of whole genome ampli-fication, which affect the fidelity of the Infinium assay. The provenance of allsamples included in the analyses is provided in Table S4.
SNP Selection. The BovineSNP50 BeadChip (Illumina) consists of SNP primarilydiscovered by the sequencing of reduced representation libraries (11), thealignment of random shotgun reads from six cattle breeds to the Herefordassembly, or from the draft assembly of the bovine genome (12). To improvegenotype quality for B. t. indicus and the outgroup species, we manuallyadjusted genotype call clusters in Illumina BeadStudio to improve genotypecalls. Where pedigree information was available, such as in O. aries and B.bison, the rate of misinheritances was minimized. A set of 40,843 SNP wasselected from the 54,693 loci queried by the assay. Loci selected for analysiswere all located on autosomes, had a call rate of at least 80% in 36 (75%) B.t. taurus breeds, and were not monomorphic in all breeds. This strategy waseffective in selecting informative SNP with fnew genotype errors (Table S5).Data are available at http://animalsciences.missouri.edu/animalgenomics/publications/php.
Genotype Calls in Outgroup Species. Almost 96% of the beads on the Bo-vineSNP50 BeadChip query Infinium II SNP, in which adenine and thymineshare a fluorescent probe and guanine and cytosine share a different fluo-rescent probe. For samples in which all four bases are present at a single locus,AA, AT, and TT genotypes produce indistinguishable fluorescence intensities,as do GG, GC, and CC. Thus, A/T or C/G SNP discovered in B. t. taurus werelimited in the assay design (1.8 and 2.2%, respectively, and use Infinium Ichemistry). However, in species diverged from B. t. taurus where all four basescould be present, genotypes are WW (W is the IUPAC code for A or T bases) forone homozygote class, SS (S is the IUPAC code for G or C bases) for the alternatehomozygote, and NN (ambiguous) for the heterozygote class. This ambiguityis evident when sequences and genotypes for outgroup species were com-pared (Table S2). The WW and SS genotypes were identified in BeadStudio asAA and BB genotype calls.
Phylogenetic Analysis. Most parsimonious trees were inferred from the geno-types using TNT version 1.1 (29). In the analyses involving the outgroupspecies, phylogenetic signal was obtained only from the homozygous geno-types, and AA homozygotes were coded as ‘‘0,’’ BB homozygotes were codedas ‘‘1,’’ heterozygotes were coded as a polymorphic character state (i.e.,‘‘[0,1]’’), and missing genotypes were coded as ‘‘?.’’ However, in the analysesof the cattle breeds, an additional data set was created in which heterozygoteswere identified by a unique character state (i.e., AA � 0, AB � 1, BB � 2). Aheuristic search was conducting using the search technology in TNT, and thesearch level was initially set to 20. Specifically, we used the SPR-TBR algorithmfollowed by random sectorial searches, constrained sectorial searches, exclu-sive sectorial searches, and 10 rounds of tree-drifting. The complete searchwas replicated 20 times, with 10 rounds of tree fusing at the conclusion ofthese 20 replicates. A subset of the samples from the tribe Bovini was inde-pendently analyzed along with the ancient bison samples to validate thequality of the data generated from these ancient samples. A data set with 714samples from all taxon groups was first used to construct the most parsimo-nious trees. After excluding samples with low quality DNA, low bootstrapsupport, and/or nonsensical placement in the cladogram (i.e., elephant andhorse as sister to B. taurus), a final data set with 678 samples was used toconstruct most parsimonious trees. The cladogram was rooted with Antiloca-
Fig. 3. Phylogenetic network depicting common ancestry for 372 animalsrepresenting 48 cattle breeds.
18648 � www.pnas.org�cgi�doi�10.1073�pnas.0904691106 Decker et al.
pra americana. Using these 678 samples, bootstrap support was calculatedusing 1,000 pseudoreplicates, and for expediency, the SPR-TBR heuristic searchwas used.
Allele frequencies were estimated for 40,843 SNP in 22 breeds (Table S6),and these frequencies were used to estimate pairwise Reynolds distances (19)among the breeds (Fig. S3). Several attempts were made to correct estimatesof genetic distance for SNP ascertainment bias. First, distances were calculatedfrom haplotype frequencies. Haplotypes were inferred for the autosomes ofall genotyped animals in our collection within each breed group (Table S6)using fastPhase (30). From these haplotyped samples, haplotypes were ex-tracted for the study animals for 885 nonoverlapping loci, each comprising sixSNP for which the intermarker distance was �50 kb for contiguous SNP.Haplotype frequencies were estimated for each of the 885 loci within eachbreed group and were used to estimate Reynolds distances between breeds.Next, we formed weighted distances by averaging individual SNP distancesweighted according to the frequency of unascertained SNP (31) possessing theMAF observed in each of the two populations. Finally, we also subsampledapproximately 3,000 or approximately 8,000 SNP such that the resulting MAFdistribution conformed to the unascertained distribution of bovine SNP (31) inAngus or Holstein, respectively. The subsample size was determined by theseverity of underrepresentation of SNP within the MAF range 0.005–0.015 andindicates that ascertainment bias was more severe for Angus than for Holstein.Reynolds and Nei genetic distances corrected for sample size (Table S6) wereestimated for each subsample and were averaged across 1,000 bootstrap
replicates. Distances were used to construct neighbor-joining and UPGMAtrees with Phylip (32). None of the approaches taken to correct for ascertain-ment bias were able to establish a tree in which branch lengths were clock-like.Biases in the allele frequency spectrum differ within B. t. taurus breeds (Fig. S4)causing the distances between breeds to not be clock-like.
Figures of phylogenies and cladograms were produced in MrEnt3 (33), andphylogenetic networks were constructed using SplitsTree version 4.10 (34).Distances based upon allele frequencies at 40,843 SNP were used to constructa network of 22 breeds. Due to memory limitations in SplitsTree, genotypes at14,023 SNP were used to construct a network of 372 individuals belonging to48 breeds. Default settings in SplitsTree were used to construct the networks.
ACKNOWLEDGMENTS. This project was supported by National Research Ini-tiative (NRI) grant nos. 2006–35616-16697, 2008–35205-18864, and 2008–35205-04687 from the U.S. Department of Agriculture Cooperative StateResearch, Education, and Extension Service (CSREES), 13321 from the MissouriLife Science Research Board and DP0773602 from the Australian ResearchCouncil. J.J.K. and K.W.K. were supported by the Technology DevelopmentProgram for Agriculture and Forestry, Ministry of Agriculture, Forestry andFisheries, Republic of Korea. We acknowledge the contribution of DNA sam-ples from UK breed societies and cattle breeders as well as the Rare BreedsSurvival Trust. We appreciate the critical review and useful comments ofAlejandro Rooney. We thank Oliva Handt for help constructing ancient bisonlibraries. Technical assistance was provided by David Morrice and Karen Troup(Ark Genomics, The Roslin Institute, Edinburgh, UK). We gratefully acknowl-edge access to Bovine HapMap Project genotypes.
1. Foss SE, Prothero DR (2007) Introduction to The Evolution of Artiodactyls, eds Foss SE,Prothero DR (Johns Hopkins University Press, Baltimore, MD), pp 1–3.
2. Gatesy J, Yelon D, DeSalle R, Vrba ES (1992) Phylogeny of the Bovidae (Artiodactyla,Mammalia), based on mitochondrial ribosomal DNA sequences. Mol Biol Evol 9:433–446.
3. Marcot JD (2007) Molecular phylogeny of terrestrial artiodactyls: Conflicts and reso-lution, in The Evolution of Artiodactyls, eds Foss SE, Prothero DR (Johns HopkinsUniversity Press, Baltimore, MD), pp 4–18.
4. Beja-Pereira A, et al. (2006) The origin of European cattle: Evidence from modern andancient DNA. Proc Natl Acad Sci USA 103:8113–8118.
5. Bradley DG, MacHugh DE, Cunningham P, Loftus RT (1996) Mitochondrial diversity andthe origins of African and European cattle. Proc Natl Acad Sci USA 93:5131–5135.
6. Gotherstrom A, et al. (2005) Cattle domestication in the Near East was followed byhybridization with aurochs bulls in Europe. Proc Biol Sci 272:2345–2350.
7. Loftus RT, MacHugh DE, Bradley DG, Sharp PM, Cunningham P (1994) Evidence for twoindependent domestications of cattle. Proc Natl Acad Sci USA 91:2757–2761.
8. Mannen H, et al. (2004) Independent mitochondrial origin and historical geneticdifferentiation in North Eastern Asian cattle. Mol Phylogenet Evol 32:539–544.
9. Li JZ, et al. (2008) Worldwide human relationships inferred from genome-wide pat-terns of variation. Science 319:1100–1104.
10. Jakobsson M, et al. (2008) Genotype, haplotype and copy-number variation in world-wide human populations. Nature 451:998–1003.
11. Van Tassell CP, et al. (2008) SNP discovery and allele frequency estimation by deepsequencing of reduced representation libraries. Nat Methods 5:247–252.
12. Matukumalli LK, et al. (2009) Development and characterization of a high density SNPgenotyping assay for cattle. PloS ONE 4:e5350.
13. Steemers FJ, et al. (2006) Whole-genome genotyping with the single-base extensionassay. Nat Methods 3:31–33.
14. Heaton MP, et al. (2002) Selection and use of SNP markers for animal identification andpaternity analysis in U.S. beef cattle. Mamm Genome 13:272–281.
15. Hassanin A, Douzery EJ (2003) Molecular and morphological phylogenies of Ruminan-tia and the alternative position of the Moschidae. Syst Biol 52:206–228.
16. Dean FB, et al. (2002) Comprehensive human genome amplification using multipledisplacement amplification. Proc Natl Acad Sci USA 99:5261–5266.
17. Iwamoto K, et al. (2007) Evaluation of whole genome amplification methods usingpostmortem brain samples. J Neurosci Methods 165:104–110.
18. Shapiro B, et al. (2004) Rise and fall of the Beringian steppe bison. Science 306:1561–1565.
19. Reynolds J, Weir BS, Cockerham CC (1983) Estimation of the coancestry coefficient:Basis for a short-term genetic distance. Genetics 105:767–779.
20. Rokas A, Carroll SB (2005) More genes or more taxa? The relative contribution of genenumber and taxon number to phylogenetic accuracy. Mol Biol Evol 22:1337–1344.
21. Wiens JJ (1998) Does adding characters with missing data increase or decrease phylo-genetic accuracy? Syst Biol 47:625–640.
22. Wiens JJ (2003) Missing data, incomplete taxa, and phylogenetic accuracy. Syst Biol52:528–538.
23. Heath TA, Zwickl DJ, Kim J, Hillis DM (2008) Taxon sampling affects inferences ofmacroevolutionary processes from phylogenetic trees. Syst Biol 57:160–166.
24. Felsenstein J (1985) Phylogenies and the comparative method. Am Nat 125:1–15.25. Moritz C (1995) Uses of molecular phylogenies for conservation. Phil Trans R Soc Lond
349:113–118.26. MacHugh DE, Shriver MD, Loftus RT, Cunningham P, Bradley DG (1997) Microsatellite
DNA variation and the evolution, domestication and phylogeography of taurine andzebu cattle (Bos taurus and Bos indicus). Genetics 146:1071–1086.
27. Pellecchia M, et al. (2007) The mystery of Etruscan origins: Novel clues from Bos taurusmitochondrial DNA. Proc Biol Sci 274:1175–1179.
28. Porter V (1991) Cattle: A Handbook to the Breeds of the World (Christopher HelmPublishers Ltd, London, UK).
29. Goloboff PA, Farris JS, Nixon KC (2008) TNT, a free program for phylogenetic analysis.Cladistics 24:774–786.
30. Scheet P, Stephens M (2006) A fast and flexible statistical model for large-scalepopulation genotype data: Applications to inferring missing genotypes and haplotypicphase. Am J Hum Genet 78:629–644.
31. The Bovine HapMap Consortium (2009) Genome wide survey of SNP variation uncoversthe genetic structure of cattle breeds. Science 324:528–532.
32. Felsenstein J (1989) PHYLIP—phylogeny inference package (version 3.2). Cladistics5:164–166.
33. Zuccon A, Zuccon D (2008) MrEnt v. 3. Program distributed by the authors. Available athttp://www.mrent.org/frame1.htm.
34. Huson DH, Bryant D (2006) Application of phylogenetic networks in evolutionarystudies. Mol Biol Evol 23:254–267.
Decker et al. PNAS � November 3, 2009 � vol. 106 � no. 44 � 18649
EVO
LUTI
ON