resonance raman spectroscopy i - university of …chemistry.uohyd.ac.in/~mvr/cy578/nb/read-2.pdf ·...
TRANSCRIPT
Dennis p. Strommen Carthage College
Kenosha. Wisconsin 53140 and Kazuo Nakamoto I Resonance Raman Spectroscopy
Marquene University Milwaukee, Wisconsin 53233 I
There are few techniques available to chemists today that haw the widr ranee of a~olicahilirv inherent to Resonance Raman ~ ~ e c t r o s c ~ y (RRS). By employing RRS it is possible to studv reactions taking place a t the surface of electrodes ( I - ? , , ,i,tilinstructural i;f"rmatim irom derpwithincnmplex biolngical nwlecules 1.54). dtwrmine the shapes of potential surfaces (7) and molecular geometries (8) inexcited states, record spectra of species with half-lives on the fi sec level (9) , obtain highly accurate values for physical parameters such as anharmonicity coefficients ( l o ) , and monitor reactions on catalytic surfaces (I1 ). The preceding list is not meant to be complete, but only to give the reader an idea of the wide utility of RRS.
In the past the situation for Raman spectroscopists was not this advantaeeous. Earlv work. in what is referred to as normal Raman Spectroscopy (NRS), used a low pressure mercury arc as the source of electromagnetic radiation. Experiments in- volving NRS usually required neat liquids or solutions with concentrations ereater than 0.1 M and rather large volumes 01 sample i n urder to obrnin reasonnl~le signal to noise ratios. 'I'hesr limitations were Inrrrl\r overcome with the advent of laser sources whose powerfulmtput could be focused into a very small volume of sample. Using the laser, samples in the fi1 and mM ranges can he readily studied.
Early Raman measurements were made on compounds which were selected such that the Hg exciting lines fell far short of the first excited electronic states. This was necessary since absorption would result in local heating effects and consequently sample decomposition. Now this difficulty is
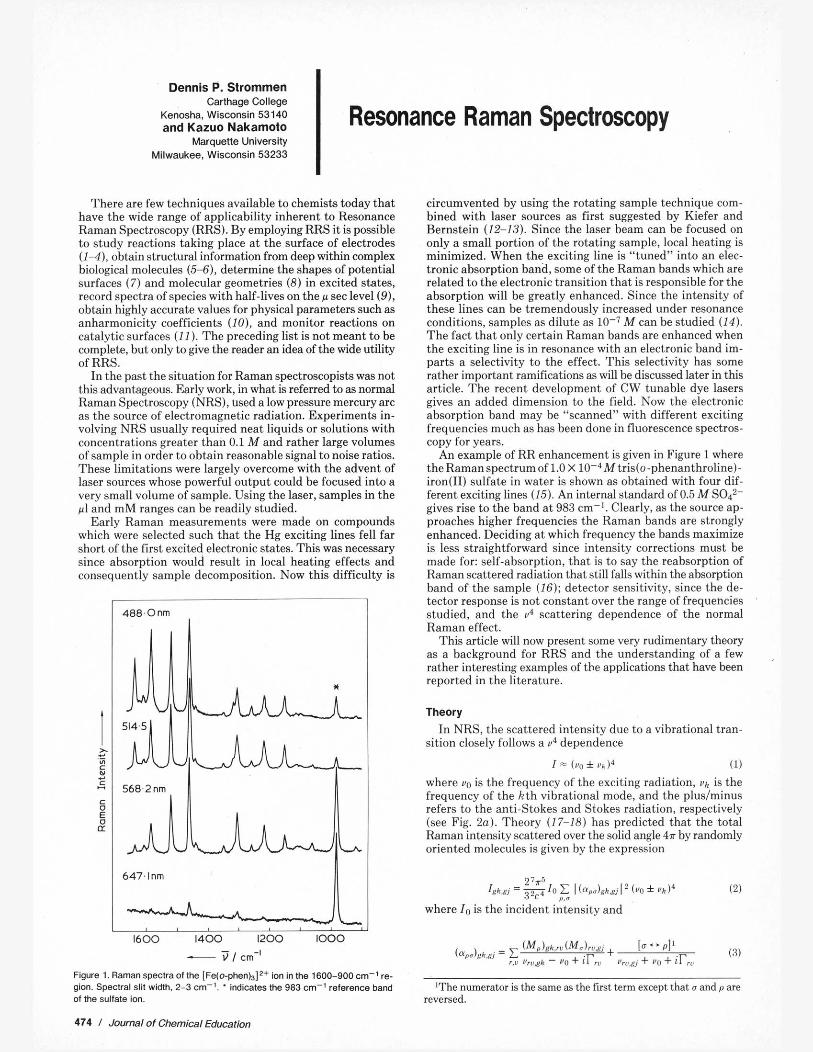
Figure 1. Raman spectra of the [Fe(+phen)3I2+ ion in me 1600-900 cm-' re- gion. Spectral slit width. 2-3 cm-'. ' indicates the 983 cm-' reference band of the sulfate ion.
circumvented by using the rotating sample technique com- bined with laser sources as first suggested by Kiefer and Bernstein (12-13). Since the laser beam can he focused on only a small portion of the rotating sample, local heating is minimized. When the exciting line is "tuned" into an elec- tronic absorption hanil, some of the Raman bands which are related to the electronic transition that is responsible for the absorption will he greatly enhanced. Since the intensity of these lines can be tremendouslv increased under resonance conditions, samplrs as dilute a* 10 .:A! can hestudied I 14). The fact [hat onlv certain Haman hands are mhanced when the exciting line is in resonance with an electronic band im- parts a selectivity to the effect. This selectivity has some rather important ramifications as will he discussed later in this article. The recent development of CW tunable dye lasers gives an added dimension to the field. Now the electronic absorption band may be "scanned" with different exciting frequencies much as has been done in fluorescence spectros- copy for years.
An example of RR enhancement is given in Figure 1 where the Ramanspectrumof 1.0 X 10-Wtris(o-phenanthroline). iron(I1) sulfate in water is shown as obtained with four dif- ferent exciting lines (15). An internal standard of 0.5 A4 S O P gives rise to the band a t 983 em-'. Clearly, as the source ap- proaches higher frequencies the Raman hands are strongly enhanced. Deciding a t which freauency the hands maximize is less straightforward since intensity corrections must be made for: self-absorption, that is to say the reahsorption of Raman scattered radiation that still falls within the absorption hand of the sample (16): detector sensitivity, since the de- tector response i6 not constant over the ran& of frequencies studied, and the 04 scattering dependence of the normal . -
Raman effect. This article will now present some very rudimentary theory
as a background for RRS and the understanding of a few rather interesting examples of the applications that have been reported in the literature.
Theory In NRS, the scattered intensity due to a vibrational tran-
sition closely follows a "4 dependence
I = (u, f "kI4 (11
where vo is the frequency of the exciting radiation, va is the frequency of the hth vibrational mode, and the pluslminus refers to the anti-Stokes and Stokes radiation, respectively (see Fig. 2a). Theory (17-18) has predicted that the total Raman intensity scattered over the solid angle 4s by randomly oriented molecules is given by the expression
27n5 10 [ (cZ,oo)gk.gj) (''0 * "k)' I&, = 7&7 ,,. (2)
where lo is the incident intensity and
'The numerator is the same as the first term except that li and p are reversed.
474 1 Journal of Chemical Education
a b Figue 2. Emgl bvel diagams in Raman eWecD: S = Stakes. A = antiStokes. (a) Ordinary Raman effect. (b) Normal resonance Raman effect.
(~,,),k+~ is referred to as the p d h component of the Raman scattermg tensor (where p,o = x,y, or 2 ) ; g and r refer to the ground and any excited electronic state, respectively, k,u and j are vibrational quantum numbers, I-," is a damping constant which has been loosely correlated with the half-width of a given excited state and (M,),,a refers to the pth component of the electronic transition moment from state a to b. The summation formally runs over all excited states and cannot be evaluated analytically unless some rather critical as- sumptions are made. For the case of RRS (see Fig. 2b) certain terms in the summation mav become extraordinarilv laree " .. (e.g.. . .where un approaches u ,,., b , (see eqn. t311, the net result beinn that the ohserved intensity follows a complex u depen- dence. In NRS where the exciting frequency i;far removed from the first excited state (see Fig. 20). the result of the summation may be considered a cuktant since small changes in vo will not mearlv favnr any particular term. In that case the . . oriiin of the u4 dependence is clearly understood (see eqn. (2)).
In order to understand the origins of the RR effect we will consider a molecule with just two low-lying excited electronic states. e and s. and the chanees in intensitv that occur when the exciting frequency is moved into resonance with thelower state e. Under these conditions. the basic annroach of Albrecht (19) may then he employed i n a manner Similar to the treat- ment bv Inaeaki et al. (20). where consideration of the de- pendence of the electronic transition moments on the normal vibrational modes leads to an expression for the elements of the scattering tensor of the following form
.. and v, - u, is the frequency corresponding to the difference between statese ands. All of the inteerals listed above areol the general type ( a l F l b ) , where F :an take any of the fol- lowing forms
1) F = 1; simple overlap integral 2) F = p or o; integral corresponding toa pure electronic transition
moment
3) F = Q.; integral corresponding to a vibrational transition mo- ment. (0, is a normal coordinate)
4) F = (JH?>Q,); integral corresponding to the degree of coupling of states a and b through the normal mode Q.
As the source is "tuned" into thee absorption band, the A term will describe the behavior of the intensities of totally symmetric modes since the product of the integrals ( k lu) and ( U 1 j ) in eqn. (7) can he finite due to the non-orthogonality of vibrational wavefunctions in the ground and excited states of totally symmetric vibrations. Then the intensity of totally symmetric vibrations can increase as the exciting frequency comes into resonance with the lowest excited state. F& non- totally symmetric modes the vibrational wavefunctions are more nearly orthogonal and thus these modes mav onlv derive their intensity from interactions described by i h e B term. Consideration of the form of B clearly indicates that the single most important factor for resonance enhancement is the value of h,.Q. Thus if two excited states are efficiently coupled bv a given normal mode, that normal mode can he expected tb be enhanced to a large extent. Application of moup theoretical principles quickly answers the question of whkthei or not h, ,~ will be finite, since in order for the integral to be non-zero, I-.@r.@r, must contain the totally symmetric representa- tion. Here we can clearly see part of the reason for the inherent selectivity of RRS. This selectivitv also shows itself with re-
~~~ ~ ~
spert to totally qmmetric modes as it IS quickly ~hsrrved [hat only those vihrutional modes lnvolvine bonds affected I n the change in electronic state are enhanced. For example i i the case of Fe(I1)-a-diimine complexes, an electronic hand in the visible region is known to hedue to charge-transfer from the metal to the ligand. This charge is localized in the skeletal region. When the Raman spectrum is obtained with radiation that falls within this visible band, only a-diimine skeletal modes are enhanced (15) (see Fig. 1).
One final point to be made is that B-type enhancement is .usually smaller than A-type due to
1) theadditional factor (u , - u,) in the denominator of theB term (see eqn. (6))
2) the additional factor (k,") in the numerator of the B term (see eqns. ( 6 ) and (9))
Taken together, these terms merely reflect the fact that B- type enhancement requires efficient coupling of nearby electronic states, which is less common than-A-type en-- hancement via resonance with a single electronic state. These considerations account for the observation that for most molecules studied to date, only symmetric modes have been resonance enhanced.
Applications
Vibrational Frequencies in Excited States I t has been demonstrated by Ohta and Ito (7) in a study of
quinoxaline, that measurements of the intensities of Raman Eries taken at different excitation wavelengths can be used to assign excited state frequencies of non-totally svmmetric modes. An earlier work ( 2 1 , on quinoxnlinr u.h&h employed the usual a ~ ~ p r n a r h ut'vibrational analysis nf electronic spec. tra, assignedexcited state frequencies to three of the bl mbdes as shown in the second column of the table. These assignments were made by employing the concept of "parallel correspon- dence" from the ground to excited states. The expression "parallel correspondence" merely implies that in going from the ground to the excited state, the order of vihrational frequencies will not be changed. Ohta and Ito were able to show qualitatively that the strongest hand observed in the vihronic spectrum should undergo the greatest frequency change between the excited and ground states. Since the n - s* absorption spectrum of quinoxaline is dominated by a 425 cm-' band they concluded that the reported 62 cm-' shift of frequency (425 - 487 cm-I) was too small. Starting from the vibronic theory of the Raman effect as set forth by Alhrecht
Volume 54, Number 8, August 1977 / 475

auentlv exhibit long, well-defined progressions of overtones B, Vibrational Assignmentsfor Quinoxaline (cm-'1
First First Ground State Excited Sfafea ~ x c i t e d stateb
aJaraan et al. (see Ref. (211 bohta and i to (see Ref. (71. Cvaluer not rewrtea.
(19), Ohta and Ito showed that the intensity enhancements of the non-totally symmetric vibrations were related to the differences of their frequencies in the excited and ground states through the h," term (see also eqn. (6))
The primed term refers to the excited state frequency. Mea- surements of the relative intensities showed that the ratios of the coupling terms (in this case: ('BllaHlaQI 'Al)) for the 867.796.487 and 398 cm-I lines should he 4.2:1.7:0:1. On this basis they proposed the assignments given in column 3 of the table. In s u ~ ~ o r t of their conclusion they pointed out that the 867 cm-I mode is due to an out-of-plane C-H bending mo- tion which is similar to that motion iwnd in pyrazine, whose frequency decreases from 925 to 385 cm-1 as a result of vi- hronic coupling (22).
Determination of Molecular Geometry in an Excited State Hirakawa andTsuhoi (81 hare postulated the empiriral
that i f a Ranian line becomes stronger when the exciting fre- quency is brought into resonance with an electronic hand, this means that thr wuilibrium ronformation oi the molecule is distorted along th i normal roordinate of the given Kaman line in the transirio~~ from rhe nround to exrited electronic state. The most striking examPC that is presented in their article is the case of gaseous NH3 where on changing from an exciting line of 514.5 nm to one of 351.1 nm the intensity of the um- brella vibration (uz, 930 cm-I) is enhanced ten times more than that of the symmetric stretch. This is exactly what is expected since the first excited electronic state of NH3, which lies at 216.8 nm above the ground state, is known to he planar (23). Although this is an extremely simple case, the possible uses of intensity information such as this are obvious.
Overtones in Resonance Raman Spectra One of the unique features of a normal Raman spectrum is
the ~ e n e r a l absence of overtones and combination hands. ~ ~-~ ~ ~~
When, however the exciting line coincides with an electronic absorption hand, simple molecules, such as I p and TiIp, fre-
Figure 3. Resonance Raman spectrvm of solid Til. (514.5 nm excitation) (Clark and Mitchell. Ref. ( lO)]-reproduced by permission of the authors.
~ -
c&responding to totally symmt:tric modes. Indtwl, the i n - tensity of the first overtone may he nearly cqur~l to that of the fundnmenwl. Kiefer and Bernstein (241 d~served l5owrtww; tbr I , in the gas phase. An interestlng sidelight to this was that Bernatein (251 u,as able to olwrve HH sratterinr oieaseous - ~ . - . I2 when using radiation oi lXX.U nm and resunanre ilutms- cence when using 514.5 nm radiation. The latter ison thcwder of 103 times stronger than RR scattering and would over- shadow it in all cases if not for the quenching which occurs in . solutions.
Clark and Mitchell (10) observed as many as 9 overtones in the RR spectrum of Ti14 in solution and 11 overtones in the solid state (see Fig. 3). There is a useful academic application nossible using these lone overtone nroeressions. that being the . . - calculatiun uf harmonic frequencies and nnhnrmonicity run. stants. Tht, latter desrrihes thr dewition ofa vihratim from the simple harmonic approximation while the former is the freauencv the mode would exhibit if truly harmonic. These par&netek may he obtained to a high degree of accuracy from the relationship (26)
u(n) = n w ~ - X l l ( n z + n) +. . . (11)
where v(n) is the observed wavenumber of any overtone, w l is the harmonic frequency, XI1 is the anharmonicity constant and n is the vihrat&alrpantum numher. A plot of u(n)ln versus n will then give a straight line with a slope equal to Xl l (n + 1) and an intercept equal to wl. An exercise of this type, employing published spectra, would seem to he appro- priate for use in an elementary instrumental analysis or physical chemistry course.
Studies of Unstable Species Two different approaches have been taken to study un-
stable snecies bv RRS. One. reworted bv Woodruff (27). em- . . ploys a stanrlard c~u~t i t~uous flow appamnls which sends the reaction mlxture thrt.uoh aca~illar\ , lulw that liesat rhe fural point of the laser. using this method in a study of the system consistine of horseradish peroxidase and hvdronen peroxide it was sh& that intermediates having half:live<on the order of 0.06 s could readily be studied by RRS.
The second approach was that of Pagsberg et al. (9) who studied the radical anion of terphenyl(TP.-). This radical anion has a stability that is strongly dependent on the nature of the solvent and counterions. Stable solutions can he oh- tained hv reducing w-ternhenvl with sodium in tetrahvdro- furan wkle a shokhved TP.' can he produced by pulsed radiolysis of a solution of p-terphenyl dissolved in a mixture of ethanol and ethylenediammine. The RR technique in this application involved the use of a flash lamp pumped dye laser as a source, with an optical multichannel analyzer for signal detection. Dye laser pulses from Coumarin 102 (481.61 nm) of 10 mJ and 600 ns duration were focused onto a spot of 0.25 mm diameter within the cell. This exciting frequency falls on the red side of an electronic absorption h&d with a maximum at 470.0 nm. One of the enhanced Raman lines (1593 cm-') ofTI'.- was found to he comparable in intensity to the 1454 c n - ' ethanol line while thr TP.- concentration was unly 1 X lo-" .A!. This p;~rticulur line *,as found to he d ~ w r v a l ~ l e even at a T P - cr~ncentrarionut8 X 10-'..Zt. The result is partinl- larlv imnressive cons~dt!rinr thc fact that the half-life u i T W
A . " under their experimental conditions was -2fi s. Frequencies of the TP.- hands thus obtained were then compared to those of TP.- under stable conditions and found to he in excellent agreement.
Biological Systems Perhaps the greatest interest in RRS has involved the study
of hioloeicallv sienificant molecules. Since there are a numher ~ ~~ ~ , . ~~ . ,. of excellent reviews available 15.61 we will only tourh un a few of the manv a~olicatiuns of RR in this area. Thr R R ~roccsc lends itselfto't'his area since the nature pf the effect'is such
476 1 Journal of Chemical Education
that only modes associated with the chromophoric group of a molecule are enhanced (17). The consequences of this are immediately obvious
1) Vibrational modes of chromophoric groups in biological mole- cules, which are often the sites of their biological activities, will be strongly enhanced.
2) The remainder of the vibrational modes will not he enhanced and therefore cannot complicate the spectra.
3) Due to the increased sensitivity of the effect, spectra can be obtained under physiologically relevant conditions.
In sum then, we have a useful biological probe that is both highly selective and extremely sensitive.
Heme related systems have received the most attention from spectroscopists. For example, the spin and oxidation states of Fe atoms in hemoglobin and cytochrome-c can be determined rather simply from the frequency shifts of RR enhanced modes (28). The appearance of a hand showing inverse polarization (for a discussion of inverse polarization see ref. (6)) at -1580 cm-1 is indicative of low-spin Fe in both the Fe(I1) and Fe(II1) states (28). This band shifts to -1553 cm-1 in high-spin complexes. In cytocbrome-c and other heme proteins, a hand at -1360 cm-I indicates Fe(I1); while if the Fe is oxidized to Fe(II1) the hand shifts to 1375 cm-I. More extensive tables of frequency correlations for hemes are availahle in the literature (5,6,29).
The interaction of dyes with biological substrates can also he investigated via RRS. Cary et al. (30), in an investigation of the interaction of methyl orange (MO) dye with bovine serum albumin (BSA), studied the spectrum of aqueous, solid and BSA complexed to MO. On the basis of the great simi- larity of the solid and complex spectra they were able to con- clude that the MO was buried within the protein rather than adsorbed on its surface.
Spectroelectrochemistry The detection and study of electrogenerated species
through the use of spectroscopic methods is well documented (31). Foremost among the methods employed are those of electron spin resonance (ESR) and uv-visible spectroscopies. ESR is severely limited by the requirement that the species under study must be paramagnetic and uv-visible spectros- copy, while not limited to paramagnetic compounds, usually contains little structural information. Infrared spectroscopy should theoretically reveal much structural information but its application is limited due to the small spectral window available when water is used as a solvent.
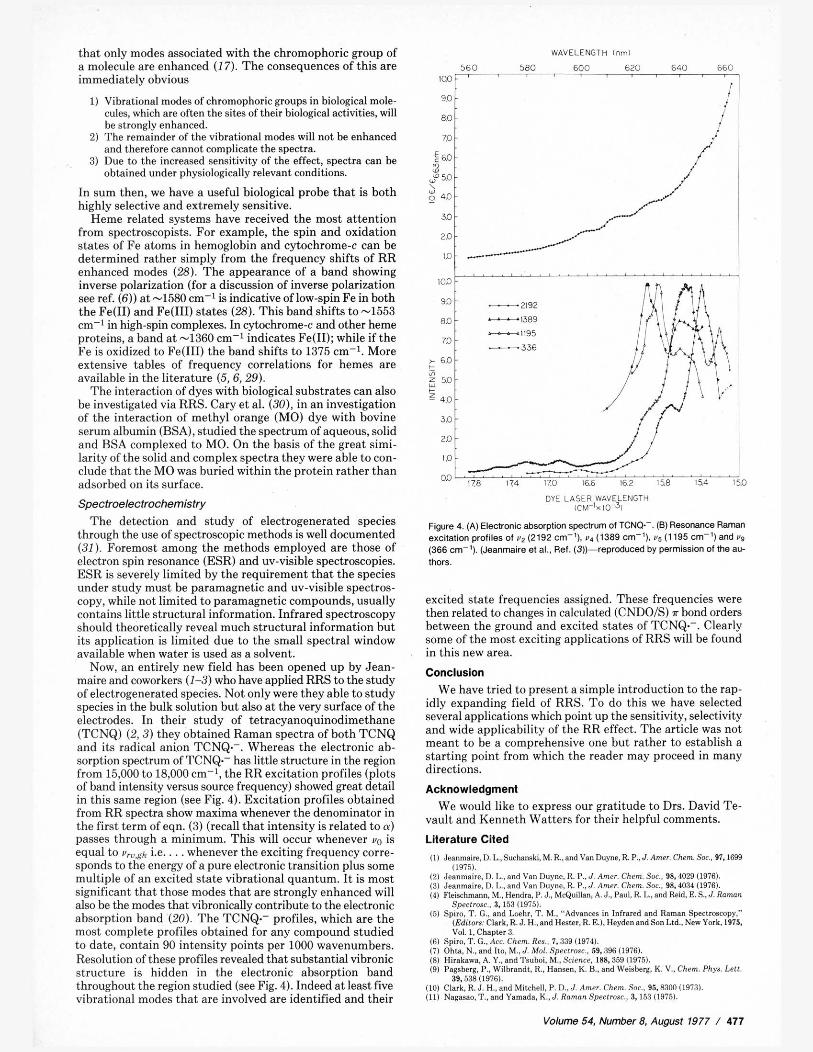
Now, an entirely new field has been opened up by Jean- maire and coworkers (1-3) who have applied RRS to the study of electrogenerated species. Not only were they able to study species in the bulk solution but also at the very surface of the electrodes. In their study of tetracyanoquinodimethane (TCNQ) (2,3) they ohtained Raman spectra of hoth TCNQ and its radical anion TCNQ.-. Whereas the electronic ah- sorption spectrum of TCNQ.- has little structure in the region from 15,000 to 18,000 em-', the RR excitation profiles (plots of hand intensity versus source frequency) showed great detail in this same region (see Fig. 4). Excitation profiles ohtained from RR spectra show maxima whenever the denominator in the first term of eqn. (3) (recall that intensity is related to a) passes through a minimum. This will occur whenever vo is equal to u,,h i.e.. . . whenever the exciting frequency corre- sponds to the energy of a pure electronic transition plus some multiple of an excited state vibrational quantum. It is most significant that those modes that are strongly enhanced will also be the modes that vibronically contribute to the electronic absorption band (20). The TCNQ.- profiles, which are the most complete profiles ohtained for any compound studied to date, contain 90 intensity points per 1000 wavenumhers. Resolution of these profiles revealed that substantial vihronic structure is hidden in the electronic absorption hand throughout the region studied (see Fig. 4). Indeed at least five vibrational modes that are involved are identified and their
WAVELENGTH lnml
5 6 0 5 8 0 6 0 0 6 2 0 6 4 0 66C 100 '
1
DYE LASER WAVELENGTH ICM-'X,O-?
Figure 4. (A) Electronic absorption spectfum of TCNQ-. (0) ResaMnce Raman excitation profiles of vz (2192 cm-'), v4 (1389 em-'), v5 (1195 cm-') and vs (366 cm-'). (Jeanmaire el al.. Ref. (a)--reproduced by permission of the au- thors.
excited state frequencies assigned. These frequencies were then related to changes in calculated (CNDO/S) a bond orders between the ground and excited states of TCNQ.-. Clearly some of the most exciting applications of RRS will he found in this new area.
Conclusion We have tried to present a simple introduction to the rap-
idly expanding field of RRS. To do this we have selected several applications which point up the sensitivity, selectivity and wide applicability of the RR effect. The article was not meant to be a comprehensive one hut rather to establish a starting point from which the reader may proceed in many directions.
Acknowledgment We would like to express our gratitude to Drs. David Te-
vault and Kenneth Watters for their helpful comments.
Literature Cited I11 Joanrnaire.D. L.,Suehanski, M. R.,andVsnDuyne,R. P., JAmar. Chem. Sm.. 97.1699
i l Q 7 i i . . . . . . . ( 2 .I..#>rna#c. D I. and \mnu)nr .H 1' J l n r r Cnim S.I . 91.10.9\1976!.
. I ~ ~ ~ ~ ~ ~ ~ . u I .and t a n nl,,nr R P . . I mm in. 9s.4 31 19-6 1 4 , F I ~ , . ~ ~ . ~ , . , , . , . . ~ H ~ ~ I , . , P .I \ I ~ . , I I ~ ~ A I .vl,, H I. nnn n d F: 5 I R L ~ ~ D ~
.D.'.,, ,,' 3, 353 !ITC, 5 i p u I I ; . and L a-r. 'I \ I . ''.4d\snl~. I,, inlrarrd and Rrrnan Sp+arorcup~."
. . . . . . 35. 538119761.
I101 Clark, R. J. H.. sndMItehel1, P.D., J. Amer Chrm. Sot, 95,8300 (18731 111) Nagasso. T.. and Yamada, K., J. Roman Sp~ctrasc . , 3.153 119751.
Volume 54. Number 8. August 1977 / 477

. . (161 ~ t ~ a i s s , T c . , ~ d s m s , D. H. ,~s iker , A,, and s p i r o , ~ . G., APPI. s p m m c . , 28,324
119741. (171 Tmg. J.. and ~ l b k e h t . A. C.,"Raman Spectmampy."Plsnumfiesa, New Yurk. I970.
Vol 2, (Editor: Szymanski. H. A,). Chspt. 2. (18) Plaezek, G.. in E. Man. "Handbuch der Radiologie." Akademkhe V n ~ ~ e W a f t .
Leipzig. 1934. Vol. 6, p. 205: English tranalstian by Ann Werblin. UCRL Tmns- 526iL1, ia p roceed by the clearing hovae far Federal Scientificand Technical In. formation of the US. Department of Commerce.
I191 Alhreeht, A.C..J. Chem. Fhys. 34.1476 (19811. (201 Inagaki. F.. Tssumi. M.. and Miyazewa, T., J . Mol. Speetmm., 50,286 11974).
(21) Jordan, A. D., Fisher, G., Rokos, K.. and Rass, I. G., J. Mol. Speclrosc., 45, 173 (1W11 ,.-.-,.
(221 Innes,K.K.,Simmon%,J.,andTilford,S., J. MoLSpeclroae.. 11.287 (1963). 123) Douglas, A. E.. Discura. Foroday Soc, 35.159 i1963l. (24) Kiefer, W., and Bernstein. H. J., J Moi. Spoelmac., 43,388 (1972l. (251 Bematein. H. J.. "Advances in Ramm Spoetrneapy," Heydenand SanLtd.. New Yark,
1973,Vol. l,(Edifor Mathieu, J.P.I.Chapf.37. (281 Herzberg. G.,"lnfraredsnd Raman Spectra ofPolyetamifMale4ca,'. Van Noatrand,
Princeton. New Jersey, I945.p. 205. (271 Woodruff, W. H., and Spiro. T. G., Appl. Spselroac., 28,576 (1974l. (281 Yamamoto,T.. Palmer, G., Gill.D.,Saimeem. I. T.. and Rimai.I.., J. R i d Chem.. 248,
5211 (19731. (29) laehr.T. M.,and Lwhr. J . S..Biochem.Biophys.Rss. Commun.. 65,218l1973l. (301 Caray.P. R..Schneid~r, H., andBernstein, H. J., Biochem. Biophya. Ros. Commun.,
41,588 (19721. 1311 Kuwsna ,T . .B~~. Bunssnges. Phys Chem.. 77.858(19731.
478 1 Journal of Chemical Education