resource allocation from the love of money perspective thomas li-ping tang middle tennessee state...
TRANSCRIPT

Resource Allocation from the Love of Money Perspective
Thomas Li-Ping TangMiddle Tennessee State University, the USA
Yuh-Jia Chen Middle Tennessee State University, the USA
The 26th International Congress of Applied PsychologyAthens, Greece, July 16-21, 2006

Outline
• The Meaning of Money• The Love of Money Scale• The Resource Allocation Scale • Method• Results • Discussion, Implications, Limitations

Money
• The instrument of commerce and the measure of value (Smith, 1776/1937).
• Attract, retain, and motivate employees and achieve organizational goals (Chiu, Luk, &
Tang, 2002; Milkovich & Newman, 2005; Tang, Kim, & Tang, 2000).
The Meaning of Money
is “in the eye of the beholder” (McClelland, 1967,
p. 10)
and can be used as the “frame of reference” (Tang, 1992) in which people examine their everyday lives (Tang & Chiu,
2003; Tang, Luna-Arocas, & Sutarso, 2005).
The Importance of Money
*10 Job Preferences, Pay was ranked: (Jurgensen, 1978)
No. 5 by Men
No. 7 by Women
*11 work goals, Pay was ranked: (Harpaz, 1990).
No. 1 in Germany
No. 2 in Belgium, the UK, and the US

Why Do Students Go to College?
In 1971, 49.9 % of freshman said: They want “to make more money”.
In 1993, 75.1 %
(The American Freshman, 1994).
Major Cause of Dissatisfaction Among University Students
The Lack of Money
1981-1987: No. 2
1990-1996: No. 3
1997-2003: No. 1 (Bryan, 2004).

The ABCs of Money Attitudes
Affective: Do you “love or hate” money?
Behavioral: What do you “do” with your money?
Cognitive: What does money “mean” to you?

The Love of Money ScaleFactor 1: Rich (Affective)
1. I want to be rich.2. It would be nice to be rich.3. Having a lot of money (being rich) is good.
Factor 2: Motivator (Behavior)4. I am motivated to work hard for money.5. Money reinforces me to work harder.6. I am highly motivated by money.
Factor 2: Importance (Cognitive)7. Money is good.8. Money is important.9. Money is valuable.
Lotteries
37 States in the USA have turned to new State lotteries as a way to increase state funding for services like education (Dee, 2004).
On January 20, 2005, Tennessee’s lottery marks its first anniversary.

TN Lottery
Retailers have sold more than $850 million worth of tickets and receive a 6.5 percent commission on tickets sales (Yeldell, 2005).
About 40,000 lottery scholarships have been awarded across the State of Tennessee in 2004 (Shepard, 2004).

Ajzen & Fishbein (1980)
Attitude Behavioral Intention:
The Love of Money Resource Allocation
Research Question:
If you win a lottery for one million dollars, how do you spend your money?
College Major: Business vs. Psychology
Gender: Males vs. Females

20 Items--Resource Allocation
1. Deposit in a bank, 2. Invest in stocks, 3. Buy a new house, 4. Buy car(s), 5. Buy personal items, TV, camera, 6. Buy a large piece of land, 7. Start (buy) a business, 8. Give/save money for children, 9. Give money/gifts to parents, 10. Give money/gifts to relatives,
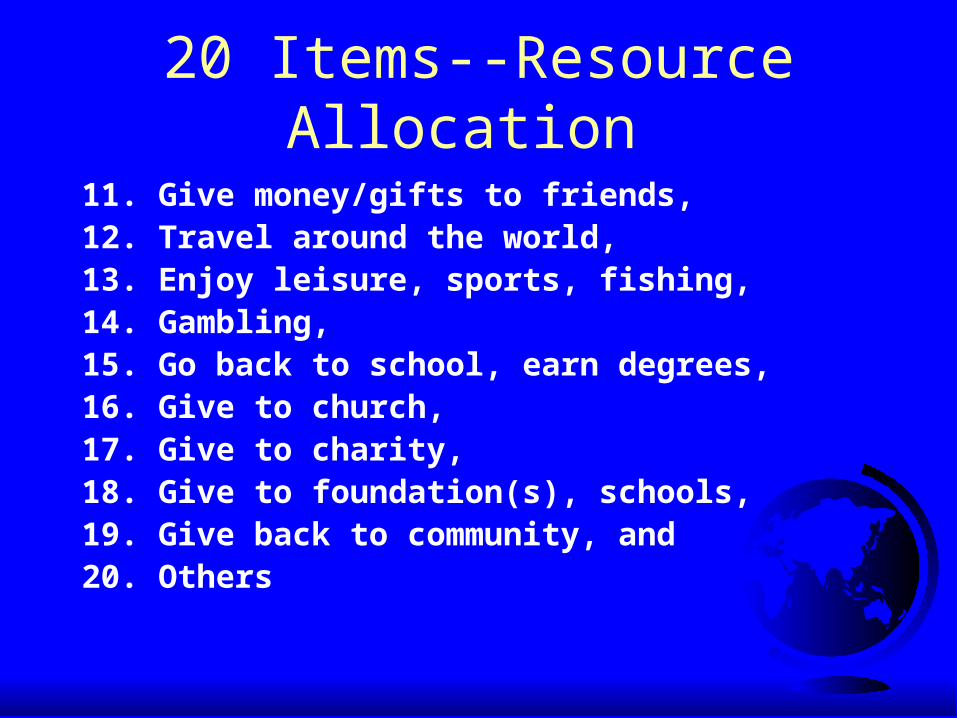
20 Items--Resource Allocation
11. Give money/gifts to friends, 12. Travel around the world, 13. Enjoy leisure, sports, fishing, 14. Gambling, 15. Go back to school, earn degrees, 16. Give to church, 17. Give to charity, 18. Give to foundation(s), schools, 19. Give back to community, and 20. Others

6 Categories
Bank
Investment
Personal Spending (buy house, car, TV, etc.)
Family
Charity
Fun (travel, leisure, gambling, go back to school)

Method
N = 2991. Business students in the “Principles of
Management” course (for juniors) (n = 198, male = 116 (63%), female = 68)
2. Psychology students in “Basic Statistics for Behavioral Science” course (for juniors) (n = 101, male = 33 (37%), female = 56)
Measures
1. The 9-item-3-factor Love of Money Scale (Tang & Chen, 2006; Tang et al., 2006)
2. The 20-item Resource Allocation Scale

Results
1. Descriptive Statistics
2. Multiple Regression
3. SEM Results

Table 1. The Mean and Standard Deviation of Major Variable_____________________________________________________________________________________________________________________Variable M SD_____________________________________________________________________________________________________________________1. Age 22.83 5.622. Gender .54 .503. Education 15.07 .994. Major 1.34 .475. The Love of Money (LOM) 3.96 .666. Deposit in a bank 25.32 20.927. Invest in stocks 8.69 12.528. Buy a new house 13.18 11.569. Buy car(s) 3.68 3.8710. Buy personal items, TV, camera 3.27 3.7711. Buy a large piece of land 4.23 7.5912. Start (buy) a business 4.34 8.4913. Give/save money for children 5.76 7.2614. Give money/gifts to parents 6.84 6.3915. Give money/gifts to relatives 2.44 3.2316. Give money/gifts to friends 2.15 3.5517. Travel around the world 3.62 4.4118. Enjoy leisure, sports, fishing 2.55 3.7619. Gambling .40 1.3520. Go back to school, earn degrees 1.28 3.4121. Give money to church 5.00 5.8922. Give money to charity 3.03 4.4523. Give money to foundation(s), schools 1.54 3.4124. Give money back to community 1.40 2.5125. Others 1.28 5.50_____________________________________________________________________________________________________________________Note. Gender: Male = 1, Female = 0. Major: Business = 1, Psychology = 2. The Love of Money was measured using a 5-point Likert scale. Items
6 to 25: If you win a lottery for one million dollars ($1,000,000), how do you spend your money? Results revealed the percentage that participants allocated to each category.
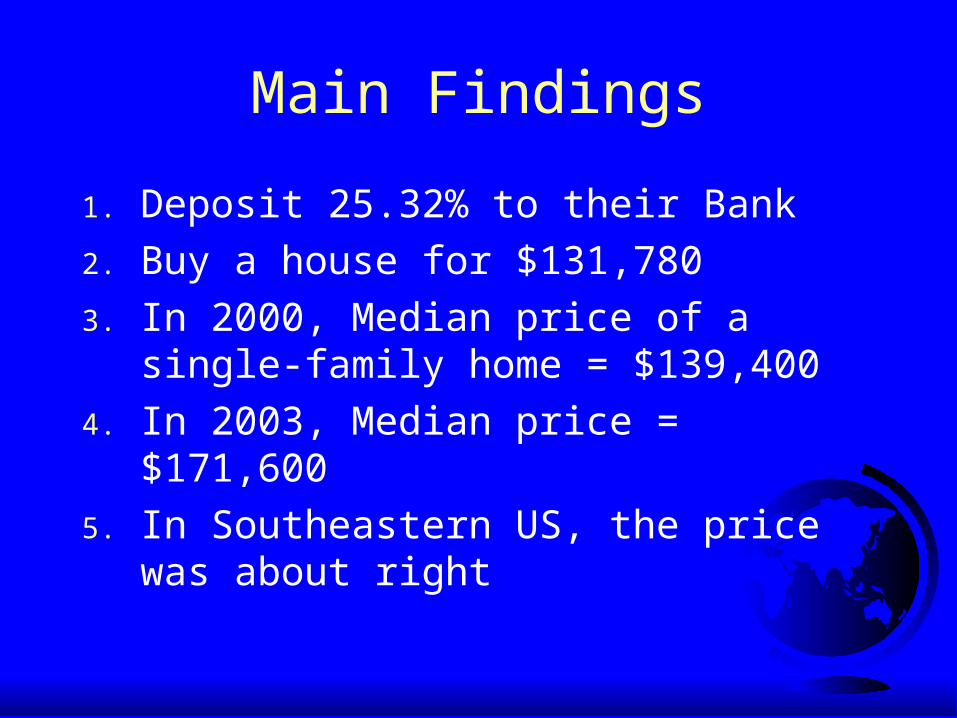
Main Findings
1. Deposit 25.32% to their Bank
2. Buy a house for $131,780
3. In 2000, Median price of a single-family home = $139,400
4. In 2003, Median price = $171,600
5. In Southeastern US, the price was about right

Predict the Love of Money, Using Multiple Regression
1. Give money to charity beta = -.166
2. Give money to foundation -.155
3. Give/Save money for children -.142
4. Buy a new house .134
5. Start a business .122

Chi-Square = 1024.31 df = 346 p = .00
Chi-Square/df = 2.96 TLI = .94
CFI = .95SRMSR = .07RMSEA = .08
The Love of Money
.58
M4e4
.72
M5e5
.76
M6e6
.54
M7e7
.36
M8e8
.45
M9e9
.66
M1e1
.40
M2e2
.47
Motivator
.76
.74
Important
.84
Rich.63
.85
.87
.73
.68
M3e3 .82
.60
.67
.81
The Loveof Money
e22
e23
e21
.86
.92
.69
.04
S4 e34.20
S5 e35.12
S6 e36.10
S7 e37.02
S8 e38.50
S9 e39.12
S10 e40.18
S11 e41.03
S12 e42.46
S13 e43.05
S14 e44.26
S15 e45.06
S16 e46.02
S17 e47.00
S18 e48
.01
S1 e31
.01
S2 e32.02
S3 e33
.03
S19 e49
.72
Bank
.15
Invest
.18
Personal
.10
Charity
.11
Fun
e51
e52
e53
e55
e56
.09
.06
Family
e54
.09
-.13
.14.71
.35
.45.35
.20
.32
.43
.18.68
.22
.51
.24-.13
-.03
.38
-.25
-.32
-.34
.85
.42
-.17

SEM Results
C.R. (path)
LOM Personal 3.103**
Family -2.762**
Charity -3.432**

Chi-Square = 1109.18 df = 387 p = .00
Chi-Square/df = 2.87 TLI = .94
CFI = .95SRMSR = .07RMSEA = .08
The Love of Money
.57
M4e4
.72
M5e5
.76
M6e6
.55
M7e7
.35
M8e8
.44
M9e9
.66
M1e1
.39
M2e2
.47
Motivator
.76
.75
Important
.85
Rich.63
.85
.87
.74
.68
M3e3 .82
.59
.66
.81
The Loveof Money
e22
e23
e21
.86
.91
.67
.00S4 e34
.24S5 e35
.11S6 e36
.09S7 e37
.02S8 e38
.43S9 e39
.16S10 e40
.16S11 e41
.03S12 e42
.43S13 e43
.06S14 e44
.27S15 e45
.08S16 e46
.05S17 e47
.02S18 e48
.01
S1 e31
.04S2 e32
.00S3 e33
.01S19 e49
.75
Bank
.85
Invest
.18
Personal
.12
Charity
.36
Fun
e51
e52
e53
e55
e56
.10
.13
Family
e54
.21
-.05
.15.65
.40
.49.33
.01
.30
.41
.18.66
.24
.52
.28
-.22
-.14
.01
-.23
-.30
-.18
.80
.42
.10
1.00
Major
e61
Major
1.00
1.00Sex
e62
Gender
1.00
.23
-.92
-.08
.00
.11
.13
.25
.13-.02
-.27
-.11
-.55
-.02
-.10-.12
.06
.08
.15

SEM with 2 Control Variables
Major Investment -3.381**Sex Family -3.283**
Fun -2.944**Rich 2.309*
LOM Personal 3.094**Family -2.547*Charity -3.225**
Major: Business = 1, Psychology = 2Sex: Male = 1, Female = 0

Implications--1
The Love of Money may serve as one’s “frame of reference” in allocating money (resources) to different categories of items.
High LOM Low Family
Low Charity
High Personal
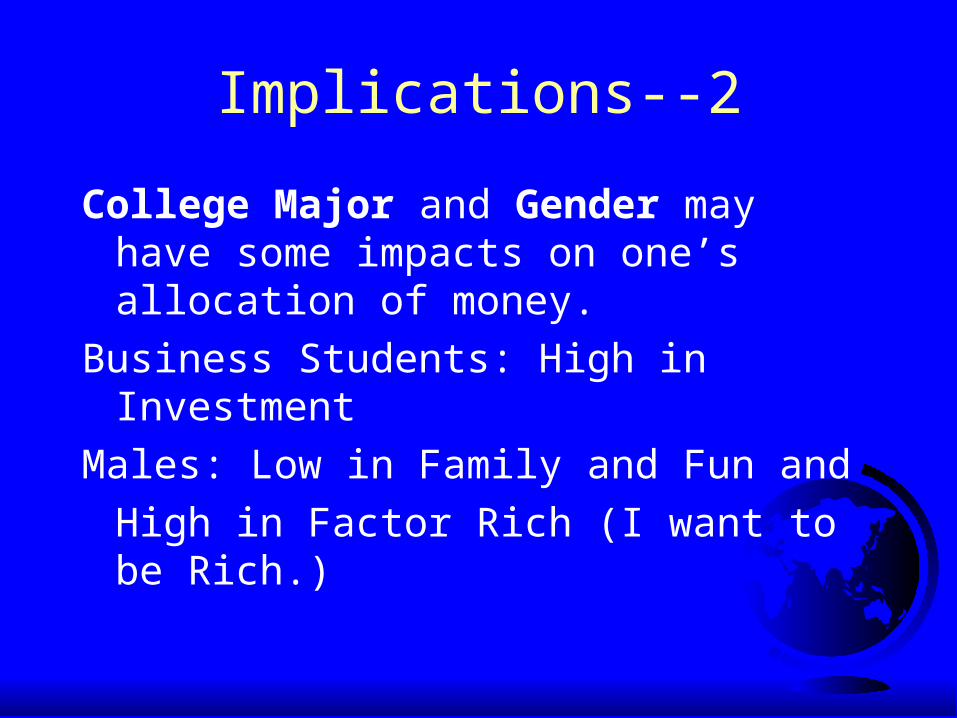
Implications--2
College Major and Gender may have some impacts on one’s allocation of money.
Business Students: High in Investment
Males: Low in Family and Fun and
High in Factor Rich (I want to be Rich.)

Implications--3
After controlling for Major and Gender:
High LOM Low Family
Low Charity
High Personal

Implications--4
University Students, Age = 22.83Major Allocation Categories:
Bank: 25.32%House: 13.18%Investment: 8.69%
Personal Interests, Establishments, Security and Safety needs,
Maslow’s Hierarchy of Needs

Limitations
1. Sample equivalence
2. Common method biases
3. Extraneous or nuisance variables
4. Non-random samples, we cannot generalize the findings to the whole population with full confidence.
Final Thoughts and Conclusions
This study offers researchers some confidence and insights in using the Love of Money Scale.
The Love of Money is related to economic behavior.
When researchers and practitioners apply the same tools consistently across organizations and geopolitical entities overtime, the cumulative results will enhance our abilities to understand, predict, and control the role of the love of money in organizations.
Thank YouDanke
Dankeshen
Grazie
Merci
Muchas Gracias
謝謝