resource assessment - houston€¦ · page 1, november 2017 greater ost / south union description...
TRANSCRIPT

Page 1, November 2017 Greater OST / South Union
DescriptionGreater OST/South Union is a collection of neighborhoods in south central Houston inside Loop 610. Most of the homes in this community were built just after World War II. Many of these small homes have been converted to commercial use, especially along Martin Luther King Boulevard. Other areas, such as LaSalette Place, remain deed restricted and well maintained. One small portion of Riverside Terrace is included in the community immediately south of MacGregor Park. Commercial development has revived along Old Spanish Trail, and the Shrine of the Black Madonna church has purchased and redeveloped a number of deteriorated properties near its sanctu-ary. In addition, new home construction is occurring in various locations throughout the area.
Highlights Houston City Council District D
Houston Independent School District
5 Police beats (includes bordering beats)
2,773 acres (4.33 sq. miles)
Super Neighborhood HoustonPop. characteristics 2000 2015 2000 2015Total population 19,523 19,141 1,953,631 2,217,706 Persons per sq. mile 4,509 4,418 3,166 3,314
Age of PopulationUnder 5 years 8% 7% 8% 8%5 - 17 years 21% 18% 19% 17%18 - 64 years 57% 61% 64% 65%65 and over 14% 14% 9% 10%
EthnicityNon Hispanic Whites 2% 3% 31% 26%Non Hispanic Blacks 84% 77% 25% 22%Hispanics 13% 19% 37% 44%Non Hispanic Asians 1% 1% 6% 7%Non Hispanic Others 1% 1% 1% 1%
IncomeUnder $25,000 58% 45% 33% 27%$25,001 to $50,000 26% 26% 31% 25%$50,001 to $100,000 15% 23% 24% 26%Over $100,001 2% 6% 12% 22%
Median Household Income $20,586 $34,019 $36,616 $46,187
Educational StatusNo Diploma 38% 24% 30% 23%High School Diploma 29% 32% 20% 23%Some College 23% 31% 23% 24%Bachelor's or Higher 9% 13% 27% 31%
Housing and HouseholdsTotal housing units 7,805 8,636 782,378 909,336 Occupied 90% 83% 92% 88% Vacant 10% 17% 8% 12%Total households 7,036 7,146 717,945 799,714Family households 4,735 4,133 457,549 491,778Median Housing Value $38,114 $88,774 $79,300 $131,700
GREATER OST / SOUTH UNIONNO. 68
R E S O U R C E A S S E S S M E N T
Super Neighborhood Houston
Page 2, November 2017 Greater OST / South Union
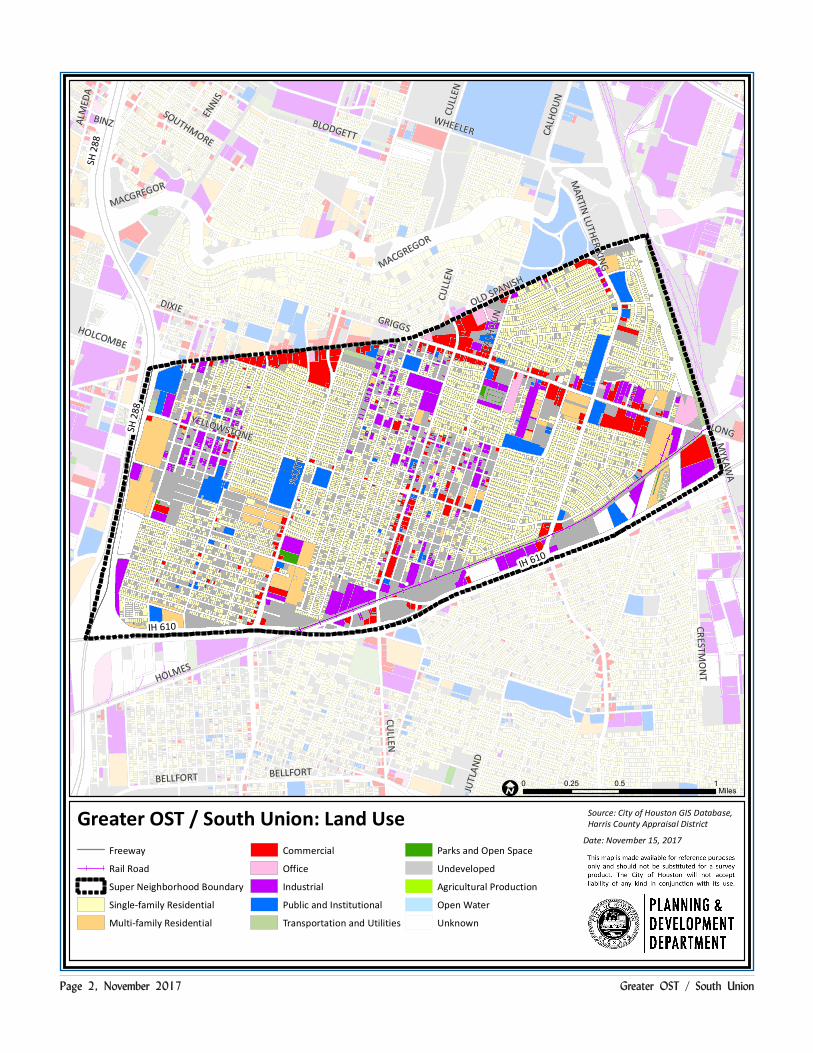
Greater OST / South Union: Land Use
SCOT
T
GRIGGS
OLD SPANISHMACGREGOR
DIXIE
HOLMES
WHEELER
YELLOWSTONE
JUTL
AND
CRESTMO
NT
SOUTHMORE
BLODGETT
ENNIS
CULL
EN
BELLFORT
MYKAW
AAL
MED
A
BINZ
CALH
OUN
HOLCOMBE
LONG
MARTIN LUTHER KING
CULLEN
MACGREGOR
CULL
EN
BELLFORT
CALH
OUN
IH 610
SH 2
88
SH 2
88
IH 610
I 0 0.5 10.25Miles
Freeway
Rail Road
Super Neighborhood Boundary
Single-family Residential
Multi-family Residential
Commercial
Office
Industrial
Public and Institutional
Transportation and Utilities
Parks and Open Space
Undeveloped
Agricultural Production
Open Water
Unknown
Source: City of Houston GIS Database,
Date: November 15, 2017
Harris County Appraisal District

Page 3, November 2017 Greater OST / South Union
Greater OST / South Union: Public Facilities Source: City of Houston GIS Database
Date: October 2017
Council District D
Council District I
SCOT
T
GRIGGS
OLD SPANISH
DIXIE
MACGREGOR
HOLMES
WHEELER
YELLOWSTONE
JUTL
AND
SOUTHMOREBLODGETT
MAR
TIN
LUTH
ER K
ING
CRESTMO
NT
ENNIS
CULL
EN
ALM
EDA
MYKAW
A
BINZ
HOLCOMBE
CALH
OUN
LONG
BELLFORT
DOW
LING
MACGREGOR
BELLFORT
CALH
OUN
CULL
EN
CULLEN
BELLFORT
IH 610
SH 2
88
IH 45
IH 45
IH 610
SH 2
88
Community Centers
Fire Station
ÆP Harris County Hospitals
ÆP Private Hospitals
ÆP Other Health Facilities
Æc Library
Metro Rail Stations
Police Station
Rail Road
å School
Parks
I0 0.5 10.25
Miles
Super Neighborhood Boundary
Metro Rail Line¬(Å
AirportsZ
TIRZ
O.S.T / AlmedaTIRZ
Page 4, November 2017 Greater OST / South Union
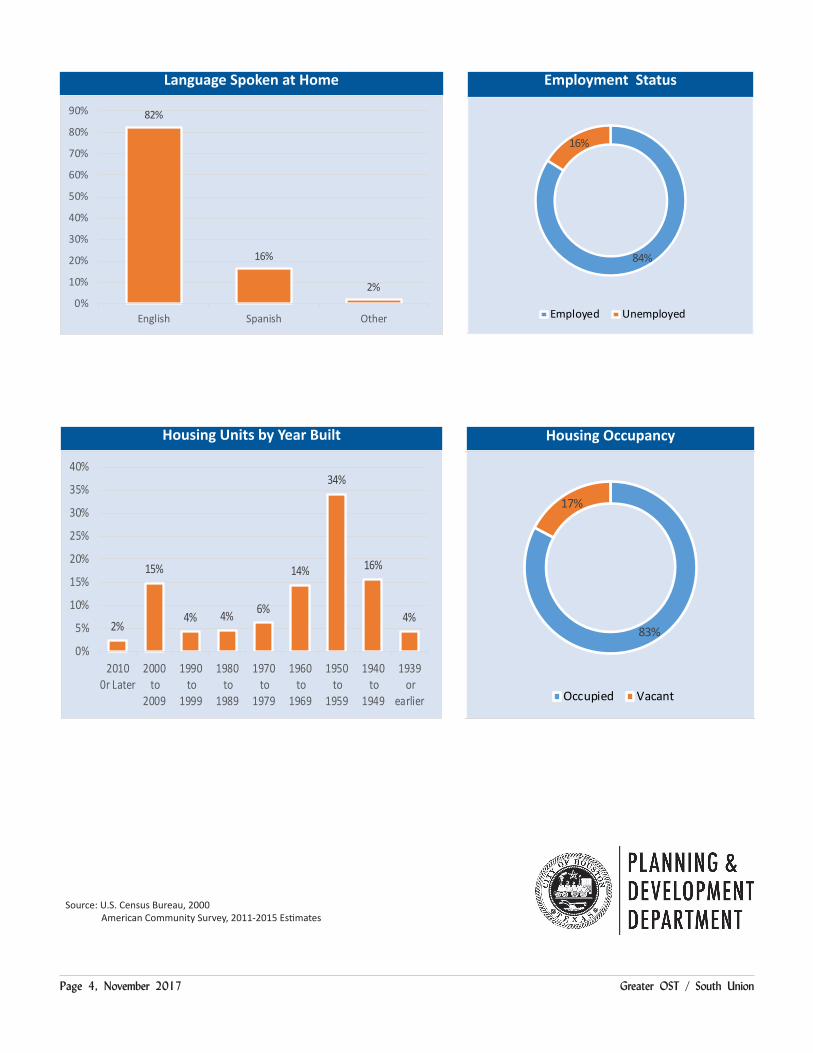
Language Spoken at Home Employment Status
Housing Units by Year Built Housing Occupancy
84%
16%
Employed Unemployed
2%
15%
4% 4% 6%
14%
34%
16%
4%
0%
5%
10%
15%
20%
25%
30%
35%
40%
20100r Later
2000 to
2009
1990 to
1999
1980 to
1989
1970 to
1979
1960 to
1969
1950 to
1959
1940 to
1949
1939 or
earlier
82%
16%
2%0%
10%
20%
30%
40%
50%
60%
70%
80%
90%
English Spanish Other
83%
17%
Occupied Vacant
Source: U.S. Census Bureau, 2000 American Community Survey, 2011-2015 Estimates