respond half year results 2015 - rotork · 2018-11-12 · respond half year results 2015 4 august...
TRANSCRIPT

GLOBAL
QUALITYDELIVER G
ROW
THRESPO
ND
INN VATE
HALF YEAR RESULTS 20154 August 2015
Presented by:Chairman – Martin LambChief Executive – Peter FranceFinance Director – Jonathan Davis

Half Year Results 2015 04 August 2015
Half Year Results 20154 August 2015
Presented by:Chairman – Martin LambChief Executive – Peter FranceFinance Director – Jonathan Davis
• Order intake 9.5% lower
• Revenue 1.6% lower
• Order book of £175.9m
• Cost management programme accelerated
• Strong growth in the Instruments division
• Two acquisitions completed including £6.9m acquisition of M&M International announced today
• Launch of IQT3 and SI3 actuator ranges
• Strong cash generation, 110% cash conversion
• Interim dividend increased by 1.6% to 1.95p
1
SUMMARY
Note: OCC are Organic constant currency figures which have all acquisitions removed and are restated at 2014 exchange rates.*Adjusted operating profit & EPS are stated before the amortisation of acquired intangible assets.

Half Year Results 2015 04 August 2015
2
FINANCIAL REVIEW
Presented by• Finance Director – Jonathan Davis
FINANCIAL REVIEW
• Adjusted* operating profit margin 23.7% (OCC 24.0%) compared with 24.8% in 2014
• Adjusted earnings per share benefited from lower tax rate
• Dividend increased by 1.6%
3
Note: OCC are Organic constant currency figures which have all acquisitions removed and are restated at 2014 exchange rates.*Adjusted operating profit & EPS are stated before the amortisation of acquired intangible assets.
H1 2015 H1 2014 % OCC %
Order intake £274m £303m ‐9.5% ‐12.9%
Order book £176m £203m ‐13.2% ‐13.0%
Revenue £274m £278m ‐1.6% ‐5.4%
Adjusted* operating profit £65m £69m ‐5.8% ‐8.6%
Adjusted* EPS 5.44p 5.73p ‐5.1% ‐8.4%
Dividends 1.95p 1.92p +1.6%

Half Year Results 2015 04 August 2015
£m Order intake RevenueAdjusted* operating
profitAdjusted* operating
margin
H1 2014 302.7 278.5 69.1 24.8%
OCC change ‐12.9% ‐5.4% ‐8.6% ‐80 bps
H1 2015 OCC 263.7 263.5 63.1 24.0%
Acquisitions +3.8% +3.8% +4.0% ‐
H1 2015 Constant currency 275.0 274.2 65.8 24.0%
Currency impact ‐0.4% 0.0% ‐1.2% ‐30 bps
H1 2015 274.0 274.2 65.0 23.7%
Reported ‐9.5% ‐1.6% ‐5.8% ‐110 bps
ANALYSIS OF CHANGE
4
• Constant currency movements – intake ‐9.1%, revenue ‐1.6%, profit ‐4.6%, margin ‐80 bps
Note: OCC are Organic constant currency figures which have all acquisitions removed and are restated at 2014 exchange rates.*Adjusted operating profit & EPS are stated before the amortisation of acquired intangible assets.
IMPACT OF CURRENCY
5
• US$ and related currencies were 44% of revenue, £11m tailwind
• Euro was 30% of revenue, £8m headwind
• Other currencies 17% of revenue, £3m headwind
• Gears has highest proportion of USD purchases into European plants
• 2015 currency impact currently ~2% headwind on revenue
£m
Revenue
impact
Revenue impact percentage
Adjusted* operating profit impact
Profit impact percentage
Controls (1.5) ‐1.0% (0.7) ‐1.6%
Fluid Systems 1.5 2.0% 0.6 7.9%
Gears 0.6 2.8% 1.0 17.5%
Instruments (0.6) ‐2.3% (0.1) ‐1.5%
Group ‐ ‐ 0.8 1.3%
Note: *Adjusted is before amortisation of acquired intangibles.
Half Year Results 2015 04 August 2015
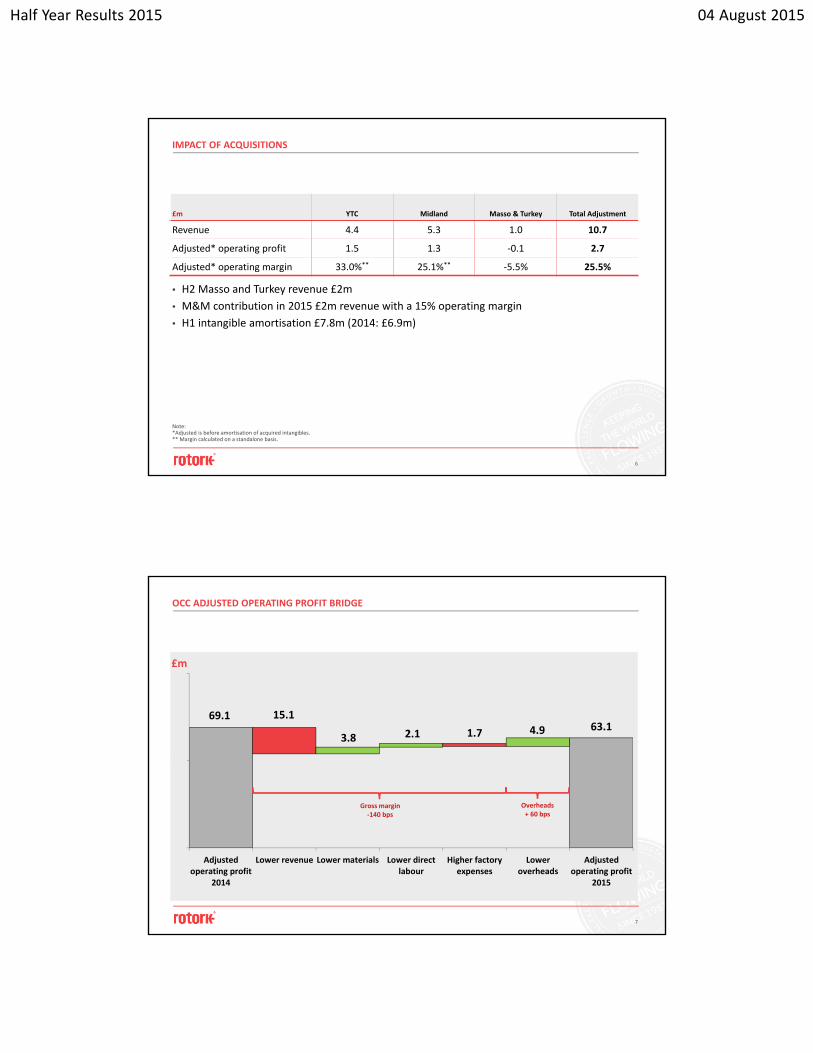
IMPACT OF ACQUISITIONS
6
Note: *Adjusted is before amortisation of acquired intangibles.** Margin calculated on a standalone basis.
• H2 Masso and Turkey revenue £2m
• M&M contribution in 2015 £2m revenue with a 15% operating margin
• H1 intangible amortisation £7.8m (2014: £6.9m)
£m YTC Midland Masso & Turkey Total Adjustment
Revenue 4.4 5.3 1.0 10.7
Adjusted* operating profit 1.5 1.3 ‐0.1 2.7
Adjusted* operating margin 33.0%** 25.1%** ‐5.5% 25.5%
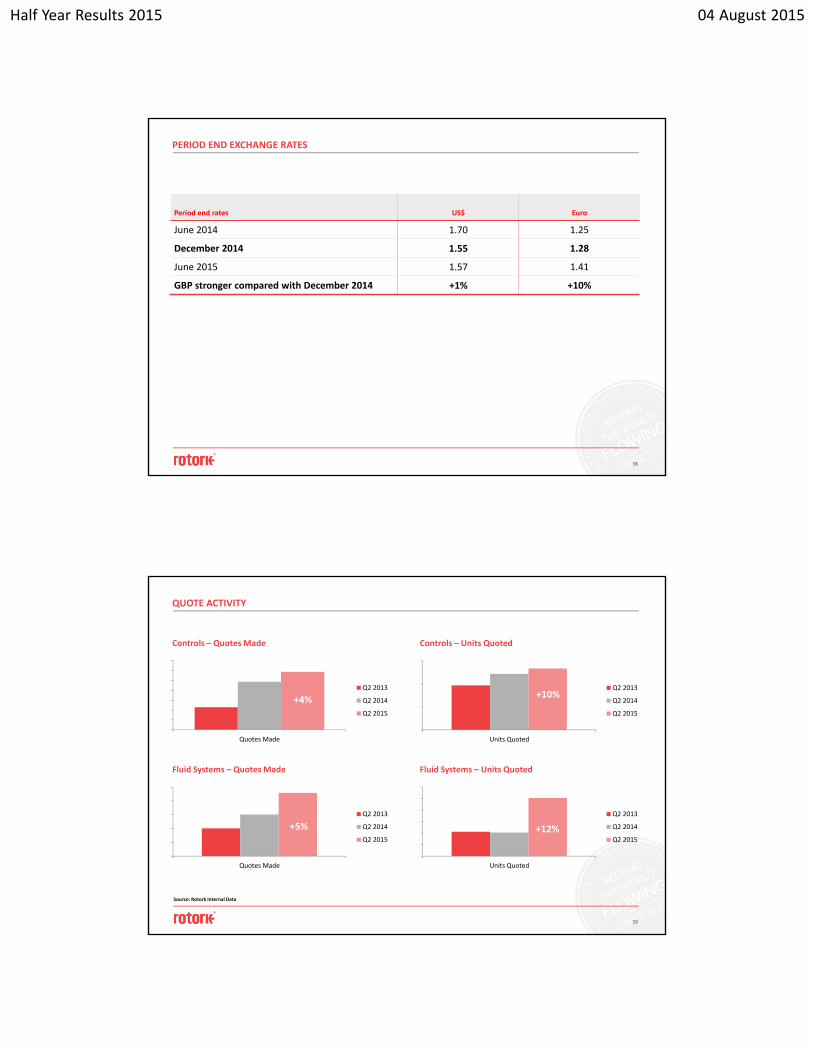
69.1 15.1
3.8 2.1 1.7 4.9 63.1
0
50
100
Adjustedoperating profit
2014
Lower revenue Lower materials Lower directlabour
Higher factoryexpenses
Loweroverheads
Adjustedoperating profit
2015
Gross margin‐140 bps
Overheads+ 60 bps
7
OCC ADJUSTED OPERATING PROFIT BRIDGE
£m

Half Year Results 2015 04 August 2015
ACCELERATED COST MANAGEMENT PROGRAMME
8
Ongoing annualised cost savings £8m
• Material costs £4m
• Overheads £4m
• 2015 benefit of these initiatives is £2m
• In addition, lower variable pay impact on 2015
106 92 86
8476 76
1011 9
35 5
30 June 2014 31 December 2014 30 June 2015
InstrumentsGearsFluid SystemsControls
9
• Order book £176m, 4.3% lower than December 2014, ‐0.1% on OCC basis
£m
ORDER BOOK
Total £203m Total £176mTotal £184m

Half Year Results 2015 04 August 2015
CONTROLS DIVISION
10
Note: OCC are Organic constant currency figures which have all acquisitions removed and are restated at 2014 exchange rates.*Adjusted operating profit & EPS are stated before the amortisation of acquired intangible assets.
• Order intake ‐11.1% (OCC ‐12.1%)
• Gross margins ‐100 bps (OCC ‐90 bps)
• Overheads lower £3.0m OCC
£m H1 2015 H1 2014 Change OCC Change
Revenue 146.0 150.7 ‐3.1% ‐4.2%
Adjusted* operating profit 45.2 46.1 ‐2.1% ‐3.5%
Adjusted* operating margin 30.9% 30.6% +30 bps +20 bps
FLUID SYSTEMS DIVISION
11
• Order intake ‐20.3% (OCC ‐19.0%)
• Gross margins ‐500 bps (OCC ‐450 bps)
• Overheads lower £1.7m OCC
£m H1 2015 H1 2014 Change OCC Change
Revenue 76.9 88.8 ‐13.4% ‐13.4%
Adjusted* operating profit 7.8 14.4 ‐46.0% ‐42.4%
Adjusted* operating margin 10.1% 16.2% ‐610 bps ‐540 bps
Note: OCC are Organic constant currency figures which have all acquisitions removed and are restated at 2014 exchange rates.*Adjusted operating profit & EPS are stated before the amortisation of acquired intangible assets.

Half Year Results 2015 04 August 2015
GEARS DIVISION
12
• Order intake +2.0% (OCC +4.7%)
• Gross margins ‐120 bps (OCC +140 bps)
• Significant impact of transaction fx in the period
£m H1 2015 H1 2014 Change OCC Change
Revenue 29.8 28.7 +3.7% +6.0%
Adjusted* operating profit 6.1 6.4 ‐4.3% +12.5%
Adjusted* operating margin 20.5% 22.2% ‐170 bps +130 bps
Note: OCC are Organic constant currency figures which have all acquisitions removed and are restated at 2014 exchange rates.*Adjusted operating profit & EPS are stated before the amortisation of acquired intangible assets.
INSTRUMENTS DIVISION
13
Note: OCC are Organic constant currency figures which have all acquisitions removed and are restated at 2014 exchange rates.*Adjusted operating profit & EPS are stated before the amortisation of acquired intangible assets.
• Order intake +59.3% (OCC +1.1%)
• Gross margins ‐250 bps (OCC ‐150 bps)
• Material costs savings focus at Midland
£m H1 2015 H1 2014 Change OCC Change
Revenue 28.8 17.4 +65.3% +8.7%
Adjusted* operating profit 9.0 5.5 +65.3% +13.6%
Adjusted* operating margin 31.4% 31.4% No change +140 bps

Half Year Results 2015 04 August 2015
EARNINGS PER SHARE
14
H1 2015 H1 2014 Change OCC Change
PBT as reported (£m) 56.3 61.5 ‐8.4% ‐9.1%
Adjusted* PBT (£m) 64.1 68.4 ‐6.3% ‐9.5%
Basic EPS as reported 4.77p 5.15p ‐7.3% ‐7.9%
Adjusted* basic EPS 5.44p 5.73p ‐5.1% ‐8.4%
Effective tax rate 26.4% 27.4%
Note: OCC are Organic constant currency figures which have all acquisitions removed and are restated at 2014 exchange rates.*Adjusted operating profit & EPS are stated before the amortisation of acquired intangible assets.
46.8
65.0 3.5 2.9 4.76.8
15.6
26.8
58.5
0
50
100
150
Cash at1 Jan 2015
Adjustedoperatingprofit
Workingcapital
Othermovements
Capitalexpenditure
Acquisitions Taxation Dividends Cash at30 Jun 2015
15
Cash conversion 110.2% (H1 2014: 87.1%)
CASH FLOW BRIDGE
£m

Half Year Results 2015 04 August 2015
WORKING CAPITAL
16
£m Jun 2015 % HY revenue Dec 2014 % Annual revenue
Inventory 84.5 15.4% 81.1 13.6%
Trade Receivables 104.8 19.1%(56 D.S.O.)
128.5 21.6%(60 D.S.O.)
Trade Payables (37.0) 6.8% (40.2) 6.8%
Net Working Capital 152.3 27.8% 169.4 28.5%
27.0%
25.1% 25.5%26.8%
24.7%
27.2%28.5%
27.8%
18%
24%
30%
Dec 2011 Jun 2012 Dec 2012 Jun 2013 Dec 2013 Jun 2014 Dec 2014 Jun 2015
17
OPERATING REVIEW
Presented by• Chief Executive – Peter France

Half Year Results 2015 04 August 2015
GROUP REVENUE BY:
• Continued growth in Instruments and Gears
• Oil & gas impact
• Industrial & mining and power increase
18
Division
End User Market
£m
£m
Oil & gas revenue breakdown H1 2015 FY 2014
Upstream 14% 15%
Midstream 13% 15%
Downstream 25% 27%
Contribution to Revenue 52% 57%
Contribution to Revenue 53% 54%
£0
£50
£100
£150
Controls Fluid Systems Gears Instruments
H1 2014
H1 2015
0
50
100
150
200
Oil & Gas Power Water Industrial &Mining
Other
H1 2014
H1 2015
Source: Rotork Internal Data
GROUP REVENUE BY:
• Strong growth in North America
• Good performance in Europe
• Challenging markets in Asia Pacific and Middle East
End Destination£m
19
£0
£20
£40
£60
£80
£100
£120
N. America exc.Mexico
Asia Pacific /Far East
E.Europe Europe Latin America Middle East /Africa
UK
H1 2014
H1 2015
Source: Rotork Internal Data

Half Year Results 2015 04 August 2015
Highlights
• Strong growth in North America
• Increase in water and industrial
• IQT 3rd Generation actuator launched
• Continued investment in R&D
Opportunities
• Centork actuator in production
• New product introduction
• Adoption of product enhancements
• Sales channel development
20
CONTROLS
21
FLUID SYSTEMS
Highlights
• Oil and gas challenging
• Progress in all other markets
• North American LNG project wins
• Masso integration as planned
Opportunities
• SI3 product introduction
• Expanded product range
• Development of new end markets

Half Year Results 2015 04 August 2015
22
GEARS
Highlights
• Growth in Asia Pacific, Europe and Latin America
• All end markets up except water
• Currency impact on costs
Opportunities
• Operational efficiencies
• Sourcing initiatives
• Product range expansion
• Sales channel development
23
INSTRUMENTS
Highlights
• Increase in all end markets
• Increase in all Rotork geographies
• Strong performance of YTC
Opportunities
• New product introductions
• Development of sales channels
• M&M International acquisition announced today

Half Year Results 2015 04 August 2015
M&M INTERNATIONAL – COMPANY OVERVIEW
• Founded in 1979
• Located in Bergamo, Italy
• Solenoid valve and piston actuated valve manufacturer
• Owned by Spirax Sarco since 2000
• 64 employees
• 2014 turnover €9m, 16% EBIT margin
• Industrial and commercial focus
24
Solenoid valve
Piston actuated valve
Pressure Flow Temperature
Control
Measurement
STRATEGY FOR GROWTH
25
Boosters
Pressure Transducers Pressure Regulators
Pressure Gauges
P/I Transducers
Pressure SensorsDifferential Pressure
Transmitters
PilotValves
Solenoid Valves
SwitchBoxes
Directional Control Valves
Flow Controllers Level Gauges
Kinetic Flow Meters Flow Meters
ThermocouplesTemperatureTransducers
Thermistors
Thermostats Fusible Plugs
TemperatureControllersPAV

Half Year Results 2015 04 August 2015
26
SITE SERVICES
Highlights
• Glasgow and Korea Service Centres opened
• Client Support Programme (CSP) adoption
Opportunities
• Sales expansion
• Increased market activity
• Capability expansion
PROJECT ACTIVITY
27
Oil & Gas Water &Sewage
Power Mining Other
Jun 2013
Jun 2014
Jun 2015
Asia, Australasia,M.East & Africa
Europe The Americas
Jun 2013
Jun 2014
Jun 2015
Project Activity: Industry Type Project Activity: End Destination
No of projectsNo of projects
Source: Rotork Internal Data

Half Year Results 2015 04 August 2015
28
MARKET CONDITIONS
Market Dynamics
• Oil & gas capex down
• Contract delays
• Pricing pressure
• Pockets of market activity
• Increased activity in some markets due to low raw material costs
• Potential M&A
Rotork Activities
• Accelerated cost management programme
• Focus on driving cost out of supply chain
• Strengthen sales teams
• Continue to develop our international presence
• Ongoing M&A
29
SUMMARY AND OUTLOOK
• Challenging first half
• Volatility expected to remain
• Accelerated cost management programmes
• Continued investment
• Project visibility positive
• Full year in line with management expectations

Half Year Results 2015 04 August 2015
30
APPENDIX
OUTLOOK STATEMENT
“The continued weakness of the oil price and geopolitical uncertainty in some of our key markets resulted in a challenging trading environment during the first half, with lower overall activity levels and an increased number of project deferrals and cancellations.
Rotork has a lean business model and we constantly review our activities to optimise costs. We have responded to market conditions and accelerated a number of our ongoing cost management initiatives. At the same time we continue to see opportunities to gain market share and expand our product portfolio through organic development and acquisition. We will continue to invest in these opportunities to ensure that Rotork is well placed to make further progress over the medium to long term.
As in previous years we anticipate that our results will be weighted to the second half. Although we expect the oil and gas market to remain challenging, and the timing of order placement remains difficult to forecast, based on our current order book and project visibility, the Board expects overall performance to be in line with management expectations for the full year.”
31

Half Year Results 2015 04 August 2015
CONSTANT CURRENCY ANALYSIS
32
£m H1 2015 as ReportedAdjust to get CC
H1 2015 at 2014 Rates
Remove Acqn. H1 2015 at OCC H1 2014
Revenue 274.2 0.0 274.2 (10.7) 263.5 278.5
Cost of Sales (147.5) 1.0 (146.5) 5.8 (140.7) (144.9)
Gross Profit 126.7 46.2% 1.0 127.7 46.6% (4.9) 122.8 46.6% 133.6 48.0%
Overheads (61.7) 22.5% (0.2) (61.9) 22.6% 2.2 (59.7) 22.7% (64.5) 23.2%
Adjusted* operating profit
65.0 23.7% 0.8 65.8 24.0% (2.7) 63.1 24.0% 69.1 24.8%
• OCC gross margins 150 bps lower
• OCC overheads reduced as a % of revenue, down 60 bps
• OCC net margin 90 bps lower
Note: OCC are Organic constant currency figures which have all acquisitions removed and are restated at 2014 exchange rates.*Adjusted operating profit & EPS are stated before the amortisation of acquired intangible assets.
ADJUSTED OPERATING MARGINS
33
Note: *Adjusted is before amortisation of acquired intangibles.
H1 2015 H1 2015 OCC H1 2014
Controls 30.9% 30.8% 30.6%
RFS 10.1% 10.8% 16.2%
Gears 20.5% 23.5% 22.2%
Instruments 31.4% 32.8% 31.4%
Group 23.7% 24.0% 24.8%
• H1 margins 110 bps lower than H1 2014
• OCC margins 80 bps lower than reported margin in 2014

Half Year Results 2015 04 August 2015
ADJUSTED OPERATING PROFIT BY SEGMENT
34
Note: *Adjustments relate to amortisation of acquired intangible assets.
£mH1 2015 Reported
H1 2015 Adjustments
H1 2015Adjusted
H1 2014 Reported
H1 2014 Adjustments
H1 2014Adjusted
Increase / Decrease
Controls 43.5 1.7 45.2 44.2 1.9 46.1 ‐2.1%
Fluid Systems 6.8 1.0 7.8 13.5 0.9 14.4 ‐46.0%
Gears 5.9 0.2 6.1 6.2 0.2 6.4 ‐4.3%
Instruments 4.1 4.9 9.0 1.5 4.0 5.5 +65.3%
Unallocated (3.1) ‐ (3.1) (3.3) ‐ (3.3) ‐7.5%
Total 57.2 7.8 65.0 62.1 7.0 69.1 ‐5.8%
DIVIDENDS
35
• Interim dividend increased by 1.6%
• Dividend paid in the year increased by 2.4% to 5.04 pence
• Half year dividend cover 2.4 times (2014: 2.7 times)
Core Dividend Month paid / payable Amount (Pence) Cost (£m)
2012 Final May 2013 2.66p 23.1
2013 Interim September 2013 1.81p 15.6
Paid in 2013 4.47p 38.7
2013 Final May 2014 3.00p 26.0
2014 Interim September 2014 1.92p 16.7
Paid in 2014 4.92p 42.7
2014 Final May 2015 3.09p 26.8
2015 Interim September 2015 1.95p 17.0
Paid in 2015 5.04p 43.8

Half Year Results 2015 04 August 2015
REVENUE ANALYSIS
36
By Division (%) Controls Fluid Systems Gears Instruments Total
2015 51.9 27.3 10.6 10.2 100.0
2014 H1 52.8 31.1 10.1 6.0 100.0
By End user market (%) Oil & Gas Power Water Industrial Other Total
2015 51.9 17.5 11.5 14.4 4.7 100.0
2014 FY 56.9 16.3 10.4 10.9 5.5 100.0
By End destination (%)
Asia Pac / Far East Europe
Middle East / Africa
N. America exc. Mexico UK
Eastern Europe
Latin America Total
2015 32.7 15.2 9.1 25.8 6.1 5.7 5.4 100.0
2014 FY 34.5 14.2 9.7 22.9 5.6 5.4 7.7 100.0
AVERAGE EXCHANGE RATES
37
Average rates trading US$ Euro
H1 2014 1.67 1.22
H2 2014 1.63 1.26
Full Year 2014 1.65 1.24
H1 2015 1.52 1.36
+ = GBP strengthening / ‐ = GBP weakening
H1 2014 ‐9% +11%
Full Year 2014 ‐8% +10%
Half Year Results 2015 04 August 2015
PERIOD END EXCHANGE RATES
38
Period end rates US$ Euro
June 2014 1.70 1.25
December 2014 1.55 1.28
June 2015 1.57 1.41
GBP stronger compared with December 2014 +1% +10%
QUOTE ACTIVITY
39
Controls – Quotes Made
Fluid Systems – Quotes Made
Controls – Units Quoted
Fluid Systems – Units Quoted
+11.3%
‐0.5%+2.7%
+25.5%
Quotes Made
Q2 2013
Q2 2014
Q2 2015
Quotes Made
Q2 2013
Q2 2014
Q2 2015
Units Quoted
Q2 2013
Q2 2014
Q2 2015
Units Quoted
Q2 2013
Q2 2014
Q2 2015
+4%
+12%+5%
+10%
Source: Rotork Internal Data

Half Year Results 2015 04 August 2015
KEY OBJECTIVES
40
Objective Description
Sales GrowthDeliver profitable sales growth by focussing on the customer, increasing our international coverage, broadening our end markets and continuing to integrate our new acquisitions.
Employee DevelopmentInvest to support growth strategy and promote diversity and inclusion throughout the company.
New Products Develop and introduce new products in each of the divisions.
Acquisitions Execute acquisition plan of identified opportunities.
Manufacturing Excellence Continue to develop world class manufacturing.
Supply Chain Management Further develop and leverage global supply chain.
Corporate & Social Responsibility
Continue to drive safety improvement and deliver the CSR strategy.
Global Business System Continue to develop and roll out the global business system solution.
Customer Support Programme Further develop our Site Services capability.
APPLICATIONS – COMMERCIAL AND INDUSTRIAL SOLENOID VALVES
• Coffee machines
• Beverage vending machines
• Car‐wash
• Water treatment
• Autoclaves ‐ sterilizers
• Compressed air – dryers
• Air conditioning
• Whirlpools
• Welding machines
• Paramedical equipment
• Pneumatic applications in animal feed equipment
• Food and Bev. plants (service fluids)
• Industrial laundries / dying textiles
• Automotive applications
• Others
41
Half Year Results 2015 04 August 2015
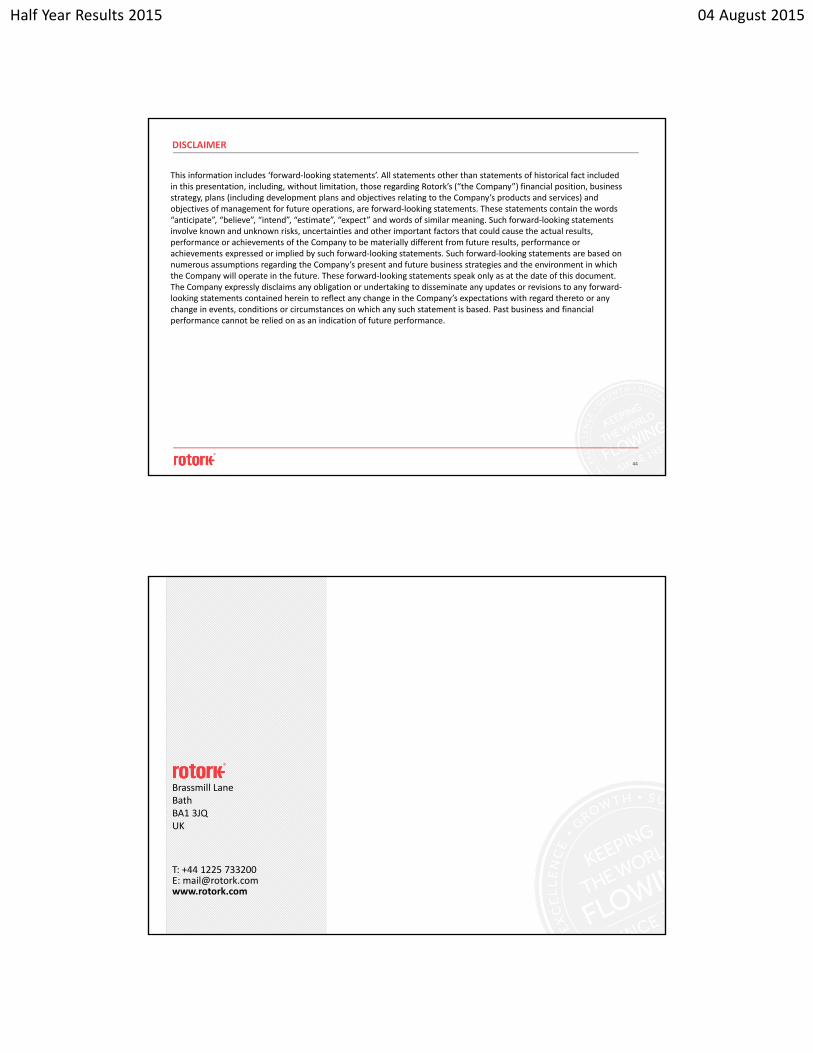
APPLICATIONS FOR PISTON ACTUATED VALVES
• Process industry: service fluids (steam, water, air, gases, etc.)
• Textile industry: washing machines, dry cleaning
• Pharmaceutical: autoclaves, sterilizers, cosmetic mixers
• Chemical industry: nitrogen generators
• Food industry: pasteurizers, humidification, drying, smoking
• Automotive: regeneration of tyres, exhaust control
• Other
42
GLOBAL LOCATIONS
43
• 27 manufacturing centres• 179 offices• 37 countries with direct presence, 101 in total• 3,423 employees worldwide• 860 sales channels
Half Year Results 2015 04 August 2015
DISCLAIMER
44
This information includes ‘forward‐looking statements’. All statements other than statements of historical fact included in this presentation, including, without limitation, those regarding Rotork’s (“the Company”) financial position, business strategy, plans (including development plans and objectives relating to the Company’s products and services) and objectives of management for future operations, are forward‐looking statements. These statements contain the words “anticipate”, “believe”, “intend”, “estimate”, “expect” and words of similar meaning. Such forward‐looking statements involve known and unknown risks, uncertainties and other important factors that could cause the actual results, performance or achievements of the Company to be materially different from future results, performance or achievements expressed or implied by such forward‐looking statements. Such forward‐looking statements are based on numerous assumptions regarding the Company’s present and future business strategies and the environment in which the Company will operate in the future. These forward‐looking statements speak only as at the date of this document. The Company expressly disclaims any obligation or undertaking to disseminate any updates or revisions to any forward‐looking statements contained herein to reflect any change in the Company’s expectations with regard thereto or any change in events, conditions or circumstances on which any such statement is based. Past business and financial performance cannot be relied on as an indication of future performance.
E: [email protected]: +44 1225 733200
www.rotork.com
Brassmill LaneBath BA1 3JQUK

Rotork plcBrassmill LaneBathBA1 3JQUK
T: +44 1225 733200F: +44 1225 333467E: [email protected]
www.rotork.com