response time and display rate in human performance with...
TRANSCRIPT
Response Time and Display Rate in Human Performance with Computers
BEN SHNEIDERMAN
Department of Computer Science, Unwersity o[ Maryland, College Park, Maryland 20742
The pace of human-computer interaction is an important issue to computer scientists and computer users alike. Experimental results have begun to shed some light on this complex, controversml, and vital subject. This paper revmws the theory and reports on experimental results concerning display rates, response time expectations and attitudes, user productivity, and variability. The decomposition of concerns and tasks helps to clarify the issues, but substanhal effort remains before a predictive model can emerge.
In general, the results indicate tha t frequent users prefer response times of less than a second for most tasks, and that productwlty does increase as response time decreases. However, error rates increase with too short or too long a response time. Users pick up the pace of the system, but the profile of commands may change with the speed of the system
Categories and Subject Descriptors: D.2.6 [ S o f t w a r e Eng inee r ing ] : Programming Environments; H.1.2 [Models and Principles]: User/Machine Systems
General Terms: Human factors
Additional Key Words and Phrases: Human/computer interaction, interactive systems, response time, user interface, user think time
Stimulation is the indispensable requisite for pleasure m an experience, and the feeling of bare time is the least stimulating experience we can have.
WILLIAM JAMES, 1842-1910 Principles of Psychology, Volume I (1890)
Nothing can be more useful to a man than a determination not to be hurried.
HENRY DAVID THOREAU, 1817-1862 Journal
INTRODUCTION
Time is precious. When unexpected delays impede the progress of a task, many people become frustrated, annoyed, and eventually angry. Lengthy system response times and slow display rates produce these conditions in computer users, leading to more frequent
errors and lower satisfaction. Even if they simply accept the situation with a shrug of their shoulders, most users would prefer to work more quickly than the computer allows in such a situation.
But there is also a danger in working too quickly. As users pick up the pace of a rapid interaction sequence, they may learn less,
Permission to copy without fee all or part of this material is granted provided that the copies are not made or dlstnbuted for direct commercial advantage, the ACM copyright notice and the title of the publication and its date appear, and notme is given tha t copying is by permission of the Association for Computing Machinery. To copy otherwise, or to repubhsh, reqmres a fee and/or specific permission. © 1984 ACM 0360-0300/84/0900-0265 $00.75
Comput,ng Surveys, Vol. 16, No. 3, September 1984
266 • Ben Shne iderman
CONTENTS
INTRODUCTION Deflmtlons Raising the Issues
1. THEORETICAL FOUNDATIONS 1.1 Short-term and Working
Memory Llmitatmns 1 2 Sources of Errors 1.3 Condihons for Optimum
Problem Solving 2. DISPLAY RATE AND VARIABILITY
2.1 Reading from Display Screens 2 2 Time-Sharing Usage 2 3 Variability in Display Rates 2.4 Summary
3 RESPONSE TIME: EXPECTATIONS AND ATTITUDES 3.1 Factors Influencing Response
Time Expectahons 3.2 Experimental Results 3 3 Forcing Immediate Responses 3 4 Shortening Response Times 3.5 Is the Computer Down ~ 3.6 User-Defined Response Times 3.7 Summary
4. RESPONSE TIME: USER PRODUCTIVITY 4.1 Repetitive Control Tasks 4.2 Problem-Solving Tasks 4 3 Programming Tasks 4 4 Professionals at Work 4.5 Summary
5. RESPONSE TIME: VARIABILITY 5.1 Range of Variation 5 2 Experimental Results 5 3 Summary
6. PRACTITIONER'S SUMMARY 7. RESEARCHER'S AGENDA ACKNOWLEDGMENTS REFERENCES
A
v
read with lower comprehension, make ill- considered decisions, and commit more data entry errors. Stress can build in this situation if errors are hard to recover from, or if they destroy data, damage equipment, or imperil human life (e.g., in air traffic or medical systems).
Definitions
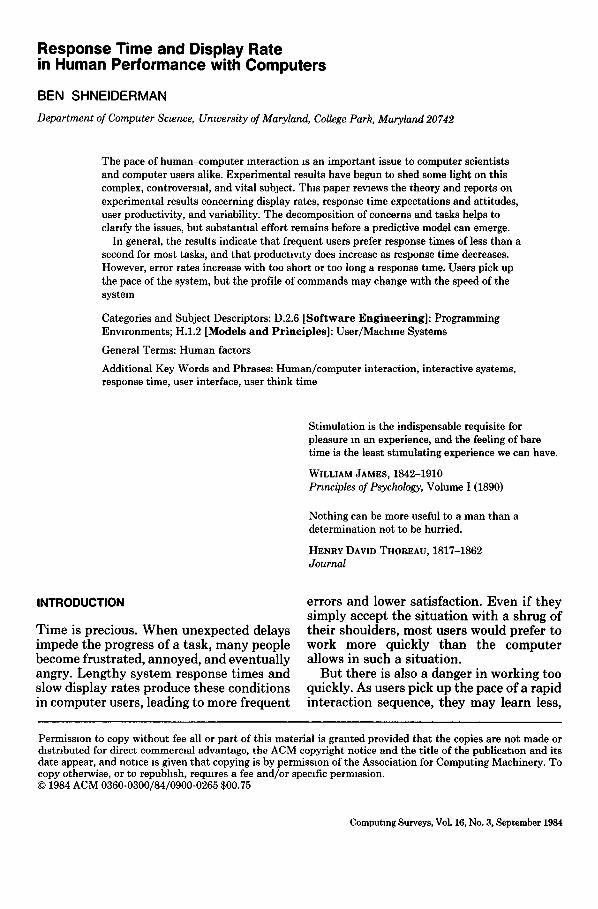
The computer system's response t ime is the number of seconds that it takes from the moment a user initiates an activity (usually by pressing an ENTER or RETURN key) until the computer begins to present results
on the screen or printer (Figure 1). In the simple model, displaying the computer's re- sponse takes a fraction of a second. When the response is completely displayed, the user begins to formulate the next com- mand. The user th ink t ime is the number of seconds that the user is thinking before entering the next command. In the simple model, the user initiates, waits for the com- puter to respond, watches while the results appear, thinks for a while, and initiates again.
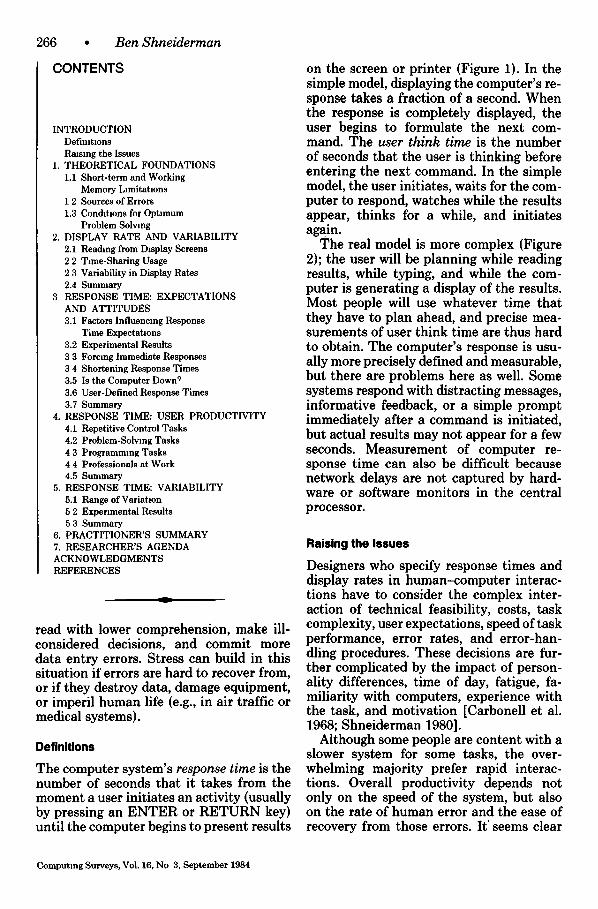
The real model is more complex (Figure 2); the user will be planning while reading results, while typing, and while the com- puter is generating a display of the results. Most people will use whatever time that they have to plan ahead, and precise mea- surements of user think time are thus hard to obtain. The computer's response is usu- ally more precisely defined and measurable, but there are problems here as well. Some systems respond with distracting messages, informative feedback, or a simple prompt immediately after a command is initiated, but actual results may not appear for a few seconds. Measurement of computer re- sponse time can also be difficult because network delays are not captured by hard- ware or software monitors in the central processor.
Raising the Issues
Designers who specify response times and display rates in human-computer interac- tions have to consider the complex inter- action of technical feasibility, costs, task complexity, user expectations, speed of task performance, error rates, and error-han- dling procedures. These decisions are fur- ther complicated by the impact of person- ality differences, time of day, fatigue, fa- miliarity with computers, experience with the task, and motivation [Carbonell et al. 1968; Shneiderman 1980].
Although some people are content with a slower system for some tasks, the over- whelming majority prefer rapid interac- tions. Overall productivity depends not only on the speed of the system, but also on the rate of human error and the ease of recovery from those errors. It' seems clear
Computing Surveys, Vol. 16, No 3, September 1984
Response Time and D~p~y Ra~ in Human Performance with Compu~m
User i n i t i a t e s Computer a c t i v i t y r e s p o n d s
. . . . . Response t i m e ~ - - - U s e r t h i n k t i m e . . . . . . . . >
Figure 1. Simple model of response time and user think time.
267
User User s t a r t s i n l t l a t e s t y p i n g a c t l v l t y
• , - - - R e s p o n s e t i m e
Computer Computer b e g l n s c o m p l e t e s r e s p o n s e r e s p o n s e
: |
: : . . . . . . . . . . . . . . . >
- - - U s e r p l a n n l n g t l m e . . . . . . . . . . ~ - - - U s e r t h i n k t i m e - - )
Figure 2. More realistic model of response time, user planning time, and user think time.
that overall lengthy response times (over 15 seconds) are generally detrimental to productivity, increasing error rates and de- creasing satisfaction. More rapid interac- tions (less than 1 second) are generally preferred and can increase productivity. The high cost of rapid response time or display rate, and the loss from increased errors, must be evaluated when choosing an optimum pace.
In Section 1 we raise basic questions about short-term human memory and the sources of human error. The issue of display rate from response time is isolated in Sec- tion 2. In Section 3 focus is on the role of users' expectations and attitudes in shaping their subjective reaction to the computer system response time. In Section 4 we con- centrate on productivity as a function of response time, and review research on the impact of variable response times in Sec- tion 5. This survey concludes with a prac- titioner's summary and a researcher's agenda.
1. THEORETICAL FOUNDATIONS
A cognitive model of human performance that accounts for the substantive experi- mental results in response time and display rates would be useful in making predic-
tions, designing systems, and formulating management policies. A complete predic- tive model that accounts for all the varia- bles is currently inaccessible, but we are able to realize useful fragments of such a model.
Robert B. Miller's [1968] review presents a lucid analysis of response time issues and a list of 17 situations in which response times might differ. Much has changed since the paper was written, but the principles of closure, short-term memory limitations, and chunking still apply.
1.1 Short-Term and Working Memory Limitations
Any cognitive model must emerge from an understanding of human problem-solving abilities and information-processing capa- bilities. A central issue is the limitation on our short-term memory capacity.
George Miller's classic paper, "The mag- ical number seven, plus or minus two" [Miller 1956], identified the limited capac- ities that people have for absorbing infor- mation. People can rapidly recognize ap- proximately seven (this value is contested by later researchers, but serves as a good estimate) "chunks" of information at a time, and hold them in short-term memory
Computing Surveys, Vol. 16, No. 3, September 1984
268 • Ben Shneiderman
for 15-30 seconds. The size of a chunk of information depends on the person's famil- iarity with the material.
For example, most people could look at seven binary digits for a few seconds and then recall the digits correctly from mem- ory within 15 seconds. A distracting task, such as reciting a poem, would erase the binary digits. Of course, if they concentrate on remembering the binary digits and suc- ceed in transferring them to long-term memory, then the binary digits can be maintained for much longer periods. Most Americans could also remember seven dec- imal digits, seven alphabetic characters, seven English words, or even seven familiar advertising slogans. Although these items are of increasing complexity, they are still treated as a single chunk. However, an American might not succeed in remember- ing seven Russian letters, Chinese picto- grams, or Polish sayings. Knowledge and experience govern the size of a chunk for each individual.
The short-term memory is used in con- junction with working memory for process- ing information and problem solving. Short-term memory processes perceptual input, whereas working memory is used to generate and implement solutions. If many facts and decisions are necessary to solve a problem, then short-term and working memory may become overloaded. People learn to cope with complex problems by developing higher level concepts, which bring together several lower level concepts into a single chunk. Novices at any task tend to work with smaller chunks until they can cluster concepts into larger chunks. Novices will break a complex task into a sequence of smaller tasks that they feel confident about accomplishing.
This chunking phenomenon was dem- onstrated by Neal [1977], who required 15 experienced keypunch operators to type data records organized into numeric, al- phanumeric, and English word fields. The median interkeystroke time was 0.2 second, but rose to more than 0.3 second at field boundaries and 0.9 second at record bound- aries.
Short-term and working memory are highly volatile; disruptions cause loss of
memory, and delays can require that the memory be refreshed. Visual distractions or noisy environments also interfere with cognitive processing. Furthermore, anxiety apparently reduces the size of the available memory, since the person's attention is partially absorbed in concerns that are be- yond the problem-solving task.
1.2 Sources of Errors
If people are able to construct a solution to a problem in spite of possible interference, they must still record or implement the solution. If they can implement the solution immediately, then they can proceed very quickly through their work. On the other hand, if they must record the solution in long-term memory, on paper, or on a com- plex device, the chances for error increase and the pace of work slows.
Multiplying two four-digit numbers in your head is difficult because the interme- diate results cannot be maintained in work- ing memory and must be transferred to long-term memory. Controlling a nuclear reactor or air traffic is a challenge, in part, because the task often requires integration of information (in short-term and working memory) from several sources while main- taining an awareness of the complete situ- ation. In attending to newly arriving infor- mation, operators may be distracted and lose the contents of their short-term or working memory.
When using an interactive computer sys- tem, users may formulate plans and then have to wait while they execute each step in the plan. If a step produces an unex- pected result or if the delays are long, then the user may forget part of the plan or be forced to continually review it.
Long [1976] studied delays of approxi- mately 0.1-0.5 second in the time for a keystroke to produce a character on an impact printer. He found that unskilled and skilled typists worked more slowly and made more errors with longer response times. Even these brief delays were dis- tracting in the rapid process of typing.
On the other hand, if users try to work too quickly, they may not allow sufficient time to correctly formulate a solution,plan,
Computing Surveys, Vol. 16, No. 3, September 1984
Response Time and Display Rate in Human Performance with Computers
and error rates may increase. As familiarity with the task increases, the user's capacity to work more quickly and correctly should increase.
This model leads to the conjecture that for a given user and task there is a preferred response time. Long response times lead to wasted effort and errors when a solution plan is continually reviewed. Short re- sponse times lead to a faster pace in which solution plans are hastily and incompletely prepared. More data from a variety of sit- uations and users would help to clarify these conjectures.
1.3 Conditions for Optimum Problem Solving
As response times grow longer, users may become more anxious because the penalty for an error increases and they will slow down in their work. As the difficulty in handling an error increases, the anxiety level increases, further slowing perform- ance and increasing errors. As response times grow shorter and display rates in- crease, users pick up the pace of the system and may fail to comprehend the presented material, generate incorrect solution plans, and make more execution errors. Wickel- gren [1977] reviews speed-accuracy trade- offs.
Rapid task performance, low error rates, and high satisfaction can occur if:
• The user has adequate knowledge of the concepts and processes necessary for the problem-solving task.
• The solution plan can be carried out without delays.
• Distractions are eliminated. • Anxiety is low. • There is feedback about progress toward
solution. • Errors can be avoided or, if they occur,
can be handled easily.
In car driving, higher speed limits are at- tractive to many drivers and do lead to faster completion of trips; they also lead to higher accident rates. Since automobile ac- cidents have dreadful consequences, we ac- cept speed limits.
These conditions for optimum problem solving, along with cost and technical fea-
• 269
sibility, are the basic constraints on design. However, there are still other conjectures that may play a role in choosing the opti- mum interaction speed:
• Novices to a task will do better and prefer to work at slower speeds than knowledge- able frequent users.
• When there is little penalty for an error, users will prefer to work more quickly.
• When the task is familiar and easily com- prehended, users will prefer more rapid action.
• If users have had rapid performance in previous experiences, they will expect it in future situations.
These informal conjectures need to be qualified and verified. Then a more rigorous cognitive model needs to be developed to accommodate the great diversity in human work styles and computer use situations. Practitioners can conduct field tests to measure productivity, error rates, and sat- isfaction as a function of response times in their application areas.
The experiments described in the follow- ing sections are tiles in the mosaic of hu- man performance with computers, but many more tiles are necessary before the fragments form a complete image. Al- though some guidelines have emerged for designers and computer center managers, local testing and continuous monitoring of performance and satisfaction are useful. The remarkable adaptability of computer users means that researchers and practi- tioners will have to be continuously alert to novel conditions that require revisions to these guidelines.
2. DISPLAY RATE AND VARIABILITY
For alphanumeric hard-copy or display ter- minals, the display rate is the speed, in characters per second (cps), at which char- acters appear for the user to read. On hard- copy terminals typical rates go from 10 to 160 characters per second, but faster rates are possible with line printer devices. On display terminals the rate may be limited by inexpensive modems to 30 characters per second or may be 1000 characters per second with special cables. At very high
Computing Surveys, VoL 16, No, 3, September 1984
270 • Ben Shneiderman
rates, the screen appears to fill in a single instant.
If a large number of data are to be dis- played and the text is only scanned, then fast display rates may produce a powerful advantage in task completion times and satisfaction. On the other hand, if the full text must be read and comprehended, then speeds above the user's reading rate may be useless or even counterproductive.
2.1 Reading from Display Screens
Bevan [1981] divided 24 subjects into low and high reading ability groups. Each sub- ject worked on a computer-assisted instruc- tion (CAD lesson at four display rates: 10 cps, 15 cps, 60 cps, and word-15 cps (each word appeared instantaneously, but the av- erage rate was 15 cps). When the text filled the screen, the subject could issue a com- mand to clear it and continue the display process. The total lesson time decreased as the display rate increased, but the number of errors increased. The mean number of errors was highest at 60 cps, with little difference among the other three treat- ments. Surprisingly, the 60-cps treatment was liked least by both high- and low-abil- ity subjects. Low-ability subjects preferred the 10-cps speed, whereas the high-ability subjects preferred the 15-cps or word-15- cps treatments. As the display rate in- creased, subjects attempted to keep up with the display of characters, and at 60 cps they were working beyond their accustomed reading rate. As comprehension deterio- rated, errors during the CAI lesson and the posttest increased, and satisfaction de- creased.
Bevan's second experiment was run with treatments of 10, 18, 25, and 480 cps. At 480 cps the screen filled in 2-3 seconds, far faster than the human reading rate. As the display rate increased, the total lesson time decreased as before, but in this experiment the error rate peaked at 18 cps. Errors were still lowest at 10 cps, but the very high display rate of 480 cps produced an inter- mediate level of errors. The preference scores showed wide diversity, with no treat- ment showing dominance. Five subjects rated 10 cps as best since they preferred to
read the text as it appeared, but seven subjects found the slow pace to be irritat- ing. Eight subjects rated 480 as best since they preferred to read at their own pace and could look at the questions at the bot- tom of the screen before reading the text, but eight subjects found the fast display worst since "they felt rushed, although they knew there was no need to be" [Bevan 1981, p. 75].
In summary, for many people the slower display rate was appealing because they could keep up with the output and compre- hend the full text. As the display rate increases beyond human reading rates, comprehension and satisfaction probably deteriorate. If the display rate can be made so fast that the screen appears to fill instant- ly (beyond the speed where someone might feel compelled to keep up), subjects may learn to pace themselves and work most productively. These conclusions apply to situations in which the users must read the full text presented on the screen.
If items are to be selected from a large display, then a faster display rate would seem to be more advantageous.
2.2 Time-Sharing Usage
Cotton [1978] reports on a study of 105 randomly selected days when usage was monitored on the National Bureau of Standards's UNIVAC 1108. After culling irregular sessions, 283 sessions were ana- lyzed in detail. Users had different equip- ment operating at 10 cps (33 sessions, 2638 interactions), 15 cps (7 sessions, 361 inter- actions), and 30 cps (243 sessions, 19,706 interactions).
The amount of statistical evidence is im- pressive, and in spite of the relatively small number of interactions at slower rates, many significant differences were found. As the display rate went from 10 to 30 cps, the user's median think time declined from 2.3 to 1.4 seconds. The user's rate of keystrok- ing commands also increased as the display rate increased.
Cotton found another example of how users change their work habits as the speed of a system changes. As the display rate increased, users requested longer outputs.
Computing Surveys, Vol. 16, No. 3, September 1984
Response Time and Display Rate in Human Performance with Computers • 271
Many contemporary systems offer much higher display rates; this is an attraction to most users. If the screen can fill in a few tenths of a second, then users may learn to scan for what they want and control their pace of interaction.
2.3 Variability in Display Rates
L. H. Miller [1977] investigated changes from 120 cps to 240 cps in an information retrieval task with 36 knowledgeable users. Half the subjects at each display rate re- ceived "high-output variability" by an al- gorithm "such that the total time to display N characters on the screen would be ap- proximately double the amount of time to display the same N characters without var- iability" [Miller 1977, p. 415]. For the 11 retrieval tasks, there was no significant dif- ference in performance time as the display rate was changed from 120 to 240 cps. Ap- parently the task performance time was limited by human reading speed, not ma- chine display rate. However, there were statistically significant different times in performance that favored the low-output variability group.
2.4 Summary
Reading textual information from a screen or printer is a challenging cognitive task- - it is more difficult than reading from a book. The pacing provided by the emerg- ence of characters on the screen may be too rapid for many users, who, in their effort to keep up, have lower comprehension of what they are reading. One possible ap- proach is to allow users to control the dis- play rate. Another possibility is to fill the screen rapidly, and hope that users learn to accept this working style, scanning down the screen as desired and reading at their own pace.
If users only scan a display to pick out relevant material, then faster display rates may speed performance. Since many com- puter-related tasks do not require careful reading of the full screen, rapid filling of the screen seems preferable; it is pleasing and relieves the anxiety about delays in paging back and forth through multiple screens.
If the task is largely data entry, then rapid display of brief prompts is of little benefit to overall productivity. Variability in the display rate should be limited. Opti- mal display rates should be determined from performance and error data from sub- jects working on the specific task.
3. RESPONSE TIME: EXPECTATIONS AND ATTITUDES
How long will users wait for the computer to respond before they become annoyed? This apparently simple question has pro- voked much discussion and a few experi- ments. There is no simple answer to the question, but, more important, it may be the wrong question to ask.
There are related design situations that may clarify the question of acceptable re- sponse time. For example, how long should users have to wait before they get a dial tone from a telephone or a picture from their television? If the cost is not excessive, the frequently mentioned 2-second limit [Miller 1968] seems appropriate for many tasks. However, in some situations, users expect responses within a tenth of a second, such as turning the wheel of a car, pressing a key on a typewriter, piano, or telephone, or changing channels on a television. In these cases 2-second delays might be un- settling because users have adapted a work- ing style and expectation based on re- sponses within a fraction of a second. In other situations, users are accustomed to longer response times, such as waiting 30 seconds for a red traffic light, two days for a letter to arrive, or a month for flowers to grow.
3.1 Factors Influencing Response Time Expectations
The first factor influencing acceptable re- sponse time is that people have established expectations based on their past experi- ences about the time required to complete a given task. If a task is completed more quickly than expected, people will be pleased, but if the task is completed much more quickly than expected, they may be- come concerned that something is wrong. Similarly, if a task is completed much more
Computing Surveys, Vol. 16, No. 3, September 1984
272 • Ben Shneiderman
slowly than expected, users become con- cerned or frustrated. Whereas people can detect 8 percent of changes in a 2- or 4- second response time [Miller 1968], users apparently do not become concerned until the change from experience is much greater.
Two installers of time-shared computer systems have reported a problem concern- ing user expectations with new systems. The first users are delighted because the response is short with a light load. As the load builds, these first users become un- happy as the response time deteriorates. The users who have come on later are sat- isfied with what they perceive as normal response times. Both installers devised a "response time choke" by which they could slow down the system when the load was light, thus making the response time uni- form over time and among users.
Computer center managers have similar problems with varying response times as new equipment is added or as large projects begin or complete their work. The variation in response time can be disruptive to users who have developed expectations and working style based on a specific response time. There are also periods within each day when the response time is short, such as at lunch time, or long, such as mid- morning or late afternoon. Some users rush to complete a task while response times are short, and they may make more errors as a result. Some workers refuse to work when the response time is poor relative to their expectations.
There has also been a change in expec- tations over the past years as people in general are becoming more accustomed to using computers. The widespread dissemi- nation of microcomputers will further raise expectations about how quickly computers should respond.
A second factor influencing response time expectations is the individual's toler- ance for delays. Novice computer users may be willing to wait much longer than expe- rienced users. Further differences may stem from personality, age, previous experience, mood, or culture.
In short, there are large variations in what individuals consider to be acceptable
waiting time. These are influenced by many factors, for example, the nature of the task, familiarity with the task, experience in per- forming the task, personality, costs, age, mood, cultural context, time of day, envi- ronmental issues such as noise, and per- ceived pressure to complete work.
A third factor influencing response time expectations is that people are highly adap- tive and can change their working style to accommodate different response times. This factor, discussed in detail in Section 4, was found in early studies of batch-pro- gramming environments and in more re- cent studies of interactive system usage. Briefly, if delays are long, users will seek alternate strategies that reduce the number of interactions, whenever possible. They will fill in the long delays with other tasks, daydreaming, or planning ahead in their work. These long delays may or may not increase error rates in the range of 3-15 seconds, but they will probably increase error rates above 15 seconds if people must remain at the keyboard waiting for a re- sponse. Even if diversions are available, dissatisfaction grows with longer response times.
The three factors influencing response time expectation can be summarized as fol- lows:
(1) Previous experiences are critical in shaping expectations.
(2) There is enormous variation in re- sponse time expectations among indi- viduals and across tasks.
(3) People are highly adaptive. Although they may be able to accommodate long and variable delays, their performance and satisfaction are likely to suffer.
3.2 Experimental Results
Experimental results do show interesting patterns of behavior for specific tasks, in- dividuals, time of day, etc., but it is hard to distill a simple set of conclusions. Several experiments focused on the acceptable waiting time by allowing the subjects to press a key if they felt that the waiting time was too long. In some cases, the subjects received immediate response for that inter-
Computing Surveys, Vol. 16, No. 3, September 1984
Response Time and Display Rate in Human Performance with Computers
Table 1. Acceptance of Delay as a Function of Response Time'
Standard response Standard Trials atten-
time Total number Average delay deviation tion key (seconds) of trials (seconds) (seconds) pressed (%)
2 11,634 1.98 0.53 1.42 4 9,754 3.50 2.08 17.44 8 10,103 2.27 5.63 82.92
• Data from Williams [1973].
• 273
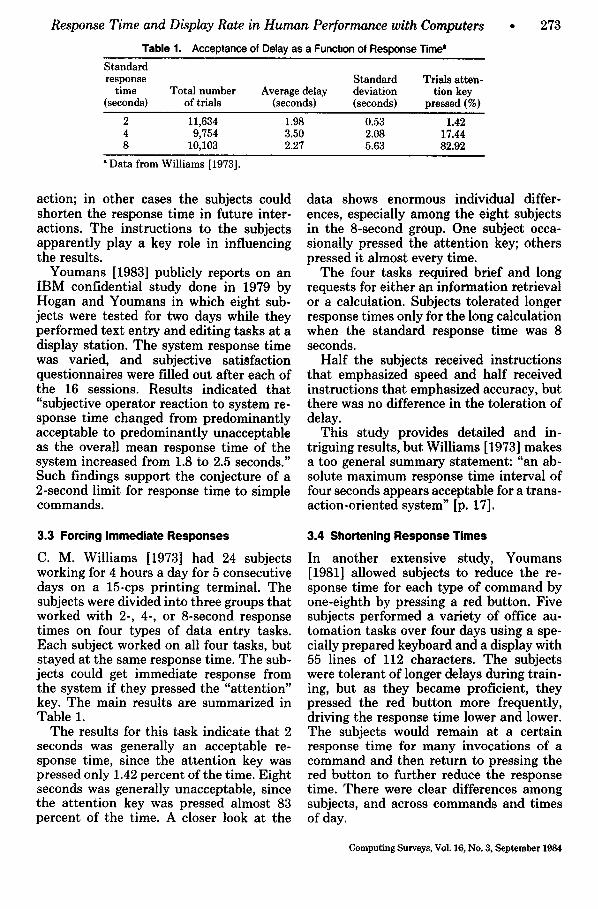
action; in other cases the subjects could shorten the response time in future inter- actions. The instructions to the subjects apparently play a key role in influencing the results.
Youmans [1983] publicly reports on an IBM confidential study done in 1979 by Hogan and Youmans in which eight sub- jects were tested for two days while they performed text entry and editing tasks at a display station. The system response time was varied, and subjective satisfaction questionnaires were filled out after each of the 16 sessions. Results indicated that "subjective operator reaction to system re- sponse time changed from predominantly acceptable to predominantly unacceptable as the overall mean response time of the system increased from 1.8 to 2.5 seconds." Such findings support the conjecture of a 2-second limit for response time to simple commands.
data shows enormous individual differ- ences, especially among the eight subjects in the 8-second group. One subject occa- sionally pressed the attention key; others pressed it almost every time.
The four tasks required brief and long requests for either an information retrieval or a calculation. Subjects tolerated longer response times only for the long calculation when the standard response time was 8 seconds.
Half the subjects received instructions that emphasized speed and half received instructions that emphasized accuracy, but there was no difference in the toleration of delay.
This study provides detailed and in- triguing results, but Williams [1973] makes a too general summary statement: "an ab- solute maximum response time interval of four seconds appears acceptable for a trans- action-oriented system" [p. 17].
3.3 Forcing Immediate Responses
C. M. Williams [1973] had 24 subjects working for 4 hours a day for 5 consecutive days on a 15-cps printing terminal. The subjects were divided into three groups that worked with 2-, 4-, or 8-second response times on four types of data entry tasks. Each subject worked on all four tasks, but stayed at the same response time. The sub- jects could get immediate response from the system if they pressed the "attention" key. The main results are summarized in Table 1.
The results for this task indicate that 2 seconds was generally an acceptable re- sponse time, since the attention key was pressed only 1.42 percent of the time. Eight seconds was generally unacceptable, since the attention key was pressed almost 83 percent of the time. A closer look at the
3.4 Shortening Response Times
In another extensive study, Youmans [1981] allowed subjects to reduce the re- sponse time for each type of command by one-eighth by pressing a red button. Five subjects performed a variety of office au- tomation tasks over four days using a spe- cially prepared keyboard and a display with 55 lines of 112 characters. The subjects were tolerant of longer delays during train- ing, but as they became proficient, they pressed the red button more frequently, driving the response time lower and lower. The subjects would remain at a certain response time for many invocations of a command and then return to pressing the red button to further reduce the response time. There were clear differences among subjects, and across commands and times of day.
Computing Surveys, Vot. 16, No. 3, September 1984
274 • Ben Shneiderman
The data from the two least tolerant subjects were reported in a summary table. They forced the response time to below 1 second for all commands {except one com- mand which the system could not perform in less than a second). Editing commands such as inserting a line, deleting a line, or turning a page were forced into the 0.3- to 0.5-second range, while display and copy commands were forced into the 0.6- to 0.8- second range.
These results suggest that, given the chance to choose a shorter response time, many users will take advantage of that feature as they become more experienced users. It does seem appealing to offer users the choice of the pace of the interaction.
ond response times in this counterbal- anced-orderings within-subjects design. The subjects were told that the experimen- ters were still developing the game and it might go into an infinite loop, but the sub- jects could get the machine to work again by simply pressing any one of the keys. No significant differences emerged among age groups, order groups, and response time groups. The mean values in the eight cells ranged from 6.16 to 13.28 seconds, with an overall mean of 10.19 seconds. The means for the 3-second and 6-second groups were close to the overall mean.
Results with game programs need to be replicated before they can be applied to frequent users in professional settings.
3.5 Is the Computer Down?
If users are working with a normal response time of 3-5 seconds and suddenly the com- puter does not respond within the expected period, how long will it take for the users to take some action? This question was the subject of a study [Farivari and Levy 1983] in which students were required to play tic- tac-toe against the computer with 1-, 2-, 4-, or 8-second response times. The screen displayed the board and the message, "If you believe the computer did not receive your response, please retype it." Play pro- ceeded normally until the machine did not respond during the second game. There were six subjects per response time treat- ment.
The results for mean waiting times were almost linear with respect to response time. The results suggest that people will wait approximately 7-9 times the customary re- sponse time before they take action. This interpretation should be limited to similar situations and to one-time interruptions. When there are regular interruptions of service, users are likely to take action more quickly.
Different findings emerge from a study of ten teenagers who regularly played video games and ten adults with little video game experience [Liverman 1983]. They were asked to play a computer version of the Othello board game at 3-second and 6-sec-
3.6 User-Defined Response Times
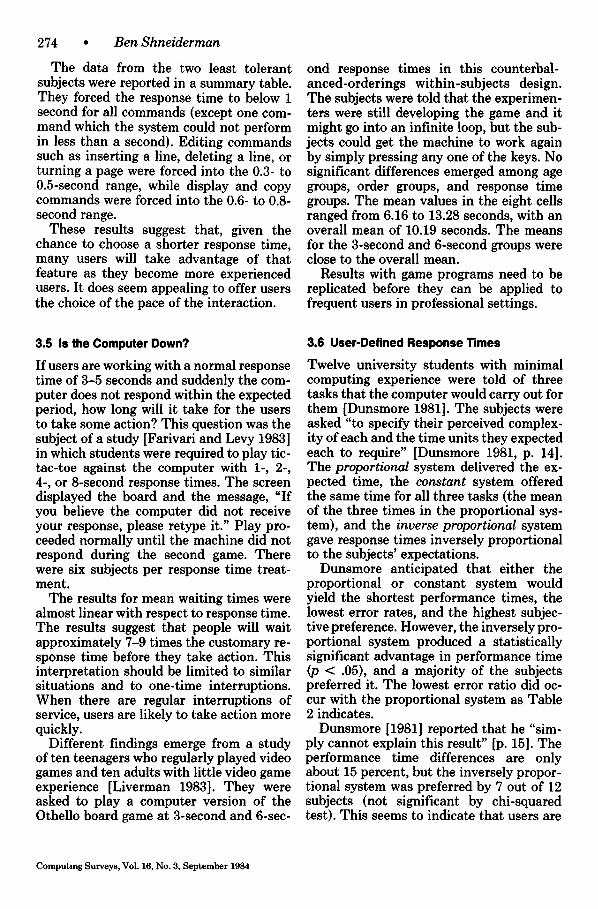
Twelve university students with minimal computing experience were told of three tasks that the computer would carry out for them [Dunsmore 1981]. The subjects were asked "to specify their perceived complex- ity of each and the time units they expected each to require" [Dunsmore 1981, p. 14]. The proportional system delivered the ex- pected time, the constant system offered the same time for all three tasks (the mean of the three times in the proportional sys- tem), and the inverse proportional system gave response times inversely proportional to the subjects' expectations.
Dunsmore anticipated that either the proportional or constant system would yield the shortest performance times, the lowest error rates, and the highest subjec- tive preference. However, the inversely pro- portional system produced a statistically significant advantage in performance time (p < .05), and a majority of the subjects preferred it. The lowest error ratio did oc- cur with the proportional system as Table 2 indicates.
Dunsmore [1981] reported that he "sim- ply cannot explain this result" [p. 15]. The performance time differences are only about 15 percent, but the inversely propor- tional system was preferred by 7 out of 12 subjects (not significant by chi-squared test). This seems to indicate that users are
Computing Surveys, Vol. 16, No. 3, September 1984
Response Time and Display Rate in Human Performance with Computers
Table 2, Performance as a Function of Response Time Strategy"
Preferred Mean system
performance {number time Mean of
System (minutes) errors subjects)
Proportional 16.4 0.5 2 Constant 16.4 1.1 3 Inversely 13.8 1.3 7
proportmnal
• Data from Dunsmore [1981].
more pleased by an unanticipated rapid response than by an unanticipated slow response.
3.7 Summary
There appear to be so many variables gov- erning response time expectations and at- titudes that it is difficult to arrange ade- quate experimental controls. Even if that were possible, the generalizability of the results would be in question.
In spite of these unsatisfying results, some conjectures do arise:
• People will work faster as they gain ex- perience with a command, and so it may be useful to allow people to set their own pace of interaction.
• In the absence of constraints such as cost or technical feasibility, people will even- tually force response time to well under 1 second.
• Although people can adapt to working with slower response times, they are gen- erally dissatisfied about it.
4. RESPONSE TIME: USER PRODUCTIVITY
Shorter system response times may lead to higher productivity, but there may be clever shortcuts if users take a moment to think about them. Working too quickly may lead to errors that reduce productivity.
In computing, just as in driving, there is no general rule about whether the high- speed highway or the slower clever shortcut is better. Each situation has to be surveyed carefully to make the optimum choice. The choice is not critical for the occasional ex-
• 275
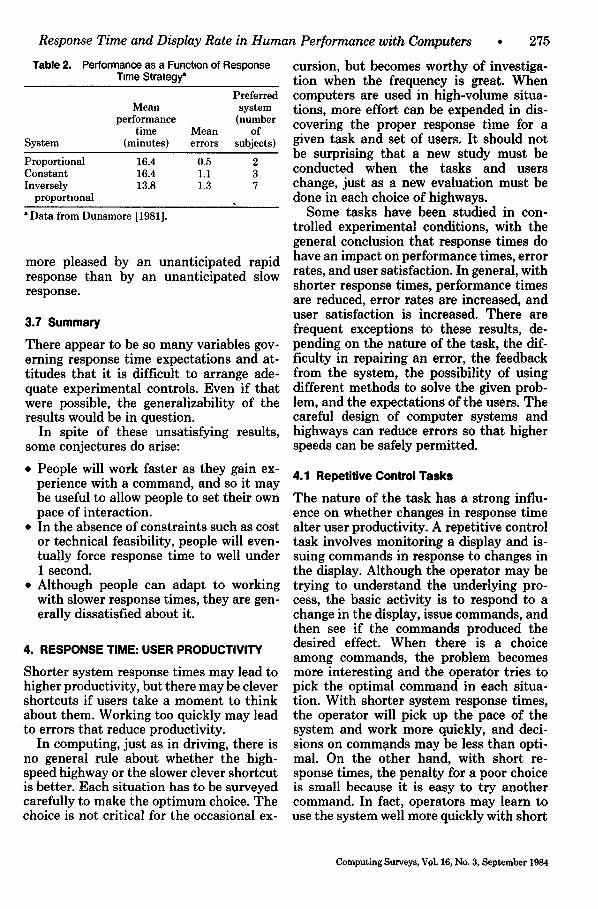
cursion, but becomes worthy of investiga- tion when the frequency is great. When computers are used in high-volume situa- tions, more effort can be expended in dis- covering the proper response time for a given task and set of users. It should not be surprising that a new study must be conducted when the tasks and users change, just as a new evaluation must be done in each choice of highways.
Some tasks have been studied in con- trolled experimental conditions, with the general conclusion that response times do have an impact on performance times, error rates, and user satisfaction. In general, with shorter response times, performance times are reduced, error rates are increased, and user satisfaction is increased. There are frequent exceptions to these results, de- pending on the nature of the task, the dif- ficulty in repairing an error, the feedback from the system, the possibility of using different methods to solve the given prob- lem, and the expectations of the users. The careful design of computer systems and highways can reduce errors so that higher speeds can be safely permitted.
4.1 Repetitive Control Tasks
The nature of the task has a strong influ- ence on whether changes in response time alter user productivity. A repetitive control task involves monitoring a display and is- suing commands in response to changes in the display. Although the operator may be trying to understand the underlying pro- cess, the basic activity is to respond to a change in the display, issue commands, and then see if the commands produced the desired effect. When there is a choice among commands, the problem becomes more interesting and the operator tries to pick the optimal command in each situa- tion. With shorter system response times, the operator will pick up the pace of the system and work more quickly, and deci- sions on commands may be less than opti- mal. On the other hand, with short re- sponse times, the penalty for a poor choice is small because it is easy to try another command. In fact, operators may learn to use the system well more quickly with short
Computing Surveys, Vol. 16, No. 3, September 1984
276 • Ben Shneiderman
system response times because they can more easily explore alternatives.
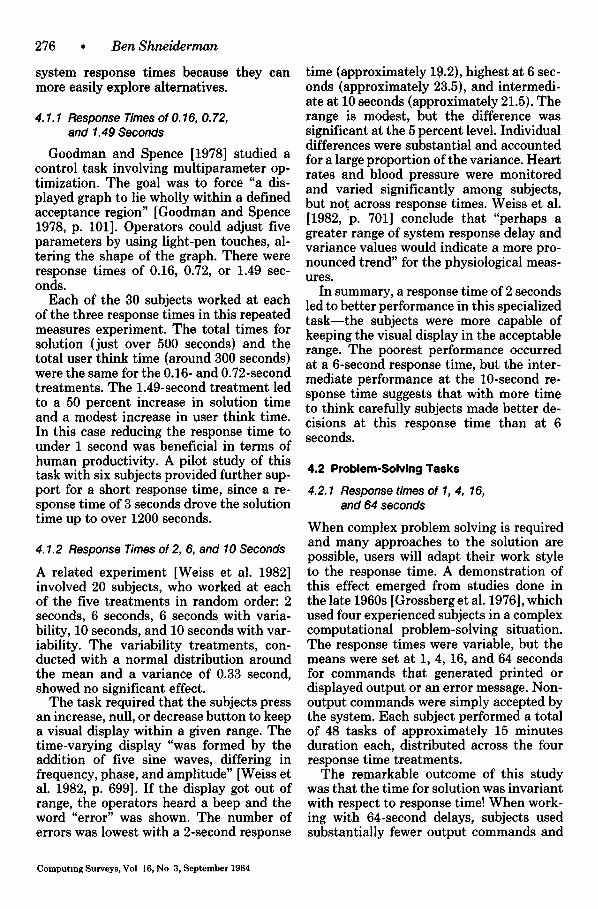
4.1.1 Response Times of O. 16, O. 72, and 1.49 Seconds
Goodman and Spence [1978] studied a control task involving multiparameter op- timization. The goal was to force "a dis- played graph to lie wholly within a defined acceptance region" [Goodman and Spence 1978, p. 101]. Operators could adjust five parameters by using light-pen touches, al- tering the shape of the graph. There were response times of 0.16, 0.72, or 1.49 sec- onds.
Each of the 30 subjects worked at each of the three response times in this repeated measures experiment. The total times for solution (just over 500 seconds) and the total user think time (around 300 seconds) were the same for the 0.16- and 0.72-second treatments. The 1.49-second treatment led to a 50 percent increase in solution time and a modest increase in user think time. In this case reducing the response time to under 1 second was beneficial in terms of human productivity. A pilot study of this task with six subjects provided further sup- port for a short response time, since a re- sponse time of 3 seconds drove the solution time up to over 1200 seconds.
4.1.2 Response Times of 2, 6, and 10 Seconds
A related experiment [Weiss et al. 1982] involved 20 subjects, who worked at each of the five treatments in random order: 2 seconds, 6 seconds, 6 seconds with varia- bility, 10 seconds, and 10 seconds with var- iability. The variability treatments, con- ducted with a normal distribution around the mean and a variance of 0.33 second, showed no significant effect.
The task required that the subjects press an increase, null, or decrease button to keep a visual display within a given range. The time-varying display "was formed by the addition of five sine waves, differing in frequency, phase, and amplitude" [Weiss et al. 1982, p. 699]. If the display got out of range, the operators heard a beep and the word "error" was shown. The number of errors was lowest with a 2-second response
time (approximately 19.2), highest at 6 sec- onds (approximately 23.5), and intermedi- ate at 10 seconds (approximately 21.5). The range is modest, but the difference was significant at the 5 percent level. Individual differences were substantial and accounted for a large proportion of the variance. Heart rates and blood pressure were monitored and varied significantly among subjects, but not across response times. Weiss et al. [1982, p. 701] conclude that "perhaps a greater range of system response delay and variance values would indicate a more pro- nounced trend" for the physiological meas- ures.
In summary, a response time of 2 seconds led to better performance in this specialized task-- the subjects were more capable of keeping the visual display in the acceptable range. The poorest performance occurred at a 6-second response time, but the inter- mediate performance at the 10-second re- sponse time suggests that with more time to think carefully subjects made better de- cisions at this response time than at 6 seconds.
4.2 Problem-Solving Tasks
4.2.1 Response times of 1, 4, 16, and 64 seconds
When complex problem solving is required and many approaches to the solution are possible, users will adapt their work style to the response time. A demonstration of this effect emerged from studies done in the late 1960s [Grossberg et al. 1976], which used four experienced subjects in a complex computational problem-solving situation. The response times were variable, but the means were set at 1, 4, 16, and 64 seconds for commands that generated printed or displayed output or an error message. Non- output commands were simply accepted by the system. Each subject performed a total of 48 tasks of approximately 15 minutes duration each, distributed across the four response time treatments.
The remarkable outcome of this study was that the time for solution was invariant with respect to response time! When work- ing with 64-second delays, subjects used substantially fewer output commands and
Computing Surveys, Vol 16, No 3, September 1984

Response Time and Display Rate in Human Performance with Computers
Table 3. Instructions and Sample D~alogue of a Guessing Game =
Trial User input System response Comments
XXXXXX HIT OOOOOO MISS
1 XXXOO0 HIT 2 I AND 2 WRONG 3 xoxooo HIT 4 XO0000 MISS 5 O000xx MISS
6 OOOOOX MISS 7 I OR 4 IMPOSSIBLE 8 2 OR 3 WRONG 9 3 OR 4 CORRECT
Printed out at the beginning of each problem
Subject inquires about pattern Subject states hypothesis
Three tenable hypotheses I AND 3, 2 OR 3, 3 OR 4
Uninformative trial Would make Trial 4 a HIT One hypothesis left
"From Bergman et al. [1981].
• 277
also fewer total commands. Apparently, with long response times the subjects thought carefully about the problem solu- tion, since there were also longer intervals between commands. There were differences among subjects, but each subject stayed within a limited range of solution times across the four system response times that they worked on.
Although the number of subjects was small, the results are very strong in support of the notion that, if possible, users will change their work habits as the response time changes. When the cost, in time, of an error or an unnecessary output command became great, subjects made fewer com- mands, output commands, and errors. These results are closely tied to this com- plex, intellectually demanding task, in which there were several ways to solve the problem.
4.2.2 Response Times of 0.33 and 1.25 Seconds
Similar (but less dramatic) results appeared in a study of computer-based instruction in a chemistry distillation experiment [Weinberg 1981]. In a question-answering situation, 120 students worked at either 0.33- or 1.25-second response times. If they guessed wrong, the students received a hint about the correct answer. With 0.33-second response times subjects averaged 11.11 er- rors, but when working at 1.25 seconds, the subjects considered their guesses more carefully and averaged only 4.73 errors. This performance result contrasted with
another part of the study in which subjects used repetitive control to keep the distilla- tion running within prescribed bounds. The subjects violated the bounds only 28.40 times with the 0.33-second delay, but 35.04 times with the longer delay. Shorter re- sponse times allowed more interventions in the fixed time of the lesson. Overall, sub- jects working at the shorter response time completed their lessons more quickly and had a more favorable attitude toward the system. There were clear indications that the subjects tried to work more carefully and made fewer errors with the longer re- sponse time.
4.2.3 Response Times of 0 and 10 Seconds
Another problem-solving study [Bergman et al. 1981] offered subjects a guessing game with the dialogue given in Table 3. Subjects worked with 0-second delay (instantaneous feedback), 10-second delay, and 10-second mean delay with variations around the mean. The two tested variations around the 10-second mean delay were generated from a gamma distribution with standard devia- tions of 2.5 and 7.5 seconds. One hundred five male psychology students were as- signed to one of the four treatments for training and three trial sessions. The sub- jects working at zero delay took a mean of 10.61 trials to solve the problems, whereas subjects with the 10-second delays took between 9.19 and 9.47 trials, depending on the variability treatment. The variability in response times did not seem to effect users in this task.
Computing Surveys, Vol. 16, No. 3, September 1984
278 • Ben Shneiderman
The modest, but statistically significant (p = .032), reduction in trials as the re- sponse time increased is in agreement with results from other experiments. People work more carefully with longer response times. With short response times and no serious cost of an ~additional interaction, subjects will feel free to try things out on the machine, rather than think through the solution.
4.3 Programming Tasks
Since programmers often use interactive systems, it is not surprising that several studies have been conducted to measure the impac~ of response time changes on pro- grammer productivity [Boies 1972; Doherty and Kelisky 1979; Smith 1983]. These stud- ies tend to focus on the number of inter- actions per hour as measured by the system rather than specific task completion times. The programmers performed a mixture of program and text editing, compila t ions , program testing, and debugging. These studies also tended to be field studies of actual work, rather than controlled experi- ments.
A preliminary study by Dannenbring [1983] focused on novices and experienced programmers debugging a 25-line BASIC program. Changing the response time from 0 to 5 to 10 seconds did not affect perform- ance time or satisfaction for novices or experienced programmers, although there were significant differences between the scores of novices and experienced program- mers. In contrast, knowledgeable program- mers generally benefit from shorter re- sponse times. Programmers often have a sequence of commands that they are ready to apply, but they must maintain these plans in their short-term memory while they wait for the computer to complete the previous command. This additional burden prevents swift completion and may lead to higher error rates. The danger of shorter response time is that programmers may make hasty decisions as they keep up the rapid pace of interaction. Can programmers learn the discipline of working carefully, even with short response times?
4.3.1 Interaction Rate
Thadhani [1981] found that on one IBM MVS/TSO system users went from 106 interactions per hour at a 23.0-second re- sponse time up to 222 interactions per hour at a 20.5-second response time. On another system the users went from approximately 200 to 340 interactions per hour as the response time was reduced from 3.0 to 0.5 second. Similar results were reported with IBM programmers in England [Lambert 1984], where the rate of interactions per hour went from 161 for the control group to 258 for the study group. The control group had a mean response time of 2.22 seconds, whereas the study group had a mean response time of 0.84 second.
These results are strong, but they only measure interactions per hour, not produc- tivity, and they do not reveal how work habits changed as the response time was changed. Thadhani [1984] offers further evidence that programmer interaction rates increase with short response times. He also refers to a study of engineers, which showed no significant change in the number of interactions to complete a task when the response time was varied from 0.25 to 2.0 seconds, but a doubling in the total task time. The task was not described, but Thadhani suggests that these results have relevance to programming tasks.
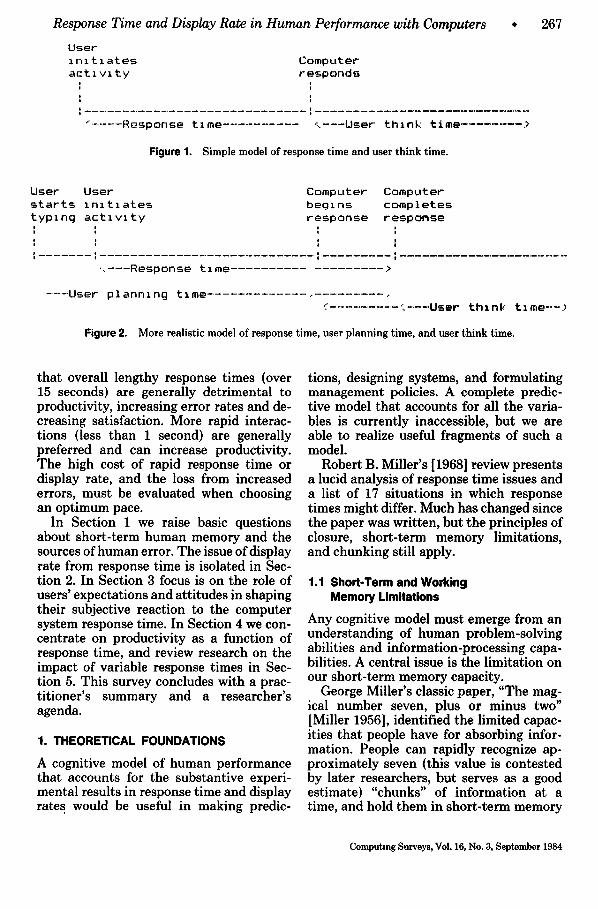
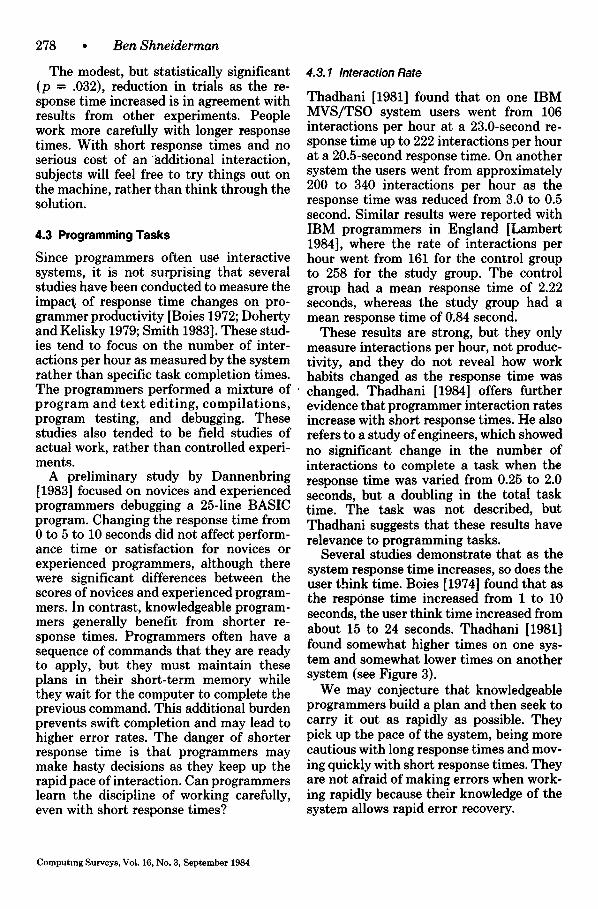
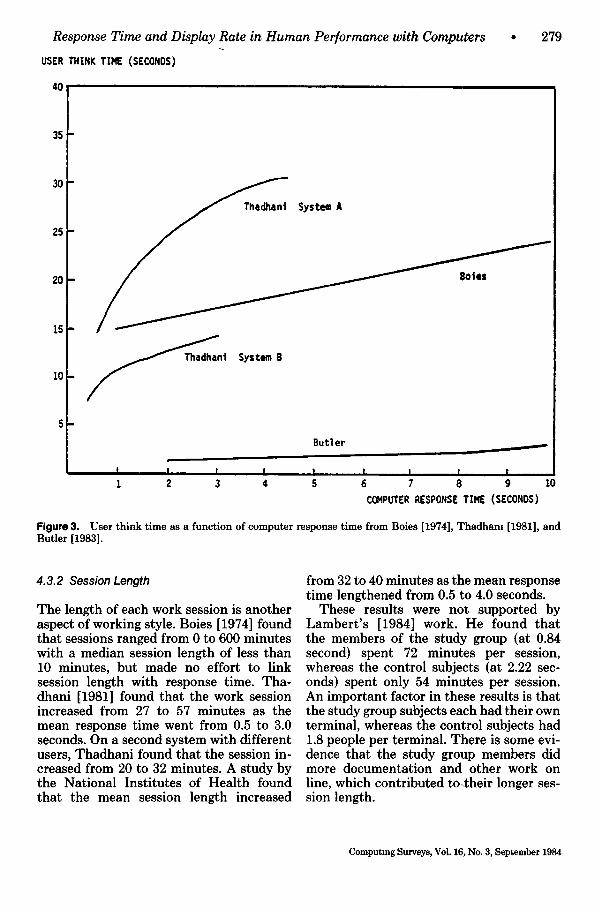
Several studies demonstrate that as the system response time increases, so does the user think time. Boles [1974] found that as the response time increased from 1 to 10 seconds, the user think time increased from about 15 to 24 seconds. Thadhani [1981] found somewhat higher times on one sys- tem and somewhat lower times on another system (see Figure 3).
We may conjecture that knowledgeable programmers build a plan and then seek to carry it out as rapidly as possible. They pick up the pace of the system, being more cautious with long response times and mov- ing quickly with short response times. They are not afraid of making errors when work- ing rapidly because their knowledge of the system allows rapid error recovery.
Computing Surveys, Vol. 16, No. 3, September 1984
Response Time and Display Rate in Human Performance with Computers
USER THINK TINE (SECONO$) ° 279
40
35
30
Z5
20
15
10
. / / / / / ~ System A
. ~ n t System 8
Figure 3. Butler [1983].
Butler
P
I I I I I ! i ! i 1 2 3 4 S 6 7 8 9 I0
CONPUTER RESPONSE TIRE (SECONOS)
User think time as a function of computer response time from Boles [1974], Thadham [1981], and
4.3.2 Session Length
The length of each work session is another aspect of working style. Boies [1974] found that sessions ranged from 0 to 600 minutes with a median session length of less than 10 minutes, but made no effort to link session length with response time. Tha- dhani [1981] found that the work session increased from 27 to 57 minutes as the mean response time went from 0.5 to 3.0 seconds. On a second system with different users, Thadhani found that the session in- creased from 20 to 32 minutes. A study by the National Institutes of Health found that the mean session length increased
from 32 to 40 minutes as the mean response time lengthened from 0.5 to 4.0 seconds.
These results were not supported by Lambert 's [1984] work. He found that the members of the study group (at 0.84 second) spent 72 minutes per session, whereas the control subjects (at 2.22 sec- onds) spent only 54 minutes per session. An important factor in these results is that the study group subjects each had their own terminal, whereas the control subjects had 1.8 people per terminal. There is some evi- dence that the study group members did more documentation and other work on line, which contributed to.their longer ses- sion length.
Computing Surveys, Vol. 16, No. 3, September 1984
280 * Ben Shneiderman
Percent
Transaction
with
errors
50
40
30
20
10
J t ! I I I # I I i I I I I I i i J , i I 4 5 6 7 8 9 10 11 12 13 14 15 16 17 18 l g 20 21 22 23 24
Computer Response Time (seconds)
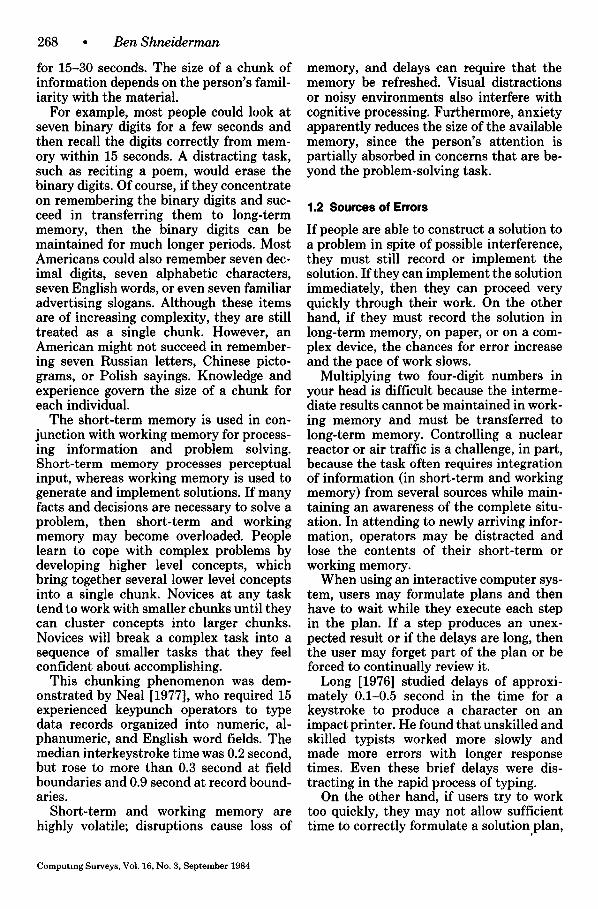
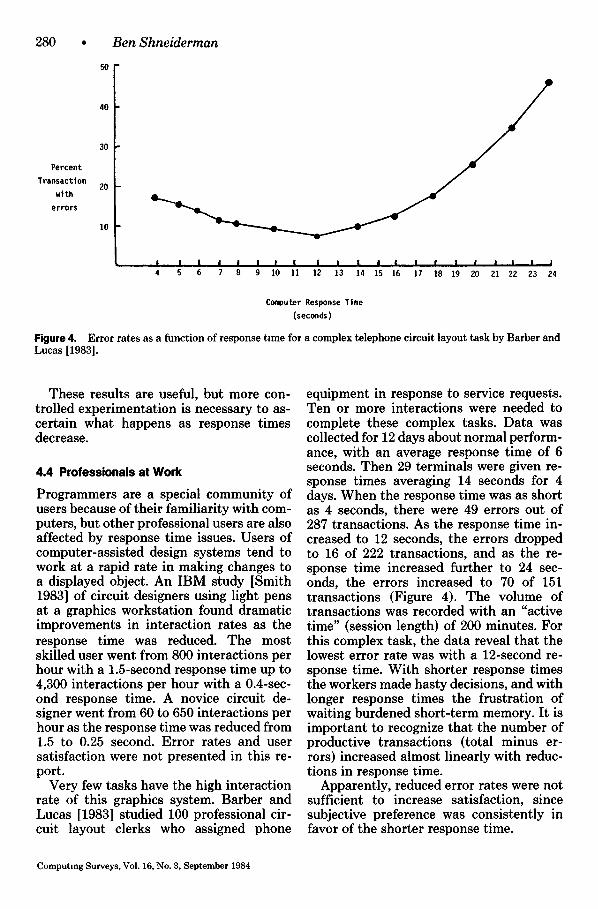
Figure 4. Error rates as a function of response tlme for a complex telephone circuit layout task by Barber and Lucas [1983].
These results are useful, but more con- trolled experimentation is necessary to as- certain what happens as response times decrease.
4.4 Professionals at Work
Programmers are a special community of users because of their familiarity with com- puters, but other professional users are also affected by response time issues. Users of computer-assisted design systems tend to work at a rapid rate in making changes to a displayed object. An IBM study [Smith 1983] of circuit designers using light pens at a graphics workstation found dramatic improvements in interaction rates as the response time was reduced. The most skilled user went from 800 interactions per hour with a 1.5-second response time up to 4,300 interactions per hour with a 0.4-sec- ond response time. A novice circuit de- signer went from 60 to 650 interactions per hour as the response time was reduced from 1.5 to 0.25 second. Error rates and user satisfaction were not presented in this re- port.
Very few tasks have the high interaction rate of this graphics system. Barber and Lucas [1983] studied 100 professional cir- cuit layout clerks who assigned phone
equipment in response to service requests. Ten or more interactions were needed to complete these complex tasks. Data was collected for 12 days about normal perform- ance, with an average response time of 6 seconds. Then 29 terminals were given re- sponse times averaging 14 seconds for 4 days. When the response time was as short as 4 seconds, there were 49 errors out of 287 transactions. As the response time in- creased to 12 seconds, the errors dropped to 16 of 222 transactions, and as the re- sponse time increased further to 24 sec- onds, the errors increased to 70 of 151 transactions (Figure 4). The volume of transactions was recorded with an "active time" (session length) of 200 minutes. For this complex task, the data reveal that the lowest error rate was with a 12-second re- sponse time. With shorter response times the workers made hasty decisions, and with longer response times the frustration of waiting burdened short-term memory. It is important to recognize that the number of productive transactions (total minus er- rors) increased almost linearly with reduc- tions in response time.
Apparently, reduced error rates were not sufficient to increase satisfaction, since subjective preference was consistently in favor of the shorter response time.
Computing Surveys, Vol. 16, No. 3, September 1984
Response Time and Display Rate in Human Performance with Computers
In a Bell Laboratories study with low complexity data entry tasks, J. D. Williams [1975] found no differences in error rates with 5-, 15-, 30-, or 45-second response times. With higher complexity tasks such as data retrieval and correction, the 30- and 45-second conditions resulted in higher er- ror rates. Typing speed during data entry deteriorated steadily as the response time increased.
Butler [1983], also at Bell Laboratories, studied simple data entry tasks with com- puter-displayed prompts. The response times were 2, 4, 8, 16, and 32 seconds. Error rates remained unchanged over this range, but the user think time increased, contrib- uting to an overall decrease in productivity.
4.5 Summary
It is clear that users pick up the pace of the system to work more quickly with shorter response times and they consistently prefer the faster pace. The profile of error rates at shorter response times varies across tasks. Not surprisingly, there appears to be an optimal pace for each user/task situa- t ion- response times that are shorter or longer than this pace lead to increased er- rors. The ease of error recovery and the damage caused by an error must be evalu- ated carefully when managers are choosing the optimal pace of interaction. If higher throughput of work is desired, then atten- tion must be paid to minimizing the cost and delay of error recovery. In short, the optimal response time may be longer than the minimum possible response time.
5. RESPONSE TIME: VARIABILITY
People are willing to pay substantial amounts of money to reduce the variability in their life. The entire insurance industry is based on the reduction of present pleas- ures, through the payment of premiums, in order to reduce the severity of a loss. Most people appreciate predictable behavior, which lessens the anxiety of unpleasant surprises.
5.1 Range of Variation
When using computers, the operator can- not see into the machine to gain reassur-
• 281
ance that the commands are being executed properly, but the response time can provide some clue. If users come to expect a re- sponse time of 3 seconds for a common operation, they may become apprehensive if this operation takes 0.5 second or 15 seconds. Such extreme variation is unset- tling and should be prevented or acknowl- edged by the system, with a message for an unusually fast response and progress re- ports for an unusually slow response.
The more difficult issue is the impact of modest variations in response time. Miller [1968] raises this issue and reports that 75 percent of subjects tested could perceive 8 percent of variations in time for time pe- riods in the interval 2-4 seconds. These results prompted some designers to suggest restrictive rules for variability of response time. For example, Gallaway [1981] pro- posed a variability of plus or minus 5 per- cent for response times in the 0- to 2-second range, and 10 percent for the 2- to 4-second range.
Since it may not be technically feasible to provide a fixed short response time (such as 1 second) for all commands, several au- thors have suggested that the time be fixed for classes of commands. Many commands could have a fixed response time of less than 1 second, other commands could take 4 seconds, and still other commands could take 12 seconds. Experimental results on all these conjectures would help to clarify the impact of variations in response time.
5.2 Experimental Results
Goodman and Spence [1981] attempted to measure peformance changes in a problem- solving situation (a similar situation was used in their earlier experiment, described in Section 4.1). The subjects used light-pen touches to manipulate a displayed graph. The mean response time was set at 1.0 second with three levels of variation: quasi- normal distributions with standard devia- tions of 0.2, 0.4, and 0.8 second. The mini- mum response time was 0.2 second and the maximum response time was 1.8 seconds. Goodman and Spence found no significant performance changes as the variability was increased. The time for solution and the
Computing Surveys, Vol. 16, No. 3, September 1984
282 • Ben Shneiderman
profile of command utilization was un- changed. As the variability increased, they did note that subjects took more advantage of fast responses by making their subse- quent commands immediately. This bal- anced the time lost ,in waiting for slower responses. In summary, the~y found that as the percentage of responses deviating from the mean grew, performance remained largely unchanged.
In a closely related experiment, Good- man and Spence [1982, p. 446] found "no significant direct effect of response varia- bility. But a large and nearly significant F(2, 96) = 3.04, p < 0.10" interaction was found with time of day for the number of light-pen touches. Increased variability led to slower performance in the morning and faster performance in the afternoon. The main effect of time to solution "just failed to reach the 10% level." The "mean re- sponse interval and its variability tended to increase with increasing (variability), with significance approaching the 10% and 5% level, respectively" [Goodman and Spence 1982, p. 446].
Similar negative results were found using a mean response time of 10 seconds and three variations: standard deviations of 0.0, 2.5, and 7.5 seconds (Bergman et al. [1981], described in Section 4.2). The au- thors conclude that an increase in variabil- ity of response time "does not have any negative influence on the subject's perform- ance on a rather complicated problem-solv- - ing task" [Bergman et al. 1981, p. 753].
A third failure to find variability effects emerged from a study of a repetitive control task (Weiss et al. [1982], described in Sec- tion 4.1). Variances of 0 and 0.33 second were applied to mean response times of 6 and 10 seconds. No significant main effects were found for the response time or the response time variability. A significant two- way interaction of response time and re- sponse time variability was intriguing. With a 10-second response time and high variability, errors, heart rate, and blood pressure were reduced. The authors conjec- ture that the occasional short response time was perceived as a positive opportunity. This conjecture fits with Dunsmore 's [1981] results (described in Section 3.5)
tha t surprisingly short response t imes were very much appreciated, even if the penalty was occasional unanticipated long response times.
Butler [1983] studied six subjects who worked for 2 hours at each of ten response time conditions: means of 2, 4, 8, 16, and 32 seconds, each with low and high varia- bility. Low variability had a standard de- viation equal to i jnd (just noticeable dif- ference) and high variability had a standard deviation equal to 3 jnd at each mean. The subjects performed simple data entry tasks but had to wait for the system response before they could proceed. The accuracy and typing rate were unaffected by the du- ration or variability of response time. The user think time increased with the duration and variability of the computer's response time (see Figure 3). Butler describes a sec- ond experiment with a more complex task, but the results are quite similar.
Four videotex studies [Murray and Abra- hamson 1983] with novice users examined response time and response time variabil- ity. No significant effects were found for response time changes. Murray and Abra- hamson [1983] interpret this as "a strong indication tha t inexperienced videotex users are relatively immune to a wide range of constant values of system delay" [p. 250]. Of the three experiments that tested re- sponse time variability, two had significant effects, which indicated that subjects who had higher variability took longer to re- spond.
5.3 Summary
In summary, modest variations in response time (plus or minus 50 percent of the mean) appear to be tolerable and to have little impact on performance. As the variability grows, there may be some decrease in per- formance speed. Frustration may emerge only if delays are unusually long--at least twice the anticipated time. Similarly, anx- iety about an erroneous command may emerge only if the response time is unu- sually short, say less than one-quarter of the anticipated time. But even with ex- treme changes, users appear to be adaptable enough to complete their tasks. Of course,
Computing Surveys, Vol 16, No 3, September 1984
Response Time and Display Rate in Human Performance with Computers • 283
the conjectures are task dependent and need further validation.
It may be useful to slow down unexpected fast responses to avoid surprising the user. This is a bold proposal, but it should affect only a small fraction of user interactions. Certainly, a serious effort should be made to avoid extremely slow responses, or, if they must occur, the user should be given information to indicate progress toward the goal. One graphics system displays a large clock ticking backward, and the output ap- pears only when the clock has ticked down to zero. A document-formatting system dis- plays the section numbers to indicate prog- ress and confirm that the computer is pro- ductively at work on the appropriate docu- ment.
6. PRACTITIONER'S SUMMARY
Computer system response time and dis- play rate are important determinants of user productivity, error rates, working style, and satisfaction. In most situations, shorter response times (less than 1 second) lead to higher productivity. Satisfaction also increases as the response time short- ens. As users pick up the pace of the system, they may make more errors; if these are easily detected and corrected, then produc- tivity will generally increase. If errors are hard to detect or very costly, then a slower pace may be more beneficial.
The optimum response time for a specific application and user community can be de- termined by measuring the productivity, cost of errors, and cost of providing short response times. Managers must be alert to changes in work style as the pace quick- ens-product iv i ty is measured by com- pleted tasks, not interactions per hour. Novices may prefer a slower pace of inter- action. When technical feasibility or costs prevent response times of less than 1 sec- ond, each class of commands can be as- signed to a response time category: for example, 2-4 seconds, 4-8 seconds, 8-12 seconds, and above 12 seconds. Modest var- iations around the mean response time are acceptable, but large variations (less than one-quarter of the mean or more than twice the mean) should be accompanied by an informative message. An alternative ap-
proach is to slow down rapid responses and avoid the message.
Display rates that are faster than human reading speed (10-30 cps) may be counter- productive when the full text must be read and comprehended. For other tasks that do not require full text reading, faster display rates will speed performance, but may lead to more errors. If one keeps these important exceptions in mind, faster display rates are preferable.
7. RESEARCHER'S AGENDA
In spite of the many experiments described above, a number of unanswered questions remain. The taxonomy of issues provides some framework for research, but a finer taxonomy of tasks, relevant cognitive style differences, and work situations is neces- sary to specify adequate experimental con- trols. Next a sound theory of problem-solv- ing behavior with computers is necessary to generate useful hypotheses.
Doherty and Kelisky [1979] suggest that longer response times lead to slower work, emotional upset, and more errors. This statement appears to be true with very long response times of over 15 seconds, but there is little evidence to support the claim that fewer errors are made with very short re- sponse times (under I second). Barber and Lucas [1983] found a U-shaped error curve, with the lowest error rate at a 12-second response time. It would be very productive to study error rates as a function of re- sponse time for a range of tasks and users.
It is understandable that error rates vary with response times, but how else is the work style affected? Do users issue more commands as response times shorten? Grossberg et al. [1976] found this result for a complex task with very long response times of up to 64 seconds, but there is little evidence with more common tasks and speeds. Does the profile of commands shift to a smaller set of more familiar commands as the response time shortens? Does the session length increase or decrease as re- sponse time increases? Are workers more willing to pursue higher quality when they are given shorter response times that eno- ble multiple quick changes?
Computing Surveys, Vol. 16, No. 3, September 1984
284 • Ben Shneiderman
There are many other questions worthy of investigation. When technical feasibility prevents short responses, can users be sat- isfied by diversionary tasks or are progress reports sufficient? Do warnings of long re- sponses relieve anxiety or further frustrate users?
Operating systems designers can also contribute by providing better control over response time. It should be possible for a designer to specify upper and lower limits for response time for each command. It is stil l diff icult on large t ime-shared com- puters to specify a response time, even on an experimental basis. With better control of response time, new approaches could be tried. For example, imagine that the re- sponse time is always 1.0 second but key- board lockout time is a function of com- mand type. After a quick command you could immediately enter the next com- mand, but after a costly command you would be forced to review your work and consider the next step because your termi- nal was locked out for 12 seconds. Boehm et al. [1971] and others suggest that key- board lockout may be less disruptive than anticipated and that it has several benefi- cial effects. Can long response times be translated into lockouts?
Program designers can contribute by ac- tively pursuing algorithms that reduce re- sponse time, designing software to reduce the impact on long response times, and simplifying error recovery to reduce the problems of higher error rates with short response times.
Finally, this topic pervades every appli- cation of computers, and so every user is a potential researcher. I await the torrent of ideas and data.
ACKNOWLEDGMENTS
The Computer Science Center at the Umverslty of Maryland provided the computer resources for the preparation of this paper. The support of IBM and Control Data Corporations helped create the stimu- lating research environment in the Human-Computer Interaction Laboratory. I am grateful to Tom Butler, S. Chandersekaran, Kent Norman, and Jerry Vaske, who provided helpful comments on early drafts of this article. The referees and the technical editor, V. Zie-
linskl, wrote extensive and insight-filled commentar- ms, which led to a better article.
REFERENCES
BARBER, R. E., AND LUCAS, H. C. 1983. System response time, operator productivlty and job sat- isfaction. Commun. ACM 26, 11 (Nov.), 972-986.
BERGMAN, I-l., BRINKMAN, A., AND KOELEGA, S. S. 1981. System response time and problem solv- ing behavior. In Proceedings o/ the Human Fac- tors Soctety, 25th Annual Meeting (Rochester, N.Y., Oct. 12-16). Human Factors Soc., Santa Monica, Calif., pp. 749-753.
BEVAN, N. 1981. Is there an optimum speed for presenting text on a VDU? Int. J Man-Mach Stud. 14, 1, 59-76.
BOEHM, B. W., SEVEN, M. J., AND WATSON, R. A. 1971. Interactive problem solving--An experi- mental study of "lockout" effects. In Proceedings of the Spring Joint Computer Conference, vol. 38. AFIPS Press, Reston, Va., pp. 205-210.
BOIES. S. J. 1974. User behavior on an interactive computer system. IBM Syst J 13, 1, 1-18.
BUTLER, T. W. 1983. Computer response time and user performance. In ACM SIGCHI '83 Proceed- rags Human Factors m Computer Systems {Dec. 1983). ACM, New York, pp. 56-62.
CARBONELL, J. R., ELKIND, J. I., AND NICKERSON, R. S. 1968. On the psychological importance of time in a timesharing system. Hum. Factors 10, 2, 135-142.
COTTON, I. W. 1978. Measurement of interactive computing: Methodology and application. Na- tional Bureau of Standards Special Publ. 500-48, National Bureau of Standards, Gaithersburg, Md., 101 pages.
DANNENBRING, G. L. 1983. The effect of computer response time on user preference and satisfaction: A preliminary investigation. Behav Res. Meth. Instrum. 15, 213-216.
DOHERTY, W. J., AND KELISKY, R. P. 1979. Man- aging VM/CMS systems for user effectiveness. IBM Syst. J 18, 1, 143-163.
DUNSMORE, H. E. 1981. A report on research. Un- , published manuscript, Computer Science Dept., Purdue Univ., West Lafayette, Ind.
FARIVARI, R., AND LEVY, I. 1983. A test of patience. Unpublished manuscript, research project report to James Foley, Computer Science Dept., George Washington Univ., Washington, D.C.
GALLAWAY, G. R. 1981. Response times to user ac- txvlties in interactive man/machine computer systems. National Cash Regmter Corporation HFP 81-25 Dayton, Ohio (Aug. 25).
GOODMAN, T. J., AND SPENCE, R. 1978. The effect of computer system response tlme on interactive computer aided problem solving. ACM SIG- GRAPH 1978 Conference Proceedings ACM, New York, pp. 100-104.
Computing Surveys, Vol. 16, No 3, September 1984
Response Time and Display Rate in Human Performance with Computers
GOODMAN, T. J., AND SPENCE, R. 1981. The effect of computer system response time variability on interactive graphmal problem solving. IEEE Trans Syst Man Cybern. 11, 3 (Mar.), 207-216
GOODMAN, T. J., AND SPENCE, R. 1982 The effects of potentlometer oimensionality, system response time, and time of day on mteractwe, graphmal problem solving. Hum Factors 24, 4, 437-456.
GROSSBERG, M., WIESEN, R. A., AND YNTEMA, D B. 1976 An experiment on problem solving with delayed computer responses IEEE Trans Syst Man Cybern. SMG-6, 3 (Mar.), 219-222.
IBM 1982. The economic value of rapid response time GE20-0752-0, IBM Dept. 824, White Plains, N.Y. (Nov.), 11 pages
LAMBERT, G. N. 1984. A comparatwe study of sys- tem response time on program developer produc- tivity. IBM Syst J. 23, 1, 36-43.
LIVERMAN, R. 1983. Unpublished manuscript, re- search project report to James Foley, Computer Science Dept, George Washington Umv., Wash- ington D.C
LONG, J. 1976. Effects of delayed irregular feedback on unskilled and skdled keying performance. Er- gonomics 19, 2, 183-202.
MILLER, G A 1956. The magmal number seven, plus or minus two: Some limits on our capacity for processing reformation. Psych Rev 63, 81-97.
MILLER, L. H. 1977. A study in man-machine inter- action. In Proceedings of the Natwnal Computer Conference, vol. 46 AFIPS Press, Reston, Va., pp. 409-421
MILLER, R. B. 1968. Response time in man-com- puter conversational transactions. In Proceedings of the Spring Joint Computer Conference, vol. 33. AFIPS Press, Reston, Va., pp 267-277.
MURRAY, R. P., AND ABRAHAMSON, D S 1983. The effect of system response t~me delay variability on inexperienced vldeotex users. Behav Inf Tech 2, 3, 237-251
NEAL, A. S. 1977. Time interval between keystrokes, records, and fields in data entry with skilled operators Hum Factors 19, 2, 163-170.
• 285
SHNEIDERMAN, B. 1980. Software Psychology: Hu- man Factors in Computer and Informatmn Sys- tems Little, Brown, Boston, Mass.
SMITH, D. 1983. Faster is better: A business case for subsecond response time. Computerworld (Apr. 18), In Depth pages 1-11.
THADHANI, A J. 1981. Interactive user productivity. IBM Syst. J. 20, 4, 407-423.
THADHANI, A. J 1984. Factors affecting program- mer productivity during application development. IBM Syst. J. 23, 1, 19-35.
WEINBERG, S 1981. Learning effectiveness: The im- pact of response time. Presentation at May 1981 Conference, Control Data Corporation, Minne- apolis, Minn. (May).
WEISS, S. M., BOGGS, G., LEHTO, M., SHODJA, S., AND MARTIN, D. J. 1982. Computer system re- sponse time and psychophysiologmal stress II. In Proceedings of the Human Factors Society, 26th Annual Meeting (Seattle, Wash., Oct. 25-29). Hu- man Factors Soc., Santa Monica, Calif., pp. 698- 702.
WlCKELGREN, W. A. 1977. Speed-accuracy tradeoff and reformation processing dynamics. Acta Psych. 41, 67-85.
WILLIAMS, C. M. 1973. System response time: A study of users' tolerance. IBM Advanced Systems Development Division Tech. Rep. 17-272, IBM, Yorktown Heights, N.Y. (July).
WILLIAMS, J. D. 1975. The effects of computer sub- system response time and response time variance on operator performance in an interactive com- puter system. Unpublished manuscript, Bell Telephone Laboratories, Memorandum 75-9131- 3, Human Performance Technology Center, Mur- ray Hill, N.J.
YOUMANS, D. M. 1981. User requirements for future office workstations with emphasis on preferred response times. IBM United Kingdom Labora- tories, Hursley Park, England (Sept.).
YOUMANS, D. M. 1983. The effects of system re- sponse time on users of interactive computer systems. IBM United Kingdom Laboratories, Hursley Park, England (Jan.).
Recewed August 1984, final revfs~on accepted October 1984.
Computing Surveys, Vol. 16, No. 3, September 1984