rest 2009 software user guide - gene-quantification.de · rest 2009 software calculates and uses...
TRANSCRIPT
December 2009
Sample & Assay Technologies
REST 2009 Software User Guide
For gene expression analysis using real-time
PCR data from the Rotor-Gene® Q and other
cyclers

QIAGEN Sample and Assay Technologies QIAGEN is the leading provider of innovative sample and assay technologies, enabling the isolation and detection of contents of any biological sample. Our advanced, high-quality products and services ensure success from sample to result.
QIAGEN sets standards in:
Purification of DNA, RNA, and proteins
Nucleic acid and protein assays
microRNA research and RNAi
Automation of sample and assay technologies
Our mission is to enable you to achieve outstanding success and breakthroughs. For more information, visit www.qiagen.com.

REST 2009 Software User Guide 12/2009 3
Contents Product Use Limitations 4
Technical Assistance 4
Introduction 5
About this user guide 5
REST 2009 Software 6
REST 2009 algorithms 7
Installing REST 2009 Software 8
Using REST 2009 Software 10
Adding genes using the REST standard mode 10
Adding genes using the REST RG mode 14
Viewing results 17
Appendix A: Reference Gene Normalization 19
Appendix B: Statistical Methods 20
Expression-level confidence intervals 20
Procedure 20
Validation of the number of randomizations used 24
Hypothesis test 24
Whisker-box plots 25
References 26

4 REST 2009 Software User Guide 12/2009
Product Use Limitations REST 2009 (Relative Expression Software Tool) 2009 is a standalone software tool to estimate up and down regulation for gene expression studies. The software addresses issues surrounding the measurement of uncertainty in expression ratios by using randomization and bootstrapping techniques. Graphical output of the data via whisker-box plots provides a visual representation of variation for each gene that highlights potential issues such as a distribution skew.
REST 2009 Software is intended for molecular biology applications. This software is neither intended for the diagnosis, prevention, or treatment of a disease, nor has it been validated for such use either alone or in combination with other products. Therefore, the performance characteristics of the product for clinical use (i.e., diagnostic, prognostic, therapeutic, of blood banking) are unknown.
REST 2009 Software is intended for use by professional users, such as technicians and scientists trained in molecular biological techniques and the operation of the Rotor-Gene Q or Rotor-Gene 6000 instrument or any other real-time PCR instrument.
Technical Assistance At QIAGEN, we pride ourselves on the quality and availability of our technical support. Our Technical Service Departments are staffed by experienced scientists with extensive practical and theoretical expertise in sample and assay technologies and the use of QIAGEN® products. If you have any questions or experience any difficulties regarding REST 2009 Software or QIAGEN products in general, please do not hesitate to contact us.
QIAGEN customers are a major source of information regarding advanced or specialized uses of our products. This information is helpful to other scientists as well as to the researchers at QIAGEN. We therefore encourage you to contact us if you have any suggestions about product performance or new applications and techniques.
For technical assistance and more information, please see our Technical Support Center at www.qiagen.com/Support or call one of the QIAGEN Technical Service Departments or local distributors (see back cover or visit www.qiagen.com).

REST 2009 Software User Guide 12/2009 5
Introduction
About this user guide This user guide provides information about the functions and features of REST 2009 Software. Please refer to the Rotor-Gene Q User Manual for complete information about the proper care, maintenance, and use of the Rotor-Gene Q cycler.
This user guide describes the features of the software.
Information about REST 2009 Software is provided in the following sections:
Introduction
REST 2009 Software
Installing REST 2009 Software
Using REST 2009 Software
Appendix A: Reference Gene Normalization
Appendix B: Statistical Methods
References
Throughout the software and this user guide, the terms CT (threshold cycle) and CP (crossing point) are interchangeable.
Controlling the mouse
The following terms for controlling the mouse are used in this user guide.
Term Action
Click Click with the left mouse button.
Right-click Click with the right mouse button.
Double-click Double click on the left mouse button.
Highlight Place the pointer over an item and click the left mouse button. The item becomes highlighted.
Select “XXX/xxx” In the toolbar, select the “xxx” submenu from the “XXX” menu.

6 REST 2009 Software User Guide 12/2009
REST 2009 Software REST 2009 Software is a standalone tool for analysis of gene expression data from quantitative, real-time PCR experiments. The analysis or quantitation of relative gene expression uses expression of reference genes to normalize expression levels of genes of interest (GOI) in different samples. This method allows quantitative PCR data to be adjusted, for example, to compensate for variations due to sample loading differences.
REST 2009 Software was jointly developed by Dr. Michael W. Pfaffl (Chair of Physiology, Technical University Munich) and coworkers (1–3) and QIAGEN.
REST 2009 Software applies a mathematic model that takes into account the different PCR efficiencies of the gene of interest and reference genes (4). Compared to using a single reference gene, using multiple reference genes for normalization can improve the reliability of results (5). For more information, see Appendix A, page 19.
Traditional relative quantitation allows gene expression to be estimated but can not provide statistical information suitable for comparing expression in groups of treated and untreated samples in a robust manner.
The integrated randomization and bootstrapping methods used in REST 2009 Software (Appendix B, page 20) test the statistical significance of calculated expression ratios and can be used even when outliers are present in the data.
REST 2009 Software provides the following additional features for convenient and robust data analysis:
REST RG mode An optional input method allows users to copy and paste results from a Rotor-Gene Q comparative quantitation analysis rather than importing standard curve and CT results.
Whisker-box plots export Expression variation is visualized for each gene in a whisker-box plot to highlight potential issues, such as distribution skew. Whisker-box plots are exported by right-clicking the graph.
Improved randomization Randomization algorithms have been improved for better confidence intervals and more accurate p values.
Handling of standard-curve variation Improvements have been made to the calculation of confidence intervals and p values. Efficiency is determined using the best fit for the standard curve and is used in the randomization process.

REST 2009 Software User Guide 12/2009 7
REST 2009 algorithms The standard REST 2009 algorithm calculates efficiency using the slope from the best fit standard curve as follows:
E = 10–1/slope – 1
Alternatively, a user-input value can be used for efficiency.
The REST 2009 RG algorithm differs from the standard REST 2009 algorithm in the way that new information is input as well as the values used for efficiency and CTs.
For the efficiency, the REST 2009 RG mode uses “Amplification”, which has a value between 1 and 2. In addition, the randomization algorithm uses take-off rather than the CT values.

8 REST 2009 Software User Guide 12/2009
Installing REST 2009 Software
Installation
Follow the steps below to install REST 2009 Software.
Note: The REST 2009 Software installer checks the computer to determine if .NET Framework v2.0 is installed. If it is not installed, a message informs the user and the the installation process is terminated. The user is then directed to the Microsoft® update Web site to download and install .NET Framework v2.0.
1. Download and register the software by following the instructions at www.qiagen.com/REST. The SetupREST2009_2.0.11.exe file is downloaded to your computer.
2. To launch the installation, double-click the SetupREST2009_2.0.11.exe file. The installation wizard, which installs the necessary components to your computer, is launched.
3. Click “Next>” to set up the installation.

REST 2009 Software User Guide 12/2009 9
4. Click “Install” to begin the installation. A dialog box appears that displays the progress of the installation procedure.
5. When installation is complete, click “Finish” to exit the installation
wizard.

10 REST 2009 Software User Guide 12/2009
Using REST 2009 Software
Adding genes using the REST standard mode
1. Open REST 2009 Software by double-clicking on the desktop. Alternatively, click “Start” and select “Programs/REST 2009/ REST 2009” from the “Start” menu. By default, REST 2009 Software opens in the REST standard mode, and “Standard Mode” appears at the bottom left of the window.
If the software opens in RG mode, change to the standard mode by selecting “Mode/REST Standard”.
REST 2009 Software User Guide 12/2009 11
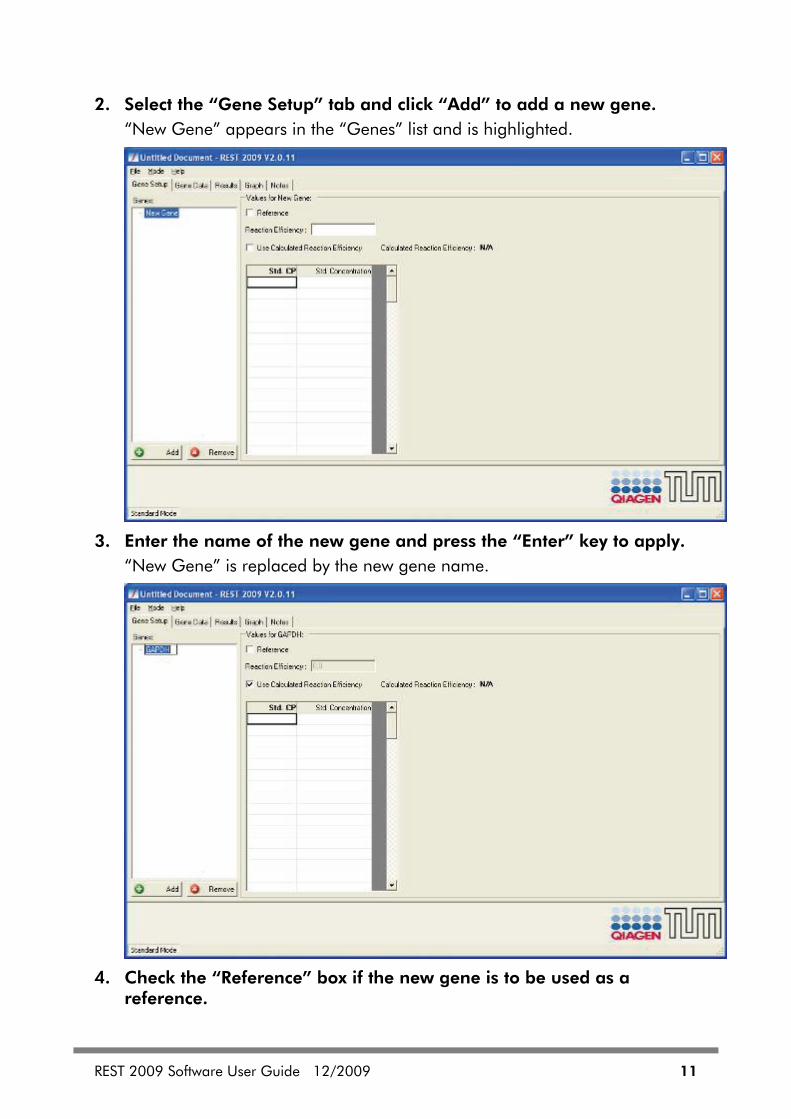
2. Select the “Gene Setup” tab and click “Add” to add a new gene. “New Gene” appears in the “Genes” list and is highlighted.
3. Enter the name of the new gene and press the “Enter” key to apply.
“New Gene” is replaced by the new gene name.
4. Check the “Reference” box if the new gene is to be used as a
reference.
12 REST 2009 Software User Guide 12/2009
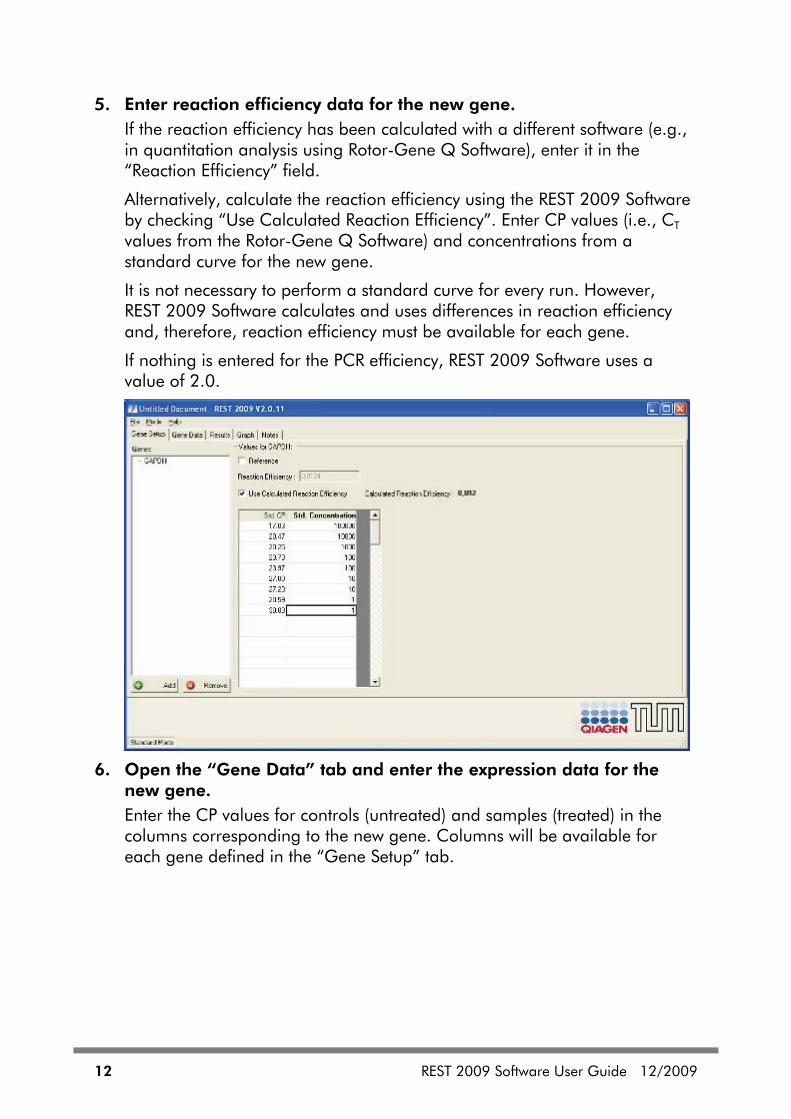
5. Enter reaction efficiency data for the new gene. If the reaction efficiency has been calculated with a different software (e.g., in quantitation analysis using Rotor-Gene Q Software), enter it in the “Reaction Efficiency” field.
Alternatively, calculate the reaction efficiency using the REST 2009 Software by checking “Use Calculated Reaction Efficiency”. Enter CP values (i.e., CT values from the Rotor-Gene Q Software) and concentrations from a standard curve for the new gene.
It is not necessary to perform a standard curve for every run. However, REST 2009 Software calculates and uses differences in reaction efficiency and, therefore, reaction efficiency must be available for each gene.
If nothing is entered for the PCR efficiency, REST 2009 Software uses a value of 2.0.
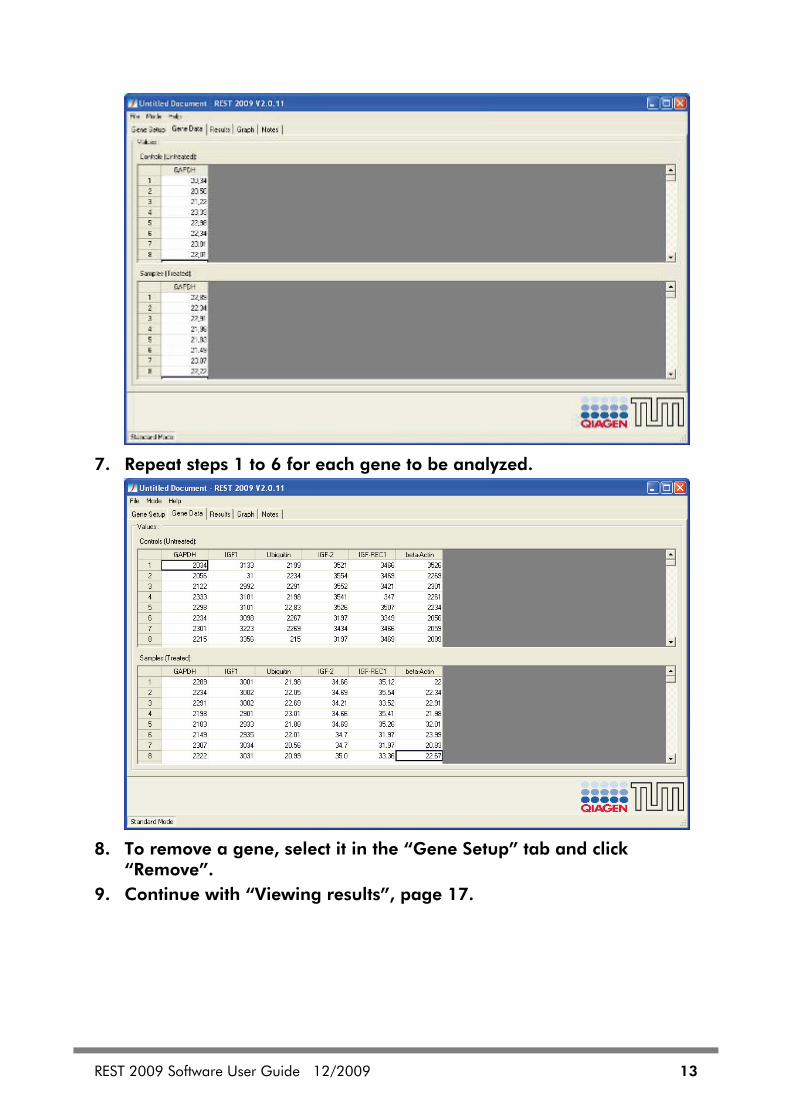
6. Open the “Gene Data” tab and enter the expression data for the
new gene. Enter the CP values for controls (untreated) and samples (treated) in the columns corresponding to the new gene. Columns will be available for each gene defined in the “Gene Setup” tab.
REST 2009 Software User Guide 12/2009 13
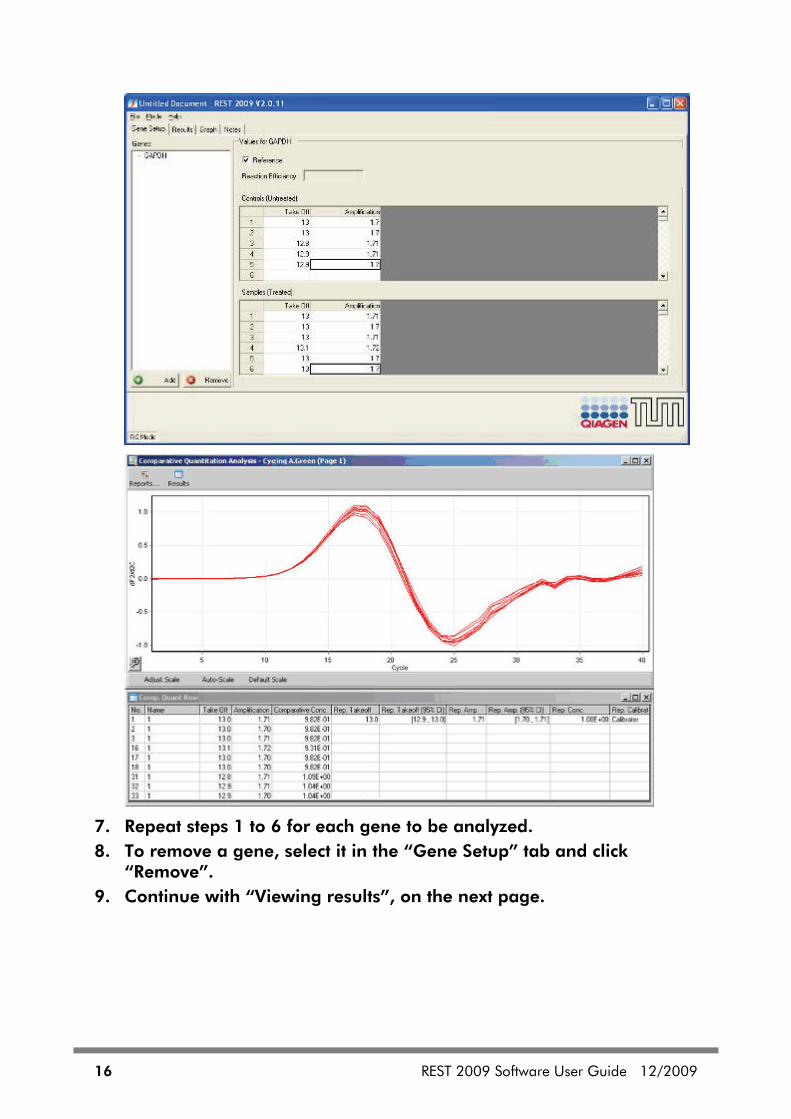
7. Repeat steps 1 to 6 for each gene to be analyzed.
8. To remove a gene, select it in the “Gene Setup” tab and click
“Remove”. 9. Continue with “Viewing results”, page 17.

14 REST 2009 Software User Guide 12/2009
Adding genes using the REST RG mode The REST RG mode facilitates the use of comparative quantitation analysis data from Rotor-Gene Q Software.
1. Open REST 2009 Software by double-clicking on the desktop. Alternatively, click “Start” and select “Programs/REST 2009/ REST 2009” from the “Start” menu. By default, REST 2009 Software opens in the standard mode.
2. Change to the RG mode by selecting “Mode/REST RG”.
The format of the screen will change and “RGMode” appears at the bottom left of the window.

REST 2009 Software User Guide 12/2009 15
3. Select the “Gene Setup” tab and click “Add” to add a new gene. “New Gene” appears in the “Genes” list and is highlighted.
4. Enter the name of the new gene and press the “Enter” key to apply.
“New Gene” is replaced by the new gene name.
5. Check the “Reference” box if the new gene is to be used as a reference.
6. Enter comparative quantitation analysis data obtained using the Rotor-Gene Q Software. Enter the take-off and amplification values from comparative quantitation analysis data obtained with Rotor-Gene Q Software for controls (untreated) and samples (treated) in the corresponding columns.
16 REST 2009 Software User Guide 12/2009
7. Repeat steps 1 to 6 for each gene to be analyzed. 8. To remove a gene, select it in the “Gene Setup” tab and click
“Remove”. 9. Continue with “Viewing results”, on the next page.
REST 2009 Software User Guide 12/2009 17
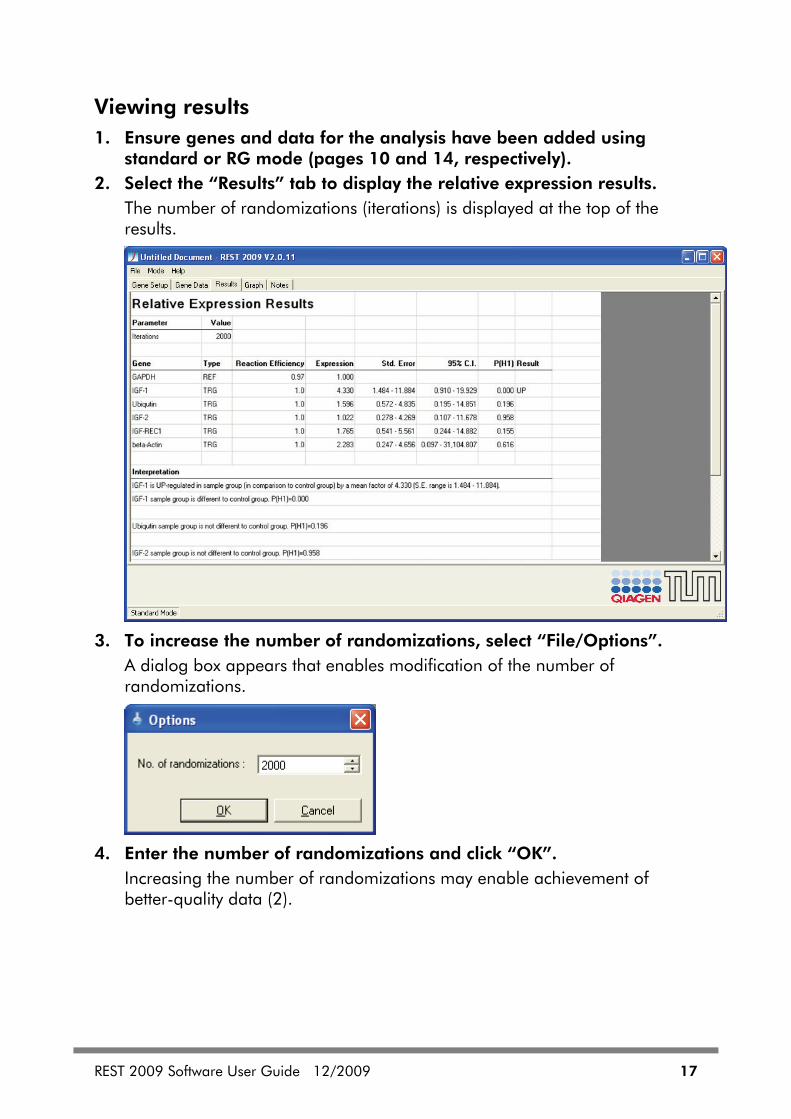
Viewing results 1. Ensure genes and data for the analysis have been added using
standard or RG mode (pages 10 and 14, respectively). 2. Select the “Results” tab to display the relative expression results.
The number of randomizations (iterations) is displayed at the top of the results.
3. To increase the number of randomizations, select “File/Options”.
A dialog box appears that enables modification of the number of randomizations.
4. Enter the number of randomizations and click “OK”.
Increasing the number of randomizations may enable achievement of better-quality data (2).

18 REST 2009 Software User Guide 12/2009
5. Select the “Graph” tab to display whisker-box plots for the data.
6. Select the “Notes” tab to enter notes about the results, data, or
source.

REST 2009 Software User Guide 12/2009 19
Appendix A: Reference Gene Normalization Since multiple reference genes can be used to analyze expression, REST 2009 software is more comprehensive than traditional techniques.
When estimating a sample’s expression ratio, an intermediate absolute concentration value is calculated using the following formula:
Concentration = efficiencyaverage CP (controls) – average CP (samples)
When using a single reference gene, the expression level is calculated using the concentrations of the gene of interest and the single reference gene.
Concentration of gene of interest Relative expression =
Concentration of reference gene
When using multiple reference genes, the geometric mean of all reference gene concentrations can be used to calculate the relative expression of individual genes to allow alternative approximations of the true expression values, as concentration estimates vary exponentially:*
Concentration of gene of interest Relative expression =
Geometric mean (concentration of reference
gene 1, concentration of reference gene 2, …)
* Errors in the concentration calculation occur due to linear variation in CT values. Estimates of
concentration use the equation c = A*eCT (where A*e is the efficiency) to allow exponential variation.

20 REST 2009 Software User Guide 12/2009
Appendix B: Statistical Methods Traditional approaches for relative quantitation of quantitative PCR did not provide statistical information suitable for comparing groups of treated versus untreated samples in a robust manner. An average expression value indicating gene regulation is calculated using these methods. However, a statistical test to determine accuracy of relative expressions is complex because ratio distributions do not have a standard deviation. REST 2009 software overcomes this limitation by using simple statistical randomization tests. Such tests may appear counter-intuitive, and we recommend reading the cited references (page 26) before continuing.
Expression-level confidence intervals Previous versions of REST 2009 Software provide a means for determining the mean output and a p value for the likelihood of upregulation or downregulation using a hypothesis test. Bootstrapping techniques (6, 7) can be used to provide 95% confidence intervals for expression ratios, without normality or symmetrical distribution assumptions. While a hypothesis test provides a measure of whether the result is statistically significant, the confidence interval provides a range that can be checked for semantic significance.
Procedure The following are used in the procedure:
Set of control (CGOI) and sample (SGOI) CT values for the gene of interest
Set of control (CREF) and sample (SREF) CT values for the reference gene
Efficiency value (eGOI) for the gene of interest
Efficiency value (eREF) for the reference gene
In addition, the method uses the following:
X, random variable indicating the expression ratio of individual samples for the gene of interest
Y, a list of simulated readings from X
n, the size of Y, preferably a large value (>2000)
choose(), a function that returns a random element from a set
count(), a function that returns the number of elements in a set
REST 2009 Software User Guide 12/2009 21
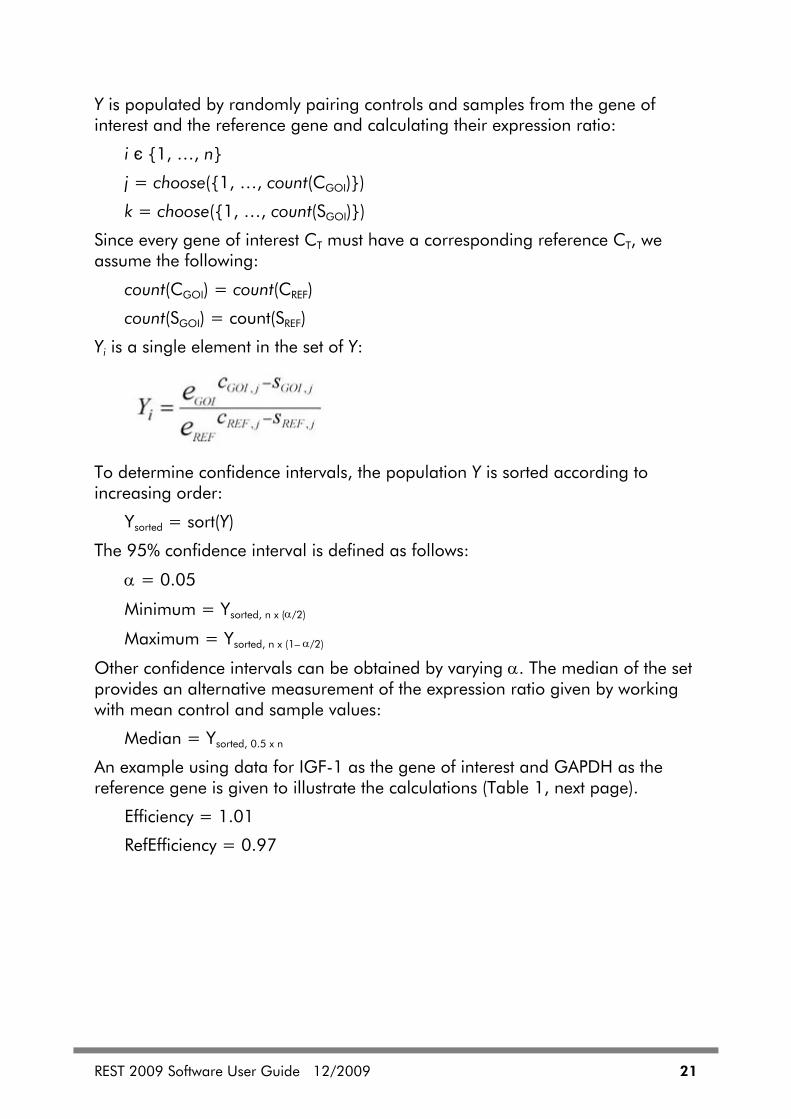
Y is populated by randomly pairing controls and samples from the gene of interest and the reference gene and calculating their expression ratio:
i є {1, …, n}
j = choose({1, …, count(CGOI)})
k = choose({1, …, count(SGOI)})
Since every gene of interest CT must have a corresponding reference CT, we assume the following:
count(CGOI) = count(CREF)
count(SGOI) = count(SREF)
Yi is a single element in the set of Y:
To determine confidence intervals, the population Y is sorted according to increasing order:
Ysorted = sort(Y)
The 95% confidence interval is defined as follows:
α = 0.05
Minimum = Ysorted, n x (α/2)
Maximum = Ysorted, n x (1– α/2)
Other confidence intervals can be obtained by varying α. The median of the set provides an alternative measurement of the expression ratio given by working with mean control and sample values:
Median = Ysorted, 0.5 x n
An example using data for IGF-1 as the gene of interest and GAPDH as the reference gene is given to illustrate the calculations (Table 1, next page).
Efficiency = 1.01
RefEfficiency = 0.97

22 REST 2009 Software User Guide 12/2009
Table 1. Example expression data
Index GAPDH control GAPDH sample IGF-1 control IGF sample
1 26.74 26.77 27.57 24.54
2 26.85 26.47 27.61 24.95
3 26.83 27.03 27.82 24.57
4 26.68 26.92 27.12 24.63
5 27.39 26.97 27.76 24.66
6 27.03 26.97 27.74 24.89
7 26.78 26.07 26.91 24.71
8 27.32 26.30 27.49 24.9
9 26.14 24.26
10 26.81 24.44
Randomizing for a small set (n=10) produces the Y shown in Table 2 (unsorted) and Table 3 (sorted).
Table 2. Randomization results
j k CREF CGOI SREF SGOI Expression
6 10 27.03 27.74 26.81 24.44 8.625105575
7 8 26.78 26.91 26.30 24.90 2.938192778
1 2 26.74 27.57 26.47 24.95 5.186421266
3 1 26.83 27.82 26.77 24.54 9.480147506
6 6 27.03 27.74 26.97 24.89 7.021676066
1 7 26.74 27.57 26.07 24.71 4.675718457
6 2 27.03 27.74 26.47 24.95 4.797510275
1 2 26.74 27.57 26.47 24.95 5.186421266
1 2 26.74 27.57 26.47 24.95 5.186421266
8 6 27.32 27.49 26.97 24.89 4.844473339

REST 2009 Software User Guide 12/2009 23
Table 3. Ysorted results
Expression
2.938192778
4.675718457
4.797510275
4.844473339
5.186421266
5.186421266
5.186421266
7.021676066
8.625105575
9.480147506
To obtain a 68% confidence interval (α = 0.32), equivalent to a single standard error interval, we examine the readings at indices 1, approximately (α/2) * (10–1), and 8, approximately (1-α/2) * (10–1).
Confidence68% = [4.675718457, 8.625105575]
For a 95% confidence interval (α = 0.05), equivalent to 2 standard error intervals, we examine the readings at indices 0, approximately (α/2) * (10-1), and 9, approximately (1-α/2) * (10-1).
Confidence95% = [2.938192778, 9.480147506]
p<0.05
With the small example, the 99.7% confidence interval (α = 0.0027) leads to the same indices 0 and 9 due to a lack of data points, leading to an identical confidence interval:
Confidence99.7% = [2.938192778, 9.480147506] p<0.0027
The median is calculated as the fifth position:
Median = 5.186421266
Note: Although the median of even sets is traditionally taken as the average of the middle 2 positions, this introduces assumptions of normality on the underlying distribution. Theoretical objections can be sidestepped by always using sets that provide critical points (α = 0.5, α = 0.05, α = 0.95) at integral

24 REST 2009 Software User Guide 12/2009
indices. The issue does not have a practical bearing on results, since variation between adjacent values is dominated by the effects of randomization.
Validation of the number of randomizations used A sample data tested on a larger randomization value (n=10000) gives the following values:
Confidence68% = [4.121081159, 8.62510557506084]
Confidence95% = [2.9840236231636, 9.98446532616807]
Median = 5.95072937164207
There was insufficient data to reliably calculate a 99.7% confidence interval.
For the same data set, REST 2009 Software calculates comparable values:
Expression = 5.927
Confidence 95% = [2.983, 9.996]
Sample upregulated = YES (p = 0.000)
As all values in the 95% confidence interval were greater than 1, the interval is consistent with the REST 2009 p value of 0.000. The median is slightly inaccurate relative to the calculated expression, due to problems of resolution caused by permutation over a set of fixed values. Although the median should, therefore, not be used to determine the mean expression value, it provides a useful cross-check of the confidence interval, as it is generated from the same data set. The 68% confidence interval covers roughly the same area as the standard error, but still retains a valid meaning when expanded to 95%, whereas traditional statistical methods of estimating standard error fall into negative values.
Hypothesis test REST 2009 software can be used to determine whether a significant difference exists between samples and controls, while taking issues of reaction efficiency and reference gene normalization into account. Because the normalization and efficiency calculations involve ratios and multiple sources of error, it would be extremely difficult to devise a traditional statistical test, so randomization techniques are employed.
The hypothesis test P(H1), indicated in the results table, represents the probability of the alternate hypothesis that the difference between the sample and control groups is due only to chance. To devise a strong randomization test, we use the following randomization scenario: “if any perceived variation between samples and controls is due only to chance, then we could randomly swap values between the 2 groups and not see any greater difference than the difference we see between the initial groups.”

REST 2009 Software User Guide 12/2009 25
The hypothesis test performs 10,000 random reallocations of samples and controls between the groups, and counts the number of times the relative expression on the randomly assigned group is greater than the sample data.
Whisker-box plots In statistical applications, whisker-box plots provide additional information about the skew of the data distributions that would not be available simply by plotting the sample mean. For further information about whisker-box plots, see (8).
To summarize, the box area in a whisker-box plot encompasses 50% of all observations, the dotted line represents the sample median and the whiskers represent the outer 50% of observations (Figure 1).
Top whisker Upper 25% of observations Box (interquartile range): middle 50% of observations
Median
Lower 25% of observations Bottom whisker
Figure 1. Whisker-box plot.
If the sample data are skewed or non-linear, the tails of the data may be asymmetrical.
Because REST 2009 Software uses randomization techniques, it draws whicker-box plots based on the permutated expression data (Y set) rather than the raw CT values input by the user.
26 REST 2009 Software User Guide 12/2009
Because expression level values are ratios, they will often have lopsided ratios with greater variability on the upper tail. As ratio populations can be unpredictable and subject to large and unseen variability, this visualization draws out characteristics of gene expression data that may otherwise go unnoticed.
References QIAGEN maintains a large, up-to-date online database of scientific publications utilizing QIAGEN products. Comprehensive search options allow you to find the articles you need, either by a simple keyword search or by specifying the application, research area, title, etc.
For a complete list of references, visit the QIAGEN Reference Database online at www.qiagen.com/RefDB/search.asp or contact QIAGEN Technical Services or your local distributor.
Cited references
1. Pfaffl, M.W. (2001) A new mathematical model for relative quantification in real-time RT-PCR. NAR 29, e45.
2. Pfaffl, M.W., Horgan, G.W., Dempfle, L. (2002) Relative expression software tool (REST) for group-wise comparison and statistical analysis of relative expression results in real-time PCR. NAR 30, e36
3. Vandesompele J. et. al. (2002) Accurate normalization of real-time quantitative RT-PCR data by geometric averaging of multiple internal control genes. Genome Biol. 3, research0034.1.
4. Relative Expression Software Tool http://rest.gene-quantification.info 5. Randomization Tests http://ordination.okstate.edu/permute.htm 6. Introduction to Randomization Tests
www.bioss.ac.uk/smart/unix/mrandt/slides/frames.htm 7. Resampling Statistics: Randomization and the Bootstrap
www.uvm.edu/~dhowell/StatPages/Resampling/Resampling.html 8. Quartiles and Box and Whisker Plots
www.regentsprep.org/regents/math/algebra/AD3/boxwhisk.htm

Trademarks: QIAGEN® (QIAGEN Group); Microsoft® (Microsoft Corporation); Rotor-Gene® (Corbett Research Pty Ltd).
©2009 Corbett Research Pty Ltd (a company of the QIAGEN Group) and Michael W. Pfaffl, all rights reserved. No parts of this work may be reproduced in any form or by any means — graphic, electronic, or mechanical, including photocopying, recording, taping, or information storage and retrieval systems – without the written permission of the publisher.
Products that are referred to in this document may be either trademarked and/or registered trademarks of the respective owners. The publisher and the author make no claim to these trademarks, other than QIAGEN or Corbett trademarks.
While every precaution has been taken the development of REST software and in preparation of this document, the publisher and the author assume no responsibility for errors or omissions or for damages resulting from the use of information contained in this document or from the use of programs and source code that may accompany it. In no event shall the publisher and the author be liable for any loss of profit or any other commercial damage caused or alleged to have been caused directly or indirectly by this document.
QIAGEN GmbH, December 2009

1060848 12/2009 Sample & Assay Technologies
www.qiagen.com
Australia Orders 03-9840-9800 Fax 03-9840-9888 Technical 1-800-243-066
Austria Orders 0800/28-10-10 Fax 0800/28-10-19 Technical 0800/28-10-11
Belgium Orders 0800-79612 Fax 0800-79611 Technical 0800-79556
Brazil Orders 0800-557779 Fax 55-11-5079-4001 Technical 0800-557779
Canada Orders 800-572-9613 Fax 800-713-5951 Technical 800-DNA-PREP (800-362-7737)
China Orders 021-3865-3865 Fax 021-3865-3965 Technical 800-988-0325
Denmark Orders 80-885945 Fax 80-885944 Technical 80-885942
Finland Orders 0800-914416 Fax 0800-914415 Technical 0800-914413
France Orders 01-60-920-926 Fax 01-60-920-925 Technical 01-60-920-930 Offers 01-60-920-928
Germany Orders 02103-29-12000 Fax 02103-29-22000 Technical 02103-29-12400
Hong Kong Orders 800 933 965 Fax 800 930 439 Technical 800 930 425
Ireland Orders 1800 555 049 Fax 1800 555 048 Technical 1800 555 061
Italy Orders 02-33430-420 Fax 02-33430-426 Technical 800-787980
Japan Telephone 03-6890-7300 Fax 03-5547-0818 Technical 03-6890-7300
Korea (South) Orders 1544 7145 Fax 1544 7146 Technical 1544 7145
Luxembourg Orders 8002-2076 Fax 8002-2073 Technical 8002-2067
Mexico Orders 01-800-7742-639 Fax 01-800-1122-330 Technical 01-800-7742-639
The Netherlands Orders 0800-0229592 Fax 0800-0229593 Technical 0800-0229602
Norway Orders 800-18859 Fax 800-18817 Technical 800-18712
Singapore Orders 65-67775366 Fax 65-67785177 Technical 65-67775366
Spain Orders 91-630-7050 Fax 91-630-5145 Technical 91-630-7050
Sweden Orders 020-790282 Fax 020-790582 Technical 020-798328
Switzerland Orders 055-254-22-11 Fax 055-254-22-13 Technical 055-254-22-12
UK Orders 01293-422-911 Fax 01293-422-922 Technical 01293-422-999
USA Orders 800-426-8157 Fax 800-718-2056 Technical 800-DNA-PREP (800-362-7737)