resting-state functional brain connectivity best predicts the ... · assessed with the neo-ffi...
TRANSCRIPT
Resting-state functional brain connectivity best predicts the personality dimension of openness to experience Julien Dubois1,4,*, Paola Galdi 5,*, Yanting Han 2, Lynn K. Paul 1, Ralph Adolphs1,2,3
* equal contribution 1 Division of Humanities and Social Sciences, 2 Division of Biology and Biological engineering, 3 Chen Neuroscience Institute, California Institute of Technology, Pasadena CA 91125, USA 4 Department of Neurosurgery, Cedars-Sinai Medical Center, Los Angeles, CA 90048, USA 5 Department of Management and Innovation Systems, University of Salerno, Fisciano, Salerno, Italy Correspondence: Julien Dubois Department of Neurosurgery Cedars-Sinai Medical Center, Los Angeles, CA 90048 [email protected]
peer-reviewed) is the author/funder. All rights reserved. No reuse allowed without permission. The copyright holder for this preprint (which was not. http://dx.doi.org/10.1101/215129doi: bioRxiv preprint first posted online Nov. 7, 2017;
Abstract
Personality neuroscience aims to find associations between brain measures and personality traits. Findings to date have been severely limited by a number of factors, including small sample size and omission of out-of-sample prediction. We capitalized on the recent availability of a large database, together with the emergence of specific criteria for best practices in neuroimaging studies of individual differences. We analyzed resting-state functional magnetic resonance imaging data from 884 young healthy adults in the Human Connectome Project (HCP) database. We attempted to predict personality traits from the “Big Five”, as assessed with the NEO-FFI test, using individual functional connectivity matrices. After regressing out potential confounds (such as age, sex, handedness and fluid intelligence), we used a cross-validated framework, together with test-retest replication (across two sessions of resting-state fMRI for each subject), to quantify how well the neuroimaging data could predict each of the five personality factors. We tested three different (published) denoising strategies for the fMRI data, two inter-subject alignment and brain parcellation schemes, and three different linear models for prediction. As measurement noise is known to moderate statistical relationships, we performed final prediction analyses using average connectivity across both imaging sessions (1 h of data), with the analysis pipeline that yielded the highest predictability overall. Across all results (test/retest; 3 denoising strategies; 2 alignment schemes; 3 models), Openness to experience emerged as the only reliably predicted personality factor. Using the full hour of resting-state data and the best pipeline, we could predict Openness to experience (NEOFAC_O: r=0.24, R2=0.024) almost as well as we could predict the score on a 24-item intelligence test (PMAT24_A_CR: r=0.26, R2=0.044). Other factors (Extraversion, Neuroticism, Agreeableness and Conscientiousness) yielded weaker predictions across results that were not statistically significant under permutation testing. We also derived two superordinate personality factors (“α” and “β”) from a principal components analysis of the NEO-FFI factor scores, thereby reducing noise and enhancing the precision of these measures of personality. We could account for 5% of the variance in the β superordinate factor (r=0.27, R2=0.050), which loads highly on Openness to experience. We conclude with a discussion of the potential for predicting personality from neuroimaging data and make specific recommendations for the field.
peer-reviewed) is the author/funder. All rights reserved. No reuse allowed without permission. The copyright holder for this preprint (which was not. http://dx.doi.org/10.1101/215129doi: bioRxiv preprint first posted online Nov. 7, 2017;

Introduction Personality refers to the relatively stable disposition of an individual that influences
long-term behavioral style (Back, Schmukle, & Egloff, 2009; Furr, 2009; Hong, Paunonen, & Slade, 2008; Jaccard, 1974). It is especially conspicuous in social interactions, and in emotional expression. It is what we pick up on when we observe a person for an extended time, and what leads us to make predictions about general tendencies in behaviors and interactions in the future. Often, these predictions are inaccurate stereotypes, and they can be evoked even by very fleeting impressions, such as merely looking at photographs of people (Todorov, 2017). Yet there is also good reliability (Viswesvaran & Ones, 2000) and consistency (B. W. Roberts & DelVecchio, 2000) for many personality traits currently used in psychology, which can predict real-life outcomes (Brent W. Roberts, Kuncel, Shiner, Caspi, & Goldberg, 2007).
While human personality traits are typically inferred from questionnaires, viewed as latent variables they could plausibly be derived also from other measures. In fact, there are good reasons to think that biological measures other than self-reported questionnaires can be used to estimate personality traits. Many of the personality traits similar to those used to describe human dispositions can be applied to animal behavior as well, and again they make some predictions about real-life outcomes (Gosling & John, 1999; Gosling & Vazire, 2002). For instance, anxious temperament has been a major topic of study in monkeys, as a model of human mood disorders. Hyenas show neuroticism in their behavior, and also show sex differences in this trait as would be expected from human data (in humans, females tend to be more neurotic than males; in hyenas, the females are socially dominant and the males are more neurotic). Personality traits are also highly heritable. Anxious temperament in monkeys is heritable and its neurobiological basis is being intensively investigated (Oler et al., 2010). Twin studies in humans typically report heritability estimates for each trait between .4 and .6 (Bouchard & McGue, 2003; Jang, Livesley, & Vernon, 1996; Verweij et al., 2010), even though no individual genes account for much variance (studies using common single-nucleotide polymorphisms (SNPs) report estimates between 0 and 0.2 (R. A. Power & Pluess, 2015; Vinkhuyzen et al., 2012)).
Just as gene-environment interactions constitute the distal causes of our phenotype, the proximal cause of personality must come from brain-environment interactions, since these are the basis for all behavioral patterns. Some aspects of personality have been linked to specific neural systems -- for instance, behavioral inhibition and anxious temperament have been linked to a system involving the medial temporal lobe and the prefrontal cortex (Birn et al., 2014). Although there is now universal agreement that personality is generated through brain function in a given context, it is much less clear what type of brain measure might be the best predictor of personality. Neurotransmitters, cortical thickness or volume of certain regions, and functional measures have all been explored with respect to their correlation with personality traits (see (Turhan Canli, 2006; Yarkoni., 2015) for reviews). We briefly summarize this literature next and refer the interested reader to review articles and primary literature for the details.
peer-reviewed) is the author/funder. All rights reserved. No reuse allowed without permission. The copyright holder for this preprint (which was not. http://dx.doi.org/10.1101/215129doi: bioRxiv preprint first posted online Nov. 7, 2017;

The search for neurobiological substrates of personality traits Since personality traits are relatively stable over time (unlike state variables, such as
emotions), one might expect that brain measures that are similarly stable over time are the most promising candidates for predicting such traits. The first types of measures to look at might thus be structural, connectional and neurochemical; indeed a number of such studies have reported correlations with personality differences. Here we briefly review studies using structural and functional magnetic resonance imaging (MRI) of humans, but leave aside research on neurotransmission (see (Turhan Canli, 2006; Yarkoni., 2015) for more exhaustive reviews). Although a number of different personality traits have been investigated, we emphasize those most similar to the “Big Five”, since they are the topic of the present paper (see below).
Structural MRI studies Many structural MRI studies of personality to date have used voxel-based morphometry
(VBM) (Blankstein, Chen, Mincic, McGrath, & Davis, 2009; Coutinho, Sampaio, Ferreira, Soares, & Gonçalves, 2013; DeYoung et al., 2010; Hu et al., 2011; Kapogiannis, Sutin, Davatzikos, Costa, & Resnick, 2013; W.-Y. Liu et al., 2013; Lu et al., 2014; Omura, Todd Constable, & Canli, 2005; Taki et al., 2013). Results have been quite variable, sometimes even contradictory (e.g., the volume of the posterior cingulate cortex has been found to be both positively and negatively correlated with agreeableness (Coutinho et al., 2013; DeYoung et al., 2010)). Methodologically, this is in part due to the rather small sample sizes (typically less than 100; 116 in (DeYoung et al., 2010), 52 in (Coutinho et al., 2013)) which undermine replicability (Button et al., 2013); studies with larger sample sizes (W.-Y. Liu et al., 2013) typically fail to replicate previous results.
More recently, surface-based morphometry (SBM) has emerged as a promising measure to study structural brain correlates of personality (Bjørnebekk et al., 2013; Holmes et al., 2012; Rauch et al., 2005; Riccelli, Toschi, Nigro, Terracciano, & Passamonti, 2017; Wright et al., 2006). It has the advantage of disentangling several geometric aspects of brain structure which may contribute to differences detected in VBM, such as cortical thickness (Hutton, Draganski, Ashburner, & Weiskopf, 2009), cortical volume, and folding . Although many studies using SBM are once again limited by small sample sizes, one recent study (Riccelli et al., 2017) used 507 subjects to investigate personality, although it had other limitations (e.g., using a correlational, rather than a predictive framework (Dubois & Adolphs, 2016; Woo, Chang, Lindquist, & Wager, 2017; Yarkoni & Westfall, 2017)).
There is much room for improvement in structural MRI studies of personality traits. The limitation of small sample sizes can now be overcome, since all MRI studies regularly collect structural scans, and recent consortia and data sharing efforts have lead to the accumulation of large publicly available datasets (Job et al., 2017; Miller et al., 2016; Van Essen et al., 2013). One could imagine a mechanism by which personality assessments, if not available already within these datasets, are collected later (Mar, Spreng, & Deyoung, 2013), yielding large samples for relating structural MRI to personality. Lack of out-of-sample generalizability, a limitation of almost all studies that we raised above, can be overcome using cross-validation
peer-reviewed) is the author/funder. All rights reserved. No reuse allowed without permission. The copyright holder for this preprint (which was not. http://dx.doi.org/10.1101/215129doi: bioRxiv preprint first posted online Nov. 7, 2017;
techniques, or by setting aside a replication sample. In short: despite a considerable historical literature that has investigated the association between personality traits and structural MRI measures, there are as yet no very compelling findings because prior studies have been unable to surmount this list of limitations.
Diffusion MRI studies Several studies have looked for a relationship between white-matter integrity as
assessed by DTI and personality factors (Cohen, Schoene-Bake, Elger, & Weber, 2008; Kim & Whalen, 2009; Westlye, Bjørnebekk, Grydeland, Fjell, & Walhovd, 2011; Xu & Potenza, 2012). As with structural MRI studies, extant focal findings often fail to replicate with larger samples of subjects, which tend to find more widespread differences linked to personality traits (Bjørnebekk et al., 2013). The same concerns mentioned in the previous section, in particular the lack of a predictive framework (e.g., using cross-validation), plague this literature; similar recommendations can be made to increase the reproducibility of this line of research, in particular aggregating data (Miller et al., 2016; Van Essen et al., 2013) and using out-of-sample prediction (Yarkoni & Westfall, 2017).
Functional MRI studies Functional MRI (fMRI) measures local changes in blood flow and blood oxygenation as a
surrogate of the metabolic demands due to neuronal activity (Logothetis & Wandell, 2004). There are two main paradigms that have been used to relate fMRI data to personality traits: task-based fMRI and resting-state fMRI.
Task-based fMRI studies are based on the assumption that differences in personality may affect information-processing in specific tasks (Yarkoni., 2015). Personality variables are hypothesized to influence cognitive mechanisms, whose neural correlates can be studied with fMRI. For example, differences in neuroticism may materialize as differences in emotional reactivity, which can then be mapped onto the brain (T. Canli et al., 2001). There is a very large literature on task-fMRI substrates of personality, which is beyond the scope of this overview. In general, some of the same concerns we raised above also apply to task-fMRI studies, which typically have even smaller sample sizes (Yarkoni, 2009), greatly limiting power to detect individual differences (in personality or any other behavioral measures). Several additional concerns on the validity of fMRI-based individual differences research apply (Dubois & Adolphs, 2016) and a new challenge arises as well: whether the task used has construct validity for a personality trait.
The other paradigm, resting-state fMRI, offers a solution to the sample size problem, as resting-state data is often collected alongside other data, and can easily be aggregated in large online databases (Biswal et al., 2010; Eickhoff, Nichols, Van Horn, & Turner, 2016; Poldrack & Gorgolewski, 2015; Van Horn & Gazzaniga, 2013). It is the type of data we used in the present paper. Resting-state data does not explicitly engage cognitive processes that are thought to be related to personality traits. Instead, it is used to study correlated self-generated activity between brain areas while a subject is at rest. These correlations, which can be highly reliable given enough data (Finn et al., 2015; Laumann et al., 2015; Noble et al., 2017), are thought to
peer-reviewed) is the author/funder. All rights reserved. No reuse allowed without permission. The copyright holder for this preprint (which was not. http://dx.doi.org/10.1101/215129doi: bioRxiv preprint first posted online Nov. 7, 2017;
reflect stable aspects of brain organization (Xilin Shen et al., 2017; S. M. Smith et al., 2013). There is a large ongoing effort to link individual variations in functional connectivity (FC) assessed with resting-state fMRI to individual traits and psychiatric diagnosis (for reviews see (Dubois & Adolphs, 2016; Orrù, Pettersson-Yeo, Marquand, Sartori, & Mechelli, 2012; S. M. Smith et al., 2013; Woo et al., 2017).
A number of recent studies have investigated functional connectivity markers from resting-state fMRI and their association with personality traits (Adelstein et al., 2011; Aghajani et al., 2014; Baeken et al., 2014; Beaty et al., 2014, 2016; Gao et al., 2013; Jiao et al., 2017; Lei, Zhao, & Chen, 2013; Pang et al., 2016; Ryan, Sheu, & Gianaros, 2011; Takeuchi et al., 2012; Wu, Li, Yuan, & Tian, 2016). Somewhat surprisingly, these resting-state fMRI studies typically also suffer from low sample sizes (typically less than 100 subjects, usually about 40), and the lack of a predictive framework to assess effect size out-of-sample. One of the best extant datasets, the Human Connectome Project (HCP) has only in the past year reached its full sample of over 1000 subjects, now making large sample sizes readily available. To date, only the exploratory “MegaTrawl” (S. Smith et al., 2016) has investigated personality in this database; we believe that ours is the first comprehensive study of personality on the full HCP dataset, offering very substantial improvements over all prior work.
Measuring Personality Although there are a number of different schemes and theories for quantifying
personality traits, by far the most common and well validated one, and also the only one available for the Human Connectome Project dataset, is the five-factor solution of personality (aka “The Big Five”). This was originally identified through systematic examination of the adjectives in English language that are used to describe human traits. Based on the hypothesis that all important aspects of human personality are reflected in language, Raymond Cattell applied factor analysis to peer ratings of personality and identified 16 common personality factors (Cattell, 1945). Over the next 3 decades, multiple attempts to replicate Cattell’s study using a variety of methods (e.g. self-description and description of others with adjective lists and behavioral descriptions) agreed that the taxonomy of personality could be robustly described through a five-factor solution (Borgatta, 1964; Fiske, 1949; Norman, 1963; G. M. Smith, 1967; Tupes & Christal, 1961). Since the 1980s, the Big Five has emerged as the leading psychometric model in the field of personality psychology (Goldberg, 1981; Robert R. McCrae & John, 1992). The five factors are commonly termed “openness,” “conscientiousness,” “extraversion,” “agreeableness,” and “neuroticism.”
While the Big Five personality dimensions are not based on an independent theory of personality, and in particular have no basis in neuroscience theories of personality, proponents of the Big Five maintain that they provide the best empirically-based integration of the dominant theories of personality, encompassing the alternative theories of Cattell, Guilford and Eysenck (Amelang & Borkenau, 1982). Self-report questionnaires, such as the NEO-FFI (Robert R. McCrae & Costa, 2004), can be used to reliably assess an individual with respect to these five factors. Even though there remain critiques of the Big Five (Block, 1995; Uher, 2015), its
peer-reviewed) is the author/funder. All rights reserved. No reuse allowed without permission. The copyright holder for this preprint (which was not. http://dx.doi.org/10.1101/215129doi: bioRxiv preprint first posted online Nov. 7, 2017;
proponents argue that its five factors “are both necessary and reasonably sufficient for describing at a global level the major features of personality" (R. R. McCrae, Costa - American Psychologist, & 1986, 1986).
The present study As we emphasized above, personality neuroscience based on MRI data confronts two
major challenges. First, nearly all studies to date have been severely underpowered due to small sample sizes (Button et al., 2013; Schönbrodt & Perugini, 2013; Yarkoni, 2009). Second, most studies have failed to use a predictive or replication framework (but see (Deris, Montag, Reuter, Weber, & Markett, 2017)), making their generalizability unclear -- a well-recognized problem in neuroscience studies of individual differences (Dubois & Adolphs, 2016; Gabrieli, Ghosh, & Whitfield-Gabrieli, 2015; Yarkoni & Westfall, 2017). The present paper takes these two challenges seriously by applying a predictive framework, together with a built-in replication, to a large, homogeneous resting-state fMRI dataset. We chose to focus on resting-state fMRI data to predict personality, because this is a predictor that could have better mechanistic interpretation than structural MRI measures (since ultimately it is brain function, not structure, that generates the behavior on the basis of which we can infer personality).
Our dataset, the Human Connectome Project resting-state fMRI data (HCP rs-fMRI) makes available over 1000 well assessed healthy adults. With respect to our study, it provided three types of relevant data: (1) substantial high-quality resting-state fMRI (2 sessions per subject on separate days, each consisting of two 15 minute runs, for 1 hour total); (2) personality assessment for each subject (using the NEO-FFI 2); (3) additional basic cognitive assessment (including fluid intelligence and others), as well as demographic information, which can be assessed as potential confounds.
Our primary question was straightforward: given the challenges noted above, is it possible to find evidence that any personality trait can be reliably predicted from fMRI data, using the best available resting-state fMRI dataset together with the best generally used current analysis methods? If the answer to this question is negative, this might suggest that studies to date that have claimed to find associations between resting-state fMRI and personality are false positives (but of course it would still leave open future positive findings, if more sensitive measures are available). If the answer is positive, it would provide an estimate of the effect size that can be expected in future studies; it would provide initial recommendations for data preprocessing, modeling, and statistical treatment; and it would provide a basis for hypothesis-driven investigations that could focus on particular traits and brain regions. As a secondary aim, we wanted to explore the sensitivity of the results to the details of the analysis used and gain some reassurance that any positive findings would be relatively robust with respect to the details of the analysis; we therefore used a few (well established) combinations of inter-subject alignment, preprocessing, and learning models. This is not intended as a systematic, exhaustive foray into all choices that could be made; such an investigation would be extremely valuable, yet is outside the scope of this work.
peer-reviewed) is the author/funder. All rights reserved. No reuse allowed without permission. The copyright holder for this preprint (which was not. http://dx.doi.org/10.1101/215129doi: bioRxiv preprint first posted online Nov. 7, 2017;
Methods
Dataset We used data from a public repository, the 1200 subjects release of the Human Connectome Project (HCP) (Van Essen et al., 2013). The HCP provides MRI data and extensive behavioral assessment from almost 1200 subjects. Acquisition parameters and “minimal” preprocessing of the resting-state fMRI data is described in the original publication (Glasser et al., 2013). Briefly, each subject underwent two sessions of resting-state fMRI on separate days, each session with two separate 15 minute acquisitions generating 1200 volumes (customized Siemens Skyra 3 Tesla MRI scanner, TR = 720 ms, TE = 33 ms, flip angle= 52°, voxel size = 2 mm isotropic, 72 slices, matrix = 104 x 90, FOV = 208 mm x 180 mm, multiband acceleration factor = 8). The two runs acquired on the same day differed in the phase encoding direction, left-right and right-left (which leads to differential signal intensity especially in ventral temporal and frontal structures). The HCP data was downloaded in its minimally preprocessed form, i.e. after motion correction, B0 distortion correction, coregistration to T1-weighted images and normalization to MNI space (the T1w image is registered to MNI space with a FLIRT 12 DOF affine and then a FNIRT nonlinear registration, producing the final nonlinear volume transformation from the subject's native volume space to MNI space).
Personality assessment, and personality factors The 60 item version of the Costa and McCrae Neuroticism/Extraversion/Openness Five
Factor Inventory (NEO-FFI), which has shown excellent reliability and validity (Robert R. McCrae & Costa, 2004), was administered to HCP subjects. This measure was collected as part of the Penn Computerized Cognitive Battery (R. C. Gur et al., 2001; Ruben C. Gur et al., 2010). Note that the NEO-FFI was recently updated (NEO-FFI-3, 2010), but the test administered to the HCP subjects is the older version (NEO-FFI-2, 2004).
The NEO-FFI is a self-report questionnaire -- the abbreviated version of the 240-item Neuroticism / Extraversion / Openness Personality Inventory Revised (NEO-PI-R (Paul T. Costa & McCrae, 1992)). For each item, participants reported their level of agreement on a 5-point Likert scale, from strongly disagree to strongly agree.
The Openness, Conscientiousness, Extraversion, Agreeableness and Neuroticism scores are derived by coding each item’s answer (strongly disagree = 0; disagree = 1; neither agree nor disagree = 2; agree = 3; strongly agree = 4) and then reverse coding appropriate items and summing into subscales. As the item scores are available in the database, we recomputed the Big Five scores with the following item coding published in the NEO-FFI 2 manual, where * denotes reverse coding :
● Openness: (3*, 8*, 13, 18*, 23*, 28, 33*, 38*, 43, 48*, 53, 58) ● Conscientiousness: (5, 10, 15*, 20, 25, 30*, 35, 40, 45*, 50, 55*, 60)
peer-reviewed) is the author/funder. All rights reserved. No reuse allowed without permission. The copyright holder for this preprint (which was not. http://dx.doi.org/10.1101/215129doi: bioRxiv preprint first posted online Nov. 7, 2017;

● Extraversion: (2, 7, 12*, 17, 22, 27*, 32, 37, 42*, 47, 52, 57*) ● Agreeableness: (4, 9*, 14*, 19, 24*, 29*, 34, 39*, 44*, 49, 54*, 59*) ● Neuroticism: (1*, 6, 11, 16*, 21, 26, 31*, 36, 41, 46*, 51, 56 )
We note that the Agreeableness factor score that we calculated was slightly discrepant with the score in the HCP database due to an error in the HCP database in not reverse-coding item 59 at that time (downloaded 06/07/2017). This issue was reported on the HCP listserv (Gray, 2017).
To test the internal consistency of each of the Big Five personality traits in our sample, Cronbach’s alpha was calculated.
Each of the Big Five personality traits can be decomposed into further facets (P. T. Costa Jr & McCrae, 1995), but we did not attempt to predict these facets from our data. Not only does each facet rely on fewer items and thus constitute a noisier measure, which necessarily reduces predictability from neural data (Gignac & Bates, 2017); also, trying to predict many traits leads to a multiple comparison problem which then needs to be accounted for (for an extreme example, see the HCP “MegaTrawl” (S. Smith et al., 2016)).
Despite their theoretical orthogonality, the Big Five are often found to be correlated with one another in typical subject samples. Some authors have suggested that these inter-correlations suggest a higher-order structure, and two superordinate factors have been described in the literature, often referred to as {α / socialization / stability} and {β / personal growth / plasticity} (Blackburn, Renwick, Donnelly, & Logan, 2004; DeYoung, 2006; Digman, 1997). The theoretical basis for the existence of these superordinate factors is highly debated (Robert R. McCrae et al., 2008), and it is not our intention to enter this debate. However, these superordinate factors are less noisy (have lower associated measurement error) than the Big 5, as they are derived from a larger number of test items; this may improve predictability (Gignac & Bates, 2017). Hence, we performed a principal component analysis on the 5 factor scores to extract 2 orthogonal superordinate components, and tested the predictability of these from the HCP rs-fMRI data, in addition to the original five factors.
While we used resting-state fMRI data from two separate sessions (typically collected on consecutive days), there was only a single set of behavioral data available; the NEO-FFI was typically administered on the same day as the second session of resting-state fMRI (Van Essen et al., 2013).
Fluid intelligence assessment An estimate of fluid intelligence is available as the PMAT24_A_CR measure in the HCP
dataset. This proxy for fluid intelligence is based on a short version of Raven’s progressive matrices (24 items) (Bilker et al., 2012); scores are integers indicating number of correct items. We used this fluid intelligence score for two purposes: i) as a benchmark comparison in our predictive analyses, since others have previously reported that this measure of fluid intelligence could be predicted from resting-state fMRI in the HCP dataset (Finn et al., 2015; Noble et al., 2017); ii) as a de-confounding variable (see “Assessment and removal of potential confounds” below). Note that we recently performed a factor analysis of the scores on all cognitive tasks in
peer-reviewed) is the author/funder. All rights reserved. No reuse allowed without permission. The copyright holder for this preprint (which was not. http://dx.doi.org/10.1101/215129doi: bioRxiv preprint first posted online Nov. 7, 2017;

the HCP to derive a more reliable measure of intelligence; this g-factor could be predicted better than the 24-item score from resting-state data (Dubois, Galdi, Paul, & Adolphs, 2018).
Subject selection The total number of subjects in the 1200-subject release of the HCP dataset is N=1206. We applied the following criteria to include/exclude subjects from our analyses (listing in parentheses the HCP database field codes). i) Complete neuropsychological datasets. Subjects must have completed all relevant neuropsychological testing (PMAT_Compl=True, NEO-FFI_Compl=True, Non-TB_Compl=True, VisProc_Compl=True, SCPT_Compl=True, IWRD_Compl=True, VSPLOT_Compl=True) and the Mini Mental Status Exam (MMSE_Compl=True). Any subjects with missing values in any of the tests or test items were discarded. This left us with N = 1183 subjects. ii) Cognitive compromise. We excluded subjects with a score of 26 or below on the MMSE, which could indicate marked cognitive impairment in this highly educated sample of adults under age 40 (Crum, Anthony, Bassett, & Folstein, 1993). This left us with N = 1181 subjects (638 females, 28.8 +/- 3.7 y.o., range 22-37 y.o). Furthermore, iii) subjects must have completed all resting-state fMRI scans (3T_RS-fMRI_PctCompl=100), which leaves us with N = 988 subjects. Finally, iv) we further excluded subjects with a root-mean-squared frame-to-frame head motion estimate (Movement_Relative_RMS.txt) exceeding 0.15mm in any of the 4 resting-state runs (threshold similar to (Finn et al., 2015)). This left us with the final sample of N = 884 subjects (Table S1; 475 females, 28.6 +/- 3.7 y.o., range 22-36 y.o.) for predictive analyses based on resting-state data.
Assessment and removal of potential confounds We computed the correlation of each of the personality factors with gender (Gender),
age (Age_in_Yrs, restricted), handedness (Handedness, restricted) and fluid intelligence (PMAT24_A_CR). We also looked for differences in personality in our subject sample with other variables that are likely to affect FC matrices, such as brain size (we used FS_BrainSeg_Vol), motion (we computed the sum of framewise displacement in each run), and the multiband reconstruction algorithm which changed in the third quarter of HCP data collection (fMRI_3T_ReconVrs). Correlations are shown in Figure 2a below. We then used multiple linear regression to regress these variables from each of the personality scores and remove their confounding effects.
Note that we do not control for differences in cortical thickness and other morphometric features, which have been reported to be correlated with personality factors (e.g. (Riccelli et al., 2017)). These likely interact with FC measures and should eventually be accounted for in a full model, yet this was deemed outside the scope of the present study.
The five personality factors are intercorrelated to some degree (see Results, Figure 2a). We did not orthogonalize them-- consequently predictability would be expected also to correlate slightly among personality factors.
peer-reviewed) is the author/funder. All rights reserved. No reuse allowed without permission. The copyright holder for this preprint (which was not. http://dx.doi.org/10.1101/215129doi: bioRxiv preprint first posted online Nov. 7, 2017;
It could be argued that controlling for variables such as gender and fluid intelligence risks producing a conservative, but perhaps overly pessimistic picture. Indeed, there are well established gender differences in personality (Feingold, 1994; Schmitt, Realo, Voracek, & Allik, 2008), which might well be based on gender differences in functional connectivity (similar arguments can be made with respect to age (Allemand, Zimprich, & Hendriks, 2008; Soto, John, Gosling, & Potter, 2011) and fluid intelligence (Chamorro-Premuzic & Furnham, 2004; Rammstedt, Danner, & Martin, 2016)). Since the causal primacy of these variables with respect to personality is unknown, it is possible that regressing out sex and age could regress out substantial meaningful information about personality. We therefore also report supplemental results with a less conservative de-confounding procedure -- only regressing out obvious confounds which are not plausibly related to personality, but which would plausibly influence functional connectivity data: image reconstruction algorithm, framewise displacement, and brain size measures.
Data preprocessing Resting-state data must be preprocessed beyond “minimal preprocessing”, due to the
presence of multiple noise components, such as subject motion and physiological fluctuations. Several approaches have been proposed to remove these noise components and clean the data, however the community has not yet reached a consensus on the “best” denoising pipeline for resting-state fMRI data (Caballero-Gaudes & Reynolds, 2016; Ciric et al., 2017; Murphy & Fox, 2017; Siegel et al., 2016). Most of the steps taken to denoise resting-state data have limitations, and it is unlikely that there is a set of denoising steps that can completely remove noise without also discarding some of the signal of interest. Categories of denoising operations that have been proposed comprise tissue regression, motion regression, noise component regression, temporal filtering and volume censoring. Each of these categories may be implemented in several ways. There exist several excellent reviews of the pros and cons of various denoising steps (Caballero-Gaudes & Reynolds, 2016; T. T. Liu, 2016; Murphy, Birn, & Bandettini, 2013; J. D. Power et al., 2014).
Here, instead of picking a single denoising strategy combining steps used in the previous literature, we set out to explore three reasonable alternatives, which we refer to as A, B, and C (Figure 1c). To easily apply these preprocessing strategies in a single framework, using input data that is either volumetric or surface-based, we developed an in-house, Python (v2.7.14)-based pipeline (mostly based on open source libraries and frameworks for scientific computing, including SciPy (v0.19.0), Numpy (v1.11.3), NiLearn (v0.2.6), NiBabel (v2.1.0), Scikit-learn (v0.18.1) (Abraham et al., 2014; K. Gorgolewski et al., 2011; K. J. Gorgolewski et al., 2017; Pedregosa et al., 2011; Walt, Colbert, & Varoquaux, 2011)) implementing the most common denoising steps described in previous literature.
Pipeline A reproduces as closely as possible the strategy described in (Finn et al., 2015) and consists of seven consecutive steps: 1) the signal at each voxel is z-score normalized; 2) using tissue masks, temporal drifts from cerebrospinal fluid (CSF) and white matter (WM) are removed with third-degree Legendre polynomial regressors; 3) the mean signals of CSF and WM are computed and regressed from gray matter voxels; 4) translational
peer-reviewed) is the author/funder. All rights reserved. No reuse allowed without permission. The copyright holder for this preprint (which was not. http://dx.doi.org/10.1101/215129doi: bioRxiv preprint first posted online Nov. 7, 2017;

and rotational realignment parameters and their temporal derivatives are used as explanatory variables in motion regression; 5) signals are low-pass filtered with a Gaussian kernel with a standard deviation of 1 TR, i.e. 720ms in the HCP dataset; 6) the temporal drift from gray matter signal is removed using a third-degree Legendre polynomial regressor; 7) global signal regression is performed.
Pipeline B, described in (Ciric et al., 2017; Satterthwaite, Wolf, et al., 2013), is composed of four steps in our implementation: 1) normalization at voxel-level is performed by subtracting the mean from each voxel’s time series; 2) linear and quadratic trends are removed with polynomial regressors; 3) temporal filtering is performed with a first order Butterworth filter with a passband between 0.01 and 0.08 Hz (after linearly interpolating volumes to be censored, cf. step 4); 4) tissue regression (CSF and WM signals with their derivatives and quadratic terms), motion regression (realignment parameters with their derivatives, quadratic terms and square of derivatives), global signal regression (whole brain signal with derivative and quadratic term), and censoring of volumes with a root-mean-squared (RMS) displacement that exceeded 0.25 mm are combined in a single regression model.
Pipeline C, inspired by (Siegel et al., 2016), is implemented as follows: 1) an automated independent component (IC)-based denoising was performed with ICA-FIX (Salimi-Khorshidi et al., 2014). Instead of running ICA-FIX ourselves, we downloaded the FIX-denoised data which is available from the HCP database; 2) voxel signals were demeaned and 3) detrended with a first degree polynomial; 4) CompCor, a PCA-based method proposed by (Behzadi, Restom, Liau, & Liu, 2007) was applied to derive 5 components from CSF and WM signals; these were regressed out of the data, together with gray matter and whole-brain mean signals; volumes with a framewise displacement greater than 0.25 mm or a variance of differentiated signal (DVARS) greater than 105% of the run median DVARS were discarded as well; 5) temporal filtering was performed with a first-order Butterworth band-pass filter between 0.01 and 0.08 Hz, after linearly interpolating censored volumes.
Inter-subject alignment, parcellation, and functional connectivity matrix generation
An important choice in processing fMRI data is how to align subjects in the first place. The most common approach is to warp individual brains to a common volumetric template, typically MNI152. However, cortex is a 2D structure; hence, surface-based algorithms that rely on cortical folding to map individual brains to a template may be a better approach. Yet another improvement in aligning subjects may come from using functional information alongside anatomical information - this is what the multimodal surface matching (MSM) framework achieves (Robinson et al., 2014). MSM-All aligned data, in which intersubject registration uses individual cortical folding, myelin maps, and resting-state fMRI correlation data, is available for download from the HCP database.
Our prediction analyses below are based on functional connectivity matrices. While voxel- (or vertex-) wise functional connectivity matrices can be derived, their dimensionality is too high compared to the number of examples in the context of a machine-learning based
peer-reviewed) is the author/funder. All rights reserved. No reuse allowed without permission. The copyright holder for this preprint (which was not. http://dx.doi.org/10.1101/215129doi: bioRxiv preprint first posted online Nov. 7, 2017;
predictive approach. PCA or other dimensionality reduction applied to the voxelwise data can be used, but this often comes at the cost of losing neuroanatomical specificity. Hence, we work with the most common type of data: parcellated data, in which data from many voxels (or vertices) is aggregated anatomically and the signal within a parcel is averaged over its constituent voxels. Choosing a parcellation scheme is the first step in a network analysis of the brain (Sporns, 2013), yet once again there is no consensus on the “best” parcellation. There are two main approaches to defining network nodes in the brain: nodes may be a set of overlapping, weighted masks, e.g. obtained using independent component analysis (ICA) of BOLD fMRI data (S. M. Smith et al., 2013); or a set of discrete, non-overlapping binary masks, also known as a hard parcellation (Glasser, Coalson, et al., 2016; Gordon et al., 2014). We chose to work with a hard parcellation, which we find easier to interpret.
Here we present results based on a classical volumetric alignment, together with a volumetric parcellation of the brain into 268 nodes (Finn et al., 2015; X. Shen, Tokoglu, Papademetris, & Constable, 2013); and, for comparison, results based on MSM-All data, together with a parcellation that was specifically derived from this data (Glasser, Coalson, et al., 2016) (Figure 1d).
Timeseries extraction simply consisted in averaging data from voxels (or grayordinates) within each parcel, and matrix generation in pairwise correlating parcel time series (Pearson correlation coefficient). FC matrices were averaged across runs (all averaging used Fisher-z transforms) acquired with left-right and right-left phase encoding in each session, i.e. we derived two FC matrices per subject, one for REST1 (from REST1_LR and REST1_RL) and one for REST2 (from REST2_LR and REST2_RL); we also derived a FC matrix averaged across all runs (REST12).
Test-retest comparisons We applied all three denoising pipelines to the data of all subjects. We then compared
the functional connectivity (FC) matrices produced by each of these strategies, using several metrics. One metric that we used follows from the connectome fingerprinting work of (Finn et al., 2015), and was recently labeled the identification success rate (ISR) (Noble et al., 2017). Identification of subject S is successful if, out of all subjects’ FC matrices derived from REST2, subject S’s is the most highly correlated with subject S’s FC matrix from REST1 (identification can also be performed from REST2 to REST1; results are very similar). The ISR gives an estimate of the reliability and specificity of the entire FC matrix at the individual subject level, and is influenced both by within-subject test-retest reliability as well as by discriminability amongst all subjects in the sample. Relatedly, it is desirable to have similarities (and differences) between all subjects be relatively stable across repeated testing sessions. Following an approach introduced in (Geerligs, Rubinov, Cam-Can, & Henson, 2015), we computed the pairwise similarity between subjects separately for session 1 and session 2, constructing a Nsubjects×Nsubjects matrix for each session. We then compared these matrices using a simple Pearson correlation. Finally, we used a metric targeted at behavioral utility, and inspired by (Geerligs, Rubinov, et al., 2015): for each edge (the correlation value between a given pair of brain parcels) in the FC matrix, we computed its correlation with a stable trait
peer-reviewed) is the author/funder. All rights reserved. No reuse allowed without permission. The copyright holder for this preprint (which was not. http://dx.doi.org/10.1101/215129doi: bioRxiv preprint first posted online Nov. 7, 2017;
across subjects, and built a matrix representing the relationship of each edge to this trait, separately for session 1 and session 2. We then compared these matrices using a simple Pearson correlation. The more edges reliably correlate with the stable trait, the higher the correlation between session 1 and session 2 matrices. It should be noted that trait stability is an untested assumption with this approach, because in fact only a single trait score was available in the HCP, collected at the time of session 2. We performed this analysis for the measure of fluid intelligence available in the HCP (PMAT24_A_CR) as well as all Big Five personality factors.
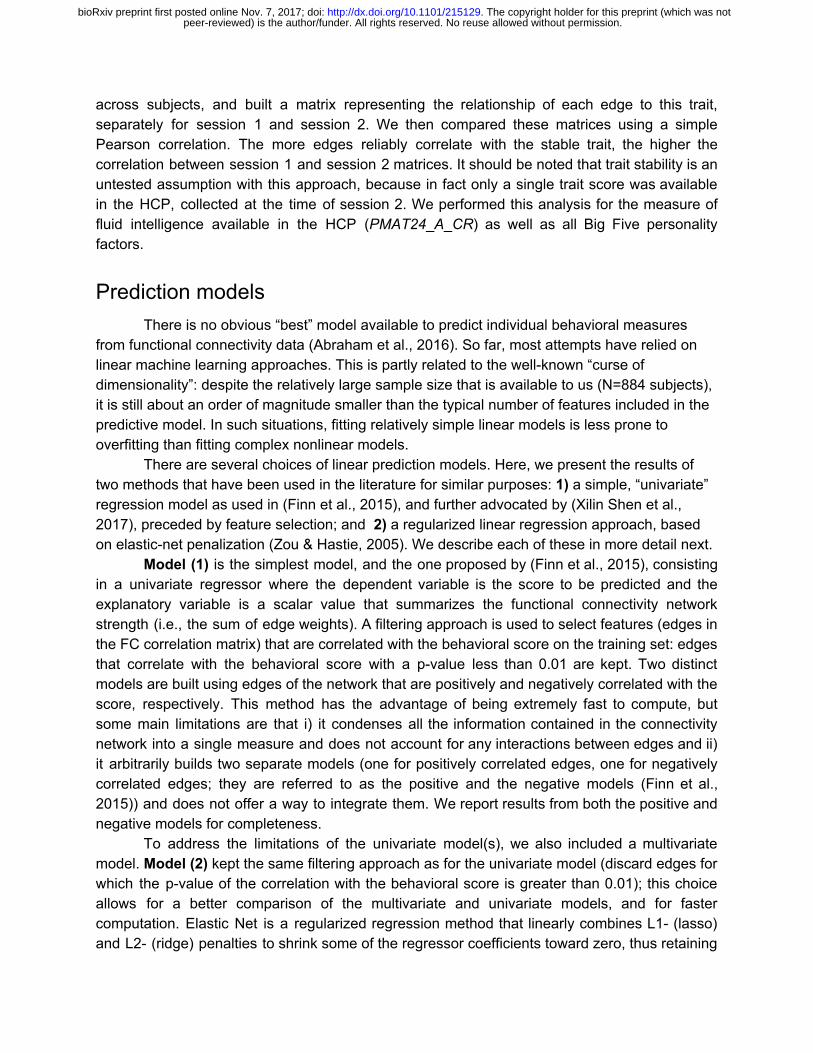
Prediction models There is no obvious “best” model available to predict individual behavioral measures
from functional connectivity data (Abraham et al., 2016). So far, most attempts have relied on linear machine learning approaches. This is partly related to the well-known “curse of dimensionality”: despite the relatively large sample size that is available to us (N=884 subjects), it is still about an order of magnitude smaller than the typical number of features included in the predictive model. In such situations, fitting relatively simple linear models is less prone to overfitting than fitting complex nonlinear models.
There are several choices of linear prediction models. Here, we present the results of two methods that have been used in the literature for similar purposes: 1) a simple, “univariate” regression model as used in (Finn et al., 2015), and further advocated by (Xilin Shen et al., 2017), preceded by feature selection; and 2) a regularized linear regression approach, based on elastic-net penalization (Zou & Hastie, 2005). We describe each of these in more detail next.
Model (1) is the simplest model, and the one proposed by (Finn et al., 2015), consisting in a univariate regressor where the dependent variable is the score to be predicted and the explanatory variable is a scalar value that summarizes the functional connectivity network strength (i.e., the sum of edge weights). A filtering approach is used to select features (edges in the FC correlation matrix) that are correlated with the behavioral score on the training set: edges that correlate with the behavioral score with a p-value less than 0.01 are kept. Two distinct models are built using edges of the network that are positively and negatively correlated with the score, respectively. This method has the advantage of being extremely fast to compute, but some main limitations are that i) it condenses all the information contained in the connectivity network into a single measure and does not account for any interactions between edges and ii) it arbitrarily builds two separate models (one for positively correlated edges, one for negatively correlated edges; they are referred to as the positive and the negative models (Finn et al., 2015)) and does not offer a way to integrate them. We report results from both the positive and negative models for completeness.
To address the limitations of the univariate model(s), we also included a multivariate model. Model (2) kept the same filtering approach as for the univariate model (discard edges for which the p-value of the correlation with the behavioral score is greater than 0.01); this choice allows for a better comparison of the multivariate and univariate models, and for faster computation. Elastic Net is a regularized regression method that linearly combines L1- (lasso) and L2- (ridge) penalties to shrink some of the regressor coefficients toward zero, thus retaining
peer-reviewed) is the author/funder. All rights reserved. No reuse allowed without permission. The copyright holder for this preprint (which was not. http://dx.doi.org/10.1101/215129doi: bioRxiv preprint first posted online Nov. 7, 2017;

just a subset of features. The lasso model performs continuous shrinkage and automatic variable selection simultaneously, but in the presence of a group of highly correlated features, it tends to arbitrarily select one feature from the group. With high-dimensional data and few examples, the ridge model has been shown to outperform lasso; yet it cannot produce a sparse model since all the predictors are retained. Combining the two approaches, elastic net is able to do variable selection and coefficient shrinkage while retaining groups of correlated variables. Here however, based on preliminary experiments and on the fact that it is unlikely that just a few edges contribute to prediction, we fixed the L1 ratio (which weights the L1- and L2- regularizations) to 0.01, which amounts to almost pure ridge regression. We used 3-fold nested cross-validation (with balanced “classes”, based on a partitioning of the training data into quartiles) to choose the alpha parameter (among 50 possible values) that weighs the penalty term.
Cross-validation scheme In the HCP dataset, several subjects are genetically related (in our final subject sample,
there were 410 unique families). To avoid biasing the results due to this family structure (e.g., perhaps having a sibling in the training set would facilitate prediction for a test subject), we implemented a leave-one-family-out cross-validation scheme for all predictive analyses.
Statistical assessment of predictions Several measures can be used to assess the quality of prediction. A typical approach is
to plot observed vs. predicted values (rather than predicted vs. observed (Piñeiro, Perelman, Guerschman, & Paruelo, 2008)). The Pearson correlation coefficient between observed scores and predicted scores is often reported as a measure of prediction (e.g. (Finn et al., 2015)), given its clear graphical interpretation. However, in the context of cross-validation, it is incorrect to square this correlation coefficient to obtain the coefficient of determination R2, which is often taken to reflect the proportion of variance explained by the model (Alexander, Tropsha, & Winkler, 2015); instead, the coefficient of determination R2 should be calculated as:
(1)1 R2 = − ∑n
i = 1( y − y )i i
2
∑n
i = 1( y − y )i
︿
i2
where n is the number of observations (subjects), y is the observed response variable, y̅ is its mean, and ŷ is the corresponding predicted value. Equation (1) therefore measures the size of the residuals from the model compared with the size of the residuals for a null model where all of the predictions are the same, i.e., the mean value y̅. In a cross-validated prediction context, R2 can actually take negative values (in cases when the denominator is larger than the numerator, i.e. when the sum of squared errors is larger than that of the null model)! Yet another, related statistic to evaluate prediction outcome is the Root Mean Square Deviation (RMSD), defined in (Piñeiro et al., 2008) as:
peer-reviewed) is the author/funder. All rights reserved. No reuse allowed without permission. The copyright holder for this preprint (which was not. http://dx.doi.org/10.1101/215129doi: bioRxiv preprint first posted online Nov. 7, 2017;
(2)MSD R = √ 1n − 1 ∑
n
i = 1( y y )i −
︿
i2
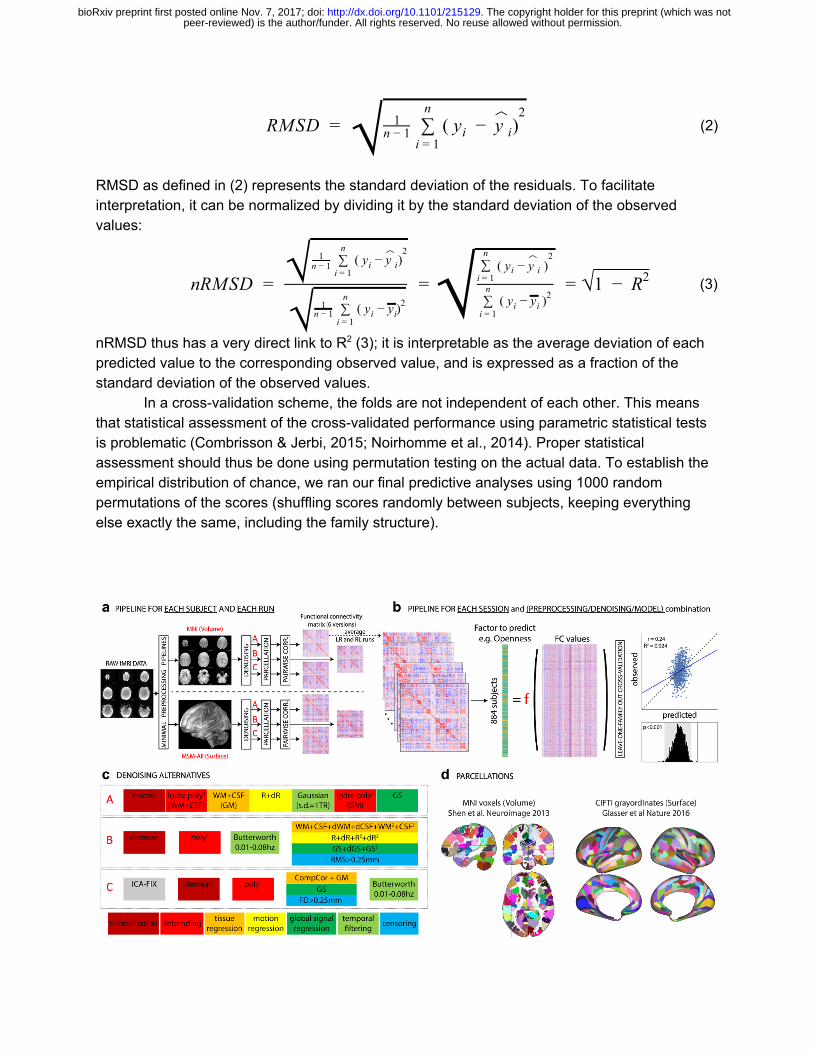
RMSD as defined in (2) represents the standard deviation of the residuals. To facilitate interpretation, it can be normalized by dividing it by the standard deviation of the observed values:
(3)RMSD n =
√ 1n − 1 ∑
n
i = 1( y − y )i i
2
√ 1n − 1 ∑
n
i = 1( y − y )i
︿
i2
=√ ∑n
i = 1( y − y )i i
2
∑n
i = 1( y − y )i
︿
i2
= √1 R− 2
nRMSD thus has a very direct link to R2 (3); it is interpretable as the average deviation of each predicted value to the corresponding observed value, and is expressed as a fraction of the standard deviation of the observed values.
In a cross-validation scheme, the folds are not independent of each other. This means that statistical assessment of the cross-validated performance using parametric statistical tests is problematic (Combrisson & Jerbi, 2015; Noirhomme et al., 2014). Proper statistical assessment should thus be done using permutation testing on the actual data. To establish the empirical distribution of chance, we ran our final predictive analyses using 1000 random permutations of the scores (shuffling scores randomly between subjects, keeping everything else exactly the same, including the family structure).
peer-reviewed) is the author/funder. All rights reserved. No reuse allowed without permission. The copyright holder for this preprint (which was not. http://dx.doi.org/10.1101/215129doi: bioRxiv preprint first posted online Nov. 7, 2017;
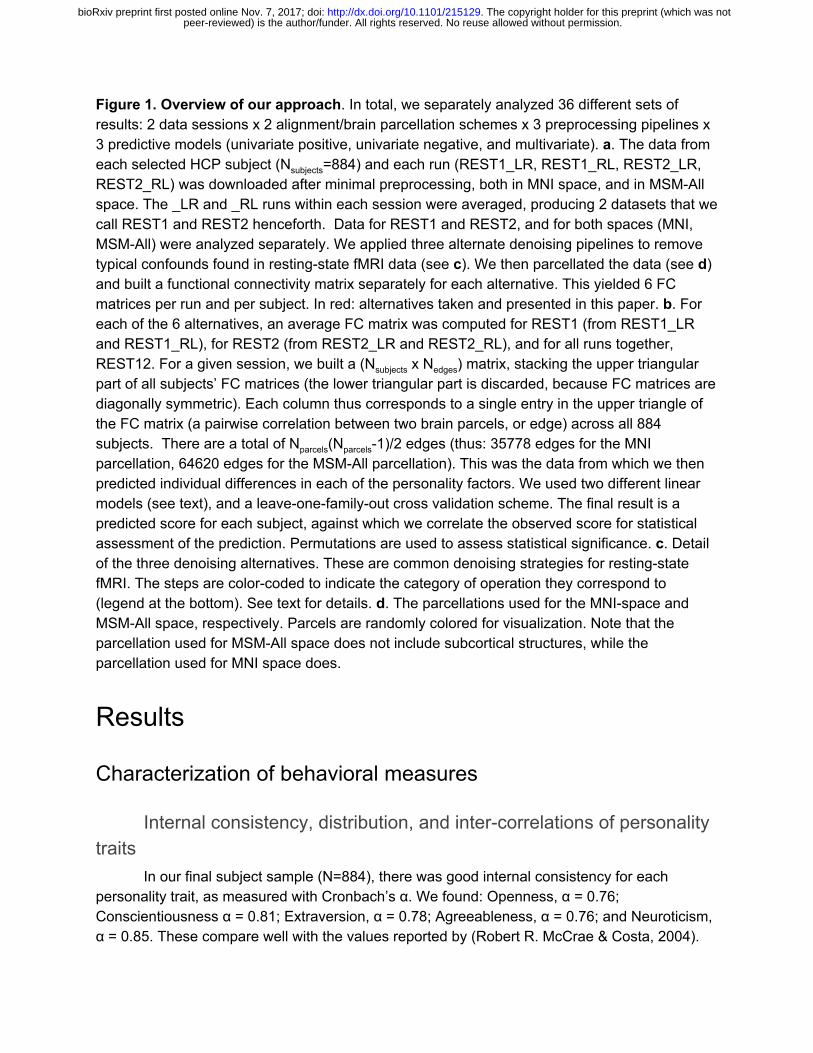
Figure 1. Overview of our approach. In total, we separately analyzed 36 different sets of results: 2 data sessions x 2 alignment/brain parcellation schemes x 3 preprocessing pipelines x 3 predictive models (univariate positive, univariate negative, and multivariate). a. The data from each selected HCP subject (Nsubjects=884) and each run (REST1_LR, REST1_RL, REST2_LR, REST2_RL) was downloaded after minimal preprocessing, both in MNI space, and in MSM-All space. The _LR and _RL runs within each session were averaged, producing 2 datasets that we call REST1 and REST2 henceforth. Data for REST1 and REST2, and for both spaces (MNI, MSM-All) were analyzed separately. We applied three alternate denoising pipelines to remove typical confounds found in resting-state fMRI data (see c). We then parcellated the data (see d) and built a functional connectivity matrix separately for each alternative. This yielded 6 FC matrices per run and per subject. In red: alternatives taken and presented in this paper. b. For each of the 6 alternatives, an average FC matrix was computed for REST1 (from REST1_LR and REST1_RL), for REST2 (from REST2_LR and REST2_RL), and for all runs together, REST12. For a given session, we built a (Nsubjects x Nedges) matrix, stacking the upper triangular part of all subjects’ FC matrices (the lower triangular part is discarded, because FC matrices are diagonally symmetric). Each column thus corresponds to a single entry in the upper triangle of the FC matrix (a pairwise correlation between two brain parcels, or edge) across all 884 subjects. There are a total of Nparcels(Nparcels-1)/2 edges (thus: 35778 edges for the MNI parcellation, 64620 edges for the MSM-All parcellation). This was the data from which we then predicted individual differences in each of the personality factors. We used two different linear models (see text), and a leave-one-family-out cross validation scheme. The final result is a predicted score for each subject, against which we correlate the observed score for statistical assessment of the prediction. Permutations are used to assess statistical significance. c. Detail of the three denoising alternatives. These are common denoising strategies for resting-state fMRI. The steps are color-coded to indicate the category of operation they correspond to (legend at the bottom). See text for details. d. The parcellations used for the MNI-space and MSM-All space, respectively. Parcels are randomly colored for visualization. Note that the parcellation used for MSM-All space does not include subcortical structures, while the parcellation used for MNI space does.
Results
Characterization of behavioral measures
Internal consistency, distribution, and inter-correlations of personality traits
In our final subject sample (N=884), there was good internal consistency for each personality trait, as measured with Cronbach’s α. We found: Openness, α = 0.76; Conscientiousness α = 0.81; Extraversion, α = 0.78; Agreeableness, α = 0.76; and Neuroticism, α = 0.85. These compare well with the values reported by (Robert R. McCrae & Costa, 2004).
peer-reviewed) is the author/funder. All rights reserved. No reuse allowed without permission. The copyright holder for this preprint (which was not. http://dx.doi.org/10.1101/215129doi: bioRxiv preprint first posted online Nov. 7, 2017;
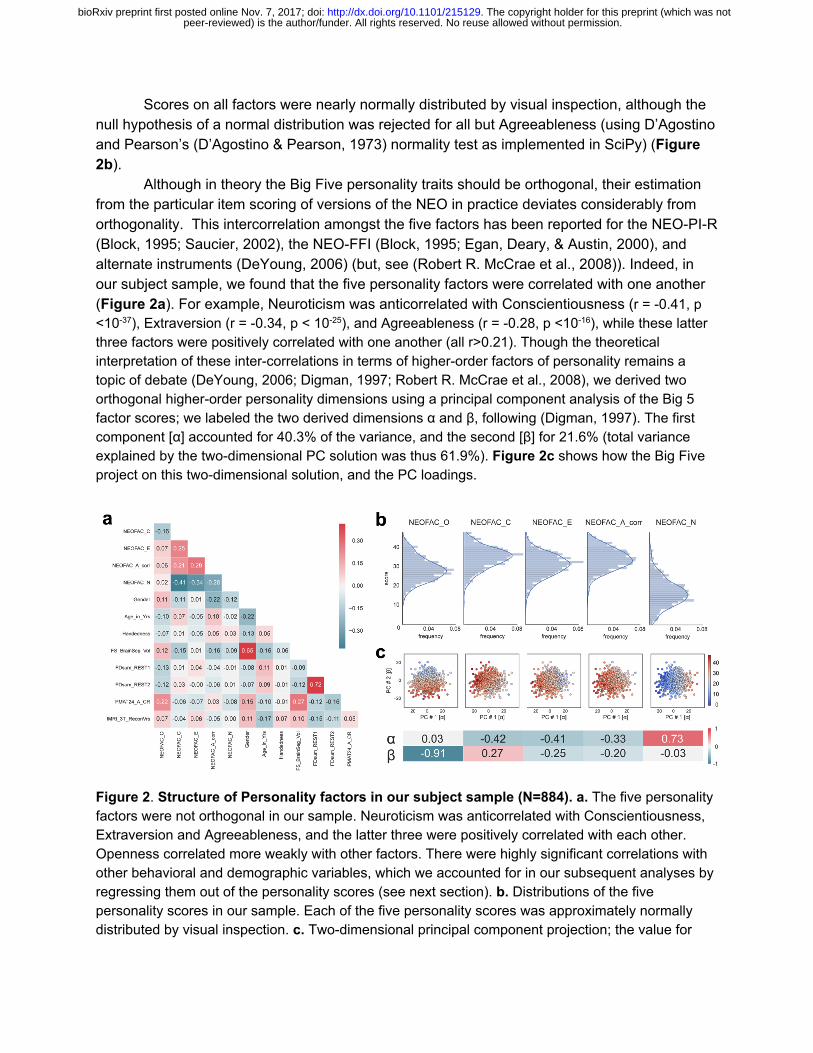
Scores on all factors were nearly normally distributed by visual inspection, although the null hypothesis of a normal distribution was rejected for all but Agreeableness (using D’Agostino and Pearson’s (D’Agostino & Pearson, 1973) normality test as implemented in SciPy) (Figure 2b).
Although in theory the Big Five personality traits should be orthogonal, their estimation from the particular item scoring of versions of the NEO in practice deviates considerably from orthogonality. This intercorrelation amongst the five factors has been reported for the NEO-PI-R (Block, 1995; Saucier, 2002), the NEO-FFI (Block, 1995; Egan, Deary, & Austin, 2000), and alternate instruments (DeYoung, 2006) (but, see (Robert R. McCrae et al., 2008)). Indeed, in our subject sample, we found that the five personality factors were correlated with one another (Figure 2a). For example, Neuroticism was anticorrelated with Conscientiousness (r = -0.41, p <10 -37), Extraversion (r = -0.34, p < 10-25), and Agreeableness (r = -0.28, p <10-16), while these latter three factors were positively correlated with one another (all r>0.21). Though the theoretical interpretation of these inter-correlations in terms of higher-order factors of personality remains a topic of debate (DeYoung, 2006; Digman, 1997; Robert R. McCrae et al., 2008), we derived two orthogonal higher-order personality dimensions using a principal component analysis of the Big 5 factor scores; we labeled the two derived dimensions α and β, following (Digman, 1997). The first component [α] accounted for 40.3% of the variance, and the second [β] for 21.6% (total variance explained by the two-dimensional PC solution was thus 61.9%). Figure 2c shows how the Big Five project on this two-dimensional solution, and the PC loadings.
Figure 2. Structure of Personality factors in our subject sample (N=884). a. The five personality factors were not orthogonal in our sample. Neuroticism was anticorrelated with Conscientiousness, Extraversion and Agreeableness, and the latter three were positively correlated with each other. Openness correlated more weakly with other factors. There were highly significant correlations with other behavioral and demographic variables, which we accounted for in our subsequent analyses by regressing them out of the personality scores (see next section). b. Distributions of the five personality scores in our sample. Each of the five personality scores was approximately normally distributed by visual inspection. c. Two-dimensional principal component projection; the value for
peer-reviewed) is the author/funder. All rights reserved. No reuse allowed without permission. The copyright holder for this preprint (which was not. http://dx.doi.org/10.1101/215129doi: bioRxiv preprint first posted online Nov. 7, 2017;
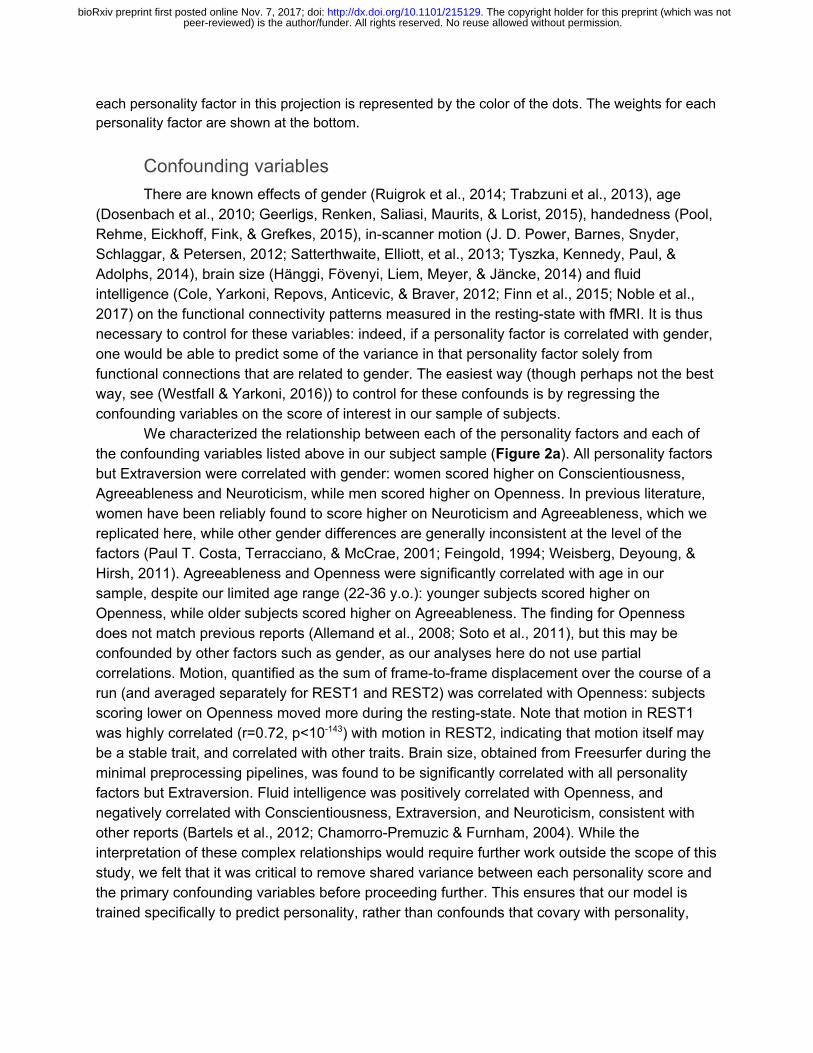
each personality factor in this projection is represented by the color of the dots. The weights for each personality factor are shown at the bottom.
Confounding variables There are known effects of gender (Ruigrok et al., 2014; Trabzuni et al., 2013), age
(Dosenbach et al., 2010; Geerligs, Renken, Saliasi, Maurits, & Lorist, 2015), handedness (Pool, Rehme, Eickhoff, Fink, & Grefkes, 2015), in-scanner motion (J. D. Power, Barnes, Snyder, Schlaggar, & Petersen, 2012; Satterthwaite, Elliott, et al., 2013; Tyszka, Kennedy, Paul, & Adolphs, 2014), brain size (Hänggi, Fövenyi, Liem, Meyer, & Jäncke, 2014) and fluid intelligence (Cole, Yarkoni, Repovs, Anticevic, & Braver, 2012; Finn et al., 2015; Noble et al., 2017) on the functional connectivity patterns measured in the resting-state with fMRI. It is thus necessary to control for these variables: indeed, if a personality factor is correlated with gender, one would be able to predict some of the variance in that personality factor solely from functional connections that are related to gender. The easiest way (though perhaps not the best way, see (Westfall & Yarkoni, 2016)) to control for these confounds is by regressing the confounding variables on the score of interest in our sample of subjects.
We characterized the relationship between each of the personality factors and each of the confounding variables listed above in our subject sample (Figure 2a). All personality factors but Extraversion were correlated with gender: women scored higher on Conscientiousness, Agreeableness and Neuroticism, while men scored higher on Openness. In previous literature, women have been reliably found to score higher on Neuroticism and Agreeableness, which we replicated here, while other gender differences are generally inconsistent at the level of the factors (Paul T. Costa, Terracciano, & McCrae, 2001; Feingold, 1994; Weisberg, Deyoung, & Hirsh, 2011). Agreeableness and Openness were significantly correlated with age in our sample, despite our limited age range (22-36 y.o.): younger subjects scored higher on Openness, while older subjects scored higher on Agreeableness. The finding for Openness does not match previous reports (Allemand et al., 2008; Soto et al., 2011), but this may be confounded by other factors such as gender, as our analyses here do not use partial correlations. Motion, quantified as the sum of frame-to-frame displacement over the course of a run (and averaged separately for REST1 and REST2) was correlated with Openness: subjects scoring lower on Openness moved more during the resting-state. Note that motion in REST1 was highly correlated (r=0.72, p<10 -143) with motion in REST2, indicating that motion itself may be a stable trait, and correlated with other traits. Brain size, obtained from Freesurfer during the minimal preprocessing pipelines, was found to be significantly correlated with all personality factors but Extraversion. Fluid intelligence was positively correlated with Openness, and negatively correlated with Conscientiousness, Extraversion, and Neuroticism, consistent with other reports (Bartels et al., 2012; Chamorro-Premuzic & Furnham, 2004). While the interpretation of these complex relationships would require further work outside the scope of this study, we felt that it was critical to remove shared variance between each personality score and the primary confounding variables before proceeding further. This ensures that our model is trained specifically to predict personality, rather than confounds that covary with personality,
peer-reviewed) is the author/funder. All rights reserved. No reuse allowed without permission. The copyright holder for this preprint (which was not. http://dx.doi.org/10.1101/215129doi: bioRxiv preprint first posted online Nov. 7, 2017;
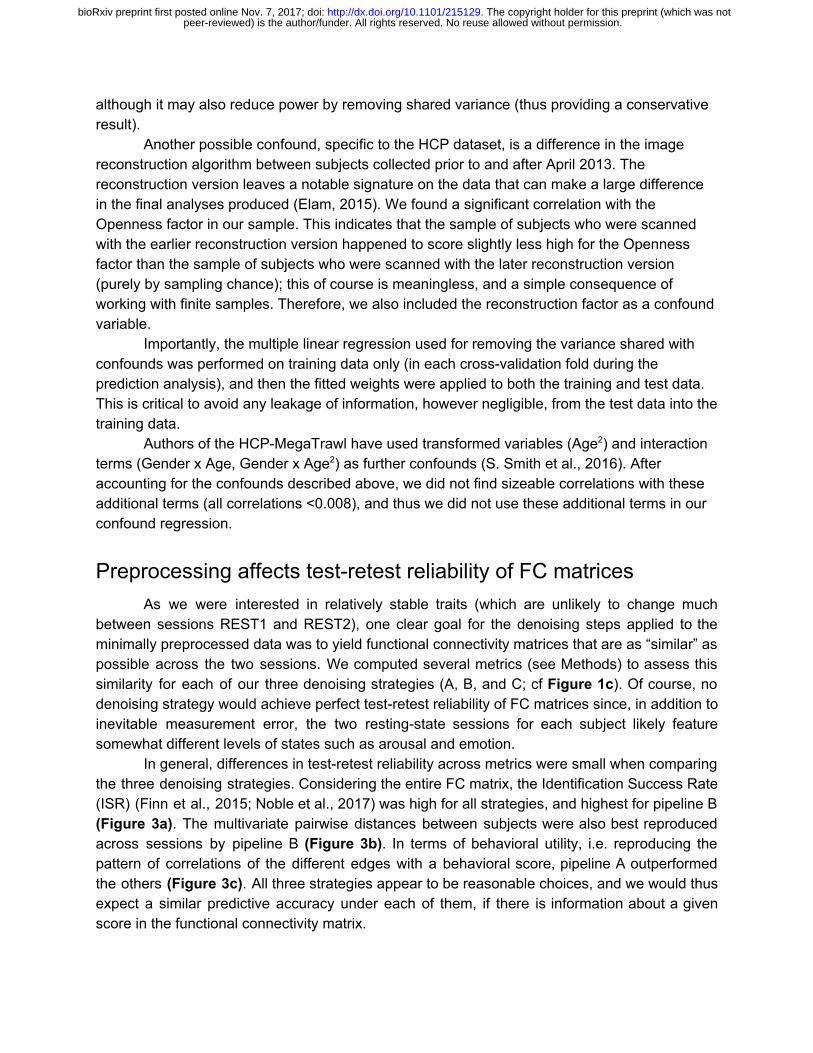
although it may also reduce power by removing shared variance (thus providing a conservative result).
Another possible confound, specific to the HCP dataset, is a difference in the image reconstruction algorithm between subjects collected prior to and after April 2013. The reconstruction version leaves a notable signature on the data that can make a large difference in the final analyses produced (Elam, 2015). We found a significant correlation with the Openness factor in our sample. This indicates that the sample of subjects who were scanned with the earlier reconstruction version happened to score slightly less high for the Openness factor than the sample of subjects who were scanned with the later reconstruction version (purely by sampling chance); this of course is meaningless, and a simple consequence of working with finite samples. Therefore, we also included the reconstruction factor as a confound variable.
Importantly, the multiple linear regression used for removing the variance shared with confounds was performed on training data only (in each cross-validation fold during the prediction analysis), and then the fitted weights were applied to both the training and test data. This is critical to avoid any leakage of information, however negligible, from the test data into the training data.
Authors of the HCP-MegaTrawl have used transformed variables (Age 2) and interaction terms (Gender x Age, Gender x Age 2) as further confounds (S. Smith et al., 2016). After accounting for the confounds described above, we did not find sizeable correlations with these additional terms (all correlations <0.008), and thus we did not use these additional terms in our confound regression.
Preprocessing affects test-retest reliability of FC matrices As we were interested in relatively stable traits (which are unlikely to change much
between sessions REST1 and REST2), one clear goal for the denoising steps applied to the minimally preprocessed data was to yield functional connectivity matrices that are as “similar” as possible across the two sessions. We computed several metrics (see Methods) to assess this similarity for each of our three denoising strategies (A, B, and C; cf Figure 1c). Of course, no denoising strategy would achieve perfect test-retest reliability of FC matrices since, in addition to inevitable measurement error, the two resting-state sessions for each subject likely feature somewhat different levels of states such as arousal and emotion.
In general, differences in test-retest reliability across metrics were small when comparing the three denoising strategies. Considering the entire FC matrix, the Identification Success Rate (ISR) (Finn et al., 2015; Noble et al., 2017) was high for all strategies, and highest for pipeline B (Figure 3a). The multivariate pairwise distances between subjects were also best reproduced across sessions by pipeline B (Figure 3b). In terms of behavioral utility, i.e. reproducing the pattern of correlations of the different edges with a behavioral score, pipeline A outperformed the others (Figure 3c). All three strategies appear to be reasonable choices, and we would thus expect a similar predictive accuracy under each of them, if there is information about a given score in the functional connectivity matrix.
peer-reviewed) is the author/funder. All rights reserved. No reuse allowed without permission. The copyright holder for this preprint (which was not. http://dx.doi.org/10.1101/215129doi: bioRxiv preprint first posted online Nov. 7, 2017;
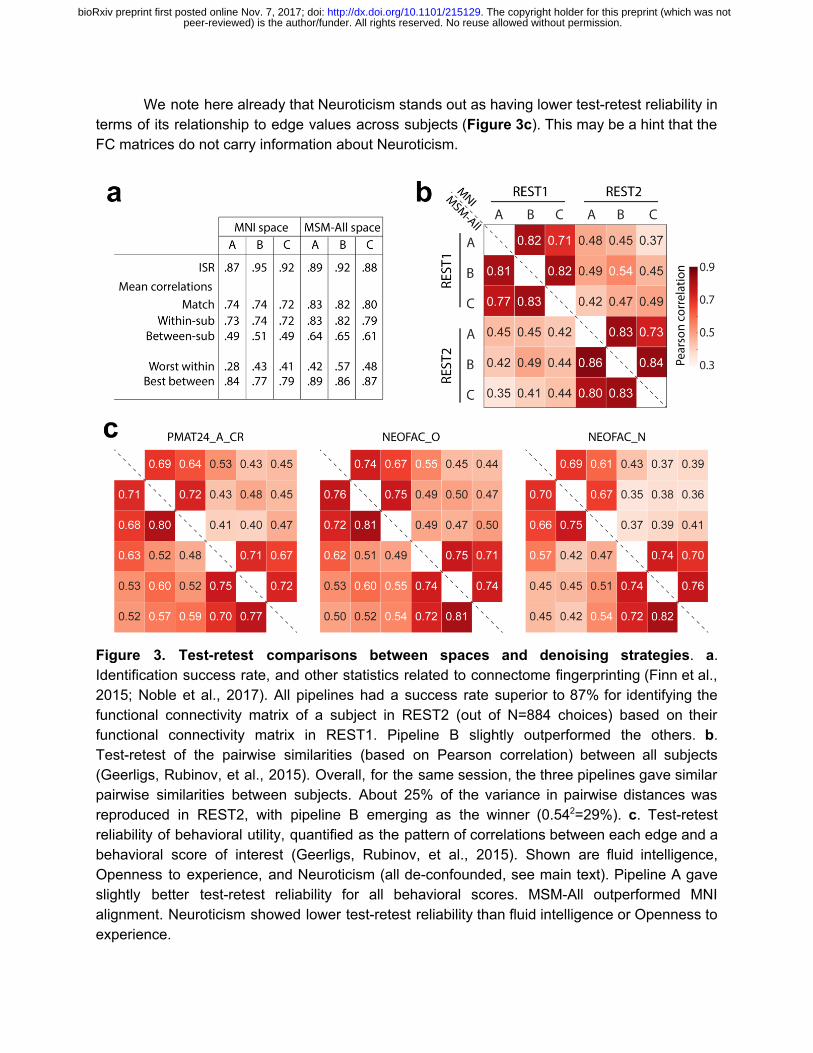
We note here already that Neuroticism stands out as having lower test-retest reliability in terms of its relationship to edge values across subjects (Figure 3c). This may be a hint that the FC matrices do not carry information about Neuroticism.
Figure 3. Test-retest comparisons between spaces and denoising strategies. a. Identification success rate, and other statistics related to connectome fingerprinting (Finn et al., 2015; Noble et al., 2017). All pipelines had a success rate superior to 87% for identifying the functional connectivity matrix of a subject in REST2 (out of N=884 choices) based on their functional connectivity matrix in REST1. Pipeline B slightly outperformed the others. b. Test-retest of the pairwise similarities (based on Pearson correlation) between all subjects (Geerligs, Rubinov, et al., 2015). Overall, for the same session, the three pipelines gave similar pairwise similarities between subjects. About 25% of the variance in pairwise distances was reproduced in REST2, with pipeline B emerging as the winner (0.54 2=29%). c. Test-retest reliability of behavioral utility, quantified as the pattern of correlations between each edge and a behavioral score of interest (Geerligs, Rubinov, et al., 2015). Shown are fluid intelligence, Openness to experience, and Neuroticism (all de-confounded, see main text). Pipeline A gave slightly better test-retest reliability for all behavioral scores. MSM-All outperformed MNI alignment. Neuroticism showed lower test-retest reliability than fluid intelligence or Openness to experience.
peer-reviewed) is the author/funder. All rights reserved. No reuse allowed without permission. The copyright holder for this preprint (which was not. http://dx.doi.org/10.1101/215129doi: bioRxiv preprint first posted online Nov. 7, 2017;
Prediction of fluid intelligence (PMAT24_A_CR) It has been reported that a measure of fluid intelligence, the raw score on a 24-item
version of the Raven’s Progressive Matrices (PMAT24_A_CR), could be predicted from FC matrices in previous releases of the HCP dataset (Finn et al., 2015; Noble et al., 2017). We generally replicated this result qualitatively for the de-confounded fluid intelligence score (removing variance shared with gender, age, handedness, brain size, motion, and reconstruction version), using a leave-one-family-out cross-validation approach. We found positive correlations across all 36 of our result datasets: 2 sessions x 3 denoising pipelines (A, B & C) x 2 parcellation schemes (in volumetric space and in MSM-All space) x 3 models (univariate positive, univariate negative, and multivariate learning models) (Figure 4a, Table 1). We note however that, using MNI space and denoising strategy A as in (Finn et al., 2015), the prediction score was very low (REST1: r=0.04; REST2: r=0.03). One difference is that the previous study did not use de-confounding, hence some variance from confounds may have been used in the predictions; also the sample size was much smaller in (Finn et al., 2015) (N=118; but N=606 in (Noble et al., 2017)), and family structure was not accounted for in the cross-validation. We generally found that prediction performance was better in MSM-All space (Figure 4a, Table 1).
To generate a final prediction, we combined data from all four resting-state runs (REST12). We chose to use pipeline A and MSM-All space, which we had found to yield the best test-retest reliability in terms of behavioral utility (Figure 3c). We obtained r=0.22 (R2=0.007, nRMSD=0.997) for the univariate positive model, r=0.18 (R2=-0.023, nRMSD=1.012) for the univariate negative model, and r=0.26 (R2=0.044, nRMSD=0.978) for the multivariate model. Interestingly, these performances on combined data outperformed performance on REST1 or REST2 alone, suggesting that decreasing noise in the neural data boosts prediction performance. For statistical assessment of predictions, we estimated the distribution of chance for the prediction score under both the univariate positive and the multivariate models, using 1000 random permutations of the subjects’ fluid intelligence scores (Figure 4b). For reference we also show parametric statistics thresholds for the correlation coefficients; we found that parametric statistics underestimate the confidence interval for the null hypothesis, hence overestimate significance. Interestingly, the null distributions differed between the univariate and the multivariate models: while the distribution under the multivariate model was roughly symmetric about 0, the distribution under the univariate model was asymmetric with a long tail on the left.The empirical, one-tailed p-values for REST12 MSM-All space data denoised with strategy A and using the univariate positive model, and using the multivariate model, both achieved p<0.001 (none of the 1000 random permutations resulted in a higher prediction score).
peer-reviewed) is the author/funder. All rights reserved. No reuse allowed without permission. The copyright holder for this preprint (which was not. http://dx.doi.org/10.1101/215129doi: bioRxiv preprint first posted online Nov. 7, 2017;
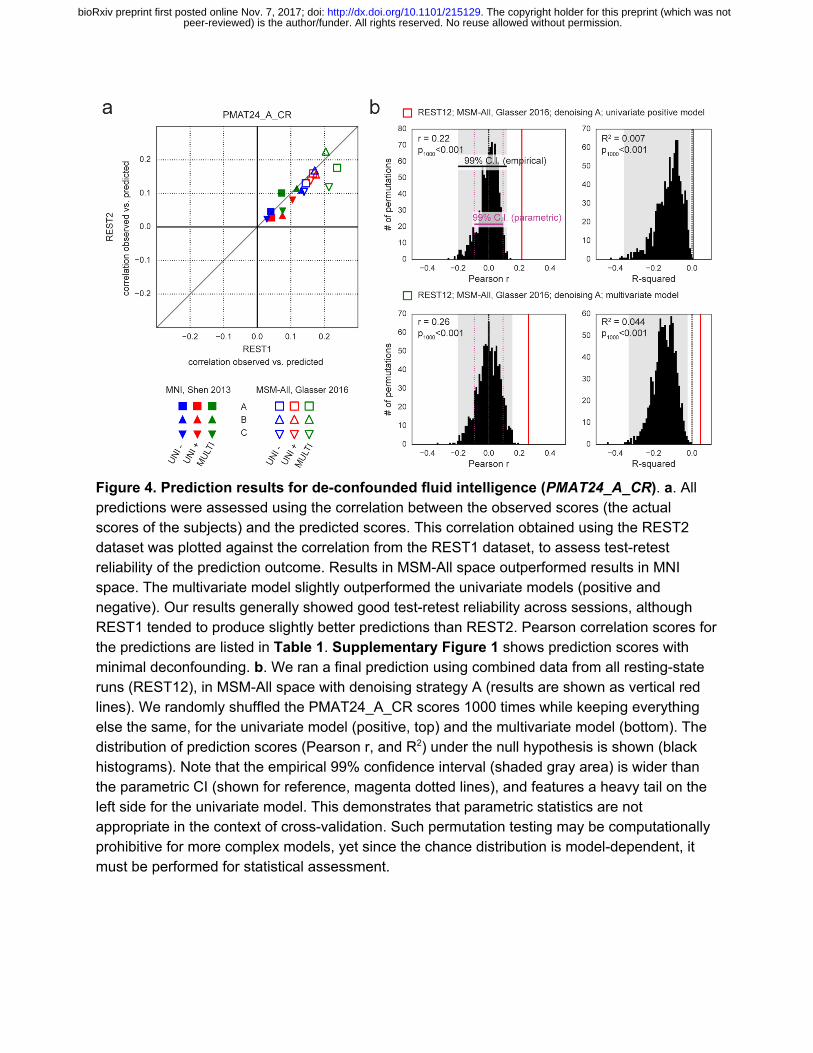
Figure 4. Prediction results for de-confounded fluid intelligence (PMAT24_A_CR). a. All predictions were assessed using the correlation between the observed scores (the actual scores of the subjects) and the predicted scores. This correlation obtained using the REST2 dataset was plotted against the correlation from the REST1 dataset, to assess test-retest reliability of the prediction outcome. Results in MSM-All space outperformed results in MNI space. The multivariate model slightly outperformed the univariate models (positive and negative). Our results generally showed good test-retest reliability across sessions, although REST1 tended to produce slightly better predictions than REST2. Pearson correlation scores for the predictions are listed in Table 1. Supplementary Figure 1 shows prediction scores with minimal deconfounding. b. We ran a final prediction using combined data from all resting-state runs (REST12), in MSM-All space with denoising strategy A (results are shown as vertical red lines). We randomly shuffled the PMAT24_A_CR scores 1000 times while keeping everything else the same, for the univariate model (positive, top) and the multivariate model (bottom). The distribution of prediction scores (Pearson r, and R2) under the null hypothesis is shown (black histograms). Note that the empirical 99% confidence interval (shaded gray area) is wider than the parametric CI (shown for reference, magenta dotted lines), and features a heavy tail on the left side for the univariate model. This demonstrates that parametric statistics are not appropriate in the context of cross-validation. Such permutation testing may be computationally prohibitive for more complex models, yet since the chance distribution is model-dependent, it must be performed for statistical assessment.
peer-reviewed) is the author/funder. All rights reserved. No reuse allowed without permission. The copyright holder for this preprint (which was not. http://dx.doi.org/10.1101/215129doi: bioRxiv preprint first posted online Nov. 7, 2017;
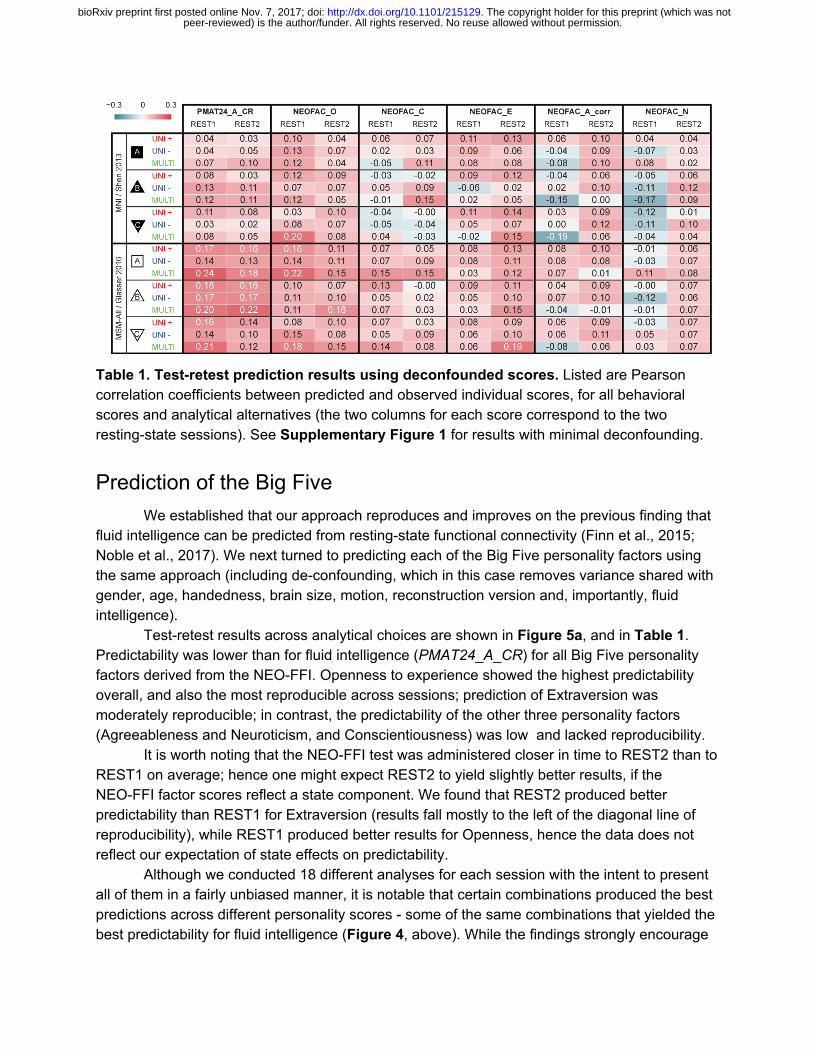
Table 1. Test-retest prediction results using deconfounded scores. Listed are Pearson correlation coefficients between predicted and observed individual scores, for all behavioral scores and analytical alternatives (the two columns for each score correspond to the two resting-state sessions). See Supplementary Figure 1 for results with minimal deconfounding.
Prediction of the Big Five We established that our approach reproduces and improves on the previous finding that
fluid intelligence can be predicted from resting-state functional connectivity (Finn et al., 2015; Noble et al., 2017). We next turned to predicting each of the Big Five personality factors using the same approach (including de-confounding, which in this case removes variance shared with gender, age, handedness, brain size, motion, reconstruction version and, importantly, fluid intelligence).
Test-retest results across analytical choices are shown in Figure 5a, and in Table 1. Predictability was lower than for fluid intelligence (PMAT24_A_CR) for all Big Five personality factors derived from the NEO-FFI. Openness to experience showed the highest predictability overall, and also the most reproducible across sessions; prediction of Extraversion was moderately reproducible; in contrast, the predictability of the other three personality factors (Agreeableness and Neuroticism, and Conscientiousness) was low and lacked reproducibility.
It is worth noting that the NEO-FFI test was administered closer in time to REST2 than to REST1 on average; hence one might expect REST2 to yield slightly better results, if the NEO-FFI factor scores reflect a state component. We found that REST2 produced better predictability than REST1 for Extraversion (results fall mostly to the left of the diagonal line of reproducibility), while REST1 produced better results for Openness, hence the data does not reflect our expectation of state effects on predictability.
Although we conducted 18 different analyses for each session with the intent to present all of them in a fairly unbiased manner, it is notable that certain combinations produced the best predictions across different personality scores - some of the same combinations that yielded the best predictability for fluid intelligence (Figure 4, above). While the findings strongly encourage
peer-reviewed) is the author/funder. All rights reserved. No reuse allowed without permission. The copyright holder for this preprint (which was not. http://dx.doi.org/10.1101/215129doi: bioRxiv preprint first posted online Nov. 7, 2017;
the exploration of additional processing alternatives (see Discussion), some of which may produce results yet superior to those here, we can provisionally recommend MSM-All alignment and the associated multimodal brain parcellation (Glasser, Coalson, et al., 2016), together with a multivariate learning model such as elastic net regression.
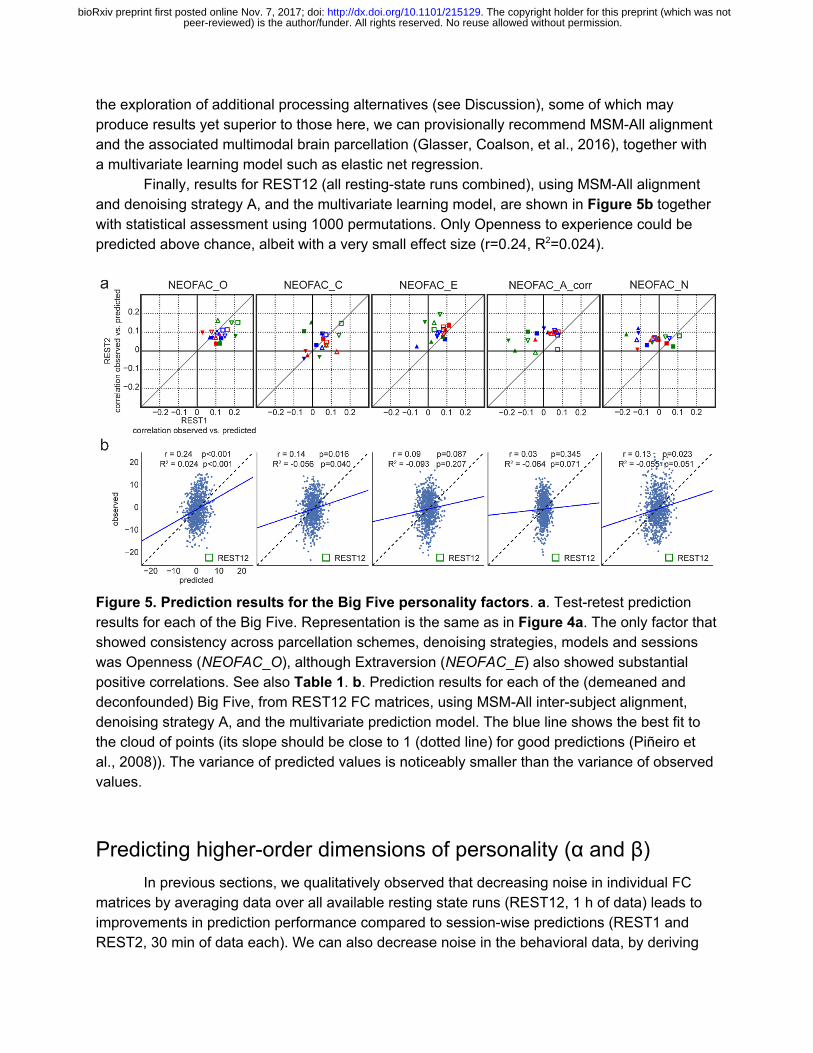
Finally, results for REST12 (all resting-state runs combined), using MSM-All alignment and denoising strategy A, and the multivariate learning model, are shown in Figure 5b together with statistical assessment using 1000 permutations. Only Openness to experience could be predicted above chance, albeit with a very small effect size (r=0.24, R2=0.024).
Figure 5. Prediction results for the Big Five personality factors. a. Test-retest prediction results for each of the Big Five. Representation is the same as in Figure 4a. The only factor that showed consistency across parcellation schemes, denoising strategies, models and sessions was Openness (NEOFAC_O), although Extraversion (NEOFAC_E) also showed substantial positive correlations. See also Table 1. b. Prediction results for each of the (demeaned and deconfounded) Big Five, from REST12 FC matrices, using MSM-All inter-subject alignment, denoising strategy A, and the multivariate prediction model. The blue line shows the best fit to the cloud of points (its slope should be close to 1 (dotted line) for good predictions (Piñeiro et al., 2008)). The variance of predicted values is noticeably smaller than the variance of observed values.
Predicting higher-order dimensions of personality (α and β) In previous sections, we qualitatively observed that decreasing noise in individual FC
matrices by averaging data over all available resting state runs (REST12, 1 h of data) leads to improvements in prediction performance compared to session-wise predictions (REST1 and REST2, 30 min of data each). We can also decrease noise in the behavioral data, by deriving
peer-reviewed) is the author/funder. All rights reserved. No reuse allowed without permission. The copyright holder for this preprint (which was not. http://dx.doi.org/10.1101/215129doi: bioRxiv preprint first posted online Nov. 7, 2017;
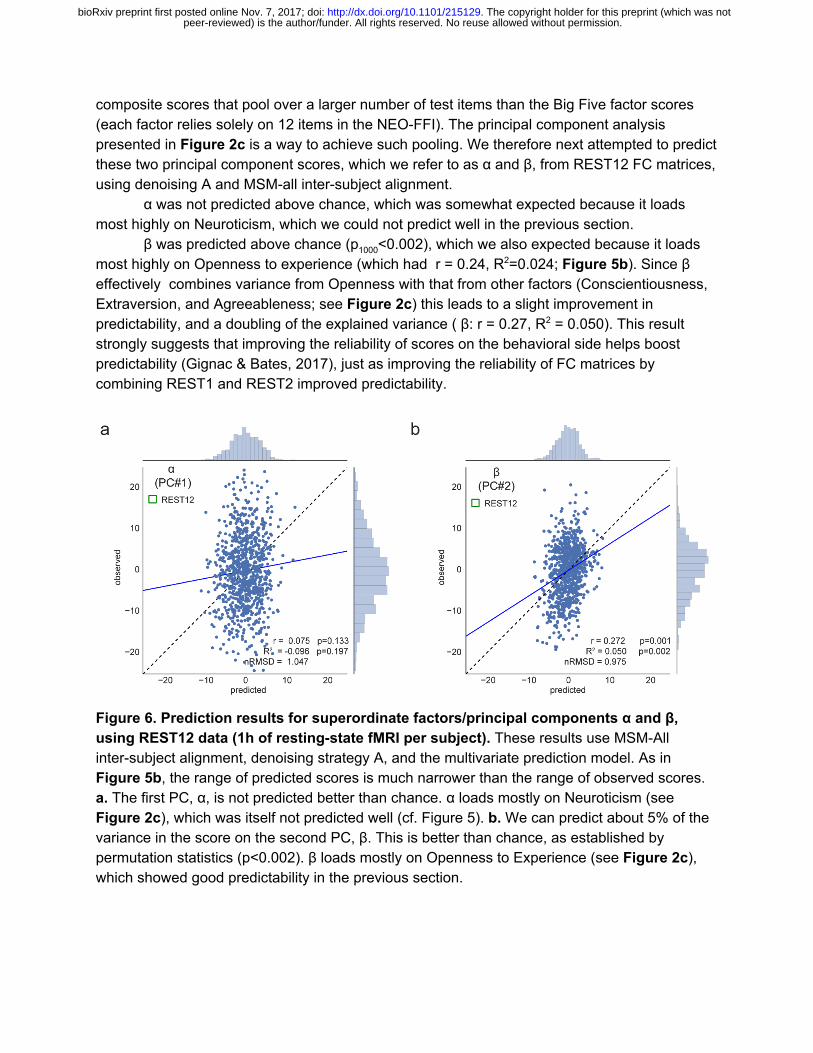
composite scores that pool over a larger number of test items than the Big Five factor scores (each factor relies solely on 12 items in the NEO-FFI). The principal component analysis presented in Figure 2c is a way to achieve such pooling. We therefore next attempted to predict these two principal component scores, which we refer to as α and β, from REST12 FC matrices, using denoising A and MSM-all inter-subject alignment.
α was not predicted above chance, which was somewhat expected because it loads most highly on Neuroticism, which we could not predict well in the previous section.
β was predicted above chance (p 1000<0.002), which we also expected because it loads most highly on Openness to experience (which had r = 0.24, R2=0.024; Figure 5b). Since β effectively combines variance from Openness with that from other factors (Conscientiousness, Extraversion, and Agreeableness; see Figure 2c) this leads to a slight improvement in predictability, and a doubling of the explained variance ( β: r = 0.27, R2 = 0.050). This result strongly suggests that improving the reliability of scores on the behavioral side helps boost predictability (Gignac & Bates, 2017), just as improving the reliability of FC matrices by combining REST1 and REST2 improved predictability.
Figure 6. Prediction results for superordinate factors/principal components α and β, using REST12 data (1h of resting-state fMRI per subject). These results use MSM-All inter-subject alignment, denoising strategy A, and the multivariate prediction model. As in Figure 5b, the range of predicted scores is much narrower than the range of observed scores. a. The first PC, α, is not predicted better than chance. α loads mostly on Neuroticism (see Figure 2c), which was itself not predicted well (cf. Figure 5). b. We can predict about 5% of the variance in the score on the second PC, β. This is better than chance, as established by permutation statistics (p<0.002). β loads mostly on Openness to Experience (see Figure 2c), which showed good predictability in the previous section.
peer-reviewed) is the author/funder. All rights reserved. No reuse allowed without permission. The copyright holder for this preprint (which was not. http://dx.doi.org/10.1101/215129doi: bioRxiv preprint first posted online Nov. 7, 2017;
Discussion
Summary of results Connectome-based predictive modeling (Dubois & Adolphs, 2016; Xilin Shen et al.,
2017) has been an active field of research in the past years: it consists in using functional connectivity as measured from resting-state fMRI data to predict individual differences in demographics, behavior, psychological profile, or psychiatric diagnosis. Here, we applied this approach and attempted to predict the Big Five personality factors (R. R. McCrae & Costa, 1987) from resting-state data in a large public dataset, the Human Connectome Project (N=884 after exclusion criteria). We can summarize our findings as follows.
1. We found that personality traits were not only intercorrelated with one another, but were also correlated with fluid intelligence, age, sex, handedness and other measures. We therefore regressed these possible confounds out, producing a residualized set of personality trait measures (that were, however, still intercorrelated amongst themselves).
2. Comparing different processing pipelines and data from different fMRI sessions showed generally good stability of functional connectivity across time, a prerequisite for attempting to predict a personality trait that is also stable across time.
3. We qualitatively replicated and extended a previously published finding, the prediction of a measure of fluid intelligence (Finn et al., 2015; Noble et al., 2017) from functional connectivity patterns, providing reassurance that our approach is able to predict individual differences when possible.
4. We then carried out a total of 36 different analyses for each of the five personality factors. The 36 different analyses resulted from separately analysing data from 2 sessions (establishing test-retest reliability), each with 3 different preprocessing pipelines (exploring sensitivity to how the fMRI data are processed), 2 different alignment and hard parcellation schemes (providing initial results whether multimodal surface-based alignment improves on classical volumetric alignment), and 3 different predictive models (univariate positive, univariate negative, and multivariate). Across all of these alternatives, we generally found that the MSM-All multimodal alignment together with the parcellation scheme of Glasser et al. (2016) was associated with the greatest predictability; and likewise for the multivariate model (elastic net).
5. Among the personality measures, Openness to experience showed the most reliable prediction between the two fMRI sessions, followed by Extraversion; for all other factors, predictions were often highly unstable, showing large variation depending on small changes in preprocessing, or across sessions.
6. Combining data from both fMRI sessions improved predictions. Likewise, combining behavioral data through principal component analysis improved predictions. At both the neural and behavioral ends, improving the quality of our measurements could improve predictions.
7. We best predicted the β superordinate factor, with r=0.27 and R2=0.05. This is highly significant as per permutation testing (though, in interpreting the statistical significance of any
peer-reviewed) is the author/funder. All rights reserved. No reuse allowed without permission. The copyright holder for this preprint (which was not. http://dx.doi.org/10.1101/215129doi: bioRxiv preprint first posted online Nov. 7, 2017;
single finding, we note that one would have to correct for all the multiple analysis pipelines that we tested; future replications or extensions of this work would benefit from a pre-registered single approach to reduce the degrees of freedom in the analysis).
Though some of our findings achieve statistical significance in the large sample of subjects provided by the HCP, resting-state functional connectivity still only explains at most 5% of the variance in any personality score. We are thus still far from understanding the neurobiological substrates of personality (Yarkoni., 2015) (and, for that matter, of fluid intelligence which we predicted at a similar, slightly lower level; but, see (Dubois et al., 2018)). Indeed, based on this finding, it seems unlikely that findings from predictive approaches using whole-brain resting-state fMRI will inform hypotheses about specific neural systems that provide a causal mechanistic explanation of how personality is expressed in behavior.
Taken together, our approach provides important general guidelines for personality neuroscience studies using resting-state fMRI data: i) operations that are sometimes taken for granted, such as resting-state fMRI denoising (Abraham et al., 2016), make a difference to the outcome of connectome-based predictions and their test-retest reliability; ii) new inter-subject alignment procedures, such as multimodal surface matching (Robinson et al., 2014), improve performance and test-retest reliability; iii) a simple multivariate linear model may be a good alternative to the separate univariate models proposed by (Finn et al., 2015), yielding improved performance.
Our approach also draws attention to the tremendous analytical flexibility that is available in principle (Carp, 2012), and to the all-too-common practice of keeping such explorations “behind the scenes” and only reporting the “best” strategy, leading to an inflation of positive findings reported in the literature (Neuroskeptic, 2012; Simonsohn, Nelson, & Simmons, 2014). At a certain level, if all analyses conducted make sense (i.e., would pass a careful expert reviewer’s scrutiny), they should all give a similar answer to the final question (conceptually equivalent to inter-rater reliability (Dubois & Adolphs, 2016)).
Effect of subject alignment The recently proposed multimodal surface matching framework uses a combination of
anatomical and functional features to best align subject cortices. It improves functional inter-subject alignment over the classical approach of warping brains volumetrically (Dubois & Adolphs, 2016). For the scores that can be predicted from functional connectivity, alignment in the MSM-All space outperformed alignment in the MNI space. However, more work needs to be done to further establish the superiority of the MSM-All approach. Indeed, the parcellations used in this study differed between the MNI and MSM-All space: the parcellation in MSM-All space had more nodes (360, vs. 268) and no subcortical structures were included. Also, it is unclear how the use of resting-state data during the alignment process in the MSM-All framework interacts with resting-state based predictions, since the same data used for predictions has already been used to align subjects. Finally, it has recently been shown that the precise anatomy of each person’s brain, even after the best alignment, introduces variability that interacts with functional connectivity (Bijsterbosch et al., 2018). The complete description of
peer-reviewed) is the author/funder. All rights reserved. No reuse allowed without permission. The copyright holder for this preprint (which was not. http://dx.doi.org/10.1101/215129doi: bioRxiv preprint first posted online Nov. 7, 2017;
brain variability at both structural and functional levels will need to be incorporated into future studies of individual differences.
Effect of preprocessing We applied three separate, reasonable denoising strategies, inspired from published
work (Ciric et al., 2017; Finn et al., 2015; Satterthwaite, Elliott, et al., 2013; Siegel et al., 2016) and our current understanding of resting-state fMRI confounds (Caballero-Gaudes & Reynolds, 2016; Murphy et al., 2013). The differences between the three denoising strategies in terms of the resulting test-retest reliability, based on several metrics, were not very large - yet, there were differences. Pipeline A appeared to yield the best reliability in terms of behavioral utility, while Pipeline B was best at conserving differences across subjects. Pipeline C performed worst on these metrics in our hands, despite its use of the automated artifact removal tool ICA-FIX (Salimi-Khorshidi et al., 2014); it is possible that performing CompCor and censoring are in fact detrimental after ICA-FIX (see also (Muschelli et al., 2014)). Finally, in terms of the final predictive score, all three strategies demonstrated acceptable test-retest reliability for scores that were successfully predicted.
The particular choices of pipelines that we made were intended to provide an initial survey of some commonly used schemes, but substantial future work will be needed to explore the space of possibilities more comprehensively. For instance, global signal regression - which was a part of all three chosen strategies - remains a somewhat controversial denoising step, and could be omitted if computing partial correlations, or replaced with a novel temporal ICA decomposition approach (Glasser et al., 2017). The bandpass filtering used in all our denoising approaches to reduce high frequency noise could also be replaced with alternatives such as PCA decomposition combined with “Wishart rolloff” (Glasser, Smith, et al., 2016). All of these choices impact the amount and quality of information in principle available, and how that information can be used to build a predictive model.
Effect of predictive algorithm Our exploration of a multivariate model was motivated by the seemingly arbitrary
decision to weight all edges equally in the univariate models (positive and negative) proposed by (Finn et al., 2015). However, we also recognize the need for simple models, given the paucity of data compared to the number of features (curse of dimensionality). We thus explored a regularized regression model that would combine information from negative and positive edges optimally, after performing the same feature-filtering step as in the univariate models. The multivariate model performed best on the scores that were predicted most reliably, yet it also seemed to have lower test-retest reliability. More work remains to be done on this front to find the best simple model that optimally combines information from all edges and can be trained in a situation with limited data.
peer-reviewed) is the author/funder. All rights reserved. No reuse allowed without permission. The copyright holder for this preprint (which was not. http://dx.doi.org/10.1101/215129doi: bioRxiv preprint first posted online Nov. 7, 2017;
Statistical significance It is inappropriate to assess statistical significance using parametric statistics in the case
of a cross-validation analysis (Figure 4b). However, for complex analyses, it is often the preferred option, due to the prohibitive computational resources needed to run permutation tests. Here we showed the empirical distribution of chance prediction scores for both the univariate (positive)- and multivariate-model predictions of fluid intelligence (PMAT24_A_CR) using denoising pipeline A in MSM-All space (Figure 4b). As expected, the permutation distribution is wider than the parametric estimate; it also differs significantly between the univariate and the multivariate models. This finding stresses that one needs to calculate permutation statistics for the specific analysis that one runs. The calculation of permutation statistics should be feasible given the rapid increase and ready availability of computing clusters with multiple processors. We show permutation statistics for all our key findings, but we did not correct for the multiple comparisons (5 personality factors, multiple processing pipelines). Future studies should ideally provide analyses that are pre-registered to reduce the degrees of freedom available and aid interpretation of statistical reliability.
Will our findings reproduce? It is common practice in machine learning competitions to set aside a portion of your
data and not look at it at all until a final analysis has been decided, and only then to run that single final analysis on the held-out data to establish out-of-sample replication. We decided not to split our dataset in that way due to its already limited sample size, and instead used a careful cross-validation framework, assessed test-retest reliability across data from different sessions, and refrained from adaptively changing parameters upon examining the final results. The current paper should now serve as the basis of a pre-registered replication, to be performed on an independent dataset (a good candidate would be the NKI enhanced dataset (Nooner et al., 2012), which also contains assessment of the Big Five).
On the relationship between brain and personality The best neural predictor of personality may be distinct, wholly or in part, from the actual
neural mechanisms by which personality expresses itself on any given occasion . Personality may stem from a disjunctive and heterogeneous set of biological constraints that in turn influence brain function in complex ways (Yarkoni., 2015); neural predictors may simply be conceived of as “markers” of personality: any correlated measures that a machine learning algorithm could use as information, on the basis of which it could be trained in a supervised fashion to discriminate among personality traits. Our goal in this study was to find such predictions, not a causal explanation (see (Yarkoni & Westfall, 2017)). It may well someday be possible to predict personality differences from fMRI data with much greater accuracy than what we found here. However, we think it likely that, in general, such an approach will still fall short of
peer-reviewed) is the author/funder. All rights reserved. No reuse allowed without permission. The copyright holder for this preprint (which was not. http://dx.doi.org/10.1101/215129doi: bioRxiv preprint first posted online Nov. 7, 2017;
uncovering the neural mechanisms behind personality, in the sense of explaining the proximal causal processes whereby personality is expressed in behavior on specific occasions.
Subjective and objective measures of personality As noted already in the introduction, it is worth keeping in mind the history of the Big
Five: they derive from factor analyses of words, of the vocabularies that we use to describe people. As such, they fundamentally reflect our folk psychology, and our social inferences (“theory of mind”) about other people. This factor structure was then used to design a self-report instrument, in which participants are asked about themselves (the NEO or variations thereof). Unlike some other self-report indices (such as the MMPI), the NEO-FFI does not assess test-taking approach (e.g. consistency across items or tendency toward a particular response set), and thus, offers no insight regarding validity of any individual’s responses. This is a notable limitation, as there is substantial evidence that NEO-FFI scores may be intentionally manipulated by the subject’s response set (Furnham, 1997; Topping & O’Gorman, 1997). Even in the absence of intentional ‘faking’, NEO outcomes are likely to be influenced by an individual’s insight, impression management, and reference group effects. However, these limitations may be addressed by applying the same analysis to multiple personality measures with varying degrees of face-validity and objectivity, as well as measures that include indices of response bias. This might include ratings provided by a familiar informant, implicit-association tests (e.g. (Schnabel, Asendorpf, & Greenwald, 2008)), and spontaneous behavior (e.g. (Mehl, Gosling, & Pennebaker, 2006)). Future development of behavioral measures of personality that provide better convergent validity and discriminative specificity will be an important component of personality neuroscience.
Limitations and Future Directions There are several limitations of the present study that could be improved upon or
extended in future work. In addition to the obvious issue of simply needing more, and/or better quality, data, there is the important issue of obtaining a better estimate of variability within a single subject. This is especially pertinent for personality traits, which are supposed to be relatively stable within an individual. Thus, collecting multiple fMRI datasets, perhaps over weeks or even years, could help to find those features in the data with the best cross-temporal stability. Indeed several such dense datasets across multiple sessions in a few subjects have already been collected, and may help guide the intelligent selection of features with the greatest temporal stability (Gordon et al., 2017; Noble et al., 2017; Poldrack et al., 2015). Against expectations, initial analyses seem to indicate that the most reliable edges in FC from such studies are not necessarily the most predictive edges (for fluid intelligence; (Noble et al., 2017)), yet more work needs to be done to further test this hypothesis. It is also possible that shorter timescale fluctuations in resting-state fMRI provide additional information (if these are stable over longer times), and it might thus be fruitful to explore dynamic FC, as some work has done
peer-reviewed) is the author/funder. All rights reserved. No reuse allowed without permission. The copyright holder for this preprint (which was not. http://dx.doi.org/10.1101/215129doi: bioRxiv preprint first posted online Nov. 7, 2017;
(Calhoun, Miller, Pearlson, & Adalı, 2014; Jia, Hu, & Deshpande, 2014; Vidaurre, Smith, & Woolrich, 2017).
No less important would be improvements on the behavioral end, as we alluded to in the previous section. Developing additional tests of personality to provide convergent validity to the personality dimension constructs would help provide a more accurate estimate of these latent variables. Just as with the fMRI data, collecting personality scores across time should help to prioritize those items that have the greatest temporal stability and reduce measurement error.
Another limitation is signal-to-noise. It may be worth exploring fMRI data obtained while watching a movie that drives relevant brain function, rather than during rest, in order to maximize the signal variance in the fMRI signal. Similarly, it could be beneficial to include participants with a greater range of personality scores, perhaps even including those with a personality disorder. A greater range of signal both on the fMRI end and on the behavioral end would help provide greater power to detect associations.
One particularly relevant aspect of our approach is that the models we used, like most in the literature, were linear. Nonlinear models may be more appropriate, yet the difficulty in using such models is that they would require a much larger number of training samples relative to the number of features in the dataset. This could be accomplished both by accruing ever larger databases of rs-fMRI data, and by further reducing the dimensionality of the data, for instance through PCA or coarser parcellations. Alternatively, one could form a hypothesis about the shape of the function that might best predict personality scores and explicitly include this in a model.
A final important but complex issue concerns the correlation between most behavioral measures. In our analyses, we regressed out fluid intelligence, age, and sex, amongst other variables. But there are many more that are likely to be correlated with personality at some level. If one regressed out all possible measures, one would likely end up removing what one is interested in, since eventually the residual of personality would shrink to a very small range. An alternative approach is to use the raw personality scores (without any removal of confounds at all), and then selectively regress out fluid intelligence, memory task performance, mood, etc., and make comparisons between the results obtained (we provide such minimally deconfounded results in Supplementary Figure 2). This could yield insights into which other variables are driving the predictability of a personality trait. It could also suggest specific new variables to investigate in their own right. Finally, multiple regression may not be the best approach to addressing these confounds, due to noise in the measurements. Specifying confounds within a structural equation model may be a better approach (Westfall & Yarkoni, 2016).
Recommendations for Personality Neuroscience There are well known challenges to the reliability and reproducibility of findings in personality neuroscience, which we have already mentioned. The field shares these with any other attempt to link neuroscience data with individual differences (Dubois & Adolphs, 2016). We conclude with some specific recommendations for the field going forward, focusing on the use of resting-state fMRI data.
peer-reviewed) is the author/funder. All rights reserved. No reuse allowed without permission. The copyright holder for this preprint (which was not. http://dx.doi.org/10.1101/215129doi: bioRxiv preprint first posted online Nov. 7, 2017;
i) Given the effect sizes that we report here (which are by no means a robust estimate, yet do provide a basis on which to build), we think it would be fair to recommend a minimum sample size of 500 or so subjects (Schönbrodt & Perugini, 2013) for connectome-based predictions. If other metrics are used, a careful estimate of effect size that adjusts for bias in the literature should be undertaken for the specific brain measure of interest (cf. (Anderson, Kelley, & Maxwell, 2017)).
ii) A predictive framework is essential (Dubois & Adolphs, 2016; Yarkoni & Westfall, 2017), as it ensures out-of-sample reliability. Personality neuroscience studies should use proper cross-validation (in the case of the HCP, taking family structure into account), with permutation statistics. Even better, studies should include a replication sample which is held out and not examined at all until the final model has been decided from the discovery sample (advanced methods may help implement this in a more practical manner (Dwork et al., 2015)).
iii) Data sharing. If new data are collected by individual labs, it would be very important to make these available, in order to eventually accrue the largest possible sample size in a database. It has been suggested that contact information about the participants would also be valuable, so that additional measures (or retest reliability) could be collected (Mar et al., 2013). Some of these data could be collected over the internet.
iv) Complete transparency and documentation of all analyses, including sharing of all analysis scripts, so that the methods of published studies can be reproduced. Several papers give more detailed recommendations for using and reporting fMRI data, see (Dubois & Adolphs, 2016; Nichols et al., 2016; Poldrack et al., 2008). Our paper makes specific recommendation about detailed parcellation, processing and modeling pipelines; however, this is a continuously evolving field and these recommendations will likely change with future work. For personality in particular, detailed assessment for all participants, and justified exclusionary and inclusionary criteria should be provided. As suggested above, authors should consider pre-registering their study, on the Open Science Framework or a similar platform.
v) Ensure reliable and uniform behavioral estimates of personality. This is perhaps one of the largest unsolved challenges. Compared with the huge ongoing effort and continuous development of the processing and analysis of fMRI data, the measures for personality are mostly stagnant and face many problems of validity. For the time being, a simple recommendation would be to use a consistent instrument and stick with the Big Five, so as not to mix apples and oranges by using very different instruments. That said, it will be important to explore other personality measures and structures. As we noted above, there is in principle a large range of more subjective, or more objective, measures of personality. It would be a boon to the field if these were more systematically collected, explored, and possibly combined to obtain the best estimate of the latent variable of personality they are thought to measure.
(vi) Last but not least, we should consider methods in addition to fMRI and species in addition to humans. To the extent that a human personality dimension appears to have a valid correlate in an animal model, it might be possible to collect large datasets, and to complement fMRI with optical imaging or other modalities. Studies in animals may also yield the most powerful tools to examine specific neural circuits, a level of causal mechanism that, as we argued above, may largely elude analyses using resting-state fMRI.
peer-reviewed) is the author/funder. All rights reserved. No reuse allowed without permission. The copyright holder for this preprint (which was not. http://dx.doi.org/10.1101/215129doi: bioRxiv preprint first posted online Nov. 7, 2017;
Author contributions J. Dubois and P. Galdi developed the overall general analysis framework and conducted
some of the initial analyses for the paper. J. Dubois conducted all final analyses and produced all figures. Y. Han helped with literature search and analysis of behavioral data. L. Paul helped with literature search, analysis of behavioral data, and interpretation of the results. J. Dubois and R. Adolphs wrote the initial manuscript and all authors contributed to the final manuscript. All authors contributed to planning and discussion on this project. The authors declare no conflict of interest.
Acknowledgments This work was supported by NIMH grant 2P50MH094258 (RA), the Carver Mead Seed
Fund (RA), and a NARSAD Young Investigator Grant from the Brain and Behavior Research Foundation (JD).
Data Sharing The Young Adult HCP dataset is publicly available at
https://www.humanconnectome.org/study/hcp-young-adult. Analysis scripts are available in the following public repository: https://github.com/adolphslab/HCP_MRI-behavior.
References Abraham, A., Milham, M., Martino, A. D., Craddock, R. C., Samaras, D., Thirion, B., &
Varoquaux, G. (2016). Deriving reproducible biomarkers from multi-site resting-state data: An Autism-based example. NeuroImage. https://doi.org/10.1016/j.neuroimage.2016.10.045
Abraham, A., Pedregosa, F., Eickenberg, M., Gervais, P., Mueller, A., Kossaifi, J., … Varoquaux, G. (2014). Machine learning for neuroimaging with scikit-learn. Frontiers in Neuroinformatics, 8 , 14. https://doi.org/10.3389/fninf.2014.00014
Adelstein, J. S., Shehzad, Z., Mennes, M., Deyoung, C. G., Zuo, X.-N., Kelly, C., … Milham, M. P. (2011). Personality is reflected in the brain’s intrinsic functional architecture. PloS One, 6(11), e27633. https://doi.org/10.1371/journal.pone.0027633
Aghajani, M., Veer, I. M., van Tol, M.-J., Aleman, A., van Buchem, M. A., Veltman, D. J., … van der Wee, N. J. (2014). Neuroticism and extraversion are associated with amygdala resting-state functional connectivity. Cognitive, Affective & Behavioral Neuroscience, 14 (2), 836–848. https://doi.org/10.3758/s13415-013-0224-0
Alexander, D. L. J., Tropsha, A., & Winkler, D. A. (2015). Beware of R(2): Simple, Unambiguous
peer-reviewed) is the author/funder. All rights reserved. No reuse allowed without permission. The copyright holder for this preprint (which was not. http://dx.doi.org/10.1101/215129doi: bioRxiv preprint first posted online Nov. 7, 2017;

Assessment of the Prediction Accuracy of QSAR and QSPR Models. Journal of Chemical Information and Modeling, 55 (7), 1316–1322. https://doi.org/10.1021/acs.jcim.5b00206
Allemand, M., Zimprich, D., & Hendriks, A. A. J. (2008). Age differences in five personality domains across the life span. Developmental Psychology, 44 (3), 758–770. https://doi.org/10.1037/0012-1649.44.3.758
Amelang, M., & Borkenau. (1982). Über die faktorielle Struktur und externe Validität einiger Fragebogen-Skalen zur Erfassung von Dimensionen der Extraversion und emotionalen Labilität. Psycnet.apa.org. Retrieved from http://psycnet.apa.org/psycinfo/1983-22406-001
Anderson, S. F., Kelley, K., & Maxwell, S. E. (2017). Sample-Size Planning for More Accurate Statistical Power: A Method Adjusting Sample Effect Sizes for Publication Bias and Uncertainty. Psychological Science, 956797617723724. https://doi.org/10.1177/0956797617723724
Back, M. D., Schmukle, S. C., & Egloff, B. (2009). Predicting actual behavior from the explicit and implicit self-concept of personality. Journal of Personality and Social Psychology, 97 (3), 533–548. https://doi.org/10.1037/a0016229
Baeken, C., Marinazzo, D., Van Schuerbeek, P., Wu, G.-R., De Mey, J., Luypaert, R., & De Raedt, R. (2014). Left and Right Amygdala - Mediofrontal Cortical Functional Connectivity Is Differentially Modulated by Harm Avoidance. PloS One, 9 (4), e95740. https://doi.org/10.1371/journal.pone.0095740
Bartels, M., van Weegen, F. I., van Beijsterveldt, C. E. M., Carlier, M., Polderman, T. J. C., Hoekstra, R. A., & Boomsma, D. I. (2012). The five factor model of personality and intelligence: A twin study on the relationship between the two constructs. Personality and Individual Differences, 53 (4), 368–373. https://doi.org/10.1016/j.paid.2012.02.007
Beaty, R. E., Benedek, M., Wilkins, R. W., Jauk, E., Fink, A., Silvia, P. J., … Neubauer, A. C. (2014). Creativity and the default network: A functional connectivity analysis of the creative brain at rest. Neuropsychologia, 64 , 92–98. https://doi.org/10.1016/j.neuropsychologia.2014.09.019
Beaty, R. E., Kaufman, S. B., Benedek, M., Jung, R. E., Kenett, Y. N., Jauk, E., … Silvia, P. J. (2016). Personality and complex brain networks: The role of openness to experience in default network efficiency. Human Brain Mapping, 37 (2), 773–779. https://doi.org/10.1002/hbm.23065
Behzadi, Y., Restom, K., Liau, J., & Liu, T. T. (2007). A component based noise correction method (CompCor) for BOLD and perfusion based fMRI. NeuroImage, 37 (1), 90–101. https://doi.org/10.1016/j.neuroimage.2007.04.042
Bijsterbosch, J. D., Woolrich, M. W., Glasser, M. F., Robinson, E. C., Beckmann, C. F., Van Essen, D. C., … Smith, S. M. (2018). The relationship between spatial configuration and functional connectivity of brain regions. eLife, 7 . https://doi.org/10.7554/eLife.32992
Bilker, W. B., Hansen, J. A., Brensinger, C. M., Richard, J., Gur, R. E., & Gur, R. C. (2012). Development of abbreviated nine-item forms of the Raven’s standard progressive matrices test. Assessment, 19 (3), 354–369. https://doi.org/10.1177/1073191112446655
Birn, R. M., Shackman, A. J., Oler, J. A., Williams, L. E., McFarlin, D. R., Rogers, G. M., … Kalin, N. H. (2014). Evolutionarily conserved prefrontal-amygdalar dysfunction in early-life anxiety. Molecular Psychiatry, 19 (8), 915–922. https://doi.org/10.1038/mp.2014.46
Biswal, B. B., Mennes, M., Zuo, X.-N., Gohel, S., Kelly, C., Smith, S. M., … Milham, M. P. (2010). Toward discovery science of human brain function. Proceedings of the National Academy of Sciences of the United States of America, 107(10), 4734–4739. https://doi.org/10.1073/pnas.0911855107
Bjørnebekk, A., Fjell, A. M., Walhovd, K. B., Grydeland, H., Torgersen, S., & Westlye, L. T.
peer-reviewed) is the author/funder. All rights reserved. No reuse allowed without permission. The copyright holder for this preprint (which was not. http://dx.doi.org/10.1101/215129doi: bioRxiv preprint first posted online Nov. 7, 2017;

(2013). Neuronal correlates of the five factor model (FFM) of human personality: Multimodal imaging in a large healthy sample. NeuroImage, 65 (Supplement C), 194–208. https://doi.org/10.1016/j.neuroimage.2012.10.009
Blackburn, R., Renwick, S. J. D., Donnelly, J. P., & Logan, C. (2004). Big Five or Big Two? Superordinate factors in the NEO Five Factor Inventory and the Antisocial Personality Questionnaire. Personality and Individual Differences, 37 (5), 957–970. https://doi.org/10.1016/j.paid.2003.10.017
Blankstein, U., Chen, J. Y. W., Mincic, A. M., McGrath, P. A., & Davis, K. D. (2009). The complex minds of teenagers: neuroanatomy of personality differs between sexes. Neuropsychologia, 47 (2), 599–603. https://doi.org/10.1016/j.neuropsychologia.2008.10.014
Block, J. (1995). A contrarian view of the five-factor approach to personality description. Psychological Bulletin, 117(2), 187–215. Retrieved from https://www.ncbi.nlm.nih.gov/pubmed/7724687
Borgatta, E. F. (1964). The structure of personality characteristics. Systems Research: The Official Journal of the International Federation for Systems Research, 9 (1), 8–17. https://doi.org/10.1002/bs.3830090103
Bouchard, T. J., Jr, & McGue, M. (2003). Genetic and environmental influences on human psychological differences. Journal of Neurobiology, 54 (1), 4–45. https://doi.org/10.1002/neu.10160
Button, K. S., Ioannidis, J. P. A., Mokrysz, C., Nosek, B. A., Flint, J., Robinson, E. S. J., & Munafò, M. R. (2013). Power failure: why small sample size undermines the reliability of neuroscience. Nature Reviews. Neuroscience, 14 (5), 365–376. https://doi.org/10.1038/nrn3475
Caballero-Gaudes, C., & Reynolds, R. C. (2016). Methods for cleaning the BOLD fMRI signal. NeuroImage. https://doi.org/10.1016/j.neuroimage.2016.12.018
Calhoun, V. D., Miller, R., Pearlson, G., & Adalı, T. (2014). The Chronnectome: Time-Varying Connectivity Networks as the Next Frontier in fMRI Data Discovery. Neuron, 84 (2), 262–274. https://doi.org/10.1016/j.neuron.2014.10.015
Canli, T. (2006). Biology of Personality and Individual Differences. Guilford Press. Retrieved from https://market.android.com/details?id=book-DH-IWaVdRHIC
Canli, T., Zhao, Z., Desmond, J. E., Kang, E., Gross, J., & Gabrieli, J. D. (2001). An fMRI study of personality influences on brain reactivity to emotional stimuli. Behavioral Neuroscience, 115(1), 33–42. Retrieved from https://www.ncbi.nlm.nih.gov/pubmed/11256451
Carp, J. (2012). On the plurality of (methodological) worlds: estimating the analytic flexibility of FMRI experiments. Frontiers in Neuroscience, 6 , 149. https://doi.org/10.3389/fnins.2012.00149
Cattell, R. B. (1945). The Description of Personality: Principles and Findings in a Factor Analysis. The American Journal of Psychology, 58 (1), 69–90. https://doi.org/10.2307/1417576
Chamorro-Premuzic, T., & Furnham, A. (2004). A possible model for understanding the personality-intelligence interface. British Journal of Psychology , 95 (2), 249–264. Retrieved from http://onlinelibrary.wiley.com/doi/10.1348/000712604773952458/full
Ciric, R., Wolf, D. H., Power, J. D., Roalf, D. R., Baum, G., Ruparel, K., … Satterthwaite, T. D. (2017). Benchmarking of participant-level confound regression strategies for the control of motion artifact in studies of functional connectivity. NeuroImage. https://doi.org/10.1016/j.neuroimage.2017.03.020
Cohen, M. X., Schoene-Bake, J.-C., Elger, C. E., & Weber, B. (2008). Connectivity-based segregation of the human striatum predicts personality characteristics. Nature
peer-reviewed) is the author/funder. All rights reserved. No reuse allowed without permission. The copyright holder for this preprint (which was not. http://dx.doi.org/10.1101/215129doi: bioRxiv preprint first posted online Nov. 7, 2017;

Neuroscience, 12 (1), 32–34. https://doi.org/10.1038/nn.2228 Cole, M. W., Yarkoni, T., Repovs, G., Anticevic, A., & Braver, T. S. (2012). Global connectivity of
prefrontal cortex predicts cognitive control and intelligence. The Journal of Neuroscience: The Official Journal of the Society for Neuroscience, 32 (26), 8988–8999. https://doi.org/10.1523/JNEUROSCI.0536-12.2012
Combrisson, E., & Jerbi, K. (2015). Exceeding chance level by chance: The caveat of theoretical chance levels in brain signal classification and statistical assessment of decoding accuracy. Journal of Neuroscience Methods, 250, 126–136. https://doi.org/10.1016/j.jneumeth.2015.01.010
Costa, P. T., Jr, & McCrae, R. R. (1995). Domains and facets: hierarchical personality assessment using the revised NEO personality inventory. Journal of Personality Assessment, 64 (1), 21–50. https://doi.org/10.1207/s15327752jpa6401_2
Costa, P. T., & McCrae, R. R. (1992). Neo PI-R professional manual. Odessa, FL: Psychological Assessment Resources, 396, 653–665.
Costa, P. T., Terracciano, A., & McCrae, R. R. (2001). Gender differences in personality traits across cultures: robust and surprising findings. Journal of Personality and Social Psychology, 81 (2), 322–331. https://doi.org/10.1037/0022-3514.81.2.322
Coutinho, J. F., Sampaio, A., Ferreira, M., Soares, J. M., & Gonçalves, O. F. (2013). Brain correlates of pro-social personality traits: a voxel-based morphometry study. Brain Imaging and Behavior, 7 (3), 293–299. https://doi.org/10.1007/s11682-013-9227-2
Crum, R. M., Anthony, J. C., Bassett, S. S., & Folstein, M. F. (1993). Population-based norms for the Mini-Mental State Examination by age and educational level. JAMA: The Journal of the American Medical Association, 269(18), 2386–2391. Retrieved from https://www.ncbi.nlm.nih.gov/pubmed/8479064
D’Agostino, R., & Pearson, E. S. (1973). Tests for Departure from Normality. Empirical Results for the Distributions of b 2 and √ b 1. Biometrika, 60 (3), 613–622. https://doi.org/10.2307/2335012
Deris, N., Montag, C., Reuter, M., Weber, B., & Markett, S. (2017). Functional connectivity in the resting brain as biological correlate of the Affective Neuroscience Personality Scales. NeuroImage, 147(Supplement C), 423–431. https://doi.org/10.1016/j.neuroimage.2016.11.063
DeYoung, C. G. (2006). Higher-order factors of the Big Five in a multi-informant sample. Journal of Personality and Social Psychology, 91 (6), 1138–1151. https://doi.org/10.1037/0022-3514.91.6.1138
DeYoung, C. G., Hirsh, J. B., Shane, M. S., Papademetris, X., Rajeevan, N., & Gray, J. R. (2010). Testing predictions from personality neuroscience. Brain structure and the big five. Psychological Science, 21 (6), 820–828. https://doi.org/10.1177/0956797610370159
Digman, J. M. (1997). Higher-order factors of the Big Five. Journal of Personality and Social Psychology, 73 (6), 1246–1256. Retrieved from https://www.ncbi.nlm.nih.gov/pubmed/9418278
Dosenbach, N. U. F., Nardos, B., Cohen, A. L., Fair, D. A., Power, J. D., Church, J. A., … Schlaggar, B. L. (2010). Prediction of individual brain maturity using fMRI. Science, 329(5997), 1358–1361. https://doi.org/10.1126/science.1194144
Dubois, J., & Adolphs, R. (2016). Building a Science of Individual Differences from fMRI. Trends in Cognitive Sciences, 20 (6), 425–443. https://doi.org/10.1016/j.tics.2016.03.014
Dubois, J., Galdi, P., Paul, L. K., & Adolphs, R. (2018, January 31). A distributed brain network predicts general intelligence from resting-state human neuroimaging data. bioRxiv. https://doi.org/10.1101/257865
peer-reviewed) is the author/funder. All rights reserved. No reuse allowed without permission. The copyright holder for this preprint (which was not. http://dx.doi.org/10.1101/215129doi: bioRxiv preprint first posted online Nov. 7, 2017;
Dwork, C., Feldman, V., Hardt, M., Pitassi, T., Reingold, O., & Roth, A. (2015). STATISTICS. The reusable holdout: Preserving validity in adaptive data analysis. Science, 349(6248), 636–638. https://doi.org/10.1126/science.aaa9375
Egan, V., Deary, I., & Austin, E. (2000). The NEO-FFI: emerging British norms and an item-level analysis suggest N, A and C are more reliable than O and E. Personality and Individual Differences, 29 (5), 907–920. https://doi.org/10.1016/S0191-8869(99)00242-1
Eickhoff, S., Nichols, T. E., Van Horn, J. D., & Turner, J. A. (2016). Sharing the wealth: Neuroimaging data repositories. NeuroImage, 124(Pt B), 1065–1068. https://doi.org/10.1016/j.neuroimage.2015.10.079
Elam, J. (2015, March 16). Ramifications of Image Reconstruction Version Differences. Retrieved from https://wiki.humanconnectome.org/display/PublicData/Ramifications+of+Image+Reconstruction+Version+Differences
Feingold, A. (1994). Gender differences in personality: a meta-analysis. Psychological Bulletin, 116(3), 429. Retrieved from http://psycnet.apa.org/psycinfo/1995-09434-001
Finn, E. S., Shen, X., Scheinost, D., Rosenberg, M. D., Huang, J., Chun, M. M., … Constable, R. T. (2015). Functional connectome fingerprinting: identifying individuals using patterns of brain connectivity. Nature Neuroscience, 18 (11), 1664–1671. https://doi.org/10.1038/nn.4135
Fiske, D. W. (1949). Consistency of the factorial structures of personality ratings from different sour sources. Journal of Abnormal Psychology, 44 (3), 329–344. Retrieved from https://www.ncbi.nlm.nih.gov/pubmed/18146776
Furnham, A. F. (1997). Knowing and faking one’s five-factor personality score. Journal of Personality Assessment, 69 (1), 229–243. Retrieved from http://www.tandfonline.com/doi/abs/10.1207/s15327752jpa6901_14
Furr, R. M. (2009). Personality psychology as a truly behavioural science. European Journal of Personality, 23 (5), 369–401. Retrieved from http://onlinelibrary.wiley.com/doi/10.1002/per.724/full
Gabrieli, J. D. E., Ghosh, S. S., & Whitfield-Gabrieli, S. (2015). Prediction as a humanitarian and pragmatic contribution from human cognitive neuroscience. Neuron, 85 (1), 11–26. https://doi.org/10.1016/j.neuron.2014.10.047
Gao, Q., Xu, Q., Long, Z., Duan, X., Liao, W., Ding, J., … Chen, H. (2013). Extraversion and neuroticism relate to topological properties of resting-state brain networks. Frontiers in Human Neuroscience, 7 , 257. https://doi.org/10.3389/fnhum.2013.00257
Geerligs, L., Renken, R. J., Saliasi, E., Maurits, N. M., & Lorist, M. M. (2015). A Brain-Wide Study of Age-Related Changes in Functional Connectivity. Cerebral Cortex , 25 (7), 1987–1999. https://doi.org/10.1093/cercor/bhu012
Geerligs, L., Rubinov, M., Cam-Can, & Henson, R. N. (2015). State and Trait Components of Functional Connectivity: Individual Differences Vary with Mental State. The Journal of Neuroscience: The Official Journal of the Society for Neuroscience, 35 (41), 13949–13961. https://doi.org/10.1523/JNEUROSCI.1324-15.2015
Gignac, G. E., & Bates, T. C. (2017). Brain volume and intelligence: The moderating role of intelligence measurement quality. Intelligence, 64 (Supplement C), 18–29. https://doi.org/10.1016/j.intell.2017.06.004
Glasser, M. F., Coalson, T. S., Bijsterbosch, J. D., Harrison, S. J., Harms, M. P., Anticevic, A., … Smith, S. M. (2017, December 13). Using Temporal ICA to Selectively Remove Global Noise While Preserving Global Signal in Functional MRI Data. bioRxiv. https://doi.org/10.1101/193862
peer-reviewed) is the author/funder. All rights reserved. No reuse allowed without permission. The copyright holder for this preprint (which was not. http://dx.doi.org/10.1101/215129doi: bioRxiv preprint first posted online Nov. 7, 2017;

Glasser, M. F., Coalson, T. S., Robinson, E. C., Hacker, C. D., Harwell, J., Yacoub, E., … Van Essen, D. C. (2016). A multi-modal parcellation of human cerebral cortex. Nature. https://doi.org/10.1038/nature18933
Glasser, M. F., Smith, S. M., Marcus, D. S., Andersson, J. L. R., Auerbach, E. J., Behrens, T. E. J., … Van Essen, D. C. (2016). The Human Connectome Project’s neuroimaging approach. Nature Neuroscience, 19 (9), 1175–1187. https://doi.org/10.1038/nn.4361
Glasser, M. F., Sotiropoulos, S. N., Wilson, J. A., Coalson, T. S., Fischl, B., Andersson, J. L., … WU-Minn HCP Consortium. (2013). The minimal preprocessing pipelines for the Human Connectome Project. NeuroImage, 80 , 105–124. https://doi.org/10.1016/j.neuroimage.2013.04.127
Goldberg, L. R. (1981). Language and individual differences: The search for universals in personality lexicons. Personality and Social Psychology Review: An Official Journal of the Society for Personality and Social Psychology, Inc, 2 (1), 141–165. Retrieved from http://projects.ori.org/lrg/PDFs_papers/universals.lexicon.81.pdf
Gordon, E. M., Laumann, T. O., Adeyemo, B., Huckins, J. F., Kelley, W. M., & Petersen, S. E. (2014). Generation and Evaluation of a Cortical Area Parcellation from Resting-State Correlations. Cerebral Cortex . https://doi.org/10.1093/cercor/bhu239
Gordon, E. M., Laumann, T. O., Gilmore, A. W., Newbold, D. J., Greene, D. J., Berg, J. J., … Dosenbach, N. U. F. (2017). Precision Functional Mapping of Individual Human Brains. Neuron. https://doi.org/10.1016/j.neuron.2017.07.011
Gorgolewski, K., Burns, C. D., Madison, C., Clark, D., Halchenko, Y. O., Waskom, M. L., & Ghosh, S. S. (2011). Nipype: a flexible, lightweight and extensible neuroimaging data processing framework in python. Frontiers in Neuroinformatics, 5 , 13. https://doi.org/10.3389/fninf.2011.00013
Gorgolewski, K. J., Esteban, O., Ellis, D. G., Notter, M. P., Ziegler, E., Johnson, H., … Ghosh, S. (2017, May). nipy/nipype: Release 0.13.1. https://doi.org/10.5281/zenodo.581704
Gosling, S. D., & John, O. P. (1999). Personality Dimensions in Nonhuman Animals: A Cross-Species Review. Current Directions in Psychological Science, 8 (3), 69–75. https://doi.org/10.1111/1467-8721.00017
Gosling, S. D., & Vazire, S. (2002). Are we barking up the right tree? Evaluating a comparative approach to personality. Journal of Research in Personality, 36 (6), 607–614. https://doi.org/10.1016/S0092-6566(02)00511-1
Gray, J. C. (2017, October 4). NEO-FFI Agreeableness scoring. Retrieved from https://www.mail-archive.com/[email protected]/msg05266.html
Gur, R. C., Ragland, J. D., Moberg, P. J., Turner, T. H., Bilker, W. B., Kohler, C., … Gur, R. E. (2001). Computerized neurocognitive scanning: I. Methodology and validation in healthy people. Neuropsychopharmacology: Official Publication of the American College of Neuropsychopharmacology, 25 (5), 766–776. https://doi.org/10.1016/S0893-133X(01)00278-0
Gur, R. C., Richard, J., Hughett, P., Calkins, M. E., Macy, L., Bilker, W. B., … Gur, R. E. (2010). A cognitive neuroscience-based computerized battery for efficient measurement of individual differences: standardization and initial construct validation. Journal of Neuroscience Methods, 187(2), 254–262. https://doi.org/10.1016/j.jneumeth.2009.11.017
Hänggi, J., Fövenyi, L., Liem, F., Meyer, M., & Jäncke, L. (2014). The hypothesis of neuronal interconnectivity as a function of brain size-a general organization principle of the human connectome. Frontiers in Human Neuroscience, 8 , 915. https://doi.org/10.3389/fnhum.2014.00915
Holmes, A. J., Lee, P. H., Hollinshead, M. O., Bakst, L., Roffman, J. L., Smoller, J. W., &
peer-reviewed) is the author/funder. All rights reserved. No reuse allowed without permission. The copyright holder for this preprint (which was not. http://dx.doi.org/10.1101/215129doi: bioRxiv preprint first posted online Nov. 7, 2017;
Buckner, R. L. (2012). Individual Differences in Amygdala-Medial Prefrontal Anatomy Link Negative Affect, Impaired Social Functioning, and Polygenic Depression Risk. The Journal of Neuroscience: The Official Journal of the Society for Neuroscience, 32 (50), 18087–18100. https://doi.org/10.1523/JNEUROSCI.2531-12.2012
Hong, R. Y., Paunonen, S. V., & Slade, H. P. (2008). Big Five personality factors and the prediction of behavior: A multitrait–multimethod approach. Personality and Individual Differences, 45 (2), 160–166. https://doi.org/10.1016/j.paid.2008.03.015
Hutton, C., Draganski, B., Ashburner, J., & Weiskopf, N. (2009). A comparison between voxel-based cortical thickness and voxel-based morphometry in normal aging. NeuroImage, 48(2), 371–380. https://doi.org/10.1016/j.neuroimage.2009.06.043
Hu, X., Erb, M., Ackermann, H., Martin, J. A., Grodd, W., & Reiterer, S. M. (2011). Voxel-based morphometry studies of personality: issue of statistical model specification--effect of nuisance covariates. NeuroImage, 54 (3), 1994–2005. https://doi.org/10.1016/j.neuroimage.2010.10.024
Jaccard, J. J. (1974). Predicting social behavior from personality traits. Journal of Research in Personality, 7 (4), 358–367. https://doi.org/10.1016/0092-6566(74)90057-9
Jang, K. L., Livesley, W. J., & Vernon, P. A. (1996). Heritability of the big five personality dimensions and their facets: a twin study. Journal of Personality, 64 (3), 577–591. Retrieved from https://www.ncbi.nlm.nih.gov/pubmed/8776880
Jia, H., Hu, X., & Deshpande, G. (2014). Behavioral relevance of the dynamics of the functional brain connectome. Brain Connectivity, 4 (9), 741–759. https://doi.org/10.1089/brain.2014.0300
Jiao, B., Zhang, D., Liang, A., Liang, B., Wang, Z., Li, J., … Liu, M. (2017). Association between resting-state brain network topological organization and creative ability: Evidence from a multiple linear regression model. Biological Psychology, 129, 165–177. https://doi.org/10.1016/j.biopsycho.2017.09.003
Job, D. E., Dickie, D. A., Rodriguez, D., Robson, A., Danso, S., Pernet, C., … Wardlaw, J. M. (2017). A brain imaging repository of normal structural MRI across the life course: Brain Images of Normal Subjects (BRAINS). NeuroImage, 144(Pt B), 299–304. https://doi.org/10.1016/j.neuroimage.2016.01.027
Kapogiannis, D., Sutin, A., Davatzikos, C., Costa, P., Jr, & Resnick, S. (2013). The five factors of personality and regional cortical variability in the Baltimore longitudinal study of aging. Human Brain Mapping, 34 (11), 2829–2840. https://doi.org/10.1002/hbm.22108
Kim, M. J., & Whalen, P. J. (2009). The structural integrity of an amygdala-prefrontal pathway predicts trait anxiety. The Journal of Neuroscience: The Official Journal of the Society for Neuroscience, 29 (37), 11614–11618. https://doi.org/10.1523/JNEUROSCI.2335-09.2009
Laumann, T. O., Gordon, E. M., Adeyemo, B., Snyder, A. Z., Joo, S. J., Chen, M.-Y., … Petersen, S. E. (2015). Functional System and Areal Organization of a Highly Sampled Individual Human Brain. Neuron, 87 (3), 657–670. https://doi.org/10.1016/j.neuron.2015.06.037
Lei, X., Zhao, Z., & Chen, H. (2013). Extraversion is encoded by scale-free dynamics of default mode network. NeuroImage, 74 , 52–57. https://doi.org/10.1016/j.neuroimage.2013.02.020
Liu, T. T. (2016). Noise contributions to the fMRI signal: An overview. NeuroImage, 143, 141–151. https://doi.org/10.1016/j.neuroimage.2016.09.008
Liu, W.-Y., Weber, B., Reuter, M., Markett, S., Chu, W.-C., & Montag, C. (2013). The Big Five of Personality and structural imaging revisited: a VBM - DARTEL study. Neuroreport, 24 (7), 375–380. https://doi.org/10.1097/WNR.0b013e328360dad7
Logothetis, N. K., & Wandell, B. A. (2004). Interpreting the BOLD signal. Annual Review of
peer-reviewed) is the author/funder. All rights reserved. No reuse allowed without permission. The copyright holder for this preprint (which was not. http://dx.doi.org/10.1101/215129doi: bioRxiv preprint first posted online Nov. 7, 2017;
Physiology, 66 , 735–769. https://doi.org/10.1146/annurev.physiol.66.082602.092845 Lu, F., Huo, Y., Li, M., Chen, H., Liu, F., Wang, Y., … Chen, H. (2014). Relationship between
Personality and Gray Matter Volume in Healthy Young Adults: A Voxel-Based Morphometric Study. PloS One, 9 (2), e88763. https://doi.org/10.1371/journal.pone.0088763
Mar, R. A., Spreng, R. N., & Deyoung, C. G. (2013). How to produce personality neuroscience research with high statistical power and low additional cost. Cognitive, Affective & Behavioral Neuroscience, 13 (3), 674–685. https://doi.org/10.3758/s13415-013-0202-6
McCrae, R. R., Costa - American Psychologist, P. T., & 1986. (1986). Clinical assessment can benefit from recent advances in personality psychology. Psycnet.apa.org. Retrieved from http://psycnet.apa.org/journals/amp/41/9/1001/
McCrae, R. R., & Costa, P. T. (2004). A contemplated revision of the NEO Five-Factor Inventory. Personality and Individual Differences, 36 (3), 587–596. https://doi.org/10.1016/S0191-8869(03)00118-1
McCrae, R. R., & Costa, P. T., Jr. (1987). Validation of the five-factor model of personality across instruments and observers. Journal of Personality and Social Psychology, 52 (1), 81–90. Retrieved from https://www.ncbi.nlm.nih.gov/pubmed/3820081
McCrae, R. R., & John, O. P. (1992). An Introduction to the Five-Factor Model and Its Applications. Journal of Personality, 60 (2), 175–215. https://doi.org/10.1111/j.1467-6494.1992.tb00970.x
McCrae, R. R., Yamagata, S., Jang, K. L., Riemann, R., Ando, J., Ono, Y., … Spinath, F. M. (2008). Substance and artifact in the higher-order factors of the Big Five. Journal of Personality and Social Psychology, 95 (2), 442–455. https://doi.org/10.1037/0022-3514.95.2.442
Mehl, M. R., Gosling, S. D., & Pennebaker, J. W. (2006). Personality in its natural habitat: manifestations and implicit folk theories of personality in daily life. Journal of Personality and Social Psychology, 90 (5), 862–877. https://doi.org/10.1037/0022-3514.90.5.862
Miller, K. L., Alfaro-Almagro, F., Bangerter, N. K., Thomas, D. L., Yacoub, E., Xu, J., … Smith, S. M. (2016). Multimodal population brain imaging in the UK Biobank prospective epidemiological study. Nature Neuroscience, 19 (11), 1523–1536. https://doi.org/10.1038/nn.4393
Murphy, K., Birn, R. M., & Bandettini, P. A. (2013). Resting-state fMRI confounds and cleanup. NeuroImage, 80 , 349–359. https://doi.org/10.1016/j.neuroimage.2013.04.001
Murphy, K., & Fox, M. D. (2017). Towards a consensus regarding global signal regression for resting state functional connectivity MRI. NeuroImage, 154, 169–173. https://doi.org/10.1016/j.neuroimage.2016.11.052
Muschelli, J., Nebel, M. B., Caffo, B. S., Barber, A. D., Pekar, J. J., & Mostofsky, S. H. (2014). Reduction of motion-related artifacts in resting state fMRI using aCompCor. NeuroImage, 96, 22–35. https://doi.org/10.1016/j.neuroimage.2014.03.028
Neuroskeptic. (2012). The Nine Circles of Scientific Hell. Perspectives on Psychological Science: A Journal of the Association for Psychological Science, 7 (6), 643–644. https://doi.org/10.1177/1745691612459519
Nichols, T. E., Das, S., Eickhoff, S. B., Evans, A. C., Glatard, T., Hanke, M., … Thomas Yeo, B. T. (2016, May 20). Best Practices in Data Analysis and Sharing in Neuroimaging using MRI. bioRxiv. https://doi.org/10.1101/054262
Noble, S., Spann, M. N., Tokoglu, F., Shen, X., Constable, R. T., & Scheinost, D. (2017). Influences on the Test-Retest Reliability of Functional Connectivity MRI and its Relationship with Behavioral Utility. Cerebral Cortex , 1–15. https://doi.org/10.1093/cercor/bhx230
Noirhomme, Q., Lesenfants, D., Gomez, F., Soddu, A., Schrouff, J., Garraux, G., … Laureys, S.
peer-reviewed) is the author/funder. All rights reserved. No reuse allowed without permission. The copyright holder for this preprint (which was not. http://dx.doi.org/10.1101/215129doi: bioRxiv preprint first posted online Nov. 7, 2017;

(2014). Biased binomial assessment of cross-validated estimation of classification accuracies illustrated in diagnosis predictions. NeuroImage. Clinical, 4 , 687–694. https://doi.org/10.1016/j.nicl.2014.04.004
Nooner, K. B., Colcombe, S. J., Tobe, R. H., Mennes, M., Benedict, M. M., Moreno, A. L., … Milham, M. P. (2012). The NKI-Rockland Sample: A Model for Accelerating the Pace of Discovery Science in Psychiatry. Frontiers in Neuroscience, 6 , 152. https://doi.org/10.3389/fnins.2012.00152
Norman, W. T. (1963). Toward an adequate taxonomy of personality attributes: replicated factors structure in peer nomination personality ratings. Journal of Abnormal and Social Psychology, 66 , 574–583. Retrieved from https://www.ncbi.nlm.nih.gov/pubmed/13938947
Oler, J. A., Fox, A. S., Shelton, S. E., Rogers, J., Dyer, T. D., Davidson, R. J., … Kalin, N. H. (2010). Amygdalar and hippocampal substrates of anxious temperament differ in their heritability. Nature, 466(7308), 864–868. https://doi.org/10.1038/nature09282
Omura, K., Todd Constable, R., & Canli, T. (2005). Amygdala gray matter concentration is associated with extraversion and neuroticism. Neuroreport, 16 (17), 1905–1908. Retrieved from https://www.ncbi.nlm.nih.gov/pubmed/16272876
Orrù, G., Pettersson-Yeo, W., Marquand, A. F., Sartori, G., & Mechelli, A. (2012). Using Support Vector Machine to identify imaging biomarkers of neurological and psychiatric disease: a critical review. Neuroscience and Biobehavioral Reviews, 36 (4), 1140–1152. https://doi.org/10.1016/j.neubiorev.2012.01.004
Pang, Y., Cui, Q., Wang, Y., Chen, Y., Wang, X., Han, S., … Chen, H. (2016). Extraversion and neuroticism related to the resting-state effective connectivity of amygdala. Scientific Reports, 6 , 35484. https://doi.org/10.1038/srep35484
Pedregosa, F., Varoquaux, G., Gramfort, A., Michel, V., Thirion, B., Grisel, O., … Duchesnay, É. (2011). Scikit-learn: Machine Learning in Python. Journal of Machine Learning Research: JMLR, 12 (Oct), 2825–2830. Retrieved from http://www.jmlr.org/papers/volume12/pedregosa11a/pedregosa11a.pdf
Piñeiro, G., Perelman, S., Guerschman, J. P., & Paruelo, J. M. (2008). How to evaluate models: Observed vs. predicted or predicted vs. observed? Ecological Modelling, 216(3), 316–322. https://doi.org/10.1016/j.ecolmodel.2008.05.006
Poldrack, R. A., Fletcher, P. C., Henson, R. N., Worsley, K. J., Brett, M., & Nichols, T. E. (2008). Guidelines for reporting an fMRI study. NeuroImage, 40 (2), 409–414. https://doi.org/10.1016/j.neuroimage.2007.11.048
Poldrack, R. A., & Gorgolewski, K. J. (2015). OpenfMRI: Open sharing of task fMRI data. NeuroImage. https://doi.org/10.1016/j.neuroimage.2015.05.073
Poldrack, R. A., Laumann, T. O., Koyejo, O., Gregory, B., Hover, A., Chen, M.-Y., … Mumford, J. A. (2015). Long-term neural and physiological phenotyping of a single human. Nature Communications, 6 . https://doi.org/10.1038/ncomms9885
Pool, E.-M., Rehme, A. K., Eickhoff, S. B., Fink, G. R., & Grefkes, C. (2015). Functional resting-state connectivity of the human motor network: differences between right- and left-handers. NeuroImage, 109, 298–306. https://doi.org/10.1016/j.neuroimage.2015.01.034
Power, J. D., Barnes, K. A., Snyder, A. Z., Schlaggar, B. L., & Petersen, S. E. (2012). Spurious but systematic correlations in functional connectivity MRI networks arise from subject motion. NeuroImage, 59 (3), 2142–2154. https://doi.org/10.1016/j.neuroimage.2011.10.018
Power, J. D., Mitra, A., Laumann, T. O., Snyder, A. Z., Schlaggar, B. L., & Petersen, S. E. (2014). Methods to detect, characterize, and remove motion artifact in resting state fMRI. NeuroImage, 84 , 320–341. https://doi.org/10.1016/j.neuroimage.2013.08.048
Power, R. A., & Pluess, M. (2015). Heritability estimates of the Big Five personality traits based
peer-reviewed) is the author/funder. All rights reserved. No reuse allowed without permission. The copyright holder for this preprint (which was not. http://dx.doi.org/10.1101/215129doi: bioRxiv preprint first posted online Nov. 7, 2017;
on common genetic variants. Translational Psychiatry, 5 , e604. https://doi.org/10.1038/tp.2015.96
Rammstedt, B., Danner, D., & Martin, S. (2016). The association between personality and cognitive ability: Going beyond simple effects. Journal of Research in Personality, 62 , 39–44. https://doi.org/10.1016/j.jrp.2016.03.005
Rauch, S. L., Milad, M. R., Orr, S. P., Quinn, B. T., Fischl, B., & Pitman, R. K. (2005). Orbitofrontal thickness, retention of fear extinction, and extraversion. Neuroreport, 16 (17), 1909–1912. Retrieved from https://www.ncbi.nlm.nih.gov/pubmed/16272877
Riccelli, R., Toschi, N., Nigro, S., Terracciano, A., & Passamonti, L. (2017). Surface-based morphometry reveals the neuroanatomical basis of the five-factor model of personality. Social Cognitive and Affective Neuroscience, 12 (4), 671–684. https://doi.org/10.1093/scan/nsw175
Roberts, B. W., & DelVecchio, W. F. (2000). The rank-order consistency of personality traits from childhood to old age: a quantitative review of longitudinal studies. Psychological Bulletin, 126(1), 3–25. Retrieved from https://www.ncbi.nlm.nih.gov/pubmed/10668348
Roberts, B. W., Kuncel, N. R., Shiner, R., Caspi, A., & Goldberg, L. R. (2007). The Power of Personality: The Comparative Validity of Personality Traits, Socioeconomic Status, and Cognitive Ability for Predicting Important Life Outcomes. Perspectives on Psychological Science: A Journal of the Association for Psychological Science, 2 (4), 313–345. https://doi.org/10.1111/j.1745-6916.2007.00047.x
Robinson, E. C., Jbabdi, S., Glasser, M. F., Andersson, J., Burgess, G. C., Harms, M. P., … Jenkinson, M. (2014). MSM: a new flexible framework for Multimodal Surface Matching. NeuroImage, 100, 414–426. https://doi.org/10.1016/j.neuroimage.2014.05.069
Ruigrok, A. N. V., Salimi-Khorshidi, G., Lai, M.-C., Baron-Cohen, S., Lombardo, M. V., Tait, R. J., & Suckling, J. (2014). A meta-analysis of sex differences in human brain structure. Neuroscience and Biobehavioral Reviews, 39 , 34–50. https://doi.org/10.1016/j.neubiorev.2013.12.004
Ryan, J. P., Sheu, L. K., & Gianaros, P. J. (2011). Resting state functional connectivity within the cingulate cortex jointly predicts agreeableness and stressor-evoked cardiovascular reactivity. NeuroImage, 55 (1), 363–370. https://doi.org/10.1016/j.neuroimage.2010.11.064
Salimi-Khorshidi, G., Douaud, G., Beckmann, C. F., Glasser, M. F., Griffanti, L., & Smith, S. M. (2014). Automatic denoising of functional MRI data: combining independent component analysis and hierarchical fusion of classifiers. NeuroImage, 90 , 449–468. https://doi.org/10.1016/j.neuroimage.2013.11.046
Satterthwaite, T. D., Elliott, M. A., Gerraty, R. T., Ruparel, K., Loughead, J., Calkins, M. E., … Wolf, D. H. (2013). An improved framework for confound regression and filtering for control of motion artifact in the preprocessing of resting-state functional connectivity data. NeuroImage, 64 , 240–256. https://doi.org/10.1016/j.neuroimage.2012.08.052
Satterthwaite, T. D., Wolf, D. H., Ruparel, K., Erus, G., Elliott, M. A., Eickhoff, S. B., … Gur, R. C. (2013). Heterogeneous impact of motion on fundamental patterns of developmental changes in functional connectivity during youth. NeuroImage, 83 , 45–57. https://doi.org/10.1016/j.neuroimage.2013.06.045
Saucier, G. (2002). Orthogonal Markers for Orthogonal Factors: The Case of the Big Five. Journal of Research in Personality, 36 (1), 1–31. https://doi.org/10.1006/jrpe.2001.2335
Schmitt, D. P., Realo, A., Voracek, M., & Allik, J. (2008). Why can’t a man be more like a woman? Sex differences in Big Five personality traits across 55 cultures. Journal of Personality and Social Psychology, 94 (1), 168. Retrieved from http://psycnet.apa.org/record/2007-19165-013
peer-reviewed) is the author/funder. All rights reserved. No reuse allowed without permission. The copyright holder for this preprint (which was not. http://dx.doi.org/10.1101/215129doi: bioRxiv preprint first posted online Nov. 7, 2017;
Schnabel, K., Asendorpf, J. B., & Greenwald, A. G. (2008). Understanding and using the implicit association test: V. measuring semantic aspects of trait self-concepts. European Journal of Personality, 22 (8), 695–706. Retrieved from http://onlinelibrary.wiley.com/doi/10.1002/per.697/full
Schönbrodt, F. D., & Perugini, M. (2013). At what sample size do correlations stabilize? Journal of Research in Personality, 47 (5), 609–612. https://doi.org/10.1016/j.jrp.2013.05.009
Shen, X., Finn, E. S., Scheinost, D., Rosenberg, M. D., Chun, M. M., Papademetris, X., & Todd Constable, R. (2017). Using connectome-based predictive modeling to predict individual behavior from brain connectivity. Nature Protocols, 12 (3), 506–518. https://doi.org/10.1038/nprot.2016.178
Shen, X., Tokoglu, F., Papademetris, X., & Constable, R. T. (2013). Groupwise whole-brain parcellation from resting-state fMRI data for network node identification. NeuroImage, 82 , 403–415. https://doi.org/10.1016/j.neuroimage.2013.05.081
Siegel, J. S., Mitra, A., Laumann, T. O., Seitzman, B. A., Raichle, M., Corbetta, M., & Snyder, A. Z. (2016). Data Quality Influences Observed Links Between Functional Connectivity and Behavior. Cerebral Cortex . https://doi.org/10.1093/cercor/bhw253
Simonsohn, U., Nelson, L. D., & Simmons, J. P. (2014). P-curve: a key to the file-drawer. Journal of Experimental Psychology. General, 143(2), 534–547. https://doi.org/10.1037/a0033242
Smith, G. M. (1967). Usefulness of Peer Ratings of Personality in Educational Research. Educational and Psychological Measurement, 27 (4), 967–984. https://doi.org/10.1177/001316446702700445
Smith, S. M., Vidaurre, D., Beckmann, C. F., Glasser, M. F., Jenkinson, M., Miller, K. L., … Van Essen, D. C. (2013). Functional connectomics from resting-state fMRI. Trends in Cognitive Sciences, 17 (12), 666–682. https://doi.org/10.1016/j.tics.2013.09.016
Smith, S., Vidaurre, D., Glasser, M., Winkler, A., McCarthy, P., Robinson, E., … Van Essen, D. (2016, April). Second beta-release of the HCP Functional Connectivity MegaTrawl. Retrieved from https://db.humanconnectome.org/megatrawl/HCP820_MegaTrawl_April2016.pdf
Soto, C. J., John, O. P., Gosling, S. D., & Potter, J. (2011). Age differences in personality traits from 10 to 65: Big Five domains and facets in a large cross-sectional sample. Journal of Personality and Social Psychology, 100(2), 330–348. https://doi.org/10.1037/a0021717
Sporns, O. (2013). The human connectome: origins and challenges. NeuroImage, 80 , 53–61. https://doi.org/10.1016/j.neuroimage.2013.03.023
Takeuchi, H., Taki, Y., Hashizume, H., Sassa, Y., Nagase, T., Nouchi, R., & Kawashima, R. (2012). The association between resting functional connectivity and creativity. Cerebral Cortex , 22 (12), 2921–2929. https://doi.org/10.1093/cercor/bhr371
Taki, Y., Thyreau, B., Kinomura, S., Sato, K., Goto, R., Wu, K., … Fukuda, H. (2013). A longitudinal study of the relationship between personality traits and the annual rate of volume changes in regional gray matter in healthy adults. Human Brain Mapping, 34 (12), 3347–3353. https://doi.org/10.1002/hbm.22145
Todorov, A. (2017). Face Value: The Irresistible Influence of First Impressions. Princeton University Press. Retrieved from https://market.android.com/details?id=book-mH8rDgAAQBAJ
Topping, G. D., & O’Gorman, J. G. (1997). Effects of faking set on validity of the NEO-FFI. Personality and Individual Differences, 23 (1), 117–124. https://doi.org/10.1016/S0191-8869(97)00006-8
Trabzuni, D., Ramasamy, A., Imran, S., Walker, R., Smith, C., Weale, M. E., … North American
peer-reviewed) is the author/funder. All rights reserved. No reuse allowed without permission. The copyright holder for this preprint (which was not. http://dx.doi.org/10.1101/215129doi: bioRxiv preprint first posted online Nov. 7, 2017;
Brain Expression Consortium. (2013). Widespread sex differences in gene expression and splicing in the adult human brain. Nature Communications, 4 , 2771. https://doi.org/10.1038/ncomms3771
Tupes, E. C., & Christal, R. E. (1961). Recurrent personality factors based on trait ratings (No. Technical Report ASD-TR-61-97). PERSONNEL RESEARCH LAB LACKLAND AFB TX. Retrieved from http://www.dtic.mil/dtic/tr/fulltext/u2/267778.pdf
Tyszka, J. M., Kennedy, D. P., Paul, L. K., & Adolphs, R. (2014). Largely typical patterns of resting-state functional connectivity in high-functioning adults with autism. Cerebral Cortex , 24(7), 1894–1905. https://doi.org/10.1093/cercor/bht040
Uher, J. (2015). Developing “Personality” Taxonomies: Metatheoretical and Methodological Rationales Underlying Selection Approaches, Methods of Data Generation and Reduction Principles. Integrative Psychological & Behavioral Science, 49 (4), 531–589. https://doi.org/10.1007/s12124-014-9280-4
Van Essen, D. C., Smith, S. M., Barch, D. M., Behrens, T. E. J., Yacoub, E., Ugurbil, K., & WU-Minn HCP Consortium. (2013). The WU-Minn Human Connectome Project: an overview. NeuroImage, 80 , 62–79. https://doi.org/10.1016/j.neuroimage.2013.05.041
Van Horn, J. D., & Gazzaniga, M. S. (2013). Why share data? Lessons learned from the fMRIDC. NeuroImage, 82 , 677–682. https://doi.org/10.1016/j.neuroimage.2012.11.010
Verweij, K. J. H., Zietsch, B. P., Medland, S. E., Gordon, S. D., Benyamin, B., Nyholt, D. R., … Wray, N. R. (2010). A genome-wide association study of Cloninger’s temperament scales: implications for the evolutionary genetics of personality. Biological Psychology, 85 (2), 306–317. https://doi.org/10.1016/j.biopsycho.2010.07.018
Vidaurre, D., Smith, S. M., & Woolrich, M. W. (2017). Brain network dynamics are hierarchically organized in time. Proceedings of the National Academy of Sciences. https://doi.org/10.1073/pnas.1705120114
Vinkhuyzen, A. A. E., Pedersen, N. L., Yang, J., Lee, S. H., Magnusson, P. K. E., Iacono, W. G., … Wray, N. R. (2012). Common SNPs explain some of the variation in the personality dimensions of neuroticism and extraversion. Translational Psychiatry, 2 , e102. https://doi.org/10.1038/tp.2012.27
Viswesvaran, C., & Ones, D. S. (2000). Measurement Error in “Big Five Factors” Personality Assessment: Reliability Generalization across Studies and Measures. Educational and Psychological Measurement, 60 (2), 224–235. https://doi.org/10.1177/00131640021970475
Walt, S. van der, Colbert, S. C., & Varoquaux, G. (2011). The NumPy Array: A Structure for Efficient Numerical Computation. Computing in Science & Engineering, 13 (2), 22–30. https://doi.org/10.1109/MCSE.2011.37
Weisberg, Y. J., Deyoung, C. G., & Hirsh, J. B. (2011). Gender Differences in Personality across the Ten Aspects of the Big Five. Frontiers in Psychology, 2 , 178. https://doi.org/10.3389/fpsyg.2011.00178
Westfall, J., & Yarkoni, T. (2016). Statistically Controlling for Confounding Constructs Is Harder than You Think. PloS One, 11 (3), e0152719. https://doi.org/10.1371/journal.pone.0152719
Westlye, L. T., Bjørnebekk, A., Grydeland, H., Fjell, A. M., & Walhovd, K. B. (2011). Linking an anxiety-related personality trait to brain white matter microstructure: diffusion tensor imaging and harm avoidance. Archives of General Psychiatry, 68 (4), 369–377. https://doi.org/10.1001/archgenpsychiatry.2011.24
Woo, C.-W., Chang, L. J., Lindquist, M. A., & Wager, T. D. (2017). Building better biomarkers: brain models in translational neuroimaging. Nature Neuroscience, 20 (3), 365–377. https://doi.org/10.1038/nn.4478
Wright, C. I., Williams, D., Feczko, E., Barrett, L. F., Dickerson, B. C., Schwartz, C. E., & Wedig,
peer-reviewed) is the author/funder. All rights reserved. No reuse allowed without permission. The copyright holder for this preprint (which was not. http://dx.doi.org/10.1101/215129doi: bioRxiv preprint first posted online Nov. 7, 2017;
M. M. (2006). Neuroanatomical correlates of extraversion and neuroticism. Cerebral Cortex , 16 (12), 1809–1819. https://doi.org/10.1093/cercor/bhj118
Wu, Y., Li, L., Yuan, B., & Tian, X. (2016). Individual differences in resting-state functional connectivity predict procrastination. Personality and Individual Differences, 95 (Supplement C), 62–67. https://doi.org/10.1016/j.paid.2016.02.016
Xu, J., & Potenza, M. N. (2012). White matter integrity and five-factor personality measures in healthy adults. NeuroImage, 59 (1), 800–807. https://doi.org/10.1016/j.neuroimage.2011.07.040
Yarkoni, T. (2009). Big Correlations in Little Studies Inflated fMRI Correlations Reflect Low Statistical Power— Commentary on Vul et al. (2009). Perspectives on Psychological Science: A Journal of the Association for Psychological Science, 4 (3).
Yarkoni., T. (2015). Neurobiological substrates of personality: A critical overview. In Mikulincer, Mario Shaver, Phillip R. Cooper, M. Lynne Larsen, Randy J. (Ed.), Personality processes and individual differences (Vol. 4). American Psychological Association.
Yarkoni, T., & Westfall, J. (2017). Choosing Prediction Over Explanation in Psychology: Lessons From Machine Learning. Perspectives on Psychological Science: A Journal of the Association for Psychological Science, 1745691617693393. https://doi.org/10.1177/1745691617693393
Zou, H., & Hastie, T. (2005). Regularization and variable selection via the elastic net. Journal of the Royal Statistical Society. Series B, Statistical Methodology, 67 (2), 301–320. https://doi.org/10.1111/j.1467-9868.2005.00503.x
peer-reviewed) is the author/funder. All rights reserved. No reuse allowed without permission. The copyright holder for this preprint (which was not. http://dx.doi.org/10.1101/215129doi: bioRxiv preprint first posted online Nov. 7, 2017;
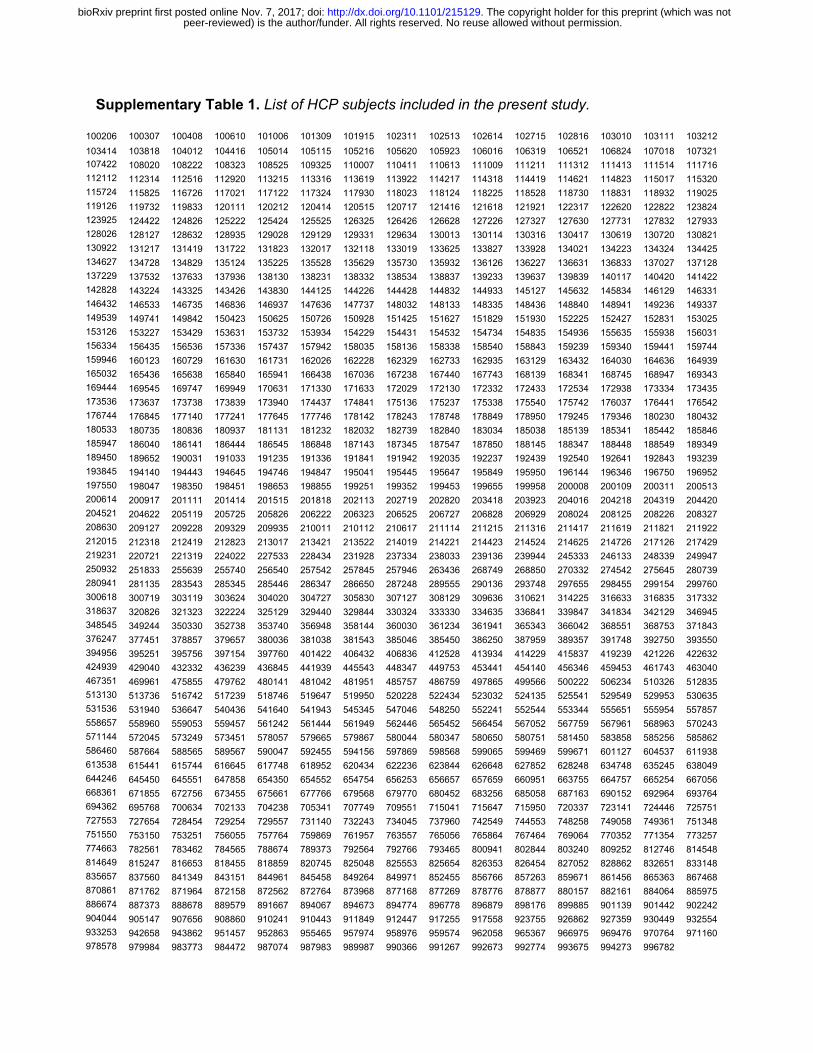
Supplementary Table 1. List of HCP subjects included in the present study.
100206 100307 100408 100610 101006 101309 101915 102311 102513 102614 102715 102816 103010 103111 103212 103414 103818 104012 104416 105014 105115 105216 105620 105923 106016 106319 106521 106824 107018 107321 107422 108020 108222 108323 108525 109325 110007 110411 110613 111009 111211 111312 111413 111514 111716 112112 112314 112516 112920 113215 113316 113619 113922 114217 114318 114419 114621 114823 115017 115320 115724 115825 116726 117021 117122 117324 117930 118023 118124 118225 118528 118730 118831 118932 119025 119126 119732 119833 120111 120212 120414 120515 120717 121416 121618 121921 122317 122620 122822 123824 123925 124422 124826 125222 125424 125525 126325 126426 126628 127226 127327 127630 127731 127832 127933 128026 128127 128632 128935 129028 129129 129331 129634 130013 130114 130316 130417 130619 130720 130821 130922 131217 131419 131722 131823 132017 132118 133019 133625 133827 133928 134021 134223 134324 134425 134627 134728 134829 135124 135225 135528 135629 135730 135932 136126 136227 136631 136833 137027 137128 137229 137532 137633 137936 138130 138231 138332 138534 138837 139233 139637 139839 140117 140420 141422 142828 143224 143325 143426 143830 144125 144226 144428 144832 144933 145127 145632 145834 146129 146331 146432 146533 146735 146836 146937 147636 147737 148032 148133 148335 148436 148840 148941 149236 149337 149539 149741 149842 150423 150625 150726 150928 151425 151627 151829 151930 152225 152427 152831 153025 153126 153227 153429 153631 153732 153934 154229 154431 154532 154734 154835 154936 155635 155938 156031 156334 156435 156536 157336 157437 157942 158035 158136 158338 158540 158843 159239 159340 159441 159744 159946 160123 160729 161630 161731 162026 162228 162329 162733 162935 163129 163432 164030 164636 164939 165032 165436 165638 165840 165941 166438 167036 167238 167440 167743 168139 168341 168745 168947 169343 169444 169545 169747 169949 170631 171330 171633 172029 172130 172332 172433 172534 172938 173334 173435 173536 173637 173738 173839 173940 174437 174841 175136 175237 175338 175540 175742 176037 176441 176542 176744 176845 177140 177241 177645 177746 178142 178243 178748 178849 178950 179245 179346 180230 180432 180533 180735 180836 180937 181131 181232 182032 182739 182840 183034 185038 185139 185341 185442 185846 185947 186040 186141 186444 186545 186848 187143 187345 187547 187850 188145 188347 188448 188549 189349 189450 189652 190031 191033 191235 191336 191841 191942 192035 192237 192439 192540 192641 192843 193239 193845 194140 194443 194645 194746 194847 195041 195445 195647 195849 195950 196144 196346 196750 196952 197550 198047 198350 198451 198653 198855 199251 199352 199453 199655 199958 200008 200109 200311 200513 200614 200917 201111 201414 201515 201818 202113 202719 202820 203418 203923 204016 204218 204319 204420 204521 204622 205119 205725 205826 206222 206323 206525 206727 206828 206929 208024 208125 208226 208327 208630 209127 209228 209329 209935 210011 210112 210617 211114 211215 211316 211417 211619 211821 211922 212015 212318 212419 212823 213017 213421 213522 214019 214221 214423 214524 214625 214726 217126 217429 219231 220721 221319 224022 227533 228434 231928 237334 238033 239136 239944 245333 246133 248339 249947 250932 251833 255639 255740 256540 257542 257845 257946 263436 268749 268850 270332 274542 275645 280739 280941 281135 283543 285345 285446 286347 286650 287248 289555 290136 293748 297655 298455 299154 299760 300618 300719 303119 303624 304020 304727 305830 307127 308129 309636 310621 314225 316633 316835 317332 318637 320826 321323 322224 325129 329440 329844 330324 333330 334635 336841 339847 341834 342129 346945 348545 349244 350330 352738 353740 356948 358144 360030 361234 361941 365343 366042 368551 368753 371843 376247 377451 378857 379657 380036 381038 381543 385046 385450 386250 387959 389357 391748 392750 393550 394956 395251 395756 397154 397760 401422 406432 406836 412528 413934 414229 415837 419239 421226 422632 424939 429040 432332 436239 436845 441939 445543 448347 449753 453441 454140 456346 459453 461743 463040 467351 469961 475855 479762 480141 481042 481951 485757 486759 497865 499566 500222 506234 510326 512835 513130 513736 516742 517239 518746 519647 519950 520228 522434 523032 524135 525541 529549 529953 530635 531536 531940 536647 540436 541640 541943 545345 547046 548250 552241 552544 553344 555651 555954 557857 558657 558960 559053 559457 561242 561444 561949 562446 565452 566454 567052 567759 567961 568963 570243 571144 572045 573249 573451 578057 579665 579867 580044 580347 580650 580751 581450 583858 585256 585862 586460 587664 588565 589567 590047 592455 594156 597869 598568 599065 599469 599671 601127 604537 611938 613538 615441 615744 616645 617748 618952 620434 622236 623844 626648 627852 628248 634748 635245 638049 644246 645450 645551 647858 654350 654552 654754 656253 656657 657659 660951 663755 664757 665254 667056 668361 671855 672756 673455 675661 677766 679568 679770 680452 683256 685058 687163 690152 692964 693764 694362 695768 700634 702133 704238 705341 707749 709551 715041 715647 715950 720337 723141 724446 725751 727553 727654 728454 729254 729557 731140 732243 734045 737960 742549 744553 748258 749058 749361 751348 751550 753150 753251 756055 757764 759869 761957 763557 765056 765864 767464 769064 770352 771354 773257 774663 782561 783462 784565 788674 789373 792564 792766 793465 800941 802844 803240 809252 812746 814548 814649 815247 816653 818455 818859 820745 825048 825553 825654 826353 826454 827052 828862 832651 833148 835657 837560 841349 843151 844961 845458 849264 849971 852455 856766 857263 859671 861456 865363 867468 870861 871762 871964 872158 872562 872764 873968 877168 877269 878776 878877 880157 882161 884064 885975 886674 887373 888678 889579 891667 894067 894673 894774 896778 896879 898176 899885 901139 901442 902242 904044 905147 907656 908860 910241 910443 911849 912447 917255 917558 923755 926862 927359 930449 932554 933253 942658 943862 951457 952863 955465 957974 958976 959574 962058 965367 966975 969476 970764 971160 978578 979984 983773 984472 987074 987983 989987 990366 991267 992673 992774 993675 994273 996782
peer-reviewed) is the author/funder. All rights reserved. No reuse allowed without permission. The copyright holder for this preprint (which was not. http://dx.doi.org/10.1101/215129doi: bioRxiv preprint first posted online Nov. 7, 2017;
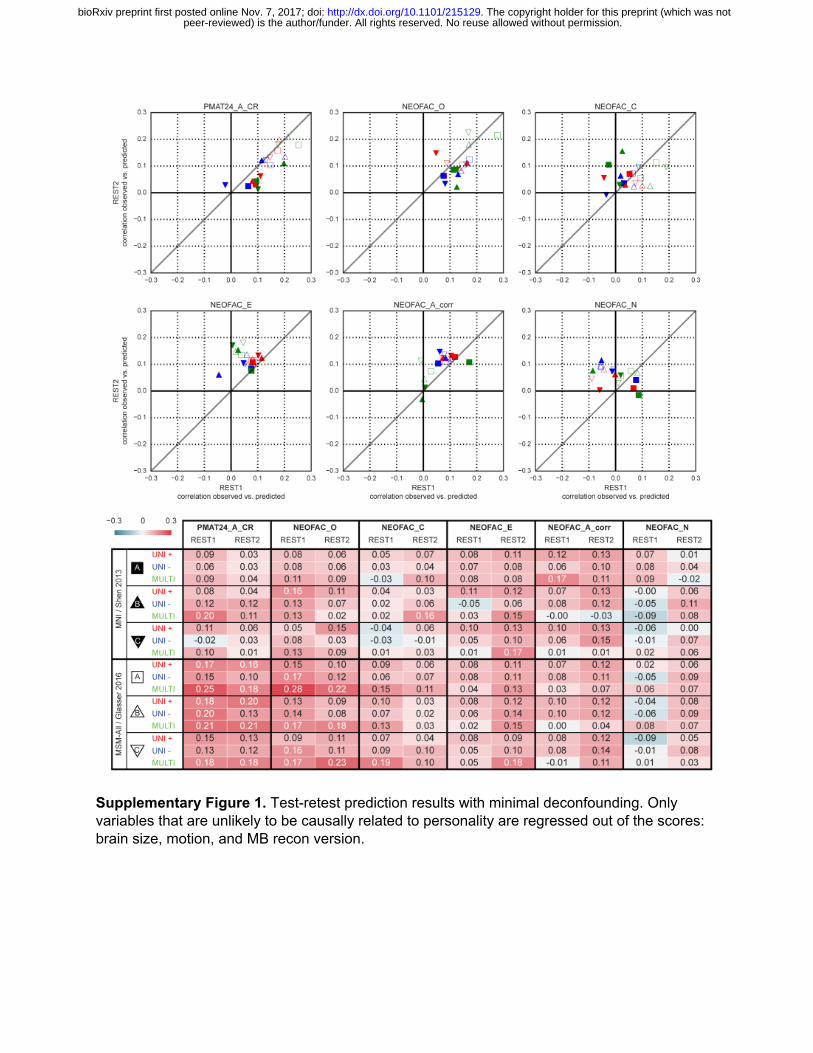
Supplementary Figure 1. Test-retest prediction results with minimal deconfounding. Only variables that are unlikely to be causally related to personality are regressed out of the scores: brain size, motion, and MB recon version.
peer-reviewed) is the author/funder. All rights reserved. No reuse allowed without permission. The copyright holder for this preprint (which was not. http://dx.doi.org/10.1101/215129doi: bioRxiv preprint first posted online Nov. 7, 2017;