result presentation q2 2015
TRANSCRIPT

© Wärtsilä
WÄRTSILÄ CORPORATIONINTERIM REPORT JANUARY-JUNE 2015
17 JULY 2015Björn Rosengren,President & CEO

• Order intake EUR 1,159 million, +2%• Net sales EUR 1,230 million, +10%• Book-to-bill 0.94 (1.02)• EBIT EUR 137 million, 11.1% of net sales
(EUR 132 million or 11.8%)• EBITA EUR 144 million, 11.7% of net sales
(EUR 138 million or 12.4%) • EPS EUR 0.54 (0.42)• Cash flow from operating activities
EUR 47 million (61)• Order book at the end of the period
EUR 5,325 million, +20%• Acquisition of L-3 MSI finalised• Strategy fine-tuned, business names changed
EBIT is shown excluding non-recurring items.EBITA is shown excluding non-recurring items and purchase price allocation amortisation.As a result of the 2-stroke operations being classified as discontinued operations in 2014, comparison figures related to the statement of income have been restated.
Highlights Q2/2015
2 © Wärtsilä

© Wärtsilä
0
200
400
600
800
1000
1200
1400
Q2/2014 Q2/2015
2%
-23%
13%
2%
1,138
MEUR
Second quarter development
MEUR
3
Order intake growth supported by Services
0
500
1000
1500
2000
2500
3000
3500
4000
4500
5000
5500
2011 2012 2013 2014 2015
1,159
Q1-Q2 Q3-Q4
EnergySolutions
MarineSolutions
Services

© Wärtsilä
0
200
400
600
800
1000
1200
1400
Q2/2014 Q2/2015
Net sales in line with our expectations
0
500
1000
1500
2000
2500
3000
3500
4000
4500
5000
2011 2012 2013 2014 2015
10%
17%
-15%
40%
1,116
MEUR
Second quarter development
MEUR
1,230
4
Net sales developed well
Q1-Q2 Q3-Q4
EnergySolutions
MarineSolutions
Services

© Wärtsilä
Net sales by business 1-3/2012
Marine Solutions30% (37)
Energy Solutions23% (20)
Services47% (43)
5
Net sales by business 1-6/2015

© Wärtsilä
1.07 1.05 1.05 1.06 1.10
0,0
0,2
0,4
0,6
0,8
1,0
1,2
0
500
1000
1500
2000
2500
3000
3500
4000
4500
5000
5500
2011 2012 2013 2014 1-6/2015
Order intake Net sales Book-to-bill
MEUR
6
Book-to-bill ratio remains above one

© Wärtsilä
Order book distribution
MEUR
7
Order book distribution
0
500
1000
1500
2000
2500
3000
3500
30.6.2014 30.6.2015
Delivery current year Delivery next year or later

© Wärtsilä
MEUR
8
Operating result and profitability
EBIT%EBIT
11.1% 10.9% 11.2%11.9%
0%
2%
4%
6%
8%
10%
12%
14%
0
100
200
300
400
500
600
2011 2012 2013 2014
EBIT is shown before non-recurring items. Figures for 2011-2013 and Q2/2014 include both discontinued and continuing operations.
Second quarter development
MEUR
10.8% 11.1%
0%
2%
4%
6%
8%
10%
12%
0
20
40
60
80
100
120
140
Q2/2014 Q2/2015

© Wärtsilä9
Challenging environment in the power generation markets

© Wärtsilä10
Energy Solutions’ quotation activity on a good level
0
2 000
4 000
6 000
8 000
10 000
12 000
14 000
16 000
18 000
Q1/2012
Q2/2012
Q3/2012
Q4/2012
Q1/2013
Q2/2013
Q3/2013
Q4/2013
Q1/2014
Q2/2014
Q3/2014
Q4/2014
Q1/2015
Q2/2015
MW
Multi-fuel
Gas
Liquid fuel

© Wärtsilä
0
200
400
600
800
1000
1200
1400
1600
1800
2011 2012 2013 2014 2015
MEUR Review period developmentTotal EUR 475 million (409)
IPP’s*
Utilities
Industrials
Oil 56%
Gas44%
Review period order intake by fuel in MW
x%
11
Growth in Energy Solutions’ order intake
49%
10%
41%
Q1-Q2 Q3-Q4
*IPP = Independent Power Producer

© Wärtsilä
40
584
31
Order intake 1-6/2015: 1,222 MW (986)
Americas 239 (76)
Asia 111 (284)
Africa and Middle East 175 (265)
UtilitiesIPP’sIndustrials
12
Energy Solutions’ orders globally
636
135
Europe 698 (361)
239
40
40

© Wärtsilä1313
21.5%
52.4%
10.3%
Market <500 MW4.7 GW (6.5)
15.0%
13
Market data includes all Wärtsilä power plants and other manufacturers’ gas and liquid fuelled turbine based power plants with prime movers above 5 MW, as well as estimated output of steam turbines for combined cycles. The data is gathered from the McCoy Power Report.Other combustion engines not included. In engine technology Wärtsilä has a leading position.
0.9%
Total market9.7 GW (11.0)
GE Siemens MHI Wärtsilä Other GTs
29.0%
43.3%
7.2%
20.1%
0.4%
Market for gas and liquid fuel based power plants 1-3/2015

© Wärtsilä14
Contracting volumes remain low

© Wärtsilä
0
1
2
3
4
5
0
50
100
150
200
250
01.0
903
.09
05.0
907
.09
09.0
911
.09
01.1
003
.10
05.1
007
.10
09.1
011
.10
01.1
103
.11
05.1
107
.11
09.1
111
.11
01.1
203
.12
05.1
207
.12
09.1
211
.12
01.1
303
.13
05.1
307
.13
09.1
311
.13
01.1
403
.14
05.1
407
.14
09.1
411
.14
01.1
503
.15
05.1
5
Mill
ion
CG
T
# of
ves
sels
Merchant Offshore Cruise and Ferry Special vessels 3 months moving average in CGT
15
Vessel contracting activity
Source: Clarkson Research Services, figures exclude late contracting* CGT= gross tonnage compensated with workload
*
*
06.1
5

© Wärtsilä
0
300
600
900
1200
1500
1800
2011 2012 2013 2014 2015
MEUR
Review period developmentTotal EUR 728 million (823)
Offshore15%
Traditional merchant
16%
Special vessels10%
16
Marine Solutions’ order intake
Others 4%
Q1-Q2 Q3-Q4
Gas carriers34%
Cruise & Ferry18%Navy
3%

© Wärtsilä
• Joint venture order intake totalled EUR 140 million (92) during January-June 2015
• Wärtsilä’s share of ownership in these companies is 50%, and the results are reported as a share of result of associates and joint ventures
MEUR
Marine Solutions order intake
Joint venture order intake, includes figures from Wärtsilä Hyundai Engine Company Ltd. and Wärtsilä Qiyao Diesel Company Ltd.
17
Joint venture ordering activity
0
100
200
300
400
500
600
700
Q1/2010
Q2/2010
Q3/2010
Q4/2010
Q1/2011
Q2/2011
Q3/2011
Q4/2011
Q1/2012
Q2/2012
Q3/2012
Q4/2012
Q1/2013
Q2/2013
Q3/2013
Q4/2013
Q1/2014
Q2/2014
Q3/2014
Q4/2014
Q1/2015
Q2/2015

© Wärtsilä
Wärtsilä’s market shares are calculated on a 12 months rolling basis, numbers in brackets are from the end of the previous quarter. The calculation is based on Wärtsilä’s own data portal.
Wärtsilä59% (56)
Others 16% (16)
MAN D&T15% (15)
Caterpillar10% (13)
Total market volume last 12 months:4,988 MW (5,711)
Medium-speed main engines
Wärtsilä5% (4)
Auxiliary engines
Total market volume last 12 months:4,078 MW (4,988)
Others95% (96)
18
Strong position in marine engine market
© Wärtsilä
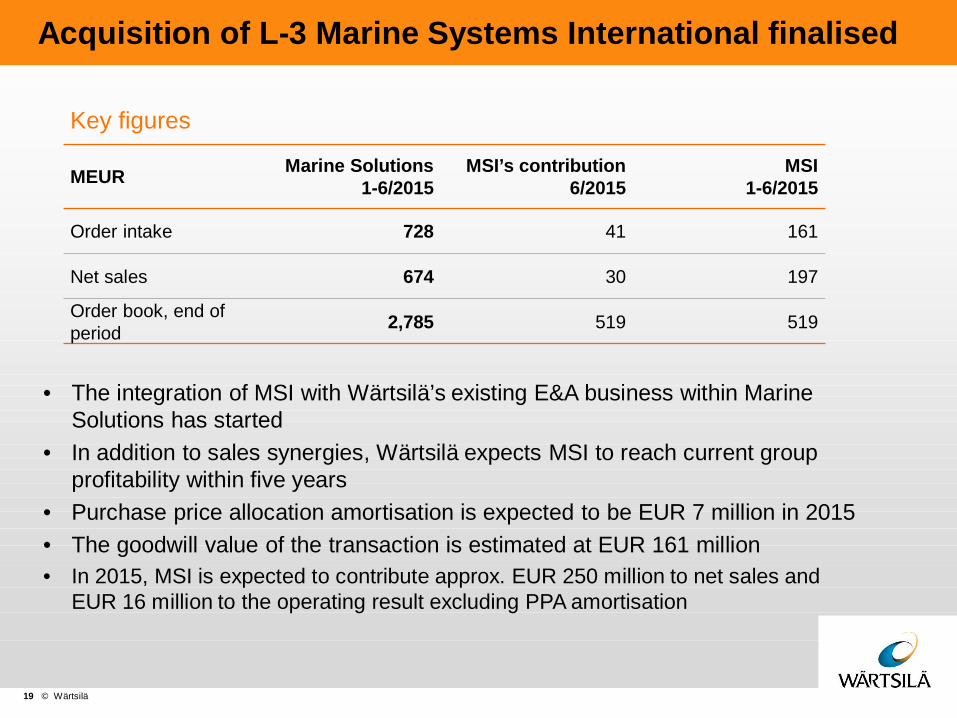
• The integration of MSI with Wärtsilä’s existing E&A business within Marine Solutions has started
• In addition to sales synergies, Wärtsilä expects MSI to reach current group profitability within five years
• Purchase price allocation amortisation is expected to be EUR 7 million in 2015• The goodwill value of the transaction is estimated at EUR 161 million• In 2015, MSI is expected to contribute approx. EUR 250 million to net sales and
EUR 16 million to the operating result excluding PPA amortisation
19
Acquisition of L-3 Marine Systems International finalised
Key figures
MEUR Marine Solutions1-6/2015
MSI’s contribution6/2015
MSI1-6/2015
Order intake 728 41 161
Net sales 674 30 197
Order book, end of period 2,785 519 519

© Wärtsilä
• Wärtsilä Marine Solutions plans to realign its organisation to maintain competitiveness in an environment of low demand
• Approx. 600 jobs will be reduced, of which 160 in Finland
• Wärtsilä seeks annual savings in the region of EUR 40 million
• The non-recurring costs related to the restructuring measures will be approximately EUR 25-30 million
• Currently, Wärtsilä Marine Solutions employs 7,217 people globally
20
Marine Solutions business to be adjusted to reflect the current market situation

© Wärtsilä21
Good activity in the service markets, market outlook remains positive

© Wärtsilä
0
200
400
600
800
1000
1200
1400
1600
1800
2000
2011 2012 2013 2014 2015
-3%
0
100
200
300
400
500
600
Q2/2014 Q2/2015
MEUR
Second quarter development
MEUR
468
17% 548
22
Services’ net sales increased by 14% in 1-6/2015
5%
Q1-Q2 Q3-Q4
5%

© Wärtsilä
Spare parts 51%(52)
Field service 24%(25)
Contracts 17%(17)
Projects7%(6)
23
Total EUR 1,034 million (903)
Services net sales distribution 1-6/2015
© Wärtsilä24
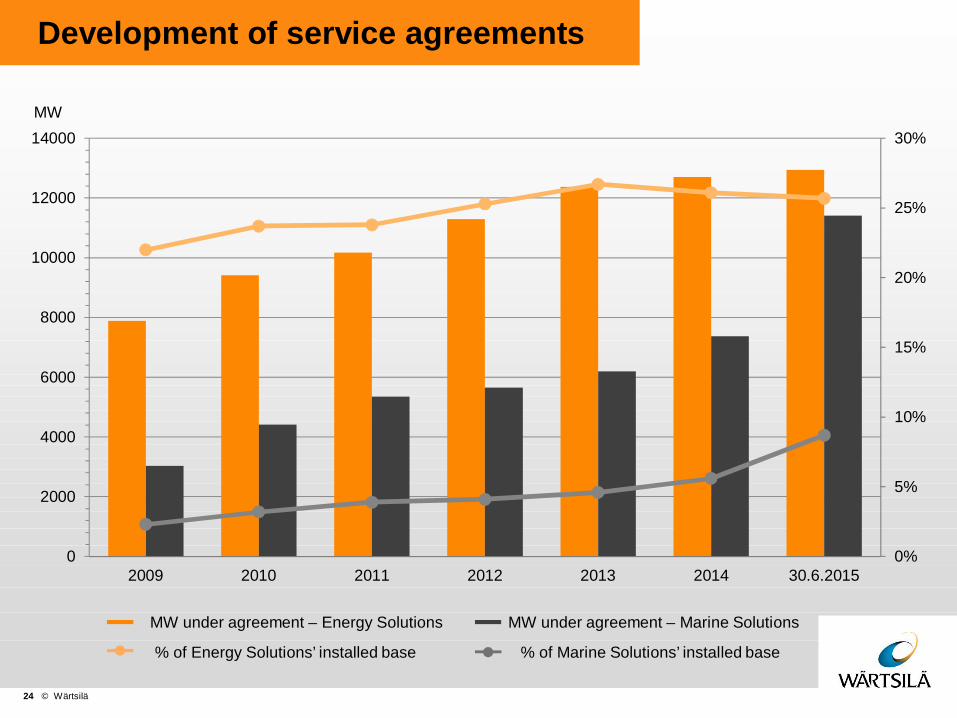
MW
Development of service agreements
MW under agreement – Energy Solutions MW under agreement – Marine Solutions
% of Marine Solutions’ installed base% of Energy Solutions’ installed base
0%
5%
10%
15%
20%
25%
30%
0
2000
4000
6000
8000
10000
12000
14000
2009 2010 2011 2012 2013 2014 30.6.2015

© Wärtsilä
• QuantiParts operates from the Netherlands and serves customers in the marine, locomotive and power plant industries worldwide
• QuantiParts trades OEM spare parts for selected mature Wärtsilä medium- and high-speed 4-stroke engines
• Establishing QuantiParts fits well with Wärtsilä Services strategy of aligning its organisation in order to ensure tailor-made services for its customers
25
QuantiParts B.V. – a new subsidiary to trade spare parts for classic 4-stroke Wärtsilä engines

© Wärtsilä26
Solid financial standing

© Wärtsilä27
Cash flow from operating activities
0
100
200
300
400
500
600
700
2011 2012 2013 2014
MEUR
0
20
40
60
80
100
120
140
160
180
1-6/2014 1-6/2015
Review period development
MEUR
© Wärtsilä
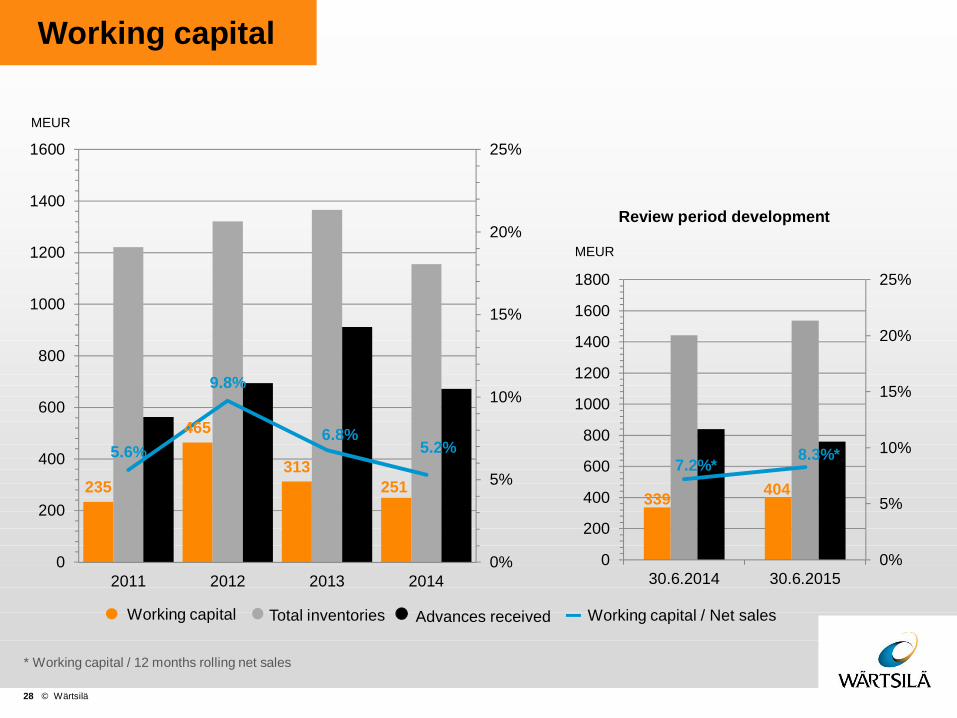
235
465
313251
5.6%
9.8%
6.8%5.2%
0%
5%
10%
15%
20%
25%
0
200
400
600
800
1000
1200
1400
1600
2011 2012 2013 2014
Working capital Total inventories Advances received Working capital / Net sales
MEUR
28
Working capital
MEUR
Review period development
* Working capital / 12 months rolling net sales
339 4047.2%* 8.3%*
0%
5%
10%
15%
20%
25%
0
200
400
600
800
1000
1200
1400
1600
1800
30.6.2014 30.6.2015

© Wärtsilä29
Gearing impacted by L-3 MSI acquisition
0,00
0,10
0,20
0,30
0,40
0,50
2011 2012 2013 2014 0,00
0,10
0,20
0,30
0,40
0,50
30.6.2014 30.6.2015
Review period development

© Wärtsilä
• Energy Solutions: Based on the market situation during 2014 and the GDP forecasts for 2015, the market for liquid and gas fuelled power generation is expected to remain challenging.
• Marine Solutions: The outlook for the shipping and shipbuilding market environment is challenging. Low oil prices are impacting demand for offshore vessels. The sentiment in the gas carrier market and cruise & ferry is healthy.
• Services: The overall service market outlook is positive with growth opportunities in selected regions and segments.
30
Market outlook
© Wärtsilä31
Wärtsilä expects its net sales for 2015 to grow by 5-10% and its operational profitability (EBIT% before non-recurring items) to be between 12.0-12.5%. The guidance includes the impact of the L-3 Marine Systems International acquisition.
Prospects for 2015 revised

© Wärtsilä
• Environmental awareness and changing energy needs are increasingly steering investments in the markets in which we operate
• We seek growth by offering energy efficient lifecycle solutions, gas based technology, as well as innovative solutions that leverage our project management and engineering competence
• Our growth ambitions are supported by our superior global service network
32
Company strategy fine-tuned

© Wärtsilä
• The Wärtsilä 31 engine is the marine industry’s most advanced, powerful, fuel efficient, fuel flexible, and environmentally sound engine
• The engine achieved a Guinness World Records title for the most efficient 4-stroke diesel engine
• Remarkable increases in fuel efficiency andfuel flexibility are matched by significant reductions in maintenance costs
• The engine comes in three alternative versions; diesel, dual-fuel and spark-ignited gas
33
A brand new medium-speed Wärtsilä 31 engine launched in June
IR Contact:Natalia ValtasaariDirector, Investor Relations Tel. +358 (0) 40 187 7809E-mail: [email protected]