result update bajaj finserv companyname...
TRANSCRIPT

Edelweiss Research is also available on www.edelresearch.com, Bloomberg EDEL <GO>, Thomson First Call, Reuters and Factset.
Edelweiss Securities Limited
RESULT UPDATE
BAJAJ FINSERV Steady quarter; fairly valued
COMPANYNAME
COMPANYNAME
EDELWEISS 4D RATINGS
Absolute Rating HOLD
Rating Relative to Sector Performer
Risk Rating Relative to Sector Low
Sector Relative to Market Overweight
MARKET DATA (R: BJFS.BO, B: BJFIN IN)
CMP : INR 4,319
Target Price : INR 4,093
52-week range (INR) : 4,750 / 1,725
Share in issue (mn) : 159.1
M cap (INR bn/USD mn) : 687 / 10,601
Avg. Daily Vol.BSE/NSE(‘000) : 197.8
SHARE HOLDING PATTERN (%)
Current Q3FY17 Q2FY17
Promoters *
58.3 58.3 58.3
MF's, FI's & BK’s 6.4 6.8 8.3
FII's 8.2 7.9 6.1
Others 27.0 27.0 27.2
* Promoters pledged shares (% of share in issue)
: NIL
PRICE PERFORMANCE (%)
Stock Nifty EW Banks and
Financial Services Index
1 month (1.2) 3.6 4.3
3 months 17.2 6.9 9.9
12 months 132.3 19.8 35.2
Nilesh Parikh +91 22 4063 5470
Kunal Shah +91 22 4040 7579
Prakhar Agarwal +91 22 6620 3076
India Equity Research| Banking and Financial Services
May 18, 2017
SOTP
Business Method Value (INR mn) Value per share
BAGIC Price to Book 1,89,521 881
BALIC Appraisal Value 2,35,361 1,094
Bajaj Finance Price to Earnings 7,69,712 2,796
Investments 1 times book 7,000 44
Net value (Net of holding company discount of 15%) 4,093
While Bajaj Finserv’s Q4FY17 operating performance was on track, the recent price outperformance leading to full valuations limits the return potential. Thus, we downgrade to ‘HOLD/SP’. Bajaj Finance (BFL) reported a off-track performance given higher credit costs, though core operational parameters were steady. Bajaj General recorded better quarter with improvement in combined ratio. Life insurance (BALIC) continued to improve operating metrics (better individual growth, persistency), though sustainability of same is key. While we are enthused by business performance, BFL’s steep valuations (>23x FY19E P/E) could be tested by rising competitive intensity and any blip on asset quality. Also, intrinsic value of life insurance is already at lower discount to listed market peers, despite <10% core RoEV, which suggests limited upside. Thus, we downgrade to ‘HOLD’ with target price of INR4,093.
BFL: Q4FY17 performance was mixed. Operationally, it was a strong quarter - NII
>50%, driven by >36% AUM growth and NIMs (calc) expansion by >100bps YoY. But,
credit cost spiked (INR2.9bn), largely due to provision of INR700mn on higher
slippages (in 2W and LAP) due to demonetisation. Consequently, GNPL increased to
1.68% (1.47% in Q3FY17).
BALIC: Operating metrics improved (individual APE growth of ~23% following
improvement in agency channel, albeit on low base), but sustainability is key.
Growth was tilted towards ULIPs which constituted 70% (versus 51% in FY16).
Consequently, NBM (pre-overrun) stood lower at 12.9% (16.6% in FY16). The entity
reported EV of INR113bn (INR98.7bn in FY16), suggesting RoEV of 14% aided by
investment variance. However, higher cost overruns fed into sub-10% core RoEV.
BAGIC: GWP grew >30% on higher crop insurance. Increased crop coverage
(announced in Budget) gives us confidence of sustainability of same. On positive
note, combined ratio declined to 92.7% (99.6% in Q3FY17), leading to underwriting
profit of INR350mn. However, lower investment income led to dip in profitability.
Outlook and valuations: Limited upside; downgrade to ‘HOLD’
While we are enthused by the improvement in operating variables across businesses, the
recent stock outperformance renders unfavourable risk-reward ratio. BFL is trading at
>23x FY19E P/E, which could be tested by rising competitive intensity and any blip in
asset quality. Life insurance trades at valuations of ~1.8-2x, despite <10% of core RoEV.
General insurance clocked strong operating performance (RoE potential of 23% plus), but
implicit valuation is higher than some deals in this space. Factoring in these, we see
limited upside. Hence, we downgrade to ‘HOLD/SP’ from ‘BUY/SP’ with SoTP of INR4,093.

Banking and Financial Services
2 Edelweiss Securities Limited
Business Overview
BALIC: Individual APE growth sustains, core RoEV at sub-10% levels
Gross written premium (GWP) came in at INR22.5bn (down 7% YoY, albeit on higher
base), given >5% YoY dip in new business premium (NBP) and >8% dip in renewal
premiums. For the full year FY17, NBP grew ~14% YoY. But, owing to softer renewals
growth (down 4% YoY), GWP growth was pegged at 4.8% YoY.
Segment-wise, individual APE growth improved (up ~23% YoY) with group NBP
declining to INR7.4bn (versus INR8.57bn in Q4FY16). The company’s efforts in terms of
agency force revamp in past few years seem to be yielding some results (agency
channel’s individual APE moved up >35% for FY17). However, sustainability of same
needs to be tracked.
Growth seems to have been coming from the tilt towards ULIP segment (formed 74% of
individual APE in Q4FY17 versus 58% a year ago). Consequently, NBMs (pre-overrun)
were lower at 12.9% (16.6% in FY16).
AUM, as at Q4FY17, stood at INR493bn (up 11.5% YoY) with ~42% contributed by unit
funds. Improving AUM accretion along with rationalisation of expenses holds key to
BALIC’s stable earnings.
The company reported embedded value (EV) of INR113bn for FY17 (versus INR98.7bn in
FY16), suggesting RoEV of 14%. However, the rise was supported by INR6.4bn of
investment variance, adjusting for which core RoEV stood at sub-10% levels due to
higher cost-overruns.
Solvency ratio stood at healthy 582% (regulatory requirement of 150%).
Table 1: BALIC - Key metrics (INR mn)
Source: Company
Table 2: AUM composition
Source: Company
(INR mn) Q4FY17 Q4FY16 YoY (%) Q3FY17 QoQ (%) FY16 FY17 YoY (%)
Gross Written Premium 22,480 24,190 (7.1) 14,847 51.4 58,970 61,830 4.8
New Business Premium 11,460 12,130 (5.5) 7,820 46.5 28,850 32,900 14.0
Renewal Premium 11,020 12,060 (8.6) 7,026 56.8 30,120 28,930 (4.0)
Shareholder Profit 1,982 2,316 (14.4) 1,924 3.0 8,790 8,360 (4.9)
(INR mn) Q3FY16 Q4FY16 Q1FY17 Q2FY17 Q3FY17 Q4FY17
AUM 4,33,614 4,41,075 4,58,000 4,69,000 4,68,000 4,92,000
-Unit Linked 1,93,012 1,92,215 2,01,000 2,03,000 1,95,000 2,08,000
-Other than Linked 2,40,602 2,48,860 2,57,000 2,66,000 2,73,000 2,84,000

Bajaj Finserv
3 Edelweiss Securities Limited
BFL: Operationally strong, but higher credit costs take toll on earnings
BFL’s Q4FY17 performance was mixed. Operationally, the company reported a strong
quarter - NII >50%, driven by >36% AUM growth and NIMs (calc) expansion by >100bps
YoY. But, higher credit costs (INR2.9bn, up > 85% YoY) led to lower profitability.
BFL posted PAT of INR4.5bn (down >19% QoQ), which stood lower than estimates on
higher credit cost as the company made higher provision of INR700mn on account of
demonetisation and non-recurring provision. The company highlighted that there are
balance provisions of INR400-500mn that would be taken over next 2-3 quarters, post
which it would return to normalised credit cost.
AUM came in at INR602bn (up >36% YoY, commendable given challenging
environment). Growth was driven by consumer (up >43% YoY) and commercial (up
>50% YoY) segments. On the other hand, SME segment growth remained sluggish (up
18% YoY, a conscious decision by management). Management stated they would grow
cautiously in small business segments and in the interim consumer segment would
drive growth.
GNPLs during the quarter came in at 1.68% versus 1.47% in previous quarter. NPAs
increased mainly in 2-wheeler and LAP segments, with other segments back at pre-
demonetisation levels from asset quality standpoint
NIMs (calc.) dipped >100bps QoQ to 11.4%, though a seasonal effect - NIMs are higher
in first and third quarters due to up-fronting of income recognition. The decline in this
quarter was lower than historical trend aided by benefits of funding cost (NIMs
improved > 100bps YoY).
Strategy perspective: From 1-3 years horizon, management is confident of delivering
>25% balance sheet growth and balance sheet composition would be ~35-37% of
consumer lending, ~45-47% of SME financing, ~10-12% of commercial lending, with
rural book comprising the rest.
Table 3: BFL- Key metrics
Table 4: Portfolio composition
Source: Company
(INR mn) Q4FY17 Q4FY16 YoY (%) Q3FY17 QoQ (%) FY16 FY17 YoY (%)
Interest Income 26,650 19,162 39.1 26,930 (1.0) 73,330 1,00,030 36.4
Interest Expense 9,837 8,058 22.1 9,802 0.4 29,270 38,030 29.9
Net Interest Income 16,813 11,104 51.4 17,128 (1.8) 44,060 62,000 40.7
Operating Expenses 7,099 4,921 44.3 6,940 2.3 18,980 25,640 35.1
Operating Profit 9,794 6,455 51.7 10,297 (4.9) 25,080 36,360 45.0
PBT 6,897 4,890 41.0 8,500 (18.9) 19,650 28,180 43.4
Tax 2,406 1,740 38.3 2,943 (18.3) 6,860 9,810 43.0
PAT 4,492 3,150 42.6 5,557 (19.2) 12,790 18,370 43.6
(%) Q1FY16 Q2FY16 Q3FY16 Q4FY16 Q1FY17 Q2FY17 Q3FY17 Q4FY17
Consumer Finance 42.0 41.3 42.3 42.9 44.2 45.7 46.9 45.1
SME Business 46.8 46.9 44.1 42.3 40.3 38.9 36.6 36.7
Commercial 9.7 10.0 11.0 11.8 12.1 11.7 12.1 13.1
Rural 1.5 1.7 2.7 3.0 3.4 3.7 4.5 5.1

Banking and Financial Services
4 Edelweiss Securities Limited
Table 5: Asset quality marginally increases
Source: Company
BAGIC: Growth sustained, combined ratio improves
GWP growth maintained momentum (up >30%), largely driven by higher crop insurance
under the Pradhan Mantri Fasal Bima Yojna (proportion of agri business rose to 21%
versus 14% in previous quarter). Higher crop coverage from 30% in FY17 to 40% in FY18
(announced in Budget) raises our confidence of sustainability of same.
Combined ratio (including motor pool losses) fell to 92.7% (versus 99.6% in previous
quarter), leading to underwriting profit of INR350mn. However, lower investment
income (INR2.1bn versus run-rate of INR2.4bn in past few quarters) led to lower
profitability.
While there is 85% re-insurance arrangement, further cushioned by stop-loss
arrangement with banks, actual loss will be ascertained in couple of quarters and will
be a key monitorable.
Table 6: BAGIC - Key metrics (INR mn)
Table 7: Combined ratio (including motor pool losses) falls to 92.7%
Source: Company
Table 8: SoTP valuation (FY19E)
Source: Edelweiss research
(%) Q3FY16 Q4FY16 Q1FY17 Q2FY17 Q3FY17 Q4FY17
GNPLs 1.3 1.2 1.5 1.6 1.5 1.7
NNPLs 0.3 0.3 0.4 0.4 0.4 0.4
(INR mn) Q4FY17 Q4FY16 YoY (%) Q3FY17 QoQ (%) FY16 FY17 YoY (%)
Gross written premium 22,600 17,300 30.6 17,216 31.3 59,010 76,870 30.3
Net Earned Premium 13,000 11,260 15.5 12,588 3.3 42,240 49,370 16.9
Investment Income 2,120 2,270 (6.6) 2,950 (28.1) 8,360 10,140 21.3
PBT 2,482 2,575 (3.6) 3,023 (17.9) 7,710 10,780 39.8
Tax 832 495 68.2 1,052 (20.9) 2,070 3,500 69.1
PAT 1,650 2,080 (20.7) 1,971 (16.3) 5,640 7,280 29.1
(%) Q1FY16 Q2FY16 Q3FY16 Q4FY16 Q1FY17 Q2FY17 Q3FY17 Q4FY17
Combined ratios 95.7 98.9 108.7 94.3 101.2 94.3 99.6 92.7
Business Method INR mn Multiple
Business
Valuation Stake
Bajaj Finserv
valuation Per share
BAGIC Price to Book 54,149 3.5 1,89,521 74% 1,40,245 881
BALIC Appraisal Value 1,32,536 1.8 2,35,361 74% 1,74,167 1,094
Bajaj Finance Price to Earnings 30,788 25.0 7,69,712 58% 4,44,893 2,796
Investments 1 times book 7,000 1.0 7,000 100% 7,000 44
total 4,816
Less: Holding co. disc. 15% 722
Sum of Parts 4,093

Bajaj Finserv
5 Edelweiss Securities Limited
Financial snapshot (Standalone) (INR mn)
Income statement Q4FY17 Q4FY16 YoY (%) Q3FY17 QoQ (%) FY17E FY18E FY19E
Operational Income 239 825 (71.1) 227 5.2 1,539 1,816 2,070
Other Income 30 23 28.9 27 11.6 111 155 202
Total income 269 848 (68.3) 254 5.9 1,650 1,971 2,272
Other operating expenses 88 64 36.8 81 8.2 392 335 341
Employee expense 60 40 49.1 47 26.1 204 218 248
Total expenses 148 104 41.5 129 14.8 595 553 589
Gross profit 121 744 (83.7) 125 (3.3) 1,055 1,418 1,683
Depreciation 4 2 54.2 4 0.0 15 18 18
Profit before tax 117 742 (84.2) 122 (3.4) 1,040 1,400 1,665
Tax 54 67 (19.4) 58 (7.5) 340 252 300
Reported net profit 64 675 (90.6) 63 0.5 700 1,148 1,365
Ratios (%)
Tax rate 45.9 9.0 48.0 32.7 18.0 18.0
Operating profit margin 45.1 87.7 49.3 63.9 71.9 74.1
Net profit margin 23.6 79.5 24.9 42.4 58.2 60.1

Banking and Financial Services
6 Edelweiss Securities Limited
Q3FY17 Concall Highlights
Life Insurance
The company started its transformation journey 2 years ago and the benefits are
starting to kick-in
o Despite higher base, management expects the growth momentum to sustain
(above industry growth)
Individual rated premium continued the growth momentum and continues to remain a
focus area
o Grew by ~62% YoY for Q3FY17, vs. industry growth rate of ~22%
Share of ULIPs is higher as that is what is selling in the markets
o Management expects the next quarter to be like Q3FY17
o The company has increased minimum ticket size and is focusing on larger cities
(where its share is lower)
o Lower allowances in ULIPs is being compensated by rationalization of expenses
Protection business is mostly in the group segment
o Group: Huge amount of financial inclusion business (~INR4bn single premium in
9MFY17)
o Individual: Not much growth as the company did have a competititive product in
the market
However, the company has launched a product few weeks back and expects it
to gain traction
AUM: Transition from old book to new book will take 2-3 years of time
o While new book is growing, old book has seen higher surrenders (Q3 better as
compared to Q1 and Q2)
o Over next few years, management expects maturity pressure within the old book
Bancassurance: The company is in discussion with a few bancassurance partners
o Some of them are new banks, which may go with more than 1 partner
o Management expects the banks to take a decision within the next 3-6 months
General Insurance
Crop insurance is expected to be a regular part of business (although quantum may
vary)
o Business: ~INR2.4bn in Q3FY17 (vs. ~INR7.4bn in Q2FY17)
o Management expects claim ratios to be better this year (below 100%) as compared
to last year
The company’s claim ratios should be better than the market average
o Govt. initiatives (incl. increased budget for CI subsidies) should drive growth going
forward
Bajaj Finserv
7 Edelweiss Securities Limited
o Market share in this segment is the same as the overall market share
o Reinsurance is an essential ingredient of this business (~85% reinsured)
o Of total crop insurance, ~70% will be run by top public and private sector
companies
Group health accounts for >50% of the total health segment (hence, need presence
within this vertical)
o The company’s ability to contain loss ratios would be lower if it does not have
strong relationships

Banking and Financial Services
8 Edelweiss Securities Limited
Company Description
Bajaj Finserv
Bajaj Finserv was formed as a result of its demerger from Bajaj Auto to act as a pure play
financial services business. The company holds stakes in Bajaj Allianz Life (sixth largest
private insurer (BALIC), Bajaj Allianz General Insurance (BAGIC) (second largest general
insurer), Bajaj Finance (BFL) and Bajaj Financial Solutions.
Bajaj Allianz Life Insurance
BALIC is a joint venture between Allianz (26%) and Bajaj Finserv (74%). However, Allianz has
the call option to increase its holding to 74%. The agreement is likely to hold till July 30,
2016 (predetermined price formula based on cut-off date of July 30, 2016), and is subject to
the government increasing FDI limit and various other regulatory approvals.
Bajaj Allianz General Insurance
BAGIC is a joint venture between Allianz (26%) and Bajaj Finserv (74%). However, Allianz has
the call option to increase its holding to 50%. The agreement is likely to hold till April 22,
2016 (predetermined price formula based on cut off date of April 22, 2016) and is subject to
government increasing FDI limit and various other regulatory approvals.
Bajaj Finance
BFL is a diversified NBFC present in consumer finance, SME and commercial lending
business. It operates across various business verticals with total AUM of ~INR602bn.
Bajaj Financial Solutions
Bajaj Financial Solutions (BFS) is a wealth management and advisory services player. It
provides financial advisory services for a holistic financial plan to customers.
Bajaj Windmill
Bajaj Finserv has wind farm assets, comprising 138 windmills in Maharashtra with an
installed capacity of 65.2MW. All 138 windmills are registered with REC registry of India
through Maharashtra Energy Development Agency (MEDA) and are eligible for Renewable
Energy Certificates (REC) Investment Theme
While we are enthused by the improvement in operating variables across businesses, the
recent stock outperformance renders unfavourable risk-reward ratio. BFL is available at
>23x FY19E P/E, which could be tested by rising competitive intensity and any blip in asset
quality. Life insurance trades at valuations of ~1.8-2x, despite <10% of core RoEV. General
insurance clocked strong operating performance (RoE potential of 23% plus), but implicit
valuation is higher than some deals in this space. Factoring in these, we see limited upside.
Hence, we downgrade to ‘HOLD/SP’ from ‘BUY/SP’.
Key Risks
Further deterioration in persistency: BALIC has poor persistency; any further deterioration
in the same will impact the company.
Introduction of direct tax code: If the corporate tax rate increases from the current 12.5% to
30% as proposed, it will hit margins and profitability.

9 Edelweiss Securities Limited
Bajaj Finserv
Financial Statements
Key assumptions
Year to March FY16 FY17E FY18E FY19E
Macro
GDP(Y-o-Y %) 7.2 6.5 7.1 7.7
Inflation (Avg) 4.9 4.8 5.0 5.2
Repo rate (exit rate) 6.8 6.3 6.3 6.3
USD/INR (Avg) 65.0 67.5 67.0 67.0
Sector
Credit growth 9.3 9.0 12.0 14.0
Borrowings growth (%) 8.6 14.0 12.0 13.0
Bank's base rate (%) 9.5 9.0 9.0 9.0
Wholesale borrowing cost (%) 8.5 8.5 8.5 8.5
G-sec yield (%) 7.5 6.5 6.5 6.5
Company
BAF
Loan growth 36.9 34.5 31.4 27.2
Yield 18.4 18.3 18.2 18.0
Gross NPLs 1.2 1.7 1.4 1.5
BAGIC
Premium growth 19.0 25.6 19.0 18.2
Reinsurance ceded (INR mn) 14,556 21,811 22,474 26,680
Claims (INR mn) 30,657 34,886 43,232 50,342
Combined ratio 97.1 96.8 97.1 96.4
BALIC
GWP growth (2.0) 7.1 14.4 18.8
Conservation ratio 62.6 64.3 67.1 70.3
Commision ratio 2.7 3.1 3.0 2.9
Opex ratio 18.8 17.9 18.0 18.4
Balance sheet (INR mn)
Year to March FY16 FY17E FY18E FY19E
SOURCES OF FUNDS :
Share capital 796 796 796 796
Reserves total 26,164 26,865 27,734 28,821
Total shareholders funds 26,960 27,660 28,530 29,617
Other liabilities 86 95 110 110
Total liabilities 27,046 27,755 28,640 29,727
APPLICATION OF FUNDS :
Gross block 3,568 3,573 3,573 3,573
Less: Accumulated deprec. 2,807 2,822 2,837 2,852
Net block 761 751 736 721
Investments 23,789 26,661 27,482 28,490
Total current assets 2,582 381 419 461
Less: Total cur. liab. & prov. 319 291 320 352
Net current assets 2,263 90 98 108
Net deferred tax (107) (95) (95) (95)
Other assets 341 349 418 502
Total assets 27,046 27,755 28,640 29,727
Income statement (INR mn)
Year to March FY16 FY17E FY18E FY19E
Total income 2,515 1,650 1,971 2,272
Other operating expenses 382 392 335 341
Employee expense 171 204 218 248
Total expenses 553 595 553 589
Gross profit 1,962 1,055 1,418 1,683
Depreciation 14 15 18 18
Profit before tax 1,948 1,040 1,400 1,665
Tax 317 340 252 300
Reported net profit 1,631 700 1,148 1,365
Extraordinary items 0 0 0 0
Adjusted net profit 1,631 700 1,148 1,365
Growth
Year to March FY16 FY17E FY18E FY19E
Operating income 21.0 (36.5) 18.0 14.0
Other income (20.1) 21.6 40.0 30.0
emp. exp % of operating inc. 7.0 13.2 12.0 12.0
Other oper. exp % of total inc. 15.2 23.8 17.0 15.0
Tax rate 16.3 32.7 18.0 18.0
Book value (INR) 169.4 173.8 179.3 186.1
EPS (INR) 10.3 4.4 7.2 8.6
DPS (INR) 1.8 1.8 1.8 1.8
Consolidated PAT (%)
Year to March FY16 FY17E FY18E FY19E
Standalone 8.1 3.0 4.0 3.9
BAGIC 21.4 23.4 21.3 22.2
BALIC 32.2 25.1 22.9 20.2
Bajaj Finance 38.6 48.6 52.0 53.8
Bajaj Allianz Financial Distributor 0.1 0.1 0.1 0.1
Bajaj Financial Solutions (0.3) (0.3) (0.2) (0.2)
Total 100.0 100.0 100.0 100.0
10 Edelweiss Securities Limited
Banking and Financial Services
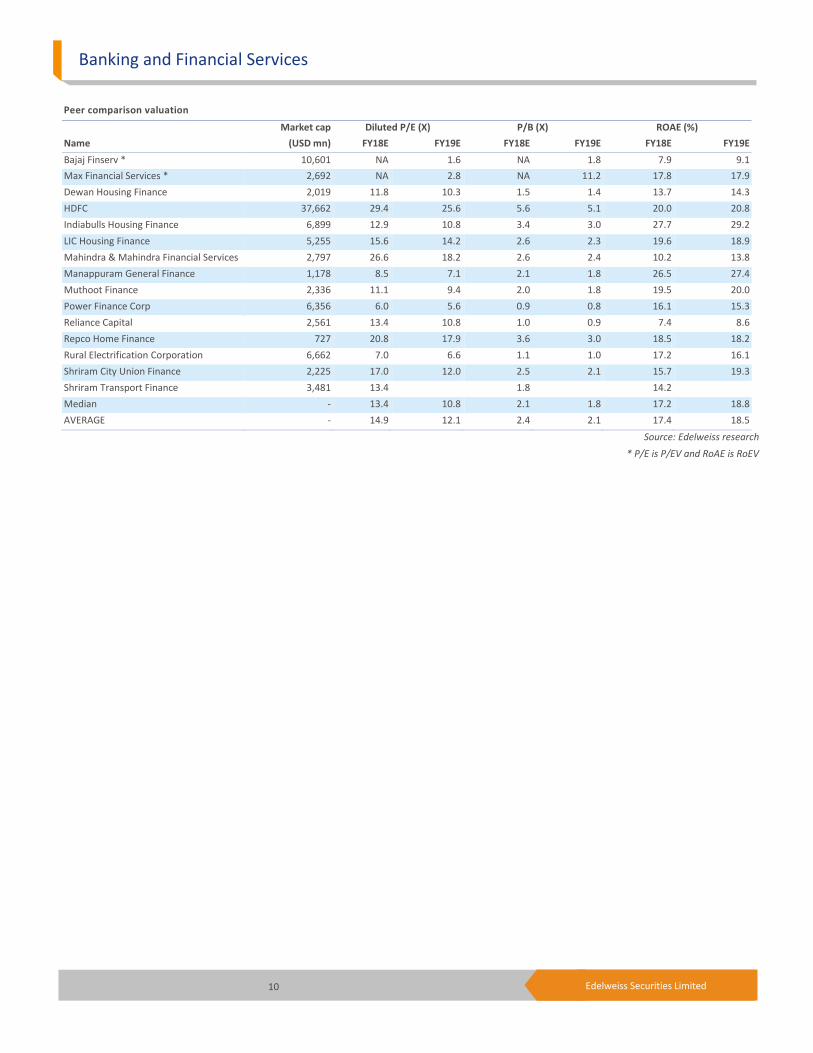
Peer comparison valuation
Market cap Diluted P/E (X) P/B (X) ROAE (%)
Name (USD mn) FY18E FY19E FY18E FY19E FY18E FY19E
Bajaj Finserv * 10,601 NA 1.6 NA 1.8 7.9 9.1
Max Financial Services * 2,692 NA 2.8 NA 11.2 17.8 17.9
Dewan Housing Finance 2,019 11.8 10.3 1.5 1.4 13.7 14.3
HDFC 37,662 29.4 25.6 5.6 5.1 20.0 20.8
Indiabulls Housing Finance 6,899 12.9 10.8 3.4 3.0 27.7 29.2
LIC Housing Finance 5,255 15.6 14.2 2.6 2.3 19.6 18.9
Mahindra & Mahindra Financial Services 2,797 26.6 18.2 2.6 2.4 10.2 13.8
Manappuram General Finance 1,178 8.5 7.1 2.1 1.8 26.5 27.4
Muthoot Finance 2,336 11.1 9.4 2.0 1.8 19.5 20.0
Power Finance Corp 6,356 6.0 5.6 0.9 0.8 16.1 15.3
Reliance Capital 2,561 13.4 10.8 1.0 0.9 7.4 8.6
Repco Home Finance 727 20.8 17.9 3.6 3.0 18.5 18.2
Rural Electrification Corporation 6,662 7.0 6.6 1.1 1.0 17.2 16.1
Shriram City Union Finance 2,225 17.0 12.0 2.5 2.1 15.7 19.3
Shriram Transport Finance 3,481 13.4 1.8 14.2
Median - 13.4 10.8 2.1 1.8 17.2 18.8
AVERAGE - 14.9 12.1 2.4 2.1 17.4 18.5
Source: Edelweiss research
* P/E is P/EV and RoAE is RoEV

11 Edelweiss Securities Limited
Bajaj Finserv
Holding - Top 10
Perc. Holding Perc. Holding
Jaya Hind Investments 4.02 ICICI Prudential Asset Management 2.49
Maharashtra Scooters 2.34 Life Insurance Corporation of India 1.99
Vanguard Group 0.81 BlackRock 0.79
Dimensional Fund Advisors 0.43 Sundaram Asset Management 0.38
Axis Asset Management 0.35 Birla Sun Life Asset Management 0.28
*as per last available data
Insider Trades
Reporting Data Acquired / Seller B/S Qty Traded
No Data Available
*in last one year
Bulk Deals Data Acquired / Seller B/S Qty Traded Price
No Data Available
*in last one year
Additional Data
Directors Data Rahul Bajaj Chairman Nanoo Pamnani Vice Chairman
Sanjiv Bajaj Managing Director Madhur Bajaj Director
Rajiv Bajaj Director D.J. Balaji Rao Director
Naresh Chandra Director Gita Piramal Director
Auditors - Dalal & Shah LLP
*as per last annual report

12 Edelweiss Securities Limited
Company Absolute
reco
Relative
reco
Relative
risk
Company Absolute
reco
Relative
reco
Relative
Risk
Allahabad Bank HOLD SU M Axis Bank BUY SO M
Bajaj Finserv BUY SP L Bank of Baroda BUY SP M
Bharat Financial Inclusion BUY SO M Capital First BUY SO M
DCB Bank REDUCE SU M Dewan Housing Finance BUY SO M
Equitas Holdings Ltd. BUY SO M Federal Bank BUY SP L
HDFC HOLD SP L HDFC Bank BUY SO L
ICICI Bank BUY SO L IDFC Bank HOLD SP L
Indiabulls Housing Finance BUY SO M IndusInd Bank BUY SP L
Karnataka Bank BUY SP M Kotak Mahindra Bank HOLD SP M
L&T FINANCE HOLDINGS LTD BUY SO M LIC Housing Finance BUY SP M
Magma Fincorp BUY SP M Mahindra & Mahindra Financial Services HOLD SU M
Manappuram General Finance BUY SO H Max Financial Services BUY SO L
Multi Commodity Exchange of India BUY SP M Muthoot Finance BUY SO M
Oriental Bank Of Commerce HOLD SP L Power Finance Corp BUY SO M
Punjab National Bank BUY SP M Reliance Capital BUY SP M
Repco Home Finance BUY SO M Rural Electrification Corporation BUY SO M
Shriram City Union Finance BUY SO M Shriram Transport Finance BUY SO L
South Indian Bank BUY SP M State Bank of India BUY SP L
Union Bank Of India HOLD SP M Yes Bank BUY SO M
RATING & INTERPRETATION
ABSOLUTE RATING
Ratings Expected absolute returns over 12 months
Buy More than 15%
Hold Between 15% and - 5%
Reduce Less than -5%
RELATIVE RETURNS RATING
Ratings Criteria
Sector Outperformer (SO) Stock return > 1.25 x Sector return
Sector Performer (SP) Stock return > 0.75 x Sector return
Stock return < 1.25 x Sector return
Sector Underperformer (SU) Stock return < 0.75 x Sector return
Sector return is market cap weighted average return for the coverage universe
within the sector
RELATIVE RISK RATING
Ratings Criteria
Low (L) Bottom 1/3rd percentile in the sector
Medium (M) Middle 1/3rd percentile in the sector
High (H) Top 1/3rd percentile in the sector
Risk ratings are based on Edelweiss risk model
SECTOR RATING
Ratings Criteria
Overweight (OW) Sector return > 1.25 x Nifty return
Equalweight (EW) Sector return > 0.75 x Nifty return
Sector return < 1.25 x Nifty return
Underweight (UW) Sector return < 0.75 x Nifty return
13 Edelweiss Securities Limited
Bajaj Finserv
Edelweiss Securities Limited, Edelweiss House, off C.S.T. Road, Kalina, Mumbai – 400 098.
Board: (91-22) 4009 4400, Email: [email protected]
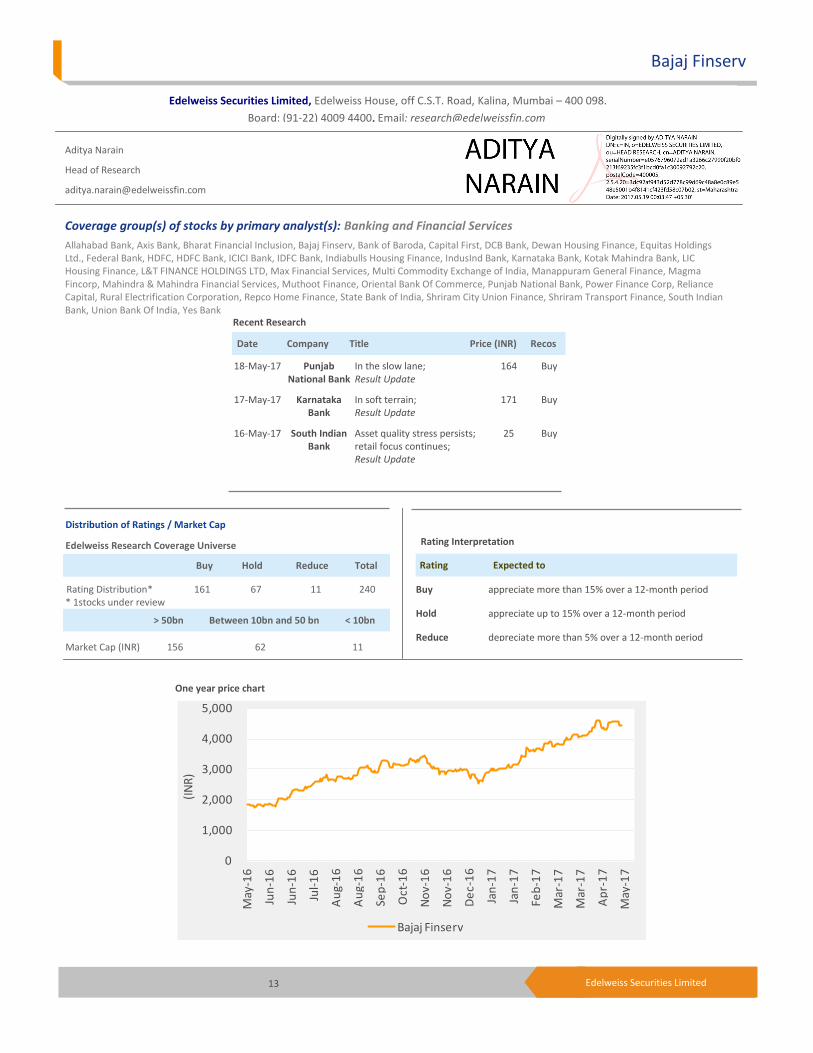
Aditya Narain
Head of Research
Coverage group(s) of stocks by primary analyst(s): Banking and Financial Services
Allahabad Bank, Axis Bank, Bharat Financial Inclusion, Bajaj Finserv, Bank of Baroda, Capital First, DCB Bank, Dewan Housing Finance, Equitas Holdings Ltd., Federal Bank, HDFC, HDFC Bank, ICICI Bank, IDFC Bank, Indiabulls Housing Finance, IndusInd Bank, Karnataka Bank, Kotak Mahindra Bank, LIC Housing Finance, L&T FINANCE HOLDINGS LTD, Max Financial Services, Multi Commodity Exchange of India, Manappuram General Finance, Magma Fincorp, Mahindra & Mahindra Financial Services, Muthoot Finance, Oriental Bank Of Commerce, Punjab National Bank, Power Finance Corp, Reliance Capital, Rural Electrification Corporation, Repco Home Finance, State Bank of India, Shriram City Union Finance, Shriram Transport Finance, South Indian Bank, Union Bank Of India, Yes Bank
Distribution of Ratings / Market Cap
Edelweiss Research Coverage Universe
Rating Distribution* 161 67 11 240 * 1stocks under review
Market Cap (INR) 156 62 11
Date Company Title Price (INR) Recos
Recent Research
18-May-17 Punjab National Bank
In the slow lane; Result Update
164 Buy
17-May-17 Karnataka Bank
In soft terrain; Result Update
171 Buy
16-May-17 South Indian Bank
Asset quality stress persists; retail focus continues; Result Update
25 Buy
> 50bn Between 10bn and 50 bn < 10bn
Buy Hold Reduce Total
Rating Interpretation
Buy appreciate more than 15% over a 12-month period
Hold appreciate up to 15% over a 12-month period
Reduce depreciate more than 5% over a 12-month period
Rating Expected to
-
149
297
446
594
743
Jan
-14
Feb
-14
Mar
-14
Ap
r-1
4
May
-14
Jun
-14
Jul-
14
Au
g-1
4
Sep
-14
Oct
-14
No
v-1
4
De
c-1
4
(IN
R)
One year price chart
0
1,000
2,000
3,000
4,000
5,000
May
-16
Jun
-16
Jun
-16
Jul-
16
Au
g-1
6
Au
g-1
6
Sep
-16
Oct
-16
No
v-1
6
No
v-1
6
De
c-1
6
Jan
-17
Jan
-17
Feb
-17
Mar
-17
Mar
-17
Ap
r-1
7
May
-17
(IN
R)
Bajaj Finserv

14 Edelweiss Securities Limited
Banking and Financial Services
DISCLAIMER
Edelweiss Securities Limited (“ESL” or “Research Entity”) is regulated by the Securities and Exchange Board of India (“SEBI”) and is licensed to carry on the business of broking, depository services and related activities. The business of ESL and its Associates (list available on www.edelweissfin.com) are organized around five broad business groups – Credit including Housing and SME Finance, Commodities, Financial Markets, Asset Management and Life Insurance.
This Report has been prepared by Edelweiss Securities Limited in the capacity of a Research Analyst having SEBI Registration No.INH200000121 and distributed as per SEBI (Research Analysts) Regulations 2014. This report does not constitute an offer or solicitation for the purchase or sale of any financial instrument or as an official confirmation of any transaction. Securities as defined in clause (h) of section 2 of the Securities Contracts (Regulation) Act, 1956 includes Financial Instruments and Currency Derivatives. The information contained herein is from publicly available data or other sources believed to be reliable. This report is provided for assistance only and is not intended to be and must not alone be taken as the basis for an investment decision. The user assumes the entire risk of any use made of this information. Each recipient of this report should make such investigation as it deems necessary to arrive at an independent evaluation of an investment in Securities referred to in this document (including the merits and risks involved), and should consult his own advisors to determine the merits and risks of such investment. The investment discussed or views expressed may not be suitable for all investors.
This information is strictly confidential and is being furnished to you solely for your information. This information should not be reproduced or redistributed or passed on directly or indirectly in any form to any other person or published, copied, in whole or in part, for any purpose. This report is not directed or intended for distribution to, or use by, any person or entity who is a citizen or resident of or located in any locality, state, country or other jurisdiction, where such distribution, publication, availability or use would be contrary to law, regulation or which would subject ESL and associates / group companies to any registration or licensing requirements within such jurisdiction. The distribution of this report in certain jurisdictions may be restricted by law, and persons in whose possession this report comes, should observe, any such restrictions. The information given in this report is as of the date of this report and there can be no assurance that future results or events will be consistent with this information. This information is subject to change without any prior notice. ESL reserves the right to make modifications and alterations to this statement as may be required from time to time. ESL or any of its associates / group companies shall not be in any way responsible for any loss or damage that may arise to any person from any inadvertent error in the information contained in this report. ESL is committed to providing independent and transparent recommendation to its clients. Neither ESL nor any of its associates, group companies, directors, employees, agents or representatives shall be liable for any damages whether direct, indirect, special or consequential including loss of revenue or lost profits that may arise from or in connection with the use of the information. Our proprietary trading and investment businesses may make investment decisions that are inconsistent with the recommendations expressed herein. Past performance is not necessarily a guide to future performance .The disclosures of interest statements incorporated in this report are provided solely to enhance the transparency and should not be treated as endorsement of the views expressed in the report. The information provided in these reports remains, unless otherwise stated, the copyright of ESL. All layout, design, original artwork, concepts and other Intellectual Properties, remains the property and copyright of ESL and may not be used in any form or for any purpose whatsoever by any party without the express written permission of the copyright holders.
ESL shall not be liable for any delay or any other interruption which may occur in presenting the data due to any reason including network (Internet) reasons or snags in the system, break down of the system or any other equipment, server breakdown, maintenance shutdown, breakdown of communication services or inability of the ESL to present the data. In no event shall ESL be liable for any damages, including without limitation direct or indirect, special, incidental, or consequential damages, losses or expenses arising in connection with the data presented by the ESL through this report.
We offer our research services to clients as well as our prospects. Though this report is disseminated to all the customers simultaneously, not all customers may receive this report at the same time. We will not treat recipients as customers by virtue of their receiving this report.
ESL and its associates, officer, directors, and employees, research analyst (including relatives) worldwide may: (a) from time to time, have long or short positions in, and buy or sell the Securities, mentioned herein or (b) be engaged in any other transaction involving such Securities and earn brokerage or other compensation or act as a market maker in the financial instruments of the subject company/company(ies) discussed herein or act as advisor or lender/borrower to such company(ies) or have other potential/material conflict of interest with respect to any recommendation and related information and opinions at the time of publication of research report or at the time of public appearance. ESL may have proprietary long/short position in the above mentioned scrip(s) and therefore should be considered as interested. The views provided herein are general in nature and do not consider risk appetite or investment objective of any particular investor; readers are requested to take independent professional advice before investing. This should not be construed as invitation or solicitation to do business with ESL.
15 Edelweiss Securities Limited
Bajaj Finserv
ESL or its associates may have received compensation from the subject company in the past 12 months. ESL or its associates may have managed or co-managed public offering of securities for the subject company in the past 12 months. ESL or its associates may have received compensation for investment banking or merchant banking or brokerage services from the subject company in the past 12 months. ESL or its associates may have received any compensation for products or services other than investment banking or merchant banking or brokerage services from the subject company in the past 12 months. ESL or its associates have not received any compensation or other benefits from the Subject Company or third party in connection with the research report. Research analyst or his/her relative or ESL’s associates may have financial interest in the subject company. ESL and/or its Group Companies, their Directors, affiliates and/or employees may have interests/ positions, financial or otherwise in the Securities/Currencies and other investment products mentioned in this report. ESL, its associates, research analyst and his/her relative may have other potential/material conflict of interest with respect to any recommendation and related information and opinions at the time of publication of research report or at the time of public appearance.
Participants in foreign exchange transactions may incur risks arising from several factors, including the following: ( i) exchange rates can be volatile and are subject to large fluctuations; ( ii) the value of currencies may be affected by numerous market factors, including world and national economic, political and regulatory events, events in equity and debt markets and changes in interest rates; and (iii) currencies may be subject to devaluation or government imposed exchange controls which could affect the value of the currency. Investors in securities such as ADRs and Currency Derivatives, whose values are affected by the currency of an underlying security, effectively assume currency risk.
Research analyst has served as an officer, director or employee of subject Company: No
ESL has financial interest in the subject companies: No
ESL’s Associates may have actual / beneficial ownership of 1% or more securities of the subject company at the end of the month immediately preceding the date of publication of research report.
Research analyst or his/her relative has actual/beneficial ownership of 1% or more securities of the subject company at the end of the month immediately preceding the date of publication of research report: No
ESL has actual/beneficial ownership of 1% or more securities of the subject company at the end of the month immediately preceding the date of publication of research report: No
Subject company may have been client during twelve months preceding the date of distribution of the research report.
There were no instances of non-compliance by ESL on any matter related to the capital markets, resulting in significant and material disciplinary action during the last three years except that ESL had submitted an offer of settlement with Securities and Exchange commission, USA (SEC) and the same has been accepted by SEC without admitting or denying the findings in relation to their charges of non registration as a broker dealer.
A graph of daily closing prices of the securities is also available at www.nseindia.com
Analyst Certification:
The analyst for this report certifies that all of the views expressed in this report accurately reflect his or her personal views about the subject company or companies and its or their securities, and no part of his or her compensation was, is or will be, directly or indirectly related to specific recommendations or views expressed in this report.
Additional Disclaimers
Disclaimer for U.S. Persons
This research report is a product of Edelweiss Securities Limited, which is the employer of the research analyst(s) who has prepared the research report. The research analyst(s) preparing the research report is/are resident outside the United States (U.S.) and are not associated persons of any U.S. regulated broker-dealer and therefore the analyst(s) is/are not subject to supervision by a U.S. broker-dealer, and is/are not required to satisfy the regulatory licensing requirements of FINRA or required to otherwise comply with U.S. rules or regulations regarding, among other things, communications with a subject company, public appearances and trading securities held by a research analyst account.
This report is intended for distribution by Edelweiss Securities Limited only to "Major Institutional Investors" as defined by Rule 15a-6(b)(4) of the U.S. Securities and Exchange Act, 1934 (the Exchange Act) and interpretations thereof by U.S. Securities and Exchange Commission (SEC) in reliance on Rule 15a 6(a)(2). If the recipient of this report is not a Major Institutional Investor as specified above, then it should not act upon this report and return the same to the sender. Further, this report may not be copied, duplicated and/or transmitted onward to any U.S. person, which is not the Major Institutional Investor.
16 Edelweiss Securities Limited
Banking and Financial Services
Access the entire repository of Edelweiss Research on www.edelresearch.com
In reliance on the exemption from registration provided by Rule 15a-6 of the Exchange Act and interpretations thereof by the SEC in order to conduct certain business with Major Institutional Investors, Edelweiss Securities Limited has entered into an agreement with a U.S. registered broker-dealer, Edelweiss Financial Services Inc. ("EFSI"). Transactions in securities discussed in this research report should be effected through Edelweiss Financial Services Inc. Disclaimer for U.K. Persons
The contents of this research report have not been approved by an authorised person within the meaning of the Financial Services and Markets Act 2000 ("FSMA"). In the United Kingdom, this research report is being distributed only to and is directed only at (a) persons who have professional experience in matters relating to investments falling within Article 19(5) of the FSMA (Financial Promotion) Order 2005 (the “Order”); (b) persons falling within Article 49(2)(a) to (d) of the Order (including high net worth companies and unincorporated associations); and (c) any other persons to whom it may otherwise lawfully be communicated (all such persons together being referred to as “relevant persons”). This research report must not be acted on or relied on by persons who are not relevant persons. Any investment or investment activity to which this research report relates is available only to relevant persons and will be engaged in only with relevant persons. Any person who is not a relevant person should not act or rely on this research report or any of its contents. This research report must not be distributed, published, reproduced or disclosed (in whole or in part) by recipients to any other person. Disclaimer for Canadian Persons
This research report is a product of Edelweiss Securities Limited ("ESL"), which is the employer of the research analysts who have prepared the research report. The research analysts preparing the research report are resident outside the Canada and are not associated persons of any Canadian registered adviser and/or dealer and, therefore, the analysts are not subject to supervision by a Canadian registered adviser and/or dealer, and are not required to satisfy the regulatory licensing requirements of the Ontario Securities Commission, other Canadian provincial securities regulators, the Investment Industry Regulatory Organization of Canada and are not required to otherwise comply with Canadian rules or regulations regarding, among other things, the research analysts' business or relationship with a subject company or trading of securities by a research analyst. This report is intended for distribution by ESL only to "Permitted Clients" (as defined in National Instrument 31-103 ("NI 31-103")) who are resident in the Province of Ontario, Canada (an "Ontario Permitted Client"). If the recipient of this report is not an Ontario Permitted Client, as specified above, then the recipient should not act upon this report and should return the report to the sender. Further, this report may not be copied, duplicated and/or transmitted onward to any Canadian person. ESL is relying on an exemption from the adviser and/or dealer registration requirements under NI 31-103 available to certain international advisers and/or dealers. Please be advised that (i) ESL is not registered in the Province of Ontario to trade in securities nor is it registered in the Province of Ontario to provide advice with respect to securities; (ii) ESL's head office or principal place of business is located in India; (iii) all or substantially all of ESL's assets may be situated outside of Canada; (iv) there may be difficulty enforcing legal rights against ESL because of the above; and (v) the name and address of the ESL's agent for service of process in the Province of Ontario is: Bamac Services Inc., 181 Bay Street, Suite 2100, Toronto, Ontario M5J 2T3 Canada. Disclaimer for Singapore Persons
In Singapore, this report is being distributed by Edelweiss Investment Advisors Private Limited ("EIAPL") (Co. Reg. No. 201016306H) which is a holder of a capital markets services license and an exempt financial adviser in Singapore and (ii) solely to persons who qualify as "institutional investors" or "accredited investors" as defined in section 4A(1) of the Securities and Futures Act, Chapter 289 of Singapore ("the SFA"). Pursuant to regulations 33, 34, 35 and 36 of the Financial Advisers Regulations ("FAR"), sections 25, 27 and 36 of the Financial Advisers Act, Chapter 110 of Singapore shall not apply to EIAPL when providing any financial advisory services to an accredited investor (as defined in regulation 36 of the FAR. Persons in Singapore should contact EIAPL in respect of any matter arising from, or in connection with this publication/communication. This report is not suitable for private investors.
Copyright 2009 Edelweiss Research (Edelweiss Securities Ltd). All rights reserved