results 3rd quarter 2007 - norwegianproperty.no · liability to acquire shares in norgani hotels...
TRANSCRIPT

www.npro.nowww.norwegianproperty.no
Results3rd Quarter 2007
13 November 2007

2 | Results 3rd Quarter 2007
Highlights – 3rd Quarter
Stable financial performance in third quarter– Rental income of NOK 253.1 million (NOK 181.0 million in 2006)– Profit before tax NOK 52.1 million (NOK -13.2 million)– Pre tax return on equity Q3 0.8% (3.1% annualised return on average book equity)– Pre tax return on equity YTD 33.6% (annualised return)
Continued positive office markets in larger cities in Norway– Office vacancy in Oslo below 5%– Continued expectations to rental growth, also in areas outside CBD
Acquisition of Norgani Hotels– Strong hotel market– Oslo Properties effectively controlled Norgani Hotels at end third quarter– Put / call options whereby Norwegian property may become the owner of Oslo Properties
Completion of acquisition of DnB Head office at Aker Brygge– Now control 55% of commercial areas and 90% of retail at Aker Brygge

3 | Results 3rd Quarter 2007
Results – 3rd Quarter 2007
Q3 Q3 Q1-Q3 - Q3NOK million 2007 2006 2007 2006
Gross rental income 1) 253.1 181.0 745.5 212.2
Maintenance and property related cost -17.7 -7.0 -46.0 -9.2Group expenses -14.0 -16.3 -45.3 -21.9
Operating result before value adjustment 221.5 157.8 654.2 181.2
Value adjustment investment property 68.9 0.0 1 126.5 0.0
Operating result 290.4 157.8 1 780.7 181.2
Net financial items excluding derivatives 2) -140.5 -113.8 -563.8 -134.5Change in market value derivatives -97.8 -57.2 322.3 -29.5
Profit before tax 52.1 -13.2 1 539.2 17.1
Income tax -14.6 3.7 -431.0 -4.8
Profit after tax 37.5 -9.5 1 108.2 12.3 Earnings per share (NOK) 0.36 -0.14 10.85 0.18
1) Gross rental income does not include Aker Hus payments (NOK 19.4 million) and rental guarantees (NOK 3.7 million) in Q3 with NOK 23.1 million (NOK 69.1 million year to date) 2) Net financial items in Q3 include Aker Hus interest expenses of NOK 3.8 million (NOK 10.8 million year to date) and gain from currency effects with NOK 10.5 million (NOK 16.5 million year to date)
4 | Results 3rd Quarter 2007
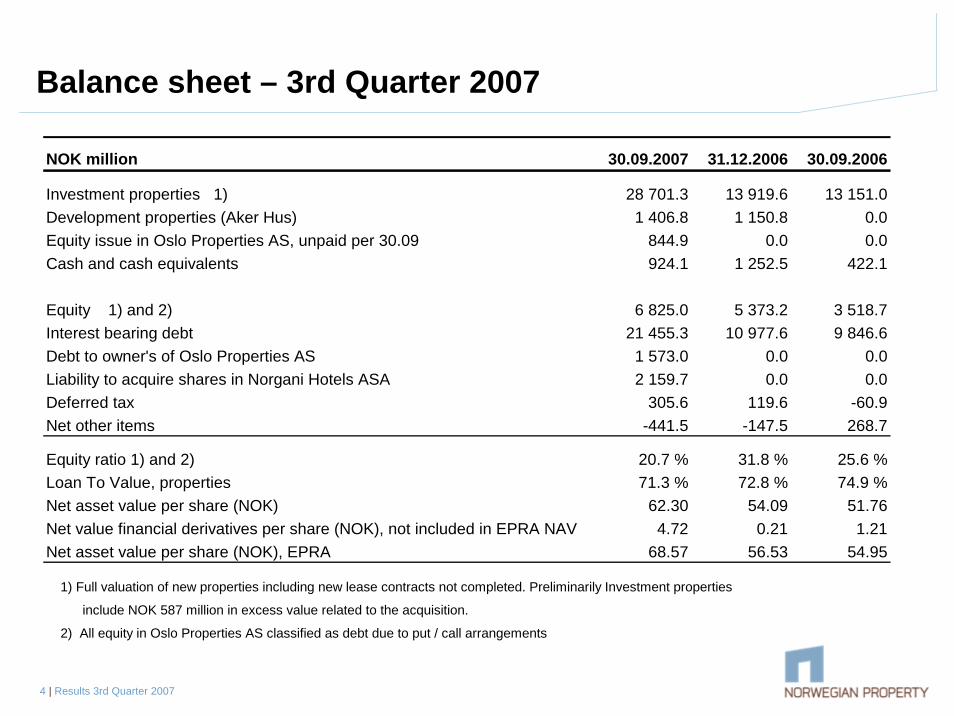
Balance sheet – 3rd Quarter 2007
NOK million 30.09.2007 31.12.2006 30.09.2006
Investment properties 1) 28 701.3 13 919.6 13 151.0Development properties (Aker Hus) 1 406.8 1 150.8 0.0Equity issue in Oslo Properties AS, unpaid per 30.09 844.9 0.0 0.0Cash and cash equivalents 924.1 1 252.5 422.1
Equity 1) and 2) 6 825.0 5 373.2 3 518.7Interest bearing debt 21 455.3 10 977.6 9 846.6Debt to owner's of Oslo Properties AS 1 573.0 0.0 0.0Liability to acquire shares in Norgani Hotels ASA 2 159.7 0.0 0.0Deferred tax 305.6 119.6 -60.9Net other items -441.5 -147.5 268.7
Equity ratio 1) and 2) 20.7 % 31.8 % 25.6 %Loan To Value, properties 71.3 % 72.8 % 74.9 %Net asset value per share (NOK) 62.30 54.09 51.76Net value financial derivatives per share (NOK), not included in EPRA NAV 4.72 0.21 1.21Net asset value per share (NOK), EPRA 68.57 56.53 54.95
1) Full valuation of new properties including new lease contracts not completed. Preliminarily Investment properties
include NOK 587 million in excess value related to the acquisition.
2) All equity in Oslo Properties AS classified as debt due to put / call arrangements

5 | Results 3rd Quarter 2007
Net Asset Value – introduction of EPRA NAV
EPRA Net Asset Value = NOK 68.57– Book NAV per share adjusted for:
– Including revaluation for development properties held for investment.– Including deferred tax– Excluding market value of financial derivatives not qualifying for hedge accounting
Not included in EPRA NAV– Market of financial derivatives not qualifying for hedge accounting
– NOK 4.72 per share as of 30.09.2007– Value of strategic agreement between Oslo Properties AS and Scandic Hotels AB in
excess of preliminary take up of NOK 587 million. Valuation pending allocation onspecific hotels.
6 | Results 3rd Quarter 2007
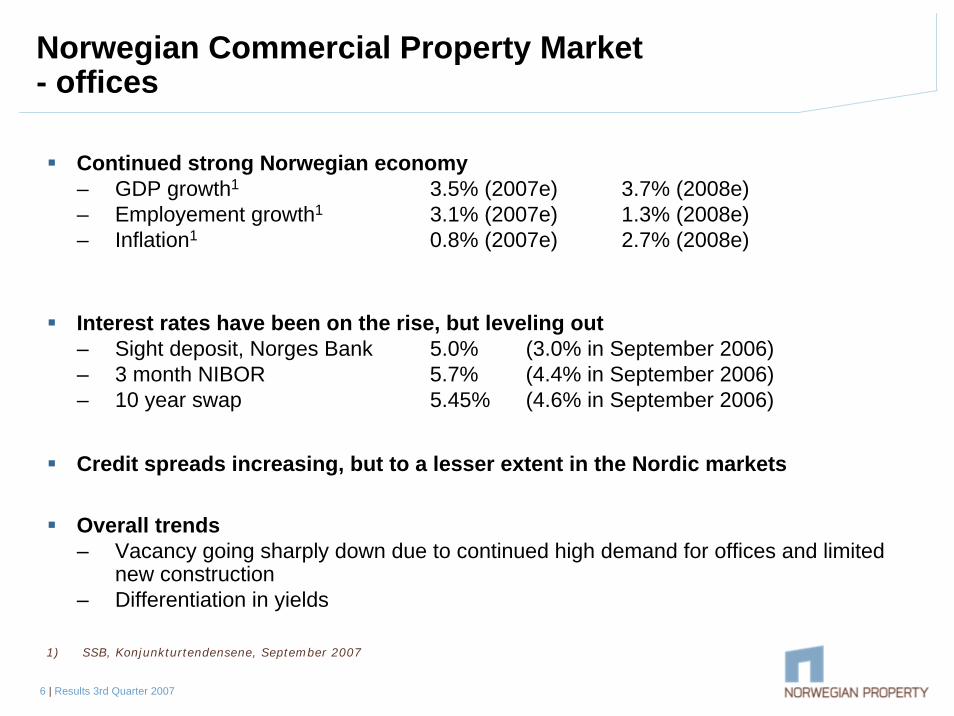
Norwegian Commercial Property Market- offices
Continued strong Norwegian economy– GDP growth1 3.5% (2007e) 3.7% (2008e)– Employement growth1 3.1% (2007e) 1.3% (2008e)– Inflation1 0.8% (2007e) 2.7% (2008e)
Interest rates have been on the rise, but leveling out– Sight deposit, Norges Bank 5.0% (3.0% in September 2006)– 3 month NIBOR 5.7% (4.4% in September 2006)– 10 year swap 5.45% (4.6% in September 2006)
Credit spreads increasing, but to a lesser extent in the Nordic markets
Overall trends– Vacancy going sharply down due to continued high demand for offices and limited
new construction– Differentiation in yields
1) SSB, Konjunkturtendensene, September 2007

7 | Results 3rd Quarter 2007
Still strong office markets
Akershus Eiendom, The Norwegian Commercial Property Market, Fall 2007
Oslo– Vacancy below 5%, and trending
towards 3% in 2008 / 2009– Continued high demand for offices– Limited supply, few new projects
initiated– Rental growth picking up pace also
outside CBD and central areas
Stavanger– Vacancy around 1.5 – 2.0 %– Continued booming market– Development projects on drawing table
Property transactions– Significant number of projects in
markets– Yields trending upwards on less
attractive properties and propertieswith long term leases
– Yields maintained at attractive levelson attractive properties

8 | Results 3rd Quarter 2007
Overview of portfolio- excluding Norgani
2007 E (*)PortfolioNumber of properties 59Number of sqm 762 177Average size per property (sqm) 12 918Average value per sqm (NOK) 27 533Average value per property (mnok) 356Average rent per gross sqm 1 518
Valuation (NOK million)Market value 20 985Gross rent *) 1 156,9
Opex 65,6Net rent *) 1 091,3Gross yield *) 5,5 %Net yield *) 5,2 %
Duration (years) 6,7CPI adjustment (2007) 95 %Vacancy (rent) 0,7 %
*) Gross rent / Net rent / Yield, run rate 1. January 2008

9 | Results 3rd Quarter 2007
Tenants- excluding Norgani
**25 largest tenants Tenants by line of business
Restaurant4 %
Industry/Prod9 %
Public adm8 %
Bank/finance21 % Other
services11 %
Retail4 %
Telecom/Data/IT21 %
Culture/media2 %
Oil/ Oil services
19 %
Contract rent DurationTenant Run rate *) years
1 EDB Business Partner ASA 78.9 6.8 %2 Aker ASA/Aker Kværner ASA 77.5 6.7 %3 DnB Nor Bank ASA 67.3 5.8 %3 Nordea 43.8 3.8 %4 SAS 40.3 3.5 %5 If Skadeforsikring 38.5 3.3 %6 Statoil Hydro 36.9 3.2 %7 Total E&P 29.0 2.5 %8 Get AS (UPC) 26.2 2.3 %9 Telenor Eiendom Holding AS 26.0 2.2 %
10 Leif Högh & Co AS 25.3 2.2 %11 Netcom AS (Tele 2) 23.0 2.0 %12 Aker Kværner Offshore Partner 22.7 2.0 %13 Astrup Fearnley 22.4 1.9 %14 Skanska Norge AS 21.1 1.8 %15 Rikshospitalet 20.3 1.8 %16 Fokus Bank 19.8 1.7 %17 Hafslund ASA 18.1 1.6 %18 GlaxoSmithKlein 17.8 1.5 %19 Ementor Norge AS 17.7 1.5 %20 Nera ASA 17.3 1.5 %21 Oslo Sporveier 17.0 1.5 %22 Simonsen Arkitektfirma DA 16.9 1.5 %23 Arbeidsdirektoratet 15.4 1.3 %25 TDC Song AS 15.0 1.3 %
TOTAL 25 LARGEST TENANTS 754.1 65.2 % 7.7Other tenants 402.8 34.8 % 4.8TOTAL ALL TENANTS 1 156.9 100.0 % 6.7
*) Run rate per 1 January 2008, before CPI-adjustment

10 | Results 3rd Quarter 2007
> 10 years24 %
- 6 years37 %
< 3 years15 %
6 - 10 years24 %
Weighted average duration appr.
6.7years
Norwegian Property– The office portfolio
Public14 %
Private86 %
Retail / Restaurant
9 %Warehouse
3 %
Parking4 %
Other5 %
Office79 %
Oslo84 %
Bergen1 %
Stavanger13 %
Other2 %
Tenant mix *
Lease duration mix (Y)**Property mix *
Geographic focus*
*By rent **Contractual rent

11 | Results 3rd Quarter 2007
Norwegian Property Prime contracts - and upside rent potential
The average length of the lease contracts is currently 6.7 years – NOK 381 million up for renegotiation over
next 4 years
The lease contracts are automatically adjusted according to the CPI annually– Weighted average of 95% adjustment on
total portfolio)
Current focus– Renegotiation of contracts due in 2007,
2008 and 2009– Tenants with changing needs (expansion,
relocation etc.)– Development potential
Accumulated renegotiation potential (2007 rents)
5,4 26,8124,3
217,8
380,8
549,7 609,3707,6
795,2 832,2
1 156,9
0,0
200,0
400,0
600,0
800,0
1 000,0
1 200,0
1 400,0
2007 2008 2009 2010 2011 2012 2013 2014 2015 2016 >2017

12 | Results 3rd Quarter 2007
Office property portfolio valuation– 30 September 2007
Total property value of portfolio includingAker Hus (fully developed) was NOK 20,985
Full external valuation by DTZ Realkapital – Average market rent per sqm in DTZ-
valuation NOK 1,705 per sqm (versus actual NOK 1,518); including DnB Nor at Aker Brygge
Value increase of Investment propertiesmnok 68.9– Related to changes in assumed market
rents, NOK 264 million– Related to discount rates, building costs,
etc, mnok -195
Impact portfolio
Change value (NOK million)
Inflation 2008 +1%-point to 3.70% 69
Market rent +10% 1 462
Market yield +0,25%-point -375
Interest rate +0.25%-point -400
Property portfolio, DTZ valuation 30.09.2007 30.06.2007 31.12.2006
Total value of all properties 1) 20 984.7 19 088.1 18 056.7Aker Hus (fully developed), development property 1 529.1 1 524.6 1 512.4 Investment properties, total value 19 455.6 17 563.5 16 544.3
Properties acquired in 2007 -2 368.9Adjustment for tax and other -375.6 -364.6 -255.8 Investment properties, book value 19 080.0 17 198.9 13 919.6 1) DnB Nor included in valuation with NOK 1,779.4
13 | Results 3rd Quarter 2007
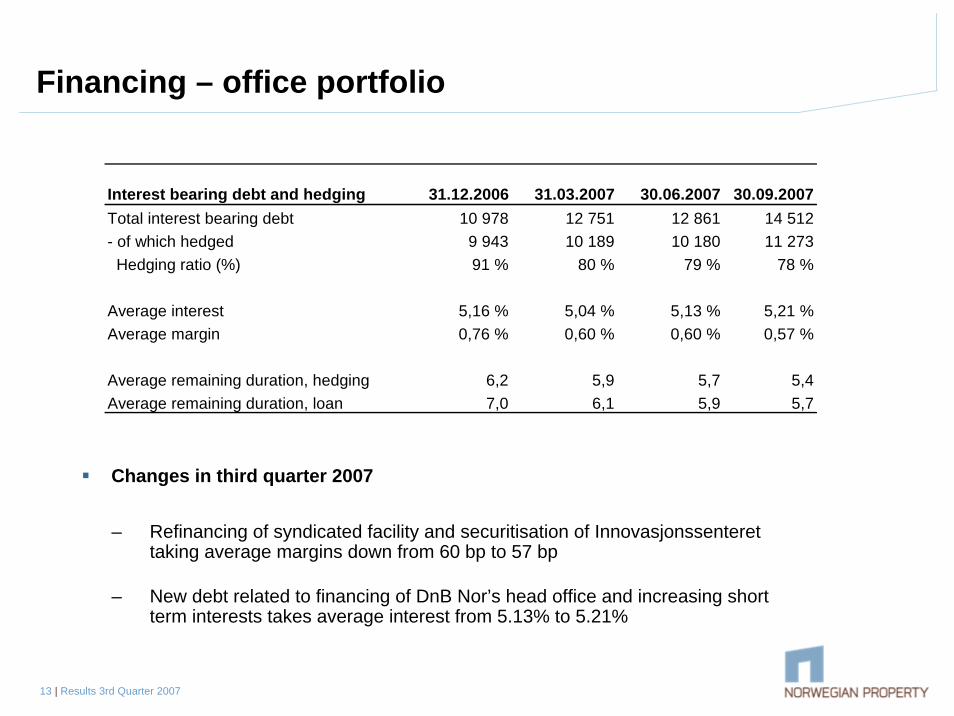
Financing – office portfolio
Interest bearing debt and hedging 31.12.2006 31.03.2007 30.06.2007 30.09.2007Total interest bearing debt 10 978 12 751 12 861 14 512- of which hedged 9 943 10 189 10 180 11 273 Hedging ratio (%) 91 % 80 % 79 % 78 %
Average interest 5,16 % 5,04 % 5,13 % 5,21 %Average margin 0,76 % 0,60 % 0,60 % 0,57 %
Average remaining duration, hedging 6,2 5,9 5,7 5,4Average remaining duration, loan 7,0 6,1 5,9 5,7
Changes in third quarter 2007
– Refinancing of syndicated facility and securitisation of Innovasjonssenterettaking average margins down from 60 bp to 57 bp
– New debt related to financing of DnB Nor’s head office and increasing short term interests takes average interest from 5.13% to 5.21%

14 | Results 3rd Quarter 2007
Norgani – financial performance
Q3 Q3 Q1 - Q3 Q1 - Q3NOK million 2007 2006 2007 2006
Rental income 164.0 140.8 477.4 371.3Rental guarantees (ordinary) 3.1 3.7 10.5Termination agreements on rental guarantees 1) 36.9 36.9 17.5
Gross rental income 204.0 144.5 524.8 388.8
Maintenance and property related cost -14.1 -13.3 -45.9 -40.6Administrative expenses -16.9 -7.0 -55.1 -17.9Administrative expenses, acquisition -51.4 - -51.4 -
Operating result before value adjustment 121.6 124.2 372.4 330.3
Net gain on disposals 0.3 0.0 6.3 7.5Value adjustment investment property 0.7 109.1 131.4 190.9
Operating result 122.6 233.3 510.1 528.7
Net financial items excluding derivatives -76.5 -67.1 -233.1 -184.3Change in market value derivatives -55.2 0.0 144.1 0.0
Profit before tax -9.0 166.3 421.0 344.4
Operating net 2) 59.6 57.1 153.8 128.5
1) Rental guarantees include mnok 36.9 in compensation relating to termination of rental guarantee contracts on 19 hotels. 2) Operatig net = Profit before tax - Change in market value derivatives - Net gain on disposals - Value adjustment investment properties + acquisition related expenses - termination agreements on rental contracts
15 | Results 3rd Quarter 2007
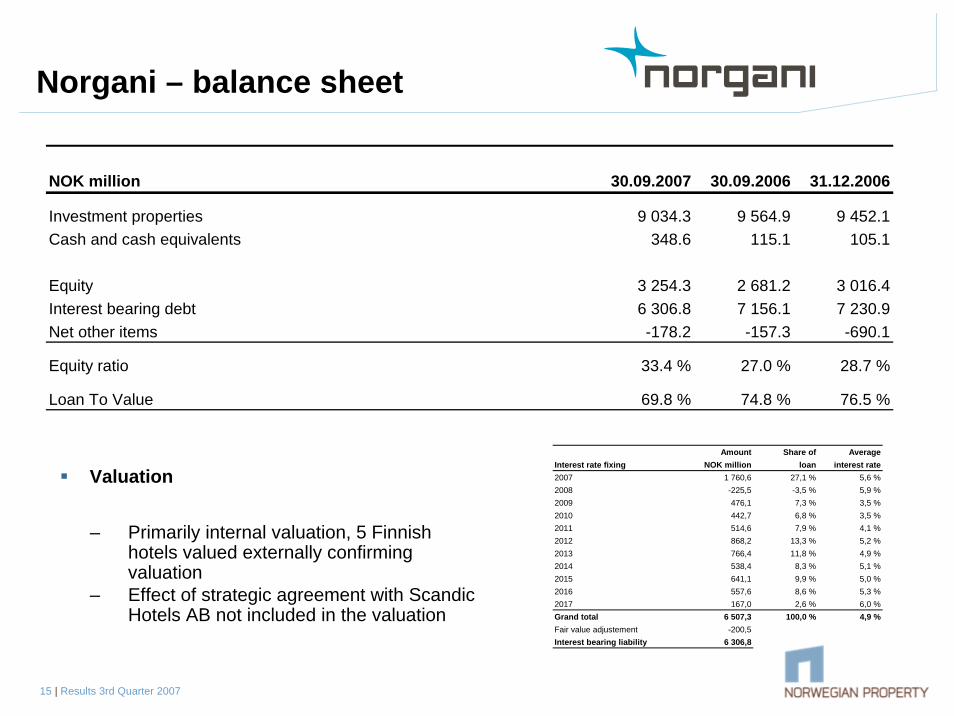
Norgani – balance sheet
Amount Share of AverageInterest rate fixing NOK million loan interest rate2007 1 760,6 27,1 % 5,6 %2008 -225,5 -3,5 % 5,9 %2009 476,1 7,3 % 3,5 %2010 442,7 6,8 % 3,5 %2011 514,6 7,9 % 4,1 %2012 868,2 13,3 % 5,2 %2013 766,4 11,8 % 4,9 %2014 538,4 8,3 % 5,1 %2015 641,1 9,9 % 5,0 %2016 557,6 8,6 % 5,3 %2017 167,0 2,6 % 6,0 %Grand total 6 507,3 100,0 % 4,9 %Fair value adjustement -200,5Interest bearing liability 6 306,8
Valuation
– Primarily internal valuation, 5 Finnish hotels valued externally confirming valuation
– Effect of strategic agreement with ScandicHotels AB not included in the valuation
NOK million 30.09.2007 30.09.2006 31.12.2006
Investment properties 9 034.3 9 564.9 9 452.1Cash and cash equivalents 348.6 115.1 105.1
Equity 3 254.3 2 681.2 3 016.4Interest bearing debt 6 306.8 7 156.1 7 230.9Net other items -178.2 -157.3 -690.1
Equity ratio 33.4 % 27.0 % 28.7 %
Loan To Value 69.8 % 74.8 % 76.5 %

16 | Results 3rd Quarter 2007
Continued strong hotel market
RevPAR, Jan-Sep (NOK)
0
50
100
150
200
250
300
350
400
450
500
Norway Sweden Finland *)
20062007 (1
Growth Y/Y Jan-Sep RevPAR Occupancy ARRSweden 9,2 % 50.8% (+2.9%) 6,2 %Finland *) 9,6 % 53.8% (+4,5%) 4,9 %Norway 12,7 % 57.9% (+3.9%) 8,4 %Denmark 58.5% (+3.0%)
*) Finland period January to August 2007
Occupancy, Jan-Sep (NOK)
0 %
10 %
20 %
30 %
40 %
50 %
60 %
70 %
Norway Denmark Sweden Finland *)
20062007 (1

17 | Results 3rd Quarter 2007
Norgani – portfolio performance - SwedenRegional hotels, Jan - Sep
0
100
200
300
400
500
600
700
800
1998 1999 2000 2001 2002 2003 2004 2005 2006 2007
SEK
25
30
35
40
45
50
55
60
% O
cc
ARR RevPAR Occ
Stockholm hotels, Jan - Sep
0
100
200
300
400
500
600
700
800
900
1998 1999 2000 2001 2002 2003 2004 2005 2006 2007
SEK
40
45
50
55
60
65
70
75
% O
cc
ARR RevPAR Occupancy
Highway hotels, Jan - Sep
0
100
200
300
400
500
600
700
800
1998 1999 2000 2001 2002 2003 2004 2005 2006 2007
SE
K
25 %
30 %
35 %
40 %
45 %
50 %
55 %
60 %
% O
cc
ARR RevPAR Occupancy
18 | Results 3rd Quarter 2007
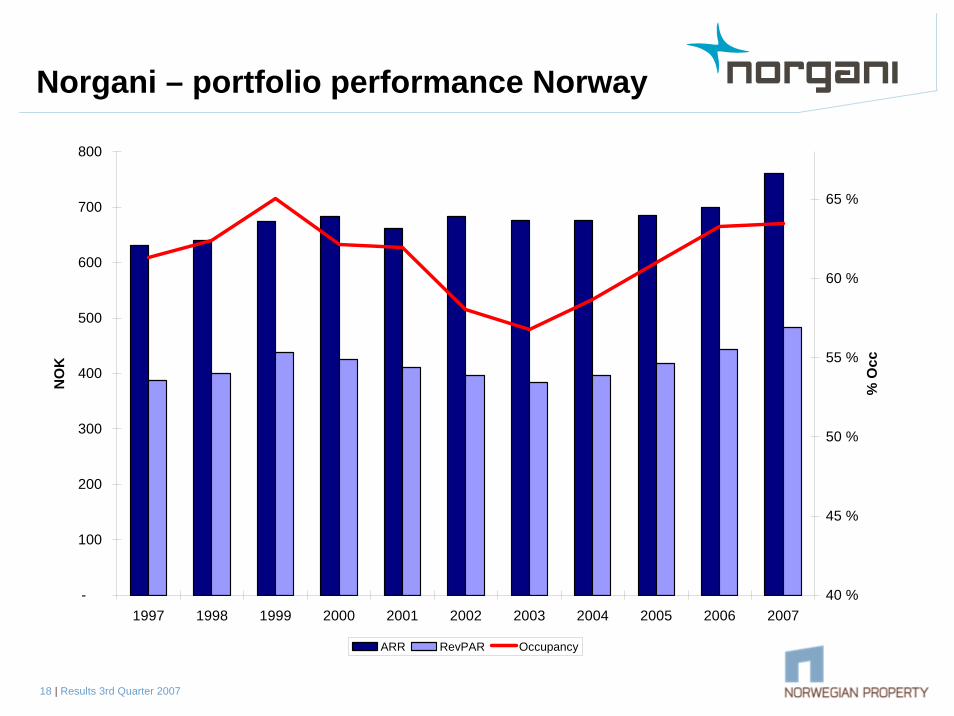
Norgani – portfolio performance Norway
-
100
200
300
400
500
600
700
800
1997 1998 1999 2000 2001 2002 2003 2004 2005 2006 2007
NO
K
40 %
45 %
50 %
55 %
60 %
65 %
% O
cc
ARR RevPAR Occupancy

19 | Results 3rd Quarter 2007
Norgani – portfolio performance – Finland- January to June
0
10
20
30
40
50
60
70
80
90
1997 1998 1999 2000 2001 2002 2003 2004 2005 2006 2007
Eur
o
30
35
40
45
50
55
60
% O
CC
ARR RevPAR Occ

20 | Results 3rd Quarter 2007
Long term contracts with solid tenants
Operator's share of rooms
Others7 %
Rica2 %
Best Western2 %
First3 %
Scandic57 %
Choice21 %
SAS Radisson5 %
Hilton3 %
Operator's share of revenue
Övr6 %
Rica2 %
First2 %
Best Western1 %
Scandic55 %
Choice23 %
SAS Radisson6 %
Hilton5 %
Strategic agreement entered between Oslo Properties ASA and Scandic Hotels AB not reflected in numbers above. Allocation of strategic agreement to individual hotels ongoing.

21 | Results 3rd Quarter 2007
Property portfolio- hotel portfolio
Geographic distribution, roomsDenmark
3 %
Finland24 %
Norw ay19 %
Sw eden54 %
Geographic distribution, revenues
Finland28 %
Norw ay24 %
Denmark4 %
Sw eden44 %
Key data portfolio– Number of rooms 12.804– Total area 664,726 sqm

22 | Results 3rd Quarter 2007
Broad shareholder base- liquid trading on Oslo Stock Exchange
No. of shares outstanding: 105.5mLast traded share price: NOK 70No. of shareholders: 1 018– Norwegian: 826– Non-Norwegian: 192Share performance YTD (12 November –nok 70): +11.5%
Source: VPS
Key share details
Shareholder distribution by domicile
20 largest shareholders*
Luxembourg2 %
Other8 %
UK21 %
Belgum12 %
USA17 %
Other Nordic1 %
Norway39 %
Largest shareholders Stake %A WILHELMSEN CAPITAL ANLEGGSMIDLER 11.53 %CREDIT SUISSE SECURI (EUROPE) LTD./FIRMS 10.37 %STATE STREET BANK AN A/C CLIENT OMNIBUS D 9.90 %FRAM REALINVEST AS 3.79 %FRAM HOLDING AS 3.79 %BANK OF NEW YORK, BR S/A ALPINE INTL REAL 3.47 %VITAL FORSIKRING ASA OMLØPSMIDLER 3.39 %AWECO INVEST AS ATT: JOSTEIN DEVOLD 2.72 %MELLON BANK AS AGENT MELLON BANK NA A/C MELLON 2.12 %BNP PARIBAS SEC. SER UK RESIDENTS 1.82 %BANK OF NEW YORK, BRUSSEL BRANCH 1.75 %ENSKILDA SECURITIES 1.74 %OPPLYSNINGSVESENETS FOND 1.58 %MELLON BANK AS AGENT 1.53 %JPMORGAN CHASE BANK CLIENTS TREATY ACCOU 1.44 %LANI DEVELOPMENT AS 1.42 %BANK OF NEW YORK, BRUSSEL BRANCH 1.24 %FORTIS BANK LUXEMBOURG 1.15 %MORGAN STANLEY & CO INC 1.12 %MIAMI AS 1.01 %Other shareholders 33.11 %Total number of shares as of 30 September 2007 100.00 %

23 | Results 3rd Quarter 2007
Summary- Attractively positioned in a prime property market
Norwegian Property is a prime real estate investment play in a strong Nordic markets
Norwegian Property offers unique exposure to high quality real estate
Management focus going forward– Consolidation and integration of Norgani
– Allocation of strategic agreement to individual hotels– Financing structure
– Sale of non-core assets both within office and hotel– Exploit the expected and realized market rental growth– Evaluate attractive and accretive M&A possibilities, currently mainly structural
acquisitions– Industrialize Facility Management
Norwegian Property targets attractive returns to investors

www.npro.nowww.norwegianproperty.no
Questions ?

25 | Results 3rd Quarter 2007
Norwegian Property - Office portfolio (1/2)
Retail / Duration GrossRest- Ware- Indoor Total Vac- pr rent
Property Offices aurant house parking Other sqm ancy % CPI 30.09.07 Run rate
OSLO/AKERSHUSCBDAker Brygge - total 28 979 21 585 4 817 2 061 491 57 933 0.2 % 95 % 149.4Aker Brygge (Kaibygning I) 23 015 3 810 0 0 4 670 31 495 0.0 % 100 % 82.5Drammensveien 60 8 593 797 1 208 275 0 10 873 0.0 % 100 % 19.5Grev Wedels plass 9 17 357 0 724 5 363 3 818 27 262 0.0 % 100 % 43.9Ibsenkvartalet 31 775 1 538 3 421 0 857 37 591 1.4 % 100 % 65.1Stortingsgaten 6 4 709 726 244 560 0 6 239 0.0 % 100 % 20.3Total CBD 114 428 28 456 10 414 8 259 9 836 171 393 0.4 % 98 % 5.0 380.6
SkøyenDrammensveien 134 - building 2-5 19 866 0 3 194 5 432 0 28 492 1.2 % 75 % 39.8Drammensveien 134 - building 1 and 6 15 301 640 1 779 4 009 0 21 729 0.0 % 100 % 39.5Drammensveien 144 9 150 0 148 1 450 107 10 855 0.0 % 100 % 18.0Drammensveien 149 10 402 0 2 083 4 006 0 16 491 10.9 % 87 % 23.8Hovfaret 11 4 377 0 569 0 696 5 642 0.0 % 100 % 10.6Nedre Skøyen vei 24 3 630 0 1 215 0 0 4 845 0.0 % 100 % 11.8Nedre Skøyen vei 26 A-E 11 444 0 696 398 5 084 17 622 0.0 % 100 % 34.0Nedre Skøyen vei 26 F 8 767 0 0 4 235 497 13 499 0.0 % 100 % 22.4Total Skøyen 82 937 640 9 684 19 530 6 383 119 174 1.5 % 93 % 8.6 200.0
Oslo West/Lysaker/FornebuAker Hus 40 254 0 0 18 089 0 58 343 0.0 % 100 % 77.5Forskningsveien 2 19 902 0 0 4 058 0 23 960 0.0 % 100 % 38.1Lysaker Torg 35 14 422 0 412 7 100 0 21 934 0.0 % 100 % 38.5Magnus Paulssons vei 7 5 357 0 0 1 861 0 7 218 0.0 % 100 % 9.8Middelthunsgate 17 26 847 0 3 473 3 000 0 33 320 0.0 % 100 % 43.8Oksenøyveien 3 10 200 0 0 2 700 0 12 900 0.0 % 100 % 16.5Total Oslo West/Lysaker/Fornebu 116 982 0 3 885 36 808 0 157 675 0.0 % 100 % 8.8 224.2
NydalenGjerdrums vei 8 8 158 0 109 2 389 0 10 656 4.7 % 96 % 11.5Gjerdrums vei 10 D 2 052 0 0 0 0 2 052 0.0 % 97 % 2.9Gjerdrums vei 14 634 0 812 0 0 1 446 0.0 % 100 % 1.4Gjerdrums vei 16 4 224 0 757 3 171 0 8 152 0.0 % 97 % 7.1Gjerdrums vei 17 803 0 0 0 0 803 0.0 % 100 % 1.3Gullhaug Torg 3 7 868 0 0 0 0 7 868 0.0 % 40 % 9.4Gullhaugveien 9-13 23 176 0 7 553 12 628 0 43 357 5.8 % 100 % 43.3Maridalsveien 323 11 646 0 2 600 5 573 1 096 20 915 5.3 % 100 % 26.2Nydalsveien 15 3 001 750 85 0 0 3 836 0.0 % 100 % 6.0Nydalsveien 17 0 1 560 0 0 0 1 560 0.0 % 100 % 3.4Sandakerveien 130 6 520 0 0 3 560 0 10 080 0.0 % 100 % 14.7Total Nydalen 68 082 2 310 11 916 27 321 1 096 110 725 3.4 % 95 % 4.9 127.2
PROPERTY FACTSSpace split (sqm)
RENT FACTS
26 | Results 3rd Quarter 2007
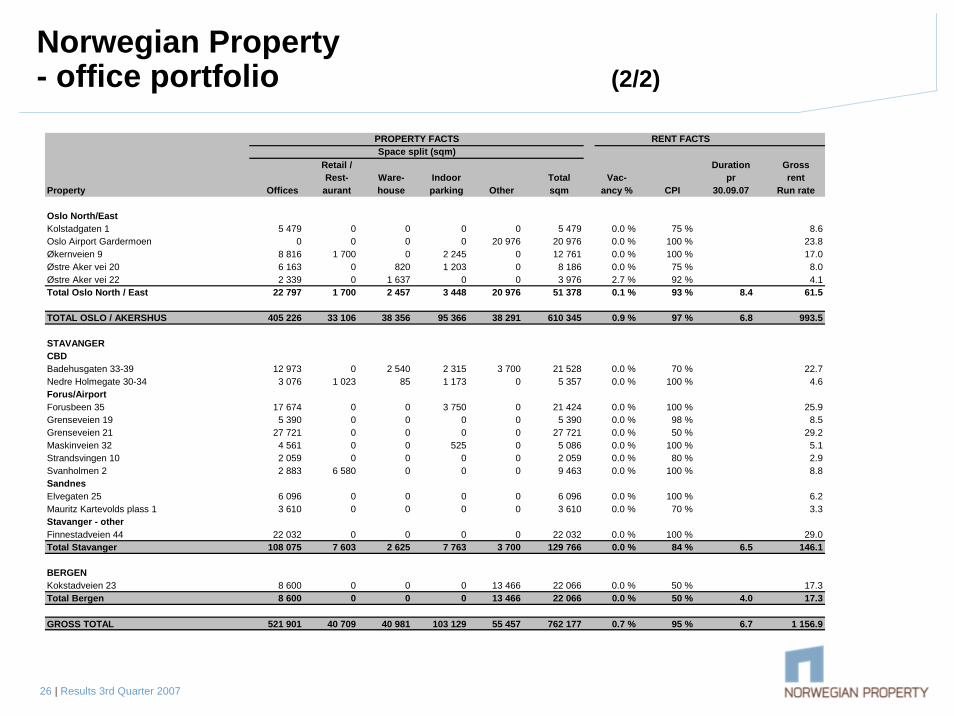
Norwegian Property- office portfolio (2/2)
Retail / Duration GrossRest- Ware- Indoor Total Vac- pr rent
Property Offices aurant house parking Other sqm ancy % CPI 30.09.07 Run rate
Oslo North/EastKolstadgaten 1 5 479 0 0 0 0 5 479 0.0 % 75 % 8.6Oslo Airport Gardermoen 0 0 0 0 20 976 20 976 0.0 % 100 % 23.8Økernveien 9 8 816 1 700 0 2 245 0 12 761 0.0 % 100 % 17.0Østre Aker vei 20 6 163 0 820 1 203 0 8 186 0.0 % 75 % 8.0Østre Aker vei 22 2 339 0 1 637 0 0 3 976 2.7 % 92 % 4.1Total Oslo North / East 22 797 1 700 2 457 3 448 20 976 51 378 0.1 % 93 % 8.4 61.5
TOTAL OSLO / AKERSHUS 405 226 33 106 38 356 95 366 38 291 610 345 0.9 % 97 % 6.8 993.5
STAVANGERCBDBadehusgaten 33-39 12 973 0 2 540 2 315 3 700 21 528 0.0 % 70 % 22.7Nedre Holmegate 30-34 3 076 1 023 85 1 173 0 5 357 0.0 % 100 % 4.6Forus/AirportForusbeen 35 17 674 0 0 3 750 0 21 424 0.0 % 100 % 25.9Grenseveien 19 5 390 0 0 0 0 5 390 0.0 % 98 % 8.5Grenseveien 21 27 721 0 0 0 0 27 721 0.0 % 50 % 29.2Maskinveien 32 4 561 0 0 525 0 5 086 0.0 % 100 % 5.1Strandsvingen 10 2 059 0 0 0 0 2 059 0.0 % 80 % 2.9Svanholmen 2 2 883 6 580 0 0 0 9 463 0.0 % 100 % 8.8SandnesElvegaten 25 6 096 0 0 0 0 6 096 0.0 % 100 % 6.2Mauritz Kartevolds plass 1 3 610 0 0 0 0 3 610 0.0 % 70 % 3.3Stavanger - otherFinnestadveien 44 22 032 0 0 0 0 22 032 0.0 % 100 % 29.0Total Stavanger 108 075 7 603 2 625 7 763 3 700 129 766 0.0 % 84 % 6.5 146.1
BERGENKokstadveien 23 8 600 0 0 0 13 466 22 066 0.0 % 50 % 17.3Total Bergen 8 600 0 0 0 13 466 22 066 0.0 % 50 % 4.0 17.3
GROSS TOTAL 521 901 40 709 40 981 103 129 55 457 762 177 0.7 % 95 % 6.7 1 156.9
PROPERTY FACTSSpace split (sqm)
RENT FACTS

27 | Results 3rd Quarter 2007
Norgani- Hotel portfolio
Hotel Municipality OperatorNumber
of rooms Sqm total
1 Scandic Hotel Malmen Stockholm Scandic 327 15,1302 Scandic Hotel Star Sollentuna Stockholm Scandic 269 18,5733 Scandic Hotel Kungens Kurva Stockholm Scandic 257 11,5814 Scandic Hotel Helsingborg Nord Helsingborg Scandic 237 9,3995 Scandic Hotel Backadal Gothenburg Scandic 232 9,3976 Scandic Hotel Elmia Jönköping Scandic 220 9,5767 Quality Hotel Luleå Luleå Choice 209 12,1668 Scandic Hotel Örebro Väst Örebro Scandic 204 7,6219 Scandic Hotel Gävle Väst Gävle Scandic 201 7,38210 Quality Hotel Prins Phillip Stockholm Choice 201 7,40011 Quality Hotel Ekoxen Linköping Choice 190 14,67112 Ibis Stockholm Syd Stockholm Accor Hotels 190 8,33913 Scandic Hotel Uppsala Nord Uppsala Scandic 184 7,51814 Scandic Hotel Västerås Västerås Scandic 174 7,28515 Scandic Hotel Ferrum Kiruna Kiruna Scandic 170 11,10016 Scandic Hotel Umeå Syd Umeå Scandic 162 5,95517 Scandic Hotel Segevång Malmö Scandic 161 6,28418 Scandic Hotel Luleå Luleå Scandic 159 5,56519 Scandic Hotel Sundsvall Nord Sundsvall Scandic 159 4,94820 Best Western Royal Corner Växjö Revhaken Hotels 158 7,11221 Scandic Hotel Linköping Väst Linköping Scandic 150 6,10522 Scandic Hotel Norrköping Nord Norrköping Scandic 150 6,76823 Quality Hotel Grand Kristianstad Kristianstad Choice 149 7,52424 Scandic Hotel Kalmar Väst Kalmar Scandic 148 5,48525 Scandic Hotel Bromma Stockholm Scandic 144 6,80026 Scandic Hotel Klarälven Karlstad Scandic 143 5,69427 Best Western Mora Hotell & Spa Mora Private operator 135 9,16128 Scandic Hotel Uplandia Uppsala Scandic 133 5,40229 First Hotel Linköping Linköping Tribe/First 133 6,54030 Scandic Hotel Södertälje Södertälje Scandic 131 5,63031 Scandic Hotel Östersund Östersund Scandic 129 4,01932 Scandic Hotel Växjö Växjö Scandic 123 3,98233 Quality Hotel Winn, Göteborg Gothenburg Choice 121 5,80034 Scandic Hotel Bollnäs Bollnäs Scandic 111 5,15035 Quality Hotel Prisma Skövde Choice 107 3,68736 First Hotel Mårtenson Halmstad Tribe/First 103 6,65737 First Hotel Royal Star Stockholm Cadhotels/First 103 4,90038 Scandic Hasselbacken Stockholm Scandic 112 10,02539 Scandic Alvik Stockholm Scandic 325 12,07540 Stadshotellet Princess Sandviken Sandviken Stadshotellet AB 84 7,00341 Radisson SAS Hotel Linköping Linköping Radisson SAS 91
Total Sweden (41 hotels) 6,889 315,409
Hotel Municipality OperatorNumber
of rooms Sqm total
Norway42 Radisson SAS Lillehammer Hotel Lillehammer Franchise 303 18,00043 Quality Hotel & Resort Kristiansand Kristiansand Choice 210 9,94044 Quality Hotel & Resort Hafjell Øyer Choice 210 9,54045 Comfort Hotel Børsparken Oslo Choice 198 7,90046 Scandic Bergen Airport Bergen Scandic 197 9,65447 Radisson SAS Hotel Bodø Bodø Radisson SAS 191 15,54648 Scandic KNA Oslo Scandic 189 11,21849 Rica Hotell Hamar Ringsaker Rica 176 9,25050 Quality Hotel Alexandra Molde Choice 163 17,03351 Comfort Hotel Holberg Bergen Choice 140 5,72052 Quality Hotel & Resort Fagernes Fagernes Choice 139 10,31053 Hotell Bastion Oslo Choice 99 4,68854 Rica Hotel Bodö Bodø Rica 113 7,98155 Quality Hotel Arcticus Harstad Choice 75 3,540
Total Norway (14 hotels) 2,403 140,320
Denmark56 Comfort Hotel Europa Copenhagen Choice 230 8,00057 Clarion Collection Hotel Mayfair Copenhagen Choice 105 3,80558 Comfort Hotel Excelsior Copenhagen Choice 99 3,600
Total Denmark (3 hotels) 434 15,405
Finland59 Scandic Continental Helsinki Scandic 512 30,00060 Scandic Grand Marina Helsinki Scandic 462 23,66061 Scandic Tampere City Tampere Scandic 263 14,45762 Hilton Helsinki Kalastajatorppa Helsinki Scandic 238 23,29163 Scandic Kajanus Kajaani Scandic 191 10,46864 Scandic Rosendahl Tampere Scandic 213 14,66265 Comfort Hotel Pilotti Vantaa Bonfinn 112 3,06866 Hilton Helsinki Strand Helsinki Scandic 192 10,25067 Serena Korpilampi Espoo Savonlinnan 150 9,77768 Scandic Jyväskylä Jyväskylä Scandic 150 7,36069 Scandic Kuopio Kuopio Scandic 137 7,11370 Airport Hotel Bonus Inn Vantaa Citymac Travels 211 8,41471 Scandic Espoo Espoo Scandic 96 5,24572 Imatran Valtionhotelli Imatra Rantasipi 92 10,09773 Scandic Luosto Luosto Scandic 59 4,23074 Scandic Marina Congress Center Helsinki Scandic 0 11,500
Total Finland (15 hotels & 1 conference center) 3,078 193,592
Grand total (74 properties) 12,804 664,726