results and development effectiveness · the african development bank ... elapsed from project...
TRANSCRIPT

August 3, 2012 7:17 PM
Results and Development Effectiveness
Discussion Paper
ADF-12 Mid-Term Review September 2012
Praia, Cape Verde
AFRICAN DEVELOPMENT FUND

i
Executive Summary
The African Development Bank (ADB) measures its performance by the lasting changes it brings to the lives of people in Africa. Measuring these changes is a complex undertaking. None of the development goals the Bank is actively promoting in Africa—equitable economic growth, resilient economies and capable institutions—can happen overnight. To meet these goals, and to keep moving in the right direction, the Bank must be a learning organisation committed to continuously improving its performance over time. It must also have the courage to rethink its strategies when it falls short of its objectives. To help with this learning process, the Bank has embarked on an ambitious set of reforms aimed at better assessing its contribution to development results across the continent. During the Twelfth General Replenishment of the African Development Fund (ADF-12) replenishment, the Bank committed to further improving and strengthening its focus on results. The purpose of this paper is to report to the African Development Fund (ADF) Deputies on the progress made by providing:
1. An overview of the Bank’s results and its performance in contributing to development results in Africa.
2. A better understanding of the actions the Bank has taken in operationalising a results agenda and implementing its ADF-12 commitments.
3. A candid assessment of the Bank’s challenges in further institutionalising a results-oriented culture.
The Bank’s performance in contributing to development results in Africa
To capture its contribution to development across its many dimensions, in 2011 the Bank launched a new Annual Development Effectiveness Review (ADER). A second edition of the ADER was presented at this year’s Annual Meetings in Arusha. These two editions assess the Bank’s contribution to development results by providing answers to four fundamental questions: What development progress is Africa making (Level 1)? What has the Bank done to contribute to development in Africa (Level 2)? Is ADB managing its operations effectively (Level 3)? Is ADB managing itself efficiently as an organisation (Level 4)? By drawing on the highlights and key findings of the ADER, this paper provides answers to all four questions (for a more detailed discussion of the Bank’s results, ADF Deputies are encouraged to consult the two editions of the ADER). In doing so, it places a special emphasis on the challenges in ADF countries and actions the Bank has taken in meeting its ADF commitments.
Level 1—ADF countries have recorded significant development progress since 2005. Africa and ADF countries have experienced dynamic growth in recent years. The continent has achieved growth rates above 6% for most of the past decade, making Africa the third-fastest growing region in the world. The pace of economic growth is creating economic opportunities and lifting millions of Africans out of poverty. It has also contributed to driving progress across a broad range of economic and social sectors. At the same time, Africa’s growth could lift more people out of poverty if it were more inclusive. Growth has tended to be concentrated in relatively few economic sectors and geographic regions. As a result, the benefits of growth have not always been evenly spread, and income disparities have been rising. Six of the 10 most unequal countries in the world in 2010 were in sub-Saharan Africa.
Level 2—by consistently delivering strong outputs and outcomes, the Bank is contributing to development in ADF countries. In 2011, the Fund invested almost UA 2 billion in development in Africa and provided a wide range of knowledge products and technical advice. These investments are, of course, very small compared to Africa’s needs. This is why, as agreed in ADF-12, the Bank has focused its activities in areas that are most likely to be developmentally effective and bring about the greatest social and economic transformations. To measure how effective these activities have been, Level 2 assesses the extent to which the Bank has been successful in delivering its planned outputs and intermediate outcomes. The 2012 ADER shows that in 80% of the Bank’s core results indicators, operations achieved or surpassed their targets. It also shows through the new geocoding initiative that a high proportion of operations targeted the most vulnerable populations in Africa.
Level 3—the Fund’s operational performance is improving. To maximise the impact of its assistance, the Bank needs to manage its operations effectively. At the end of 2011, the ADF portfolio consisted of 349 operations with a combined value of almost UA 9 billion. Level 3 uses 21

ii
indicators to measure the performance of this portfolio. The Bank has made real progress in improving the management of its portfolio, with 68% of Level 3 indicators on track to achieve or surpass their targets for 2012. However, analysis shows that in 2013, two areas require Management’s special attention: (i) The disbursement ratio for ADF operations remains at 18%, below the target of 20%, even though it is somewhat better than in 2010 (17%); and (ii) time elapsed from project approval to first disbursement remains at 13 months—2 months short of the 2012 target of 11 months.
Level 4—as an organisation, the Bank manages itself effectively but needs to improve human resource management. Six of 11 indicators for Level 4 are on track to achieve the 2012 targets. The Bank is a large and complex structure with 1900 staff located across the continent. It needs to ensure that it is fit for purpose. The ADB is moving forward with decentralisation, devolving staff and responsibilities to field offices and enabling the Bank to form stronger partnerships with regional member countries. In 2011, field presence was expanded to four fragile states (Burundi, Liberia, Togo and the Central African Republic) and new Regional Resource Centres were established in Nairobi and Pretoria. Human resource management remains, however, a persistent challenge, with two indicators not on track to achieve their targets: (i) the staff premature attrition rate—staff leaving before the end of their first contract, and (ii) the staff vacancy ratio.
Progress and challenges in operationalising the Bank’s results agenda
The Bank has made significant progress in establishing the critical processes, systems and tools to manage for development results. As the Bank consolidates its systems, the focus is gradually shifting from the “harder” to the “softer” challenges—behaviours, incentives, culture and practices. A results culture needs to be more deeply embedded in the Bank’s management practices, understood and accepted by staff and used at the country level. This new frontier is arguably one of the most challenging aspects of change management. In this connection, Management will be paying special attention in the coming period to two outstanding challenges:
Moving from measuring results to managing for results. The Bank needs to gradually shift its focus from a culture of reporting on results to a culture of managing for development results. To this end, Management has already introduced a number of key processes—including the ADER series—to improve the Bank’s focus on results. But further actions are also needed to underpin change management:
More effectively using results on the Bank’s performance to inform and determine corporate priorities and planning at relevant levels of the Results Measurement Framework.
Updating and adjusting the Bank’s Results Measurement Framework as the Bank continues to adapt its operations to Africa’s changing development challenges. Adjustments to the current RMF will be made by 2013.
Closing the feedback loop—that is, feeding into the design of new operations the lessons learnt in operations and good practices generated across the continent.
Enhancing IT and data systems and processes to improve data quality and integrity and thus confidence and reliability of data.
Focusing on a results culture at country level. All too often, the results agenda is seen as a corporate reporting requirement for headquarters. A strong results culture at the country level is essential to the effective management of the Bank’s operations. The Bank is equipping staff in field offices and placing increasing emphasis on results in country engagement—for example, by launching a pilot Country Development Effectiveness Review in 2012.
Embedding a results culture is a continuous challenge. Persistent and continuous emphasis on results at all levels will enable the Bank to build stronger ownership of and focus on results across the institution. And doing so will make the Bank more accountable to the people in Africa it serves.
iii
Table of Contents
Abbreviations and Acronyms.............................................................................................................. iv
1. Introduction ................................................................................................................................. 1
2. Performance in Contributing to Development Results ........................................................... 1
Level 1: What Development Progress are ADF Countries Making? ............................................. 2
Level 2: How Well is the Bank Contributing to Development in ADF Member Countries? ........... 3
Level 3: Is the Bank Managing its ADF Operations Effectively? ................................................... 6
Level 4: Is the Bank, as an Organisation, Managing Itself Efficiently? ......................................... 8
3. Progress and Challenges in Operationalising the Results Agenda ...................................... 9
Progress in Operationalising the Results Agenda ........................................................................ 9
Outstanding Challenges and New Frontiers ............................................................................... 13
4. Conclusions ............................................................................................................................... 16
Annex I: Development in ADF Countries (Level 1) .......................................................................... 17
Annex II: How the Bank Group Contributes to Development in ADF Countries (Level 2) ........... 19
Annex III: How well the Bank Group manages its ADF operations (Level 3) ................................ 21
Annex IV: How efficient the Bank Group is as an organisation (Level 4) ...................................... 22
Boxes
Box 1: Mali-Senegal Road Project: An Award-Winning Infrastructure Project ........................................ 5
Box 2: Geocoding: Mapping for Results will Improve the Bank’s Development Effectiveness ............. 12
Figures
Figure 1: The African Development Fund’s Summary Performance Scorecard ..................................... 2
Figure 2: The Bank’s Operations Create Opportunities and Benefit the Most Vulnerable Across Africa 6
Figure 3: Reducing the Delays between Project Approval and First Disbursement ............................... 7
Figure 4: Milestones in Implementing the Results Agenda ................................................................... 10
Figure 5: The Bank is Consolidating its Efforts to Strengthen Results ................................................. 16
Tables
Table 1: Improving Africans’ lives in ADF Member Countries ................................................................. 4

iv
Abbreviations and Acronyms
ADB African Development Bank ADER Annual Development Effectiveness Review ADF African Development Fund ADF-9 Ninth General Replenishment of the African Development Fund ADF-10 Tenth General Replenishment of the African Development Fund ADF-11 Eleventh General Replenishment of the African Development Fund ADF-12 Twelfth General Replenishment of the African Development Fund ADF-12 MTR Mid-Term Review of the Twelfth General Replenishment of the African Development Fund ADF-13 Thirteenth General Replenishment of the African Development Fund ADOA Additionality and Develpment Outcomes Assessment AfCoP African Community of Practice on Managing for Development Results AsDB Asian Development Bank BRICs Brazil, Russia, India and China CSP Country Strategy Paper DER Development Effectiveness Review IATI International Aid Transparency Initiative IT Information Technology LIC Low Income Countrie MDB Multilateral Development Bank NEPAD New Partnership for Africa's Development PIU Project Implementation Unit RMC Regional Member Country RMC Regional Member Country RMF Results Measurement Framework UA Units of Account USD United States Dollar

1
RESULTS AND ACCOUNTABILITY FOR MORE EFFECTIVE DEVELOPMENT
1. Introduction
Accounting for its contributions to Africa’s development is central to the Bank’s mandate.
1.1 The African Development Bank Group (the Bank or ADB) measures success not by the amount of money it spends or by the number of projects it funds, but by the lasting changes it brings to the lives of people in Africa. Measuring these changes is a complex undertaking.
1.2 Over the past decade, the understanding of development has deepened. Economic growth is an essential part of the process; it supplies households with livelihoods and opportunities and governments with the means to invest in public goods and services. But development is also about empowering people to achieve a range of needs and aspirations, including through education, better health, and membership in secure and supportive communities.
1.3 Recent events in North Africa have also shown that growth is not enough if its benefits are concentrated in only a few hands or regions. In fact, when combined with a lack of political voice and poor governance standards, growth itself can be a source of tension and instability. For development to be sustainable, growth and equity must go hand in hand. Africa needs strong growth to make serious inroads into poverty. But the quality of that growth is also important: it must generate more and better jobs, and create economic opportunities for the majority of Africans.
1.4 The Bank has embarked on an ambitious set of reforms aimed at turning the Bank into an effective results-oriented institution. During the Twelfth General Replenishment of the African Development Fund (ADF-12) replenishment, the Bank committed to further improving and strengthening its focus on results. The purpose of this paper is to report to African Development Fund (ADF) Deputies on the progress made by providing:
An overview of the Bank’s results and its performance in contributing to development results in ADF countries.
A better understanding of the actions the Bank has taken in operationalising a results agenda and implementing its ADF-12 commitments.
A candid assessment of the Bank’s challenges in further institutionalising a results-oriented culture.
2. Performance in Contributing to Development Results
The Bank’s contributions to an emerging Africa.
2.1 To better capture the Bank’s contribution to Africa’s development across its many dimensions, in 2011 the Bank launched a new Annual Development Effectiveness Review (ADER). A second edition of the review was presented at the Bank’s Annual Meetings in Arusha in May 2012. This section of the report draws on the highlights and key findings of the two editions of the ADER, focussing specifically on ADF results. (For a more detailed presentation and discussion of the Bank’s results and performance in contributing to Africa’s development, ADF Deputies are invited to consult the ADER 2011 and the ADER 2012.)
2.2 To assess the Bank’s performance in contributing to Africa’s development, the ADER appraises development trends across the continent and gauges the part played by the Bank. It also looks at how effectively the Bank manages its operations and the organisation. By assembling the evidence on its strength and weaknesses, the ADER helps the Bank determine how it can better meet its goals of improving the lives and livelihoods of Africans.
2.3 Every organisation needs a yardstick to measure its performance. Like other multilateral development banks (MDBs), the Bank uses a standard set of performance indicators that are assembled in a Results Measurement Framework (RMF). These indicators allow it to track progress against baselines, and assess whether it is on track to meet its own targets. The
2
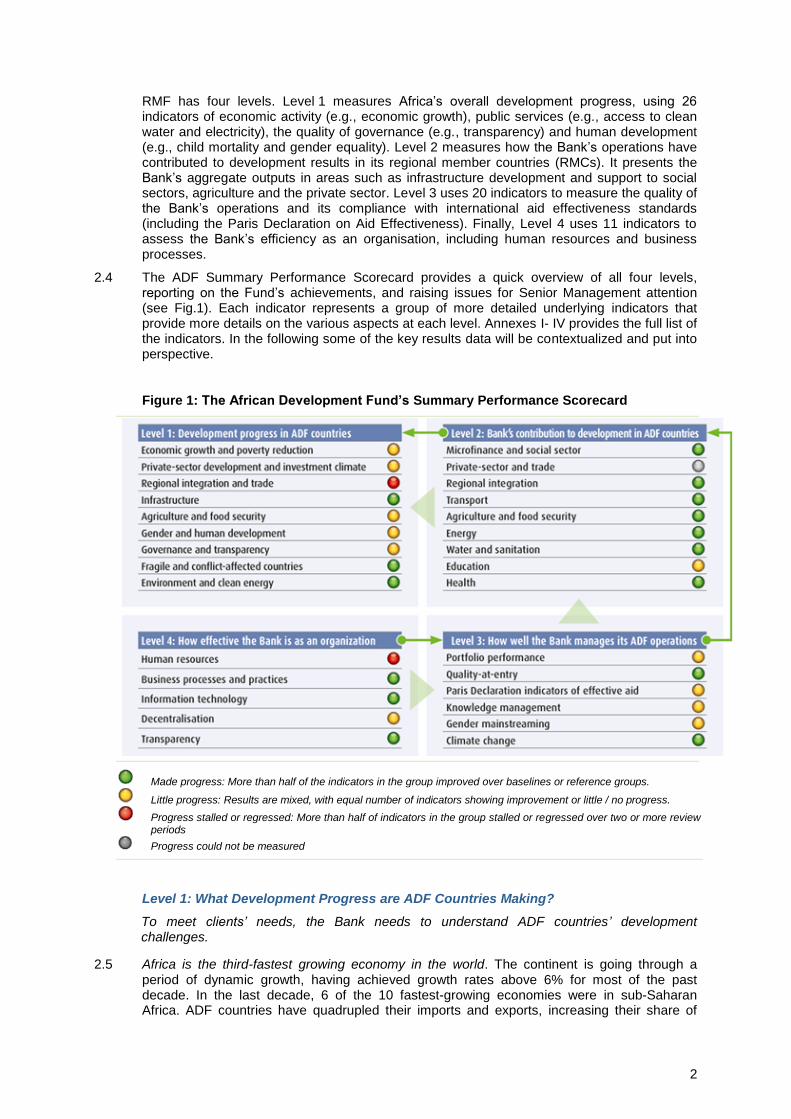
RMF has four levels. Level 1 measures Africa’s overall development progress, using 26 indicators of economic activity (e.g., economic growth), public services (e.g., access to clean water and electricity), the quality of governance (e.g., transparency) and human development (e.g., child mortality and gender equality). Level 2 measures how the Bank’s operations have contributed to development results in its regional member countries (RMCs). It presents the Bank’s aggregate outputs in areas such as infrastructure development and support to social sectors, agriculture and the private sector. Level 3 uses 20 indicators to measure the quality of the Bank’s operations and its compliance with international aid effectiveness standards (including the Paris Declaration on Aid Effectiveness). Finally, Level 4 uses 11 indicators to assess the Bank’s efficiency as an organisation, including human resources and business processes.
2.4 The ADF Summary Performance Scorecard provides a quick overview of all four levels, reporting on the Fund’s achievements, and raising issues for Senior Management attention (see Fig.1). Each indicator represents a group of more detailed underlying indicators that provide more details on the various aspects at each level. Annexes I- IV provides the full list of the indicators. In the following some of the key results data will be contextualized and put into perspective.
Figure 1: The African Development Fund’s Summary Performance Scorecard
Made progress: More than half of the indicators in the group improved over baselines or reference groups.
Little progress: Results are mixed, with equal number of indicators showing improvement or little / no progress.
Progress stalled or regressed: More than half of indicators in the group stalled or regressed over two or more review periods
Progress could not be measured
Level 1: What Development Progress are ADF Countries Making?
To meet clients’ needs, the Bank needs to understand ADF countries’ development challenges.
2.5 Africa is the third-fastest growing economy in the world. The continent is going through a period of dynamic growth, having achieved growth rates above 6% for most of the past decade. In the last decade, 6 of the 10 fastest-growing economies were in sub-Saharan Africa. ADF countries have quadrupled their imports and exports, increasing their share of

3
global trade from 1% in 2005 to 1.5% in 2011.
2.6 Growth is lifting millions of Africans out of poverty. ADF countries are also making progress on a broad range of development frontiers: for example, the proportion of people living under the poverty line decreased from 54% to 43% between 2005 and 2010, maternal mortality decreased by one-quarter, and net enrolment rates in primary education increased from 58% to 76%. In the private sector, the time required to start a business dropped from 58 to 32 days. At the same time, more and more Africans are better connected—to roads, electricity, information technology, water and sanitation. In ADF countries alone, more than 330 million people are now connected to modern information and communication technology.
2.7 The quality of growth also matters. Africa’s growth could, potentially, lift more Africans out of poverty if it were more inclusive. Growth has tended to be concentrated in relatively few economic sectors and geographic regions. The benefits of growth have not always been evenly spread, and income disparities have been rising: in 2010, 6 of the 10 most unequal countries in the world were in sub-Saharan Africa. Large parts of the continent’s population have yet to experience substantial improvement in their standards of living. Many people still lack access to basic services such as health, education, clean drinking water and sanitation facilities. Many are left without jobs and prospects to share in the benefits of growth. Africa can reap significant dividends from investing in the potential of its youth—that is, ensuring that education and training are matched to the needs of the labour market. A more diversified economy goes hand in hand with more sustained and inclusive growth.
2.8 To sustain the pace and quality of growth, it will be necessary to remove bottlenecks. Africa’s regional infrastructure, for example, lags well behind that of comparable regions in the world. Compared with Brazil, Russia, India, and China (the BRICs), the continent has less than half of the railway density, one-fifth of the road density, and less than half of the power consumption per capita. Conflict and political fragility are also serious constraints on Africa’s development: 17 ADF countries—home to over 200 million people—are considered to be fragile. With 50% higher rates of malnutrition, 20% higher child mortality rates and 18% lower primary school completion rates, these countries lag behind on almost all development indicators. Though the number of fragile countries is decreasing, and many are making progress, addressing fragility remains a key priority.
2.9 The challenges and opportunities of transitioning to a green economy. To be sustainable, the growth process needs to become more efficient in the management of Africa’s natural resources, less carbon intensive in its productive output, and more resilient to climate change and other environmental and socio-economic changes. Africa’s natural resource wealth and the need to address its infrastructure deficit put it in a unique position to choose a green development path without undermining its economic development.
Level 2: How Well is the Bank Contributing to Development in ADF Member Countries?
The Bank’s investments are changing the lives of Africans.
2.10 The Bank’s priorities respond to RMCs’ most pressing development challenges. Between 2009 and 2011, the Fund invested almost UA 6 billion in Africa’s development and provided a wide range of knowledge products and technical advice to its RMCs. The Fund investments are, of course, small in comparison with the countries development needs. That is why the Bank focuses its activities in areas it believes will unlock Africa’s potential and bring about the greatest economic and social transformation. And as Africa is changing, so are the Bank’s priorities. The Bank is continuously working with its clients to identify the key drivers of growth, address bottlenecks, and meet new challenges. The Bank is currently carrying out consultations on a Long-Term Strategy (2013–2022) that will have inclusiveness and green growth at its heart.

4
Table 1: Improving Africans’ lives in ADF Member Countries
Indicators Beneficiaries
Population benefiting from new electricity connections 4.7 million people
People with improved access to transport 10.3 million people
People with new or improved access to water and sanitation 12.5 million people
Students and scholars reached 3.0 million people
People with access to better health services 11.3 million people
Population benefiting from microfinance and social activities 12.8 million people
Population benefiting from agriculture operations 8.1 million people
2.11 The Bank’s investments are changing the lives of Africans across the continent. The Bank is
improving the lives of millions in ADF countries through investments that help to address their most pressing development needs (see Table 1; see also Annex II for more detailed results). A few examples:
The Bank helped catalyse commercial investment in infrastructure, industry and the financial sector. With a catalytic multiplier of 5 to 7, these investments are expected to mobilise over USD 30 billion in investment from other sources. Investments in small and medium-sized enterprises have generated some 325,000 jobs. Investment projects completed between 2009 and 2011 led to foreign-exchange savings of USD 2.3 billion and generated government revenues of USD 1.9 billion.
Between 2009 and 2011, the Bank constructed, rehabilitated or maintained 8,000 km of main roads and 15,000 km of feeder roads, providing more than 10 million people in ADF countries with improved access to transport (Box 1 describes one example).
Investments in water management and energy have made a direct contribution to reducing exclusion of the rural poor: more than 4.7 million people in ADF countries benefited from the Bank’s support for power generation and new electricity connections.
Investing in agriculture is one of the most direct ways the Bank promotes inclusive growth. The Bank helped bring into productive use or improved the productivity of over a million hectares of land through investments in irrigation and reforestation. The Bank’s agriculture projects have reached almost 8 million beneficiaries.
Gender equality is a theme running across many of the Bank’s operations. For example, the Bank’s education support to Rwanda helped boost girls’ enrolment in secondary school from 20% in 2004 to 54% in 2011.
Under ADF12, the Bank has invested in energy projects that will ultimately generate about 550MW of clean energy: hydropower in Cameroon and Zambia and geothermal energy in Kenya. The energy generated by these projects by 2017 is estimated at over 4,000 gigawatt hours / year, which is equivalent to the consumption of approximately 1 million households and small businesses in sub-Saharan African LICs.
Over the past three years, the Bank has worked successfully with ADF clients to promote improvements in the business environment: it has helped reduce the time and cost of starting a business, strengthened the financial sector, and created legal frameworks for public-private partnerships.
2.12 The ADER presents many other examples of how the Bank is changing the lives of people across the continent. For example, to support human capital development, the Bank specialises in higher education and training, making it well-placed to tackle the issue of youth employment. The Bank has been working with client countries to adapt their higher-education curricula to emphasise science, technology and entrepreneurship, to prepare young people for the needs of the labour market.
5
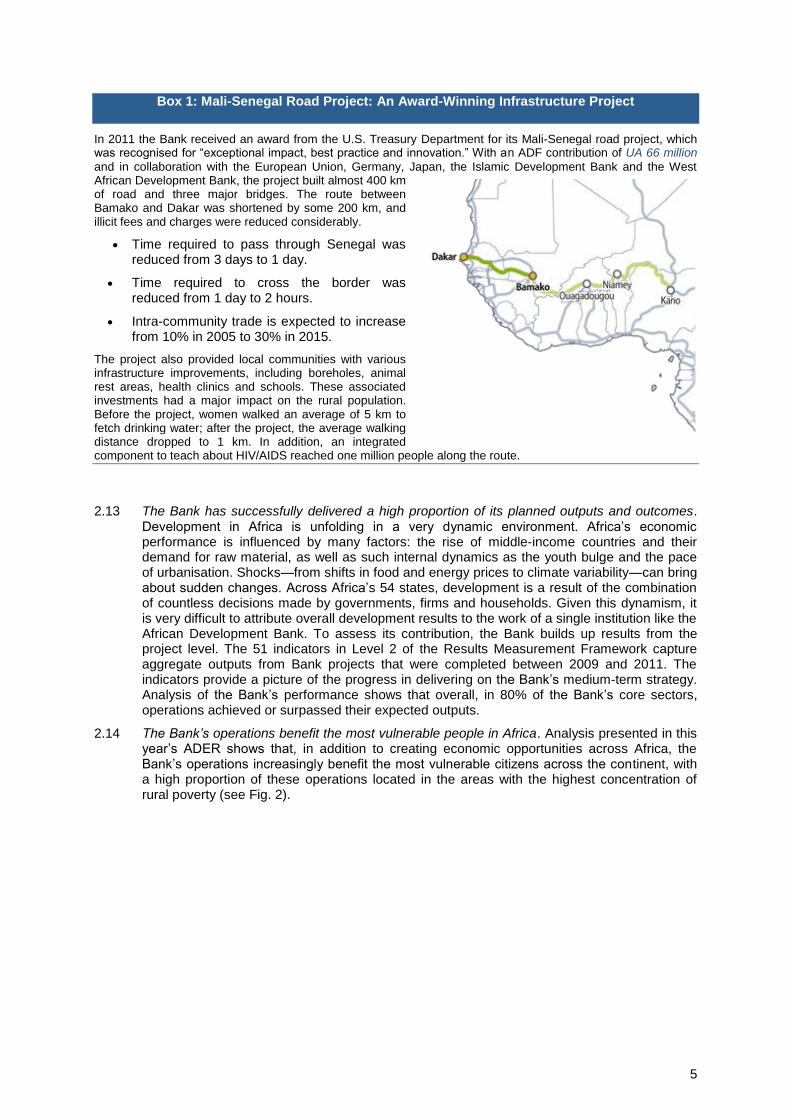
Box 1: Mali-Senegal Road Project: An Award-Winning Infrastructure Project
In 2011 the Bank received an award from the U.S. Treasury Department for its Mali-Senegal road project, which was recognised for “exceptional impact, best practice and innovation.” With an ADF contribution of UA 66 million
and in collaboration with the European Union, Germany, Japan, the Islamic Development Bank and the West African Development Bank, the project built almost 400 km of road and three major bridges. The route between Bamako and Dakar was shortened by some 200 km, and illicit fees and charges were reduced considerably.
Time required to pass through Senegal was reduced from 3 days to 1 day.
Time required to cross the border was reduced from 1 day to 2 hours.
Intra-community trade is expected to increase from 10% in 2005 to 30% in 2015.
The project also provided local communities with various infrastructure improvements, including boreholes, animal rest areas, health clinics and schools. These associated investments had a major impact on the rural population. Before the project, women walked an average of 5 km to fetch drinking water; after the project, the average walking distance dropped to 1 km. In addition, an integrated component to teach about HIV/AIDS reached one million people along the route.
2.13 The Bank has successfully delivered a high proportion of its planned outputs and outcomes. Development in Africa is unfolding in a very dynamic environment. Africa’s economic performance is influenced by many factors: the rise of middle-income countries and their demand for raw material, as well as such internal dynamics as the youth bulge and the pace of urbanisation. Shocks—from shifts in food and energy prices to climate variability—can bring about sudden changes. Across Africa’s 54 states, development is a result of the combination of countless decisions made by governments, firms and households. Given this dynamism, it is very difficult to attribute overall development results to the work of a single institution like the African Development Bank. To assess its contribution, the Bank builds up results from the project level. The 51 indicators in Level 2 of the Results Measurement Framework capture aggregate outputs from Bank projects that were completed between 2009 and 2011. The indicators provide a picture of the progress in delivering on the Bank’s medium-term strategy. Analysis of the Bank’s performance shows that overall, in 80% of the Bank’s core sectors, operations achieved or surpassed their expected outputs.
2.14 The Bank’s operations benefit the most vulnerable people in Africa. Analysis presented in this year’s ADER shows that, in addition to creating economic opportunities across Africa, the Bank’s operations increasingly benefit the most vulnerable citizens across the continent, with a high proportion of these operations located in the areas with the highest concentration of rural poverty (see Fig. 2).

6
Figure 2: The Bank’s Operations Create Opportunities and Benefit the Most Vulnerable Across Africa
The African Development Fund approved almost UA 6 billion in loans and grants between 2009 and 2011. To increase the transparency of its operations and better allocate its resources across the continent, the Bank is geo-coding its entire portfolio. This map so far plots the geographic location of 461 ADF operations with about 9,760 locations. . The shades of green represent the density of rural poor. Projects that can be pinned to a geographic location are signalled by a blue dot. The map shows that a high proportion of the Bank’s activities are targeted in areas that most need the Bank’s support.
Level 3: Is the Bank Managing its ADF Operations Effectively?
The performance of the Bank’s portfolio is improving, with some persistent disbursement challenges.
2.15 Managing the portfolio effectively is critical to the Bank’s overall development performance. At the end of 2011, the ADF portfolio consisted of 349 operations with a combined value of close to UA 9 billion. At the Twelfth General Replenishment of the African Development Fund in 2010, 26 donor countries and the Bank made a record contribution of UA 6.1 billion over three years to the ADF’s resources. The operations funded by the ADF have increased considerably in size and complexity. The Bank needs to ensure that operations are well designed and regularly supervised. It tracks disbursement rates closely to see whether operations are moving forward as planned, and it keeps a close eye on underperforming operations. For effective ownership and capacity development, the Bank is making good progress on using national systems, processes and institutions.
2.16 Overall, portfolio performance has been improving. Progress in portfolio performance in ADF countries has been recorded in a number of important areas:

7
The number of operations eligible for cancellation has dropped from 20% to 8%1,
surpassing the Fund’s 10% target for 2012. Management has been aggressively implementing a policy of cancelling non-performing operations and reallocating idle resources to more productive uses.
Satisfactory Project Appraisal Reports increased from 78% in 2009 to 93% in 2011, leading to fewer problems with implementation.
Budget support is increasingly disbursed to ADF countries on schedule. The indicator has increased from 60% in 2009 to 92% in 2011, exceeding the 75% target for 2012. This is due in part to a simpler and better designed conditionality framework that helps make disbursements more predictable.
The share of new operations with at least one gender indicator has increased from 61% to 75% in ADF countries, again exceeding the 2012 target.
In 2011, 60% of operations were climate-proofed, well above the 2012 target.
2.17 The Bank is, however, confronted with a few persistent challenges, including its disbursement ratios.
2 One of the Bank’s disbursement indicators that is not performing as well as planned is
the time elapsed from project approval to first disbursement. The Bank has made significant progress in reducing disbursement delays in operations—from 21 months in 2007 to 11 months in 2009. Since 2009, however, the Bank is no longer on track to meet its 2012 target of 10 months (see Fig. 3).
2.18 The reasons for this lapse in performance are to some extent a consequence of the 2008 global economic and financial crisis. In 2009, the Bank acted swiftly to help the Bank’s clients limit the effects of the crisis. It front-loaded commitments, restructured and accelerated programmes, fast-tracked approvals and made greater use of fast-disbursing instruments such as budget support. By providing its client countries with the liquidity necessary to avoid a deeper recession and sustain their poverty reduction programmes, the Bank helped African economies weather the worst effects of the global crisis. But this increased lending, combined with the increasing size and complexity of operations, put portfolio management under additional stress and took its toll on the Bank’s disbursement performance.
2.19 The Bank is acting to improve its disbursement performance. Improving disbursement performance is a complex undertaking; indeed, one that all MDBs are facing. Both Bank- and client-related causes of such delays have been identified, and the ADB will develop measures to expedite disbursements. For example, the Bank will assist clients in the ratification process, choose conditions more selectively, and allow for accelerated procurement for major contracts. The Bank has introduced fiduciary clinics to better train its own country teams and its partners.
Figure 3: Reducing the Delays between Project Approval and First Disbursement
The Bank has reduced the delays between project approval and first disbursement from 21 to 13 months. More needs to be done to reach the ambitious target of 10 months, and the Bank is taking action to reduce disbursement delays further.
1 These operations represent 4% of the value (in UA terms) of the ADF portfolio - see also the Progress Report on
ADF-12 Operational Priorities. 2 See also more detailed discussion in the ADF-12 MTR Discussion paper on Institutional Effectiveness (section 4)
21
11 13
10
5
10
15
20
25
2006 2007 2008 2009 2010 2011 2012 2013
Actual

8
2.20 The Bank is making progress on the Paris Declaration indicators on aid effectiveness. As noted in the Roadmap on Aid Effectiveness approved by the Board in 2011, the Bank focusses on areas it believes will best support effectiveness at country level: use of national systems, processes and institutions for effective ownership and capacity development, as well as alignment on budget and predictability for improved transparency and accountability. As part of its efforts to increasingly use country systems, the Bank is relying much less on parallel PIUs to implement its operations: the number of parallel Project Implementation Units (PIUs) has dropped from 113 to 38, exceeding the 2012 target of 40, and the use of country systems has increased from 39% to 50%. While there is still room for progress, both development resources recorded on budget and predictability have improved further in 2011 to 70% and 61%, respectively (see also section 3 below).
Level 4: Is the Bank, as an Organisation, Managing Itself Efficiently?
The Bank manages itself efficiently, but needs to improve human resource management.
2.21 An organisation that is fit for purpose. The final level of the ADB’s Results Measurement Framework looks at how well the Bank is managed as an organisation. The Bank is a large and complex structure, with around 1900 staff located across the continent. The Bank needs to ensure that its employees are well managed and highly motivated. It needs to keep its business processes nimble, while meeting exacting fiduciary standards. Management and technical resources need to be provided to ensure consistently good results across a decentralised organisation. To monitor progress in all of these areas, Level 4 of the Results Measurement Framework tracks progress against 11 indicators of organisational performance.
2.22 By and large, ADB performs well as an organisation. In 2011, 6 of the 11 indicators for organisational performance were on track to achieve the Bank’s 2012 targets:
The Bank is moving forward on decentralisation, devolving staff and responsibilities to field offices to form stronger partnerships with member countries. In 2011, field presence expanded to Burundi, Central African Republic, Liberia, and Togo, and a new field office will open in South Sudan in 2012. Nearly one-third of professional staff are now based at the 31 field offices. A quarter of project tasks are now managed from the field, and this share is set to increase substantially in 2012.
Field offices are supported by an increasingly effective information and communications infrastructure. The downtime of the Bank’s Wide Area Network in field offices dropped by more than two-thirds, from 175 hours in 2009 to only 53 hours in 2011, well exceeding the 2012 target of 150 hours.
The Bank is pressing forward with a range of measures to improve business processes and practices. Accounting practices were introduced that allow monitoring the Bank’s efficiency by allocating administrative costs to deliverables. This in turn allows the Bank to track administrative costs per 1 million of Units of Account disbursed. This indicator dropped from UA 109,000 in 2009 to UA 79,000 in 2011, surpassing 2012 targets.
2.23 Human resource management remains a persistent challenge. Both premature attrition rate—staff leaving before completion of their first contract—and vacancy ratio, which stands at 15%, fall short of meeting the ambitious 2012 targets. However, these ratios need to be put in perspective. In 2011, the Bank had 1,116 professional level staff (not including administrative staff) on its payroll. In the same year, the Bank recorded 17 departures of people who resigned before the end of their first contract—and half of these were junior staff, who typically have high turnover rates. That being said, the Bank is fully committed to curbing premature staff attrition and vacancy ratios through a wide range of actions. More efficient recruitment processes have been introduced through Bankwide pooling of vacancies, batch interviews, use of recommended lists and enhanced technology, including an upgraded online recruitment system.
Through these enhanced recruitment processes and a freeze on new positions, the Bank is working hard to reduce the vacancy ratio to below 5%--the 2012 target.

9
A detailed analysis of staff departures is being conducted to identify how the Bank can enhance career prospects and improve the work environment and work/life balance to improve retention.
People-management skills are being improved across the organisation by placing people management at the heart of performance assessment for all managers.
The recruitment process has been enhanced, including placing a stronger focus on younger professionals and women.
3. Progress and Challenges in Operationalising the Results Agenda
Institutionalising a results culture across the organisation.
3.1 The Bank is constantly improving its focus on development results. The results presented in the previous section reflect improvements in a whole series of underlying systems and processes that are designed to increase the Bank’s focus on results. As the Bank continues to adapt its operations to Africa’s new and emerging development challenges, it needs to build on lessons from its own experience as well as the experience of other MDBs. This means ensuring that the Bank remains a leader on managing for results. This section discusses in more detail actions that the Bank has taken during the ADF-11 and ADF-12 periods, and particularly in response to its commitments under the ADF-12 replenishment.
Progress in Operationalising the Results Agenda
The Bank has a come a long way.
3.2 Building on the foundations laid since ADF-9, the Bank has embarked on an ambitious results agenda. Amongst other things, it has improved its processes to better plan and manage for outcomes; established sustainable processes to capture results; launched tools to better monitor and report on results across the institution; produced structured results reports to inform Management and stakeholders; promoted networks to build results capacity at country level; and shaped the international development effectiveness agenda (see Fig. 4). The section below provides an update on some of the milestones in implementing the results agenda.

10
Figure 4: Milestones in Implementing the Results Agenda
The Bank first adopted a Results Measurement Framework (RMF) in 2003. It enhanced the framework for the ADF-10 and the ADF-11 periods to better address emerging priorities and concerns. In 2010 the Bank launched the African Development Bank Group’s RMF for 2010-2012—a major step forward, placing the Bank on a par with or ahead of many development organisations. The Bank also launched many complementary initiatives to better capture and report on results, including adjustments in the organisational structure to allow for better management for results and provide organisational support in implementing the results agenda.
3.3 Integrating results throughout the project cycle continuum. To measure the development impact of each of its operations throughout the project cycle, and keep operations under constant scrutiny, the Bank has revamped the full set of tools and processes it uses to continuously track results from project inception to project completion:
Readiness Reviews: designing operations to maximise their development impact. In 2010, the Bank introduced a new tool—the Readiness Review—to improve the quality at entry of its operations to ensure that they are technically sound and designed to maximise development impact. Quality at entry is extremely important for the Bank’s overall effectiveness, as errors in design tend to be hard to correct once implementation is under way. For each new project, a team carries out desk reviews: first of the Project Concept Note and then, following the design process, of the Project Appraisal Report. The review criteria include alignment and strategic fit, lessons learnt from prior operations, and the focus on results.
Improved standards for quality at entry. In 2010 the Bank adopted quality-at-entry standards for both public sector operations and country strategies and introduced a simpler and more robust results-based logical framework. Comprehensive reviews during concept and appraisal hep ensure good design and the use of strong results frameworks. Since January 2011, all public sector operations and country strategies undergo a systematic quality-at-entry assessment through the Readiness Review.
Monitoring operations’ quality at entry. An Annual Readiness Review Retrospective Report monitors quality at entry, analyses trends, and draws lessons from the Readiness Reviews. Some early findings indicate that projects that had a satisfactory rating at appraisal reached their first disbursement on average 25% faster than projects that were rated moderately unsatisfactory. The fact that the quality of operations has improved suggests that the Readiness Review has helped guide project teams in improving the readiness of the operations and country strategies. The Bank will continue its efforts to train staff in the use of the various quality assurance tools, including the results-based logical framework
11
Improving regular supervision of operations. In 2011 the Bank introduced a new Implementation Progress and Results Report with the aim of changing from sporadic supervision—as a one-off event or mission—to a continuous and field-based approach. A new project rating methodology with related rating criteria—based on evidence and focused on results (outcome and output reporting)—was adopted with the new report. Staff are being trained, and a help desk and a project clinic initiative will be established in 2012.
Reporting at project completion. Project results are assessed at project completion—the main source of results reporting. A new completion and results report, to be introduced later this year, will better capture results in line with the log-frame set out during the concept stage, and will increase the outcome focus, with a particular emphasis on beneficiaries. The strengthened completion report will also better capture lessons learnt to more systematically feed into the design of new operations.
Better capturing contributions from the private sector. Private sector operations are an integral part of the Bank’s business, and it is critical that their results also be captured and integrated into the corporate results framework. The Additionality and Development Outcomes Assessment (ADOA) framework was introduced in 2008 to enhance the quality-at-entry controls for private sector operations. It provides a platform for assessing contributions to private sector development at the project and portfolio levels. Measures are under way to integrate selected ADOA indicators into the Bank’s RMF.
3.4 Transparency: increasing the Bank’s accountability to its stakeholders. As a development bank, the ADB takes very seriously its commitment to openness and transparency on its activities and performance. It has a strong record of openly reporting on its results and operational performance. For example, it ranked third of 58 donors in the 2011 Aid Transparency Index published by the Publish What You Fund organisation. It has recently taken a range of actions to further increase access to information, provide transparent reporting, and actively engage with shareholders and the public:
A new disclosure policy. Recently the Bank adopted a new disclosure policy, allowing for even better access to its projects, knowledge and data. This increased transparency helps to hold the Bank accountable to its clients, donors and to civil society.
The International Aid Transparency Initiative. In 2011, the Bank endorsed the International Aid Transparency Initiative (IATI) in what it sees as a critical step towards aid effectiveness and mutual accountability. IATI has the potential to transform the way aid is managed by offering partners and citizens timely, accurate and comparable information. The Bank is finalising its implementation plan, according to its commitments on Busan, and has started collaborating on pilot implementations at country level.
Systematically reporting on the Bank’s performance in contributing to development results. In 2011, the Bank launched the first edition of its Annual Development Effectiveness Review (discussed in the previous section), to measure Africa’s development and the Bank’s contributions to it. The ADER has been well received as a focused and transparent way of reporting on results that provides a qualitative context for the indicators. It offers a candid overview of what the Bank has achieved and where it is facing challenges. The second edition of the ADER focused on inclusive growth and the Bank’s contribution to it.
Thematic and country results reports. The ADER is complemented by more detailed reviews of particular sectors and thematic areas. In 2012 the Bank launched three thematic Development Effectiveness Reviews (DERs): one on Fragile States and Conflict-Affected Countries, one on Governance, and one on Regional Integration. To provide deeper analysis and better link the Bank’s contributions to country results, this year the Bank also launched a series of Country Development Effectiveness Reviews; the first was on Rwanda.
Geocoding: mapping for results. The Bank is geographically mapping its portfolio of activities with a view to integrating this effort with other national open data and geospatial initiatives and making the information available to the public. This effort will improve the Bank’s ability to target operations in areas where they are most needed while improving coordination with other development agencies operating in the same regions. An example

12
of how this will be done is presented in Box 2. The Bank will also use this information to better plan and coordinate projects, as well as encourage better feedback from the public. As part of this exercise, the Bank is developing a dashboard to display its active portfolio on a user-friendly interface that provides more detailed information on each operation: its beneficiaries, implementation status, development impact, and so on.
Box 2: Geocoding: Mapping for Results will Improve the Bank’s Development Effectiveness
In 2011, Kenya launched its Open Data Initiative, making key government data—for example, data from the 2009 census, the 2005 household income survey, and seven years of detailed government expenditure data—freely available to the public through a single online portal. This makes Kenya a leader among developing countries in the adoption of open data. Kenyans now have access to local data on
schools, hospitals, etc., all presented on a map with detailed information on, for example, the number of students enrolled and the number of teachers, or the distance to clean water or fuel. They will be able to use the information to lobby their representatives for better facilities and services based on statistics.
There have been over 17,000 page views, and over 2,500 datasets have been downloaded and embedded in various websites and portals. There are now over 100 requests from the public for new datasets, and there is a clear demand for more transparency and more data.
Sharing data openly also enables the creation of new and innovative services in Kenya. One example is Huduma (huduma.or.ke), a platform
through which citizens can raise to their local authorities and service providers such issues as water outages or the bad quality of roads. By partnering with civil society organisations and local communities and empowering citizens to engage, Huduma can help increase transparency and accountability in the provision of services.
Through the Open Aid Partnership, the Bank is working with Kenya and with other donors to provide the geo-locations of projects. This will help in better planning projects and measuring results. Knowing exactly what exists, where gaps are, and who is working on what to address these gaps will help all parties make more informed choices. For example, overlaying coverage with new census data will help to better target, and also better measure results. Geocoding also offers a powerful tool to narrow the feedback loop. Openly accounting for projects allows more civil engagement and accountability to stakeholders, with more continuous direct feedback on the progress and the impact of the Bank’s operations on the ground.
3.5 An IT system to systematically capture and track results of all operations throughout the project cycle. With the introduction of a corporate RMF, the Bank has also developed an automated results reporting system to systematically and continuously capture the results achieved in operations. The system tracks results throughout the project cycle: it captures the log-frame at project appraisal, captures results during implementation, and records project results at completion. This system will strengthen the Bank’s capacity to report on different segments of the portfolio by sector, sub-sector, financial instrument, country, gender, and so on. A dashboard function is now being piloted to provide the basis for a results monitoring tool for use by Bank Management.
3.6 Building capacity to manage for development results in member countries. The Bank works with its partners to achieve results, and it relies on countries to monitor, measure and manage for results. It relies on national statistics to measure impact, identify needs and set priorities.

13
3.7 Supporting the African Community of Practice on Managing for Development Results. The African Community of Practice on Managing for Development Results (AfCoP) is the leading network to help build capacity for development results in Regional Member Countries. It builds on the expertise of more than 2500 members across 43 African countries to advance the results agenda and improve national development processes. In May 2012, the Bank approved a project to support AfCoP in further mainstreaming results into the policies and strategies of RMCs and the regional economic communities. The Bank helped AfCoP to set up national chapters in eight African countries to instil a results culture at country level by promoting political leadership for results, strengthening national capacities and systems, and engaging non-state actors to hold governments accountable for results.
3.8 Building statistical capacity at country level. Statistical capacity-building is essential to the Bank’s results efforts. Both the country and the Bank itself need reliable and up-to-date data for better measuring, monitoring and managing for development results. The Bank is engaged in building capacity in 53 RMCs, five sub-regional organisations, and six regional training centres to produce better and more readily available data. Building on what has already been achieved in the first two phases (2004 to 2011), the Bank recently launched the third phase of its Statistical Capacity Building programme to improve the quality and coverage of official statistics and to provide a reliable information base for national, regional and global policy-making as well as to support and monitor progress towards achieving the Millennium Development Goals and poverty reduction strategies.
3.9 Shifting the focus from effective aid to effective development. The Bank contributed greatly to shaping the agenda of the High Level Forum in Busan, shifting the focus from aid effectiveness to development effectiveness.
3.10 Shaping the Busan Agenda: contributing to a common African position. As part of its contribution, the Bank brokered the Tunis Consensus to establish a common vision for Africa's development agenda. The Bank also participated actively in the Busan Forum and, with the Asian Development Bank (AsDB) and the government of Korea, co-organised a special side event, “The quest for inclusive growth: Lessons and implications for development cooperation policy.” The Bank has also supported the NEPAD Planning and Coordination Agency and the African Union Commission in launching the African Platform for Development Effectiveness (www.africa-platform.org). This platform provides a forum for policy discussions and knowledge-sharing among African decision-makers and stakeholders in development as their countries define their path to development effectiveness.
3.11 Engaging in the post-Busan agenda. The Bank is contributing to framing the post-Busan governance and monitoring framework through the MDBs’ working group and will adapt its internal monitoring when the new set of indicators is approved. The Bank remain committed to supporting ownership and capacity development through the use of national systems, processes and institutions, as well as to transparency and accountability both at country and global levels.
3.12 Implementing the commitments under the Paris Declaration. The Bank remains fully committed to operationalising its Paris and Accra commitments. The Roadmap on Aid Effectiveness approved by the Board early in 2011 sets a Bankwide framework of action that not only addresses aid delivery issues targeted by the Paris Declaration but also takes a broader approach to improving development effectiveness. Selected indicators drawn from the Paris Declaration are fully integrated in the Bank’s RMF and monitored annually. The 2012 monitoring exercise shows encouraging results: use of country systems in ADF countries, for example, has increased from 39% in 2009 to 50% in 2011, while the number of parallel PIUs has dropped from 113 to 38 over the same period.
Outstanding Challenges and New Frontiers
Moving the results agenda forward.
3.13 The Bank has achieved much within a short period of time, establishing most of the critical processes and systems to manage for development results. As it makes progress, and learns from its successes and failures, the nature of the challenges it faces is changing. The focus is gradually shifting from systems and processes to institutionalising a results-oriented culture. Results management needs to be embedded in the culture of the organisation, accepted and
14
understood by staff, Management, clients and stakeholders. Changing the “soft” side of an organisation—its behaviours, incentives, practices and culture—is often the most complex challenge in change management. Constant demonstration of commitment and leadership, regular top-level communication, and gradual improvements in the quality of tools and service provided to staff are necessary to firmly root the results culture across the Bank. Results need to be mainstreamed into the processes and systems, and results must be equally a means of management and accountability as well as a tool for learning from successes and failures. The section below candidly discusses some of the Bank’s outstanding challenges and also new frontiers in making further progress in establishing a genuinely results-oriented development Bank.
3.14 Closing the feedback loop: learning from results. As a learning organisation, the ADB considers continuous learning to be critical. To achieve better results and avoid repeating mistakes, the Bank needs to learn from its successes and failures. A key element of the results agenda is to close the feedback loop—that is, to feed into the design of new operations the lessons learnt in operations and good practices generated across the continent. At a strategic level, corporate results reporting serves as a management tool, informing Management of what has been achieved in the past and highlighting areas where the Bank has performed well and where more attention is needed. The Bank is producing structured results reports (such as the ADER) and is rolling out a results dashboard to facilitate this process. It is also exploring ways to strengthen this feedback loop to more systematically use corporate results as a key input into the planning process. The Bank is collaborating with the AsDB —where results are an integral part of corporate management, informing key priorities for the corporate medium-term strategy—to learn how it is using results as a tool for corporate management.
3.15 The Independent Operations Evaluation Department (OPEV) conducts rigorous evaluations of the Bank’s operations and strategies. It uses various channels to feed these findings back into operations—reports, outreach activities, and regular briefings and knowledge seminars. This relationship is being strengthened through more constructive collaboration on deriving tangible actions from evaluations. A new Bankwide consultative mechanism—The Roundtable Review Mechanism—has been piloted to strengthen the quality of follow up to OPEV’s evaluations. Each review brings together representatives from a range of relevant Complexes and Departments to discuss findings in detail and work together to ensure that Management can take appropriate action to translate those findings into actionable improvements.
3.16 The Bank is conducting consultations as part of updating its CSO Engagement Framework. The framework will help make the Bank more transparent and accountable to its member countries and the broader public, facilitating greater participation by civil society in corporate policy, country dialogue and project design and implementation. New mechanisms and policies are being developed and promoted to better identify and integrate African citizens’ aspirations. This will help to hold the Bank to account for achieving results to a broader public, strengthening the voice of those it aims to assist and providing more direct feedback on the impact it is making.
3.17 Adjusting the RMF to reflect new and emerging challenges. As the Bank continues to adapt its operations to Africa’s new and emerging development challenges, it will need to build on lessons from its own experience as well as the experience from other MDBs. The Long-Term Strategy will set new strategic and operational priorities. This will require making a number of adjustments to the Bank’s RMF. An updated RMF, to be ready in 2013, will reflect the changes in priorities and will set ambitious targets for ADF-13 and onwards.
Level 1: Indicators of development progress. A revised set of indicators for measuring development progress will reflect emerging development challenges, such as inclusive and green growth, and the Bank’s new priorities.
Level 2 Indicators: Outputs and outcomes. These are critical to reporting at the corporate, sector, and regional levels. They allow aggregation and comparability over time. The RMF introduced and defined an extensive list of core sector indicators, which are regularly refined to reflect the lessons of implementation and international experience.
Levels 3 and 4: Indicators of operational efficiency. As the Bank evolves, progress is made, and new challenges emerge, the Bank will need to reconsider its indicators for operational effectiveness and institutional efficiency.

15
3.18 In developing its new RMF, the Bank will work closely with other MDBs to ensure that when MDBs use common indicators, they also use the same definitions and approach to measuring them. Harmonised indicators will make data more accessible and will reduce the burden on partners of generating data.
3.19 Enhancing IT and data systems and processes. Sound IT and data systems are the backbone of managing for and reporting on results. Sound and reliable data inform decision-making and help monitor progress. Integrating these systems into operational processes and monitoring and management decision making will support a deepening of the results focus throughout the institution. While most systems are in place to support staff in capturing, monitoring and reporting on results, additional efforts are needed to improve the quality and integrity of the Bank’s IT and data systems.
3.20 Rationalising and enhancing the Bank’s IT systems and improving data quality and integrity. Data quality remains a challenge, and significant efforts are still required to ensure the integrity of the data used in the various reports produced by the Bank. The complexity of the Bank’s SAP systems can create a disincentive for users to regularly update data and has encouraged the development of specific stand-alone tools. New tools have enhanced transparency at the expense of a stable IT architecture. To address the challenges, work is under way to consolidate and integrate the Bank’s IT systems by:
Upgrading the Bank’s SAP system. This will include a review of functionalities and interfaces and the integration of the Results Reporting System into the Bank’s systems.
Reviewing the Bank’s Business Intelligence architecture with a view to rationalising data management.
Enhancing and simplifying the end-user’s interfaces.
3.21 Rolling out the Bank’s Results Reporting Systems. Many legacy issues have impeded rolling out the Results Reporting System (discussed above). For example, many projects that started before the new RMF do not have a strong focus on outcomes and do not track the number of beneficiaries or use core sector indicators. To address this problem, core sector indicators are being grandfathered into older projects, integrating them into results frameworks. This results in a continuous improvement of the data quality, but it also means it will take some time. Only with wide uptake and consistent use of core indicators will it be possible to aggregate a fuller set of key indicators in priority areas to monitor and report on progress.
3.22 Reporting on ongoing operations rather than just completed operations. Today the Bank reports only on results achieved on project completion, and not on ongoing operations. Once more robust systems are in place and there is sufficient uptake and operational ownership to capture a large part of the portfolio, the Bank will switch from reporting on results achieved at completion to a more timely results monitoring system. This migration will be carefully prepared once projects are fully integrated into the new reporting system and lessons on how best to report on these results become available.
3.23 Fostering a results culture at country level. All too often, the results agenda is seen as a corporate reporting requirement for headquarters. A strong results culture at the country level is essential to the effective management of the Bank’s operations, and sound country programming is a critical component of effective results management. Identifying key bottlenecks and carefully coordinating project components and programs can help bring about better results. The Bank’s decentralization efforts will be a key component in strengthening its presence to better implement projects and manage for results. To support field offices, the Bank is providing results training, equipping staff with the necessary tools to better focus on results, and placing increasing emphasis on results in country engagement
3.24 To foster a stronger results focus in the country context, the Bank has launched a pilot Country Development Effectiveness Review that applies the four-level results framework to the country context. It is not only an exercise in transparent reporting, but also serves as an important tool to engage country teams to focus on results, thinking through the results chain, and learning how the different elements fit together, and how together results are being achieved. With its focus on a particular country, the Review can help better trace the Bank’s contribution to country outcomes, demonstrating the impact the Bank is having on improving people’s lives.

16
3.25 Country oriented tools and processes to promote a better results focus have been reviewed and new ones are being developed. Quality at entry standards for CSPs are now assessed through the readiness review process, and include a review of how strong the country strategy is in demonstrating the Bank’s contribution to the country’s development through a clear results chain. The new results reporting systems will offer a basis to develop targeted country results monitoring tools to track results at all four levels and serve as monitoring and management tools.
4. Conclusions
Continuous improvement in the context of ongoing reforms.
4.1 The Bank has come a long way in pursuing its ambitious results agenda. It is achieving results and is able to report on them. Solid foundations have been laid, and the Bank is in good shape to move forward. It is time to focus on consolidating its efforts, refine and further strengthen systems, processes and products, and deepen the results culture in the institution.
4.2 The Bank has embarked on an ambitious set of initiatives to further strengthen its capacity to deliver and report on results (see Fig. 5). Transparency and accountability will drive this process. The Bank will continue improving processes, learning from its own experience and that of the other MDBs. IT architecture will be strengthened and consolidated to make results data more accurate and available, and to better link it with national data platforms. The Bank will further strengthen reporting to promote transparency about how it contributes to development.
4.3 Overall, Management is confident that the Bank is on the right track. While the results agenda is well under way, some flexibility has to be built in to adjust to emerging needs and changing contexts to be responsive to the needs of the institution and stakeholders while producing reliable data, supporting staff, informing management, and strengthening the institution’s focus on results.
4.4 Against this background, Deputies are invited to provide their views and guidance on the design of the new RMF for the coming years:
Is the ADB pursuing the right focus and balance of indicators to reflect Africa’s development over the coming years and the Bank's contribution to it, and do they reflect the Bank’s reforms and priorities? Is setting medium-term targets aligned with the ADF cycle the right approach, or should the Bank set long-term targets?
Figure 5: The Bank is Consolidating its Efforts to Strengthen Results
2010 2011 2012 2013
THEMATIC/COUNTRY ADERS
ONE BANK RMF
CORE SECTOR INDICATORS
ADER ‘11
QUALITY AT ENTRY
QUALITY OF SUPERVISION
QUALITY AT EXIT
RESULTS REPORTING SYSTEM
GEOCODING
RESULTS AND QUALITY LEARNING
AFRICAN COMMUNITY OF PRACTICE
REVISED RMF
ADER ‘12 ADER ‘13
17
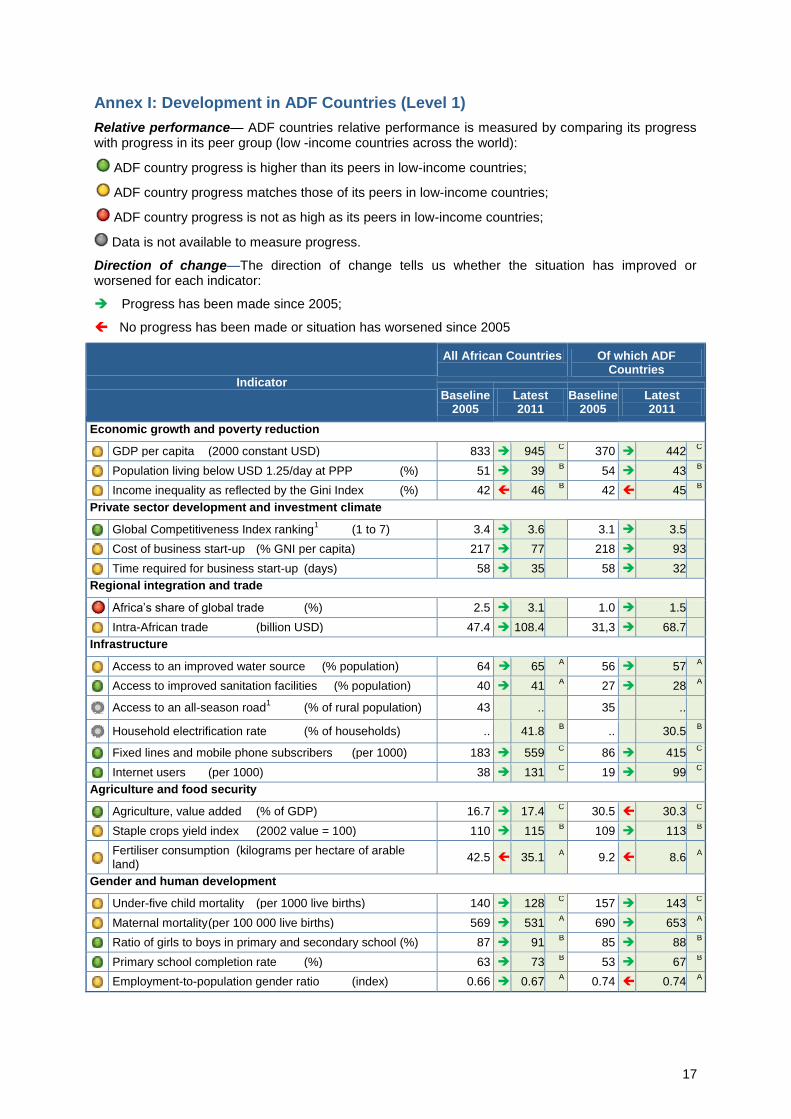
Annex I: Development in ADF Countries (Level 1)
Relative performance— ADF countries relative performance is measured by comparing its progress with progress in its peer group (low -income countries across the world):
ADF country progress is higher than its peers in low-income countries;
ADF country progress matches those of its peers in low-income countries;
ADF country progress is not as high as its peers in low-income countries;
Data is not available to measure progress.
Direction of change—The direction of change tells us whether the situation has improved or worsened for each indicator:
Progress has been made since 2005;
No progress has been made or situation has worsened since 2005
Indicator
All African Countries Of which ADF Countries
Baseline 2005
Latest 2011
Baseline 2005
Latest 2011
Economic growth and poverty reduction
GDP per capita (2000 constant USD) 833 945 C 370 442
C
Population living below USD 1.25/day at PPP (%) 51 39 B 54 43
B
Income inequality as reflected by the Gini Index (%) 42 46 B 42 45
B
Private sector development and investment climate
Global Competitiveness Index ranking1 (1 to 7) 3.4 3.6 3.1 3.5
Cost of business start-up (% GNI per capita) 217 77 218 93
Time required for business start-up (days) 58 35 58 32
Regional integration and trade
Africa’s share of global trade (%) 2.5 3.1 1.0 1.5
Intra-African trade (billion USD) 47.4 108.4 31,3 68.7
Infrastructure
Access to an improved water source (% population) 64 65 A 56 57
A
Access to improved sanitation facilities (% population) 40 41 A 27 28
A
Access to an all-season road1 (% of rural population) 43 .. 35 ..
Household electrification rate (% of households) .. 41.8 B .. 30.5
B
Fixed lines and mobile phone subscribers (per 1000) 183 559 C 86 415
C
Internet users (per 1000) 38 131 C 19 99
C
Agriculture and food security
Agriculture, value added (% of GDP) 16.7 17.4 C 30.5 30.3
C
Staple crops yield index (2002 value = 100) 110 115 B 109 113
B
Fertiliser consumption (kilograms per hectare of arable land)
42.5 35.1 A 9.2 8.6
A
Gender and human development
Under-five child mortality (per 1000 live births) 140 128 C 157 143
C
Maternal mortality (per 100 000 live births) 569 531 A 690 653
A
Ratio of girls to boys in primary and secondary school (%) 87 91 B 85 88
B
Primary school completion rate (%) 63 73 B 53 67
B
Employment-to-population gender ratio (index) 0.66 0.67 A 0.74 0.74
A

18
Governance and transparency
Public Expenditure and Financial Accountability score (1 to 7)
.. 3.2 A .. 3.1
A
Worldwide Governance Indicators avg. score (-2.5 to 2.5) -0.69 -0.66 C -0.84 -0.80
C
Extractive Industries Transparency Initiative score (% compliance)
.. 33.3 B .. 40
B
Fragile and conflict-affected countries
Country Policy and Institutional Assessment (CPIA) score
1
(average) 3.3 3.5 3.2 3.4
Number of fragile countries2 (number) 20 17 20 16
Environment and clean energy
Combustible renewables and waste (% of total energy) 46 43 B 79 81
B
.. = data not available; ADB=African Development Bank; ADF = African Development Fund; GDP=gross domestic product;
GNI=gross national income; PPP=purchasing power parity; USD=United States dollars.
Available Baseline year is 1 2006,
2 2007 Latest data available is for
A 2008,
B 2009,
C 2010.
Source: African Development Bank, Food and Agriculture Organization of the United Nations, International Monetary Fund, Organisation for Economic Co-operation and Development, United Nations Educational, Scientific and Cultural Organization, World Bank Group, and International Energy Agency.

19
Annex II: How the Bank Group Contributes to Development in ADF Countries (Level 2)
The table below presents the contribution the Bank is making to development through its operations in ADF countries. The Bank’s performance is measured by comparing expected and actual achievements for all operations that have been completed:
Bank operations achieved 95% or more of what was expected at the beginning;
Bank operations achieved 60-94% of what was expected at the beginning;
Bank operations achieved less than 60% of what was expected at the beginning;
Data is not available to measure performance.
Indicator
2009-2011 2012-2014
Expected Delivered Percentag
e delivered
Expected
Energy
Length of transmission and distribution lines rehabilitated or installed (km)
9,436 9,651 102% 8,928
Distribution substations and transformers constructed or rehabilitated (number)
188 279 148% 1,612
Power capacity installed (MW) 150 160 107% 1,300
Staff trained/recruited in the maintenance of energy facilities (number)
1,678 1,690 101% 1,200
People with a new electricity connection (number) 33,271 19,811 60% 104,757
Population benefiting from new electricity connections (people) 4,716,344 4,726,344 100% 2,449,511
Transport
Roads constructed, rehabilitated or maintained (km) 11,565 8,083 70% 9,077
Feeder roads constructed or rehabilitated (km) 16,974 15,215 90% 29,598
Staff trained/recruited for road maintenance (number) 34,169 33,397 98% 1,122
People educated in road safety and HIV transmission (people) 100,020 184,020 184% 25,000
People with improved access to transport (people) 10,269,00
0 10,269,00
0 100% 17,189,958
Water and Sanitation
Boreholes and wells drilled/rehabilitated and equipped (number) 23,520 24,160 103% 20,304
Drinking water transmission and distribution pipes constructed (km) 2,218 2,431 110% 955
Drinking water capacity created (service reservoirs m3/day) 316,173 342,800 108% ..
Latrines constructed or rehabilitated (number) 32,822 38,614 118% 92,909
Workers trained in the maintenance of water facilities (number) 22,229 32,197 145% 20,553
People with new or improved access to water and sanitation (people)
12,016,687
12,453,195
104% 13,132,421
Education
Classrooms and educational support facilities constructed/rehabilitated (number)
5,910 4,883 83% 4,575
Textbooks and teaching materials supplied (number) 13,887,92
2 13,882,88
7 100% 451,554
Teachers and other educational staff recruited/trained (number) 96,693 106,728 110% 68,632
Students newly enrolled (number) 168,683 169,770 101% 161,465
Students and scholars reached (students) 3,260,637 3,017,349 93% 1,754,360
Health
Primary, secondary and tertiary health centres 1,556 1,581 102% 1,443

20
constructed/equipped (number)
Health workers trained (number) 22,649 23,285 103% 41,717
Health training and education sessions (number) 7,048 7,048 100% 799
People with access to better health services (people) 11,537,85
8 11,263,47
7 98% 13,056,232
Microfinance and Social Sector
Social facilities, community centres constructed and equipped (number)
8,514 8,776 103% 931
Jobs created (number) 1,861 1,861 100% 234,625
Government/NGO staff trained in microfinance management (number)
7,408 7,403 100% 21,323
Microcredits granted (number) 377,973 326,354 86% ..
Microfinance clients trained in business management (number) 14,500 14,500 100% 10,600
Population benefiting from microfinance and social activities (people)
12,869,474
12,814,131
100% 8,302,279
Agriculture
Rural marketing and production facilities constructed or rehabilitated (number)
5,934 4,974 84% 3,931
Land with improved water management developed or rehabilitated (ha)
163,685 171,841 105% 192,704
Land whose use has been improved: replanted, reforested, landscaped, etc. (ha)
712,388 853,316 120% 499,720
Heads of livestock provided/vaccinated (number) 1,593,898 1,651,873 104% ..
Plants introduced: seedlings, trees, etc. (number) 4,806,283 4,403,879 92% 990,659
Social facilities established or rehabilitated (number) 6,974 6,943 100% 1,891
Agricultural inputs provided: fertiliser, seeds, etc. (tons) 442,489 467,196 106% 147,640
Agricultural community-based projects executed (number) 554 582 105% 1,270
Rural population trained/recruited/using improved technology (people)
673 940 140% 770,964
Rural households reached (household) 339,240 418,777 123% 247,302
Total population benefited (people) 8,142,672 8,138,368 100% 26,008,244
Regional Integration
Cross-border roads constructed or rehabilitated (km) 471 467 99% 1,021
Cross-border transmission lines constructed or rehabilitated(km) 667 665 100% 769
Private Sector and Trade1
Foreign exchange saved (million USD) .. 2,283 .. 631
Government revenue from investee projects and sub-projects (million USD)
.. 1,718 .. 22,897
SME effect (turnover from investments) (million USD) .. 416 .. 3,008
Total jobs created for investee projects and sub-projects (jobs) .. 324,670 .. 2,422,393
Total jobs created for women (jobs) .. 25,930 .. 763,032
..=data not available; ha=hectares; km=kilometres; MW=megawatts ; m3=cubic metres; NGO=non-governmental organisation;
SME=small and medium-sized enterprise; USD=United States dollars.
NB: UA figures from material converted at 1 UA= $1.58036
Source: African Development Bank.
1 Results expected come from Private sector operations approved only in 2009 or later when the ex-ante assessment of
development outcomes and additionality (ADOA) was launched. The numbers may therefore appear lower than they actually
are. Over the next few years the expected results will climb as more operations from 2009 and later begin to reach their full
operating maturity. This will also allow for a baseline for closed projects to assess achievement of targets.

21
Annex III: How well the Bank Group manages its ADF operations (Level 3)
The table below presents the Bank’s progress in achieving its 2012 targets for portfolio management:
Good progress has been made, and we are on track to achieve our target;
Little progress has been and we are at risk of not achieving our target;
No progress has been made, or we have moved even further away from our target;
Data is not available to measure performance.
Indicator
ADF Countries
Baseline 2009
Latest 2011
Target 2012
Portfolio Performance
Operations formally supervised twice a year (%) 61 63 65
Problem projects in ongoing portfolio (%) 6 5 5
Disbursement ratio of ongoing portfolio (%) 18 18 20
Number of operations eligible for cancellation (%) 20 8 10
Quality-at-Entry
Budget support disbursed on schedule (%) 60 92 75
Time elapsed from approval to first disbursement (months) 13 13 11
Operations that disclose ESIAs on time (%) 82 95 90
CSPs rated satisfactory (%) .. 92 95
Operations rated satisfactory1 (%) 78 93 95
Regional operations rated satisfactory1 (%) 75 100 90
Paris Declaration Indicators of Effective Aid
Development resources recorded on budget (%) 57 70 85
Predictable disbursements (%) 54 61 80
Use of country systems (%) 39 50 53
Parallel project implementation units (number) 113 38 40
Knowledge Management
Exiting projects with a timely PCR (%) 92 92 90
PCRs rated satisfactory (%) 72 76 80
New ESW and related papers (number) 52 55 73
Gender Mainstreaming
PCRs with gender-disaggregated data (%) 56 68 75
New projects with at least one gender indicator (%) 61 75 70
New CSPs with at least one gender indicator (%) .. 42 70
Climate Change
Climate-proofed projects (%) 0 60 15
.. = data not available; ADB=African Development Bank; ADF = African Development Fund; CSP=Country Strategy Paper; ESIA=Environmental and Social Impact Assessment; ESW=economic and sector work; PCR=Project Completion Report.
1 Baseline is 2010.
Notes: Government data for Paris Declaration indicators “Development resources recorded on budget” and “Predictable disbursements” could be collected in 2011 for only 10 countries from the baseline group with historical measures available from 2005. Source: African Development Bank.

22
Annex IV: How efficient the Bank Group is as an organisation (Level 4)
The table below presents the Bank’s progress in achieving its 2012 targets for organisational performance:
Good progress has been made, and we are on track to achieve our target;
Little progress has been made and we are at risk of not achieving our target;
No progress has been made, or we have moved even further away from our target;
Indicator Baseline
2009 2010 2011
Target 2012
Decentralisation
Operations professional staff based in Field Offices (%) 26 26 29 40
Projects task managed from Field Offices (%) 16 19 25 35
Human Resources
Staff premature attrition rate1 (%) 11 28 28 6
Share of women in professional staff (%) 26 27 28 33
Vacancy rate (%) 12 13 15 5
Operations professional staff (%) 62 67 72 65
Business Processes and Practices
Lapse of time for bidding completion (weeks) 63 60 42 40
Administrative costs per UA 1 million disbursed (UA thousands) 109 92 79 93
Transparency and Timely Auditing
Project audits submitted on time (%) 9 29 59 80
Information Technology
Downtime of Wide Area Network in Field Offices (hours) 175 108 53 150
Average time to resolve clients’ IT requests (hours) 5 4.3 4 4
.. = data not available, ADB = African Development Bank, ADF = African Development Fund; IT=information technology; UA=Units of Account.
1 The premature attrition rate can be measured in different ways. The definition used here uses the percentage of professional
staff leaving the Bank within the first three years of contract in comparison to total professional staff leaving the Bank in the same period.
Source: African Development Bank.