results and recommendations - pennsylvania state university 1 pv panel.… · results and...
TRANSCRIPT

April 7, 2009 Page | 21
ZÜtÇwi|xã Matthew Karle AT ANNAPOLIS TOWNE CENTRE Construction Management – Dr. Anumba
Final Report
Results and Recommendations
The Maryland Energy Administration has proposed New Energy Incentives in order to promote building implementation in homes and businesses in Maryland, this would directly apply to GrandView if a solar PV array was installed in the future.
For homeowners:
• Increases a 10 percent tax credit for energy efficiency improvements to a 30 percent tax credit
• Eliminates caps for specific improvements (such as windows and furnaces), and instead establishes an aggregate cap of $1,500 for all improvements placed in service in 2009 and 2010 (except biomass systems, which must be placed in service after the act is enacted).
• Tightens the energy efficiency requirements to meet current standards. For residential renewable energy systems, the act removes all caps on the tax credits, which equal 30 percent of the cost of qualified solar energy systems, geothermal heat pumps, small wind turbines and fuel cell systems.
• Eliminates a reduction in credits for installations with subsidized financing
For businesses:
• A new 30 percent investment tax credit is available for projects that establish, re‐equip, or expand manufacturing facilities for fuel cells, microturbines, renewable fuel refineries and blending facilities, energy saving technologies, smart grid technologies, and solar, wind and geothermal technologies. The credit also applies to the manufacture of plug‐in electric vehicles and their electric components, such as battery packs, electric motors, generators and power control units. The credit may also be expanded in the future to include other energy technologies that reduce greenhouse gas emissions.
It is my recommendation that the US government provide higher tax incentives and grants for solar installation. Energy research funding should be focused on the development of higher efficiency solar panels and their overall manufacturing process. Savings can be passed on to the consumer by reducing the cost to manufacture such panels.
As far as the constructability of an array is concerned, advancements of cell mounting and delivery should enable manufactures the ability to incorporate PV’s into building materials that would both save time when installing and provide more aesthetically pleasing features that are less noticeable.

April 7, 2009 Page | 22
ZÜtÇwi|xã Matthew Karle AT ANNAPOLIS TOWNE CENTRE Construction Management – Dr. Anumba
Final Report
Analysis 1: Photovoltaic Panel Implementation and Life Cycle
(7.1) Problem Statement:
Everywhere we turn in today’s economy it seems that energy is driving all that we do. Between gas prices and electric bills, the cost of energy consumption is overwhelming. There are many technologies out there waiting to be tapped into such as the harnessing of the sun’s power. Advancements in technology such as NanoSolar’s super thin PV panels are giving the industry cheaper and more efficient options. Their manufacturing process allows PV panels to actually be printed out on a roll that is a fraction of the thickness of conventional panels and much cheaper. The use of photovoltaic panels is not new to the industry. If PV panels were implemented into the roof system of GrandView, tenant’s bills would be reduced and therefore money would be saved. Although PV panels are more expensive in the initial investment, I believe that the owners/tenants would benefit in the long run. The roof of GrandView is for the most part, unused. There is a small portion in the center of the deck that is used for the social club and pool area. The rest is blocked from view. Would the area of the roof provide enough available space to install a PV system that would have a great enough impact as to reduce monthly electric bills? * GrandView is connected to a large parking garage that has perfect southern exposure. The deck has a covered roof that is solely there to provide protection to the vehicles underneath. (7.3) Research Goals: It is my intention to determine the feasibility, advantages and disadvantages of implementing photovoltaic panels onto the roof of GrandView. A quantification of the amount of energy that a standard PV panel will be obtained and then translated into power generation that the building could provide as a whole. The analysis will cover the initial costs of installation as well as the energy savings and utility costs that would be accrued over a longer period of time. A separate CO2 quantification will be carried out to determine how much CO2 per year the implementation of a PV array will prevent from entering the atmosphere. It is my hope that the implementation of PV panels in GrandView Apartment Complex will reduce the energy consumption by the tenants in the long term operation of the building. It is understood that there will be a greater upfront cost of the addition of the panels. However, through analysis, I hope to find that the long term benefits will outweigh the short‐term investment and ultimately save the tenants and owner money.
Note: “CO2” stands for CO2‐equivalents (which means other greenhouse gases are included).

April 7, 2009 Page | 23
ZÜtÇwi|xã Matthew Karle AT ANNAPOLIS TOWNE CENTRE Construction Management – Dr. Anumba
Final Report
(7.4) Tools:
a. PV Watts Calculator b. National Renewable Energy Laboratory d. Google SketchUp f. Gilbane Building Company g. Calls to solar panel companies
(7.5) Background
Solar power harnesses the sun’s energy to make clean electricity. Its value to the consumer depends on factors such as geography and local policies, including the terms for selling surplus power to the public grid. PV power is growing at a rate of about 48% per year and presents an economical and intelligent way to cut energy costs, reduce exposure to rising utility prices and help safeguard the environment.
There are predominately two types of photovoltaic technologies being implemented today; thick crystalline and thin film cells. The first and most predominately used is thick crystalline cells. While more efficient than their paper thin cousin, these cells weigh far more and use more material. Because of their size, they cost more and are more difficult to install. Efficiency rangers are between 11% and 14%. The total energy produced by a 223 W panel is about 12 Watts per square foot.
The most eco‐friendly and quickest emerging type is known as ‘thin film’. These modules are made with less than 1% of the silicon used crystalline lines and are manufactured using automated equipment in fewer steps. This means a step‐function change in cost per watt and a lower effective cost per kilowatt hours for large‐scale applications. As far as efficiency goes, Sharp’s thin film modules convert nearly 9% of the sun's total energy into electricity and have almost reached the 10% mark. For every kW of rated power, thin film delivers more kilowatt hours‐up to 10%‐than its crystalline silicon cousin, due to substantially greater resistance to losses caused by typical mid‐day operating temperature.
Figure 7.1: Thick Crystalline Solar Array

April 7, 2009 Page | 24
ZÜtÇwi|xã Matthew Karle AT ANNAPOLIS TOWNE CENTRE Construction Management – Dr. Anumba
Final Report
When dealing with power storage and distribution of a solar array, two types of approaches can be taken. The array can either be a stand‐alone or grid‐tied system. Stand‐alone systems are typically used in smaller applications where access to power lines is difficult. Benefits to a grid‐tied system are as follows:
• Excess electricity produced by the PV array can be fed back into the grid and stored
• The array acts up as a support system during the peak hours of operation which lowers the power consumption from the grid
• There is a 100% efficiency rating
Figure 7.2: Thin Film Solar Array

April 7, 2009 Page | 25
ZÜtÇwi|xã Matthew Karle AT ANNAPOLIS TOWNE CENTRE Construction Management – Dr. Anumba
Final Report
(7.6) Sun Path and Shadow Analysis
Because of protrusions on the roof, it was hard to determine where to place the solar arrays as to avoid any shadows. A study done by National Semiconductor claims that even if 8‐16% of the array is covered during the day, it results in an average power loss of 35%‐40%. Therefore, it is imperative that the arrays be placed in the area that receives full sunlight during the peak hours of the day.
According to a shadow analysis of the building rooftop during each time of the day, the array was determined to be best suited in two separate areas on the East and West ends of the building.
Figure 7.3: July Shadows Figure 7.4: December Shadows

April 7, 2009 Page | 26
ZÜtÇwi|xã Matthew Karle AT ANNAPOLIS TOWNE CENTRE Construction Management – Dr. Anumba
Final Report
Max AC Power Output 5000 W : 4500 WAC OUTPUT (nominal) 240 V : 208 VAC FREQUENCY (nominal) 60 HzMax Continuous Output Current 21‐22 AMax Output over Current Protection 30Max Utility Backfeed Current 12:00 AMPower Factor >0.99Output Characteristics Current Source
Weight 58 lbs.Dimensions 29" x 16 " x 6"
Power Data
Size
INVERTER SPECIFICATIONS: GT5.0
(7.7) Product Information
In order to reduce utility costs of GrandView, several different solar ideas were presented. The first of which was integrating the panels into the glass foot windows in the south side of the building. This was quickly determined to be too small of an area and relatively ugly when talking about the aesthetic features of the building. Placement on the roof proved to be the best location for the solar arrays. In order ease calculations, a standard 200 W conventional multicrystalline silicon PV module was chosen.
Photovoltaic Panel Type: BP Solar sx3200 200 Watt PV Module
Inverter Type: Xantrex GT 5.0 Series Grid Tie Solar Inverter

April 7, 2009 Page | 27
ZÜtÇwi|xã Matthew Karle AT ANNAPOLIS TOWNE CENTRE Construction Management – Dr. Anumba
Final Report
(7.8) Design Methodology
The following section will provide a detailed look into the design of the PV system and its eventual integration into the building through a step by step process.
Using the open circuit voltage of 30.8V per panel and the U.S. NEC Rating of 600V, it is determined that 19.5 panels are allowable per series which converts to a round number of 20 panels per series.
Number of Panels in Series = (600V)/(30.8V/Panel) = 19.48 = 20 Panels
STEP 1 Determining the Number of Panels in a Series
In order to size the inverters, the number of panels in a series is multiplied by the max power of each panel.
Size of Inverter = (20 Panels)(200 W/Panel) = 4000 W = 4 kW
Based on this data the Xantrex GT 5.0 was chosen which is rated at 5000 W and has a 208 V AC output. The full specs for the GT 5.0 Inverter can be found in Appendix C
STEP 2 Sizing the Inverters
Calculating the number of inverters required is as simple as dividing the total number of panels in the array by the number of panels in a series. The result yields a total of 10 inverters.
Number of Inverters = (200 Panels)(20 Panels/Series) = 10 Inverters
STEP 3 Determining the Number of Inverters Required
• Two (2) Separate Array locations at opposite ends of the roof
• Each Array consists of 100 panels arranged in rows of 10 (200 total panels)
• Panels are rated at 200W and measure 66” x 33” for a total area of 15.13 ft2
• The Array is fixed facing directly south with the optimal 39.2 degree tilt for its location
• Xantrex GT5.0 Inverters have been chosen to convert to AC power
GIVEN Basic Array Design and Layout
ELECTRICAL BREADTH

April 7, 2009 Page | 28
ZÜtÇwi|xã Matthew Karle AT ANNAPOLIS TOWNE CENTRE Construction Management – Dr. Anumba
Final Report
Using the open circuit voltage of 30.8V per panel and the U.S. NEC Rating of 600V, it is determined that 19.5 panels are allowable per series which converts to a round number of 20 panels per series.
Max Panel Loading = (175 A)(208V)(3)1/2 = 63046.6 W = 63 kW
STEP 1 Confirm Panel Boards have Sufficient Load Capacity
Since 10 Inverters will be placed on this panel board, it is necessary to determine whether or not the total load of the inverters is less than the panel board load capacity. In order to determine the number of
inverters was multiplied by the load that each supplies.
Total Inverter Load = (10 Inverters)(4.0 kW) = 40 kW
From the above calculations it is determined that 40 kW < 49.8 kW therefore the Panel Board can support the load supplied by the inverters.
The 49.8 kW comes from the total capacity minus the existing load (63 kW – 13.2 kW)
STEP 2 Checking to Confirm the Total Inverter Load on the Panel Board
For a single phase, it is determined that the load of each inverter needs to be divided by 2 in order to get the loading of each on the panel board.
Load Per Inverter on P.B. = (4.0 Kw)/(2) = 2.0 kW
STEP 3 Determining Load Each Inverter has on the Panel Board
• Integrate into powering the rooftop and all of the corridor lighting loads
• Electrical Rooms on the Roof and 12th floors have room to house the inverters
• Rooms are close to inverters and array system which requires minimal wiring
• Inverters are considered single phase loads and require 2 “spare locations” for the 2 phase wires
• Each of the two separate 20 Kw array systems will be fed into two separate panel boards
KNOWN Electrical Impact and System Integration

April 7, 2009 Page | 29
ZÜtÇwi|xã Matthew Karle AT ANNAPOLIS TOWNE CENTRE Construction Management – Dr. Anumba
Final Report
A B C(2) #12 AWG 2.0 13 A(1) #12 WAG G 2.0 15 B(2) #12 AWG 2.0 17 C(1) #12 WAG G 2.0 19 A(2) #12 AWG 2.0 21 B(1) #12 WAG G 2.0 23 C(2) #12 AWG 2.0 25 A(1) #12 WAG G 2.0 27 B(2) #12 AWG 2.0 29 C(1) #12 WAG G 2.0 31 A
INVERTER 4 25/2
INVERTER 5 25/2
INVERTER 2 25/2
INVERTER 3 25/2
INVERTER 1 25/2
Load DescriptionWire and Conduit
Kw LoadCB/Phase Circuit No. Φ
A B CA 14 2.0 (2) #12 AWGB 16 2.0 (1) #12 WAG GC 18 2.0 (2) #12 AWGA 20 2.0 (1) #12 WAG GB 22 2.0 (2) #12 AWGC 24 2.0 (1) #12 WAG GA 26 2.0 (2) #12 AWGB 28 2.0 (1) #12 WAG GC 30 2.0 (2) #12 AWGA 32 2.0 (1) #12 WAG G
25/2 INVERTER 4
25/2 INVERTER 5
25/2 INVERTER 2
25/2 INVERTER 3
Load Description
25/2 INVERTER 1
Φ Circuit No. CB/PhaseKw Load Wire and
Conduit
To size the circuit breakers, divide the watts of the inverter by 208V. this will yield amperes.
Circuit Breakers Size = (5000 W)/(208 V) = 24.04 = 25A Circuit Breaker
However, each inverter is only receiving 4000 W therefore, as 20A Circuit breaker should suffice. It can always be switch out for a higher capacity if the array is added to in the future
STEP 4 Sizing the Circuit Breakers
Based off the circuit breaker size and considering the inverter comes with a ___ knockout for the wires, it is determined that 2 ‐ #12 AWG and 1 #12 AWG wire sizes should be used. This conforms to THHN/THWN AT
600V.
• (2) #12 AWG (THHN) +(1) #12 AWG (THWN)
STEP 5 Wire Sizes
Table 7.1: Inverter 1‐5 Panel Layout
Table 7.2: Inverter 5‐10 Panel Layout
END ELECTRICA
L BREADTH

April 7, 2009 Page | 30
ZÜtÇwi|xã Matthew Karle AT ANNAPOLIS TOWNE CENTRE Construction Management – Dr. Anumba
Final Report
(7.9) Array Analysis using PV Watts Energy Calculator
The size of a photovoltaic (PV) system is its nameplate DC power rating. This is determined by adding the PV module power listed on the nameplates of the PV modules in watts and then dividing the sum by 1,000 to convert it to kilowatts (kW). PV module power ratings are for standard test conditions (STC) of 1,000 W/m2 solar irradiance and 25°C PV module temperature. The default PV system size is 40 kW. This corresponds to a PV array area of approximately 3025 ft2 (280 m2).
To calculate the energy production of a solar array in the Maryland region, a program developed by the National Renewable Energy Laboratory was used. The PV Watts Calculator determines the cost of electricity a solar array produces given the location of the array and the tilt. For this analysis, two different tilt angles are shown. This is partly due to the construction costs of tilting the array. For all intensive purposes, the maximum solar gain with the tilt of 39.2 degrees will be used in the calculations.
As for C02 emissions otherwise known as greenhouse gases (GHG) , the EPA reports that each kilowatt‐hour of electricity produced from coal creates 2.3 lbs. of carbon dioxide.
Figure 7.5: PV WATTS Calculation Results for 40 kW array

April 7, 2009 Page | 31
ZÜtÇwi|xã Matthew Karle AT ANNAPOLIS TOWNE CENTRE Construction Management – Dr. Anumba
Final Report
(7.10) Constructability of Support System
It is important to note that the array on the roof will be a fixed tilt array set at 39.2 degrees in order to maximize energy absorption. This also allows the array to partially shade the section of the roof that it is on while letting air pass underneath.
In this case a lightweight structural aluminum frame for each row will be constructed prior to mounting. The array could in fact be placed flush with the roof at a 0 degree tilt. When this scenario was run in the PV WATTS calculator it was determined that the overall (AC) output of the system would be approximately, 42,009 kWh per year. This is 7,102 kWh or 14% less than if it were mounted on tilted support structure.
Constructability issues of flush mounted system: • Reduced initial investment in structural support system and installation • A greater area available for PV array because the panels would not need spacing between them • Lighter load on the roof itself because no structural support necessary • Maintenance becomes an issue when trying to access panels in the center of the array • Higher heat gain conducted through the roof due to lack of air circulation under the panels
Constructability issues of structural tilt mounted system: • Higher initial investment due to support material and labor costs • Slightly higher load on roof due to support system • Shading effect comes into play which reduces solar gain on the roof
Structural Materials and Cost of Installation
A quote from Tubular Steel Inc was maintained outlining the design and labor cost of a structural support system needed to house the proposed 39.2 degree fixed tilt array. It was determined that a $4700 total implementation price would be incurred. This resulted in an additional $1.50 per square foot be added to the base amount of $6.50 for flush mounted system, making the total panel and installation cost of a tilted array system $8.00 per square foot. The initial investment of
Post‐Report‐Completion Analysis (Angels and Spacing)
Due to a realization at the end of the report, I decided to add this section just to clear up my thinking process and mistake. It was determined after a quick geometry calculation and sun angle calculation that the spacing required between rows of panels would need to be 50” as to not cast shadows on the panels behind them during the winter months. Due to the relatively low energy loss compared to a flush mount system and the fact that 1.5 more panels could be placed in the same area with a flush mounted system, it is only logical that a flush mounted system be used. However, this stage of enlightenment was realized after the completion of the report, and therefore should be noted, but the final results will be given with the tilted fixed support system.

April 7, 2009 Page | 32
ZÜtÇwi|xã Matthew Karle AT ANNAPOLIS TOWNE CENTRE Construction Management – Dr. Anumba
Final Report
JAN FEB MAR APR MAY JUN JUL AUG SEP OCT NOV DECPower 3.49 4.41 4.79 5.11 5.26 5.67 5.59 5.27 4.95 4.91 3.59 2.86
Power Data (kWh/m2day) Angled Array‐ Annapolis, MD
(7.11) PV Impact on Building Cost and Environment
After considering the shadow analysis of GrandView’s rooftop and the incentive to keep the solar array hidden from pedestrian and adjacent views for aesthetic purposes, the following cost and power analysis provides initial cost estimates and environmental impacts.
It is assumed the area provided on the roof will not take GrandView off the grid. That is, it cannot provide enough power to all the residencies by itself. Therefore, it is proposed that the solar array system be specifically tailored to power the rooftop amenities such as the lounge, area pool area, club and interior corridor lighting. A solar energy system is ideal for this type of situation because the peak energy production occurs during the summer when this area is used the most. During the winter, solar energy production decreases with the use of the area.
The first thing that needs to be analyzed is the potential solar radiation gain that an array system of this size and location can produce. Using the PV Watts software seen on the previous page the following results were obtained.
For Annapolis, MD a 40 kW array system can produce a total of 49,111 kWh per year (AC), with the maximum gain occurring in June and the minimum occurring in December.
The initial investment of a system is often one of the main detracting points when thinking about installation. It is important to remember that while the initial investment may be significant, the overall life‐cycle cost and environmental impact should also be considered and weighed greatly. This is due to the fact that over time, if properly maintained and utilized, the system should pay for itself. After that point it is considered savings.
Cost Offset: When analyzing the amount of power generated by the solar array, the following figures where used in accordance with the Power Data shown in Table 7.3 above:
• Panel Power: 200W (Max Power)
• Panel Voltage: 30.8V (Open Circuit Voltage)
• Maryland Energy Price: $0.138/kWh
• Coal CO2 equivalent of 1.6 lbs./kWh
• Panel and Installation: $8.00 / watt
Table 7.3: Generated Power Data per Month

April 7, 2009 Page | 33
ZÜtÇwi|xã Matthew Karle AT ANNAPOLIS TOWNE CENTRE Construction Management – Dr. Anumba
Final Report
Item Quantity Cost / Unit Total CostPV Panels 40000 W $8.0/W $320,000.00Inverters 10 $3,060 $30,600.00Savings ‐$10,000.00
‐$3,000.00
Total Cost $337,600.00
INITIAL INVESTMENT
Federal: $10,000 State: $3,000
Initial Investment
While researching the cost of photovoltaic system and installation, it was determined that the overall cost of would amount to about $8.00 per watt including the installation and support structure for the incline of 39.2 degrees needed for maximum solar gain. This is relatively low due to some other figures that were found. It was assumed that the lowest cost found would be used due to rapid technological advances in solar technology including thin film. The following is the initial investment cost of the system:
Assumptions on incentives were made on the fact that the Maryland Energy Administration is considering revising its clean energy grant programs for fiscal year 2010 (which starts July 1, 2009.) This enables residents to claim 30 percent of the total installed cost of solar PV, solar hot water, and geothermal heat pump systems against their federal income tax.
For photovoltaic property the maximum incentive was taken totaling $10,000 because the size of the system exceeds per watt incentive calculations.
Table 7.4: Initial Investment
Figure 7.6: Conceptual West Array Figure 7.7: Conceptual East Array

April 7, 2009 Page | 34
ZÜtÇwi|xã Matthew Karle AT ANNAPOLIS TOWNE CENTRE Construction Management – Dr. Anumba
Final Report
Month (AC) kWh/month Savings($) Savings(lbs of CO2)
JAN 3390.00 $469.18 5424FEB 3862.00 $534.50 6179MAR 4469.00 $618.51 7150APR 4520.00 $625.57 7232MAY 4630.00 $640.79 7408JUN 4648.00 $643.28 7437JUL 4714.00 $652.42 7542AUG 4437.00 $614.08 7099SEP 4096.00 $566.89 6554OCT 4400.00 $608.96 7040NOV 3242.00 $448.69 5187DEC 2704.00 $374.23 4326
$6,797.10 78,579
SAVINGS PER YEAR
TOTAL SAVINGS
(7.12) Savings and Life‐Cycle
Using the data provided by the PV Watt Calculator and environmental factors, the following power and CO2 savings was calculated:
The addition of the 40 kW solar array would essentially save $6,800.00 on electricity cost and keep 39.3 tons of CO2 from entering the atmosphere annually. This equates to a total of $136,000 of energy produced (assuming the cost of energy stays the same) and 786 tons of CO2 saved over the span of 20 years.
This would reduce its total carbon footprint due to electricity consumption by %13.
Considering the Initial Investment of $337,600 and the fact that the array provides $6,800.00 per year in savings, the total payback period for the system would be approximately 49 years. However, this did not take into account the inflation of energy price over time. Therefore, the payback period would most likely be less the 49 years. Assuming that the life cycle of the building is 50 years, the initial investment would in the end pay off. However, newer and more efficient technologies are likely to emerge that surpass the existing solar technologies.
Knowing that only a small amount of energy can be produced due to the limited roof area and cast shadows, I wondered if it would be possible to provide GrandView with enough solar power that it did not need to tap into the grid for energy. GrandView provides parking in the adjacent 4 story parking garaged that is connected to the lobby by a bridge. Most of the upper lever is open except for a small ‘shade’ roof centered in the middle. The question posed was would I be able to erect a solar array that would provide both shade for the cars beneath it as well as enough energy to power GrandView’s electrical load.
Table 7.5: Electrical Cost Savings and CO2 Savings

April 7, 2009 Page | 35
ZÜtÇwi|xã Matthew Karle AT ANNAPOLIS TOWNE CENTRE Construction Management – Dr. Anumba
Final Report
(7.13) Quick Analysis: Feasibility of Utilizing Adjacent Parking Structure
An adjacent parking garage that provides 4 levels of parking for the tenants of GrandView provides a perfect area to install a large additional array. The 4th floor of the structure is open air space; therefore, a shading structure could be erected for the cars parked on the roof that incorporates solar panels. An array of this size using 200 watt PV panels would result in 43,900 ft2 which is equivalent to the area of a football field not including the end zones. Obviously, there is not nearly this much available space on the roof of GrandView so taking the residencies off the grid using solar power in this case is highly unlikely. Therefore, the goal of PV panel implementation would be to reduce the monthly energy consumption costs and provide clean renewable energy.
Theory: In theory, if an efficient layout was used on the roof of GrandView for a solar array, and the following was neglected; rooftop views, aesthetics, structural loads, and cost, a potential 4000 ft2 solar array collected could be constructed. In addition to the roof area, the attached parking garage could be utilized. Adding a solar array to the roof of the garage would not only give an additional 43,900 ft2 of collective surface, but would also provide protection to the parked cars which currently are only protected by a small shading roof that already exists. The total collective area provided by both the roof and garage would be 46,900 ft2, which would provide 10 times the amount of energy as just a roof array system alone as well as shade for parked vehicles.
Total Area: 46,900 ft2 Number of Panels 3116 Power Provided 630 kWh Total System Cost $ 4.9 million Payback Period 46 years Amount of CO2 saved 618 tons/year
Assumptions:
• Best Case Scenario With incentives and Tax Credit in Maryland • Assume 13.8 cents per kWh does not inflate over time • Payback Period accounts for $107,000 energy savings per year • CO2 savings is equal to 1.6 lbs of coal burned per kWh • CO2 savings accounts for 774,000 kWh of AC produced per year
Item Quantity Cost / Unit Total CostPV Panels 630000 W $7/W $4,410,000.00Inverters 3 $100,000 $300,000.00Structure $180,000.00
Total Cost $4,890,000.00
INITIAL INVESTMENT
Support
Table 7.6: Initial Investment
Figure 7.8: Solar Array above Parking Deck

April 7, 2009 Page | 36
ZÜtÇwi|xã Matthew Karle AT ANNAPOLIS TOWNE CENTRE Construction Management – Dr. Anumba
Final Report
(7.14) Constructability Review
In order to determine the feasibility of construction and the impact the installation of the panels would have on the design of the building, some key areas of constructability were looked at.
Schedule Impact
The impact that this type of system would have on the schedule is minimal. It can be installed at any point after the completion and water tight test of the roof. It is not considered to be on the critical path and therefore trades can work on the installation virtually unimpeded.
Panel Weight In order to ease the concern of whether
or not solar panel addition would require a structural re‐design, BP solar panels are extremely lightweight (34 lbs). as to not exceed load limitations.
Mounting A fixed mounting system at a 39.2
degree tilt is the optimal design. Each row would need its own support system which would consist of simple steel
tubing or wood.
Inverters Since the inverters tie directly into the panels, there are no batteries to deal
with which alleviates added construction and maintenance time as well as cost
Wiring The system is set up so each panel is pre‐wired. All that needs to be done once they are in place is a quick
connection.
Maintenance Solar PV systems are considered highly durable and require a minimal amount of maintenance. Since, the panels are at roof level and have gaps between each row, if a panel does malfunction, it can
be accessed extremely easily.
Utility and Inspector Requirements A local inspector would need to be contacted in order to evaluate the
system and determine if it meets the area requirements. The utility company
would need to be notified prior to connection into the grid.
Transport Due to the lightweight nature of the panels, the elevators can be used to transport them to
the roof. At 34 lbs, a roofer should have no trouble carrying and placing each panel by themselves. A system of this size could easily be installed in a day.
April 7, 2009 Page | 37
ZÜtÇwi|xã Matthew Karle AT ANNAPOLIS TOWNE CENTRE Construction Management – Dr. Anumba
Final Report
Results and Recommendations
Through the analysis the following results overall results were determined:
• A 40kWh solar array would occupy ft2 of roof space and provide 49,111 kWh annually
• An array system of this is would require a $337,600.00 initial investment
• Through a savings and life cycle cost analysis, it was determined that $6,797.00 worth of electricity would be produced annually. This equates to an approximate annual savings of $49.00 per apartment unit.
• The environmental impact of this system prevents 39.3 tons of CO2 from entering the atmosphere annually and reduces its total carbon footprint due to electricity consumption by %13
• The payback period of a 40 kWh array system would be 49 years.
• If the adjacent parking garage was utilized a 630 kW solar array system could be erected that would generate power for GrandView as well as provided shade and protection for the cars.
These results have led me to recommend that the array system not be installed at this time. From an owners view, the benefits do not outweigh the initial investment and environmental impact.
However, solar technology has been advancing exponentially in the last few years with thin film technology and more efficient designs. New government incentives and energy acts bring down initial investments costs in the near future. Based on these facts, it is my recommendation that an eventually solar array be installed in 5 years after new low cost panels are introduced into the market and government incentives allow for a greater reduction in initial investments.
Since the roof will remain unused in the areas specified in the analysis, quick installation would be possible and there would be minimal disturbance to the tenants.
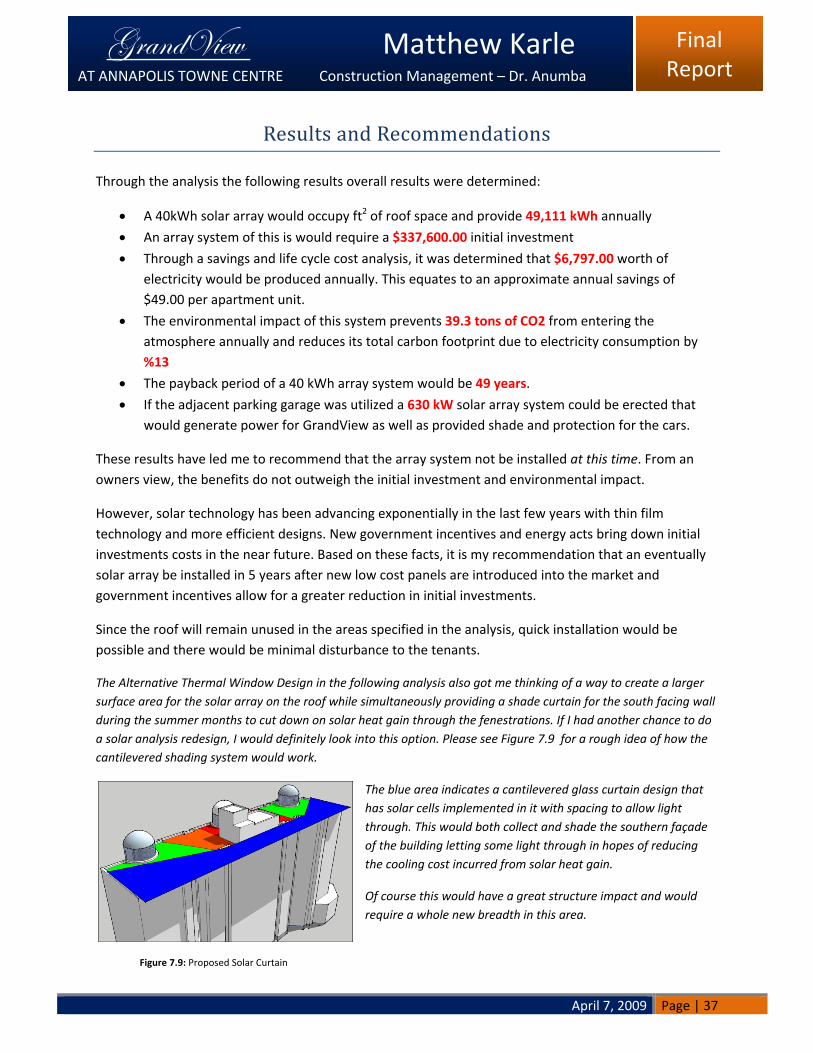
The Alternative Thermal Window Design in the following analysis also got me thinking of a way to create a larger surface area for the solar array on the roof while simultaneously providing a shade curtain for the south facing wall during the summer months to cut down on solar heat gain through the fenestrations. If I had another chance to do a solar analysis redesign, I would definitely look into this option. Please see Figure 7.9 for a rough idea of how the cantilevered shading system would work.
The blue area indicates a cantilevered glass curtain design that has solar cells implemented in it with spacing to allow light through. This would both collect and shade the southern façade of the building letting some light through in hopes of reducing the cooling cost incurred from solar heat gain.
Of course this would have a great structure impact and would require a whole new breadth in this area.
Figure 7.9: Proposed Solar Curtain