results announcement for the three and six months … · 1 hong kong exchanges and clearing limited...
TRANSCRIPT
1
Hong Kong Exchanges and Clearing Limited and The Stock Exchange of Hong Kong Limited take no responsibility for the
contents of this announcement, make no representation as to its accuracy or completeness and expressly disclaim any liability
whatsoever for any loss howsoever arising from or in reliance upon the whole or any part of the contents of this announcement.
XIAOMI CORPORATION小米集團
(A company controlled through weighted voting rights and incorporated in the Cayman Islands with limited liability)
(Stock Code: 1810)
RESULTS ANNOUNCEMENTFOR THE THREE AND SIX MONTHS ENDED JUNE 30, 2018
The board (the “Board”) of directors (the “Directors”) of Xiaomi Corporation 小米集团 (the “Company”) is pleased to announce the unaudited consolidated results of the Company and its subsidiaries (collectively, the “Group”) for the three and six months ended June 30, 2018 (the “Reporting Period”). These interim results have been prepared in accordance with International Accounting Standard 34 “Interim Financial Reporting” and reviewed by PricewaterhouseCoopers, the independent auditor of the Company, in accordance with International Standard on Review Engagements 2410 “Review of interim financial information performed by the independent auditor of the entity” issued by the International Auditing and Assurance Standards Board, and by the audit committee of the Company (the “Audit Committee”).
In this announcement, “we”, “us”, and “our” refer to the Company (as defined above) and where the context otherwise requires, the Group (as defined above).
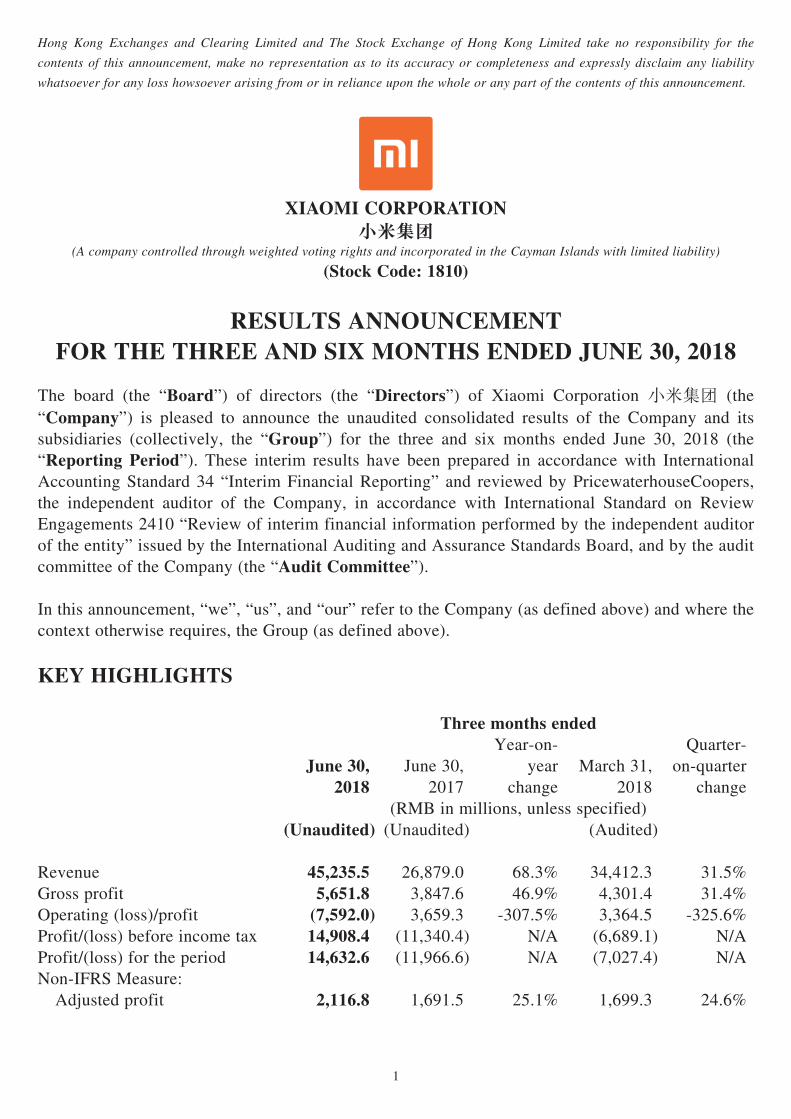
KEY HIGHLIGHTS
Three months ended
June 30, 2018
June 30, 2017
Year-on-year
changeMarch 31,
2018
Quarter-on-quarter
change(RMB in millions, unless specified)
(Unaudited) (Unaudited) (Audited)
Revenue 45,235.5 26,879.0 68.3% 34,412.3 31.5%Gross profit 5,651.8 3,847.6 46.9% 4,301.4 31.4%Operating (loss)/profit (7,592.0) 3,659.3 -307.5% 3,364.5 -325.6%Profit/(loss) before income tax 14,908.4 (11,340.4) N/A (6,689.1) N/AProfit/(loss) for the period 14,632.6 (11,966.6) N/A (7,027.4) N/ANon-IFRS Measure: Adjusted profit 2,116.8 1,691.5 25.1% 1,699.3 24.6%

2
Six months endedJune 30,
2018June 30,
2017Year-on-
year change(RMB in millions, unless specified)
(Unaudited) (Unaudited)
Revenue 79,647.8 45,410.8 75.4%Gross profit 9,953.2 6,311.7 57.7%Operating (loss)/profit (4,227.5) 5,613.8 -175.3%Profit/(loss) before income tax 8,219.4 (18,862.5) N/AProfit/(loss) for the period 7,605.2 (19,833.6) N/ANon-IFRS Measure: Adjusted profit 3,816.1 2,352.0 62.2%
BUSINESS REVIEW AND OUTLOOK
1. Overall financial performance
In the second quarter of 2018, we achieved RMB45.2 billion in revenue, representing growth of 68.3% year-on-year. Adjusted profit grew 25.1% to RMB2.1 billion year-on-year. All business segments achieved strong revenue growth, with the fastest growth seen in our IoT and lifestyle products segment.
2. Smartphones
Our smartphones segment recorded approximately RMB30.5 billion in revenue for the second quarter of 2018, representing year-on-year growth of 58.7%. This growth was driven by an increase in both smartphone sales volume and our average selling price (“ASP”). Smartphone sales volume for the quarter reached 32.0 million units, up 43.9% on a year-on-year basis. According to IDC Consulting (Beijing) Ltd. (“IDC”), we are the fastest growing amongst the top five mobile phone companies globally.
“Amazing products, honest pricing” remains our core pursuit. With this fundamental goal in mind, we have continued to push the boundaries of technological development to release a series of innovative products in the second quarter of 2018. To mark the 8th anniversary of Xiaomi, we released our flagship smartphone Mi 8 which is equipped with cutting-edge technologies. Mi 8 is the world’s first smartphone to use pressure sensitive in-display fingerprint technology and dual frequency GPS. It is also the first Android smartphone to have 3D face unlock. Mi 8’s camera also features outstanding performance, receiving a score of 105 in DxOMark’s review which is a leading position in the industry. Mi 8’s camera continues to improve user experience and is well-received among both professional users and mass consumers.
In China, our strategic focus for 2018 is to expand into the high-end smartphone market and we have seen good progress. Our smartphone ASP in mainland China increased over 25% year-on-year in the second quarter of 2018. Our flagship phone series, Mi 8, which has an average ASP above RMB2,000, sold over 1.1 million units in the first month of sales.

3
The smartphone market in mainland China is in a period of recalibration. We believe our strategic focus to further penetrate the high-end smartphone market by optimizing our product portfolio in 2018 will lay the groundwork for further shipment unit growth in China in 2019.
3. IoT and lifestyle products
The IoT and lifestyle products segment grew 104.3% year-on-year in revenue to RMB10.4 billion for the second quarter of 2018.
Global sales volume of our smart TVs grew over 350% year-on-year for the second quarter of 2018. We became the number one TV brand in mainland China in the second quarter of 2018. We also launched our smart TV in the India market in February 2018 and built significant market share by the end of the second quarter of 2018.
We continued to broaden our IoT product portfolio globally. As we bring more IoT products to international markets, such products direct additional traffic to our overseas sales channels, improving the efficiency of our overseas operations.
We also continued to launch innovative IoT products, such as the Mi VR Standalone headset that we co-developed with Oculus, and Mi Band 3, which features a large touchscreen, 50 meter water resistance and battery life of up to 20 days. Mi VR Standalone headset was named one of the best inventions of 2017 by Time Magazine.
As of the end of the second quarter of 2018, we had about 115 million connected Xiaomi IoT devices, excluding smartphones and laptops, representing 15% quarter-on-quarter growth. There are close to 1.7 million users who own more than five Xiaomi IoT devices, excluding smartphones and laptops, representing 19% quarter-on-quarter growth.
4. Internet services
Revenue from our internet services segment grew 63.6% year-on-year to RMB4.0 billion in the second quarter of 2018, driven primarily by increasing monetization in mainland China. Advertising revenue grew 69.6% year-on-year to RMB2.5 billion driven by continued optimization of our recommendation algorithm and increased advertising spending from our customers. Revenue from internet value-added services also grew 54.1% year-on-year to RMB1.5 billion.
Within internet value-added services, revenue from gaming accounted for RMB703.9 million, growing 25.5% year-on-year.
Monthly active users (“MAU”) of MIUI increased 41.7% from 146.0 million in June 2017 to 206.9 million in June 2018, driven by increasing smartphone sales volume and user adoption. Average revenue per user (“ARPU”) this quarter increased 15.4% year-on-year to RMB19.1. Up until the end of the second quarter of 2018, our internet services revenue was primarily generated in mainland China. We are excited about opportunities to provide internet services in the global market and are developing internet services for our international users to provide them with a better user experience, and to lay the foundation for future revenue growth.
4
Artificial intelligence (“AI”) technology is a core part of our strategy. Our AI assistant (“小愛同學 ”) won the “2018 Leading Scientific and Technological Achievement Award — Cool Technologies” and “2018 Leading Scientific and Technological Achievement Award — New Product” awards at the China International Big Data Industry Expo held in May 2018. As of July 2018, our AI assistant (“小愛同學 ”) MAU exceeded 30 million. Our AI speaker has accumulated over 2 billion activations within the first year of its launch.
To promote the development of the AI industry, in June 2018 we announced that our Mobile AI Compute Engine (“MACE”), a prediction framework for a deep learning model optimized for mobile devices, would become a fully open source platform. Using MACE, developers can more quickly and efficiently develop AI applications on mobile devices and significantly enhance the user experience of these applications. At present, application scenarios covered by MACE include scene recognition, image super-resolution, image stylization processing, intelligent speech, intelligent translation, etc. Embracing open source and encouraging public participation in technological advancement is an important part of our culture.
5. International markets
Our international revenue grew 151.7% year-on-year to RMB16.4 billion, which accounted for 36.3% of our total revenue.
According to Canalys, our smartphones continued to experience rapid growth in the Indian market and ranked first in terms of market share by shipment in the second quarter of 2018. In Indonesia, we also recorded impressive growth and ranked number two in terms of smartphone shipments in the second quarter of 2018. In the Western Europe market, we expanded into France and Italy in May 2018. In the second quarter of 2018, smartphone shipments in Western Europe grew over 2700% year-on-year.
As of the second quarter of 2018, we were ranked top five in the smartphone markets in 25 countries and regions, according to Canalys.
6. Others
Quality
Maintaining high quality across our products is our priority. We continued to see improvement in our product quality in the second quarter of 2018.
We recently appointed Mr. Yan Kesheng as the Group’s Vice President and chairman of the quality committee. Mr. Yan will be responsible for the quality management of all of our products and services and will oversee the continued improvement of user experience for our products. This is the first senior management appointment after the listing of the Group, and reflects our commitment to quality. Mr. Yan Kesheng has more than 20 years of experience in mobile phone research and development. He previously led the research and development of a series of important innovative smartphones and led the quality management committee of our smartphone department.

5
Efficiency
Xiaomi is an innovation-driven company that also focuses on efficiency. We continued to expand our efficient offline channels while maintaining our online channels in the second quarter of 2018. As of June 30, 2018, we had more than 400 Mi Homes in mainland China, mainly in first and second tier cities. To penetrate more rural parts of China, by the end of the second quarter of 2018, we had over 360 authorized stores and also had built a direct supply network covering more than 37,000 locations, spread across over 30 provinces, over 300 cities and over 2,500 towns. In India, our offline smartphone sales achieved a market share of over 20% and ranked number one in 8 cities, according to GFK, in the second quarter of 2018. Even with the rapid expansion of offline channels, our overall operation remained highly efficient with an operating expense ratio at 8.8% for the second quarter of 2018.
Strategic partnerships
We have recently established strategic partnerships with several leading companies to further strengthen our business, including:
— a global strategic alliance with CK Hutchison Holdings Limited to explore global markets;
— a strategic partnership agreement with China Merchants Group to deepen cooperation in various areas, including finance and investment; and
— a strategic partnership agreement with China Mobile Communications Corporation to cooperate and explore opportunities in nine major areas including 4G+ terminal, new retail, smart hardware and IoT, joint marketing, government enterprise services and cloud services, 5G, cross-border businesses and investment.

6
MANAGEMENT DISCUSSION AND ANALYSIS
Second Quarter of 2018 Compared to Second Quarter of 2017
The following table sets forth the comparative figures for the second quarter of 2018 and the second quarter of 2017:
Three months endedJune 30,
2018 June 30,
2017(RMB in millions)
(Unaudited) (Unaudited)
Revenue 45,235.5 26,879.0Cost of sales (39,583.7) (23,031.4)Gross profit 5,651.8 3,847.6Selling and marketing expenses (2,075.7) (1,143.5)Administrative expenses (10,456.9) (228.8)Research and development expenses (1,363.6) (707.3)Fair value changes on investments measured at fair value through profit or loss 526.9 1,738.3Share of losses of investments accounted for using the equity method (128.5) (84.6)Other income 207.3 172.9Other gains, net 46.7 64.7Operating (loss)/profit (7,592.0) 3,659.3Finance (expense)/income, net (32.3) 4.5Fair value changes of convertible redeemable preferred shares 22,532.7 (15,004.2)Profit/(loss) before income tax 14,908.4 (11,340.4)Income tax expenses (275.8) (626.2)Profit/(loss) for the period 14,632.6 (11,966.6)Non-IFRS Measure: Adjusted profit 2,116.8 1,691.5

7
Revenue
Revenue increased by 68.3% to RMB45,235.5 million for the second quarter of 2018 on a year-on-year basis. The following table sets forth our revenue by line of business for the second quarter of 2018 and the second quarter of 2017:
Three months endedJune 30, 2018 June 30, 2017
Amount% of total
revenue Amount% of total
revenue(RMB in millions, unless specified)
(Unaudited) (Unaudited)
Smartphones 30,501.1 67.4% 19,218.7 71.5%IoT and lifestyle products 10,378.8 22.9% 5,080.9 18.9%Internet services 3,958.2 8.8% 2,419.6 9.0%Others 397.4 0.9% 159.8 0.6%
Total revenue 45,235.5 100.0% 26,879.0 100.0%
Smartphones
Revenue from our smartphones segment increased by 58.7% from RMB19.2 billion in the second quarter of 2017 to RMB30.5 billion in the second quarter of 2018, driven by strong growth in both sales volume and ASP. We sold approximately 32.0 million smartphone units in the second quarter of 2018, compared to approximately 22.2 million units in the second quarter of 2017. The ASP of our smartphones was RMB952.3 per unit in the second quarter of 2018, compared with RMB863.8 per unit in the second quarter of 2017. The increase in ASP was primarily due to strong sales of our mid to high end models such as MIX 2S and Mi 8 in the China market, consistent with the shifts in consumer taste in China’s smartphone market. Enhanced marketing efforts in the second quarter, as well as major promotional events including the Mi Fans Festival in April and mid-year 6.18 sales in June further boosted our brand awareness and sales performance.
IoT and lifestyle products
Revenue from our IoT and lifestyle products segment increased by 104.3% from RMB5.1 billion in the second quarter of 2017 to RMB10.4 billion in the second quarter of 2018, primarily due to strong sales growth in existing products, particularly smart TVs and laptops. Revenue from the sales of our key IoT products, including smart TVs and laptops, increased by 147.2% from RMB1,689.8 million in the second quarter of 2017 to RMB4,178.0 million in the second quarter of 2018.

8
Internet services
Revenue from our internet services segment increased by 63.6% from RMB2.4 billion in the second quarter of 2017 to RMB4.0 billion in the second quarter of 2018, primarily due to growth in advertising revenue. MIUI MAU increased by 41.7% from 146.0 million in June 2017 to 206.9 million in June 2018. Average internet services revenue per user, calculated as internet services revenue for the three months ended June 30 divided by the MAU in June for such year, increased from RMB16.6 in the second quarter of 2017 to RMB19.1 in the second quarter of 2018.
Others
Other revenue increased by 148.6% from RMB159.8 million in the second quarter of 2017 to RMB397.4 million in the second quarter of 2018, primarily due to an increase in hardware repair revenue, in-line with our increase in hardware sales.
Cost of Sales
Our cost of sales increased by 71.9% from RMB23.0 billion in the second quarter of 2017 to RMB39.6 billion in the second quarter of 2018.
Three months endedJune 30, 2018 June 30, 2017
Amount
% of segment revenue Amount
% of segment revenue
(RMB in millions, unless specified)(Unaudited) (Unaudited)
Smartphones 28,458.9 62.9% 17,541.3 65.3%IoT and lifestyle products 9,399.5 20.8% 4,485.3 16.7%Internet services 1,473.0 3.3% 909.0 3.4%Others 252.3 0.5% 95.8 0.3%
Total cost of sales 39,583.7 87.5% 23,031.4 85.7%
Smartphones
Cost of sales related to our smartphones segment increased by 62.2% from RMB17.5 billion in the second quarter of 2017 to RMB28.5 billion in the second quarter of 2018, primarily due to increased sales of our smartphones and the appreciation of the United States dollar against the RMB and Indian Rupee in the second quarter of 2018. For a detailed break-down of the costs of our smartphones segment, please refer to the section headed “Financial Information” in the prospectus of the Company dated June 25, 2018.

9
IoT and lifestyle products
Cost of sales in our IoT and lifestyle products segment increased by 109.6% from RMB4.5 billion in the second quarter of 2017 to RMB9.4 billion in the second quarter of 2018, primarily due to increased sales of smart TVs and laptops and other IoT products and the appreciation of the United States dollar against the RMB.
Internet services
Cost of sales related to our internet services segment increased by 62.0% from RMB909.0 million in the second quarter of 2017 to RMB1,473.0 million in the second quarter of 2018, primarily due to increased infrastructure service spending resulting from higher user traffic and engagement.
Others
Cost of sales in our others segment increased by 163.4% from RMB95.8 million in the second quarter of 2017 to RMB252.3 million in the second quarter of 2018, primarily due to increased hardware repair costs.
Gross Profit and Margin
As a result of the foregoing, our gross profit increased by 46.9% from RMB3.8 billion in the second quarter of 2017 to RMB5.7 billion in the second quarter of 2018. The gross profit margin from our smartphones segment decreased from 8.7% in the second quarter of 2017 to 6.7% in the second quarter of 2018. The gross profit margin from our IoT and lifestyle products segment decreased from 11.7% in the second quarter of 2017 to 9.4% in the second quarter of 2018. In order to lay the groundwork to capture long term value, we will selectively prioritize higher growth to capture market share in key products over higher gross margins. We are also closely monitoring changes in currency exchange rates and will take necessary measures to mitigate exchange rate impact. The gross profit margin from our internet services segment increased from 62.4% in the second quarter of 2017 to 62.8% in the second quarter of 2018. As a result of the foregoing, our gross margin decreased from 14.3% in the second quarter of 2017 to 12.5% in the second quarter of 2018.
Selling and Marketing Expenses
Our selling and marketing expenses increased by 81.5% from RMB1,143.5 million in the second quarter of 2017 to RMB2,075.7 million in the second quarter of 2018, primarily due to our enhanced marketing efforts, such as advertising during the World Cup and offline advertising campaigns for newly launched products including the Mi 8, MIX 2S and Mi 6X. Salaries and benefits relating to selling and marketing personnel increased from RMB285.5 million in the second quarter of 2017 to RMB459.3 million in the second quarter of 2018 primarily due to increased headcount to accommodate the rapid growth of our business.
10
Administrative Expenses
Our administrative expenses increased by 4,469.6% from RMB228.8 million in the second quarter of 2017 to RMB10,456.9 million in the second quarter of 2018, primarily due to one-off share-based compensation of RMB9.9 billion in the second quarter of 2018, as well as the expansion of our administration departments, including the management, human resources and accounting teams. Salaries and benefits (excluding the one-off share-based compensation) relating to administrative personnel increased from RMB116.7 million in the second quarter of 2017 to RMB302.7 million in the second quarter of 2018, primarily due to the related headcount increase to accommodate the rapid growth of our business. Our administrative expenses, excluding the one-off share-based compensation, increased from RMB228.8 million in the second quarter of 2017 to RMB527.1 million in the second quarter of 2018.
Research and Development Expenses
Our research and development expenses increased by 92.8% from RMB707.3 million in the second quarter of 2017 to RMB1,363.6 million in the second quarter of 2018, primarily due to the expansion of our research and development efforts for our internet services and several new research projects. Salaries and benefits relating to research and development personnel increased primarily due to increased headcount to accommodate the rapid growth of our business.
Fair Value Changes on Investments Measured at Fair Value Through Profit or Loss
Our fair value changes on investments measured at fair value through profit or loss decreased by 69.7% from RMB1,738.3 million in the second quarter of 2017 to RMB526.9 million in the second quarter of 2018, primarily due to the smaller changes in fair value gains of our equity and preferred share investments in the second quarter of 2018.
Share of Losses of Investments Accounted for Using the Equity Method
Our share of losses of investments accounted for using the equity method changed from a loss of RMB84.6 million in the second quarter of 2017 to a loss of RMB128.5 million in the second quarter of 2018, primarily due to share of loss of IQIYI in the second quarter of 2018.
Other Income
Our other income increased by 19.9% from RMB172.9 million in the second quarter of 2017 to RMB207.3 million in the second quarter of 2018, primarily due to the increase in dividend income following the declaration of dividends by Midea Group (Shenzhen Stock Exchange Stock Code: 000333) in the second quarter of 2018 and the increase in returns from our wealth management products.
Finance (Expense)/Income, Net
We had net finance income of RMB4.5 million in the second quarter of 2017 and a net finance expense of RMB32.3 million in the second quarter of 2018, primarily due to greater interest expenses as a result of higher indebtedness.

11
Fair Value Changes of Convertible Redeemable Preferred Shares
Changes in the fair value of our convertible redeemable preferred shares were recorded as “fair value changes of convertible redeemable preferred shares”. Fair value changes of convertible redeemable preferred shares changed from a loss of RMB15.0 billion in the second quarter of 2017 to a gain of RMB22.5 billion in the second quarter of 2018, primarily due to revaluation of equity value of the Company based on the Offer Price in the Global Offering. After the completion of the Global Offering, all of our convertible redeemable preferred shares were converted to our Class B Shares. The fair value of each of convertible redeemable preferred shares is equivalent to the fair value of each of our ordinary shares on the conversion date, which is the Offer Price in the Global Offering.
Income Tax Expenses
Our income tax expenses decreased from RMB626.2 million in the second quarter of 2017 to RMB275.8 million in the second quarter of 2018.
Profit/(Loss) for the Period
As a result of the foregoing, we had a loss of RMB12.0 billion and profit of RMB14.6 billion in the second quarter of 2017 and the second quarter of 2018, respectively.
12
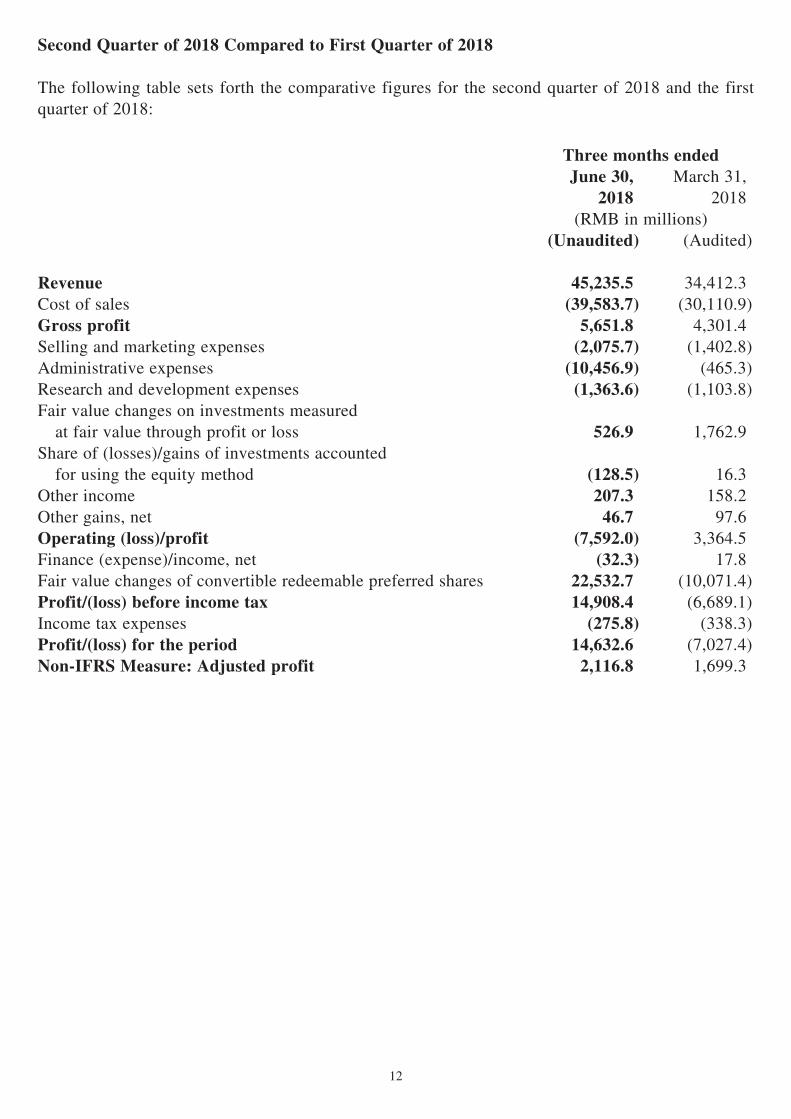
Second Quarter of 2018 Compared to First Quarter of 2018
The following table sets forth the comparative figures for the second quarter of 2018 and the first quarter of 2018:
Three months endedJune 30,
2018March 31,
2018(RMB in millions)
(Unaudited) (Audited)
Revenue 45,235.5 34,412.3Cost of sales (39,583.7) (30,110.9)Gross profit 5,651.8 4,301.4Selling and marketing expenses (2,075.7) (1,402.8)Administrative expenses (10,456.9) (465.3)Research and development expenses (1,363.6) (1,103.8)Fair value changes on investments measured at fair value through profit or loss 526.9 1,762.9Share of (losses)/gains of investments accounted for using the equity method (128.5) 16.3Other income 207.3 158.2Other gains, net 46.7 97.6Operating (loss)/profit (7,592.0) 3,364.5Finance (expense)/income, net (32.3) 17.8Fair value changes of convertible redeemable preferred shares 22,532.7 (10,071.4)Profit/(loss) before income tax 14,908.4 (6,689.1)Income tax expenses (275.8) (338.3)Profit/(loss) for the period 14,632.6 (7,027.4)Non-IFRS Measure: Adjusted profit 2,116.8 1,699.3

13
Revenue
Revenue increased by 31.5% to RMB45,235.5 million for the second quarter of 2018 on a quarter-on-quarter basis. The following table sets forth our revenue by line of business for the second quarter of 2018 and the first quarter of 2018:
Three months endedJune 30, 2018 March 31, 2018
Amount% of total
revenue Amount% of total
revenue(RMB in millions, unless specified)
(Unaudited) (Audited)
Smartphones 30,501.1 67.4% 23,239.5 67.5%IoT and lifestyle products 10,378.8 22.9% 7,696.6 22.4%Internet services 3,958.2 8.8% 3,231.3 9.4%Others 397.4 0.9% 244.9 0.7%
Total revenue 45,235.5 100.0% 34,412.3 100.0%
Smartphones
Revenue from our smartphones segment increased by 31.2% from RMB23.2 billion in the three months ended March 31, 2018 to RMB30.5 billion in the three months ended June 30, 2018, driven by growth in both sales volume and ASP of our smartphones. We sold approximately 32.0 million units of smartphones in the three months ended June 30, 2018, compared to approximately 28.4 million units in the three months ended March 31, 2018. The ASP of our smartphones was RMB952.3 per unit in the three months ended June 30, 2018, compared with RMB817.9 per unit in the three months ended March 31, 2018. The increase in ASP was primarily due to strong sales of our mid to high end models such as MIX 2S and Mi 8 in the China market. Enhanced marketing efforts in the second quarter, as well as major promotional events including the Mi Fans Festival in April and mid-year 6.18 sales in June, further boosted our brand awareness and sales performance.
IoT and lifestyle products
Our revenue from our IoT and lifestyle products segment increased by 34.8% from RMB7.7 billion in the three months ended March 31, 2018 to RMB10.4 billion in the three months ended June 30, 2018, primarily due to strong growth in existing products, particularly smart TVs and laptops. Revenue from sales of our key IoT products, including smart TVs and laptops, increased by 30.7% from RMB3,195.9 million in the three months ended March 31, 2018 to RMB4,178.0 million in the three months ended June 30, 2018.
14
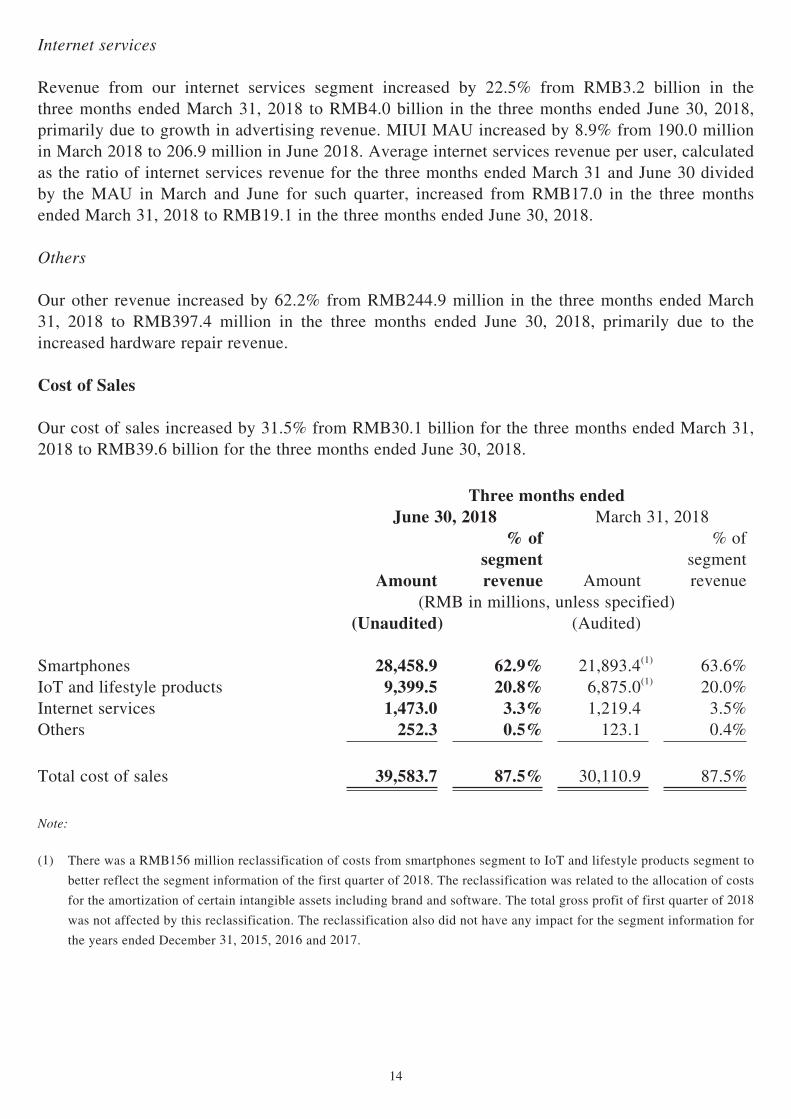
Internet services
Revenue from our internet services segment increased by 22.5% from RMB3.2 billion in the three months ended March 31, 2018 to RMB4.0 billion in the three months ended June 30, 2018, primarily due to growth in advertising revenue. MIUI MAU increased by 8.9% from 190.0 million in March 2018 to 206.9 million in June 2018. Average internet services revenue per user, calculated as the ratio of internet services revenue for the three months ended March 31 and June 30 divided by the MAU in March and June for such quarter, increased from RMB17.0 in the three months ended March 31, 2018 to RMB19.1 in the three months ended June 30, 2018.
Others
Our other revenue increased by 62.2% from RMB244.9 million in the three months ended March 31, 2018 to RMB397.4 million in the three months ended June 30, 2018, primarily due to the increased hardware repair revenue.
Cost of Sales
Our cost of sales increased by 31.5% from RMB30.1 billion for the three months ended March 31, 2018 to RMB39.6 billion for the three months ended June 30, 2018.
Three months endedJune 30, 2018 March 31, 2018
Amount
% of segment revenue Amount
% of segment revenue
(RMB in millions, unless specified)(Unaudited) (Audited)
Smartphones 28,458.9 62.9% 21,893.4(1) 63.6%IoT and lifestyle products 9,399.5 20.8% 6,875.0(1) 20.0%Internet services 1,473.0 3.3% 1,219.4 3.5%Others 252.3 0.5% 123.1 0.4%
Total cost of sales 39,583.7 87.5% 30,110.9 87.5%
Note:
(1) There was a RMB156 million reclassification of costs from smartphones segment to IoT and lifestyle products segment to
better reflect the segment information of the first quarter of 2018. The reclassification was related to the allocation of costs
for the amortization of certain intangible assets including brand and software. The total gross profit of first quarter of 2018
was not affected by this reclassification. The reclassification also did not have any impact for the segment information for
the years ended December 31, 2015, 2016 and 2017.
15
Smartphones
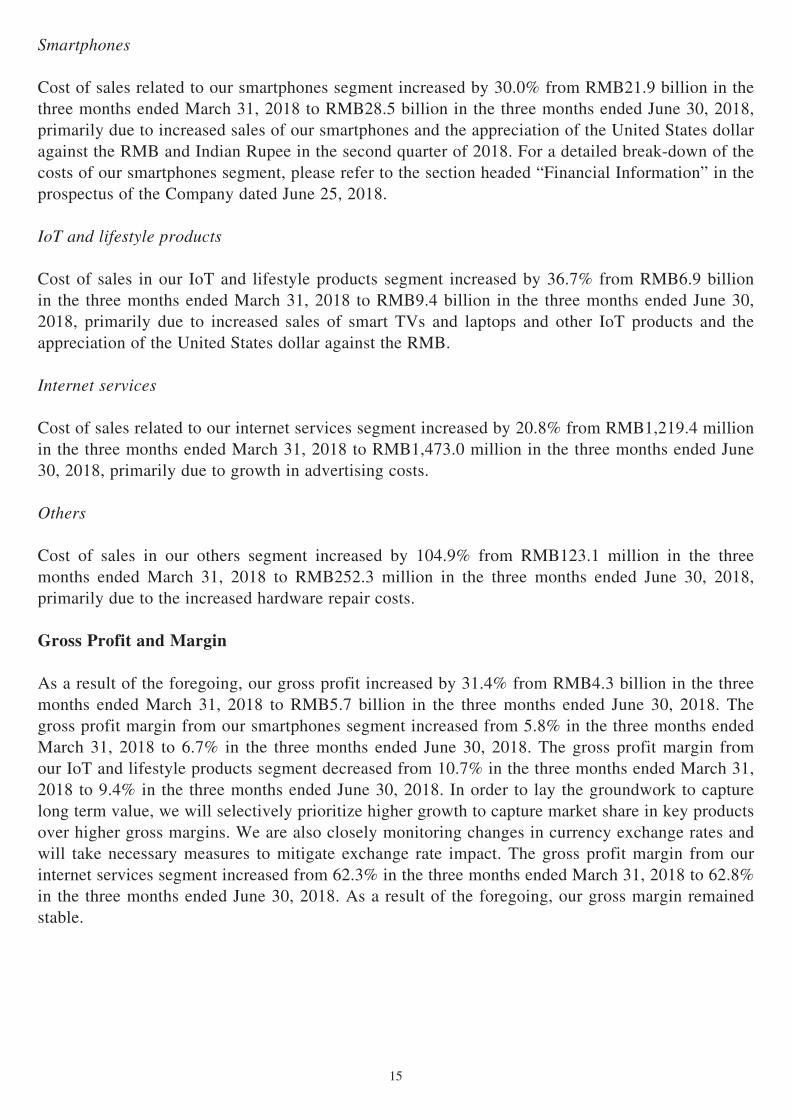
Cost of sales related to our smartphones segment increased by 30.0% from RMB21.9 billion in the three months ended March 31, 2018 to RMB28.5 billion in the three months ended June 30, 2018, primarily due to increased sales of our smartphones and the appreciation of the United States dollar against the RMB and Indian Rupee in the second quarter of 2018. For a detailed break-down of the costs of our smartphones segment, please refer to the section headed “Financial Information” in the prospectus of the Company dated June 25, 2018.
IoT and lifestyle products
Cost of sales in our IoT and lifestyle products segment increased by 36.7% from RMB6.9 billion in the three months ended March 31, 2018 to RMB9.4 billion in the three months ended June 30, 2018, primarily due to increased sales of smart TVs and laptops and other IoT products and the appreciation of the United States dollar against the RMB.
Internet services
Cost of sales related to our internet services segment increased by 20.8% from RMB1,219.4 million in the three months ended March 31, 2018 to RMB1,473.0 million in the three months ended June 30, 2018, primarily due to growth in advertising costs.
Others
Cost of sales in our others segment increased by 104.9% from RMB123.1 million in the three months ended March 31, 2018 to RMB252.3 million in the three months ended June 30, 2018, primarily due to the increased hardware repair costs.
Gross Profit and Margin
As a result of the foregoing, our gross profit increased by 31.4% from RMB4.3 billion in the three months ended March 31, 2018 to RMB5.7 billion in the three months ended June 30, 2018. The gross profit margin from our smartphones segment increased from 5.8% in the three months ended March 31, 2018 to 6.7% in the three months ended June 30, 2018. The gross profit margin from our IoT and lifestyle products segment decreased from 10.7% in the three months ended March 31, 2018 to 9.4% in the three months ended June 30, 2018. In order to lay the groundwork to capture long term value, we will selectively prioritize higher growth to capture market share in key products over higher gross margins. We are also closely monitoring changes in currency exchange rates and will take necessary measures to mitigate exchange rate impact. The gross profit margin from our internet services segment increased from 62.3% in the three months ended March 31, 2018 to 62.8% in the three months ended June 30, 2018. As a result of the foregoing, our gross margin remained stable.

16
Selling and Marketing Expenses
Our selling and marketing expenses increased by 48.0% from RMB1,402.8 million in the three months ended March 31, 2018 to RMB2,075.7 million in the three months ended June 30, 2018, primarily due to increases in promotional and advertising expenses. Promotional and advertising expenses increased by 133.0% from RMB337.6 million in the three months ended March 31, 2018 to RMB786.5 million in the three months ended June 30, 2018, primarily due to series of online advertisements (e.g. World Cup advertisements) and offline advertisements for newly launched products including Mi 8, MIX 2S and Mi 6X.
Administrative Expenses
Our administrative expenses increased by 2,147.2% from RMB465.3 million in the three months ended March 31, 2018 to RMB10,456.9 million in the three months ended June 30, 2018, primarily due to one-off share-based compensation of RMB9.9 billion in the second quarter of 2018. Our administrative expenses, excluding the one-off share-based compensation, increased from RMB465.3 million in the first quarter of 2018 to RMB527.1 million in the second quarter of 2018.
Research and Development Expenses
Our research and development expenses increased by 23.5% from RMB1,103.8 million in the three months ended March 31, 2018 to RMB1,363.6 million in the three months ended June 30, 2018, primarily due to the increase in total compensation relating to research and development personnel and the expansion of our research projects. Salaries and benefits relating to research and development personnel increased primarily due to increased headcount to accommodate the rapid growth of our business.
Fair Value Changes on Investments Measured at Fair Value Through Profit or Loss
Our fair value changes on investments measured at fair value through profit or loss decreased by 70.1% from RMB1.8 billion in the three months ended March 31, 2018 to RMB0.5 billion in the three months ended June 30, 2018, primarily due to the lesser changes in fair value gains of our equity and preferred share investments.
Share of (Losses)/Gains of Investments Accounted for Using the Equity Method
Our share of (losses)/gains of investments accounted for using the equity method changed from a gain of RMB16.3 million in the three months March 31, 2018 to a loss of RMB128.5 million in the three months ended June 30, 2018, primarily due to share of loss of IQIYI in the second quarter of 2018.
Other Income
Our other income increased by 31.0% from RMB158.2 million in the three months ended March 31, 2018 to RMB207.3 million in the three months ended June 30, 2018, primarily due to the increase

17
in dividend income following the declaration of dividends by Midea Group (Shenzhen Stock Exchange Stock Code: 000333) in the second quarter of 2018.
Finance (Expense)/Income, Net
We had net finance income of RMB17.8 million in the three months ended March 31, 2018 and a net finance expense of RMB32.3 million in the three months ended June 30, 2018, primarily due to an increase in interest expenses. Our interest expenses increased primarily due to increased interest expenses on bank borrowing.
Fair Value Changes of Convertible Redeemable Preferred Shares
Changes in the fair value of convertible redeemable preferred shares were recorded as “fair value changes of convertible redeemable preferred shares”. Fair value changes of convertible redeemable preferred shares increased from a loss of RMB10.1 billion in the three months ended March 31, 2018 to a gain of RMB22.5 billion in the three months ended June 30, 2018, primarily due to the revaluation of equity value of the Company based on the Offer Price in the Global Offering. After the completion of the Global Offering, all of our convertible redeemable preferred shares were converted to our Class B Shares. The fair value of each of convertible redeemable preferred shares is equivalent to the fair value of each of our ordinary shares on the conversion date, which is the Offer Price in the Global Offering.
Income Tax Expenses
Our income tax expenses remained relatively stable, at RMB338.3 million in the three months ended March 31, 2018 and RMB275.8 million in the three months ended June 30, 2018.
Profit/(Loss) for the Period
As a result of the foregoing, we had loss of RMB7.0 billion and profit of RMB14.6 billion in the three months ended March 31, 2018 and June 30, 2018, respectively.
Non-IFRS Measure: Adjusted Profit
To supplement our consolidated results which are prepared and presented in accordance with International Financial Reporting Standards (the “IFRS”), we also use adjusted profit as an additional financial measure, which is not required by, or presented in accordance with, IFRS. We believe that the presentation of non-IFRS measures when shown in conjunction with the corresponding IFRS measures provides useful information to investors and management regarding financial and business trends in relation to our financial condition and results of operations, by eliminating any potential impact of items that our management does not consider to be indicative of our operating performance such as certain non-cash items and the impact of certain investment transactions. We also believe that the non-IFRS measures are appropriate for evaluating the Group’s operating performance. The use of this non-IFRS measure has limitations as an analytical tool, and you should not consider it in isolation from, or as a substitute for analysis of, our results of operations or financial conditions as reported under IFRS. In addition, this non-IFRS financial measure may be defined differently from similar terms used by other companies.
18
The following tables set forth reconciliations of the Group’s non-IFRS measures for the second quarter of 2018 and 2017, the first quarter of 2018, and the first half of 2018 and 2017 to the nearest measures prepared in accordance with IFRS:
Three Months Ended June 30, 2018
Adjustments
As reported
Fair value
changes of
convertible
redeemable
preferred
shares
Share-based
compensation
Net fair
value gains on
investments(1)
Amortization
of intangible
assets
resulting from
acquisitions(2) Non-IFRS
(RMB in thousand, unless specified)
Profit for the
period 14,632,647 (22,532,721) 10,527,322 (510,945) 521 2,116,824
Net margin 32.3% 4.7%
Three Months Ended March 31, 2018
Adjustments
As reported
Fair value
changes of
convertible
redeemable
preferred
shares
Share-based
compensation
Net fair
value gains on
investments(1)
Amortization
of intangible
assets
resulting from
acquisitions(2) Non-IFRS
(RMB in thousand, unless specified)
(Loss)/profit for
the period (7,027,411) 10,071,376 488,237 (1,833,421) 520 1,699,301
Net margin (20.5)% 4.9%
Three Months Ended June 30, 2017
Adjustments
As reported
Fair value
changes of
convertible
redeemable
preferred
shares
Share-based
compensation
Net fair
value gains on
investments(1)
Amortization
of intangible
assets
resulting from
acquisitions(2) Non-IFRS
(RMB in thousand, unless specified)
(Loss)/profit for
the period (11,966,571) 15,004,165 182,209 (1,528,921) 611 1,691,493
Net margin (44.5)% 6.3%
19
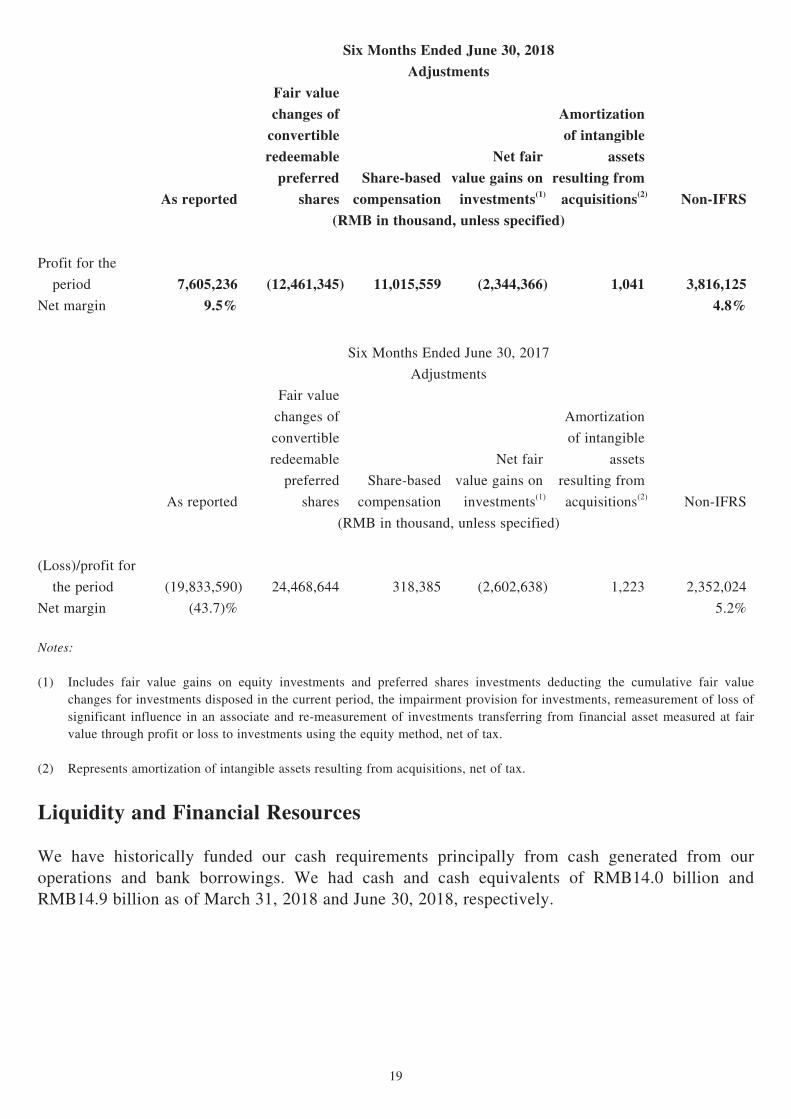
Six Months Ended June 30, 2018
Adjustments
As reported
Fair value
changes of
convertible
redeemable
preferred
shares
Share-based
compensation
Net fair
value gains on
investments(1)
Amortization
of intangible
assets
resulting from
acquisitions(2) Non-IFRS
(RMB in thousand, unless specified)
Profit for the
period 7,605,236 (12,461,345) 11,015,559 (2,344,366) 1,041 3,816,125
Net margin 9.5% 4.8%
Six Months Ended June 30, 2017
Adjustments
As reported
Fair value
changes of
convertible
redeemable
preferred
shares
Share-based
compensation
Net fair
value gains on
investments(1)
Amortization
of intangible
assets
resulting from
acquisitions(2) Non-IFRS
(RMB in thousand, unless specified)
(Loss)/profit for
the period (19,833,590) 24,468,644 318,385 (2,602,638) 1,223 2,352,024
Net margin (43.7)% 5.2%
Notes:
(1) Includes fair value gains on equity investments and preferred shares investments deducting the cumulative fair value changes for investments disposed in the current period, the impairment provision for investments, remeasurement of loss of significant influence in an associate and re-measurement of investments transferring from financial asset measured at fair value through profit or loss to investments using the equity method, net of tax.
(2) Represents amortization of intangible assets resulting from acquisitions, net of tax.
Liquidity and Financial Resources
We have historically funded our cash requirements principally from cash generated from our operations and bank borrowings. We had cash and cash equivalents of RMB14.0 billion and RMB14.9 billion as of March 31, 2018 and June 30, 2018, respectively.

20
Consolidated Statement of Cash Flow
Three monthsended
June 30, 2018
Three monthsended
March 31, 2018(in thousands of RMB)
(Unaudited) (Audited)
Net cash generated from/(used in) operating activities(1) 7,399,225 (1,277,682)Net cash (used in)/generated from investing activities (4,286,376) 460,647Net cash (used in)/generated from financing activities(1) (2,144,294) 3,337,476
Net increase in cash and cash equivalents 968,555 2,520,441
Cash and cash equivalents at beginning of period 14,027,013 11,563,282Effects of exchange rate changes on cash and cash equivalents (101,418) (56,710)
Cash and cash equivalents at end of period 14,894,150 14,027,013
Note:(1) Excluding the increase in loan and interest receivables mainly resulting from internet finance business, the net cash
generated from operating activities was RMB8.2 billion for the three months ended June 30, 2018 and the net cash used in operating activities was RMB1.2 billion for three months ended March 31, 2018; excluding the change of borrowings for internet finance business, the net cash used in financing activities was RMB0.7 billion for the three months ended June 30, 2018 and the net cash generated from financing activities was RMB2.5 billion for the three months ended March 31, 2018. The information in this footnote is based on the management accounts of the Group which has not been audited or reviewed by the Group’s auditor. The accounting policies applied in the preparation of the management accounts are consistent with those used for other figures in this announcement.
Net Cash Generated From/(Used In) Operating Activities
Net cash generated from/(used in) operating activities represents cash generated from/(used in) operations minus income tax paid. Cash generated from/(used in) operations primarily comprise our loss or profit for the period adjusted by non-cash items and changes in working capital.
For the three months ended June 30, 2018, net cash generated from operating activities amounted to RMB7.4 billion, representing cash generated from operations of RMB8.0 billion minus income tax paid of RMB0.6 billion. Cash generated from operations was primarily attributable to our profit before income tax of RMB14.9 billion, as adjusted by (i) the add-back of non-cash items, primarily comprising share-based compensation of RMB10.5 billion, offset by fair value changes of convertible redeemable preferred shares of RMB22.5 billion, and (ii) changes in working capital, which primarily comprised an increase in trade payables of RMB15.5 billion, an increase in prepayments and other receivables of RMB3.3 billion and an increase in inventories of RMB6.8 billion.

21
Net Cash (Used In)/Generated From Investing Activities
For the three months ended June 30, 2018, our net cash used in investing activities was RMB4.3 billion, which was primarily attributable to the net cash used in purchase of short-term investments measured at fair value through profit or loss of RMB35.5 billion, and the net cash generated from proceeds from maturity of short-term investments measured at fair value through profit or loss of RMB30.4 billion.
Net Cash (Used In)/Generated From Financing Activities
For the three months ended June 30, 2018, our net cash used in financing activities was RMB2.1 billion, which was primarily attributable to repayments of borrowings of RMB2.5 billion and placement of restricted cash of RMB3.3 billion, partially offset by proceeds from limited partners of RMB2.6 billion.
Borrowings
As of March 31, 2018 and June 30, 2018, we had total borrowings of RMB14.1 billion and RMB12.6 billion, respectively.
Convertible Redeemable Preferred Shares
As of March 31, 2018 and June 30, 2018, our convertible redeemable preferred shares had fair values of RMB165.3 billion and RMB150.6 billion, respectively.
Capital Expenditure
Three months endedJune 30, 2018 March 31, 2018
(in thousands of RMB)
Capital expenditures 308,642 706,042Placement of long-term investments(1) 310,400 600,242
Total 619,042 1,306,284
Note:
(1) Placement for long-term investments represents equity investments and preferred share investments.
Our capital expenditures primarily included expenditures on property and equipment resulting from the construction of and improvements made to our office complex, as well as intangible assets.
Off-Balance Sheet Commitments and Arrangements
As of June 30, 2018, except for financial guarantee contracts, we had not entered into any off-balance sheet arrangements.
22
Future Plans for Material Investments and Capital Assets
As of June 30, 2018, we did not have other plans for material investments and capital assets.
Material Acquisitions and Disposals of Subsidiaries and Affiliated Companies
During the six months ended June 30, 2018, we did not have any material acquisitions or disposals of subsidiaries and affiliated companies.
Employee and Remuneration Policy
As of June 30, 2018, we had 15,222 full-time employees, 14,495 of whom were based in mainland China, primarily at our headquarters in Beijing, with the rest primarily based in India, Taiwan, Hong Kong and Indonesia. We expect to continue to increase our headcount in mainland China and our key target markets in the rest of the world. As of June 30, 2018, our research and development personnel, totaling 6,537 employees, were staffed across our various departments.
Our success depends on our ability to attract, retain and motivate qualified personnel. As part of our human resources strategy, we offer employees competitive compensation packages. As of June 30, 2018, over 6,415 employees held share-based awards. The total remuneration expenses, including share-based compensation expense, for the three months ended June 30, 2018 were RMB11,642.9 million, representing an increase of 666.3% as compared to the previous quarter ended March 31, 2018, primarily due to one-off share-based compensation of RMB9.9 billion in the second quarter of 2018.
Foreign Exchange Risk
The transactions of our Company are denominated and settled in our functional currency, the United States dollar. Our Group’s subsidiaries primarily operate in the People’s Republic of China and other regions such as India, and are exposed to foreign exchange risk arising from various currencies exposures, primarily with respect to the United States dollar. Therefore, foreign exchange risk primarily arose from recognized assets and liabilities in our subsidiaries when receiving or to receive foreign currencies from, or paying or to pay foreign currencies to overseas business partners.
We did not hedge against any fluctuation in foreign currency in the three months ended June 30, 2018, nor did we do so in the three months ended March 31, 2018.
Pledge of Assets
As at June 30, 2018, we pledged a restricted deposit of RMB4,587.1 million (as of March 31, 2018: RMB1,678.2 million).
Contingent Liabilities
As at June 30, 2018, we did not have any material contingent liabilities (as of March 31, 2018: nil).

23
UNAUDITED INTERIM CONDENSED CONSOLIDATED FINANCIAL INFORMATION
Unaudited Interim Condensed Consolidated Income StatementsFor the three months and six months ended June 30, 2018(Expressed in Renminbi (“RMB”))
Unaudited UnauditedThree months ended
June 30,Six months ended
June 30,Note 2018 2017 2018 2017
RMB’000 RMB’000 RMB’000 RMB’000
Revenue 3 45,235,473 26,879,009 79,647,835 45,410,802Cost of sales 4 (39,583,661) (23,031,378) (69,694,596) (39,099,053)
Gross profit 5,651,812 3,847,631 9,953,239 6,311,749Selling and marketing expenses 4 (2,075,709) (1,143,514) (3,478,538) (1,870,371)Administrative expenses 4 (10,456,916) (228,839) (10,922,239) (469,048)Research and development expenses 4 (1,363,619) (707,311) (2,467,394) (1,312,000)Fair value changes on investments measured at fair value through profit or loss 8 526,910 1,738,300 2,289,778 2,918,000Share of losses of investments accounted for using the equity method 5 (128,512) (84,610) (112,183) (151,014)Other income 207,315 172,901 365,541 197,057Other gains/(losses), net 46,757 64,741 144,324 (10,578)
Operating (loss)/profit (7,591,962) 3,659,299 (4,227,472) 5,613,795Finance (expense)/income, net (32,330) 4,480 (14,496) (7,641)Fair value changes of convertible redeemable preferred shares 12 22,532,721 (15,004,165) 12,461,345 (24,468,644)
Profit/(loss) before income tax 14,908,429 (11,340,386) 8,219,377 (18,862,490)Income tax expenses 6 (275,782) (626,185) (614,141) (971,100)
Profit/(loss) for the period 14,632,647 (11,966,571) 7,605,236 (19,833,590)Profit/(loss) attributable to: — Owners of the Company 14,651,318 (11,960,551) 7,646,195 (19,806,442) — Non-controlling interests (18,671) (6,020) (40,959) (27,148)
14,632,647 (11,966,571) 7,605,236 (19,833,590)
Earnings/(loss) per share (expressed in RMB per share) 7Basic 1.409 (1.226) 0.759 (2.030)
Diluted (0.377) (1.226) (0.234) (2.030)

24
Unaudited Interim Condensed Consolidated Statements of Comprehensive IncomeFor the three months and six months ended June 30, 2018(Expressed in RMB)
Unaudited UnauditedThree months ended
June 30,Six months ended
June 30,Note 2018 2017 2018 2017
RMB’000 RMB’000 RMB’000 RMB’000
Profit/(loss) for the period 14,632,647 (11,966,571) 7,605,236 (19,833,590)
Other comprehensive (loss)/income:Items that may be reclassified to profit or lossShare of other comprehensive income/(loss) of investments accounted for using the equity method 5 125,515 (7,550) 111,153 (6,897)Currency translation differences (212,762) (26,811) (399,244) (22,666)Item that will not be reclassified subsequently to profit or lossCurrency translation differences (7,392,513) 2,296,789 (1,480,779) 2,876,660
Other comprehensive (loss)/income for the period, net of tax (7,479,760) 2,262,428 (1,768,870) 2,847,097
Total comprehensive income/(loss) for the period 7,152,887 (9,704,143) 5,836,366 (16,986,493)
Attributable to:— Owners of the Company 7,163,993 (9,694,520) 5,875,458 (16,955,302)— Non-controlling interests (11,106) (9,623) (39,092) (31,191)
7,152,887 (9,704,143) 5,836,366 (16,986,493)

25
Unaudited Interim Condensed Consolidated Balance SheetsAs of June 30, 2018(Expressed in RMB)
Unaudited Audited
Note
As of June 30,
2018
As of December 31,
2017RMB’000 RMB’000
AssetsNon-current assets Land use rights 3,377,517 3,416,359 Property and equipment 2,394,155 1,730,872 Intangible assets 2,176,439 2,274,352 Investments accounted for using the equity method 5 7,495,225 1,710,819 Long-term investments measured at fair value through profit or loss 8 16,229,340 18,856,961 Deferred income tax assets 946,928 591,576 Other non-current assets 132,189 150,361
32,751,793 28,731,300
Current assets Inventories 10 21,740,309 16,342,928 Trade receivables 9 7,112,042 5,469,507 Loan receivables 8,795,925 8,144,493 Prepayments and other receivables 15,289,506 11,393,910 Short-term investments measured at amortized cost 8 — 800,000 Short-term investments measured at fair value through profit or loss 8 7,900,902 4,488,076 Short-term bank deposits 1,198 225,146 Restricted cash 4,587,069 2,711,119 Cash and cash equivalents 14,894,150 11,563,282
80,321,101 61,138,461
Total assets 113,072,894 89,869,761

26
Unaudited Audited
Note
As of June 30,
2018
As of December 31,
2017RMB’000 RMB’000
Equity and liabilitiesEquity attributable to owners of the Company Share capital 161 150 Reserves (110,431,652) (127,272,511)
(110,431,491) (127,272,361)
Non-controlling interests 93,940 61,670
Total equity (110,337,551) (127,210,691)
LiabilitiesNon-current liabilities Borrowings 11 4,601,862 7,251,312 Deferred income tax liabilities 1,043,484 1,018,651 Warranty provision 239,272 191,404 Convertible redeemable preferred shares 12 150,563,894 161,451,203 Other non-current liabilities 13 2,665,697 35,211
159,114,209 169,947,781
Current liabilities Trade payables 14 44,966,287 34,003,331 Other payables and accruals 4,624,944 4,223,979 Advance from customers 3,771,828 3,390,650 Borrowings 11 7,950,151 3,550,801 Income tax liabilities 481,345 421,113 Warranty provision 2,501,681 1,542,797
64,296,236 47,132,671
Total liabilities 223,410,445 217,080,452
Total equity and liabilities 113,072,894 89,869,761

27
Unaudited Interim Condensed Consolidated Statements of Cash FlowsFor the six months ended June 30, 2018(Expressed in RMB)
UnauditedSix months ended June 30,
2018 2017RMB’000 RMB’000
Net cash generated from operating activities 6,121,543 1,938,638Net cash used in investing activities (3,825,729) (1,817,334)Net cash generated from financing activities 1,193,182 2,967,113Net increase in cash and cash equivalents 3,488,996 3,088,417
Cash and cash equivalents at the beginning of the period 11,563,282 9,230,320Effects of exchange rate changes on cash and cash equivalents (158,128) (238,164)
Cash and cash equivalents at end of the period 14,894,150 12,080,573

28
Notes:
1 General information
Xiaomi Corporation (formerly known as Top Elite Limited) (the “Company”), was incorporated in the Cayman Islands on January 5, 2010 as an exempted company with limited liability under the Companies Law, Cap. 22 (Law 3 of 1961, as consolidated and revised) of the Cayman Islands. The address of the Company’s registered office is at the offices of Maples Corporate Services Limited, PO Box 309, Ugland House, Grand Cayman, KY1-1104, Cayman Islands.
The Company is an investment holding company. The Company and its subsidiaries, including controlled structured entities (together, the “Group”) are principally engaged in development and sales of smartphones, internet of things (“IoT”) and lifestyle products, provision of internet services and investments holding in the People’s Republic of China and other countries or regions.
Lei Jun is the ultimate controlling shareholder of the Company as of the date of this financial information.
The interim condensed consolidated financial information comprises the interim condensed consolidated balance sheet as of June 30, 2018, the interim condensed consolidated income statements and the interim condensed consolidated statements of comprehensive income for the three months and six months periods then ended, the interim condensed consolidated statement of changes in equity and the interim condensed consolidated statement of cash flows for the six months period then ended, and a summary of significant accounting policies and other explanatory notes (the “Interim Financial Information”). The Interim Financial Information is presented in Renminbi (“RMB”), unless otherwise stated.
2 Basis of preparation
The Interim Financial Information has been prepared in accordance with International Accounting Standard (“IAS”) 34, “Interim Financial Reporting”, issued by the International Accounting Standards Board (“IASB”).
The Interim Financial Information does not include all the notes of the type normally included in an annual financial statements. Accordingly, it should be read in conjunction with the financial information for the year ended December 31, 2017 as set out in the accountant’s report (the “Accountant’s Report”) included in Appendix I to the prospectus of the Group in connection with the initial public offering of the Company’s shares on the Main Board of The Stock Exchange of Hong Kong Limited (the “Stock Exchange”) dated June 25, 2018.
As of June 30, 2018, the Group had net liabilities of RMB110,337,551,000 and accumulated losses of RMB121,316,496,000, respectively, primarily due to the significant fair value changes of convertible redeemable preferred shares (“Preferred Shares”). All Preferred Shares were converted into class B ordinary shares upon completion of its initial public offering on the Main Board of the Stock Exchange on July 9, 2018. The Preferred Shares will not have cash flow impact to the Group in the next twelve months from the date of the report.
As of June 30, 2018, the Group had net current asset of RMB16,024,865,000. In addition, the Group has performed a working capital forecast for the next twelve months. Accordingly, the directors believe that the Group will have sufficient cash resources to satisfy its future working capital in the next twelve months from the date of the report and they consider that it is appropriate that the Interim Financial Information is prepared on a going concern basis.
The accounting policies and method of computation used in the preparation of the Interim Financial Information are consistent with those used in the financial information for the years ended December 31, 2015, 2016 and 2017, and the 3 months ended March 31, 2018, as set out in the Accountant’s Report.
Amendments to International Financial Reporting Standards (“IFRS”) effective for the financial year ending December 31, 2018 do not have a material impact on the Group’s Interim Financial Information.

29
3 Segment information
The Group’s business activities, for which discrete financial statements are available, are regularly reviewed and evaluated by the Chief Operating Decision Maker (“CODM”). The CODM, who is responsible for allocating resources and assessing performance of the operating segments, has been identified as the Chief Executive Officer that makes strategic decisions. As a result of this evaluation, the Group determined that it has operating segments as follows:
• Smartphones
• IoT and lifestyle products
• Internet services
• Others
There were no material inter-segment sales during the three months and six months ended June 30, 2017 and 2018. The revenues from external customers reported to the CODM are measured in a manner consistent with that applied in the interim condensed consolidated income statements.
The segment results for the three months and six months ended June 30, 2017 and 2018 are as follows:
Three months ended June 30, 2018
Smartphones
IoT and lifestyle
productsInternet services Others Total
RMB’000 RMB’000 RMB’000 RMB’000 RMB’000
(Unaudited)Segment revenues 30,501,122 10,378,798 3,958,220 397,333 45,235,473Cost of sales (28,458,873) (9,399,472) (1,472,999) (252,317) (39,583,661)Gross profit 2,042,249 979,326 2,485,221 145,016 5,651,812
Three months ended June 30, 2017
Smartphones
IoT and lifestyle products
Internet services Others Total
RMB’000 RMB’000 RMB’000 RMB’000 RMB’000
(Unaudited)Segment revenues 19,218,738 5,080,875 2,419,590 159,806 26,879,009Cost of sales (17,541,275) (4,485,283) (909,033) (95,787) (23,031,378)Gross profit 1,677,463 595,592 1,510,557 64,019 3,847,631

30
Six months ended June 30, 2018
Smartphones
IoT and lifestyle
productsInternet services Others Total
RMB’000 RMB’000 RMB’000 RMB’000 RMB’000
(Unaudited)Segment revenues 53,740,612 18,075,364 7,189,570 642,289 79,647,835Cost of sales (50,352,247) (16,274,494) (2,692,412) (375,443) (69,694,596)Gross profit 3,388,365 1,800,870 4,497,158 266,846 9,953,239
Six months ended June 30, 2017
Smartphones
IoT and lifestyle products
Internet services Others Total
RMB’000 RMB’000 RMB’000 RMB’000 RMB’000
(Unaudited)Segment revenues 31,412,590 9,241,540 4,449,227 307,445 45,410,802Cost of sales (29,016,741) (8,176,034) (1,713,745) (192,533) (39,099,053)Gross profit 2,395,849 1,065,506 2,735,482 114,912 6,311,749
The Company is domiciled in the Cayman Islands while the Group mainly operates its businesses in mainland China. For the three months and six months ended June 30, 2017 and 2018, the geographical information on the total revenues is as follows:
Three months ended June 30, Six months ended June 30,2018 2017 2018 2017
RMB’000 % RMB’000 % RMB’000 % RMB’000 %(Unaudited) (Unaudited) (Unaudited) (Unaudited)
Mainland China 28,823,107 63.7 20,357,219 75.7 50,765,210 63.7 34,586,069 76.2Rest of the world 16,412,366 36.3 6,521,790 24.3 28,882,625 36.3 10,824,733 23.8
45,235,473 26,879,009 79,647,835 45,410,802
The major customers which contributed more than 10% of the total revenue of the Group for the three months and six months ended June 30, 2017 and 2018 are listed as below:
Three months ended June 30, Six months ended June 30,2018 2017 2018 2017
% % % %(Unaudited) (Unaudited) (Unaudited) (Unaudited)
Customer A 13.4 16.7 12.4 15.3
All the revenues derived from other single external customer were less than 10% of the Group’s total revenues during the three months and six months ended June 30, 2018.

31
4 Expenses by nature
Three months ended June 30, Six months ended June 30,2018 2017 2018 2017
RMB’000 RMB’000 RMB’000 RMB’000(Unaudited) (Unaudited) (Unaudited) (Unaudited)
Cost of inventories sold 35,821,152 20,680,207 62,984,283 35,042,832Provision for impairment of inventories 192,703 96,964 514,468 164,239Royalty fees 1,175,237 800,564 1,956,131 1,334,448Employee benefit expenses (Note (a)) 11,642,896 878,984 13,162,180 1,608,118Depreciation of property and equipment 52,622 47,909 95,962 91,559Amortization of intangible assets 107,609 33,609 247,727 63,679Promotion and advertising expenses 786,498 414,440 1,124,097 577,847Content fees to game developers and video providers 480,941 307,150 901,865 613,487Provision for loan receivables 163,961 90,849 232,754 105,716Consultancy and professional service fees 171,839 104,386 284,980 167,742Cloud service, bandwidth and server custody fees 398,199 221,448 733,197 426,038Office rental expenses 126,935 68,749 232,475 130,215Warranty expenses 822,647 525,579 1,408,892 786,460
Note:
(a) For the six months ended June 30, 2018, the employee benefit expenses comprise one-off share-based compensation amounting to approximately RMB9,929,765,000.
5 Investments accounted for using the equity method
As of June 30,
As of December 31,
2018 2017RMB’000 RMB’000
(Unaudited) (Audited)
Investments in associate accounted for using the equity method — Listed entities 5,949,894 386,490 — Unlisted entities 1,545,331 1,324,329
7,495,225 1,710,819
Six months ended June 30,2018 2017
RMB’000 RMB’000(Unaudited) (Unaudited)
At the beginning of the period 1,710,819 1,852,563Additions (Note (a)) 5,768,697 10,659Disposals (100) (42,298)Share of losses (112,183) (151,014)Share of other comprehensive income/(loss) 111,153 (6,897)Share of changes of other reserves 16,839 17,939Dividends — (33,155)
At the end of the period 7,495,225 1,647,797

32
Note:
(a) On March 29, 2018, iQIYI, Inc. (“iQIYI”), an investment engaging in the provision of internet video streaming services in mainland China, for which the Group accounted as long-term investments measured at fair value through profit or loss, has undergone initial public offering by listing certain of its new ordinary shares on the Nasdaq Stock Exchange, and a fair value change gain amounting to approximately RMB1,591,989,000 was recognized by the Group. The conversion of the preference shares in iQIYI owned by the Group into ordinary shares was completed on April 2, 2018, following which the Group reclassifies the investment in associate measured at fair value through profit or loss to an investment accounted for using the equity method.
6 Income tax expenses
The income tax expenses of the Group during all the periods presented are analyzed as follows:
Three months ended June 30, Six months ended June 30,2018 2017 2018 2017
RMB’000 RMB’000 RMB’000 RMB’000(Unaudited) (Unaudited) (Unaudited) (Unaudited)
Current income tax 553,562 454,544 948,210 678,157Deferred income tax (277,780) 171,641 (334,069) 292,943
Income tax expenses 275,782 626,185 614,141 971,100
Income tax expense is recognized based on management’s best knowledge of the income tax rates that would be applicable to the full financial year.
7 Earnings/(loss) per share
On June 17, 2018, pursuant to the shareholders’ resolution, each existing issued and unissued share of US$0.000025 each in the share capital of the Company were subdivided into 10 shares of US$0.0000025 each (“Share Subdivision”). Following the Share Subdivision, the weighted average number of ordinary shares for the purpose of basic and diluted earnings per share for the three months and six months ended June 30, 2017 and 2018 has been retrospectively adjusted.
(a) Basic
Basic earnings or loss per share for the three months and six months ended June 30, 2017 and 2018 are calculated by dividing the profit or loss attributable to the Company’s owners by the weighted average number of ordinary shares in issue during the periods.
Three months ended June 30, Six months ended June 30,2018 2017 2018 2017
RMB’000 RMB’000 RMB’000 RMB’000(Unaudited) (Unaudited) (Unaudited) (Unaudited)
Net profit/(loss) attributable to the owners of the Company 14,651,318 (11,960,551) 7,646,195 (19,806,442)Weighted average number of ordinary shares in issue (Note) (thousand shares) 10,398,712 9,758,173 10,080,295 9,758,173
Basic earnings/(loss) per share (Note) (expressed in RMB per share) 1.409 (1.226) 0.759 (2.030)
Note: Weighted average number of ordinary shares in issue and basic earnings/(loss) per share were calculated taken into account the effect of the Share Subdivision.
33
As of June 30, 2018, 24,000,000 ordinary shares were issued to several employees. However, the shareholders’ rights of these shares were restricted and would be vested over certain service periods. Accordingly, these shares were accounted for as restricted stock units (RSUs). The Group did not include these ordinary shares in the calculation of basic earnings/(loss) per share for the three months and six months ended June 30, 2018 as these shares are not considered outstanding for earnings/(loss) per share calculation purposes.
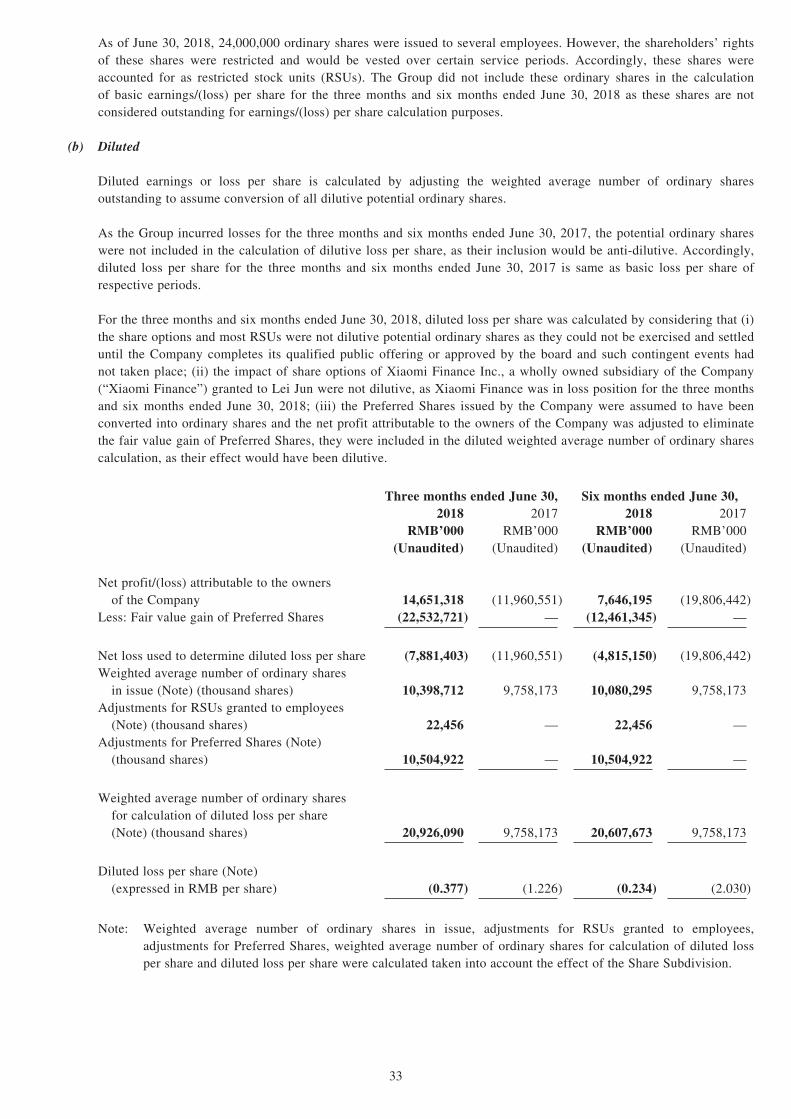
(b) Diluted
Diluted earnings or loss per share is calculated by adjusting the weighted average number of ordinary shares outstanding to assume conversion of all dilutive potential ordinary shares.
As the Group incurred losses for the three months and six months ended June 30, 2017, the potential ordinary shares were not included in the calculation of dilutive loss per share, as their inclusion would be anti-dilutive. Accordingly, diluted loss per share for the three months and six months ended June 30, 2017 is same as basic loss per share of respective periods.
For the three months and six months ended June 30, 2018, diluted loss per share was calculated by considering that (i) the share options and most RSUs were not dilutive potential ordinary shares as they could not be exercised and settled until the Company completes its qualified public offering or approved by the board and such contingent events had not taken place; (ii) the impact of share options of Xiaomi Finance Inc., a wholly owned subsidiary of the Company (“Xiaomi Finance”) granted to Lei Jun were not dilutive, as Xiaomi Finance was in loss position for the three months and six months ended June 30, 2018; (iii) the Preferred Shares issued by the Company were assumed to have been converted into ordinary shares and the net profit attributable to the owners of the Company was adjusted to eliminate the fair value gain of Preferred Shares, they were included in the diluted weighted average number of ordinary shares calculation, as their effect would have been dilutive.
Three months ended June 30, Six months ended June 30,2018 2017 2018 2017
RMB’000 RMB’000 RMB’000 RMB’000(Unaudited) (Unaudited) (Unaudited) (Unaudited)
Net profit/(loss) attributable to the owners of the Company 14,651,318 (11,960,551) 7,646,195 (19,806,442)Less: Fair value gain of Preferred Shares (22,532,721) — (12,461,345) —
Net loss used to determine diluted loss per share (7,881,403) (11,960,551) (4,815,150) (19,806,442)Weighted average number of ordinary shares in issue (Note) (thousand shares) 10,398,712 9,758,173 10,080,295 9,758,173Adjustments for RSUs granted to employees (Note) (thousand shares) 22,456 — 22,456 —Adjustments for Preferred Shares (Note) (thousand shares) 10,504,922 — 10,504,922 —
Weighted average number of ordinary shares for calculation of diluted loss per share (Note) (thousand shares) 20,926,090 9,758,173 20,607,673 9,758,173
Diluted loss per share (Note) (expressed in RMB per share) (0.377) (1.226) (0.234) (2.030)
Note: Weighted average number of ordinary shares in issue, adjustments for RSUs granted to employees, adjustments for Preferred Shares, weighted average number of ordinary shares for calculation of diluted loss per share and diluted loss per share were calculated taken into account the effect of the Share Subdivision.
34
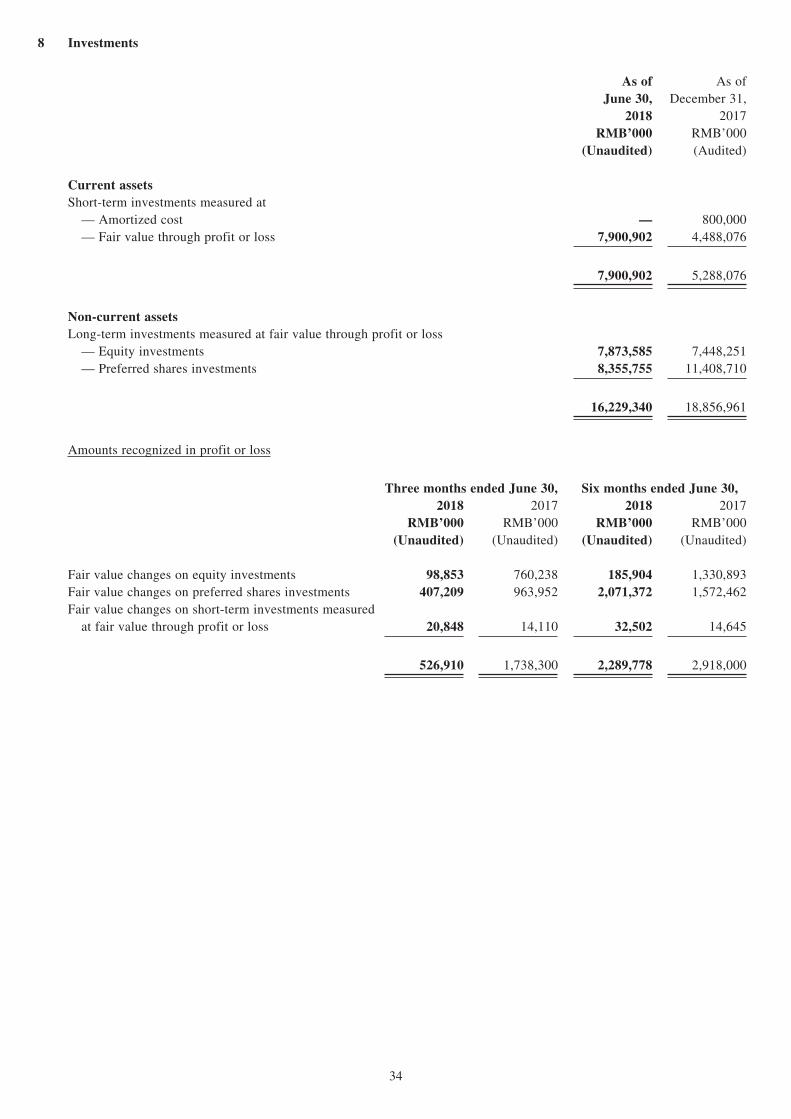
8 Investments
As of June 30,
As of December 31,
2018 2017RMB’000 RMB’000
(Unaudited) (Audited)
Current assetsShort-term investments measured at — Amortized cost — 800,000 — Fair value through profit or loss 7,900,902 4,488,076
7,900,902 5,288,076
Non-current assetsLong-term investments measured at fair value through profit or loss — Equity investments 7,873,585 7,448,251 — Preferred shares investments 8,355,755 11,408,710
16,229,340 18,856,961
Amounts recognized in profit or loss
Three months ended June 30, Six months ended June 30,2018 2017 2018 2017
RMB’000 RMB’000 RMB’000 RMB’000(Unaudited) (Unaudited) (Unaudited) (Unaudited)
Fair value changes on equity investments 98,853 760,238 185,904 1,330,893Fair value changes on preferred shares investments 407,209 963,952 2,071,372 1,572,462Fair value changes on short-term investments measured at fair value through profit or loss 20,848 14,110 32,502 14,645
526,910 1,738,300 2,289,778 2,918,000

35
9 Trade receivables
The Group allows a credit period within 180 days to its customers. Aging analysis of trade receivables based on invoice date is as follows:
As of June 30,
As of December 31,
2018 2017RMB’000 RMB’000
(Unaudited) (Audited)
Trade receivablesUp to 3 months 6,684,758 5,099,5903 to 6 months 393,532 302,3546 months to 1 year 35,616 39,0281 to 2 years 20,009 53,613Over 2 years 39,969 31,742
7,173,884 5,526,327Less: allowance for impairment (61,842) (56,820)
7,112,042 5,469,507
Majority of the Group’s trade receivables were denominated in RMB and Indian Rupee.
Trade receivables balances as of December 31, 2017 and June 30, 2018 mainly represented amounts due from certain channel distributors and customers in mainland China and India who usually settle the amounts due by them within 180 days.
The Group applies the simplified approach to providing for expected credit losses prescribed by IFRS 9, which permits the use of the lifetime expected loss provision for all trade receivables. To measure the expected credit losses, trade receivables have been grouped based on shared credit risk characteristics and the days past due. The expected credit losses also incorporate forward looking information. As of June 30, 2018, insignificant amount of impairment provision was recognized based on the expected credit losses model.
10 Inventories
As of June 30,
As of December 31,
2018 2017RMB’000 RMB’000
(Unaudited) (Audited)
Raw materials 9,313,293 5,117,285Finished goods 8,139,036 8,461,798Work in progress 3,117,666 1,352,886Spare parts 1,036,899 1,569,040Others 500,316 510,061
22,107,210 17,011,070Less: provision for impairment (366,901) (668,142)
21,740,309 16,342,928
36
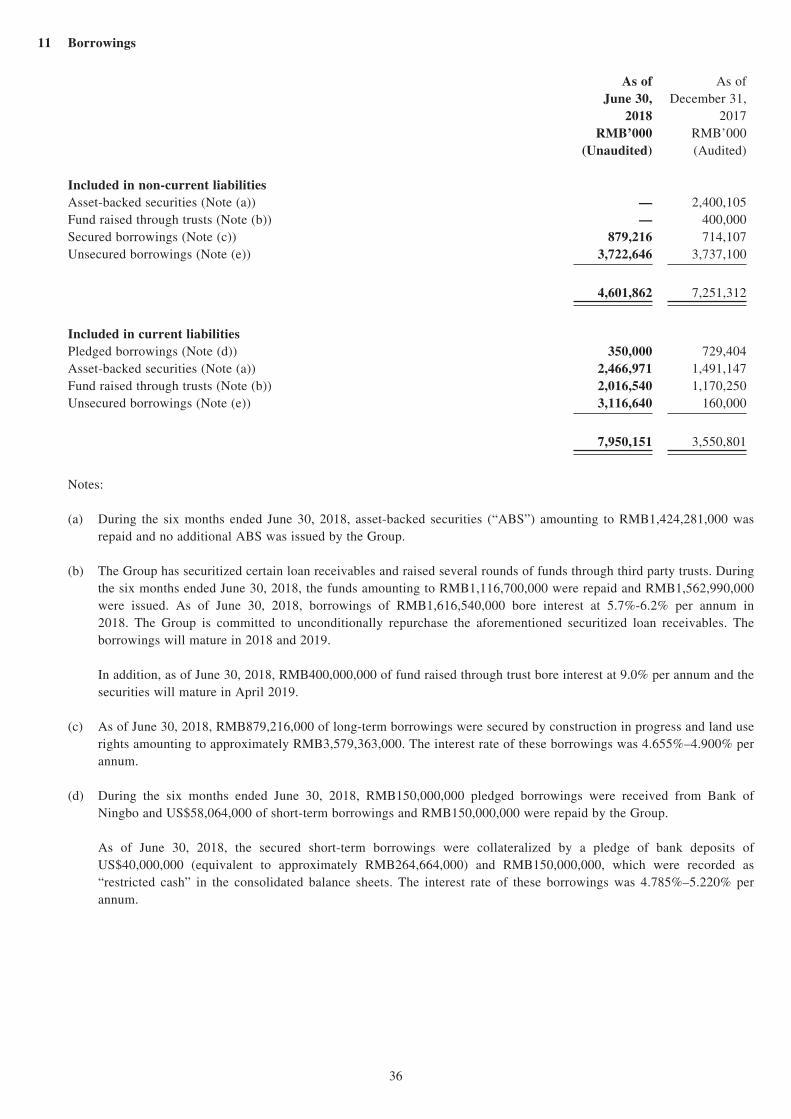
11 Borrowings
As of June 30,
As of December 31,
2018 2017RMB’000 RMB’000
(Unaudited) (Audited)
Included in non-current liabilitiesAsset-backed securities (Note (a)) — 2,400,105Fund raised through trusts (Note (b)) — 400,000Secured borrowings (Note (c)) 879,216 714,107Unsecured borrowings (Note (e)) 3,722,646 3,737,100
4,601,862 7,251,312
Included in current liabilitiesPledged borrowings (Note (d)) 350,000 729,404Asset-backed securities (Note (a)) 2,466,971 1,491,147Fund raised through trusts (Note (b)) 2,016,540 1,170,250Unsecured borrowings (Note (e)) 3,116,640 160,000
7,950,151 3,550,801
Notes:
(a) During the six months ended June 30, 2018, asset-backed securities (“ABS”) amounting to RMB1,424,281,000 was repaid and no additional ABS was issued by the Group.
(b) The Group has securitized certain loan receivables and raised several rounds of funds through third party trusts. During the six months ended June 30, 2018, the funds amounting to RMB1,116,700,000 were repaid and RMB1,562,990,000 were issued. As of June 30, 2018, borrowings of RMB1,616,540,000 bore interest at 5.7%-6.2% per annum in 2018. The Group is committed to unconditionally repurchase the aforementioned securitized loan receivables. The borrowings will mature in 2018 and 2019.
In addition, as of June 30, 2018, RMB400,000,000 of fund raised through trust bore interest at 9.0% per annum and the securities will mature in April 2019.
(c) As of June 30, 2018, RMB879,216,000 of long-term borrowings were secured by construction in progress and land use rights amounting to approximately RMB3,579,363,000. The interest rate of these borrowings was 4.655%–4.900% per annum.
(d) During the six months ended June 30, 2018, RMB150,000,000 pledged borrowings were received from Bank of Ningbo and US$58,064,000 of short-term borrowings and RMB150,000,000 were repaid by the Group.
As of June 30, 2018, the secured short-term borrowings were collateralized by a pledge of bank deposits of US$40,000,000 (equivalent to approximately RMB264,664,000) and RMB150,000,000, which were recorded as “restricted cash” in the consolidated balance sheets. The interest rate of these borrowings was 4.785%–5.220% per annum.

37
(e) The Group entered into a three-year bank loan facility agreement on July 26, 2017. The available commitment is US$1,000,000,000 (equivalent to approximately RMB6,534,200,000) including US$500,000,000 (equivalent to approximately RMB3,267,100,000) term loan and US$500,000,000 (equivalent to approximately RMB3,267,100,000) revolving loan. As of December 31, 2017, the total loan amount was US$500,000,000 (equivalent to approximately RMB3,267,100,000) and should be repaid by the Group on July 25, 2020. On March 28, 2018, the Group drew down US$400,000,000 (equivalent to approximately RMB2,646,640,000) revolving loan at LIBOR plus 2.15% per annum and repaid on July 27, 2018.
As of December 31, 2017, the Group had RMB490,000,000 borrowings from Bank of Beijing with interest rate 4.750% per annum. During the six months ended June 30, 2018, the Group repaid RMB10,000,000 to Bank of Beijing. As of June 30, 2018, RMB20,000,000 of these outstanding borrowings should be repaid by the Group within the next twelve months and RMB460,000,000 should be repaid by the Group in March 2022.
As of December 31, 2017, the Group has RMB140,000,000 borrowings from China Resources Bank of Zhuhai Co., Ltd. with interest rate 5.8725% per annum. On April 13, 2018, the Group drew down RMB310,000,000 from China Resources Bank of Zhuhai Co., Ltd. with an interest rate of 6.960% per annum. As of June 30, 2018, RMB450,000,000 outstanding borrowings should be repaid by the Group in 2018 and 2019.
For the six months ended June 30, 2018, the interest rate of the interest-bearing liabilities ranges from 3.53% to 9.00% per annum.
12 Convertible redeemable preferred shares
Since the date of incorporation, the Company has completed several rounds of financing by issuing Preferred Shares. The movement of the Preferred Shares is set out as below:
RMB’000
(Unaudited)At January 1, 2018 161,451,203Changes in fair value (12,461,345)Currency translation differences 1,574,036
At June 30, 2018 150,563,894
At January 1, 2017 115,802,177Changes in fair value 24,468,644Currency translation differences (3,060,461)
At June 30, 2017 137,210,360
The Group has used the discounted cash flow method to determine the underlying share value of the Company and adopted equity allocation model to determine the fair value of the Preferred Shares as of the dates of issuance and as of June 30, 2017. Key valuation assumptions used to determine the fair value of Preferred Shares as of June 30, 2017 include discount rate (post-tax) of 17.00%, risk-free interest rate ranging from 2.03% to 2.19%, DLOM of 10.00% and volatility ranging from 33.40% to 36.71%.
On July 9, 2018, the Company has successfully listed on the Main Board of the Stock Exchange and made an offering of 2,179,585,000 class B ordinary shares (excluding any class B ordinary shares issued pursuant to the exercise of the over-allotment option) at a price at HK$17.00 per share. The Company used this offering price to determine the underlying Preferred Shares value of the Company as of June 30, 2018 accordingly. All Preferred Shares were converted into class B ordinary shares upon completion of the initial public offering on July 9, 2018.
Changes in fair value of Preferred Shares were recorded in “fair value changes of convertible redeemable preferred shares” in the interim condensed consolidated income statements. Management considered that fair value changes in the Preferred Shares that are attributable to changes of credit risk of this liability are not significant.

38
13 Other non-current liabilities
As of June 30,
As of December 31,
2018 2017RMB’000 RMB’000
(Unaudited) (Audited)
Investment from investors (Note (a)) 2,631,000 —Others 34,697 35,211
2,665,697 35,211
Note:
(a) Two subsidiaries of the Group together with other limited partners newly launched a RMB fund named Hubei Yangtze River Industry Investment Fund Partner (Limited Partnership) (湖北小米長江產業基金合夥企業 (有限合夥 )) (the “Hubei Fund”) in Wuhan, Hubei province in mainland China in 2017. During the six months ended June 30, 2018, the Hubei Fund raised approximately RMB2,631,000,000 from third party investors for investment activities. The size of the Hubei Fund is RMB12,000,000,000. The Group controls the Hubei Fund as the Group is exposed to, and has rights to, variable returns from its involvement with the Hubei Fund and has the ability to affect those returns through its power over the Hubei Fund. Hubei Fund has limited operation during the current period. The amount raised from limited partners is classified as financial liability in the consolidated financial statements.
14 Trade payables
Trade payables primarily include payables for inventories and royalty fees. As of December 31, 2017 and June 30, 2018, the carrying amounts of trade payables were primarily denominated in RMB.
Trade payables and their aging analysis based on invoice date are as follows:
As ofJune 30,
As of December 31,
2018 2017RMB’000 RMB’000
(Unaudited) (Audited)
Up to 3 months 43,334,309 32,859,3023 to 6 months 1,428,885 936,6906 months to 1 year 162,458 180,0601 to 2 years 39,317 22,525Over 2 years 1,318 4,754
44,966,287 34,003,331
15 Events after the reporting period
On July 9, 2018 the Company successfully completed its initial public offering of 2,179,585,000 offer shares (comprising 1,434,440,000 new class B ordinary shares) at a price at HK$17.00 per share, and was listed on the Main Board of the Stock Exchange. Additionally, the Company issued and allotted 201,486,000 class B ordinary shares on July 20, 2018 pursuant to the full exercise of the over-allotment option as disclosed in the announcement of the Company dated July 18, 2018. The gross proceeds received by the Company was approximately HK$27,810,742,000 (equivalent to approximately RMB23,525,107,000).
All Preferred Shares were converted into class B ordinary shares upon completion of the global offering on July 9, 2018.
On July 20, 2018, the Hubei Fund completed its registration with relevant government authority. Accordingly, funds of RMB3,235,211,000 that were recorded as restricted cash as of June 30, 2018 were transferred to cash and cash equivalent upon the completion of registration.

39
CORPORATE GOVERNANCE AND OTHER INFORMATION
The Company was incorporated in the Cayman Islands on January 5, 2010 with limited liability, and the class B ordinary shares in the share capital of the Company were listed on the Main Board of The Stock Exchange of Hong Kong Limited (the “Stock Exchange”) on July 9, 2018 (the “Listing Date”).
The Company is committed to maintaining and promoting stringent corporate governance standards. The principles of the Company’s corporate governance are to promote effective internal control measures and to enhance the transparency and accountability of the Board to all shareholders.
As the shares of the Company were not yet listed on the Stock Exchange as of June 30, 2018, the principles and code provisions of the Corporate Governance Code (the “CG Code”) contained in Appendix 14 to the Listing Rules were not applicable to the Company during the Reporting Period.
The Company has adopted the principles and code provisions of the CG Code as the basis of the Company’s corporate governance practices with effect from the Listing Date.
Save for code provision A.2.1 of the CG Code, the Company has complied with all the code provisions set out in the CG Code throughout the period from the Listing Date to the date of this announcement.
Pursuant to code provision A.2.1 of the CG Code, companies listed on the Stock Exchange are expected to comply with, but may choose to deviate from the requirement that the responsibilities between the chairman and the chief executive officer should be segregated and should not be performed by the same individual. The Company does not have a separate chairman and chief executive officer and Mr. Lei Jun currently performs these two roles. The Board believes that vesting the roles of both chairman and chief executive officer in the same person has the benefit of ensuring consistent leadership within the Group and enabling more effective and efficient overall strategic planning for the Group. The Board considers that the balance of power and authority for the present arrangement will not be impaired and this structure will enable the Company to make and implement decisions promptly and effectively. The Board will continue to review and consider segregating the roles of chairman of the Board and chief executive officer of the Company at an appropriate time, taking into account the circumstances of the Group as a whole.
COMPLIANCE WITH THE MODEL CODE FOR SECURITIES TRANSACTIONS BY DIRECTORS
The Company has adopted the Model Code for Securities Transactions by Directors of Listed Issuers (the “Model Code”) as set out in Appendix 10 to the Listing Rules as the code of conduct regarding the Directors’ dealings in the securities of the Company. The provisions under the Listing Rules in relation to compliance with the Model Code by the Directors regarding securities transactions have been applicable to the Company since the Listing Date. As the shares of the Company were not yet listed on the Stock Exchange as of June 30, 2018, the Model Code was not applicable to the Company during the Reporting Period.

40
Having made specific enquiry of all the Directors, all the Directors confirmed that they have complied with the provisions of the Model Code throughout the period from the Listing Date to the date of this announcement.
AUDIT COMMITTEE
The Company has established the Audit Committee in compliance with Rule 3.21 of the Listing Rules and the CG Code. The primary duties of the Audit Committee are to review and supervise the financial reporting process and internal controls system of the Group, review and approve connected transactions and to advise the Board. The Audit Committee comprises one non-executive Director and two independent non-executive Directors, namely, Dr. Chen Dongsheng, Mr. Koh Tuck Lye and Mr. Wong Shun Tak. Mr. Wong Shun Tak is the chairman of the Audit Committee.
The Audit Committee has reviewed the unaudited interim results of the Group for the three and six months ended June 30, 2018. The Audit Committee has also discussed matters with respect to the accounting policies and practices adopted by the Company and internal control with senior management members and the external auditor of the Company, PricewaterhouseCoopers.
The unaudited interim condensed consolidated financial report of the Group for the three months and six months ended June 30, 2018 has been separately reviewed by the Audit Committee and by the Company’s external auditor in accordance with the International Standard on Review Engagements 2410, Review of Interim Financial Information Performed by the Independent Auditor of the Entity, issued by the International Auditing and Assurance Standard Board.
OTHER BOARD COMMITTEES
In addition to the Audit Committee, the Company has also established a nomination committee, a remuneration committee and a corporate governance committee.
PURCHASE, SALE OR REDEMPTION OF THE COMPANY’S LISTED SECURITIES
Save for the issuance of 201,486,000 class B ordinary shares on July 20, 2018 pursuant to the full exercise of the over-allotment option as disclosed in the announcement of the Company dated July 18, 2018, neither the Company nor any of its subsidiaries purchased, sold or redeemed any of the Company’s securities listed on the Stock Exchange during the period from the Listing Date to the date of this announcement.
MATERIAL LITIGATION
As of June 30, 2018, the Company was not involved in any material litigation or arbitration. Nor were the Directors aware of any material litigation or claims that were pending or threatened against the Company.

41
INTERIM DIVIDEND
The Board has resolved not to declare an interim dividend for the six months ended June 30, 2018.
USE OF PROCEEDS FROM THE GLOBAL OFFERING
Upon the listing of the shares of the Company on the Stock Exchange on July 9, 2018, the proceeds from the Global Offering will be utilized for the purposes as set out in the prospectus of the Company published on June 25, 2018.
PUBLICATION OF THE INTERIM RESULTS ANNOUNCEMENT AND INTERIM REPORT
This interim results announcement has been published on the website of the Stock Exchange at www.hkexnews.hk and the website of the Company at www.mi.com. The 2018 interim report of the Company will be published on the aforesaid websites of the Stock Exchange and the Company and will be dispatched to the Company’s shareholders in due course.
By order of the BoardXiaomi Corporation
Lei JunChairman
Hong Kong, August 22, 2018
As at the date of this announcement, the Board of Directors of the Company comprises Mr. Lei Jun as Chairman and Executive Director and Mr. Lin Bin as Executive Director, Mr. Koh Tuck Lye and Mr. Liu Qin as Non-executive Directors, and Dr. Chen Dongsheng, Dr. Lee Ka Kit and Mr. Wong Shun Tak as Independent Non-executive Directors.