results for the year ended 31 march 2016 - atkinsglobal.com/media/files/a/atkins-corporate/... ·...
TRANSCRIPT
Results for the year ended 31 March 2016 Strong performance, 8% margin target achieved and PP&T nuclear acquisition now completed Design, engineering and project management consultancy WS Atkins plc (Atkins) today announces its preliminary results for the year ended 31 March 2016. RESULTS SUMMARY
Note
2016
2015
Change
Income statement Revenue £1,861.9m £1,756.6m +6.0% Operating profit £143.4m £118.5m +21.0% Underlying operating profit 1 £148.2m £134.1m +10.5% Operating margin 7.7% 6.7% +1.0pp Underlying operating margin 2 8.0% 7.6% +0.4pp Profit before tax £131.1m £106.7m +22.9% Underlying profit before tax 3 £139.0m £121.9m +14.0% Profit for the year after tax £103.4m £85.7m +20.7% Diluted EPS 103.0p 85.4p +20.6% Underlying diluted EPS 4 107.3p 97.1p +10.5% Dividend 39.5p 36.5p +8.2% People 5 Staff numbers 31 March 18,052 18,462 -2.2% Average staff numbers 18,416 17,898 +2.9% Cash Operating cash flow £116.1m £133.9m -13.3% Net funds 6 £191.7m £179.3m +6.9% Work in hand 7 44% 51% -7pp
Financial highlights
- Revenue up 6% to £1.86bn
- Underlying operating profit up 10.5%, 8.0% margin target achieved
- Underlying profit before tax of £139.0m, ahead of market expectations
- Underlying diluted EPS up 10.5%, full year dividend up 8.2%
- Strong balance sheet with net funds of £191.7m at 31 March 2016
Operational highlights
- Significant improvement in UK and Europe performance
- Two recent major transportation project wins in North America underpin workload into the new financial year
- Strong performance in Middle East driven by the Central Planning Office in Qatar and peak delivery on metro projects
- In Asia Pacific we continue to pursue outbound investment opportunities with selected Chinese contractors
- Difficult year for Energy, although good growth in nuclear, power and renewables
- PP&T nuclear acquisition completed in April 2016.
“We are delighted to have achieved our 8% operating margin target against headwinds in certain markets. These are good results with strong growth in profitability and underlying diluted EPS. Overall, we remain confident for the year ahead despite continued uncertainty in some of our markets.”
Allan Cook CBE Chairman
Prof Dr Uwe Krueger CEO

Notes:
1. Underlying operating profit is profit before exceptional items, amortisation of acquired intangibles, and deferred acquisition payments. In addition, 2015 excludes impairment of goodwill.
2. Underlying operating margin is the value of underlying operating profit expressed as a percentage of revenue
3. Underlying profit before tax additionally excludes net loss on disposal of businesses of £3.1m (2015: profit £0.4m).
4. Underlying diluted EPS is based on underlying profit after tax and allows for the dilutive effect of share options.
5. Staff numbers are shown on a full-time equivalent basis, including agency staff.
6. Net funds comprise cash and cash equivalents plus financial assets and loan notes receivable less borrowings.
7. Work in hand is the value of contracted and committed work as at 31 March that is scheduled for the following financial year, expressed as a percentage of budgeted revenue for the year.
Enquiries Heath Drewett, Group finance director +44 (0) 20 7121 2000 Sara Lipscombe, Group communications director +44 (0) 20 7121 2000 Kate Moy, Investor relations director +44 (0) 20 7121 2000 Notes to editors 1. Atkins Atkins (www.atkinsglobal.com) is one of the world's most respected design, engineering and project management consultancies, employing over 18,000 people across the UK, North America, Middle East, Asia Pacific and Europe. We build long term trusted partnerships to create a world where lives are enriched through the implementation of our ideas. You can view Atkins’ recent projects on our website. 2. Attachments Attached to this news release are the overview of the year, business review, financial review, table of principal risks and responsibilities, statement of going concern, statement of directors’ responsibilities, the consolidated income statement, consolidated statement of comprehensive income, consolidated balance sheet, consolidated cash flow statement, consolidated statement of changes in equity and notes to the preliminary financial information for the year. 3. Analyst Presentation A presentation for analysts will be held today at the London Stock Exchange at 0830. Dial-in details are available from +44 (0) 1372 756077 for those wishing to join the presentation by conference call. A webcast of the presentation will be available via the Company's website, www.atkinsglobal.com. 4. Cautionary Statement This announcement has been prepared for the shareholders of Atkins as a whole and its sole purpose and use is to assist shareholders to exercise their governance rights. In particular, this announcement has not been audited or otherwise independently verified and no warranty is given as to its accuracy or completeness (other than any such warranty which is mandatorily implied by statute). Atkins and its directors and employees are not responsible for any other purpose or use or to any other person in relation to this announcement and their responsibility to shareholders shall be limited to that which is imposed by statute. This announcement contains indications of likely future developments and other forward looking statements that are subject to risk factors associated with, among other things, the economic and business circumstances occurring from time to time in the countries, sectors and business segments in which the Group operates. These and other factors could adversely affect the Group’s results, strategy and prospects. Forward looking statements involve risks, uncertainties and assumptions. They relate to events and/or depend on circumstances in the future which could cause actual results and outcomes to differ materially from those currently expected. No obligation is assumed to update any forward looking statements, whether as a result of new information, future events or otherwise. Nothing in this announcement should be construed as a profit forecast.

OVERVIEW OF THE YEAR We are pleased to report that the Group delivered a strong set of results against headwinds in certain markets. During the year, we made further progress on the delivery of our strategy and are delighted to have achieved our 8% underlying operating margin goal. Underlying operating profit was £148.2m (2015: £134.1m) up 10.5% year on year. Revenue rose 6% to £1.86bn (2015: £1.76bn). Our operational excellence programme, including streamlined organisational structures in all four of our geographic regions, continues to deliver results. In March 2016, we reached agreement on the acquisition of Howard Humphreys (East Africa) Limited (Howard Humphreys), subject to normal regulatory clearances. The acquisition is an important catalyst to develop our presence within East Africa’s rapidly growing infrastructure market. Our acquisition of the projects, products and technology (PP&T) segment of EnergySolutions completed in April 2016 after receiving the necessary regulatory approvals. Our combined business is well positioned in major nuclear markets in North America, the UK, Europe, the Middle East and Asia Pacific. In the US, which has the largest nuclear fleet, we are now in the top tier for decommissioning, site operations, major projects and consultancy. We are investing to create a new advisory business – Atkins Acuity – targeted at infrastructure and energy projects worldwide. Acuity has developed a structure, operation and pipeline of opportunities at the heart of our focus sectors of energy, transport and infrastructure and is creating new revenue opportunities for us. Underlying profit before tax of £139.0m (2015: £121.9m) is arrived at after adjusting for exceptional gains totalling £4.7m (2015: £4.4m loss) along with amortisation of acquired intangible assets of £6.3m (2015: £6.9m), deferred acquisition payments of £3.2m (2015: £1.5m) and a loss on disposal of business of £3.1m (2015: £0.4m profit) and, in the prior year, impairment of goodwill of £2.8m. Underlying diluted earnings per share rose 10.5% to 107.3p (2015: 97.1p). Operating cash flow for the year was £116.1m (2015: £133.9m), representing 78.3% (2015: 99.8%) of underlying operating profit. The Group’s liquidity remains strong with closing net funds of £191.7m (2015: £179.3m). The Group pension schemes have seen the net IAS 19 pension liability reduce to £265.3m (2015: £298.4m). This is due to a combination of reduced liabilities of £5.3m, as a consequence of changes in economic assumptions, and asset gains over the year of £27.8m. Staff numbers were 18,052 (2015: 18,462), reflecting reductions in the Middle East and Asia Pacific and the sale of our business in Portugal. Our UK and Europe business delivered very good results. All parts of the UK business performed well with the exception of our aerospace business where we had a slow start to the year. The infrastructure market in UK roads, rail and water remains well funded and investment continues to enjoy Government support. Significant contract wins during the year include East West rail phase 2, engineering delivery partner for High Speed 2, work on the west section of Thames Tideway and appointment onto Scottish Water’s technical support consultancy contract. Our core markets in Scandinavia remain well funded, with strong pipelines. We are focused on expanding our position in the Norwegian infrastructure and project management markets, helped by the successful integration of Terramar. This has been a transitional year for our North America business with the start of a portfolio shift towards larger projects and programmes. We were delighted to be appointed to Project NEON for Nevada Department of Transportation and the Purple Line light rail project in Maryland, both significant wins for the region. Faithful+Gould has delivered an improved year on year performance in North America. Our Middle East business delivered another very good overall performance driven by the Central Planning Office project in Qatar and peak delivery on its metro projects. However, cash flow was not without its challenges in a region coming under increased liquidity pressure as a result of the current oil price. Our Faithful+Gould business also delivered growth across the United Arab Emirates (UAE) and the Kingdom of Saudi Arabia (KSA). Profitability and cash flow performance in Asia Pacific were impacted by delays to the start of a number of key opportunities and receipts from clients beyond agreed contract terms. In Hong Kong, we have continued to bid for major new government contracts but are closely monitoring a slowdown in the rate of funding approval and increased competition. In mainland China, while we welcome the Government programme of anti-corruption measures it continues to slow down the release and award of projects. Our Faithful+Gould business had another good year.

Our Energy business has had a mixed year, with a good performance in our nuclear, power and renewables businesses but challenges in most of our oil and gas markets, with the exception of the Middle East. People We continue our work to attract more young people into pursuing a career in the engineering sector. During the year, we welcomed over 400 new graduates across the Group and accelerated our apprentice programme by recruiting 81 apprentices within our UK business. We are a member of the ‘5% Club’, an industry-led campaign whose member organisations make a public commitment to have at least 5% of their UK workforce on formal graduate and apprenticeship schemes. Our current proportion is 12.3% (2015: 8.9%) of UK headcount. A more diverse and inclusive workforce will help to address the critical skills shortage in our industry and our commitment to build a more diverse organisation continues to gain momentum. We have increased the number of women’s professional networks around the world and continue to roll out our flexible working practices across the Group. Dividend The Board is recommending a final dividend of 27.8p per ordinary share in respect of the year ended 31 March 2016, making the total dividend for the year 39.5p (2015: 36.5p), an increase of 8.2%. If approved at the Company’s annual general meeting, the dividend will be paid on 19 August 2016 to ordinary shareholders on the register on 8 July 2016. Outlook In the UK, we see a healthy pipeline of opportunities, particularly in infrastructure markets. Our core markets in Scandinavia remain well funded, supported by government commitments. In North America, our workload is underpinned by the two significant transportation wins and the five-year Transportation Bill should provide greater pipeline visibility, although we do not expect to see any material impact until after the presidential election. In the Middle East economies, long-term major project opportunities continue to come to the market but contract awards are expected to remain slow. We are cautious about the outlook for the region, given increased uncertainty on the timing and funding of our pipeline opportunities. However, our acquisition of Howard Humphreys gives us an excellent platform to develop our presence in Africa. Asia Pacific is aiming to improve operational efficiency with the formation of a new property division in mainland China. We continue to monitor funding approval across the region. The outlook for our Energy business as a whole remains positive. Despite difficult trading conditions in the oil and gas market, we believe we are well positioned for the medium and longer term and see significant opportunities in nuclear supported by our acquisition of PP&T. Overall, we remain confident for the year ahead, in line with expectations, despite continued uncertainty in some of our markets.
BUSINESS REVIEW Segmental performance
UK and Europe
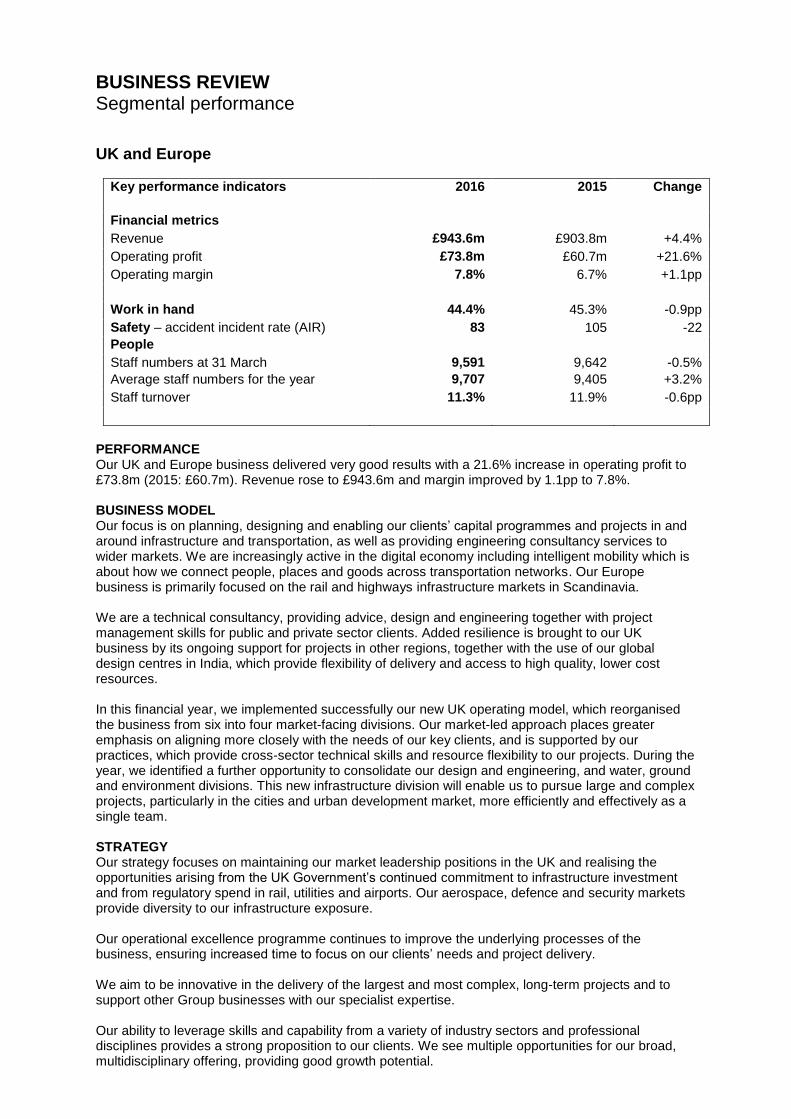
Key performance indicators 2016 2015 Change
Financial metrics
Revenue £943.6m £903.8m +4.4%
Operating profit £73.8m £60.7m +21.6%
Operating margin 7.8% 6.7% +1.1pp
Work in hand 44.4% 45.3% -0.9pp
Safety – accident incident rate (AIR) 83 105 -22
People
Staff numbers at 31 March 9,591 9,642 -0.5%
Average staff numbers for the year 9,707 9,405 +3.2%
Staff turnover 11.3% 11.9% -0.6pp
PERFORMANCE Our UK and Europe business delivered very good results with a 21.6% increase in operating profit to £73.8m (2015: £60.7m). Revenue rose to £943.6m and margin improved by 1.1pp to 7.8%. BUSINESS MODEL Our focus is on planning, designing and enabling our clients’ capital programmes and projects in and around infrastructure and transportation, as well as providing engineering consultancy services to wider markets. We are increasingly active in the digital economy including intelligent mobility which is about how we connect people, places and goods across transportation networks. Our Europe business is primarily focused on the rail and highways infrastructure markets in Scandinavia. We are a technical consultancy, providing advice, design and engineering together with project management skills for public and private sector clients. Added resilience is brought to our UK business by its ongoing support for projects in other regions, together with the use of our global design centres in India, which provide flexibility of delivery and access to high quality, lower cost resources. In this financial year, we implemented successfully our new UK operating model, which reorganised the business from six into four market-facing divisions. Our market-led approach places greater emphasis on aligning more closely with the needs of our key clients, and is supported by our practices, which provide cross-sector technical skills and resource flexibility to our projects. During the year, we identified a further opportunity to consolidate our design and engineering, and water, ground and environment divisions. This new infrastructure division will enable us to pursue large and complex projects, particularly in the cities and urban development market, more efficiently and effectively as a single team. STRATEGY Our strategy focuses on maintaining our market leadership positions in the UK and realising the opportunities arising from the UK Government’s continued commitment to infrastructure investment and from regulatory spend in rail, utilities and airports. Our aerospace, defence and security markets provide diversity to our infrastructure exposure. Our operational excellence programme continues to improve the underlying processes of the business, ensuring increased time to focus on our clients’ needs and project delivery. We aim to be innovative in the delivery of the largest and most complex, long-term projects and to support other Group businesses with our specialist expertise. Our ability to leverage skills and capability from a variety of industry sectors and professional disciplines provides a strong proposition to our clients. We see multiple opportunities for our broad, multidisciplinary offering, providing good growth potential.
BUSINESS DRIVERS The UK economic environment and social policy, such as development of the Northern Powerhouse, the roads investment strategy and ongoing development of major cities such as London, Birmingham and Manchester, significantly affect the opportunities available to our business. The digital economy, with its forward-thinking use of technology in areas such as intelligent mobility, is another increasingly important driver for our business. Our diversified portfolio provides resilience against market fluctuations, as does the fact that a number of our most important markets remain well funded. Scandinavian markets continue to benefit from investment in infrastructure from both the public and private sectors, providing stable market conditions. OPERATIONS The infrastructure market in UK roads, rail and water remains well funded and investment continues to enjoy Government support. In particular, the Budget and Autumn Statement confirmed our expectations that capital investment for infrastructure projects will remain strong. Transportation Transportation has performed well this year. Our appointment by Highways England as one of its key suppliers on the Collaborative Delivery Framework (CDF) is proving successful and we are well positioned to bid on the largest projects. Under the CDF, Atkins and CH2M were awarded the detailed design contract for the £1.5bn A14 Cambridge to Huntingdon upgrade programme, and our joint venture with Jacobs was awarded the design contract for three smart motorway schemes. In joint venture with Arup, we achieved another key win in the second half of the year with Highways England which appointed us to develop proposals for a tunnel on the A303 near Stonehenge. The Hendy Review into project delivery in Network Rail resulted in some scheme delays and the extension of works programmes into the next spending control period. However, we are encouraged that the overall level of investment increased as a result of the review to £40bn. This included the funding of a significant number of our projects, particularly in the electrification programme, on the Great Western mainline between London and South Wales and the Midland mainline. We continue to deliver a range of complex projects for Network Rail, including the Stafford Area Improvement Programme and projects at East Kent and Cardiff. In December 2015, the East West Rail Phase 2 scheme was secured as part of our alliance with Volker Rail, Laing O’Rourke and Network Rail. This multi-year contract is expected to deliver up to £100m of revenue for the Group. In September, the five-year programme to improve capacity and the passenger experience at Birmingham New Street station, for which we were lead designer, was completed. As part of a joint venture with CH2M and SENER, we have won a contract to become engineering delivery partner for High Speed 2. The contract, valued at between £250m and £350m for the consortium, is expected to run for 10 years and will see us provide engineering support for the delivery of phase 1 of the project which runs from London to Birmingham. Our investment to shape the future of transportation in the UK has made progress with leadership on intelligent mobility projects such as Venturer, the driverless vehicle pilot in Bristol, and FLOURISH, the BIS funded project to support the development of connected and autonomous vehicles. Water, ground and environment (WG&E) WG&E has had a good year. Our healthy pipeline of work from water utility clients includes our support for the delivery of the programmes for the 2015 to 2020 regulatory period asset management plan (AMP6) for Thames Water, Severn Trent Water and United Utilities. We have also been appointed onto Scottish Water’s technical support consultancy contract as part of the ARC joint venture. The framework runs throughout the current Scottish Water SR15 business plan period (2015-2021). In January 2016, our joint venture with Arup was appointed to deliver a range of design and engineering services for the BMB joint venture between BAM Nuttall, Morgan Sindall and Balfour Beatty on the west section of London’s new sewer, Thames Tideway. We are seeing increasing opportunities to cross-sell the skills and expertise within this business into the transportation and energy markets. For example, work on Crossrail and High Speed 2, and recent awards on major highways and other rail projects, are drawing on our specialist environmental and ground engineering teams. This was a key reason behind the decision to merge the WG&E and design and engineering businesses to create our new infrastructure division from April 2016.

Design and engineering Our design and engineering business has performed well during the year with strong volumes and high productivity. The business saw continued growth in its core markets and works closely with the Group’s Energy business to deliver the buildings and infrastructure elements of major UK projects. Our proposition to local authorities and developers for residential-led regeneration and social infrastructure is developing with the recent appointment to design 600 new homes as part of a mixed-use regeneration scheme in West London. In the education sector, the market remains active and continues to represent a significant proportion of our portfolio. Recently secured projects include work for the universities of Glasgow, Wolverhampton and Bournemouth and we will continue to focus on higher and further education opportunities. Our airports team is delivering significant programmes of work at London Heathrow and Gatwick, as well as to support the wider Group on international opportunities. Our defence infrastructure portfolio includes major programmes of work for BAE Systems and designing facilities for air and sea-based defence. We have also supported initial nuclear new build infrastructure work in the UK, including EDF Energy’s proposed new Hinkley Point power station, and remain involved in nuclear decommissioning work with our colleagues in the Energy business. Aerospace, defence, security and technology (ADS&T) ADS&T has had a mixed year. In aerospace, during the early part of the year, workload was cancelled at short notice in North America and appropriate action was taken to reduce headcount further, particularly in North America and Europe. The position is now stabilising after securing a number of new and diversified contracts, including our alliance with Ausy to Airbus’ E2S multi-year framework. Our defence and security businesses traded well during the year, with increased volume flowing through ongoing contracts to deliver security work for central Government. Heathrow Airport’s IT outsourcing contract, in partnership with Capgemini, allows us to leverage our position in aviation. In holistic security, our team is delivering a range of projects, including a number of cyber security assignments for multinational private sector clients. Faithful+Gould Our UK business has performed well with a steady stream of work, particularly in higher and further education, as well as commercial property in London and the South East. Our work on the Scape Asset Management, Surveying and Design Services public sector framework has provided a steady stream of work and is subject to rebid this year. Project wins include appointments at the universities of Edinburgh and Glasgow and with Westminster City Council and CapInvest. We were pleased to win Construction Consultant/Surveyor of the Year at the Building Awards 2015. Our market position in the nuclear sector continues to grow as we work to develop opportunities with our Energy business and to support EDF Energy on the proposed Hinkley Point C with our renewed appointment for contract management and administration services. We successfully secured a place on Highways England's Specialist Professional and Technical Services framework. Europe Our core markets in Scandinavia remain well funded, with a strong pipeline of infrastructure projects and increasing opportunities to work with local contractors as well as public bodies. Workload in Denmark is stable across our major rail and road infrastructure projects including two major projects with Banedanmark – the signalling programme and the design of the new rail line between Copenhagen and Ringsted. The design and build project for bridges on this line is progressing well, with the bridges under construction. In Sweden, we continue to work on a number of large rail projects, including Hallsberg (TrV), HSL Mölnlycke (TrV) and the Molnby depot project, which is progressing into the detailed design stage. We are focused on expanding our position in the Norwegian infrastructure and project management markets, helped by the successful integration of the Terramar project management consultancy. We have recently secured a rail infrastructure project as well as several important framework agreements. In the year, further progress on our portfolio optimisation strategy was made, with the disposal of our 48 person business in Portugal.
PEOPLE Closing staff numbers reduced slightly to 9,591 (2015: 9,642), (UK: 8,873 (2015: 8,885); Europe: 718 (2015: 757)) after allowing for the disposal of the Portuguese business. Staff turnover decreased to 11.3% from 11.9%. In the UK, we continue to implement programmes to assist with the attraction, engagement and retention of talented people and are recognised by a number of independent organisations as a great place to work. We were once again named in The Sunday Times 25 Best Big Companies to Work For, appearing in the top 25 for the 10th time in 12 years. We are one of the largest and most popular recruiters of new graduate engineers and were shortlisted for the TARGETjobs most popular graduate recruiter in the construction, civil engineering and surveying sector in 2016. The ongoing promotion of science, technology, engineering and mathematics (STEM) careers to young people continues to be a focus. Over 500 STEM ambassadors took part in more than 350 STEM activities with schools, colleges and community groups, engaging with thousands of students. During the year, 383 young people joined the UK business on formal education and development programmes including 81 apprentices. While we maintain our commitment to achieving gender diversity, the scope of our diversity and inclusion (D&I) activity is widening in the shape of a five-year D&I plan. The plan will be aligned with the 10 steps, developed by industry members and partners of the Royal Academy of Engineering and the WISE campaign in 2014. Focus on increasing the proportion of female employees continues and a range of flexible working options has been developed to help us both recruit and retain staff. We recruited 91 female graduates in the September 2015 intake, an increase of 4%. In line with the rest of the Group, employee engagement is measured through our Viewpoint employee opinion survey. Across the region, our results in 2015 were unchanged compared with the previous year, a pleasing result given the reshaping of our UK business and the difficult conditions in some of our markets. The result continued to outperform the global norm for the professional services sector. SAFETY AND SUSTAINABILITY Workplace health, safety and wellbeing continue to be a high priority and our overall AIR has improved due to a reduction in the number of reportable accidents. RISKS There is a risk in the medium and longer term of a shortage of professional technical staff in our industry. In 2015, we released a report, The skills deficit: consequences and opportunities for UK infrastructure, focusing on the challenges of an engineering skills shortage, which highlighted apprenticeships as one of the most effective ways to solve it. The Our people section of our Annual Report outlines our approach to recruiting apprentices and sponsoring students and graduates to help mitigate this risk. We believe that the availability of talented engineers and scientists from Europe without restrictions means that it is in our best interests for the UK to remain within the EU. However, we do not believe that a vote to leave the EU would constitute a material risk to the Group from an operational or financial perspective. The majority of the Group’s post-employment benefit liability sits within the UK business and is comprised of defined benefit pension obligations, the largest of which is within the Atkins Pension Plan, which is closed to the future accrual of benefits (see note 13 for more detail). The pension obligations are recognised as a risk due to their size and the fact that the ongoing liability is a function of a number of assumptions, not least the life expectancy of members. This risk is mitigated by ongoing cash contributions to the pension fund, which have been agreed with the pension trustee, along with measures to manage ongoing volatility. We assess risks across all of our businesses and this is explained in more detail in the Principal risks and uncertainties section.

OUTLOOK Our secured work in hand in UK and Europe is 44.4% (2015: 45.3%) of next year’s budgeted revenue and, with the continued optimisation of our business in the UK, this gives us confidence for the year ahead. We see a healthy pipeline of opportunities in the UK, particularly in transportation and infrastructure markets. Our core markets in Scandinavia remain well funded and supported by government commitments. In the March Budget the Chancellor announced funding for improved connectivity in the Northern Powerhouse and the initial development of Crossrail 2. The Government has also committed to making a decision on south east airport capacity in the summer and the parliamentary process for phase 1 of High Speed 2 is in its final stages, with the intention for construction to begin in 2017. However, there may be some slowing of decision-making and in the award of major projects due to continued Government austerity measures.
North America
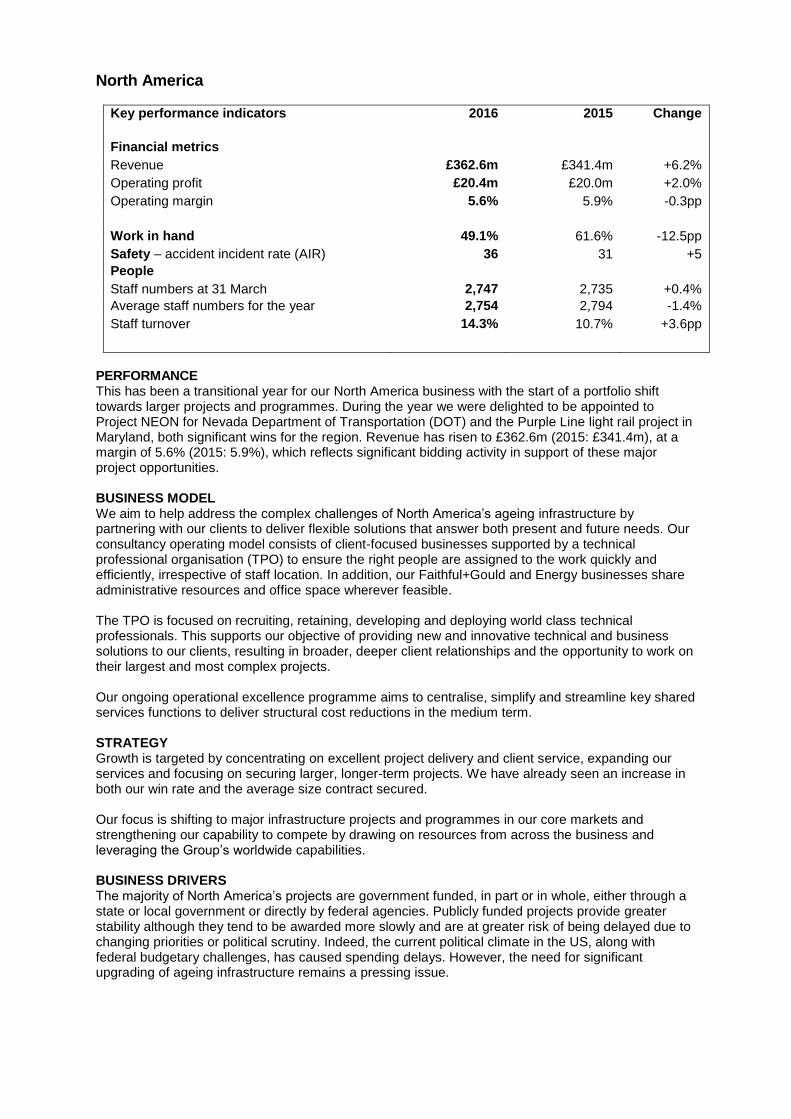
Key performance indicators 2016 2015 Change
Financial metrics
Revenue £362.6m £341.4m +6.2%
Operating profit £20.4m £20.0m +2.0%
Operating margin 5.6% 5.9% -0.3pp
Work in hand 49.1% 61.6% -12.5pp
Safety – accident incident rate (AIR) 36 31 +5
People
Staff numbers at 31 March 2,747 2,735 +0.4%
Average staff numbers for the year 2,754 2,794 -1.4%
Staff turnover 14.3% 10.7% +3.6pp
PERFORMANCE This has been a transitional year for our North America business with the start of a portfolio shift towards larger projects and programmes. During the year we were delighted to be appointed to Project NEON for Nevada Department of Transportation (DOT) and the Purple Line light rail project in Maryland, both significant wins for the region. Revenue has risen to £362.6m (2015: £341.4m), at a margin of 5.6% (2015: 5.9%), which reflects significant bidding activity in support of these major project opportunities. BUSINESS MODEL We aim to help address the complex challenges of North America’s ageing infrastructure by partnering with our clients to deliver flexible solutions that answer both present and future needs. Our consultancy operating model consists of client-focused businesses supported by a technical professional organisation (TPO) to ensure the right people are assigned to the work quickly and efficiently, irrespective of staff location. In addition, our Faithful+Gould and Energy businesses share administrative resources and office space wherever feasible. The TPO is focused on recruiting, retaining, developing and deploying world class technical professionals. This supports our objective of providing new and innovative technical and business solutions to our clients, resulting in broader, deeper client relationships and the opportunity to work on their largest and most complex projects. Our ongoing operational excellence programme aims to centralise, simplify and streamline key shared services functions to deliver structural cost reductions in the medium term. STRATEGY Growth is targeted by concentrating on excellent project delivery and client service, expanding our services and focusing on securing larger, longer-term projects. We have already seen an increase in both our win rate and the average size contract secured. Our focus is shifting to major infrastructure projects and programmes in our core markets and strengthening our capability to compete by drawing on resources from across the business and leveraging the Group’s worldwide capabilities. BUSINESS DRIVERS The majority of North America’s projects are government funded, in part or in whole, either through a state or local government or directly by federal agencies. Publicly funded projects provide greater stability although they tend to be awarded more slowly and are at greater risk of being delayed due to changing priorities or political scrutiny. Indeed, the current political climate in the US, along with federal budgetary challenges, has caused spending delays. However, the need for significant upgrading of ageing infrastructure remains a pressing issue.
OPERATIONS Our DOT business continues to improve and has grown revenue 12% year on year, particularly with key clients such as the Colorado, Florida, Texas and Georgia DOTs. In October 2015, we won the $45m design contract for Project NEON, the widening of I-15 for the Nevada DOT, as part of the Kiewit Infrastructure West team, and are now in full production. Public and private is focused on the water, environmental, city and county markets and was impacted during the year by delays in project task awards. Work to reshape and position this business for more substantial and sustainable growth built around larger, longer-term projects is ongoing. In the key focus area of major programme management, there were notable wins during the year for Miami-Dade County and Broward County Schools in Florida and Cobb County in Georgia. The federal market continues to face political uncertainty and budget restrictions ahead of the presidential election, as well as challenges from global economic uncertainty. Task order assignments are being pursued under existing contracts with the Federal Emergency Management Agency, the Army Corps of Engineers and the National Guard. We are also working with other parts of the Group to target federal Government contracts outside North America. Our strategic ventures business has a diverse portfolio of rail, transit and municipal clients for whom we provide environmental, planning, permitting, programme management, asset management and engineering services. In February, we were delighted to be selected as part of the Purple Line Transit Partners team for the $100m lead design contract on the Purple Line project for Maryland DOT. Work has started on the project, which is scheduled to complete in 2022. This represents the business’s largest single project award since joining the Atkins Group in 2010. In aviation, where architectural and engineering services are provided at major airports, including New Orleans, Los Angeles, Orlando, Nashville and Atlanta, performance improved during the year. Faithful+Gould has delivered an improved year on year performance. Its aviation projects include work at San Francisco, Denver and San Diego airports and for United Airlines. The appointment to provide programme management services on John Wayne Airport’s five-year capital improvement programme continues our longstanding work there. In the energy sector, additional work was secured with Bruce Power and work continues with Ontario Power Generation and BP as well as with PacifiCorp on electricity transmission. Other appointments include new projects in the hospitality and manufacturing sectors. PEOPLE Closing staff numbers rose slightly to 2,747. Focus remains on attracting and retaining key staff, which has been a priority as competition for resources remains keen. Staff turnover increased to 14.3% from 10.7% reflecting these improved labour market conditions. We measure employee engagement through our Group wide Viewpoint employee opinion survey and are working with an employee focus group to address areas that it highlighted. The overall score in 2015 improved five points and is well ahead of industry norms. We are committed to recruiting, retaining, developing, and elevating minority and women professionals through initiatives such as our sponsorship of WTS International. Founded in 1977, WTS has a specific mission of fostering lifelong career goals for women in the transportation industry. SAFETY AND SUSTAINABILITY Our safety culture plays a central role in how we deliver work. Sustainability and employee wellbeing continued to be an area of focus. While there was a slight deterioration in the AIR for North America this arose as a result of reduced office-based staff numbers in our Faithful+Gould business in the region. RISKS A majority of our work is government funded and, as a result, political uncertainty and deadlock caused by the 2016 presidential election may lead to delays in federal programmes and funding. We are closely monitoring Congress’s activities for continued programme funding, particularly around transportation and highways, where delays would have the most significant impact on our workload. Congress’s support of federal funding for military and civilian programmes is also of particular concern in North America, as we hold a number of task order based contracts. For more information about risks across all of our businesses and the actions that we are taking, see the Principal risks and uncertainties section.

OUTLOOK Our secured work in hand in North America is 49.1% (2015: 61.6%). This figure excludes the recent Purple Line project award which, if included, would increase the level to 60.1%. Together with our Project NEON workload, this gives us confidence for the year ahead. We see stable market conditions ahead, while federal funding remains uncertain. The agreement reached on a five-year Transportation Bill should provide greater pipeline visibility, although no material impact is expected until after the forthcoming presidential election. Looking forward, the benefits from our simplified organisational structure are expected to deliver improved efficiency and we believe this, coupled with volume growth, will drive margin improvement.
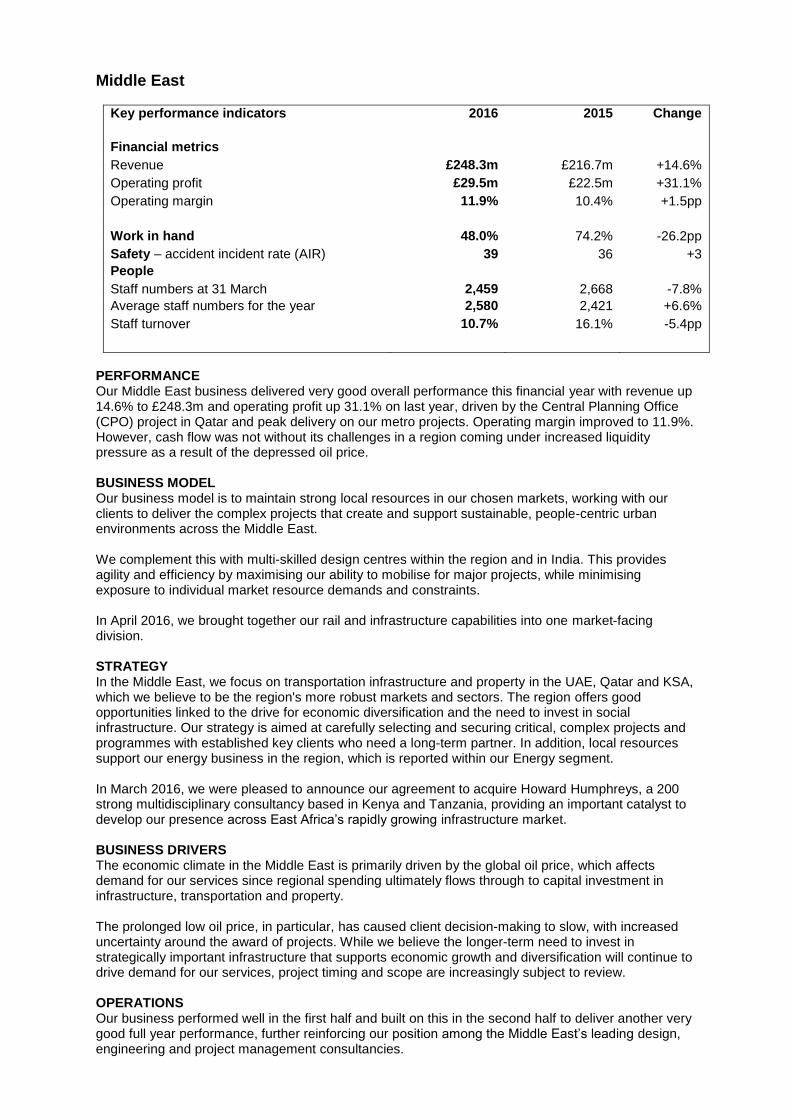
Middle East
Key performance indicators 2016 2015 Change
Financial metrics
Revenue £248.3m £216.7m +14.6%
Operating profit £29.5m £22.5m +31.1%
Operating margin 11.9% 10.4% +1.5pp
Work in hand 48.0% 74.2% -26.2pp
Safety – accident incident rate (AIR) 39 36 +3
People
Staff numbers at 31 March 2,459 2,668 -7.8%
Average staff numbers for the year 2,580 2,421 +6.6%
Staff turnover 10.7% 16.1% -5.4pp
PERFORMANCE Our Middle East business delivered very good overall performance this financial year with revenue up 14.6% to £248.3m and operating profit up 31.1% on last year, driven by the Central Planning Office (CPO) project in Qatar and peak delivery on our metro projects. Operating margin improved to 11.9%. However, cash flow was not without its challenges in a region coming under increased liquidity pressure as a result of the depressed oil price. BUSINESS MODEL Our business model is to maintain strong local resources in our chosen markets, working with our clients to deliver the complex projects that create and support sustainable, people-centric urban environments across the Middle East. We complement this with multi-skilled design centres within the region and in India. This provides agility and efficiency by maximising our ability to mobilise for major projects, while minimising exposure to individual market resource demands and constraints. In April 2016, we brought together our rail and infrastructure capabilities into one market-facing division. STRATEGY In the Middle East, we focus on transportation infrastructure and property in the UAE, Qatar and KSA, which we believe to be the region's more robust markets and sectors. The region offers good opportunities linked to the drive for economic diversification and the need to invest in social infrastructure. Our strategy is aimed at carefully selecting and securing critical, complex projects and programmes with established key clients who need a long-term partner. In addition, local resources support our energy business in the region, which is reported within our Energy segment. In March 2016, we were pleased to announce our agreement to acquire Howard Humphreys, a 200 strong multidisciplinary consultancy based in Kenya and Tanzania, providing an important catalyst to develop our presence across East Africa’s rapidly growing infrastructure market. BUSINESS DRIVERS The economic climate in the Middle East is primarily driven by the global oil price, which affects demand for our services since regional spending ultimately flows through to capital investment in infrastructure, transportation and property. The prolonged low oil price, in particular, has caused client decision-making to slow, with increased uncertainty around the award of projects. While we believe the longer-term need to invest in strategically important infrastructure that supports economic growth and diversification will continue to drive demand for our services, project timing and scope are increasingly subject to review. OPERATIONS Our business performed well in the first half and built on this in the second half to deliver another very good full year performance, further reinforcing our position among the Middle East’s leading design, engineering and project management consultancies.
Delivery continues on the design of our major metro projects, including Riyadh Metro and Doha Metro, positioning us well for any future metro opportunities in the region. Property sector activity in the UAE remains focused primarily on expanding Dubai’s offering to visitors and residents, especially where linked to the hosting of Expo 2020. Our current projects include the Dubai Opera, which is scheduled to open later in 2016. We also secured the design and supervision of a 95,000 m² extension to a Dubai shopping mall for a large retail development client, while in Abu Dhabi we have been awarded the design of a new residential community for up to 16,000 people. In Qatar, we are working with the Government towards meeting its National Vision 2030. Our role on the CPO has been completed, with the success of our advisory work having made an important contribution to the coordination of Qatar’s major transport infrastructure programmes. We continue to work on a significant framework to upgrade Doha’s roads and drainage system. In addition to our metro work in KSA, during the year we successfully supported strategic programmes to drive the Kingdom’s long-term economic growth and diversification. The need to prioritise and manage infrastructure investment is leading to advisory services opportunities with public sector clients. Our Faithful+Gould business in the Middle East has had another good year with growth across the UAE and KSA. In the UAE, our focus is on the property sector, with recent appointments for a large mixed use development in Abu Dhabi and as programme manager for Emaar on the Dubai Creek Harbour project. We have also been appointed as project manager on a 100 bed hospital in Dubai. In KSA, we continue to work in conjunction with our Energy colleagues to explore wider opportunities under a new five-year framework agreement with a key client. PEOPLE Headcount fell to 2,459 (2015: 2,668), reflecting the downsizing of our property and infrastructure teams, completion of our work on the CPO and as delays to project awards continued. Staff turnover decreased to 10.7% (2015: 16.1%) across the region. We measure staff engagement through our Group wide Viewpoint employee opinion survey. Our overall engagement score for the Middle East improved by six percentage points year on year, putting us 10 points above the benchmark for our industry sector. This is reinforced by the large proportion of people who indicated in the survey that they are proud to work for Atkins and that they care about our success. During the course of the year, the Middle East women’s professional network continued its engagement internally and is progressively becoming more recognised externally within the region. In addition to providing development opportunities and coaching and mentoring activities to our female employees, we want to attract the best talent in the region and be the employer of choice. We continue to invest in the most important capabilities and behaviours required to deliver our major projects successfully. SAFETY AND SUSTAINABILITY The slight deterioration in our AIR was driven by the reduction in headcount, the number of major accidents was unchanged. We have continued to encourage higher standards of health and safety, presenting Atkins minimum requirements and working with Qatar’s Ministry of Municipality and Urban Planning to improve and standardise accommodation for the local work force. RISKS Certain countries within the Middle East have greater potential for political change. In addition, it is a region where there is an increased risk of payment delays. Our extensive experience of operating in the Middle East over the last 40 years gives us a level of insight into the political environment which, combined with our focused strategy of carefully selecting both the countries in which we operate and our clients, helps us to mitigate political and commercial risks. Further uncertainty around the oil price presents a key risk because of the impact on government spending and the knock-on effect on private sector confidence. Our focus on strategically important projects and programmes gives us some insulation from short-term changes, which partially mitigates this risk.

Construction safety remains an elevated risk in the Middle East. We are mitigating this wherever possible and have been instrumental in creating improved standards for the industry through initiatives such as the Atkins minimum requirements. More detail on the risks that our businesses face can be found in the Principal risks and uncertainties section. OUTLOOK Our order book stands at 48.0% of next year’s budgeted revenue (2015: 74.2%), with the annual reduction reflecting prior year awards of major contracts and the significant challenges faced by the region due to the low oil price. While long-term major project opportunities continue to come to the market, contract awards in the Middle East are expected to remain slow. We are cautious about the outlook for the region, given increased uncertainty on the timing and funding of our pipeline opportunities, particularly in property and infrastructure. Our advisory services team, which now exists within our Atkins Acuity business, are developing plans to participate more actively in the new framework opportunities developed by Faithful+Gould and Energy, where we see good potential for infrastructure support. Activity is now underway to establish the new transport and infrastructure division's strategy and structure in order to respond fully to the needs of clients more effectively and efficiently. The primary focus will be on our core Middle East markets and Africa. The acquisition of Howard Humphreys gives us an excellent platform to develop our presence in Africa, where major investment in transportation, infrastructure and energy is creating demand for multidisciplinary design and consultancy services. We will continue to explore other opportunities to increase our regional footprint.

Asia Pacific
Key performance indicators 2016 2015 Change
Financial metrics
Revenue £106.1m £109.7m -3.3%
Operating profit £8.5m £9.8m -13.3%
Operating margin 8.0% 8.9% -0.9pp
Work in hand 46.1% 49.2% -3.1pp
Safety – accident incident rate (AIR) 209 77 +132
People
Staff numbers at 31 March 1,354 1,523 -11.1%
Average staff numbers for the year 1,448 1,561 -7.2%
Staff turnover 18.7% 12.2% +6.5pp
PERFORMANCE In our Asia Pacific region operating margin was 8.0% on revenue of £106.1m (2015: £109.7m). Our profitability and cash flow performance were impacted by delays to the start of a number of key opportunities and cash receipts from clients beyond agreed contract terms. BUSINESS MODEL We operate predominantly in Hong Kong and mainland China supplemented by a network of offices across Malaysia, Vietnam, Singapore, India and Australia. Using our local knowledge combined with our skills and experience in delivering complex projects around the world, we offer our clients a range of services throughout the entire cycle of urban development. We work in partnership with chosen Chinese contractors and support them both within the region and further afield. Our regional capability in project management has been strengthened, helped by the 2013 acquisition of Confluence, and we draw upon our Group wide expertise to deliver the most technically suitable solutions to our clients. STRATEGY Our strategy of geographic diversification has a focus on urban planning, transport infrastructure and property. Our relationships with Chinese contractors seeking to grow and invest outside their domestic market are progressing. Our presence in the southeast Asian markets is being developed. In Hong Kong, our client base is diversifying and our relationships with internationally renowned contractors is being strengthened through our design and build projects. In mainland China, property market conditions have led to the restructuring and right sizing of our teams. In 2016, architecture, landscape, and urban planning and consultancy were consolidated into a new property business designed to increase operational efficiency and allow a multidisciplinary approach to chosen clients. We will increasingly target state owned enterprises and larger developers who have the financial capability to take major projects forward. Opportunities to expand our Atkins Acuity advisory role across the region, but particularly in southeast Asia, are increasing as strategic partnerships are formed with engineering companies and contractors to secure higher value opportunities. BUSINESS DRIVERS Our growth potential in the region is underpinned by the scale of urbanisation driving both government spending and the rate of private sector investment. Outside Asia Pacific, good business opportunities exist for the Group as a whole as major Chinese companies invest in large scale infrastructure development projects outside their domestic market. OPERATIONS In Hong Kong, the largest part of our Asia Pacific business, the political situation appears to be stabilising following the anti-Government protests of late 2014. We have continued to bid for major new government contracts but are closely monitoring a slowdown in the rate of funding approval and increased competition.
We see progress in diversifying our service offering to our major clients. We have won a design consultancy contract for Hong Kong International Airport for advance modification works on the airport taxiway network to facilitate future aircraft movements during the initial construction phase of the new third runway. Our Hong Kong office is increasing its exploration of outbound projects including opportunities in Indonesia and Vietnam. We are providing the transit oriented development masterplan along the new Jakarta-Bandung high speed rail corridor, Indonesia's first high speed rail project. In mainland China, the property market slowdown has continued and opportunities for our property team to work together with local design institutes are being investigated. In mainland China, while we welcome the Government programme of anti-corruption measures it continues to slow down the release and award of projects which is impacting our workloads and has led to resource adjustments. We were appointed recently to provide support to Prasarana in a client advisory role on the delivery of its LRT3 light railway project in Kuala Lumpur, Malaysia. Our overseas work with Chinese contractors includes support to China Merchant and Djibouti Ports and Free Zones Authority on a feasibility study for a port oriented free trade zone investment in Djibouti, where the downstream masterplan work was secured. Work with China Communications Construction Company and its subsidiaries on a number of outbound opportunities in the UK, Asia, Africa and the Middle East is ongoing. We are supporting a number of contractors in Africa and the UK to assist in securing construction contracts and investment prospects in the transport, property and energy sectors. In southeast Asia, two new city development contracts were secured with Vingroup and Sands Corporation has appointed us as lead consultant for projects at Marina Bay Sands in Singapore. Our Faithful+Gould business had another good year, with its role as engineering project manager on the Formula 1 Singapore Grand Prix and a strong pharmaceutical and manufacturing sector workload. Recent wins include a large-scale retail development in Malaysia, luxury retail stores in Macau and premium brand hotel projects in Singapore and India. While economic growth has slowed in China, we continue to see opportunities in the manufacturing and hospitality sectors. PEOPLE Overall headcount in our Asia Pacific region decreased in the year to 1,354 (2015: 1,523) primarily as a result of actions taken to restructure and resize our team in mainland China. Staff turnover has increased to 18.7% (2015: 12.2%). In November 2015, the Asia Pacific women’s professional network was launched with the mandate to promote gender diversity in the workplace and engage and encourage female staff in their professional development. Our employment approach has helped attract and retain female employees and they now account for 38% of the overall headcount. Over 37% of all our new hires for graduate engineer positions, outside Faithful+Gould, were women. In our global design centres (GDC), 23% (2015: 20%) of the workforce and 16% of our overall graduate engineers hired are female. SAFETY AND SUSTAINABILITY AIR has increased in Asia Pacific partly reflecting three reportable accidents compared with two last year. RISKS During the financial year, the welcome anti-corruption measures introduced previously in mainland China resulted in increased risk for our business as contract awards were delayed. We continue to monitor developments closely and to take appropriate action regarding resourcing. Expanding our footprint across the region brings increased risks such as lack of commercial transparency, political instability and risks associated with operating within unfamiliar regulatory, tax and employment regimes. We undertake research into both the market and specific clients, as well as using professional advisors to assist with legal and regulatory compliance. Risks are discussed in more detail in the Principal risks and uncertainties section.

OUTLOOK Our order book stands at 46.1% of next year’s budgeted revenue (2015: 49.2%).The political situation in Hong Kong is stabilising, however delayed approval of funding continues to impact our pipeline of work. The slowdown in mainland China is expected to continue and our aim is to improve operational efficiency with the formation of the new property division. We see increasing opportunities for Atkins Acuity to provide advisory work in the region.
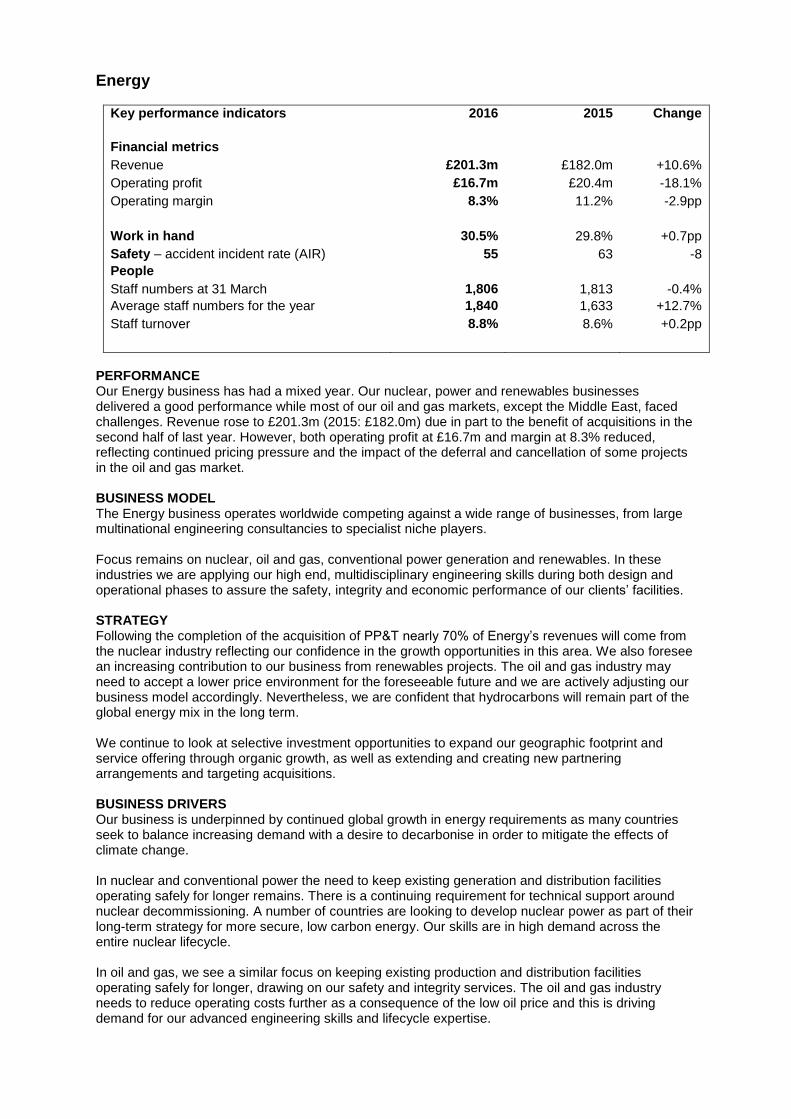
Energy
Key performance indicators 2016 2015 Change
Financial metrics
Revenue £201.3m £182.0m +10.6%
Operating profit £16.7m £20.4m -18.1%
Operating margin 8.3% 11.2% -2.9pp
Work in hand 30.5% 29.8% +0.7pp
Safety – accident incident rate (AIR) 55 63 -8
People
Staff numbers at 31 March 1,806 1,813 -0.4%
Average staff numbers for the year 1,840 1,633 +12.7%
Staff turnover 8.8% 8.6% +0.2pp
PERFORMANCE Our Energy business has had a mixed year. Our nuclear, power and renewables businesses delivered a good performance while most of our oil and gas markets, except the Middle East, faced challenges. Revenue rose to £201.3m (2015: £182.0m) due in part to the benefit of acquisitions in the second half of last year. However, both operating profit at £16.7m and margin at 8.3% reduced, reflecting continued pricing pressure and the impact of the deferral and cancellation of some projects in the oil and gas market. BUSINESS MODEL The Energy business operates worldwide competing against a wide range of businesses, from large multinational engineering consultancies to specialist niche players. Focus remains on nuclear, oil and gas, conventional power generation and renewables. In these industries we are applying our high end, multidisciplinary engineering skills during both design and operational phases to assure the safety, integrity and economic performance of our clients’ facilities. STRATEGY Following the completion of the acquisition of PP&T nearly 70% of Energy’s revenues will come from the nuclear industry reflecting our confidence in the growth opportunities in this area. We also foresee an increasing contribution to our business from renewables projects. The oil and gas industry may need to accept a lower price environment for the foreseeable future and we are actively adjusting our business model accordingly. Nevertheless, we are confident that hydrocarbons will remain part of the global energy mix in the long term. We continue to look at selective investment opportunities to expand our geographic footprint and service offering through organic growth, as well as extending and creating new partnering arrangements and targeting acquisitions. BUSINESS DRIVERS Our business is underpinned by continued global growth in energy requirements as many countries seek to balance increasing demand with a desire to decarbonise in order to mitigate the effects of climate change. In nuclear and conventional power the need to keep existing generation and distribution facilities operating safely for longer remains. There is a continuing requirement for technical support around nuclear decommissioning. A number of countries are looking to develop nuclear power as part of their long-term strategy for more secure, low carbon energy. Our skills are in high demand across the entire nuclear lifecycle. In oil and gas, we see a similar focus on keeping existing production and distribution facilities operating safely for longer, drawing on our safety and integrity services. The oil and gas industry needs to reduce operating costs further as a consequence of the low oil price and this is driving demand for our advanced engineering skills and lifecycle expertise.

OPERATIONS Nuclear We have a robust, broad-based nuclear portfolio that is performing well. In the UK, our position in the nuclear new build market remains strong. In line with our strategy, engineering and related technical services are provided to EDF Energy, Horizon Nuclear Power and NuGen for a new generation of nuclear power stations in the UK. We have recently finished our commission for the UK Government on the techno-economic assessment and are positioning to take a leading role as engineering partner for the future development of small modular reactors. Following the successful conclusion of termination negotiations and the demobilisation of the Silos Direct-encapsulation Plant project, additional decommissioning work at Sellafield was secured. Our joint venture with AREVA and Doosan has been appointed to Sellafield’s decommissioning delivery partnership under a framework agreement which is expected to run for 10 years and involves decommissioning and maintenance work on a broad range of facilities. We are busy on existing nuclear generation and life extension work through our role as an EDF Energy UK Strategic Supply Chain Partner. We see significant opportunities in North America and other markets outside the UK and continue to expand the international portfolio of our nuclear business. A broad range of services are provided to the Emirates Nuclear Energy Corporation in the Middle East on the £20bn Barakah New Nuclear Programme and to the €15bn International Thermonuclear Experimental Reactor programme in the south of France. Our international footprint in nuclear was significantly enhanced in April 2016 when, following US Government regulatory clearance, we completed our acquisition of PP&T, which designs solutions for the treatment and stabilisation of high, intermediate and low level nuclear waste. This positions us well across all tiers of the international decommissioning and waste management market. Oil and gas The performance of our oil and gas business continues to be mixed. A further deterioration in trading conditions, particularly in our North American business, was offset to some extent by growth in the Middle East. In the UK, we continue to see focus on keeping existing production and distribution facilities operating safely for longer, which is drawing on our safety and integrity services. In line with the industry as a whole, we remain cautious and continue to monitor productivity closely, while delivering both consultancy and design services under our long-term framework agreements with major international oil and gas operators. Our Middle East oil and gas business has doubled in size during the year and is seeking to establish a new joint venture in KSA. Further expansion has been achieved in the UAE and Qatar with design and consultancy services for ADNOC and Qatar Petroleum. Our relationship with Shanghai Electric Power to deliver projects to Aramco has been extended to include the design of a third gas compressor booster station, as well as securing the design of a major pipeline project with Saudi Kad. Working in collaboration with our Faithful+Gould colleagues, a major contract has been secured with a key client in KSA to support the execution of capital projects as part of a five-year framework, covering project management services for major pipelines and a wide range of projects. Our portfolio of work in the international liquefied natural gas (LNG) market is expanding. Building on our ongoing relationship with Shell, we were appointed to develop asset integrity models for future inspection and maintenance of its Prelude FLNG project, the largest floating LNG project in the world. Work on the INPEX-operated Ichthys LNG project is ongoing and we act as technical advisor and engineering designers on Singapore’s LNG terminal as part of a five-year engineering services agreement. Power Our power division had a very strong year, trading above our expectations. Our renewables business has further strengthened its position in the UK offshore wind market. We are currently one of the largest suppliers of engineering work in this market and are at the forefront of driving innovative design for floating offshore wind to maximise energy yield for clients in this fast-moving sector. In February 2016, the Swedish company Hexicon appointed us as engineering partner for its innovative multi-turbine offshore wind floating platform to be deployed off the north coast of Scotland.
In 2015, Seaway Heavy Lifting appointed us to design the jacket foundations for the 664MW Beatrice offshore wind farm. We are also designing eight offshore substation platforms across four of DONG Energy’s proposed offshore wind farms. Statoil named us as one of three winning companies of the Hywind Installation Challenge innovation campaign for the design of a novel assembly and installation concept for floating structures. We were involved as an official advisor to DECC for their energy storage competition programme which supported UK businesses to develop and demonstrate innovative energy storage technologies. In November 2015, Stoke-on-Trent City Council appointed us as primary project consultant to deliver a ground-breaking new low carbon district heating network for the city. Our presence in the Middle East has been increased with the award by Hyundai Engineering and Construction to provide engineering design services for the Abu Dhabi Water & Electricity Authority Mirfa independent water and power project. We have also been appointed to support the design and implementation of Dubai Airport’s energy management programme. As well as building our pipeline in the Middle East, our role supporting China Light and Power in Hong Kong is expanding as it looks at options to extend the life of its generating assets. PEOPLE Headcount decreased slightly to 1,806 (2015: 1,813), with the reduced workload in our UK and US oil and gas businesses being offset by organic growth of our nuclear, power and Middle East oil and gas businesses. Staff turnover has remained steady at 8.8% (2015: 8.6%). We measure employee engagement through our Group wide Viewpoint employee opinion survey. Our overall engagement score for Energy remains significantly better than the benchmark for our industry sector. Our popular Energising Your Career course supports the development of our mid-career staff by helping employees to consider their future career development in an informed manner; 130 staff have now attended. During the year it was adopted into the Group’s corporate curriculum for use by the wider business. We will work to increase the proportion of female employees and offer a range of flexible working options to help us both recruit and retain staff. We implemented a programme to support women returning to work after maternity leave in 2015 which has now been extended to other UK-based female employees. SAFETY AND SUSTAINABILITY The improvement in the AIR result is due to the increase in headcount during the year with no decrease in reportable accidents. We are helping society to make the transition to a low carbon economy through our work on a wide range of low carbon enabling technologies such as nuclear, offshore wind, tidal, carbon capture and storage, and biomass. We also help to ensure that extraction of the world’s remaining oil and gas reserves respects both life and the wider environment. RISKS Continuing deterioration of the oil price is a key risk for Energy. During the year mitigating action was taken by reducing headcount and our overall cost base. We continue to address productivity and rebalance the business to meet demand. The safety, environmental and reputational consequences of an error in our work, given the high hazard nature of the facilities on which we work, is another key risk. As with any acquisition, there is the potential risk of a failure to integrate the acquired PP&T business into Atkins which could lead to a loss of shareholder value with expected benefits and synergies not achieved. This risk is mitigated by thorough due diligence ahead of acquisition, a detailed integration plan compiled in conjunction with the acquired business and well-resourced implementation plan, with progress against the plan fed back regularly to the Board.
Our plans for growth are potentially affected by the availability of skills in the right locations. To mitigate this risk we continue to invest in our in-house training academy that now provides externally recognised courses. This year over 300 people were welcomed onto these courses. For more information on the risks that our businesses face and the actions we are taking see the Principal risks and uncertainties section. OUTLOOK Our secured work in hand is 30.5% (2015: 29.8%) of next year’s budgeted revenue, which excludes PP&T’s work in hand. The outlook for our Energy business overall remains positive, with the fundamental drivers for growth unchanged as the world’s requirement for energy continues to increase. We continue to seek ways to grow the business organically, while also exploring further acquisition opportunities. Despite difficult trading conditions in the oil and gas market, we believe we are well positioned for the medium and longer term. We are adapting to a more cost conscious oil and gas market and are seeking further opportunities to leverage our skills in LNG and floating structures. We see significant opportunity for growth in nuclear across new build, maintenance and decommissioning supported by our acquisition of PP&T with its proven track record in the management of Tier 1 nuclear licensed sites. The outlook for power is positive and we will continue to internationalise the business while expanding our renewable energy portfolio.
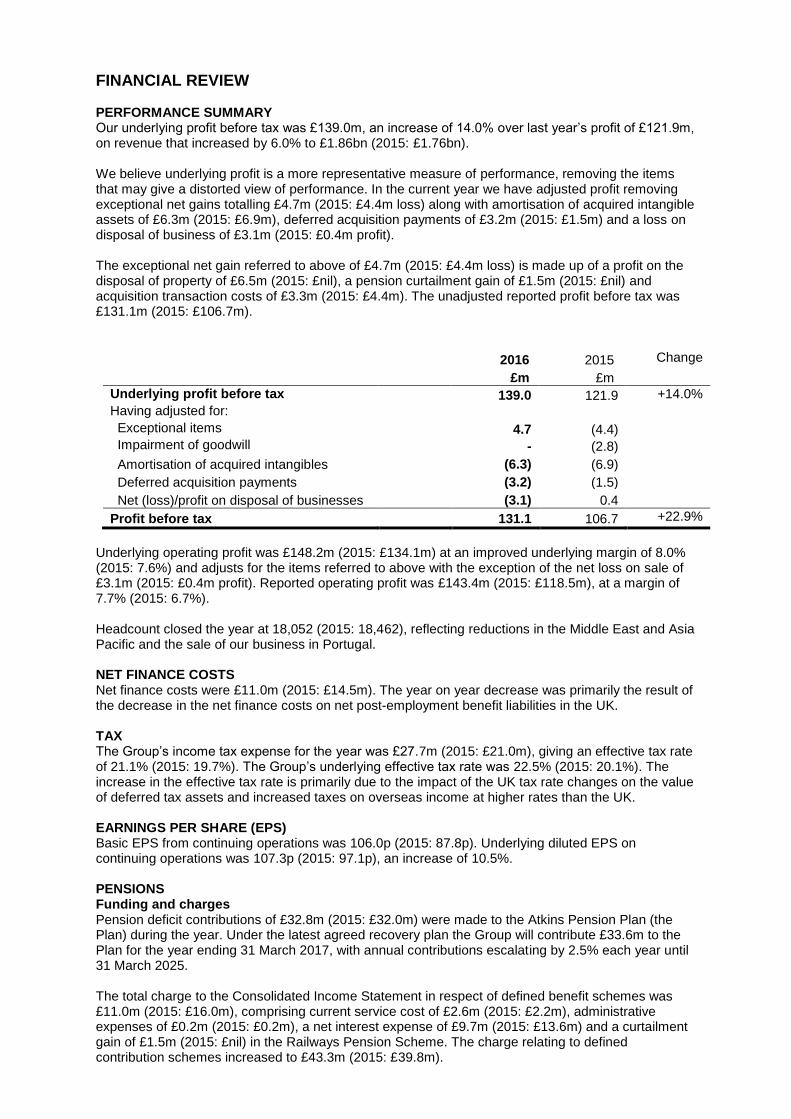
FINANCIAL REVIEW PERFORMANCE SUMMARY Our underlying profit before tax was £139.0m, an increase of 14.0% over last year’s profit of £121.9m, on revenue that increased by 6.0% to £1.86bn (2015: £1.76bn). We believe underlying profit is a more representative measure of performance, removing the items that may give a distorted view of performance. In the current year we have adjusted profit removing exceptional net gains totalling £4.7m (2015: £4.4m loss) along with amortisation of acquired intangible assets of £6.3m (2015: £6.9m), deferred acquisition payments of £3.2m (2015: £1.5m) and a loss on disposal of business of £3.1m (2015: £0.4m profit). The exceptional net gain referred to above of £4.7m (2015: £4.4m loss) is made up of a profit on the disposal of property of £6.5m (2015: £nil), a pension curtailment gain of £1.5m (2015: £nil) and acquisition transaction costs of £3.3m (2015: £4.4m). The unadjusted reported profit before tax was £131.1m (2015: £106.7m).
2016 2015 Change
£m £m
Underlying profit before tax 139.0 121.9 +14.0%
Having adjusted for:
Exceptional items 4.7 (4.4)
Impairment of goodwill - (2.8)
Amortisation of acquired intangibles (6.3) (6.9)
Deferred acquisition payments (3.2) (1.5)
Net (loss)/profit on disposal of businesses (3.1) 0.4
Profit before tax 131.1 106.7 +22.9%
Underlying operating profit was £148.2m (2015: £134.1m) at an improved underlying margin of 8.0% (2015: 7.6%) and adjusts for the items referred to above with the exception of the net loss on sale of £3.1m (2015: £0.4m profit). Reported operating profit was £143.4m (2015: £118.5m), at a margin of 7.7% (2015: 6.7%). Headcount closed the year at 18,052 (2015: 18,462), reflecting reductions in the Middle East and Asia Pacific and the sale of our business in Portugal. NET FINANCE COSTS Net finance costs were £11.0m (2015: £14.5m). The year on year decrease was primarily the result of the decrease in the net finance costs on net post-employment benefit liabilities in the UK. TAX The Group’s income tax expense for the year was £27.7m (2015: £21.0m), giving an effective tax rate of 21.1% (2015: 19.7%). The Group’s underlying effective tax rate was 22.5% (2015: 20.1%). The increase in the effective tax rate is primarily due to the impact of the UK tax rate changes on the value of deferred tax assets and increased taxes on overseas income at higher rates than the UK. EARNINGS PER SHARE (EPS) Basic EPS from continuing operations was 106.0p (2015: 87.8p). Underlying diluted EPS on continuing operations was 107.3p (2015: 97.1p), an increase of 10.5%. PENSIONS Funding and charges Pension deficit contributions of £32.8m (2015: £32.0m) were made to the Atkins Pension Plan (the Plan) during the year. Under the latest agreed recovery plan the Group will contribute £33.6m to the Plan for the year ending 31 March 2017, with annual contributions escalating by 2.5% each year until 31 March 2025. The total charge to the Consolidated Income Statement in respect of defined benefit schemes was £11.0m (2015: £16.0m), comprising current service cost of £2.6m (2015: £2.2m), administrative expenses of £0.2m (2015: £0.2m), a net interest expense of £9.7m (2015: £13.6m) and a curtailment gain of £1.5m (2015: £nil) in the Railways Pension Scheme. The charge relating to defined contribution schemes increased to £43.3m (2015: £39.8m).
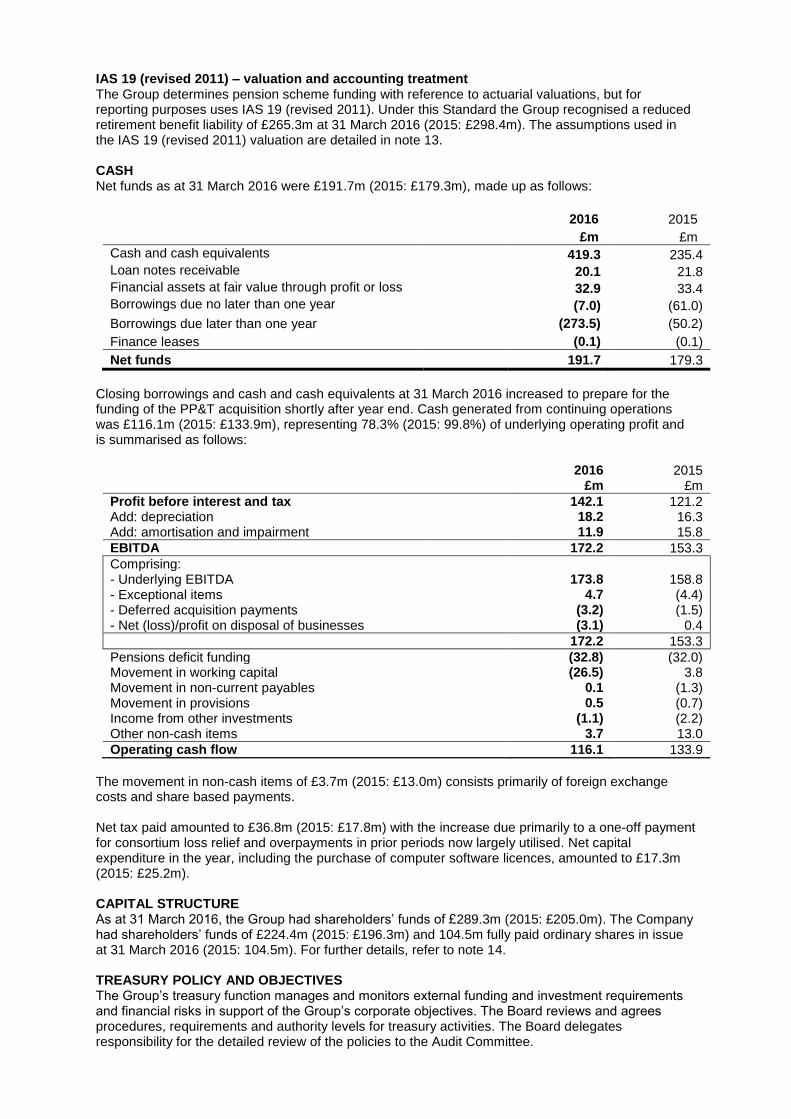
IAS 19 (revised 2011) – valuation and accounting treatment The Group determines pension scheme funding with reference to actuarial valuations, but for reporting purposes uses IAS 19 (revised 2011). Under this Standard the Group recognised a reduced retirement benefit liability of £265.3m at 31 March 2016 (2015: £298.4m). The assumptions used in the IAS 19 (revised 2011) valuation are detailed in note 13. CASH Net funds as at 31 March 2016 were £191.7m (2015: £179.3m), made up as follows:
2016 2015
£m £m
Cash and cash equivalents 419.3 235.4 Loan notes receivable 20.1 21.8 Financial assets at fair value through profit or loss 32.9 33.4 Borrowings due no later than one year (7.0) (61.0)
Borrowings due later than one year (273.5) (50.2)
Finance leases (0.1) (0.1)
Net funds 191.7 179.3
Closing borrowings and cash and cash equivalents at 31 March 2016 increased to prepare for the funding of the PP&T acquisition shortly after year end. Cash generated from continuing operations was £116.1m (2015: £133.9m), representing 78.3% (2015: 99.8%) of underlying operating profit and is summarised as follows:
2016 2015 £m £m
Profit before interest and tax 142.1 121.2 Add: depreciation 18.2 16.3 Add: amortisation and impairment 11.9 15.8
EBITDA 172.2 153.3
Comprising: - Underlying EBITDA 173.8 158.8 - Exceptional items 4.7 (4.4) - Deferred acquisition payments (3.2) (1.5) - Net (loss)/profit on disposal of businesses (3.1) 0.4
172.2 153.3
Pensions deficit funding (32.8) (32.0) Movement in working capital (26.5) 3.8 Movement in non-current payables 0.1 (1.3) Movement in provisions 0.5 (0.7) Income from other investments (1.1) (2.2) Other non-cash items 3.7 13.0
Operating cash flow 116.1 133.9
The movement in non-cash items of £3.7m (2015: £13.0m) consists primarily of foreign exchange costs and share based payments. Net tax paid amounted to £36.8m (2015: £17.8m) with the increase due primarily to a one-off payment for consortium loss relief and overpayments in prior periods now largely utilised. Net capital expenditure in the year, including the purchase of computer software licences, amounted to £17.3m (2015: £25.2m). CAPITAL STRUCTURE As at 31 March 2016, the Group had shareholders’ funds of £289.3m (2015: £205.0m). The Company had shareholders’ funds of £224.4m (2015: £196.3m) and 104.5m fully paid ordinary shares in issue at 31 March 2016 (2015: 104.5m). For further details, refer to note 14. TREASURY POLICY AND OBJECTIVES The Group’s treasury function manages and monitors external funding and investment requirements and financial risks in support of the Group’s corporate objectives. The Board reviews and agrees procedures, requirements and authority levels for treasury activities. The Board delegates responsibility for the detailed review of the policies to the Audit Committee.
The Group’s financial instruments, other than derivatives, comprise borrowings, cash and liquid resources and various items, such as trade receivables and trade payables, which arise directly from its operations. The main purpose of these financial instruments is to finance the Group’s activities. The Group also enters into derivative transactions, principally forward foreign currency contracts to manage foreign exchange risk on material commercial transactions undertaken in currencies other than the local functional currency. The main risks arising from the Group’s financial instruments are market risk (including foreign exchange risk, interest rate risk and price risk), credit risk and liquidity risk. The Group’s exposures to and management of each of the main risks, together with sensitivities and risk concentrations, are described in more detail in note 20 to the Financial Statements which will be available on our website. The Group funds its ongoing activities through cash generated from its operations and, where necessary, borrowings and finance leases. The Group’s debt facilities are described in note 27 to the Financial Statements. Utilisation of the Group’s facilities is a consequence of prior and current year acquisitions and ongoing organic growth. As at 31 March 2016, the Group had £71.9m of undrawn committed borrowing facilities available (2015: £138.1m). There have been no significant changes to the Group’s treasury procedures, requirements and authority levels during the year. CRITICAL ACCOUNTING POLICIES The Group’s principal accounting policies are described in note 1 to the Financial Statements which will be available on our website www.atkinsglobal.com. The Financial Statements for the year ended 31 March 2016 have been prepared under International Financial Reporting Standards (IFRSs) as adopted by the European Union. The preparation of financial statements in conformity with generally accepted accounting principles requires the use of estimates and assumptions that affect the reported amounts of assets and liabilities at the date of the financial statements and the reported amounts of revenues and expenses during the reporting period. Although these estimates are based on management’s best knowledge of the amount, event or actions, actual results may ultimately differ from those estimates. Material estimates applied across the Group’s businesses and joint ventures are reviewed to a common standard and adjusted where appropriate to ensure that consistent treatment of similar and related issues that require judgement is achieved upon consolidation. Any revisions to estimates are recognised prospectively. The accounting policies and areas that require the most significant estimates and judgements to be used in the preparation of the Financial Statements are in relation to contract accounting, including recoverability of receivables, goodwill impairment, defined benefit pension schemes, tax, research and development, and joint arrangements. Contract accounting The Group's contract accounting policy is central to how the Group values the work it has carried out in each financial year. This policy requires forecasts to be made on the projected outcomes of projects. These forecasts require assessments and judgements to be made on changes in, for example, work scope, changes in costs and costs to completion. While the assumptions made are based on professional judgements, subsequent events may mean that estimates calculated prove to be inaccurate, with a consequent effect on the reported results. Goodwill impairment Goodwill is subject to impairment review both annually and when there are indications that the carrying value may not be recoverable. The carrying value of goodwill is compared to the recoverable amount, which is the higher of the value in use and fair value less costs to sell. For the purpose of impairment testing, goodwill acquired in a business combination is allocated to each of the cash-generating units (CGUs), or groups of CGUs, that is expected to benefit from the synergies of the combination. Each CGU or group of CGUs to which the goodwill is allocated represents the lowest level within the entity at which goodwill is monitored for internal management purposes.

Determining whether goodwill is impaired requires an estimation of the value in use of CGUs to which the goodwill has been allocated. The value in use calculation requires an estimate to be made of the timing and amount of future cash flows expected to arise from the CGU and the application of a suitable discount rate to calculate the present value. The discount rates used are based on the Group's weighted average cost of capital adjusted to reflect the specific economic environment of the relevant CGU. Defined benefit pension schemes Accounting for pensions involves judgement about uncertain events in the future such as inflation, salary levels at retirement, longevity rates, rates of return on plan assets and discount rates. Assumptions in respect of pensions and post-employment benefits are set after consultation with independent qualified actuaries. Management believes the assumptions are appropriate. However, a change in the assumptions used would have an impact on the Group’s results and net assets. Any differences between the assumptions and the actual outcome will affect results in future years. An estimate of the sensitivity to changes in key assumptions is disclosed in note 13. Tax The Group is subject to tax in a number of jurisdictions and judgement is required in determining the Group wide provision for income taxes. The Group provides for potential liabilities in respect of uncertain tax positions where additional tax may become payable in future periods and such provisions are based on management’s assessment of exposures. Deferred tax is accounted for on temporary differences using the liability method, with deferred tax liabilities being provided for in full and deferred tax assets being recognised only to the extent that it is judged probable that future taxable profits will arise against which the temporary differences can be utilised. Research and development All R&D expenditure is written off to the Consolidated Income Statement as incurred. In the UK, the Group adopted the research and development expenditure credit regime with effect from 1 April 2013. These credits have characteristics more akin to government grants than income taxes and therefore are offset against the relevant expenditure in the income statement rather than via the tax charge. The credits are recognised to the extent that there is reasonable assurance that they will be received, albeit that the claim process takes place sometime after the original expenditure was incurred. In the balance sheet, the credit receivable reduces the overall current tax payable for the Group. Joint arrangements The Group applies IFRS 11 to all joint arrangements. Under IFRS 11 a joint arrangement is an arrangement over which two or more parties have joint control. Joint control is the contractually agreed sharing of control of an arrangement, which exists only when decisions about the relevant activities require the unanimous consent of the parties sharing control. The Group classifies its interests in joint arrangements as either joint ventures or joint operations. The Group holds 50% of the voting rights in some of its joint arrangements. However, the Group has joint control over these arrangements as under the respective contractual agreements unanimous consent is required from all parties to the agreements for all relevant activities. These joint arrangements are not structured through separate legal entities and the terms of the arrangements provide the Group and the other parties to the arrangements with the rights to the assets and obligations for the liabilities, or other facts and circumstances indicate this is the case. Therefore, these arrangements are classified as joint operations of the Group.
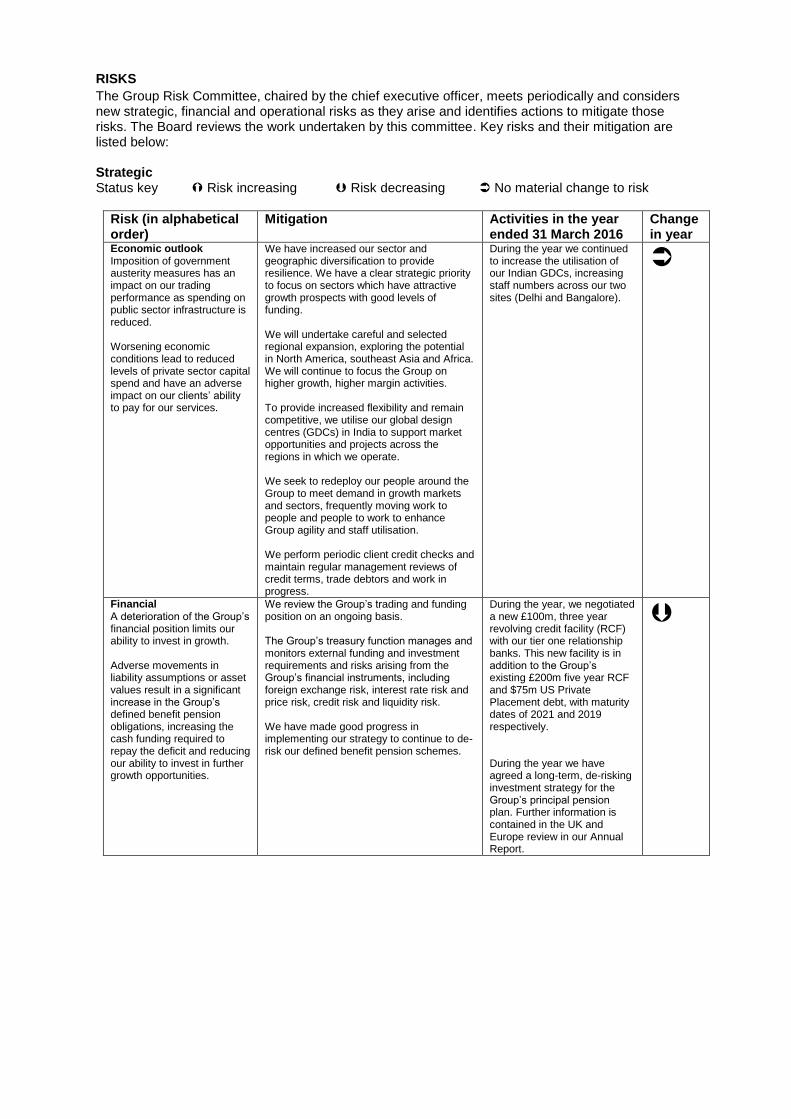
RISKS
The Group Risk Committee, chaired by the chief executive officer, meets periodically and considers new strategic, financial and operational risks as they arise and identifies actions to mitigate those risks. The Board reviews the work undertaken by this committee. Key risks and their mitigation are listed below: Strategic Status key Risk increasing Risk decreasing No material change to risk
Risk (in alphabetical order)
Mitigation Activities in the year ended 31 March 2016
Change in year
Economic outlook Imposition of government austerity measures has an impact on our trading performance as spending on public sector infrastructure is reduced. Worsening economic conditions lead to reduced levels of private sector capital spend and have an adverse impact on our clients’ ability to pay for our services.
We have increased our sector and geographic diversification to provide resilience. We have a clear strategic priority to focus on sectors which have attractive growth prospects with good levels of funding. We will undertake careful and selected regional expansion, exploring the potential in North America, southeast Asia and Africa. We will continue to focus the Group on higher growth, higher margin activities. To provide increased flexibility and remain competitive, we utilise our global design centres (GDCs) in India to support market opportunities and projects across the regions in which we operate. We seek to redeploy our people around the Group to meet demand in growth markets and sectors, frequently moving work to people and people to work to enhance Group agility and staff utilisation. We perform periodic client credit checks and maintain regular management reviews of credit terms, trade debtors and work in progress.
During the year we continued to increase the utilisation of our Indian GDCs, increasing staff numbers across our two sites (Delhi and Bangalore).
Financial A deterioration of the Group’s financial position limits our ability to invest in growth. Adverse movements in liability assumptions or asset values result in a significant increase in the Group’s defined benefit pension obligations, increasing the cash funding required to repay the deficit and reducing our ability to invest in further growth opportunities.
We review the Group’s trading and funding position on an ongoing basis. The Group’s treasury function manages and monitors external funding and investment requirements and risks arising from the Group’s financial instruments, including foreign exchange risk, interest rate risk and price risk, credit risk and liquidity risk. We have made good progress in implementing our strategy to continue to de-risk our defined benefit pension schemes.
During the year, we negotiated a new £100m, three year revolving credit facility (RCF) with our tier one relationship banks. This new facility is in addition to the Group’s existing £200m five year RCF and $75m US Private Placement debt, with maturity dates of 2021 and 2019 respectively. During the year we have agreed a long-term, de-risking investment strategy for the Group’s principal pension plan. Further information is contained in the UK and Europe review in our Annual Report.

Risk (in alphabetical order)
Mitigation Activities in the year ended 31 March 2016
Change in year
Geopolitical Political instability in the regions within which we operate has a negative impact on our ability to deliver contractual services and receive payment, and endangers the safety of our people. Political transition leads to uncertainty or deadlock delaying government funded programmes.
We are focused on geographies that have more stable trading markets and environments with regional growth resulting from economic diversity, population growth and urbanisation. We monitor closely our operating geographies and markets to identify geopolitical change that could potentially have an impact on the trading conditions for our operating business. We obtain the latest professional risk and security information provided by external organisations before engaging in contracts in new geographies and we monitor regularly the economic stability and the security of the markets in which we continue to trade. The operational leadership team and senior management review periodically geopolitical influences that have the potential to affect the economic and safety environment in our operating geographies and markets.
During the year we continued to develop the security and safety standard for our staff when working in low, medium and high risk geographies.
Market Worsening market conditions, for example a fall in commodity prices or a shift in industry demand, lead to changes in contracts resulting in increased risk transfer from clients and a need to accept more onerous contract terms to win work. Reductions in the amount of available work through client delays or cancellations, together with reduced win rates from increased competition, result in insufficient work for our people.
We have robust, integrated online service delivery review processes, which include risk classification, peer reviews and Group authority approvals during the key stages of bidding work, entering into contracts and during delivery of our projects. We continue to embed our integrated online service delivery process across the Group. We continue to focus our strategy on sectors with strong sustainable growth prospects, good levels of funding and higher technical barriers to entry. We have a strategic focus on operational excellence and, through a series of initiatives together with the increasing use of our GDCs in India, we aim to deliver a competitive cost base while also supporting and enabling growth across the Group. We carry out our online service delivery process to ensure it continues to provide a robust standard for winning, delivering and reducing contract and commercial risk across the Group.
During the year we continued to drive operational performance across the Group to improve our margins. This year we successfully implemented the online service delivery process in North America. During the year we took specific action to reduce our resources in our oil and gas business, redeploying elsewhere within the Group where possible to meet demand in other growth markets and sectors in response to reduced demand for our services from a number of our clients as they have responded to the fall in oil prices. We reduced our resource levels in the Middle East property and infrastructure business to reflect reduced demand and delayed awards for our services in these markets.
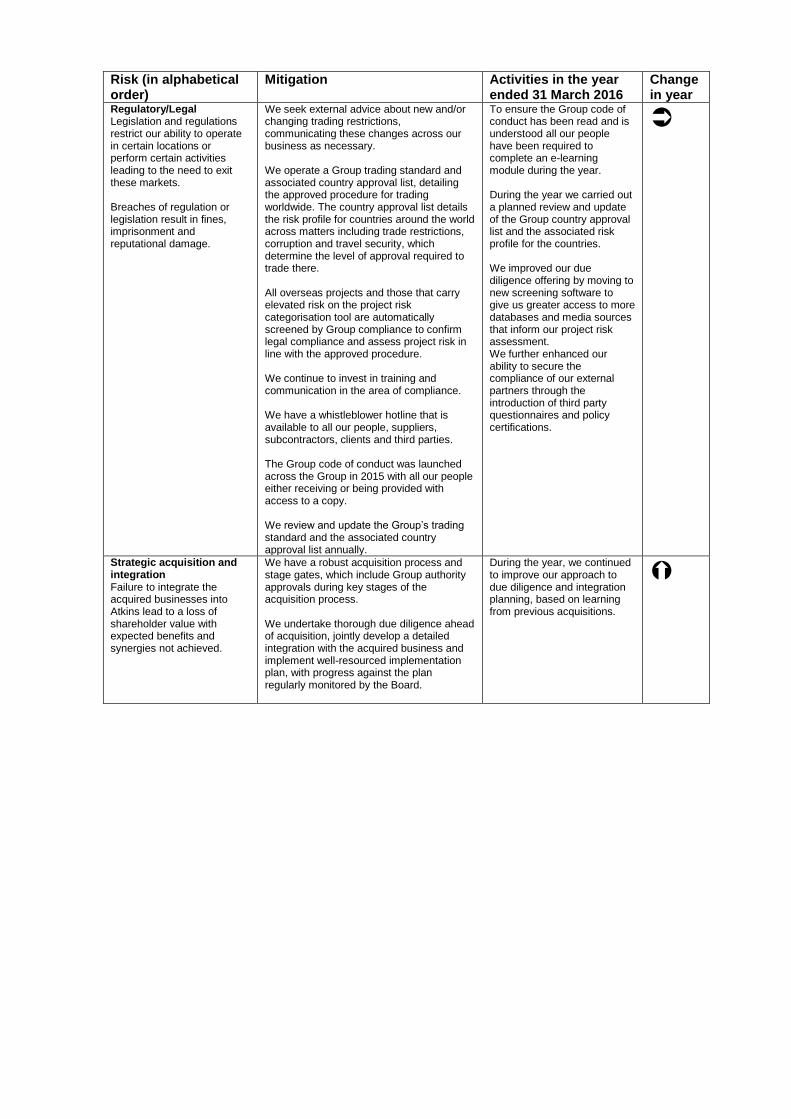
Risk (in alphabetical order)
Mitigation Activities in the year ended 31 March 2016
Change in year
Regulatory/Legal Legislation and regulations restrict our ability to operate in certain locations or perform certain activities leading to the need to exit these markets. Breaches of regulation or legislation result in fines, imprisonment and reputational damage.
We seek external advice about new and/or changing trading restrictions, communicating these changes across our business as necessary. We operate a Group trading standard and associated country approval list, detailing the approved procedure for trading worldwide. The country approval list details the risk profile for countries around the world across matters including trade restrictions, corruption and travel security, which determine the level of approval required to trade there. All overseas projects and those that carry elevated risk on the project risk categorisation tool are automatically screened by Group compliance to confirm legal compliance and assess project risk in line with the approved procedure. We continue to invest in training and communication in the area of compliance. We have a whistleblower hotline that is available to all our people, suppliers, subcontractors, clients and third parties. The Group code of conduct was launched across the Group in 2015 with all our people either receiving or being provided with access to a copy. We review and update the Group’s trading standard and the associated country approval list annually.
To ensure the Group code of conduct has been read and is understood all our people have been required to complete an e-learning module during the year. During the year we carried out a planned review and update of the Group country approval list and the associated risk profile for the countries. We improved our due diligence offering by moving to new screening software to give us greater access to more databases and media sources that inform our project risk assessment. We further enhanced our ability to secure the compliance of our external partners through the introduction of third party questionnaires and policy certifications.
Strategic acquisition and integration Failure to integrate the acquired businesses into Atkins lead to a loss of shareholder value with expected benefits and synergies not achieved.
We have a robust acquisition process and stage gates, which include Group authority approvals during key stages of the acquisition process. We undertake thorough due diligence ahead of acquisition, jointly develop a detailed integration with the acquired business and implement well-resourced implementation plan, with progress against the plan regularly monitored by the Board.
During the year, we continued to improve our approach to due diligence and integration planning, based on learning from previous acquisitions.

Operational Status key Risk increasing Risk decreasing No material change to risk
Risk (in alphabetical order)
Mitigation Activities in the year ended 31 March 2016
Change in year
Crisis event A significant one-off event affecting a key business location, project or our people could interrupt service delivery, threaten life and/or cause reputational damage to our business.
We have a Group crisis management plan in place to enable us to respond quickly to such events. We carry out regular reviews of the Group’s crisis management plan and carry out tests to establish its effectiveness and adequacy. These tests periodically include a simulated exercise of a regional crisis event that was escalated to the Group.
A review of the Group’s crisis management plan was carried out during the year. This included a simulated exercise of a regional crisis event in the Middle East and UK that was escalated to the Group crisis management team.
Health, safety and environmental Shortcomings in our design or works’ supervision result in a health, safety or environmental incident involving our people, clients or other third parties leading to injury, loss of life and/or significant damage to our reputation with all stakeholders.
We have consistent safety standards worldwide, and senior management leadership on health, safety and environmental matters is regularly reinforced via targeted campaigns. Our Group wide behavioural awareness campaign, Safe and Secure by Choice, focuses on the safety behaviours of our employees, highlighting the importance of reporting all health and safety incidents. It supports our commitment to creating a leading health and safety culture and includes sections on personal safety, ability to challenge, driving and near-miss reporting. We mandate accident and near-miss reporting and provide a whistleblower hotline to enable our people, suppliers, subcontractors, clients and other third parties to raise concerns confidentially. We invest in training of and communication to our people about the importance of safety and security in the workplace. We operate a global standard to assess the competency of construction contractors and set the minimum requirements expected on site during the supervision of the services. Atkins has implemented an online operating safely system (AOS), which includes an online risk assessment and enables employees to be tracked while working on site.
During the year we rolled out the AOS system across the Middle East and North America.
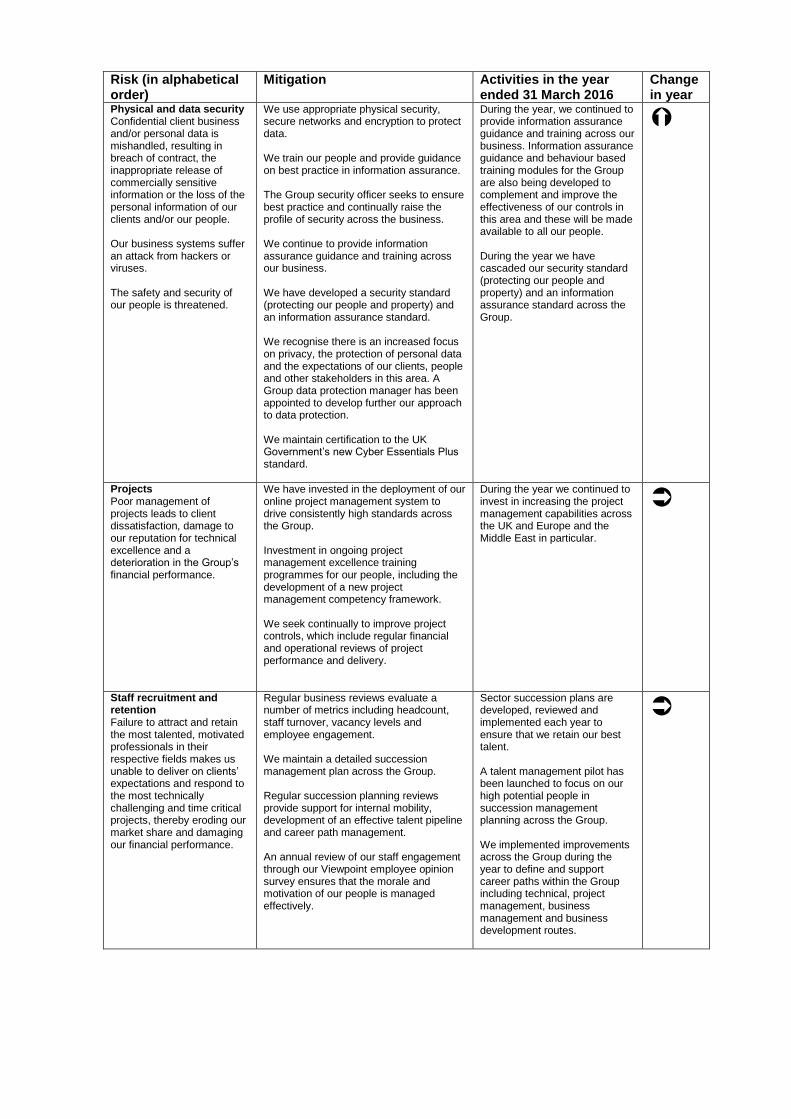
Risk (in alphabetical order)
Mitigation Activities in the year ended 31 March 2016
Change in year
Physical and data security Confidential client business and/or personal data is mishandled, resulting in breach of contract, the inappropriate release of commercially sensitive information or the loss of the personal information of our clients and/or our people. Our business systems suffer an attack from hackers or viruses. The safety and security of our people is threatened.
We use appropriate physical security, secure networks and encryption to protect data. We train our people and provide guidance on best practice in information assurance. The Group security officer seeks to ensure best practice and continually raise the profile of security across the business. We continue to provide information assurance guidance and training across our business. We have developed a security standard (protecting our people and property) and an information assurance standard. We recognise there is an increased focus on privacy, the protection of personal data and the expectations of our clients, people and other stakeholders in this area. A Group data protection manager has been appointed to develop further our approach to data protection. We maintain certification to the UK Government’s new Cyber Essentials Plus standard.
During the year, we continued to provide information assurance guidance and training across our business. Information assurance guidance and behaviour based training modules for the Group are also being developed to complement and improve the effectiveness of our controls in this area and these will be made available to all our people. During the year we have cascaded our security standard (protecting our people and property) and an information assurance standard across the Group.
Projects Poor management of projects leads to client dissatisfaction, damage to our reputation for technical excellence and a deterioration in the Group’s financial performance.
We have invested in the deployment of our online project management system to drive consistently high standards across the Group. Investment in ongoing project management excellence training programmes for our people, including the development of a new project management competency framework. We seek continually to improve project controls, which include regular financial and operational reviews of project performance and delivery.
During the year we continued to invest in increasing the project management capabilities across the UK and Europe and the Middle East in particular.
Staff recruitment and retention Failure to attract and retain the most talented, motivated professionals in their respective fields makes us unable to deliver on clients’ expectations and respond to the most technically challenging and time critical projects, thereby eroding our market share and damaging our financial performance.
Regular business reviews evaluate a number of metrics including headcount, staff turnover, vacancy levels and employee engagement. We maintain a detailed succession management plan across the Group. Regular succession planning reviews provide support for internal mobility, development of an effective talent pipeline and career path management. An annual review of our staff engagement through our Viewpoint employee opinion survey ensures that the morale and motivation of our people is managed effectively.
Sector succession plans are developed, reviewed and implemented each year to ensure that we retain our best talent. A talent management pilot has been launched to focus on our high potential people in succession management planning across the Group. We implemented improvements across the Group during the year to define and support career paths within the Group including technical, project management, business management and business development routes.

Risk (in alphabetical order)
Mitigation Activities in the year ended 31 March 2016
Change in year
Technical delivery Design errors or omissions lead to client dissatisfaction, financial losses and damage to our reputation for technical excellence.
Our robust service delivery process, and the associated stage gate review procedures during the bidding, contracting, delivery and completion stage, ensure that the Group has the capability to deliver the technical requirements within our contracts. We use seven design principles which govern all our technical work and are embedded in our business management system. Technical reviews and checking during delivery of our projects remains a key control. Our technical assurance guidance and standard is included within our business management system. We have implemented a programme of continual technical training and development. ’Network chairs’ lead our technical centres of excellence across the Group. We have established a working group of representatives from all our operating businesses and relevant corporate functions to develop and disseminate best practice regarding technical assurance and governance.
We have continued to develop our standards in project manager competence and electronic data management across all sectors during the year. We continued to cascade our technical assurance standard during the year establishing the minimum assurance requirement for our technical deliverables to our clients in the Group. We also refreshed the technical assurance guidance in our business management system.
Notwithstanding that no new key risks have been identified in the period, we continue to manage a number of potential risks and uncertainties which could have a material impact on our long-term performance. Many of these risks are common to other companies and we assess them to establish the principal risks for the Group. Effective risk management continues to be embedded in our governance framework as set out in the corporate governance section of our Annual Report. GOING CONCERN The directors are required to consider the appropriateness of the going concern assertion in the preparation of the Group’s financial information for the year ended 31 March 2016. The Group meets its day-to-day working capital requirements through cash generated from operations and the use of its banking facilities. The Group has delivered good results and progressed its strategic objectives. It has net funds at 31 March 2016 of £191.7m. In addition, the Group had access to undrawn committed borrowing facilities of £71.9m at 31 March 2016. During the period we negotiated a new £100m, three-year revolving credit facility (RCF) with our tier one relationship banks. This new facility is in addition to the Group’s existing £200m five-year RCF and $75m US Private Placement debt, with maturity dates of 2021 and 2019 respectively. The Group’s forecasts and projections, under various scenarios, show that the Group should be able to operate within the level of these facilities. The Group has a good level of work in hand at 31 March 2016 representing 44% of forecast revenue for the year (2015: 51%). After making enquiries and having considered the Group’s results, the strength of its balance sheet and near-term outlook, the directors have a reasonable expectation that the Group has adequate resources to continue in operational existence for the foreseeable future. It is therefore deemed appropriate to continue to apply the going concern principle in the preparation of its consolidated financial information for the year ended 31 March 2016.

STATEMENT OF DIRECTORS’ RESPONSIBILITIES The directors are responsible for preparing the Annual Report, the Remuneration report and the Financial Statements in accordance with applicable law and regulations. Detailed below are statements made by the directors in relation to their responsibilities, disclosure of information to the Company’s auditors and going concern. Company law requires the directors to prepare financial statements for each financial year. Under that law, the directors have prepared the Group and Company Financial Statements in accordance with International Financial Reporting Standards (IFRSs) as adopted by the European Union (EU). Under company law the directors must not approve the Financial Statements unless they are satisfied that they give a true and fair view of the state of affairs of the Group and the Company and of the profit or loss of the Company and Group for that period. In preparing these Financial Statements, the directors are required to:
select suitable accounting policies and then apply them consistently
make judgements and accounting estimates that are reasonable and prudent
state whether applicable IFRSs as adopted by the EU have been followed, subject to any material departures disclosed and explained in the Financial Statements.
The directors are responsible for keeping adequate accounting records that are sufficient to show and explain the Company’s transactions and disclose with reasonable accuracy at any time the financial position of the Company and the Group and enable them to ensure that the Financial Statements and the Remuneration report comply with the Companies Act 2006 (the Act) and, as regards the Group Financial Statements, Article 4 of the International Accounting Standard Regulation. They are also responsible for safeguarding the assets of the Company and the Group and hence for taking reasonable steps for the prevention and detection of fraud and other irregularities. The directors are responsible for the maintenance and integrity of the corporate and financial information included on the Company’s website. Legislation in the UK governing the preparation and dissemination of financial statements may differ from legislation in other jurisdictions. The directors consider that the Annual Report, taken as a whole, is fair, balanced and understandable and provides the information necessary for shareholders to assess the Group’s position and, performance, business model and strategy. Each of the directors, whose names and functions are listed in the Annual Report which will be available on our website, confirms that, to the best of his/her knowledge:
the Group Financial Statements, which have been prepared in accordance with IFRSs as adopted by the EU, give a true and fair view of the assets, liabilities, financial position and profit of the Group
the Directors’ report contained in the Annual Report which will be available on our website includes a fair review of the development and performance of the business and the position of the Group, together with a description of the principal risks and uncertainties that it faces.
Going concern The directors have a reasonable expectation that the Company and the Group have adequate resources to continue in operational existence for the foreseeable future and therefore continue to adopt the going concern basis in preparing the Financial Statements. Disclosure of audit information The directors confirm that, as at the date the Annual Report was approved, so far as each director is aware there is no relevant audit information of which the Company’s independent auditor is unaware and that he or she has taken all the steps that he or she ought to have taken as a director in order to make himself or herself aware of any relevant audit information and to establish that the Company’s independent auditor is aware of that information. Approved by the Board and signed on its behalf by Richard Webster Company Secretary 15 June 2016

Consolidated Income Statement for the year ended 31 March 2016
2016 2015 Note £m £m
Revenue 2 1,861.9 1,756.6 Cost of sales (1,109.2) (1,049.2)
Gross profit 752.7 707.4
Administrative expenses (609.3) (588.9)
Operating profit 2 143.4 118.5
Comprising - Underlying operating profit 148.2 134.1 - Exceptional items 4.7 (4.4) - Impairment of goodwill - (2.8) - Amortisation of acquired intangibles (6.3) (6.9) - Deferred acquisition payments (3.2) (1.5)
143.4 118.5
Net (loss)/profit on disposal of businesses 6 (3.1) 0.4 Income from other investments 1.1 2.2 Share of post-tax profit from joint ventures 2, 3 0.7 0.1
Profit before interest and tax 142.1 121.2 Finance income 4 4.0 4.8 Finance costs 4 (15.0) (19.3)
Net finance costs 4 (11.0) (14.5)
Profit before tax 131.1 106.7
Comprising - Underlying profit before tax 139.0 121.9 - Exceptional items 4.7 (4.4) - Impairment of goodwill - (2.8) - Amortisation of acquired intangibles (6.3) (6.9) - Deferred acquisition payments (3.2) (1.5) - Net (loss)/profit on disposal of businesses 6 (3.1) 0.4
131.1 106.7
Income tax expense 5 (27.7) (21.0)
Profit for the year 103.4 85.7
Profit attributable to: Owners of the parent 103.2 85.7 Non-controlling interests 0.2 - 103.4 85.7
Earnings per share Basic earnings per share 10 106.0p 87.8p Diluted earnings per share 10 103.0p 85.4p Underlying diluted earnings per share 10 107.3p 97.1p
Notes 1 to 18 below form part of the preliminary financial information.
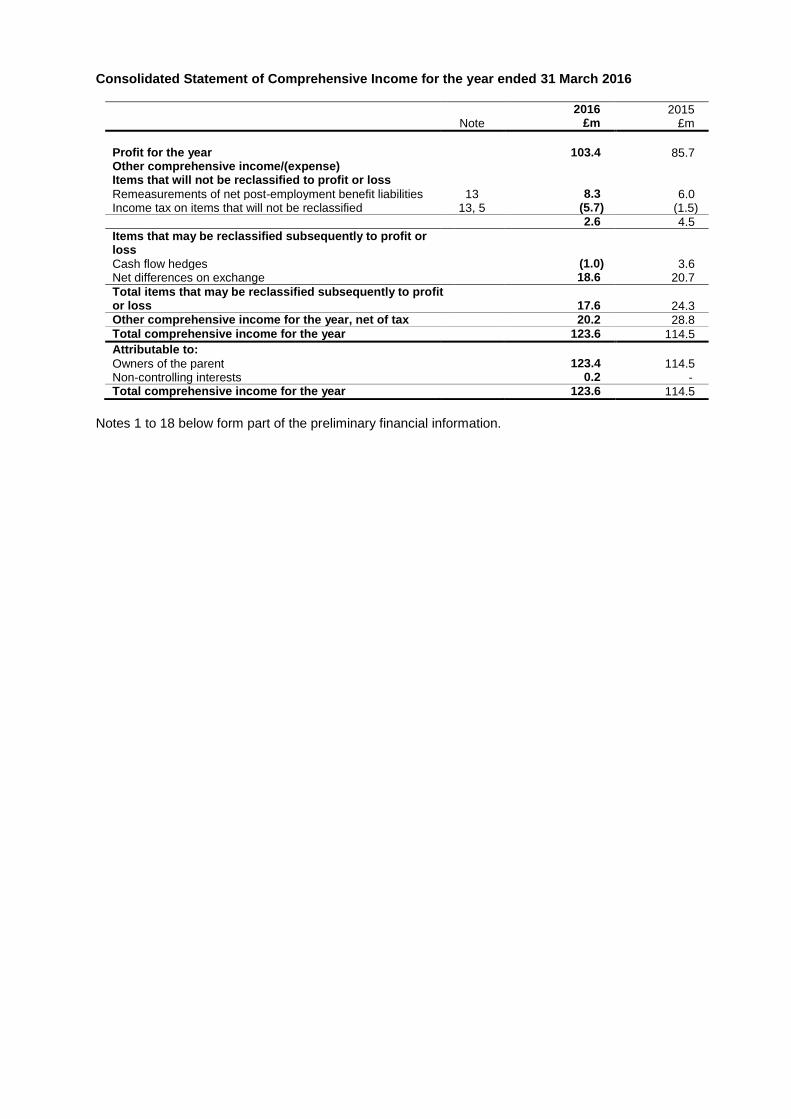
Consolidated Statement of Comprehensive Income for the year ended 31 March 2016
2016 2015 Note £m £m
Profit for the year 103.4 85.7 Other comprehensive income/(expense) Items that will not be reclassified to profit or loss Remeasurements of net post-employment benefit liabilities 13 8.3 6.0 Income tax on items that will not be reclassified 13, 5 (5.7) (1.5)
2.6 4.5
Items that may be reclassified subsequently to profit or loss Cash flow hedges (1.0) 3.6 Net differences on exchange 18.6 20.7
Total items that may be reclassified subsequently to profit or loss 17.6 24.3 Other comprehensive income for the year, net of tax 20.2 28.8 Total comprehensive income for the year 123.6 114.5
Attributable to: Owners of the parent 123.4 114.5 Non-controlling interests 0.2 - Total comprehensive income for the year 123.6 114.5
Notes 1 to 18 below form part of the preliminary financial information.
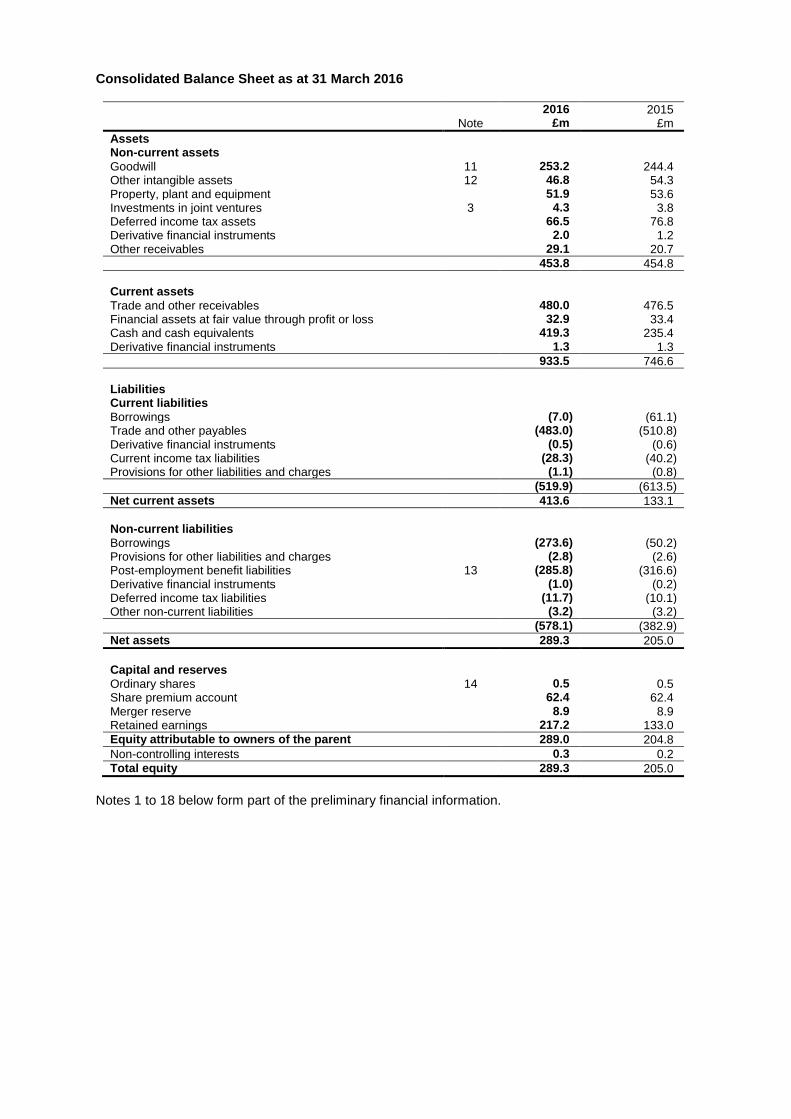
Consolidated Balance Sheet as at 31 March 2016
2016 2015 Note £m £m
Assets Non-current assets Goodwill 11 253.2 244.4 Other intangible assets 12 46.8 54.3 Property, plant and equipment 51.9 53.6 Investments in joint ventures 3 4.3 3.8 Deferred income tax assets 66.5 76.8 Derivative financial instruments 2.0 1.2 Other receivables 29.1 20.7
453.8 454.8
Current assets Trade and other receivables 480.0 476.5 Financial assets at fair value through profit or loss 32.9 33.4 Cash and cash equivalents 419.3 235.4 Derivative financial instruments 1.3 1.3
933.5 746.6
Liabilities Current liabilities Borrowings (7.0) (61.1) Trade and other payables (483.0) (510.8) Derivative financial instruments (0.5) (0.6) Current income tax liabilities (28.3) (40.2) Provisions for other liabilities and charges (1.1) (0.8)
(519.9) (613.5)
Net current assets 413.6 133.1
Non-current liabilities Borrowings (273.6) (50.2) Provisions for other liabilities and charges (2.8) (2.6) Post-employment benefit liabilities 13 (285.8) (316.6) Derivative financial instruments (1.0) (0.2) Deferred income tax liabilities (11.7) (10.1) Other non-current liabilities (3.2) (3.2)
(578.1) (382.9)
Net assets 289.3 205.0
Capital and reserves Ordinary shares 14 0.5 0.5 Share premium account 62.4 62.4 Merger reserve 8.9 8.9 Retained earnings 217.2 133.0
Equity attributable to owners of the parent 289.0 204.8
Non-controlling interests 0.3 0.2
Total equity 289.3 205.0
Notes 1 to 18 below form part of the preliminary financial information.
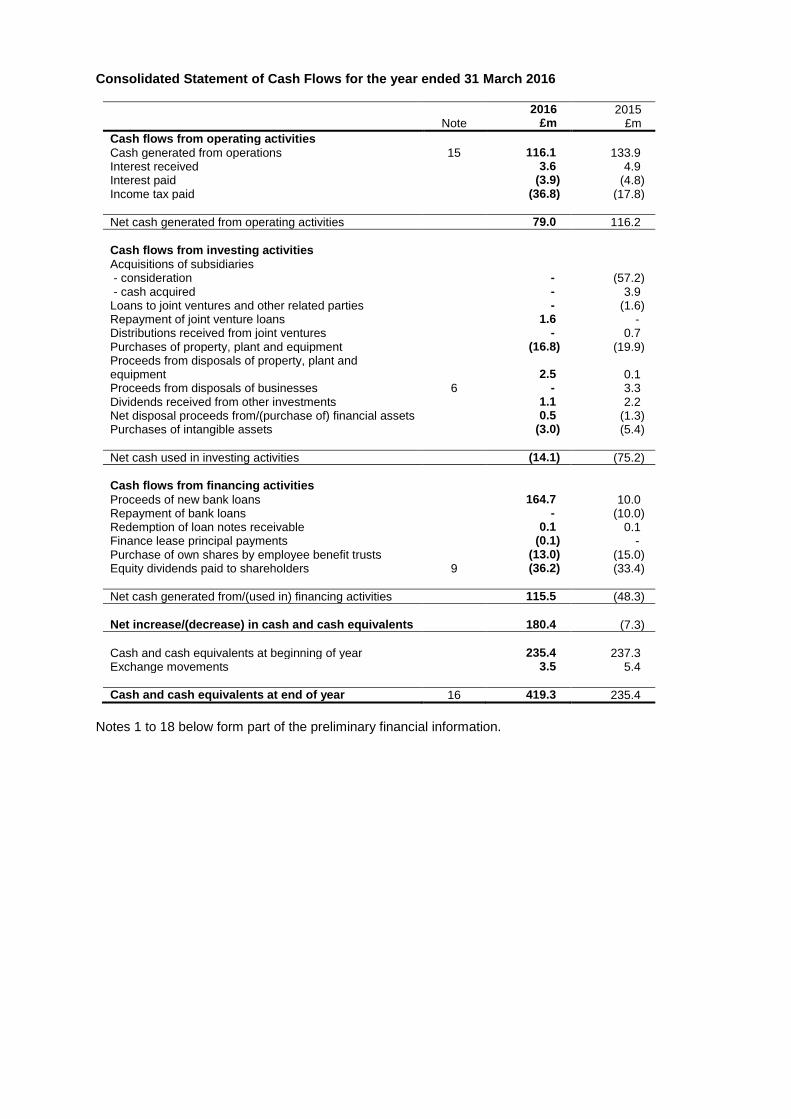
Consolidated Statement of Cash Flows for the year ended 31 March 2016
2016 2015 Note £m £m
Cash flows from operating activities Cash generated from operations 15 116.1 133.9 Interest received 3.6 4.9 Interest paid (3.9) (4.8) Income tax paid (36.8) (17.8)
Net cash generated from operating activities 79.0 116.2
Cash flows from investing activities Acquisitions of subsidiaries - consideration - (57.2) - cash acquired - 3.9 Loans to joint ventures and other related parties - (1.6) Repayment of joint venture loans 1.6 - Distributions received from joint ventures - 0.7 Purchases of property, plant and equipment (16.8) (19.9) Proceeds from disposals of property, plant and equipment 2.5 0.1 Proceeds from disposals of businesses 6 - 3.3 Dividends received from other investments 1.1 2.2 Net disposal proceeds from/(purchase of) financial assets 0.5 (1.3) Purchases of intangible assets (3.0) (5.4)
Net cash used in investing activities (14.1) (75.2)
Cash flows from financing activities Proceeds of new bank loans 164.7 10.0 Repayment of bank loans - (10.0) Redemption of loan notes receivable 0.1 0.1 Finance lease principal payments (0.1) - Purchase of own shares by employee benefit trusts (13.0) (15.0) Equity dividends paid to shareholders 9 (36.2) (33.4)
Net cash generated from/(used in) financing activities 115.5 (48.3)
Net increase/(decrease) in cash and cash equivalents 180.4 (7.3)
Cash and cash equivalents at beginning of year 235.4 237.3 Exchange movements 3.5 5.4
Cash and cash equivalents at end of year 16 419.3 235.4
Notes 1 to 18 below form part of the preliminary financial information.
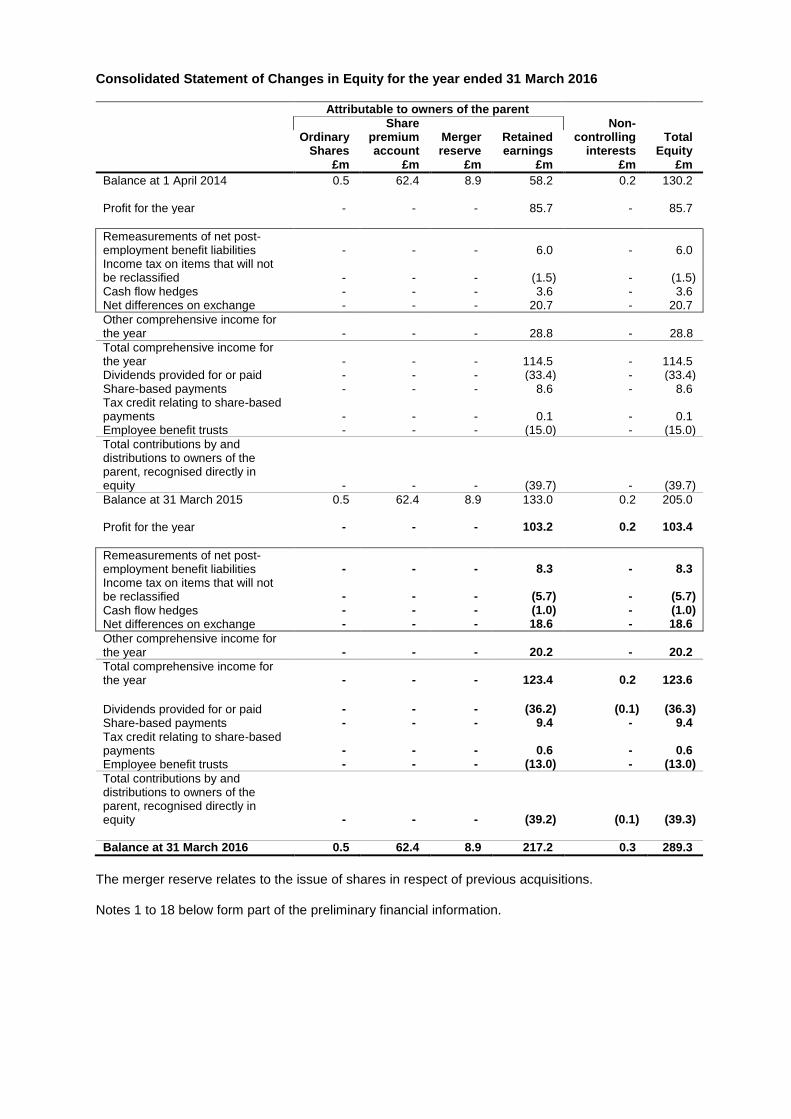
Consolidated Statement of Changes in Equity for the year ended 31 March 2016
Attributable to owners of the parent
Share Non-
Ordinary premium Merger Retained controlling Total
Shares account reserve earnings interests Equity
£m £m £m £m £m £m
Balance at 1 April 2014 0.5 62.4 8.9 58.2 0.2 130.2 Profit for the year - - - 85.7 - 85.7
Remeasurements of net post-employment benefit liabilities - - - 6.0 - 6.0 Income tax on items that will not be reclassified - - - (1.5) - (1.5) Cash flow hedges - - - 3.6 - 3.6 Net differences on exchange - - - 20.7 - 20.7
Other comprehensive income for the year - - - 28.8 - 28.8 Total comprehensive income for the year - - - 114.5 - 114.5 Dividends provided for or paid - - - (33.4) - (33.4) Share-based payments - - - 8.6 - 8.6 Tax credit relating to share-based payments - - - 0.1 - 0.1 Employee benefit trusts - - - (15.0) - (15.0)
Total contributions by and distributions to owners of the parent, recognised directly in equity - - - (39.7) - (39.7)
Balance at 31 March 2015 0.5 62.4 8.9 133.0 0.2 205.0 Profit for the year - - - 103.2 0.2 103.4
Remeasurements of net post-employment benefit liabilities - - - 8.3 - 8.3
Income tax on items that will not be reclassified - - - (5.7) - (5.7)
Cash flow hedges - - - (1.0) - (1.0)
Net differences on exchange - - - 18.6 - 18.6
Other comprehensive income for the year - - - 20.2 - 20.2
Total comprehensive income for the year - - - 123.4 0.2 123.6
Dividends provided for or paid - - - (36.2) (0.1) (36.3)
Share-based payments - - - 9.4 - 9.4
Tax credit relating to share-based payments - - - 0.6 - 0.6
Employee benefit trusts - - - (13.0) - (13.0)
Total contributions by and distributions to owners of the parent, recognised directly in equity - - - (39.2) (0.1) (39.3)
Balance at 31 March 2016 0.5 62.4 8.9 217.2 0.3 289.3
The merger reserve relates to the issue of shares in respect of previous acquisitions.
Notes 1 to 18 below form part of the preliminary financial information.
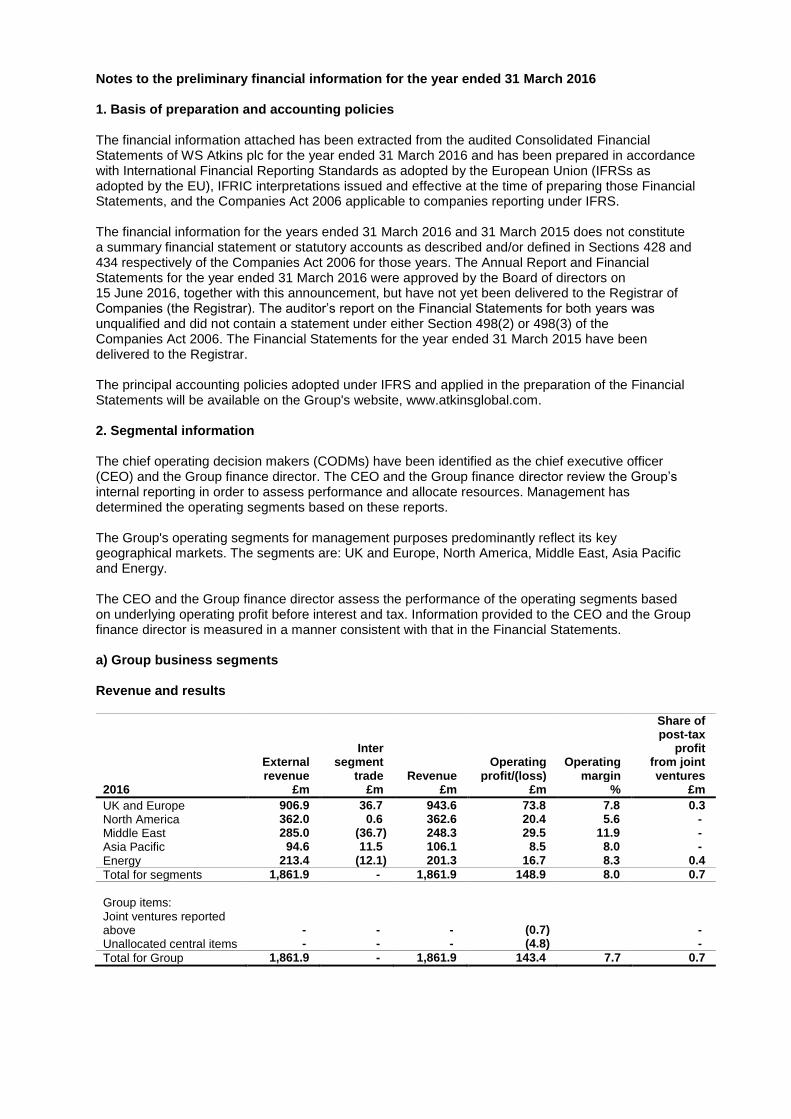
Notes to the preliminary financial information for the year ended 31 March 2016 1. Basis of preparation and accounting policies The financial information attached has been extracted from the audited Consolidated Financial Statements of WS Atkins plc for the year ended 31 March 2016 and has been prepared in accordance with International Financial Reporting Standards as adopted by the European Union (IFRSs as adopted by the EU), IFRIC interpretations issued and effective at the time of preparing those Financial Statements, and the Companies Act 2006 applicable to companies reporting under IFRS. The financial information for the years ended 31 March 2016 and 31 March 2015 does not constitute a summary financial statement or statutory accounts as described and/or defined in Sections 428 and 434 respectively of the Companies Act 2006 for those years. The Annual Report and Financial Statements for the year ended 31 March 2016 were approved by the Board of directors on 15 June 2016, together with this announcement, but have not yet been delivered to the Registrar of Companies (the Registrar). The auditor’s report on the Financial Statements for both years was unqualified and did not contain a statement under either Section 498(2) or 498(3) of the Companies Act 2006. The Financial Statements for the year ended 31 March 2015 have been delivered to the Registrar. The principal accounting policies adopted under IFRS and applied in the preparation of the Financial Statements will be available on the Group's website, www.atkinsglobal.com. 2. Segmental information The chief operating decision makers (CODMs) have been identified as the chief executive officer (CEO) and the Group finance director. The CEO and the Group finance director review the Group’s internal reporting in order to assess performance and allocate resources. Management has determined the operating segments based on these reports. The Group's operating segments for management purposes predominantly reflect its key geographical markets. The segments are: UK and Europe, North America, Middle East, Asia Pacific and Energy. The CEO and the Group finance director assess the performance of the operating segments based on underlying operating profit before interest and tax. Information provided to the CEO and the Group finance director is measured in a manner consistent with that in the Financial Statements. a) Group business segments Revenue and results
Share of
post-tax
Inter profit
External segment Operating Operating from joint revenue trade Revenue profit/(loss) margin ventures 2016 £m £m £m £m % £m
UK and Europe 906.9 36.7 943.6 73.8 7.8 0.3
North America 362.0 0.6 362.6 20.4 5.6 -
Middle East 285.0 (36.7) 248.3 29.5 11.9 -
Asia Pacific 94.6 11.5 106.1 8.5 8.0 -
Energy 213.4 (12.1) 201.3 16.7 8.3 0.4
Total for segments 1,861.9 - 1,861.9 148.9 8.0 0.7
Group items:
Joint ventures reported above
-
-
- (0.7)
-
Unallocated central items - - - (4.8) -
Total for Group 1,861.9 - 1,861.9 143.4 7.7 0.7

Share of post-tax Inter (loss)/profit External segment Operating Operating from joint revenue trade Revenue profit/(loss) margin ventures 2015 £m £m £m £m % £m
UK and Europe 872.4 31.4 903.8 60.7 6.7 (0.4) North America 340.4 1.0 341.4 20.0 5.9 - Middle East 238.2 (21.5) 216.7 22.5 10.4 - Asia Pacific 102.1 7.6 109.7 9.8 8.9 - Energy 200.5 (18.5) 182.0 20.4 11.2 0.5
Total for segments 1,753.6 - 1,753.6 133.4 7.6 0.1
Group items: Joint ventures reported above
-
-
- (0.1)
-
Unallocated central items 3.0 - 3.0 (14.8) -
Total for Group 1,756.6 - 1,756.6 118.5 6.7 0.1
Unallocated central items reported in the year ended 31 March 2016 comprise: £6.3m of intangible asset amortisation relating to the acquisitions of The PBSJ Corporation (PBSJ), Confluence Project Management Pte. Ltd (Confluence), Nuclear Safety Associates, Inc. (NSA), Houston Offshore Engineering, LLC (HOE) and Terramar AS (Terramar); £3.3m of external fees in relation to the acquisition of the projects, products and technology (PP&T) segment of EnergySolutions; £3.2m of deferred payment arising on the acquisition of HOE; £1.5m pension curtailment gain and £6.5m gain on disposal of part of the Group's freehold property at Woodcote Grove. Unallocated central items reported in the year ended 31 March 2015 comprise: £6.9m of intangible asset amortisation relating to the acquisitions of PBSJ, Confluence, NSA, HOE and Terramar; impairment of goodwill for the European aerospace business of £2.8m; £4.4m of external fees in relation to the pursuit of an unsuccessful acquisition; £1.5m of deferred payments arising on the acquisition of HOE; release of a £3.0m provision relating to the previously disposed of Asset Management business and £2.2m settlement of longstanding enquiries by the Department of Justice and the Securities and Exchange Commission. A reconciliation of segmental operating profit to profit before tax is provided as follows:
2016 2015 £m £m
Operating profit 143.4 118.5 Net (loss)/profit on disposal of businesses (3.1) 0.4 Income from other investments 1.1 2.2 Share of post-tax profit from joint ventures 0.7 0.1
Profit before interest and tax 142.1 121.2 Finance income 4.0 4.8 Finance costs (15.0) (19.3)
Net finance costs (11.0) (14.5)
Profit before tax 131.1 106.7
Balance sheet
Total Total Net Investments Depreciation,
segment segment assets/ in joint Capital amortisation, assets liabilities (liabilities) ventures expenditure impairment 2016 £m £m £m £m £m £m
UK and Europe 584.2 (264.7) 319.5 4.0 8.6 13.0
North America 449.8 (57.7) 392.1 - 4.8 4.3
Middle East 144.7 (87.1) 57.6 - 3.4 2.6
Asia Pacific 68.0 (47.2) 20.8 - 1.4 2.7
Energy 112.2 (26.0) 86.2 0.3 1.7 1.2
Total for segments 1,358.9 (482.7) 876.2 4.3 19.9 23.8
Group items:
Unallocated central items 28.4 (615.3) (586.9) - - 6.3
Total for Group 1,387.3 (1,098.0) 289.3 4.3 19.9 30.1
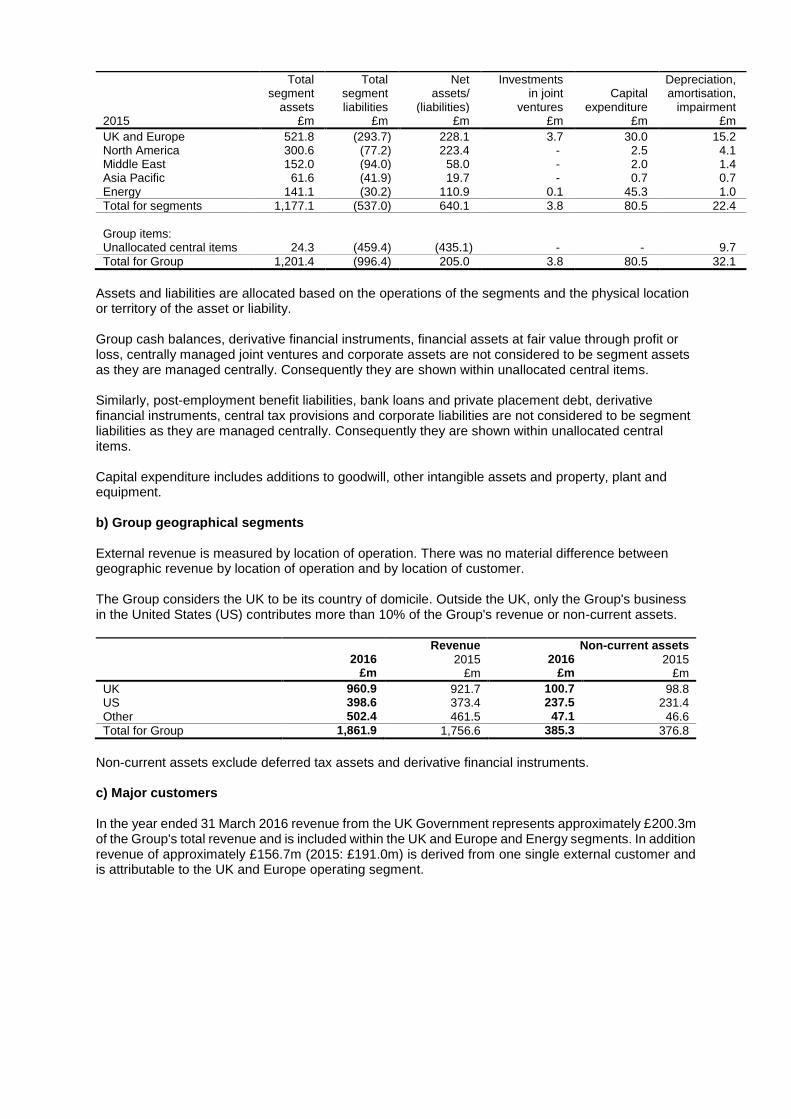
Total Total Net Investments Depreciation, segment segment assets/ in joint Capital amortisation, assets liabilities (liabilities) ventures expenditure impairment 2015 £m £m £m £m £m £m
UK and Europe 521.8 (293.7) 228.1 3.7 30.0 15.2 North America 300.6 (77.2) 223.4 - 2.5 4.1 Middle East 152.0 (94.0) 58.0 - 2.0 1.4 Asia Pacific 61.6 (41.9) 19.7 - 0.7 0.7 Energy 141.1 (30.2) 110.9 0.1 45.3 1.0
Total for segments 1,177.1 (537.0) 640.1 3.8 80.5 22.4
Group items: Unallocated central items 24.3 (459.4) (435.1) - - 9.7
Total for Group 1,201.4 (996.4) 205.0 3.8 80.5 32.1
Assets and liabilities are allocated based on the operations of the segments and the physical location or territory of the asset or liability. Group cash balances, derivative financial instruments, financial assets at fair value through profit or loss, centrally managed joint ventures and corporate assets are not considered to be segment assets as they are managed centrally. Consequently they are shown within unallocated central items. Similarly, post-employment benefit liabilities, bank loans and private placement debt, derivative financial instruments, central tax provisions and corporate liabilities are not considered to be segment liabilities as they are managed centrally. Consequently they are shown within unallocated central items. Capital expenditure includes additions to goodwill, other intangible assets and property, plant and equipment. b) Group geographical segments External revenue is measured by location of operation. There was no material difference between geographic revenue by location of operation and by location of customer. The Group considers the UK to be its country of domicile. Outside the UK, only the Group's business in the United States (US) contributes more than 10% of the Group's revenue or non-current assets.
Revenue Non-current assets
2016 2015 2016 2015 £m £m £m £m
UK 960.9 921.7 100.7 98.8 US 398.6 373.4 237.5 231.4 Other 502.4 461.5 47.1 46.6
Total for Group 1,861.9 1,756.6 385.3 376.8
Non-current assets exclude deferred tax assets and derivative financial instruments. c) Major customers In the year ended 31 March 2016 revenue from the UK Government represents approximately £200.3m of the Group's total revenue and is included within the UK and Europe and Energy segments. In addition revenue of approximately £156.7m (2015: £191.0m) is derived from one single external customer and is attributable to the UK and Europe operating segment.
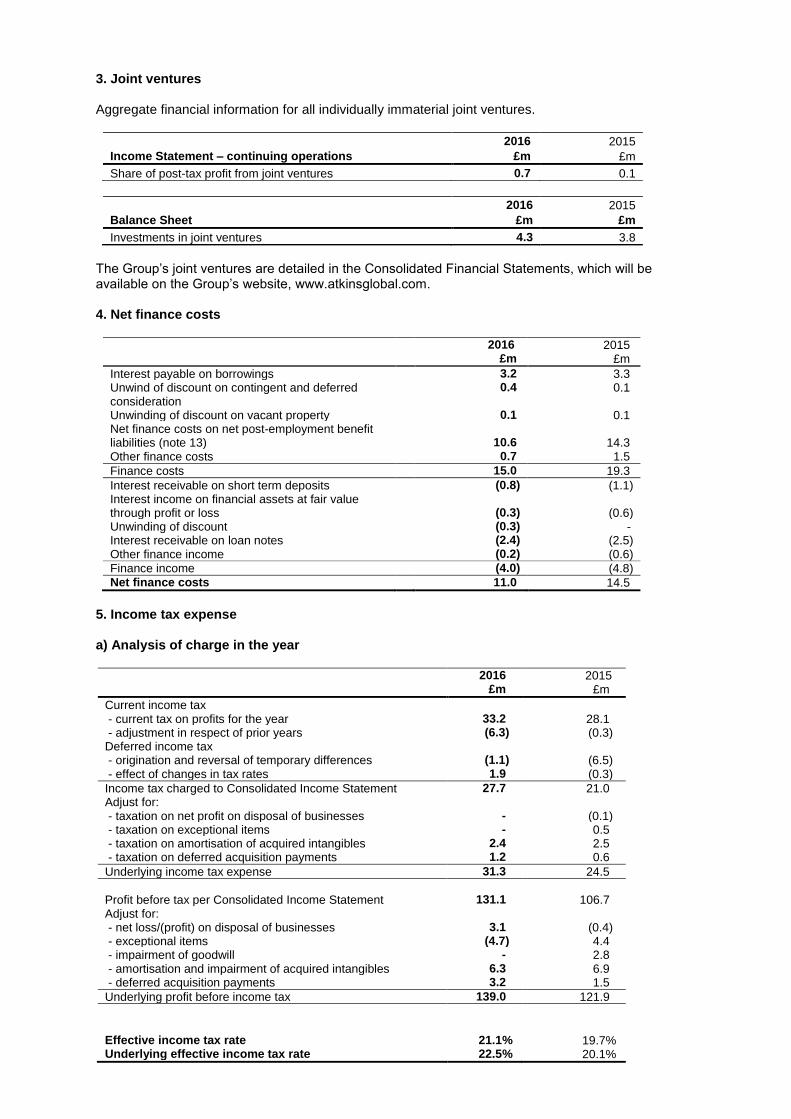
3. Joint ventures Aggregate financial information for all individually immaterial joint ventures.
2016 2015
Income Statement – continuing operations £m £m
Share of post-tax profit from joint ventures 0.7 0.1
2016 2015
Balance Sheet £m £m
Investments in joint ventures 4.3 3.8
The Group’s joint ventures are detailed in the Consolidated Financial Statements, which will be available on the Group’s website, www.atkinsglobal.com. 4. Net finance costs
2016 2015 £m £m
Interest payable on borrowings 3.2 3.3 Unwind of discount on contingent and deferred consideration
0.4 0.1
Unwinding of discount on vacant property 0.1 0.1 Net finance costs on net post-employment benefit liabilities (note 13)
10.6
14.3
Other finance costs 0.7 1.5
Finance costs 15.0 19.3
Interest receivable on short term deposits (0.8) (1.1) Interest income on financial assets at fair value through profit or loss (0.3) (0.6) Unwinding of discount (0.3) - Interest receivable on loan notes (2.4) (2.5) Other finance income (0.2) (0.6)
Finance income (4.0) (4.8)
Net finance costs 11.0 14.5
5. Income tax expense a) Analysis of charge in the year
2016 2015 £m £m
Current income tax - current tax on profits for the year 33.2 28.1 - adjustment in respect of prior years (6.3) (0.3) Deferred income tax - origination and reversal of temporary differences (1.1) (6.5) - effect of changes in tax rates 1.9 (0.3)
Income tax charged to Consolidated Income Statement 27.7 21.0 Adjust for: - taxation on net profit on disposal of businesses - (0.1) - taxation on exceptional items - 0.5 - taxation on amortisation of acquired intangibles 2.4 2.5 - taxation on deferred acquisition payments 1.2 0.6
Underlying income tax expense 31.3 24.5
Profit before tax per Consolidated Income Statement 131.1 106.7 Adjust for: - net loss/(profit) on disposal of businesses 3.1 (0.4) - exceptional items (4.7) 4.4 - impairment of goodwill - 2.8 - amortisation and impairment of acquired intangibles 6.3 6.9 - deferred acquisition payments 3.2 1.5
Underlying profit before income tax 139.0 121.9
Effective income tax rate 21.1% 19.7% Underlying effective income tax rate 22.5% 20.1%
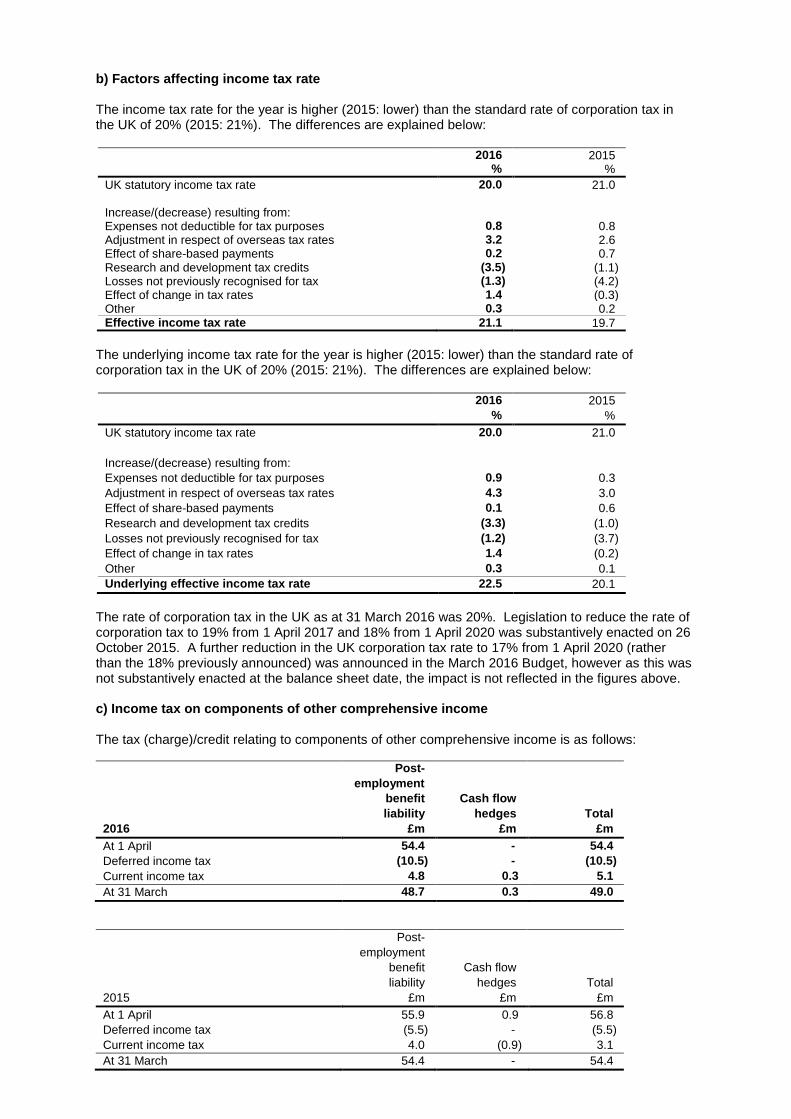
b) Factors affecting income tax rate The income tax rate for the year is higher (2015: lower) than the standard rate of corporation tax in the UK of 20% (2015: 21%). The differences are explained below:
2016 2015 % %
UK statutory income tax rate 20.0 21.0 Increase/(decrease) resulting from: Expenses not deductible for tax purposes 0.8 0.8 Adjustment in respect of overseas tax rates 3.2 2.6 Effect of share-based payments 0.2 0.7 Research and development tax credits (3.5) (1.1) Losses not previously recognised for tax (1.3) (4.2) Effect of change in tax rates 1.4 (0.3) Other 0.3 0.2 Effective income tax rate 21.1 19.7
The underlying income tax rate for the year is higher (2015: lower) than the standard rate of corporation tax in the UK of 20% (2015: 21%). The differences are explained below:
2016 2015
% %
UK statutory income tax rate 20.0 21.0
Increase/(decrease) resulting from:
Expenses not deductible for tax purposes 0.9 0.3
Adjustment in respect of overseas tax rates 4.3 3.0
Effect of share-based payments 0.1 0.6
Research and development tax credits (3.3) (1.0)
Losses not previously recognised for tax (1.2) (3.7)
Effect of change in tax rates 1.4 (0.2)
Other 0.3 0.1
Underlying effective income tax rate 22.5 20.1
The rate of corporation tax in the UK as at 31 March 2016 was 20%. Legislation to reduce the rate of corporation tax to 19% from 1 April 2017 and 18% from 1 April 2020 was substantively enacted on 26 October 2015. A further reduction in the UK corporation tax rate to 17% from 1 April 2020 (rather than the 18% previously announced) was announced in the March 2016 Budget, however as this was not substantively enacted at the balance sheet date, the impact is not reflected in the figures above. c) Income tax on components of other comprehensive income The tax (charge)/credit relating to components of other comprehensive income is as follows:
Post-
employment
benefit Cash flow
liability hedges Total
2016 £m £m £m
At 1 April 54.4 - 54.4
Deferred income tax (10.5) - (10.5)
Current income tax 4.8 0.3 5.1
At 31 March 48.7 0.3 49.0
Post-
employment
benefit Cash flow
liability hedges Total
2015 £m £m £m
At 1 April 55.9 0.9 56.8
Deferred income tax (5.5) - (5.5)
Current income tax 4.0 (0.9) 3.1
At 31 March 54.4 - 54.4
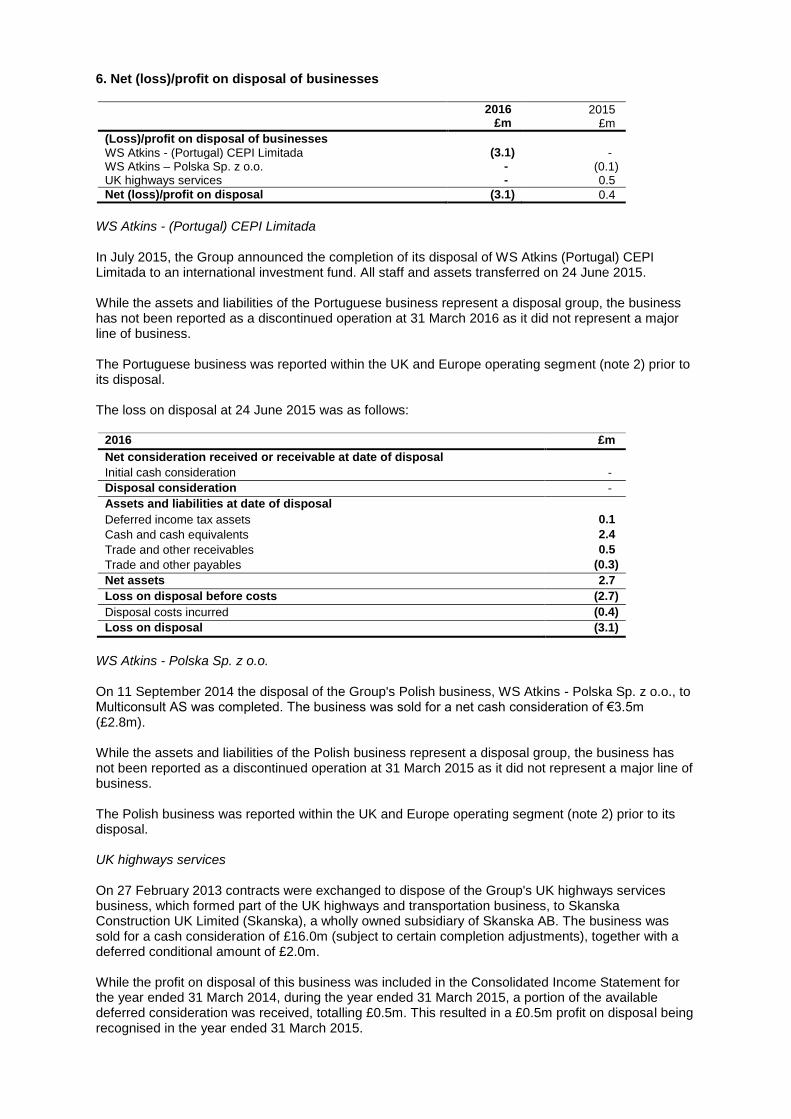
6. Net (loss)/profit on disposal of businesses
2016 2015 £m £m
(Loss)/profit on disposal of businesses WS Atkins - (Portugal) CEPI Limitada (3.1) - WS Atkins – Polska Sp. z o.o. - (0.1) UK highways services - 0.5
Net (loss)/profit on disposal (3.1) 0.4
WS Atkins - (Portugal) CEPI Limitada In July 2015, the Group announced the completion of its disposal of WS Atkins (Portugal) CEPI Limitada to an international investment fund. All staff and assets transferred on 24 June 2015. While the assets and liabilities of the Portuguese business represent a disposal group, the business has not been reported as a discontinued operation at 31 March 2016 as it did not represent a major line of business. The Portuguese business was reported within the UK and Europe operating segment (note 2) prior to its disposal. The loss on disposal at 24 June 2015 was as follows:
2016 £m
Net consideration received or receivable at date of disposal
Initial cash consideration -
Disposal consideration -
Assets and liabilities at date of disposal
Deferred income tax assets 0.1
Cash and cash equivalents 2.4
Trade and other receivables 0.5
Trade and other payables (0.3)
Net assets 2.7
Loss on disposal before costs (2.7)
Disposal costs incurred (0.4)
Loss on disposal (3.1)
WS Atkins - Polska Sp. z o.o. On 11 September 2014 the disposal of the Group's Polish business, WS Atkins - Polska Sp. z o.o., to Multiconsult AS was completed. The business was sold for a net cash consideration of €3.5m (£2.8m). While the assets and liabilities of the Polish business represent a disposal group, the business has not been reported as a discontinued operation at 31 March 2015 as it did not represent a major line of business. The Polish business was reported within the UK and Europe operating segment (note 2) prior to its disposal. UK highways services On 27 February 2013 contracts were exchanged to dispose of the Group's UK highways services business, which formed part of the UK highways and transportation business, to Skanska Construction UK Limited (Skanska), a wholly owned subsidiary of Skanska AB. The business was sold for a cash consideration of £16.0m (subject to certain completion adjustments), together with a deferred conditional amount of £2.0m. While the profit on disposal of this business was included in the Consolidated Income Statement for the year ended 31 March 2014, during the year ended 31 March 2015, a portion of the available deferred consideration was received, totalling £0.5m. This resulted in a £0.5m profit on disposal being recognised in the year ended 31 March 2015.
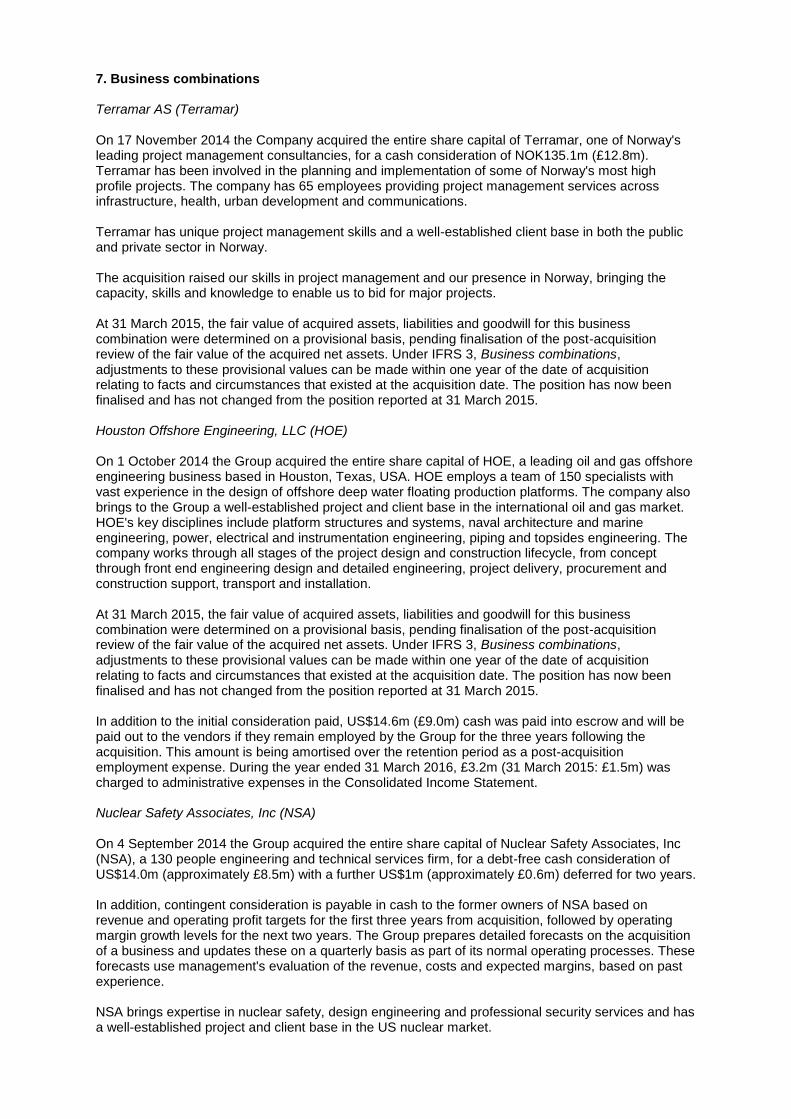
7. Business combinations Terramar AS (Terramar) On 17 November 2014 the Company acquired the entire share capital of Terramar, one of Norway's leading project management consultancies, for a cash consideration of NOK135.1m (£12.8m). Terramar has been involved in the planning and implementation of some of Norway's most high profile projects. The company has 65 employees providing project management services across infrastructure, health, urban development and communications. Terramar has unique project management skills and a well-established client base in both the public and private sector in Norway. The acquisition raised our skills in project management and our presence in Norway, bringing the capacity, skills and knowledge to enable us to bid for major projects. At 31 March 2015, the fair value of acquired assets, liabilities and goodwill for this business combination were determined on a provisional basis, pending finalisation of the post-acquisition review of the fair value of the acquired net assets. Under IFRS 3, Business combinations, adjustments to these provisional values can be made within one year of the date of acquisition relating to facts and circumstances that existed at the acquisition date. The position has now been finalised and has not changed from the position reported at 31 March 2015. Houston Offshore Engineering, LLC (HOE) On 1 October 2014 the Group acquired the entire share capital of HOE, a leading oil and gas offshore engineering business based in Houston, Texas, USA. HOE employs a team of 150 specialists with vast experience in the design of offshore deep water floating production platforms. The company also brings to the Group a well-established project and client base in the international oil and gas market. HOE's key disciplines include platform structures and systems, naval architecture and marine engineering, power, electrical and instrumentation engineering, piping and topsides engineering. The company works through all stages of the project design and construction lifecycle, from concept through front end engineering design and detailed engineering, project delivery, procurement and construction support, transport and installation. At 31 March 2015, the fair value of acquired assets, liabilities and goodwill for this business combination were determined on a provisional basis, pending finalisation of the post-acquisition review of the fair value of the acquired net assets. Under IFRS 3, Business combinations, adjustments to these provisional values can be made within one year of the date of acquisition relating to facts and circumstances that existed at the acquisition date. The position has now been finalised and has not changed from the position reported at 31 March 2015. In addition to the initial consideration paid, US$14.6m (£9.0m) cash was paid into escrow and will be paid out to the vendors if they remain employed by the Group for the three years following the acquisition. This amount is being amortised over the retention period as a post-acquisition employment expense. During the year ended 31 March 2016, £3.2m (31 March 2015: £1.5m) was charged to administrative expenses in the Consolidated Income Statement. Nuclear Safety Associates, Inc (NSA) On 4 September 2014 the Group acquired the entire share capital of Nuclear Safety Associates, Inc (NSA), a 130 people engineering and technical services firm, for a debt-free cash consideration of US$14.0m (approximately £8.5m) with a further US$1m (approximately £0.6m) deferred for two years. In addition, contingent consideration is payable in cash to the former owners of NSA based on revenue and operating profit targets for the first three years from acquisition, followed by operating margin growth levels for the next two years. The Group prepares detailed forecasts on the acquisition of a business and updates these on a quarterly basis as part of its normal operating processes. These forecasts use management's evaluation of the revenue, costs and expected margins, based on past experience. NSA brings expertise in nuclear safety, design engineering and professional security services and has a well-established project and client base in the US nuclear market.
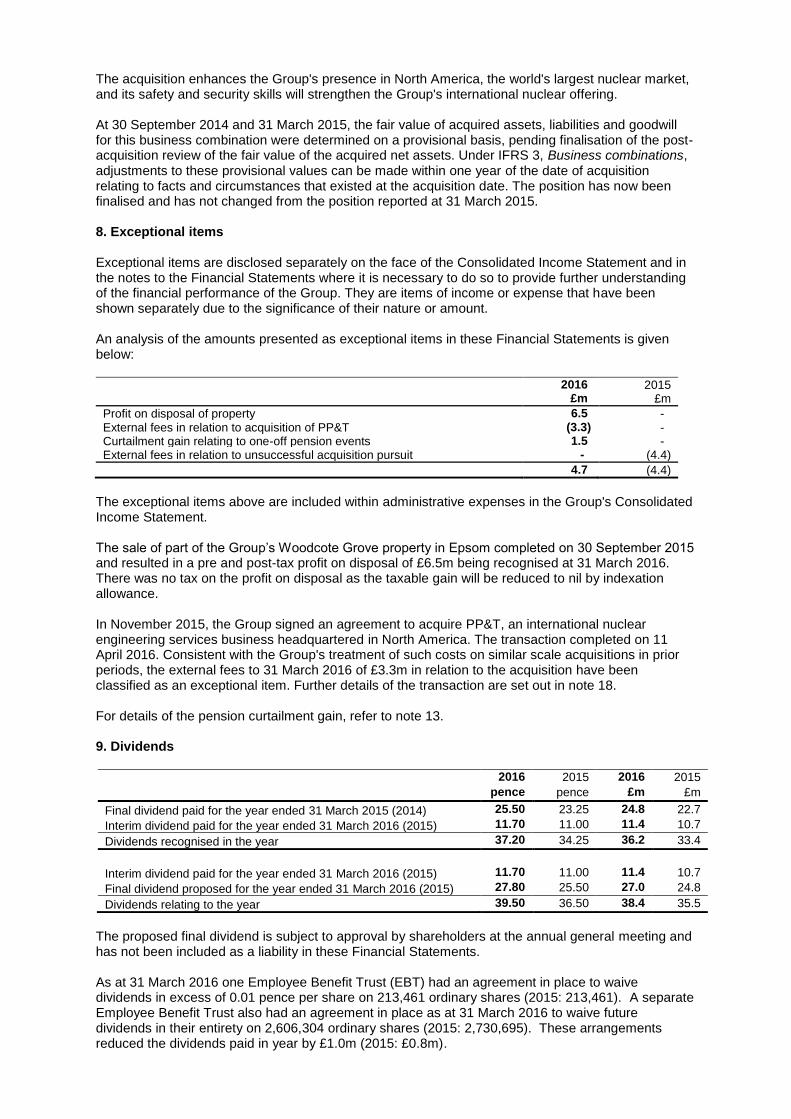
The acquisition enhances the Group's presence in North America, the world's largest nuclear market, and its safety and security skills will strengthen the Group's international nuclear offering. At 30 September 2014 and 31 March 2015, the fair value of acquired assets, liabilities and goodwill for this business combination were determined on a provisional basis, pending finalisation of the post-acquisition review of the fair value of the acquired net assets. Under IFRS 3, Business combinations, adjustments to these provisional values can be made within one year of the date of acquisition relating to facts and circumstances that existed at the acquisition date. The position has now been finalised and has not changed from the position reported at 31 March 2015. 8. Exceptional items Exceptional items are disclosed separately on the face of the Consolidated Income Statement and in the notes to the Financial Statements where it is necessary to do so to provide further understanding of the financial performance of the Group. They are items of income or expense that have been shown separately due to the significance of their nature or amount. An analysis of the amounts presented as exceptional items in these Financial Statements is given below:
2016 2015 £m £m
Profit on disposal of property 6.5 - External fees in relation to acquisition of PP&T (3.3) - Curtailment gain relating to one-off pension events 1.5 - External fees in relation to unsuccessful acquisition pursuit - (4.4)
4.7 (4.4)
The exceptional items above are included within administrative expenses in the Group's Consolidated Income Statement. The sale of part of the Group’s Woodcote Grove property in Epsom completed on 30 September 2015 and resulted in a pre and post-tax profit on disposal of £6.5m being recognised at 31 March 2016. There was no tax on the profit on disposal as the taxable gain will be reduced to nil by indexation allowance. In November 2015, the Group signed an agreement to acquire PP&T, an international nuclear engineering services business headquartered in North America. The transaction completed on 11 April 2016. Consistent with the Group's treatment of such costs on similar scale acquisitions in prior periods, the external fees to 31 March 2016 of £3.3m in relation to the acquisition have been classified as an exceptional item. Further details of the transaction are set out in note 18. For details of the pension curtailment gain, refer to note 13. 9. Dividends
2016 2015 2016 2015
pence pence £m £m
Final dividend paid for the year ended 31 March 2015 (2014) 25.50 23.25 24.8 22.7
Interim dividend paid for the year ended 31 March 2016 (2015) 11.70 11.00 11.4 10.7
Dividends recognised in the year 37.20 34.25 36.2 33.4
Interim dividend paid for the year ended 31 March 2016 (2015) 11.70 11.00 11.4 10.7
Final dividend proposed for the year ended 31 March 2016 (2015) 27.80 25.50 27.0 24.8
Dividends relating to the year 39.50 36.50 38.4 35.5
The proposed final dividend is subject to approval by shareholders at the annual general meeting and has not been included as a liability in these Financial Statements. As at 31 March 2016 one Employee Benefit Trust (EBT) had an agreement in place to waive dividends in excess of 0.01 pence per share on 213,461 ordinary shares (2015: 213,461). A separate Employee Benefit Trust also had an agreement in place as at 31 March 2016 to waive future dividends in their entirety on 2,606,304 ordinary shares (2015: 2,730,695). These arrangements reduced the dividends paid in year by £1.0m (2015: £0.8m).
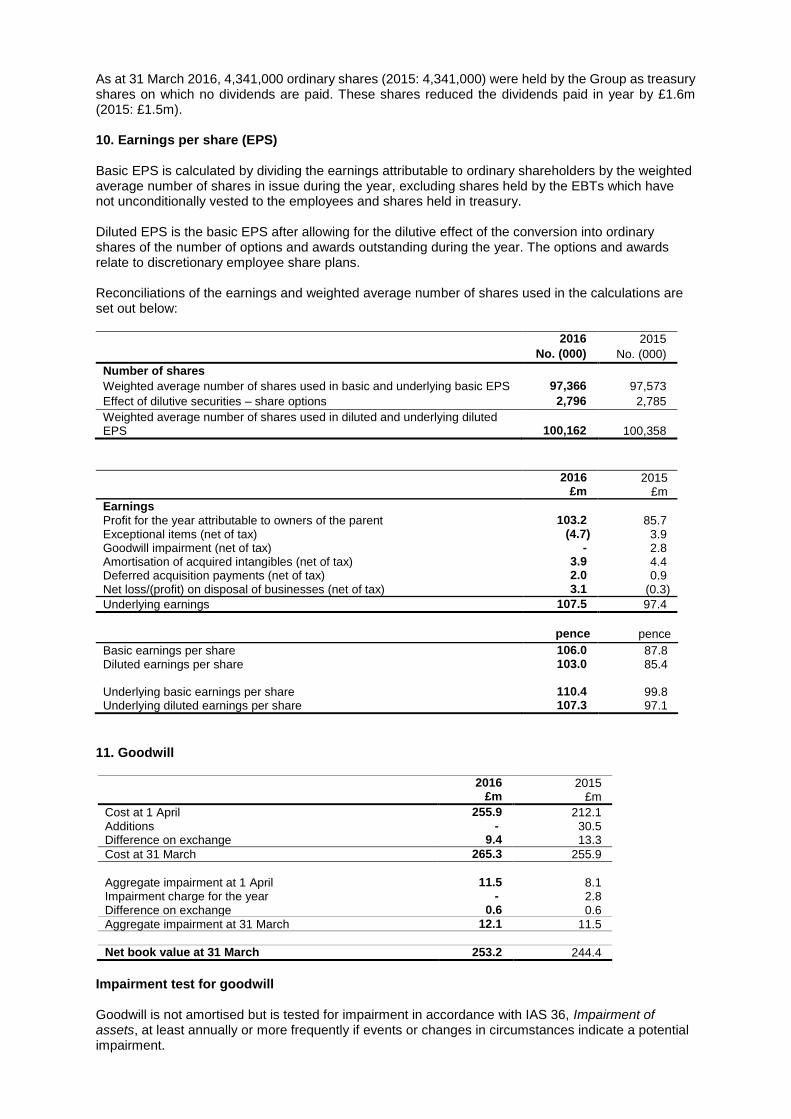
As at 31 March 2016, 4,341,000 ordinary shares (2015: 4,341,000) were held by the Group as treasury shares on which no dividends are paid. These shares reduced the dividends paid in year by £1.6m (2015: £1.5m). 10. Earnings per share (EPS) Basic EPS is calculated by dividing the earnings attributable to ordinary shareholders by the weighted average number of shares in issue during the year, excluding shares held by the EBTs which have not unconditionally vested to the employees and shares held in treasury. Diluted EPS is the basic EPS after allowing for the dilutive effect of the conversion into ordinary shares of the number of options and awards outstanding during the year. The options and awards relate to discretionary employee share plans. Reconciliations of the earnings and weighted average number of shares used in the calculations are set out below:
2016 2015
No. (000) No. (000)
Number of shares
Weighted average number of shares used in basic and underlying basic EPS 97,366 97,573
Effect of dilutive securities – share options 2,796 2,785
Weighted average number of shares used in diluted and underlying diluted EPS 100,162 100,358
2016 2015 £m £m
Earnings Profit for the year attributable to owners of the parent 103.2 85.7 Exceptional items (net of tax) (4.7) 3.9 Goodwill impairment (net of tax) - 2.8 Amortisation of acquired intangibles (net of tax) 3.9 4.4 Deferred acquisition payments (net of tax) 2.0 0.9 Net loss/(profit) on disposal of businesses (net of tax) 3.1 (0.3)
Underlying earnings 107.5 97.4
pence pence
Basic earnings per share 106.0 87.8 Diluted earnings per share 103.0 85.4 Underlying basic earnings per share 110.4 99.8 Underlying diluted earnings per share 107.3 97.1
11. Goodwill
2016 2015 £m £m
Cost at 1 April 255.9 212.1 Additions - 30.5 Difference on exchange 9.4 13.3
Cost at 31 March 265.3 255.9
Aggregate impairment at 1 April 11.5 8.1 Impairment charge for the year - 2.8 Difference on exchange 0.6 0.6
Aggregate impairment at 31 March 12.1 11.5
Net book value at 31 March 253.2 244.4
Impairment test for goodwill Goodwill is not amortised but is tested for impairment in accordance with IAS 36, Impairment of assets, at least annually or more frequently if events or changes in circumstances indicate a potential impairment.
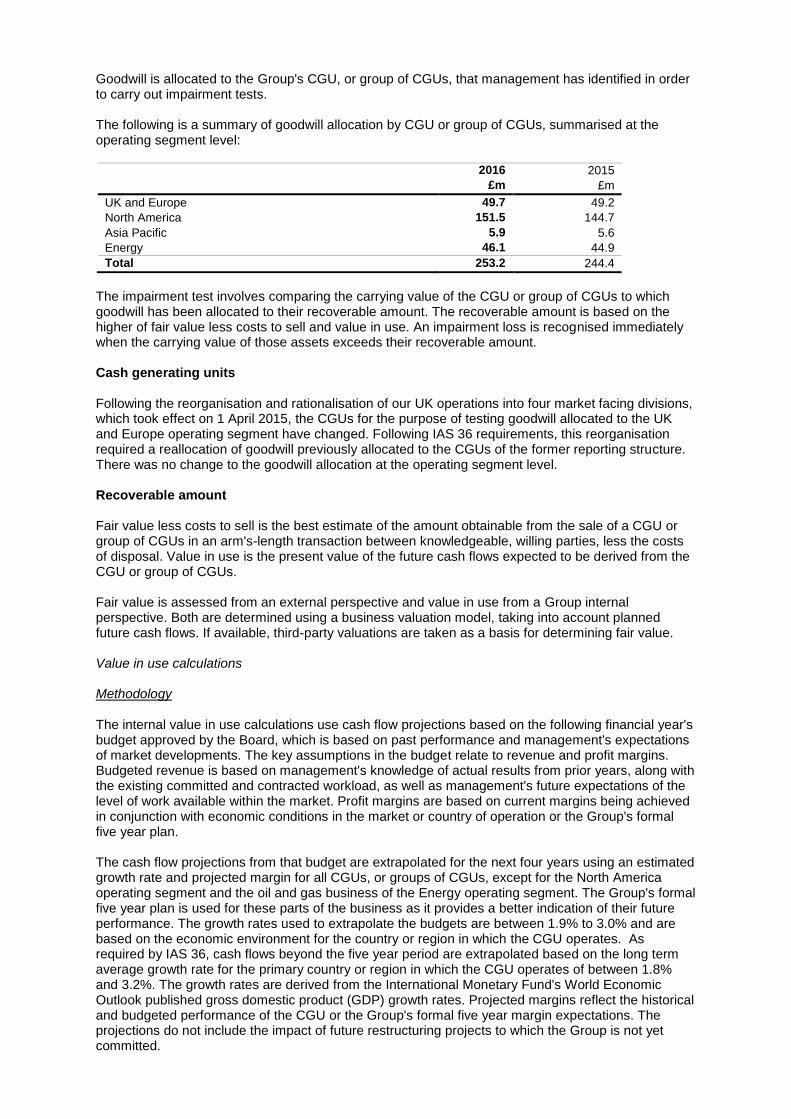
Goodwill is allocated to the Group's CGU, or group of CGUs, that management has identified in order to carry out impairment tests. The following is a summary of goodwill allocation by CGU or group of CGUs, summarised at the operating segment level:
2016 2015
£m £m
UK and Europe 49.7 49.2
North America 151.5 144.7
Asia Pacific 5.9 5.6
Energy 46.1 44.9
Total 253.2 244.4
The impairment test involves comparing the carrying value of the CGU or group of CGUs to which goodwill has been allocated to their recoverable amount. The recoverable amount is based on the higher of fair value less costs to sell and value in use. An impairment loss is recognised immediately when the carrying value of those assets exceeds their recoverable amount. Cash generating units Following the reorganisation and rationalisation of our UK operations into four market facing divisions, which took effect on 1 April 2015, the CGUs for the purpose of testing goodwill allocated to the UK and Europe operating segment have changed. Following IAS 36 requirements, this reorganisation required a reallocation of goodwill previously allocated to the CGUs of the former reporting structure. There was no change to the goodwill allocation at the operating segment level. Recoverable amount Fair value less costs to sell is the best estimate of the amount obtainable from the sale of a CGU or group of CGUs in an arm's-length transaction between knowledgeable, willing parties, less the costs of disposal. Value in use is the present value of the future cash flows expected to be derived from the CGU or group of CGUs. Fair value is assessed from an external perspective and value in use from a Group internal perspective. Both are determined using a business valuation model, taking into account planned future cash flows. If available, third-party valuations are taken as a basis for determining fair value. Value in use calculations Methodology
The internal value in use calculations use cash flow projections based on the following financial year's budget approved by the Board, which is based on past performance and management's expectations of market developments. The key assumptions in the budget relate to revenue and profit margins. Budgeted revenue is based on management's knowledge of actual results from prior years, along with the existing committed and contracted workload, as well as management's future expectations of the level of work available within the market. Profit margins are based on current margins being achieved in conjunction with economic conditions in the market or country of operation or the Group's formal five year plan. The cash flow projections from that budget are extrapolated for the next four years using an estimated growth rate and projected margin for all CGUs, or groups of CGUs, except for the North America operating segment and the oil and gas business of the Energy operating segment. The Group's formal five year plan is used for these parts of the business as it provides a better indication of their future performance. The growth rates used to extrapolate the budgets are between 1.9% to 3.0% and are based on the economic environment for the country or region in which the CGU operates. As required by IAS 36, cash flows beyond the five year period are extrapolated based on the long term average growth rate for the primary country or region in which the CGU operates of between 1.8% and 3.2%. The growth rates are derived from the International Monetary Fund's World Economic Outlook published gross domestic product (GDP) growth rates. Projected margins reflect the historical and budgeted performance of the CGU or the Group's formal five year margin expectations. The projections do not include the impact of future restructuring projects to which the Group is not yet committed.

The cash flows have been discounted using the CGU's specific pre-tax discount rates of between 8.9% and 13.1%. The discount rates have been calculated using the capital asset pricing model to determine the cost of equity and are adjusted for risks specific to the CGU. The discount rates are revised annually using updated market information. Assumptions The growth rate and discount rate assumptions used for the internal value in use calculations are as follows:
2016 2015
Five year growth rate 1.9%- 3.0% 1.9%- 3.8% Post five year growth rate 1.8%- 3.2% 1.8%- 3.8% Pre-tax discount rate 8.9%-13.1% 8.9%-16.0%
Prior period impairment loss Following the downturn in the European aerospace market, the carrying amount of goodwill arising on the acquisition in 2007 of the Dutch consultancy Nedtech Engineering BV was reviewed during the prior year ended 31 March 2015 and, as a consequence, reduced to its recoverable amount through the recognition of an impairment loss of £2.8m. This loss was included in administrative expenses in the Consolidated Income Statement for the period ended 31 March 2015. Following the reorganisation and rationalisation of our UK operations, there was a reallocation of goodwill previously allocated to the CGUs of the former reporting structure, including the goodwill arising on the acquisition of Nedtech Engineering BV. Following these changes, sensitivity analysis has indicated that there is no longer a significant risk of the carrying amount of the CGU, to which this goodwill has been allocated, exceeding its recoverable amount. Sensitivity analysis North America group of CGUs Goodwill of £151.5m (2015: £144.7m) allocated to the North America operating segment includes £143.5m of goodwill arising on the acquisition of PBSJ. This goodwill has been allocated to the North America group of CGUs and is considered significant in comparison with the Group's total carrying amount of goodwill. The recoverable amount of this group of CGUs has been determined using an internal value in use calculation, key inputs to which are the Group's 2016/17 budget and the formal five year plan for the North America segment, which covers the period to 2020. The other assumptions used for this value in use calculation are the long term growth rate and the discount rate as follows:
2016 2015
Post five year growth rate 2.0% 2.0%
Pre-tax discount rate 12.2% 14.0%
Given the materiality of goodwill allocated to the North America group of CGUs, sensitivity analysis has been performed on the key assumptions used in the value in use calculations. The recoverable amount of the North America group of CGUs calculated based on value in use exceeds its carrying value by £161.6m. The two assumptions to which these value in use calculations are most sensitive are the projected profit margin as extracted from the five year plan and the discount rate applied. Specific sensitivity analysis with regard to these assumptions shows that, with respect to the profit margin it would need to fall by 350 basis points before any impairment would be triggered, and similarly the pre-tax discount rate would need to increase from 12.2% to 18.4%. Oil and gas group of CGUs Market conditions in the oil and gas sector and the performance of our oil and gas business, as reported in the Energy segmental performance, led to a closer review of the carrying value of goodwill in the oil and gas CGU. We have included additional information for the oil and gas CGU. The recoverable amount of the oil and gas CGU exceeds the carrying amount of the group of CGUs at 31 March 2016 by £22.3m (2015: £74.1m). The recoverable amount of this group of CGUs has been determined using an internal value in use calculation, key inputs to which are the Group's 2016/17 budget and the formal five year plan for the oil and gas business, which covers the period to 2020.
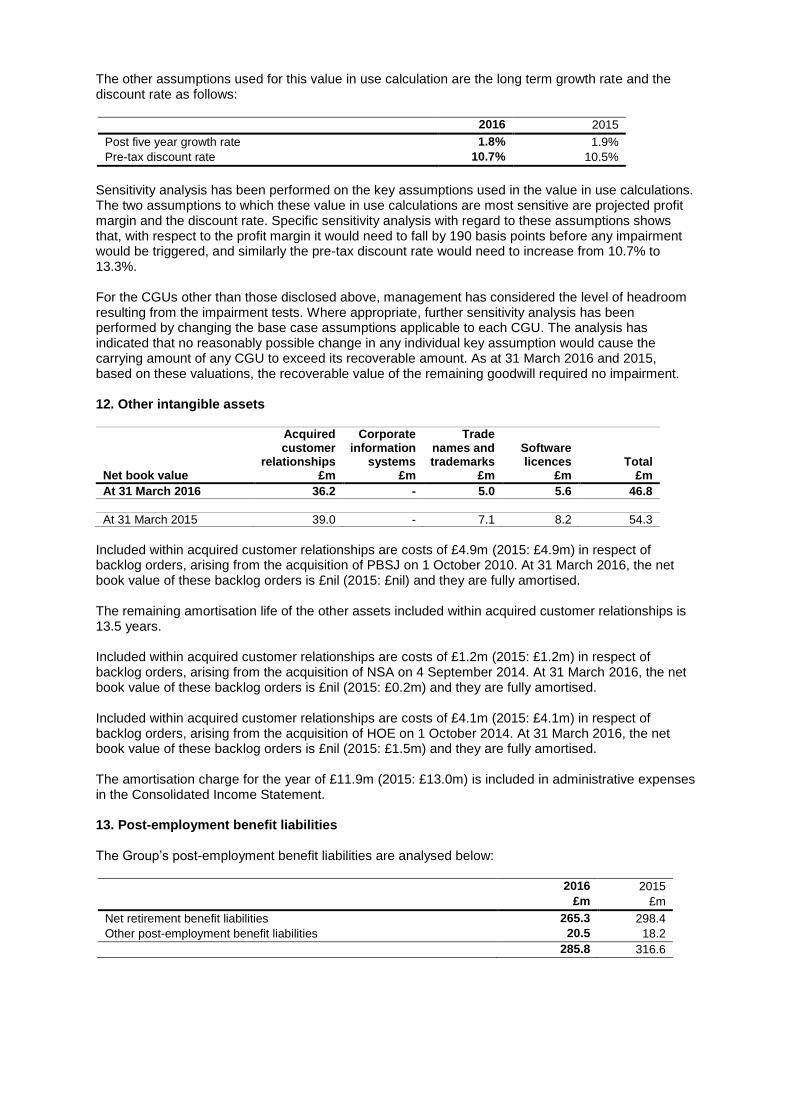
The other assumptions used for this value in use calculation are the long term growth rate and the discount rate as follows:
2016 2015
Post five year growth rate 1.8% 1.9%
Pre-tax discount rate 10.7% 10.5%
Sensitivity analysis has been performed on the key assumptions used in the value in use calculations. The two assumptions to which these value in use calculations are most sensitive are projected profit margin and the discount rate. Specific sensitivity analysis with regard to these assumptions shows that, with respect to the profit margin it would need to fall by 190 basis points before any impairment would be triggered, and similarly the pre-tax discount rate would need to increase from 10.7% to 13.3%. For the CGUs other than those disclosed above, management has considered the level of headroom resulting from the impairment tests. Where appropriate, further sensitivity analysis has been performed by changing the base case assumptions applicable to each CGU. The analysis has indicated that no reasonably possible change in any individual key assumption would cause the carrying amount of any CGU to exceed its recoverable amount. As at 31 March 2016 and 2015, based on these valuations, the recoverable value of the remaining goodwill required no impairment. 12. Other intangible assets
Acquired customer
relationships
Corporate information
systems
Trade names and trademarks
Software licences
Total Net book value £m £m £m £m £m
At 31 March 2016 36.2 - 5.0 5.6 46.8
At 31 March 2015 39.0 - 7.1 8.2 54.3
Included within acquired customer relationships are costs of £4.9m (2015: £4.9m) in respect of backlog orders, arising from the acquisition of PBSJ on 1 October 2010. At 31 March 2016, the net book value of these backlog orders is £nil (2015: £nil) and they are fully amortised. The remaining amortisation life of the other assets included within acquired customer relationships is 13.5 years. Included within acquired customer relationships are costs of £1.2m (2015: £1.2m) in respect of backlog orders, arising from the acquisition of NSA on 4 September 2014. At 31 March 2016, the net book value of these backlog orders is £nil (2015: £0.2m) and they are fully amortised. Included within acquired customer relationships are costs of £4.1m (2015: £4.1m) in respect of backlog orders, arising from the acquisition of HOE on 1 October 2014. At 31 March 2016, the net book value of these backlog orders is £nil (2015: £1.5m) and they are fully amortised. The amortisation charge for the year of £11.9m (2015: £13.0m) is included in administrative expenses in the Consolidated Income Statement. 13. Post-employment benefit liabilities The Group’s post-employment benefit liabilities are analysed below:
2016 2015
£m £m
Net retirement benefit liabilities 265.3 298.4
Other post-employment benefit liabilities 20.5 18.2
285.8 316.6
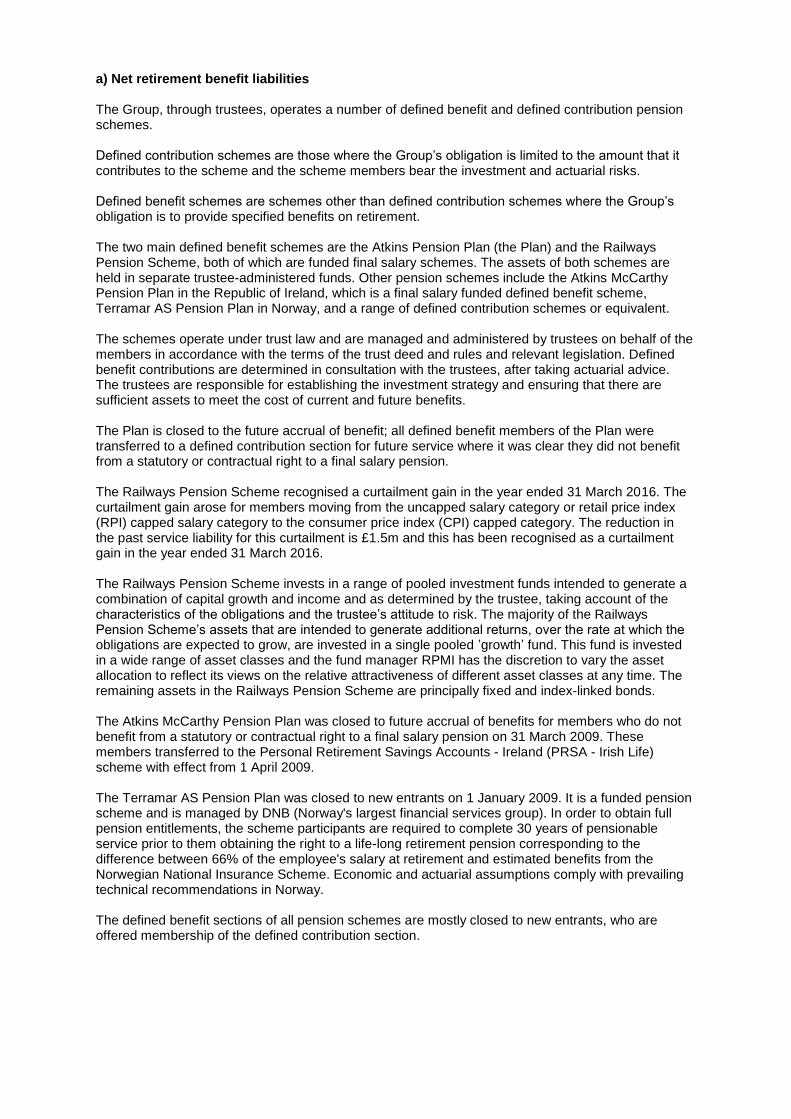
a) Net retirement benefit liabilities The Group, through trustees, operates a number of defined benefit and defined contribution pension schemes. Defined contribution schemes are those where the Group’s obligation is limited to the amount that it contributes to the scheme and the scheme members bear the investment and actuarial risks. Defined benefit schemes are schemes other than defined contribution schemes where the Group’s obligation is to provide specified benefits on retirement. The two main defined benefit schemes are the Atkins Pension Plan (the Plan) and the Railways Pension Scheme, both of which are funded final salary schemes. The assets of both schemes are held in separate trustee-administered funds. Other pension schemes include the Atkins McCarthy Pension Plan in the Republic of Ireland, which is a final salary funded defined benefit scheme, Terramar AS Pension Plan in Norway, and a range of defined contribution schemes or equivalent. The schemes operate under trust law and are managed and administered by trustees on behalf of the members in accordance with the terms of the trust deed and rules and relevant legislation. Defined benefit contributions are determined in consultation with the trustees, after taking actuarial advice. The trustees are responsible for establishing the investment strategy and ensuring that there are sufficient assets to meet the cost of current and future benefits. The Plan is closed to the future accrual of benefit; all defined benefit members of the Plan were transferred to a defined contribution section for future service where it was clear they did not benefit from a statutory or contractual right to a final salary pension. The Railways Pension Scheme recognised a curtailment gain in the year ended 31 March 2016. The curtailment gain arose for members moving from the uncapped salary category or retail price index (RPI) capped salary category to the consumer price index (CPI) capped category. The reduction in the past service liability for this curtailment is £1.5m and this has been recognised as a curtailment gain in the year ended 31 March 2016. The Railways Pension Scheme invests in a range of pooled investment funds intended to generate a combination of capital growth and income and as determined by the trustee, taking account of the characteristics of the obligations and the trustee’s attitude to risk. The majority of the Railways Pension Scheme’s assets that are intended to generate additional returns, over the rate at which the obligations are expected to grow, are invested in a single pooled ’growth’ fund. This fund is invested in a wide range of asset classes and the fund manager RPMI has the discretion to vary the asset allocation to reflect its views on the relative attractiveness of different asset classes at any time. The remaining assets in the Railways Pension Scheme are principally fixed and index-linked bonds. The Atkins McCarthy Pension Plan was closed to future accrual of benefits for members who do not benefit from a statutory or contractual right to a final salary pension on 31 March 2009. These members transferred to the Personal Retirement Savings Accounts - Ireland (PRSA - Irish Life) scheme with effect from 1 April 2009. The Terramar AS Pension Plan was closed to new entrants on 1 January 2009. It is a funded pension scheme and is managed by DNB (Norway's largest financial services group). In order to obtain full pension entitlements, the scheme participants are required to complete 30 years of pensionable service prior to them obtaining the right to a life-long retirement pension corresponding to the difference between 66% of the employee's salary at retirement and estimated benefits from the Norwegian National Insurance Scheme. Economic and actuarial assumptions comply with prevailing technical recommendations in Norway. The defined benefit sections of all pension schemes are mostly closed to new entrants, who are offered membership of the defined contribution section.

The main assumptions used for the IAS 19 valuation of the retirement benefit liabilities for the Atkins Pension Plan and the Railways Pension Scheme are listed in the table below:
2016 2015
Price inflation
RPI 2.90% 3.00%
CPI 1.90% 2.00%
Rate of increase of pensions in payment
Limited Price Indexation (RPI-based) 2.80% 2.80%
Limited Price Indexation (CPI-based) 2.00% 2.10%
Limited Price Indexation to 2.5% 2.50% 2.50%
Fixed 5.00% 5.00%
Rate of increase in salaries
Atkins Pension Plan 4.40% 4.50%
Railways Pension Scheme (uncapped) 5.15% 5.25%
Railways Pension Scheme (RPI capped) 2.90% 3.00%
Railways Pension Scheme (CPI capped) 1.90% 2.00%
Rate of increase for deferred pensioners
Atkins Pension Plan 2.90% 3.00%
Railways Pension Scheme 1.90% 2.00%
Discount rate 3.50% 3.50%
Longevity at age 65 for current pensioners
Men 24.3 years 24.2 years
Women 26.2 years 26.1 years
Longevity at age 65 for future pensioners (current age 45)
Men 26.6 years 26.5 years
Women 28.5 years 28.4 years
The actuarial tables used to calculate the retirement benefit liabilities for the Plan were the Self-Administered Pension Schemes (SAPS) tables, with medium cohort improvements from 2002 to 2009 and a scaling factor of 0.85/0.90 for males/females respectively. Future improvements are based on Continuous Mortality Investigation (CMI) improvements with a 1.5% per annum improvement trend, based on year of use application. The Railways Pension Scheme results have been adjusted on an approximate basis to be based on the same mortality tables. The components of the pension cost are as follows:
2016 £m
2015 £m
Cost of sales Current service cost 2.6 2.2 Administrative expenses 0.2 0.2 Curtailment gain (1.5) -
Total charge 1.3 2.4
Net interest expense 9.7 13.6
Total charge to Income Statement for defined benefit schemes 11.0 16.0
Charge for defined contribution schemes 43.3 39.8
Total charge to Income Statement 54.3 55.8
Statement of Comprehensive Income (Loss)/gain on pension scheme assets (9.6) 243.2 Changes in assumptions 17.9 (237.2)
Remeasurements gain recognised in other comprehensive income 8.3 6.0 Net deferred and income tax charged to equity (5.7) (1.5)
Remeasurements gain (net of deferred tax) 2.6 4.5
2016 £m
2015 £m
Defined benefit obligation (1,821.9) (1,827.2) Fair value of plan assets 1,556.6 1,528.8
Net retirement benefit liabilities (265.3) (298.4)
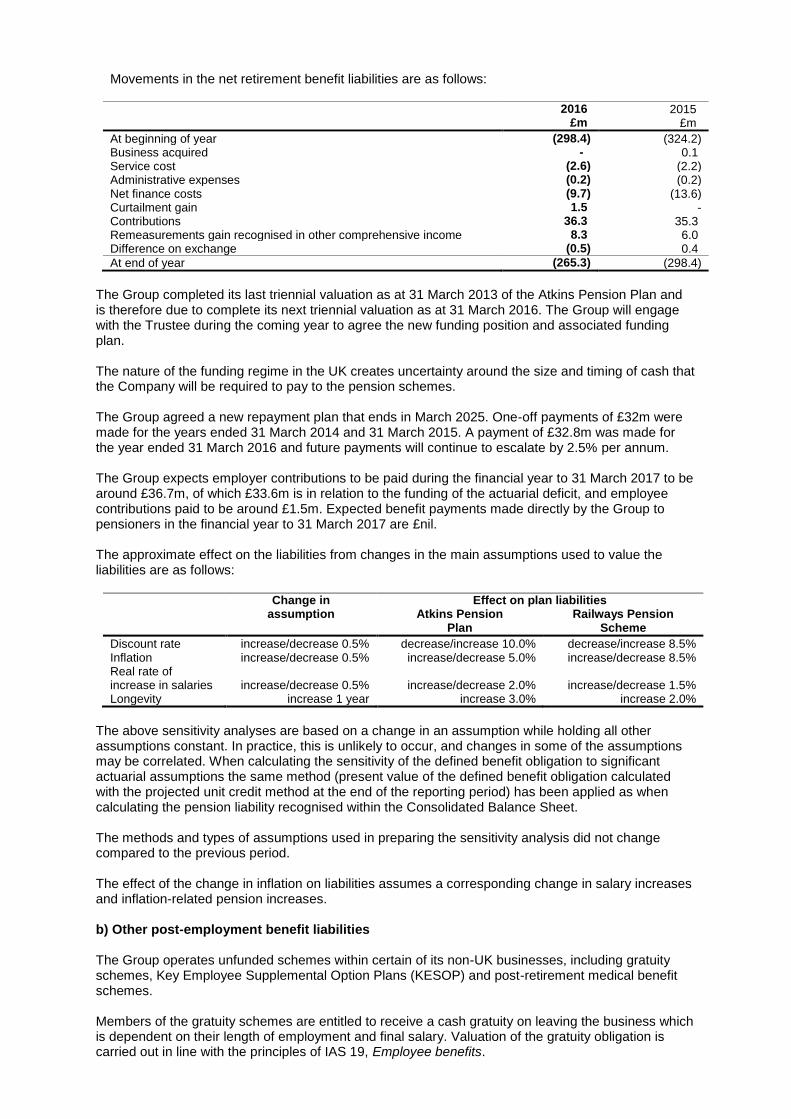
Movements in the net retirement benefit liabilities are as follows:
2016 £m
2015 £m
At beginning of year (298.4) (324.2) Business acquired - 0.1 Service cost (2.6) (2.2) Administrative expenses (0.2) (0.2) Net finance costs (9.7) (13.6) Curtailment gain 1.5 - Contributions 36.3 35.3 Remeasurements gain recognised in other comprehensive income 8.3 6.0 Difference on exchange (0.5) 0.4
At end of year (265.3) (298.4)
The Group completed its last triennial valuation as at 31 March 2013 of the Atkins Pension Plan and is therefore due to complete its next triennial valuation as at 31 March 2016. The Group will engage with the Trustee during the coming year to agree the new funding position and associated funding plan. The nature of the funding regime in the UK creates uncertainty around the size and timing of cash that the Company will be required to pay to the pension schemes. The Group agreed a new repayment plan that ends in March 2025. One-off payments of £32m were made for the years ended 31 March 2014 and 31 March 2015. A payment of £32.8m was made for the year ended 31 March 2016 and future payments will continue to escalate by 2.5% per annum. The Group expects employer contributions to be paid during the financial year to 31 March 2017 to be around £36.7m, of which £33.6m is in relation to the funding of the actuarial deficit, and employee contributions paid to be around £1.5m. Expected benefit payments made directly by the Group to pensioners in the financial year to 31 March 2017 are £nil. The approximate effect on the liabilities from changes in the main assumptions used to value the liabilities are as follows:
Change in Effect on plan liabilities
assumption Atkins Pension Railways Pension
Plan Scheme
Discount rate increase/decrease 0.5% decrease/increase 10.0% decrease/increase 8.5% Inflation increase/decrease 0.5% increase/decrease 5.0% increase/decrease 8.5% Real rate of increase in salaries increase/decrease 0.5% increase/decrease 2.0% increase/decrease 1.5% Longevity increase 1 year increase 3.0% increase 2.0%
The above sensitivity analyses are based on a change in an assumption while holding all other assumptions constant. In practice, this is unlikely to occur, and changes in some of the assumptions may be correlated. When calculating the sensitivity of the defined benefit obligation to significant actuarial assumptions the same method (present value of the defined benefit obligation calculated with the projected unit credit method at the end of the reporting period) has been applied as when calculating the pension liability recognised within the Consolidated Balance Sheet. The methods and types of assumptions used in preparing the sensitivity analysis did not change compared to the previous period. The effect of the change in inflation on liabilities assumes a corresponding change in salary increases and inflation-related pension increases. b) Other post-employment benefit liabilities The Group operates unfunded schemes within certain of its non-UK businesses, including gratuity schemes, Key Employee Supplemental Option Plans (KESOP) and post-retirement medical benefit schemes. Members of the gratuity schemes are entitled to receive a cash gratuity on leaving the business which is dependent on their length of employment and final salary. Valuation of the gratuity obligation is carried out in line with the principles of IAS 19, Employee benefits.
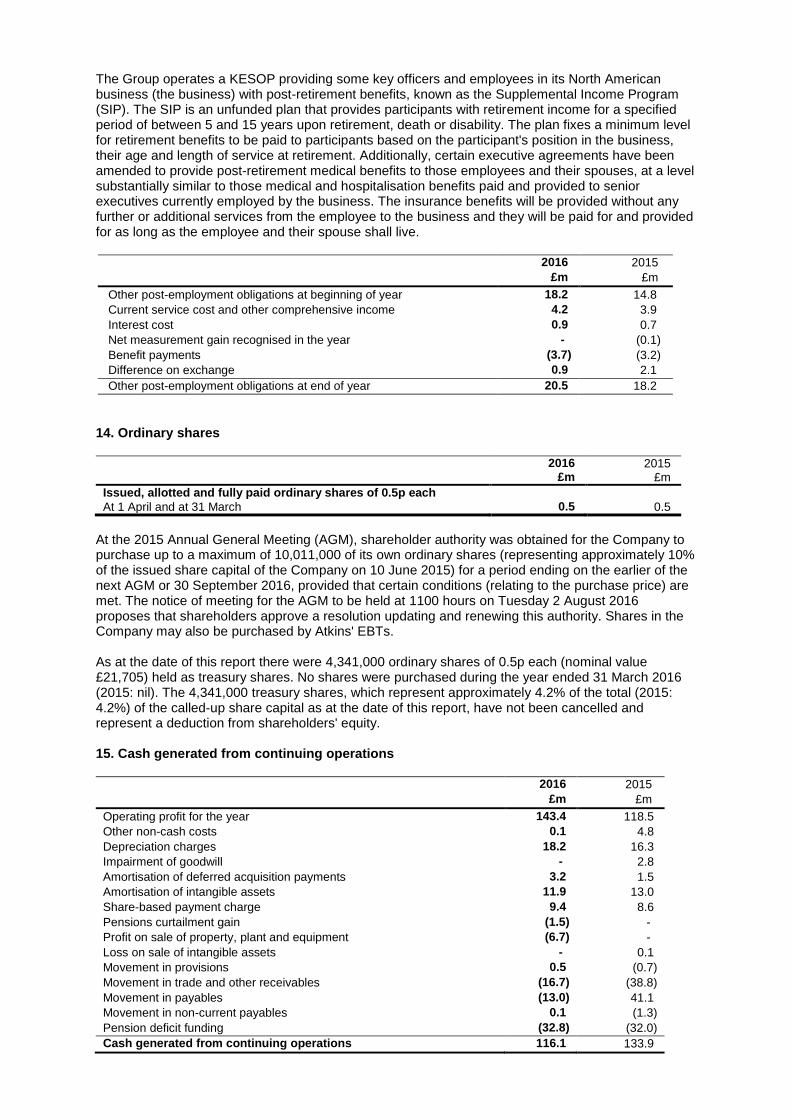
The Group operates a KESOP providing some key officers and employees in its North American business (the business) with post-retirement benefits, known as the Supplemental Income Program (SIP). The SIP is an unfunded plan that provides participants with retirement income for a specified period of between 5 and 15 years upon retirement, death or disability. The plan fixes a minimum level for retirement benefits to be paid to participants based on the participant's position in the business, their age and length of service at retirement. Additionally, certain executive agreements have been amended to provide post-retirement medical benefits to those employees and their spouses, at a level substantially similar to those medical and hospitalisation benefits paid and provided to senior executives currently employed by the business. The insurance benefits will be provided without any further or additional services from the employee to the business and they will be paid for and provided for as long as the employee and their spouse shall live.
2016 2015
£m £m
Other post-employment obligations at beginning of year 18.2 14.8
Current service cost and other comprehensive income 4.2 3.9
Interest cost 0.9 0.7
Net measurement gain recognised in the year - (0.1)
Benefit payments (3.7) (3.2)
Difference on exchange 0.9 2.1
Other post-employment obligations at end of year 20.5 18.2
14. Ordinary shares
2016 £m
2015 £m
Issued, allotted and fully paid ordinary shares of 0.5p each At 1 April and at 31 March 0.5 0.5
At the 2015 Annual General Meeting (AGM), shareholder authority was obtained for the Company to purchase up to a maximum of 10,011,000 of its own ordinary shares (representing approximately 10% of the issued share capital of the Company on 10 June 2015) for a period ending on the earlier of the next AGM or 30 September 2016, provided that certain conditions (relating to the purchase price) are met. The notice of meeting for the AGM to be held at 1100 hours on Tuesday 2 August 2016 proposes that shareholders approve a resolution updating and renewing this authority. Shares in the Company may also be purchased by Atkins' EBTs. As at the date of this report there were 4,341,000 ordinary shares of 0.5p each (nominal value £21,705) held as treasury shares. No shares were purchased during the year ended 31 March 2016 (2015: nil). The 4,341,000 treasury shares, which represent approximately 4.2% of the total (2015: 4.2%) of the called-up share capital as at the date of this report, have not been cancelled and represent a deduction from shareholders' equity. 15. Cash generated from continuing operations
2016 2015
£m £m
Operating profit for the year 143.4 118.5
Other non-cash costs 0.1 4.8
Depreciation charges 18.2 16.3
Impairment of goodwill - 2.8
Amortisation of deferred acquisition payments 3.2 1.5
Amortisation of intangible assets 11.9 13.0
Share-based payment charge 9.4 8.6
Pensions curtailment gain (1.5) -
Profit on sale of property, plant and equipment (6.7) -
Loss on sale of intangible assets - 0.1
Movement in provisions 0.5 (0.7)
Movement in trade and other receivables (16.7) (38.8)
Movement in payables (13.0) 41.1
Movement in non-current payables 0.1 (1.3)
Pension deficit funding (32.8) (32.0)
Cash generated from continuing operations 116.1 133.9
16. Analysis of net funds
1 April 2015
£m
Cash flow £m
Other non-cash changes
£m
Exchange movement
£m
31 March 2016
£m
Cash and cash equivalents 235.4 180.4 - 3.5 419.3
Loan notes receivable 21.8 (1.7) - - 20.1
Financial assets at fair value through profit or loss 33.4 (0.5) - - 32.9
Borrowings due no later than one year (61.0) - 54.0 - (7.0)
Borrowings due later than one year (50.2) (164.7) (54.0) (4.6) (273.5)
Finance leases (0.1) 0.1 (0.1) - (0.1)
Net funds 179.3 13.6 (0.1) (1.1) 191.7
Included within loan notes receivable is £0.4m (2015: £2.0m) relating to amounts receivable within less than 12 months from joint venture entities. 17. Related party transactions Details of the directors' shareholdings, share options and remuneration are given in the Remuneration report and form part of the Group’s Annual Report which will be available on the Group's website, www.atkinsglobal.com. Transactions with the retirement benefit schemes are shown in note 13. Details of the Company's subsidiaries and joint ventures form part of the Financial Statements and will be available on the Group's website, www.atkinsglobal.com. Provision of goods and services to and purchases of goods and services from related parties were made at the rates charged to external customers. The amounts outstanding are unsecured and will be settled in cash. No guarantees have been given or received. No provision has been made for doubtful debts in respect of amounts owed by related parties and £nil charged to income and expense (2015: £nil). a) Group sales and purchases of goods and services
2016 2015
£m £m
Sales of goods and services to joint ventures 42.5 30.7
Purchases of goods and services from joint ventures - -
b) Group year end balances arising from sales/purchases of goods and services to/from joint ventures and loans provided to joint ventures
2016 2015
£m £m
Receivables from joint ventures 1.7 6.4
Receivables from joint ventures are shown net of contract-related provisions of £nil (2015: £nil).
2016 2015
£m £m
Payables to joint ventures - -
c) Group year end balances arising from loans provided to other related parties
2016 2015
£m £m
Receivables from related parties 19.7 19.8
d) Company sales/purchases of goods and services to/from subsidiaries The Company did not sell any goods or services to subsidiaries during the year (2015: £nil). The Company did not purchase any goods or services from its subsidiaries during the year (2015: £nil). e) Company year end balances with subsidiaries
2016 2015
£m £m
Receivables from subsidiaries 339.2 169.4
Payables to subsidiaries 51.9 65.9
Receivables from subsidiaries are shown net of impairment of £0.5m (2015: £0.5m). f) Key management compensation Key management comprises the executive and non-executive directors, and certain senior managers who are members of the senior leadership team (SLT).
2016 2015
£m £m
Short-term employee benefits 6.3 7.3
Post-employment benefits 0.1 0.1
Share-based payments 1.5 2.3
7.9 9.7
The deferred share award element of any bonus paid to key management is not included in the salaries and other short-term employment benefits number as it is included in the share-based payment charge in subsequent years. 18. Events occurring after the reporting period Acquisition of projects, products and technology (PP&T) segment of EnergySolutions After the balance sheet date, on 11 April 2016, the Group acquired the PP&T segment of EnergySolutions for a cash consideration of $318m (approximately £226m), subject to working capital adjustments. The acquisition includes the integration of 650 staff who deliver a wide range of technical engineering and programme management services for the decontamination and decommissioning of high hazard nuclear facilities. Most of these staff are based in North America. The transaction included purchasing the entire share capital of EnergySolutions EU Ltd (UK), Duratek, Inc. (US), BNG America, LLC (US), P&T Global Solutions, LLC (US) and EnergySolutions Canada Group LTD (Canada). The acquisition expands the Group’s service offering in the nuclear energy sector and will significantly enhance the Group’s current nuclear capability, particularly in North America. PP&T also adds a significant portfolio of innovative, proprietary nuclear waste treatment technologies. As PP&T was acquired on 11 April 2016, no revenue or profit or loss relating to the acquired businesses has been included in the Group’s Consolidated Income Statement or the Group’s Consolidated Statement of Comprehensive Income. £3.3m of acquisition related costs have been included in the period ended 31 March 2016. The information given above for PP&T has been given as the acquisition was made after the reporting period but before the Financial Statements were signed and authorised for issue. At the time that the Financial Statements were signed and authorised for issue, the initial accounting for the business combination was incomplete, mainly due to the Group still working on finalising the fair value calculations of the acquired identifiable intangible assets. As a result, disclosures around the opening balance sheet, goodwill, fair value adjustments and preacquisition income statement have not been made.

General Information WS Atkins plc is a public limited company incorporated and domiciled in England with company number 1885586. The Company is listed on the London Stock Exchange. Copies of this preliminary financial information are available from the registered office: Woodcote Grove, Ashley Road, Epsom, Surrey, KT18 5BW, England and may be viewed on the Atkins website www.atkinsglobal.com.