results from testing a web mode for the consumer
TRANSCRIPT

Results from Testing a Web Mode for the Consumer
Expenditure Diary Survey
Ian Elkin, Laura Erhard, Brett McBride, and Dawn Nelson
Consumer Expenditure Survey Division/U.S. Census Bureau
CE Survey Methods SymposiumJuly 15, 2014
Presentation Outline
2
I. Web Diary Overview
II. Results – Sample Performance
III. Results – Expenditure Comparisons
IV. Findings and Recommendations

I. WEB DIARY OVERVIEW
3

Consumer Expenditure Diary Overview
The Consumer Expenditure Diary methodology uses PAPI – one week’s worth of expenditure entries (x2)
Census Field Representatives “place” the diary in-person and have up to two more visits
The CED gathers more detail than the Consumer Expenditure Quarterly Interview
The Diary is divided into four sections: Food Away From Home
Food for Home Consumption
Clothing, Shoes, Jewelry and Accessories
All Other Products, Services and Expenses
4

Web Diary Overview
5
Motivation
To encourage contemporaneous reporting,
improve accuracy through access across locations
and household members, provide a platform for
individual diaries, allow for a multiportal
approach, and to improve response rates by
offering alternative response modes to the
traditional paper diary.
Objective
To understand the operational issues regarding
implementing a web mode for CE and to
understand the data quality and response rates
associated with web collection.

Web Diary Logistics
6
Data Collection Period – Jan, Feb, Mar 2013
Separate online WD application
All research cases are “double placed”
FRs provide username and password to
Respondent via CAPI instrument
New outcome codes for Web Diary (final
disposition)
New materials
FR Talking Points (FR)
User Guide (FR)
Test Limitations
English only
No Multi-CU HHs or Replacement HHs

Web Diary Eligible Cases & Production Sample
7
Eligible Web Diary Cases
English only
No Multi-CU HHs or Replacement HHs
Home internet access via PC or tablet
Full Production Sample
All CE Diary cases fielded between January and
March 2013
Restricted Production Sample
Excluded non-English language interviews
Excluded Spawned HHs and Replacement HHs
Excluded HHs reporting no internet access or
internet access only through a mobile phone

II. RESULTS – SAMPLE PERFORMANCE & DEMOGRAPHICS
8

Sample Demographics & Characteristics
9
Web Diary Sample
(N = 456)
Restricted Production
(N = 2,261)
Full Production
(N = 3,251)
Average Age50.1 49.6 50.1
Average CU Size2.6 2.5 2.4
Race (percent)
White & Other Race87.1 86.5 85.1
Black6.8 9.2 10.9
Asian6.1 4.2 4.0
Ethnicity
Hispanic12.7% 9.8% 14.6%
Pre-tax Income Difference
Web Diary Sample–Restricted Production = $5,000

Sample Demographics & Characteristics
Web Diary Sample
(N = 456)
Restricted Production
(N = 2,261)
Full Production
(N = 3,251)
Gender
Male48.5% 51.0% 49.6%
Female51.5% 49.0% 50.4%
Education
Elementary0.9% 1.4% 3.6%
High school21.1% 26.7% 33.2%
College78.1% 71.8% 62.8%
Never attended- 0.1% 0.4%
Tenure
Homeowner73.0% 72.3% 64.4%
Renter27.0% 27.7% 35.6%
10

Overall Response Rates
11
Overall Response RatesWeb Diary Sample Restricted Production Full Production
RO Total
Eligible
Diaries Rate Total
Eligible
Diaries Rate Total
Eligible
Diaries Rate
New York 178 54 30.3% 536 301 56.2% 708 435 61.4%
Philadelphia 239 100 41.8% 722 410 56.8% 1,008 609 60.4%
Chicago 273 86 31.5% 560 373 66.6% 761 550 72.3%
Atlanta 286 80 28.0% 604 423 70.0% 845 598 70.8%
Denver 156 55 35.3% 584 329 56.3% 809 503 62.2%
Los Angeles 294 81 27.6% 710 425 59.9% 910 556 61.1%
Overall 1,426 456 32.0% 3,716 2,261 60.8% 5,041 3,251 64.5%
Response Rates
Web Diary Sample – 32.0%
Restricted Production – 60.8%
Full Production – 64.5%

III. RESULTS – EXPENDITURE COMPARISONS
12

Diary Completion
13
Analysis excluded non-respondents and removed diaries
that FRs indicated had no entries upon pick-up
Partial Recall – Diaries in which respondent provided
entries are augmented by entries collected through the
receipt/recall process
Diary Completion
Web Diary
CUs
Restricted
Production
CUs
Web Diary
Percent
Restricted
Production Percent
Difference
(Test-RP) Change
Week 1 entries only 38 52 19.0% 5.5% 13.5 245.5%
Week 2 entries only 7 95 3.5% 10.0% -6.5 -65.0%
Entries both weeks 155 801 77.5% 84.5% -7.0 -8.3%
Total 200 948 100.0% 100.0%

Number of Diary Entries
14
Total Entries among CUs entering 2 weeks of data without
total recall
Total Entries among CUs entering 2 weeks of data without
total recall, compared against double placed restricted
production CUs
Total EntriesWeb Diary Sample
(n=155)
Restricted Production
(n=801)
Difference
(Test-RP) Change
Mean entries 66.9 75.6 -8.7 -11.5%
Median entries 61.0 69.0 -8.0 -11.6%
Total Entries compared against double-placed RP CUs
Web Diary Sample
(n=155)
Double-Placed Restricted
Production (n=281)
Difference (Test-
RP) Change
Mean entries 66.9 79.4 -12.5 -15.7%
Median entries 61.0 74.0 -13.0 -17.6%
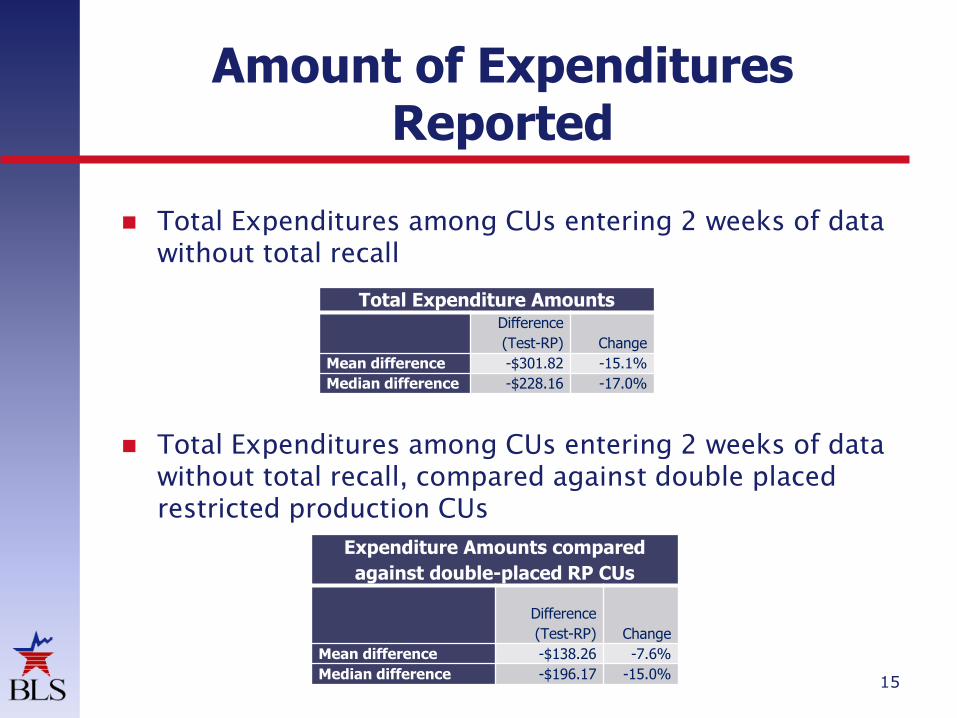
Amount of Expenditures Reported
15
Total Expenditures among CUs entering 2 weeks of data
without total recall
Total Expenditures among CUs entering 2 weeks of data
without total recall, compared against double placed
restricted production CUs
Total Expenditure AmountsDifference
(Test-RP) Change
Mean difference -$301.82 -15.1%
Median difference -$228.16 -17.0%
Expenditure Amounts compared
against double-placed RP CUs
Difference
(Test-RP) Change
Mean difference -$138.26 -7.6%
Median difference -$196.17 -15.0%

Number of Entries per Week
16
Cases were subset to include CUs not having any entries
from partial recall
Entries by CUs completing both weeks (no recall)Web Diary
Sample (n=126)
Restricted
Production (n=244)
Difference (Test-
RP) Change
Week 1 mean entries 37.8 41.7 -3.9 -9.4%
Week 1 median entries 35.0 37.0 -2.0 -5.4%
Week 2 mean entries 31.7 38.3 -6.6 -17.2%
Week 2 median entries 29.0 32.5 -3.5 -10.8%
Overall mean entries 69.5 80.0 -10.5 -13.1%
Overall median entries 62.0 75.5 -13.5 -17.9%
Within-CU proportion of entries entered in first week by
CUs completing both weeks (no recall)Web Diary
Sample (n=126) Restricted Production (n=244)
Proportion (Week 1) 54.8% 53.1%

Amount of Expenditures per Week
17
Cases were subset to include CUs not having any entries
from partial recall
Expenditure Totals for CUs completing both weeks (no
recall)
Difference (Test-RP) Change
Week 1 mean difference -$3.73 -0.4%
Week 1 median difference -$74.85 -12.8%
Week 2 mean difference -$244.32 -25.1%
Week 2 median difference -$93.84 -15.9%
Overall mean difference -$248.05 -13.2%
Overall median difference -$210.31 -15.5%
Within-CU proportion of expenditure amounts entered in first
week of CUs completing both weeks (no recall)Web Diary Sample
(n=126) Restricted Production (n=244)
Proportion (Week 1) 52.4% 52.1%

Association of Respondent Log-in Patterns
18
Expenditures
CUs that logged-in within the first three days and completed
both diary weeks had larger median expenditure amounts
($146 higher) than those that did not.
CUs that logged-in within the first three days and completed
both diary weeks had comparable median expenditure totals
to those in the RP subsample.
Entries
CUs completing two weeks of data entry and logging-in
early in the reporting period had a greater average number
of entries (77) compared to those that did not (65).
CUs logging-in within the first three days of the reporting
period had similar average number of entries (77) as those
in the paper diary RP sample (76).

Association of FR Follow-up Contacts
19
Expenditures
CUs receiving a FR reminder contact had a slightly higher
median weekly amount of reported expenditures ($50
higher).
Entries
CUs receiving a FR reminder contact had a slightly greater
median number of entries than those that did not (33 and 29
respectively).

Daily Expenditures between Test and RP Diaries
Although, RP CUs have a higher number of entries on average than test CUs, a greater percentage of RP CUs had days with no expenditures
20
0%
5%
10%
15%
20%
25%
30%
35%
40%
45%
1 2 3 4 5 6 7 8 9 10 11 12 13 14
Perc
ent
of CU
s w
ith n
o e
ntr
ies
Day of Expenditure
Change in Percent of CUs with No Daily Expenditures (among 2-week diary completers)
Test CUs (n=126) "DP RP" Production CUs (n=244)

IV. FINDINGS & RECOMMENDATIONS
FULL REPORT: HTTP://WWW.BLS.GOV/CEX/CE_STATPAPERS.HTM
21

Findings
Higher median expenditures for the following sections:
Clothing, Shoes, Jewelry, and Accessories
Food and Drinks for Home Consumption
Lower item nonresponse, as defined for a diary instrument
Week-to-week drop-off validates shift to one week collection period
22

Recommendations
Low Response Rates
Create flexible, but secure, username and password requirements
Restrict default usernames and passwords to specific characters
Print User Guide on non-glossy paper to facilitate username/password transcription
Change the test protocol to allow for FR collection and input of records, particularly receipts with numerous items
23

Recommendations
Higher Rate of Total Recall
Allow entry, into the instrument, of in-scope expenditures after the final day of collection
Assess different protocols for allowing the FR access to a summary of the respondent’s web diary entries
Set Date field to default to current day
Run daily analysis on the paradata to determine which respondents have not logged into the instrument as well as keeping a log of how many days have passed since the last successful logon by the respondent and, after a specific time period has lapsed, FRs will be notified to contact the respondent to remind them to enter any expenditures
24

Recommendations
Low Placement Rates
Create classroom training for any feasibility test that features enormous departures from past protocols
Implement the most recent security protocols, displaying security assurances in a prominent place within the instrument, and educate FRs on the most relevant data security concerns
Higher Ineligible Rates
Include multiple survey modes in order to determine which modal offering is optimal and the most effective
25

Recommendations
Other
Paradata should be formatted in a manner that is easily analyzed and readable
26
Acronym Definitions
WD – Web Diary
FR – Field Representative
R – Respondent
CU – Consumer Unit
HH - Household
CAPI – Computer-assisted Personal Interviewing
PAPI – Paper-and-Pencil Interviewing
CED – Consumer Expenditure Diary
27