results from the cryogenic dark matter search wolfgang rau on behalf of the cdms collaboration
Post on 21-Dec-2015
214 views
TRANSCRIPT

Results from theCryogenic Dark Matter Search
Wolfgang Rau
On behalf of the CDMS collaboration

CDMS Collaboration
California Institute of TechnologyZ. Ahmed, J. Filippini, S.R. Golwala, D. Moore
Case Western Reserve UniversityD. Akerib, C.N. Bailey, M.R. Dragowsky, D.R. Grant, R. Hennings-Yeomans
Fermi National Accelerator LaboratoryD. A. Bauer, F. DeJongh, J. Hall, D. Holmgren, L. Hsu, E. Ramberg, R.L. Schmitt, J. Yoo
Massachusetts Institute of TechnologyE. Figueroa-Feliciano, S. Hertel, S.W. Leman, K.A. McCarthy, P. Wikus
NIST *K. Irwin
Queen’s UniversityC. Crewdson *, P. Di Stefano *, J. Fox *, S. Liu *, C. Martinez *, P. Nadeau *, W. Rau
Santa Clara UniversityB. A. Young
SLAC/KIPAC * M. Asai, A. Borgland, D. Brandt, W. Craddock, E. do Couto e Silva, G.G. Godrey, J. Hasi, M. Kelsey, C. J. Kenney, P. C. Kim, R. Partridge, R. Resch, J.G. Weisend, D. Wright
Southern Methodist UniversityJ. Cooley
Stanford University P.L. Brink, B. Cabrera, M. Cherry *, R. Moffatt*, L. Novak, R.W. Ogburn , M. Pyle, M. Razeti*, B. Shank*, A. Tomada, S. Yellin, J. Yen*
Syracuse UniversityM. Kos, M. Kiveni, R. W. Schnee
Texas A&MK. Koch*, R. Mahapatra, M. Platt *, K. Prasad*, J. Snader
University of California, Berkeley M. Daal, T. Doughty* , N. Mirabolfathi, A. Phipps, B. Sadoulet, D. Seitz, B. Serfass, D. Speller*, K.M. Sundqvist
University of California, Santa BarbaraR. Bunker, D.O. Caldwell, H. Nelson
University of Colorado DenverB.A. Hines, M.E. Huber
University of FloridaT. Saab, D. Balakishiyeva, B. Welliver *
University of Minnesota H. Chagani*, J. Beaty, P. Cushman, S. Fallows, M. Fritts, T. Hoffer*, O. Kamaev, V. Mandic, X. Qiu, R. Radpour*, A. Reisetter, A. Villano*, J. Zhang
University of ZurichS. Arrenberg, T. Bruch, L. Baudis, M. Tarka* new collaborators or new institutions in SuperCDMS
CDMS resutls – W. Rau - SNOLAB Workshop 2010

• Introduction – Dark Matter• CDMS technology• Data Analysis and WIMP Results • Other Results (time permitting)
OverviewCDMS resutls – W. Rau - SNOLAB Workshop 2010

4Analysis
Results
ConclusionCD
MS
TechnologyD
ark M
atter
WMAP
Other
AnalysesIntroduction – Dark Matter
Coma Cluster
Vera Rubin-Cooper, Rotation curves1970s
Abell 2218 (HST)
Gravitational LensingBullet Cluster
Zwicky, 1930s Coma cluster
• Strong and multiple observational
evidence for dark matter
• Weakly Interacting Massive
Particles (WIMPs) are among the
best motivated candidates.
CDMS resutls – W. Rau - SNOLAB Workshop 2010

5
EvidenceAnalysis
Results
Conclusion
CDMS TechnologyOperating Principle
CDM
S Technology
Dark
Matt
erO
ther Analyses
Thermal couplingThermalbath
Phonon sensor
Target
+++ +
-- --
++
+ +
-- - - -
- -
++ +en
Phonon energy [keV]
Ioni
zatio
n en
ergy
[keV
eeq
]
Nuclear recoilsfrom neutrons
Electron recoilsfrom β’s and γ’s
• Phonon signal: measures energy deposition
• Ionization signal: distinguishes between electron (large) and nuclear recoils (small)
• Surface events have reduced ionization: need additional information to identify
Phon
on s
igna
lCh
arge
sig
nal
Electron recoil Nuclear recoil
CDMS resutls – W. Rau - SNOLAB Workshop 2010

6
EvidenceAnalysis
Results
Conclusion
CDMS TechnologyDetectors
CDM
S Technology
Dark
Matt
erO
ther Analyses
Cryogenic ionization detectors, Ge (Si)• = 7 cm, h = 1 cm, m = 250 g (100 g)• Thermal readout: superconducting phase
transition sensor (TES)• Transition temperature: 50 – 100 mK• 4 sensors/detector, fast signal (< ms)• Charge readout: Al electrode, divided
CDMS resutls – W. Rau - SNOLAB Workshop 2010

7
EvidenceAnalysis
Results
ConclusionCD
MS
TechnologyD
ark M
atter
Other
AnalysesCDMS Technology
Detector Performance
Detector
Ioni
zatio
n/Re
coil
ener
gy
Recoil energy [keV]
Collimator
++
+
+
––––
E++++
–– ––
+
Surface effect
b-band
g-band
n-band
gs
neutrons
bs
Reduced charge signalbut faster phonon signal
surface event
nuclear recoil
rising edge slope
CDMS resutls – W. Rau - SNOLAB Workshop 2010
8
EvidenceAnalysis
Results
ConclusionCD
MS
TechnologyD
ark M
atter
Other
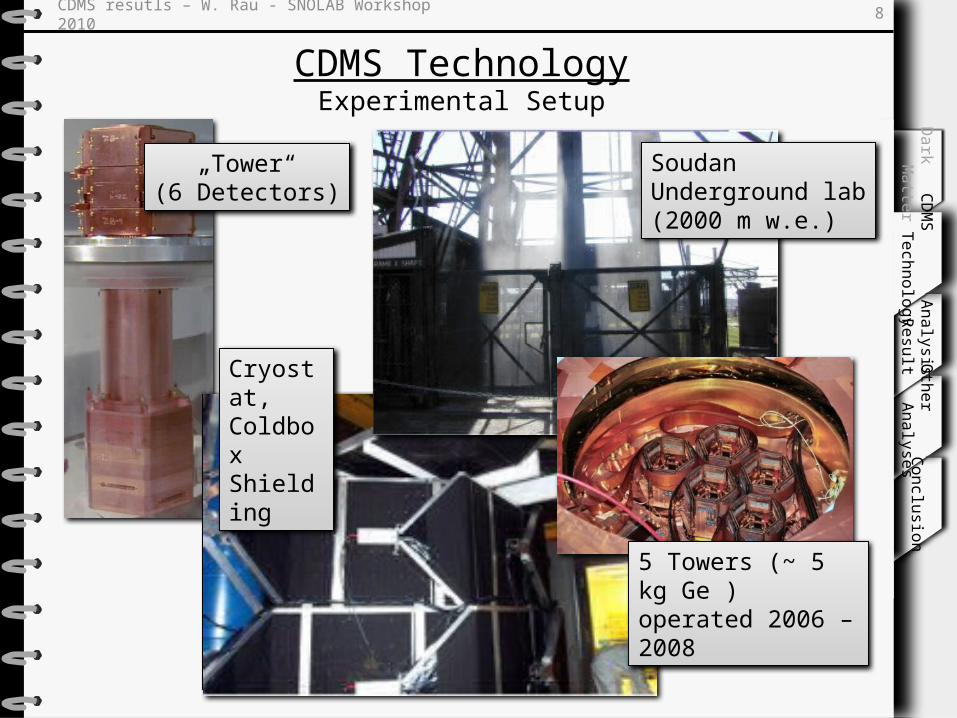
AnalysesCDMS Technology
Experimental Setup
„Tower“(6 Detectors)
Cryostat, ColdboxShielding
SoudanUnderground lab(2000 m w.e.)
5 Towers (~ 5 kg Ge ) operated 2006 – 2008
CDMS resutls – W. Rau - SNOLAB Workshop 2010

9
EvidenceCD
MS
TechnologyAnalysis
Results
ConclusionD
ark M
atter
Other
AnalysesData Analysis
Event Reconstruction
Time bins [0.8 s]
Ampl
itude
[a.u
.]
Event reconstruction• For each trigger ALL
detectors are read out, including muon-veto
• Optimal Filter(phonon pulse shape varying, so not really ‘optimal’, but gives best resolution)
• Extract basic parameters (Amplitude, Event time)
• Multi-parameter pulse fit• Events time-stamped to
correlate with slow control parameters / Minos neutrino beam
CDMS resutls – W. Rau - SNOLAB Workshop 2010

10
EvidenceCD
MS
TechnologyAnalysis
Results
ConclusionD
ark M
atter
Other
AnalysesData Analysis
Data Quality
Fra
ctio
n of
low
yie
ld e
vent
s
Dateda
tase
ts
templates
ExampleDetector neutralization / low yield events
Kolmogorov-Smirnov test• Pick a few ‘golden’ data sets• Compare parameter
distributions
average5 above average(colored points = poorly neutralized datasets)
Charge carriers trapped at defects build up counter field poor charge collections increase background
CDMS resutls – W. Rau - SNOLAB Workshop 2010

11
EvidenceCD
MS
TechnologyAnalysis
Results
ConclusionD
ark M
atter
Other
AnalysesData Analysis
Data Quantity
raw exposure
Total raw exposure is 612 kg-days
this work
2008 published data
some detectors not analyzed for WIMP scatters
periods of poor data quality
removed
recorded data
CDMS resutls – W. Rau - SNOLAB Workshop 2010

12
EvidenceCD
MS
TechnologyAnalysis
Results
ConclusionD
ark M
atter
Other
AnalysesData Analysis
Position Dependent Calibration
Tim
ing parameter
Position Dependence of Timing Parameter (measured with e-recoils)
events near and outside fiducial volume
increasin
g radius
Radi
us fr
om a
rriv
al ti
me
Radius from energy partition
• Large area sensor not completely homogeneous
• Use extensive calibration to create lookup table for position dependent pulse height/timing distributions
• Compare each event from WIMP search data with events at same location
• Position determination not perfect: ambiguity close to edge of detector where timing distributions are changing quickly
• May lead to miscalibration
Improvement in this analysis Include s outside fiducial volume in lookup table reduces timing outliers from miscalibration
CDMS resutls – W. Rau - SNOLAB Workshop 2010

13
EvidenceCD
MS
TechnologyAnalysis
Results
ConclusionD
ark M
atter
Other
AnalysesData Analysis
Background Estimate – Neutrons
Radiogenic Neutrons
From rock negligible (neutron shield!)
From experimental setup • estimated from screening
measurements, BG analysis• Main contributions from
spontaneous fission of U in Cu/Pb• Caveat: cannot measure U with
screening, only daughters – ICPMS measurement for EXO (Pb from same source) indicate lower contamination
• Total 0.03 – 0.06 events expected
Cosmogenic Neutrons
Muons in experimental setup; internal
negligible (muon veto detector)
Muons in surrounding rock; external• Use Monte Carlo to estimate rate• Compare MC for n from vetoed
(internal) muons to measured rate• Scale MC result for external muons
by ‘measured/MC’ ratio for internal muons
• Expected rate: 0.04 (stat) + 0.04– 0.03
CDMS resutls – W. Rau - SNOLAB Workshop 2010

14
EvidenceCD
MS
TechnologyAnalysis
Results
ConclusionD
ark M
atter
Other
AnalysesData Analysis
Background Estimate – Surface Events, ‘Leakage’
Timing Distribution – Surface vs. Neutrons
Surface events
from Ba calibration
Nuclear recoils from Cf neutron
source
Tail distribution different for each detector determines cut position
CDMS resutls – W. Rau - SNOLAB Workshop 2010
15
WIMP Search Data
EvidenceCD
MS
TechnologyAnalysis
Results
ConclusionD
ark M
atter
Other
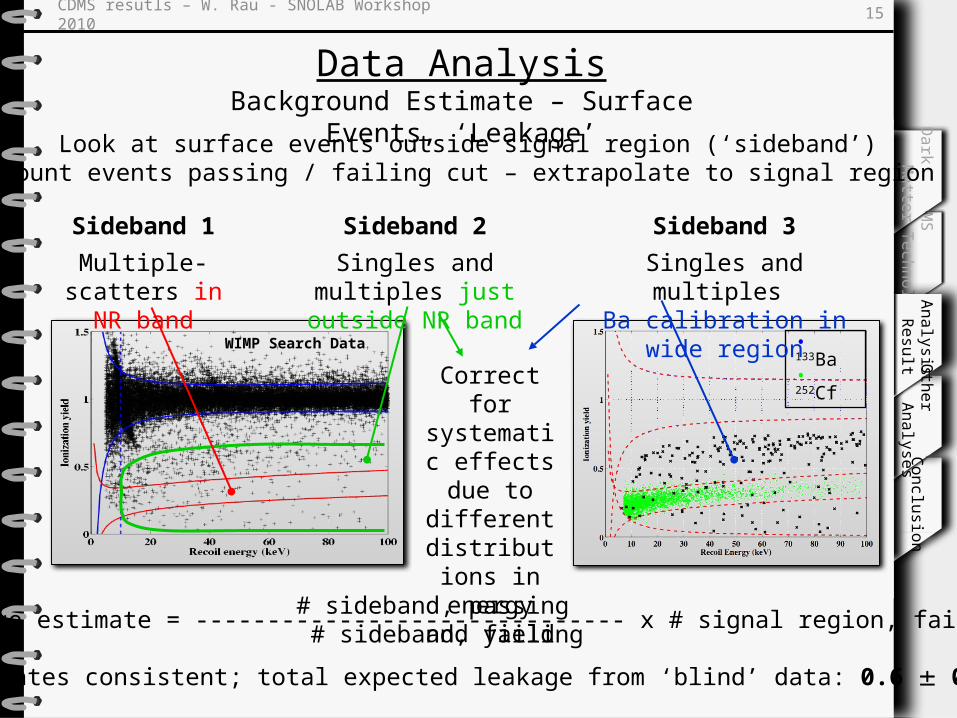
AnalysesData Analysis
Background Estimate – Surface Events, ‘Leakage’
Look at surface events outside signal region (‘sideband’)Count events passing / failing cut – extrapolate to signal region
• 133Ba• 252Cf
Sideband 2
Singles and multiples just outside NR band
Sideband 1
Multiple-scatters in NR band
Sideband 3
Singles and multiples Ba calibration in wide region
Correct for systematic
effects due to different
distributions in energy and
yield
Estimates consistent; total expected leakage from ‘blind’ data: 0.6 0.1
Leakage estimate = ------------------------------ x # signal region, failing# sideband, passing # sideband, failing
CDMS resutls – W. Rau - SNOLAB Workshop 2010

16
EvidenceCD
MS
TechnologyAnalysis
Results
ConclusionD
ark M
atter
Other
AnalysesData Analysis
Expected Sensitivity
CDMS resutls – W. Rau - SNOLAB Workshop 2010

17
EvidenceCD
MS
TechnologyConclusion
Dark
Matt
erO
ther Analyses
Data AnalysisUnblinding
masked signal region (2 NR band)
signal region
2 events near NR band
Event 1: Tower 1, ZIP 5 (T1Z5) Sat. Oct. 27, 20078:48pm CDT
Event 2: Tower 3, ZIP 4 (T3Z4) Sun. Aug. 5, 20072:41 pm CDT
Failing Cut ( Surface events)Passing Cut ( Good events)
AnalysisResu
lts
CDMS resutls – W. Rau - SNOLAB Workshop 2010

18
EvidenceCD
MS
TechnologyConclusion
Dark
Matt
erO
ther Analyses
Data AnalysisPost-unblinding Studies – Data Quality Recheck
Data Quality Item Resultmuon veto performance good neutralization good KS tests normal noise levels typical pre-pulse baseline rms typical background electron-recoil rate typical surface event rate typical radial position well-contained single-scatter identification good special running conditions no operator recorded issues no
Everything seems to have been in best order
AnalysisResu
lts
CDMS resutls – W. Rau - SNOLAB Workshop 2010

19
EvidenceCD
MS
TechnologyConclusion
Dark
Matt
erO
ther Analyses
Data AnalysisPost-unblinding Studies – Event Reconstruction
Could there be a problem with the start time of the charge pulse?
fitted start time
What is the true start time?
2 of t
he fi
ttemplate start time [ADC bin]
Closeup of template fit to ionization pulse for event 2
[ADC bin]
puls
e he
ight
(AD
C un
its)
A more careful accounting revised the surface event leakage estimate
from 0.6 to 0.8 events
• affects only ~1% of events with <6 keV ionization energy
• mostly accounted for in the pre-unblinding leakage estimate.
~
AnalysisResu
lts
CDMS resutls – W. Rau - SNOLAB Workshop 2010

20
EvidenceCD
MS
TechnologyConclusion
Dark
Matt
erO
ther Analyses
Data AnalysisCut Variation and Probabilities
1.0 10estimated surface event leakage from 133Ba
• Tightening cut to ~1/2 expected leakage would remove both events
• Would cost 26 % of exposure• Loosening cut to ~2 expected
leakage would add one more event• Limit not very sensitive to cut
position
• Probability to see 2 or more events from surface event leakage: ~20 %• Probability to see 2 or more events from background including neutrons: ~23 %
These values indicate that the results of this analysis cannot be interpreted as significant evidence for WIMP interactions, but we cannot reject either event as signal.
AnalysisResu
lts
CDMS resutls – W. Rau - SNOLAB Workshop 2010

21
EvidenceCD
MS
TechnologyConclusion
Dark
Matt
erO
ther Analyses
Data AnalysisLikelihood analysis
• Determine how well the event distribution fits surface event hypothesis
• Compare to how well it fits nuclear recoil hypothesis
• Conclusion: either might be possible AnalysisResu
lts
Surface events
from Ba calibration
Nuclear recoils from Cf neutron
source
CDMS resutls – W. Rau - SNOLAB Workshop 2010

22
EvidenceCD
MS
TechnologyConclusion
Dark
Matt
erO
ther Analyses
Data AnalysisLimits
Minimum @ ~70 GeV CDMS new 7.0 10-8 pbCDMS combined 3.8 10-8 pb
XENON 10
CRESST 08
ZEPLIN III
EDELWEISS (09)
WARP
CDMS, new CDMS (08)
CDMS, total
AnalysisResu
lts
CDMS resutls – W. Rau - SNOLAB Workshop 2010
Expectedsensitivity

23
EvidenceCD
MS
TechnologyConclusion
Dark
Matt
erO
ther Analyses
• Interaction may depend on spin of target
• May also depend on spin carrying nucleon (p or n)
• DAMA could avoid conflict with CDMS and XENON
• COUPP and PICASSO exclude most of the DAMA region
• If nucleon type is ignored, XENON provides strong limit
Spin Dependent InteractionPICASSO, COUPP, XENON
SuperKamiokande (p)
CRESST I
IceCube (p)
DAMA (p)CDMS (p)
COUPP (p)
PICASSO (p)
KIMS (n)
XENON (p)
KIMS (p)
XENON (n)
CDMS (n) COUPP, 4 kg(p, prelim 2010)
AnalysisResu
lts
CDMS resutls – W. Rau - SNOLAB Workshop 2010

24
EvidenceCD
MS
TechnologyConclusion
Dark
Matt
erO
ther Analyses
• Proposed by Wiener et al. could explain DAMA/LIBRA
• Scattering includes transition of WIMP to excited state ( E= )
• DAMA allowed: marginalized over cross section
• Hashed: excluded at 90 % C.L.
• New (preliminary) results from CRESST: all DAMA allowed region excluded
Data AnalysisInelastic Dark Matter
AnalysisResu
lts
CDMS resutls – W. Rau - SNOLAB Workshop 2010

25
EvidenceCD
MS
TechnologyConclusion
Dark
Matt
erO
ther Analyses
Other ResultsCoGeNT – Evidence for Dark Matter?
• Low threshold high resolution Ge detector
• Ultra low background• No discrimination• Observe rise in spectrum
at low energy• 2/dof for ‘no WIMP’
hypothesis: 20.4/20• Claim that fit with WIMPs
is better (give example for fit with 2/dof = 20.1/18)
• Show preferred region• Tension with CDMS Si data
(PhD thesis by J. Filippini, no paper published yet)
Preliminary!!
AnalysisResu
lts
CDMS resutls – W. Rau - SNOLAB Workshop 2010

26
EvidenceCD
MS
TechnologyConclusion
Dark
Matt
erO
ther Analyses
Other ResultsXENON100 – Preliminary Limit
XENON 10CDMS (08)
CDMS, total
AnalysisResu
lts
XENON 100
CDMS resutls – W. Rau - SNOLAB Workshop 2010

27
EvidenceAnalysis
Results
ConclusionCD
MS
TechnologyD
ark M
atter
Other
AnalysesOther Analyses
Axions
• Solar Axions• Convert in nuclear
electric field to • “Bragg” condition
enhances x-section
CDMS resutls – W. Rau - SNOLAB Workshop 2010

28
EvidenceAnalysis
Results
ConclusionCD
MS
TechnologyD
ark M
atter
Other
AnalysesOther Analyses
Low Energy Electron Recoils Spectrum
No excess above background!
Interpretation with respect to relic axions:• Signal: peak at axion mass• No preferred direction• Consider all electron
recoil events
CDMS resutls – W. Rau - SNOLAB Workshop 2010

29
EvidenceAnalysis
Results
ConclusionCD
MS
TechnologyD
ark M
atter
Other
AnalysesOngoing Analyses
Low Energy Threshold
• Expand energy range down to O(1 keV)No ER vs NR discrimination will have background, but expected rate increases strongly at low energy (low mass WIMPs)
• Dedicated ultra-low threshold experimentemploy Neganov-Luke effect (thermal signal amplification from drifting charges)
• Finalise Si analysis
CDMS resutls – W. Rau - SNOLAB Workshop 2010

30O
ther Analyses
AnalysisResu
lts
CDM
S Technology
Dark
Matt
erConclusion
Conclusion
• We present the analysis of new data comprising 612 kgd raw exposure• Expected background is 0.8 from surface events and <0.1 from neutrons• We observe 2 events• This result is statistically compatible with expected background
(23 % prob), so they do not constitute statistically significant signal• Both events are compatible with being nuclear recoils or surface event
background• Other analyses: solar axions, low energy ER, low threshold WIMP analysis
CDMS resutls – W. Rau - SNOLAB Workshop 2010

31
EvidenceConclusion
Super- heated
CryogenicD
irectionalScintillator
Fine
CDMS resutls – W. Rau - SNOLAB Workshop 2010