results of breast cancer screening perception & awareness survey 2010
DESCRIPTION
Results of Breast Cancer Screening Perception & Awareness Survey 2010. Feb 2011. Background. In Hong Kong, breast cancer is… The most common type of cancer for women Mortality rate ranks third among all female cancer types - PowerPoint PPT PresentationTRANSCRIPT
Results of Breast Cancer Screening Perception & Awareness Survey 2010
Feb 2011

BackgroundIn Hong Kong, breast cancer is…
The most common type of cancer for women
Mortality rate ranks third among all female cancer types
One in every 20 females has a chance to develop breast cancer in her lifetime
8 women are diagnosed every day

Research Objectives
To examine the trend of Hong Kong women’s awareness about breast cancer, attitudes towards and practice of breast examinations
To investigate the motivations and barriers that influence women’s attendance to breast examinations

Research Design
Methodology: Computer Assisted Telephone Interviewing
Sample Size: 800 interviews averaging 20 to 23 minutes
Subjects : Women aged 18-59
Fieldwork Period: 22 Nov – 10 Dec 2010
Notes: weighting has been applied in terms of age according to Hong Kong population, the latest census statistics (source: C&SD, 2010)

60% respondents named breast cancer the most common cancer among women in HK
62
17
10
1
10
Breast Cancer
Cervical Cancer
Uterine Cancer
Lung Cancer
Don't know/ refused
Age 18-29: 27%Age 30-39: 20%Age 40-59: 8%
Age 18-29: 51%Age 30-39: 59%Age 40-59: 68%
Base: All females aged 18-59Weighted base (’000) 2,540Unweighted base 800
%

Total StudentsWhite Collar PME Blue Collar Other Non working
18-29 30-39 40-59 18-39 40-59 18-39 40-59 18-39 40-49 50-59
Breast Cancer 62% 45% 63% 67% 77% 47% 83% 46% 66% 55% 64% 64%
Cervical Cancer 17% 42% 21% 22% 8% 26% 14% 18% 9% 21% 17% 7%
Uterine Cancer 10% 7% 7% 5% 5% 6% - 17% 16% 10% 12% 13%
Don't know/ refused
10% 5% 7% 1% 9% 15% 3% 15% 9% 13% 6% 14%
Base: All females aged 18-59Weighted base (’000) 2540 131 246 230 245 116 93 259 259 256 274 349Unweighted base 800 54 73 71 77 35# 29## 81 82 75 86 111
Note: ‘total’ mentions less than 3% are not shown
# small base; ## very small base
Elder women tend to be more aware of breast cancer. Among the highest risk group (40-59), non-working or blue-collar women were less aware than white-collars, professionals , managers & executives (PME).

About half respondents think regular breast exam should start after 30
11
14
21
22
9
11
6
6
1
19 or below
20 – 24
25 – 29
30 – 34
35 – 39
40 – 44
45 or above
Don’t know
No Need
%Average age: 29
54%
Base: All females aged 18-59Weighted base (’000) 2,540Unweighted base 800

Few acted on their knowledge about the three ways of breast examinations
Breast Self-Examination (BSE)
Clinical Breast Examination (CBE)
Mammogram (MMG)
(Among targeted population aged 40-
59)
%
Doing regularly*
%GAP
%
29 65
44 * 52
18 * 59
Base: All females aged 40-59Weighted base (’000) 2,540Unweighted base 800
Don’t know: 14% * Based on fulfilling frequency recommended by HKBCF:- SBE: at least once a month - CBE: at least once every 2 yrs- MMG: for 40-59, at least once every 2 yrs
Knowing (%)

Awareness-action gaps for Breast Exams were widest among youngest group.
18-29 30-39 40-49 50-59
Recommended Frequency (Monthly)*Aided Awareness 93% 93% 97% 95% Observe Recommendation 17% 27% 38% 36%Awareness-action gap 76% 66% 59% 59%
Breast Self-Examination
Recommended Frequency*^Every 3 yrs Every 3 yrs Every 2 yrs Every 2 yrsAided Awareness 97% 95% 97% 95% Observe Recommendation 21% 49% 56% 49% Awareness-action gap 76% 46% 41% 46%
Clinical Breast Examination
Mammography Screening
Recommended Frequency* Every 2 yrsAided Awareness 46% 63% 80% 73% Observe Recommendation NA NA 19% 17%Awareness-action gap NA NA 61% 56%
Base: All females aged 18-59Weighted base (’000) 624 656 694 567 Unweighted base 199 203 218 180
* Proper breast cancer screening procedures as recommended by HKBCF^ For 18-29 and 30-39 y.o., fulfilling recommended frequency is based on at least once every 2 years
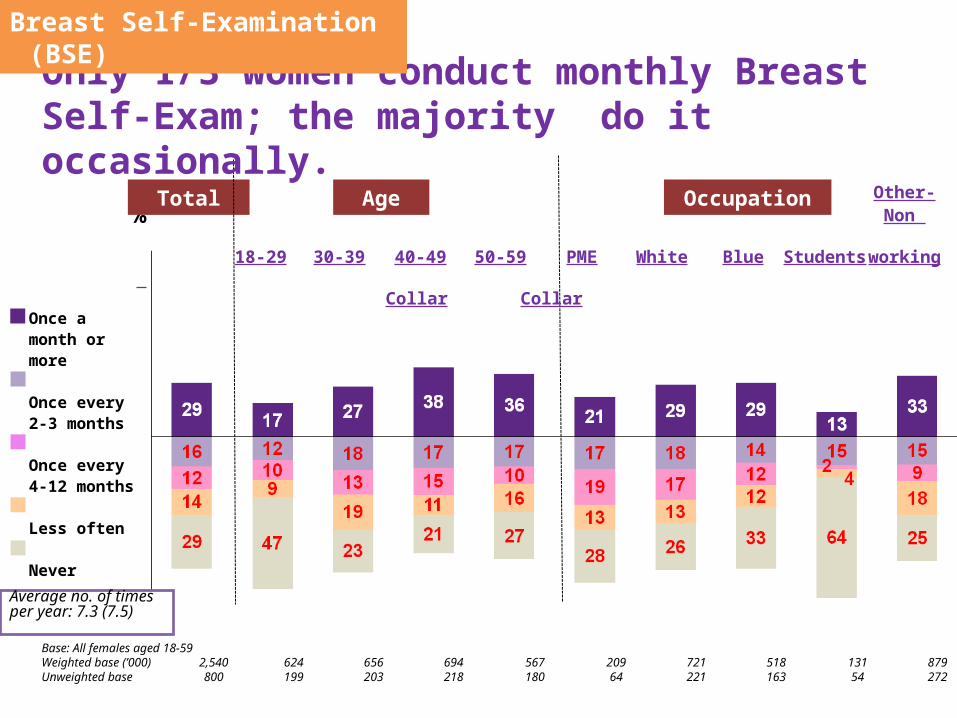
%Total Age Occupation Other-
Non
18-29 30-39 40-49 50-59 PME White Blue Students working Collar Collar
Base: All females aged 18-59Weighted base (’000) 2,540 624 656 694 567 209 721 518 131 879Unweighted base 800 199 203 218 180 64 221 163 54 272
Average no. of times per year: 7.3 (7.5)
Once a month or more
Once every 2-3 months
Once every 4-12 months
Less often
Never
Only 1/3 women conduct monthly Breast Self-Exam; the majority do it occasionally.
Breast Self-Examination (BSE)
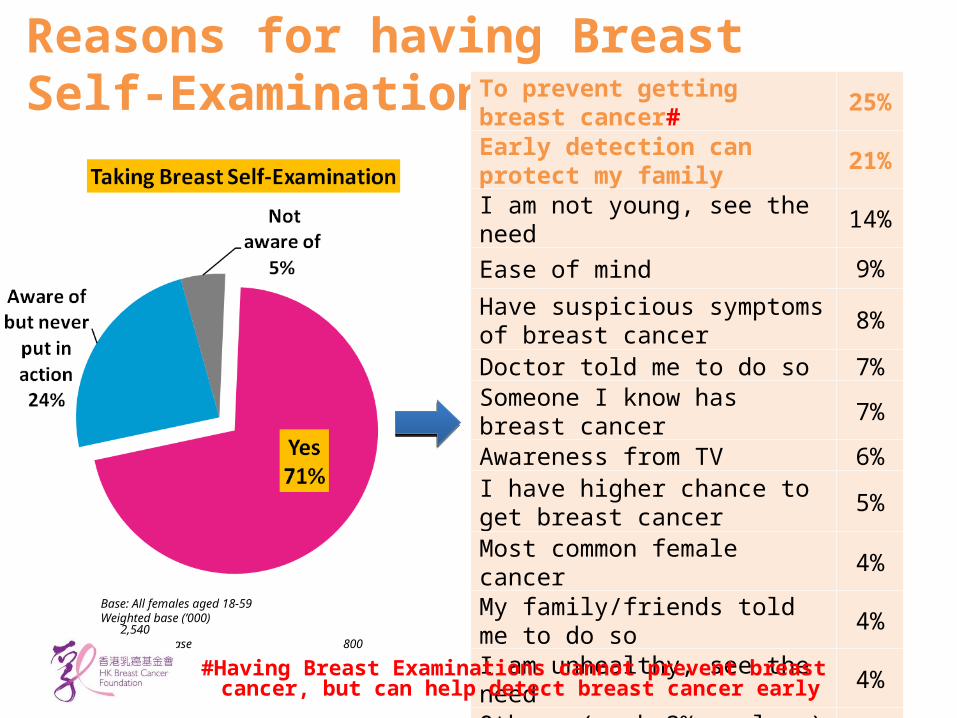
Reasons for having Breast Self-ExaminationTo prevent getting breast cancer# 25%Early detection can protect my family
21%
I am not young, see the need 14%
Ease of mind 9%
Have suspicious symptoms of breast cancer
8%
Doctor told me to do so 7%Someone I know has breast cancer 7%Awareness from TV 6%I have higher chance to get breast cancer 5%
Most common female cancer 4%My family/friends told me to do so 4%I am unhealthy, see the need 4%Others (each 3% or less)Base: Those who did self breast examinationWeighted base (’000) 1,805Unweighted base 560
Base: All females aged 18-59Weighted base (’000)
2,540Unweighted base 800
#Having Breast Examinations cannot prevent breast cancer, but can help detect breast cancer early

Reasons for not doing Breast Self-Exam
I am healthy, do not see the need 30%
Don’t know how to do it 29%
I am still young, do not see the need 17%
Already have medical check-up 16%
Don’t know how to determine whether it is a problem or not 8%
I have lower chance to get breast cancer 6%
Checkup is useless if you are meant to have it 4%
Others (each 3% or less)Base: Those who are aware but never did self breast examinationWeighted base (’000) 595Unweighted base 194
Base: All females aged 18-59Weighted base (’000)
2,540Unweighted base 800

%
Total Age Occupation Other-Non
18-29 30-39 40-49 50-59 PME White Blue Students working Collar Collar
Average no. of times per year: 0.7 (0.8)
Once a year
or more
Once every
2 years
Once every
3-5 years or
less
Not regular
Never
Base: All females aged 18-59Weighted base (’000) 2,540 624 656 694 567 209 721 518 131 879Unweighted base 800 199 203 218 180 64 221 163 54 272
Clinical Breast Examination
One-third had attended Clinical Breast Examination

Reasons for having Clinical Breast ExamIncluded when doing my female body check-up 39%
Included in my body check-up 17%To prevent getting breast cancer# 8%
Doctors are more professional in checking 8%
Have suspicious symptoms for breast cancer 7%
I am not young, see the need 6%Early detection can protect my family 5%
Ease of mind 4%It is included in my insurance plan 4%
Others (each 3% or less)Base: Those who did clinical breast examinationWeighted base (’000) 1,575Unweighted base 481
Base: All females aged 18-59Weighted base (’000)
2,540Unweighted base 800
#Having Breast Examinations cannot prevent breast cancer, but can help detect breast cancer early

Reasons for not having Clinical Breast Exam
I am healthy, do not see the need 43% I am still young, do not see the need 20%
Do not have time 13% Expensive 9% I can examine by myself 9% I have lower chance to get breast cancer 6%
Don’t know where to have medical check-up 5%
It’s embarrassing 4%
Others (each 3% or less)Base: Those who are aware but never did clinical breast examinationWeighted base (’000) 868Unweighted base 289
Base: All females aged 18-59Weighted base (’000)
2,540Unweighted base 800

Rates of regular mammography screening are low.
Total Age Occupation
Once a year
or more
Once every
2 years
Once every
3-5 years or
less
Not regular
Never
Other-Non
18-29 30-39 40-49 50-59 PME White Blue Students working Collar Collar
%
Average no. of times per year: 0.5 (0.5)
Base: All females aged 18-59Weighted base (’000) 2,540 624 656 694 567 209 721 518 131 879Unweighted base 800 199 203 218 180 64 221 163 54 272
# small base; ## very small base
Mammography Screening
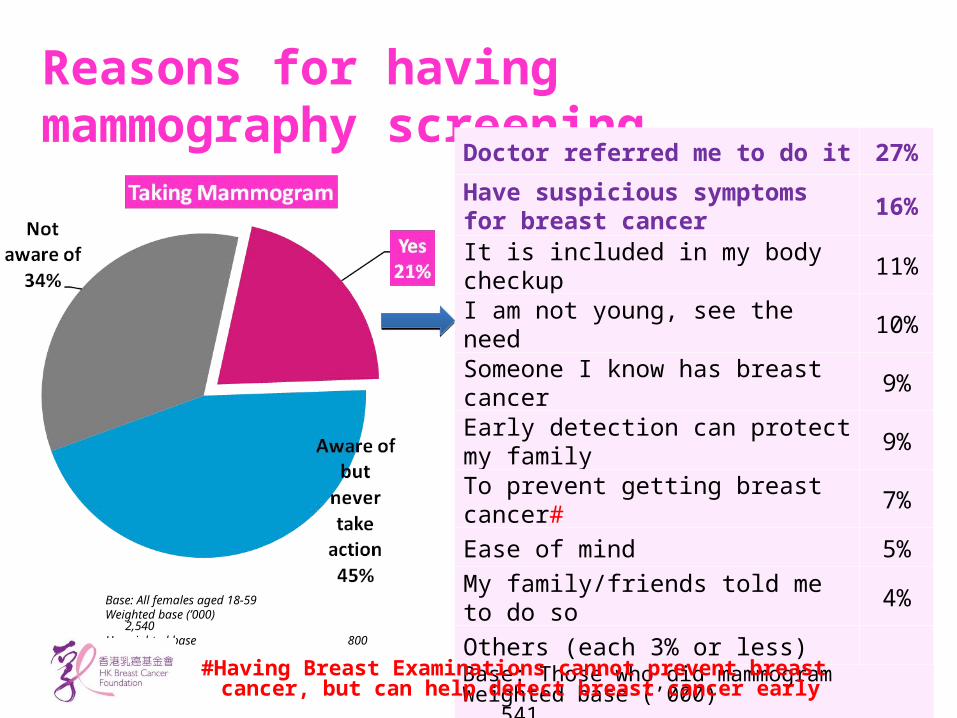
Reasons for having mammography screening
Doctor referred me to do it 27%
Have suspicious symptoms for breast cancer 16%
It is included in my body checkup 11%
I am not young, see the need 10%
Someone I know has breast cancer 9%
Early detection can protect my family 9%
To prevent getting breast cancer# 7%
Ease of mind 5%
My family/friends told me to do so 4%
Others (each 3% or less)Base: Those who did mammogramWeighted base (’000) 541Unweighted base 171
Base: All females aged 18-59Weighted base (’000)
2,540Unweighted base 800
#Having Breast Examinations cannot prevent breast cancer, but can help detect breast cancer early
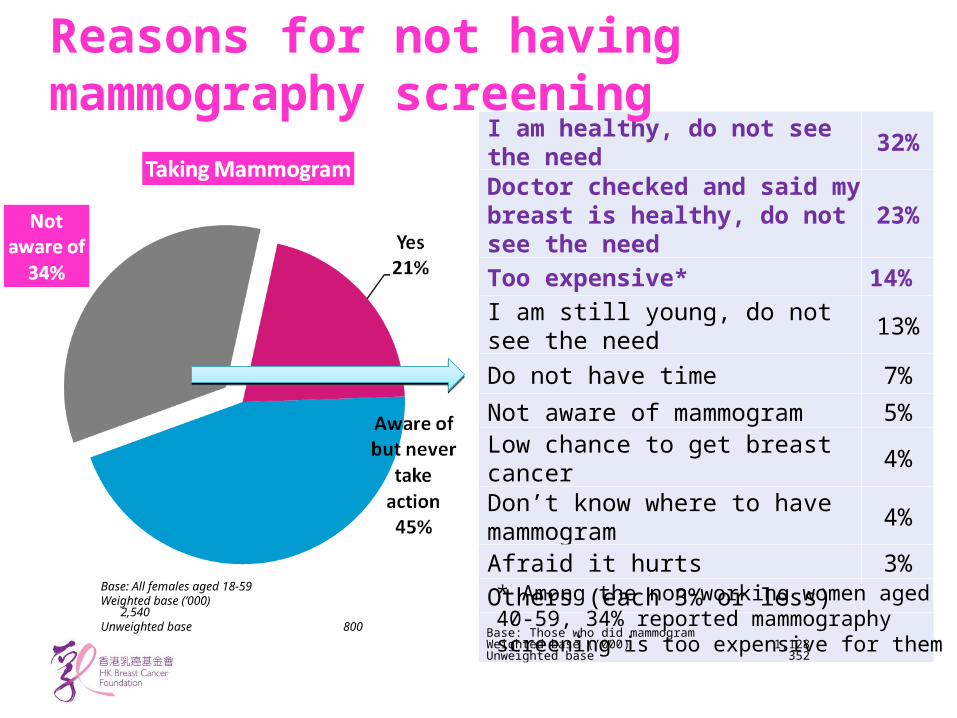
I am healthy, do not see the need 32%Doctor checked and said my breast is healthy, do not see the need 23%
Too expensive* 14%
I am still young, do not see the need 13%
Do not have time 7%
Not aware of mammogram 5%Low chance to get breast cancer 4%Don’t know where to have mammogram 4%
Afraid it hurts 3%Others (each 3% or less)Base: Those who did mammogramWeighted base (’000) 1,128Unweighted base 352
Base: All females aged 18-59Weighted base (’000)
2,540Unweighted base 800
* Among the non-working women aged 40-59, 34% reported mammography screening is too expensive for them
Reasons for not having mammography screening
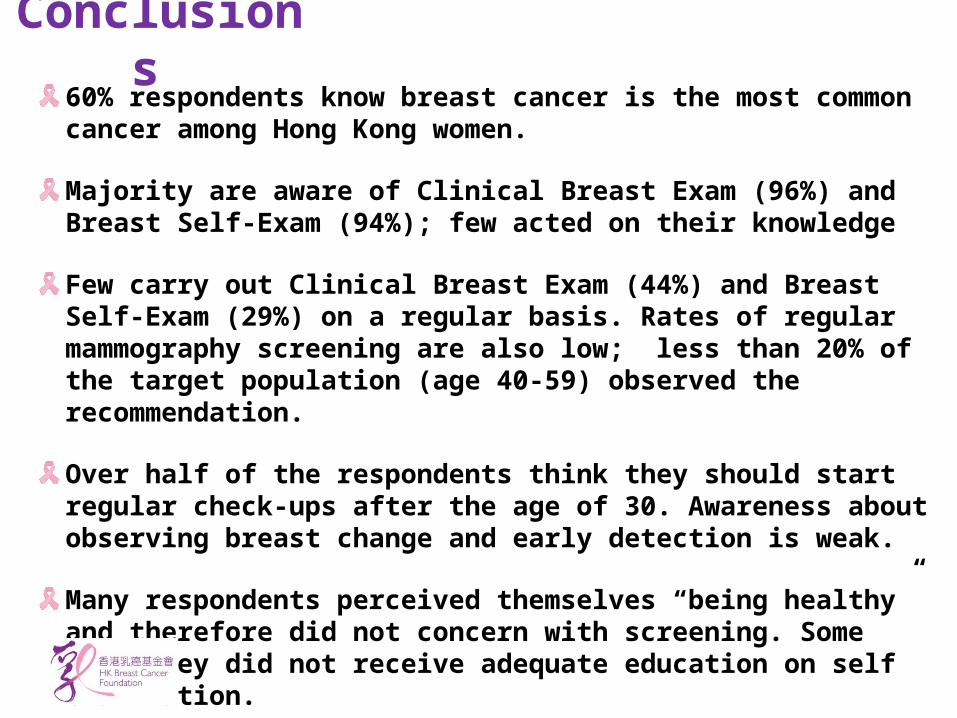
Conclusions 60% respondents know breast cancer is the most common cancer among Hong Kong women.
Majority are aware of Clinical Breast Exam (96%) and Breast Self-Exam (94%); few acted on their knowledge
Few carry out Clinical Breast Exam (44%) and Breast Self-Exam (29%) on a regular basis. Rates of regular mammography screening are also low; less than 20% of the target population (age 40-59) observed the recommendation.
Over half of the respondents think they should start regular check-ups after the age of 30. Awareness about observing breast change and early detection is weak.
Many respondents perceived themselves “being healthy” and therefore did not concern with screening. Some said they did not receive adequate education on self examination.
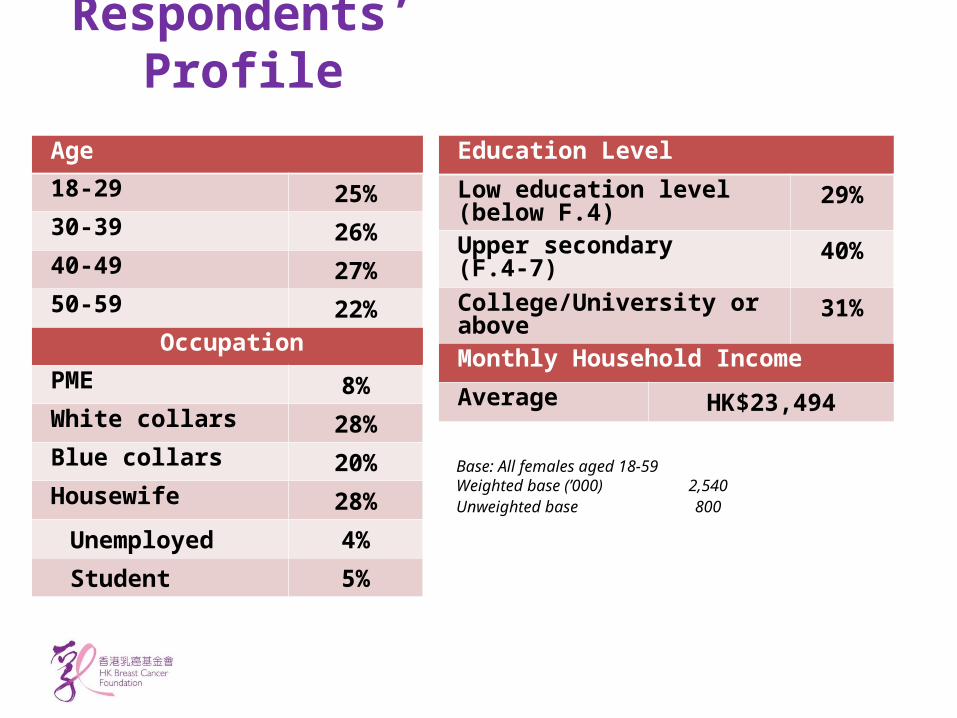
Respondents’ Profile
Age18-29 25%30-39 26%40-49 27%50-59 22%
OccupationPME 8%White collars 28%Blue collars 20%Housewife 28%
Unemployed 4%
Student 5%
Education Level
Low education level (below F.4) 29%Upper secondary (F.4-7)
40%
College/University or above 31%Monthly Household Income
Average HK$23,494
Base: All females aged 18-59Weighted base (’000) 2,540Unweighted base 800