results of mbank group q1 2017 - de.marketscreener.com sa...|2 key highlights of q1 2017 strong...
TRANSCRIPT

Results of mBank Group
Q1 2017
Promising start to the yearwith strong operating results
Management Board of mBank S.A.
Investor Presentation
April 27, 2017

|2
Key highlights of Q1 2017
Strong total revenues
exceeding PLN 1.08 B
Net Profit of PLN 218.8 M,
-25.2% compared to Q4/16
Businessdevelopment
Volumes
Profit & Loss
Capital &Liquidity
Selective volume growth
• Gross loans at PLN 84.5 B
(-0.1% QoQ, +4.4% YoY)1
• Customer deposits at PLN 88.7 B
(-2.8% QoQ, +8.7% YoY)1
Focus on higher margin lending
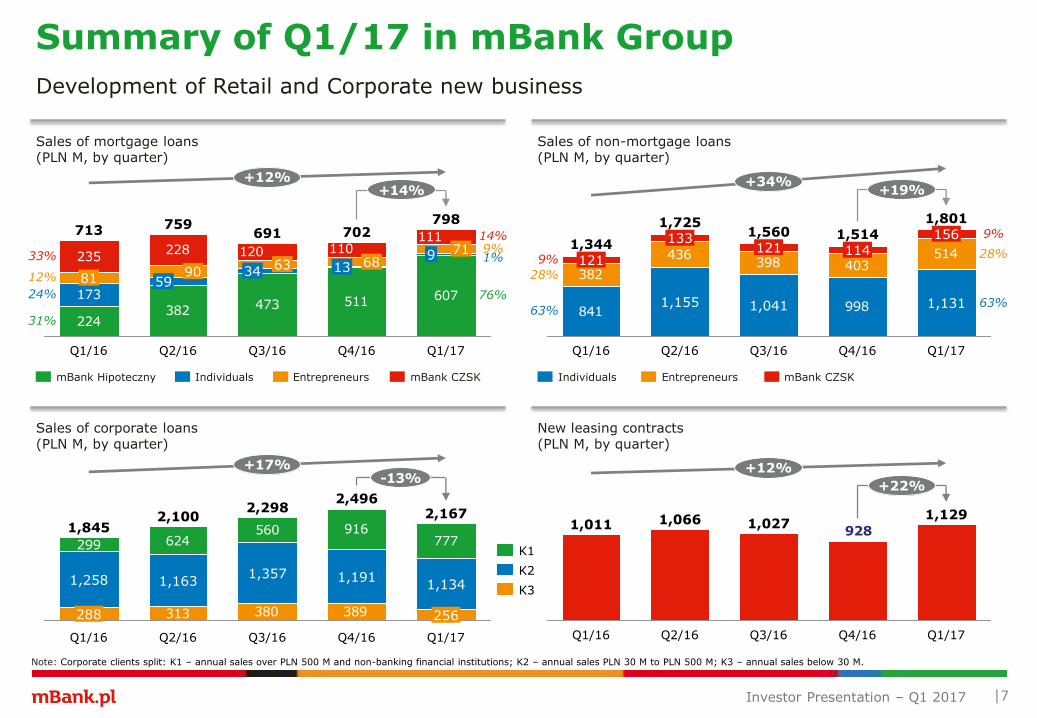
• Mortgage loan sales at PLN 0.8 B in
Q1/17 (+12% YoY); non-mortgage
loan sales at PLN 1.8 B (+34% YoY)
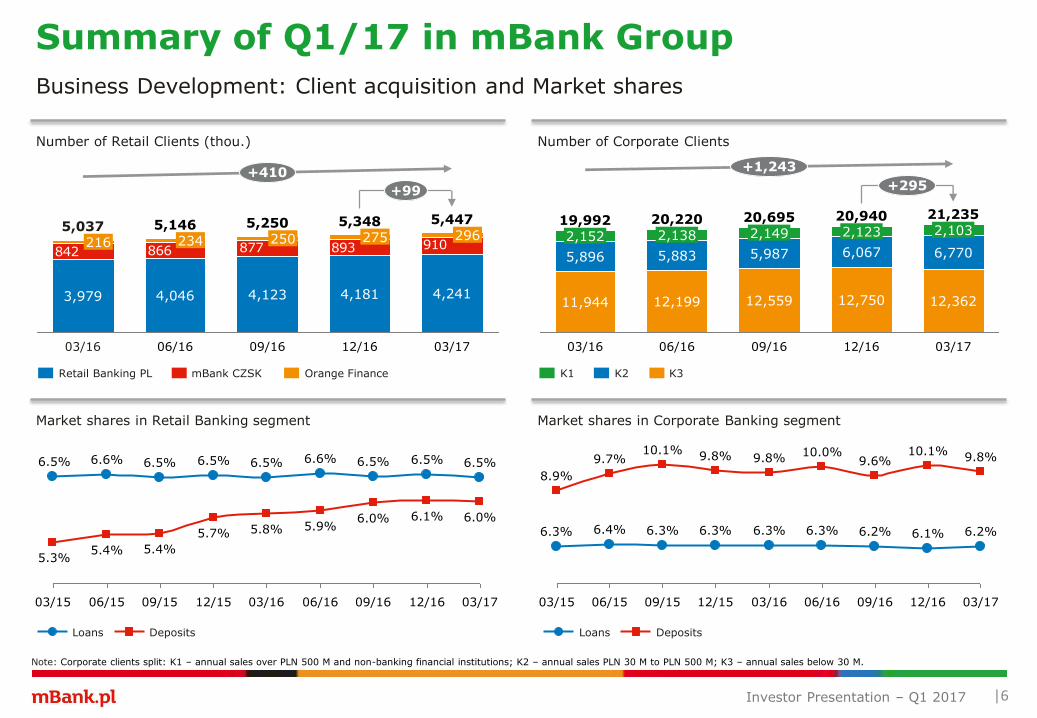
Accelerating client acquisition
• 5,447 thou. retail clients (+410
thou. YoY) and 21,235 corporate
clients (+1,243 YoY)
Solid efficiency maintained
• Cost/Income ratio at 53.4%
Core income of PLN 998.6 M close to historical heights
• NII at PLN 749.0 M (+10.7% YoY),
on improved margins
• NFC at PLN 249.6 M (+17.9% YoY),
on rising customer business
Capital ratios well above regulatory requirements
• CET 1 Ratio at 18.8%/22.1%2
• Total Capital Ratio at 21.6%/25.4%2
Diversification of funding
• New issue under EMTN programme
Sound deposit base
• Loan-to-Deposit ratio at 92.1%
1 Volume dynamics presented excl. reverse repo / buy-sell-back transactions and repo transactions, respectively; 2 Stand-alone capital ratios;
Strengthening the position as mobile and transactional bank
• Enhanced mobile application and
new mCompanyNet platform
• Launch of mBank’s FinTech fund
Investor Presentation – Q1 2017
|3
Agenda
Summary of Q1/17 in mBank Group
Key Financials
Client acquisition and Market shares
Development of retail and corporate new business
Analysis of Q1/17 Results
Development of Loans and Deposits
Development of Income and Costs
Loan Portfolio Quality
Funding Structure Details
Capital and Liquidity Ratios
Macroeconomic Update
Appendix
Additional Information: Selected Financial Data
Detailed Results of Business Lines
Investor Presentation – Q1 2017

PLN million Q1/16 Q4/16 Q1/17 change QoQ change YoY
Net interest income 676.4 753.3 749.0 -0.6% +10.7%
Net fee and commission income 211.7 250.6 249.6 -0.4% +17.9%
Total income 1,008.9 1,044.7 1,081.8 +3.5% +7.2%
Total costs (excl. BFG) -443.6 -442.7 -445.5 +0.6% +0.4%
Contributions to the BFG1
-37.1 -49.2 -132.2 --- ---
Loan Loss Provisions -68.5 -39.7 -82.9 +109.0% +21.0%
Operating profit 459.6 513.1 421.2 -17.9% -8.4%
Taxes on the Group balance sheet items -57.3 -92.8 -91.3 -1.6% +59.3%
Profit before income tax 402.3 420.3 329.9 -21.5% -18.0%
Net profit 307.8 292.5 218.8 -25.2% -28.9%
Net Interest Margin (NIM) 2.29% 2.35% 2.42% +0.07 p.p. +0.12 p.p.
NIM excl. CHF portfolio 2.66% 2.69% 2.77% +0.08 p.p. +0.11 p.p.
Cost/Income ratio 47.7% 47.1% 53.4% +6.3 p.p. +5.7 p.p.
Cost of Risk 0.35% 0.20% 0.41% +0.21 p.p. +0.06 p.p.
Return on Equity (ROE) 10.1% 9.8% 6.8% -3.0 p.p. -3.3 p.p.
Return on Assets (ROA) 0.99% 0.88% 0.68% -0.20 p.p. -0.31 p.p.
|4
1 Q4/16 contributions include additional payment to the Bank Guarantee Fund related to the bankruptcy of Cooperative Bank in Nadarzyn of PLN 10.9 million;Q1/17 contributions consist of annual payment to the Resolution Fund of PLN 116.8 million and quarterly payment to the Deposit Guarantee Scheme of PLN 15.4 million;
Key Financials: Profit and Loss Account
Summary of Q1/17 in mBank Group
Investor Presentation – Q1 2017

PLN million Q1/16 Q4/16 Q1/17 change QoQ change YoY
Total assets 123,268 133,744 130,488 -2.4% +5.9%
Gross loans to customers 80,925 84,581 84,538 -0.1% +4.5%
Retail client loans 46,511 48,950 48,338 -1.2% +3.9%
Core corporate client loans1 32,801 34,118 34,759 +1.9% +6.0%
Amounts due to customers 81,134 91,418 88,744 -2.9% +9.4%
Retail client deposits 47,835 53,495 53,829 +0.6% +12.5%
Core corporate client deposits1 31,771 35,783 32,080 -10.3% +1.0%
Total equity 12,627 13,051 13,338 +2.2% +5.6%
Loan to Deposit ratio 96.1% 89.4% 92.1% +2.6 p.p. -4.0 p.p.
NPL ratio 5.8% 5.4% 5.2% -0.2 p.p. -0.6 p.p.
Coverage ratio 58.6% 57.1% 59.4% +2.3 p.p. +0.7 p.p.
Common Equity Tier 1 Ratio 16.2% 17.3% 18.8% +1.5 p.p. +2.6 p.p.
Total Capital Ratio 19.0% 20.3% 21.6% +1.3 p.p. +2.6 p.p.
|5
Key Financials: Balance Sheet
1 Excluding reverse repo / buy-sell-back transactions for loans and repo transactions for deposits;
Investor Presentation – Q1 2017
Summary of Q1/17 in mBank Group
Retail Banking PL mBank CZSK Orange Finance
|6
Business Development: Client acquisition and Market shares
Number of Retail Clients (thou.) Number of Corporate Clients
+295
+1,243
12/16
20,940
12,750
6,067
2,123
09/16
20,695
12,559
5,987
2,149
06/16
20,220
12,199
5,883
2,138
03/16
19,992
11,944
5,896
2,152
03/17
21,235
12,362
6,770
2,103
K1 K2 K3
Market shares in Retail Banking segment Market shares in Corporate Banking segment
12/16
10.1%
6.1%
09/16
9.6%
6.2%
06/16
10.0%
6.3%
03/16
9.8%
6.3%
12/15
9.8%
6.3%
09/15
10.1%
6.3%
06/15
9.7%
6.4%
03/15
8.9%
6.3%
03/17
6.2%
9.8%
DepositsLoans
03/17
6.0%
6.5%
12/16
6.1%
6.5%
09/16
6.0%
6.5%
06/16
5.9%
6.6%
03/16
5.8%
6.5%
12/15
5.7%
6.5%
09/15
5.4%
6.5%
06/15
5.4%
6.6%
03/15
5.3%
6.5%
DepositsLoans
910893877866842
+99
+410
12/16
5,348
4,181
275
09/16
5,250
4,123
250
06/16
5,146
4,046
234
03/17
5,447
4,241
296
03/16
5,037
3,979
216
Note: Corporate clients split: K1 – annual sales over PLN 500 M and non-banking financial institutions; K2 – annual sales PLN 30 M to PLN 500 M; K3 – annual sales below 30 M.
Investor Presentation – Q1 2017
Summary of Q1/17 in mBank Group
|7
382
436398 403
514
998841
+19%+34%
Q1/17
1,801
1,131
156
Q4/16
1,514114
Q3/16
1,560
1,041
121
Q2/16
1,725
1,155
133
Q1/16
1,344121
Sales of mortgage loans(PLN M, by quarter)
Sales of non-mortgage loans(PLN M, by quarter)
Individuals Entrepreneurs mBank CZSK
Development of Retail and Corporate new business
Sales of corporate loans(PLN M, by quarter)
New leasing contracts(PLN M, by quarter)
28%
9%
63%
mBank CZSKIndividualsmBank Hipoteczny Entrepreneurs
928
+12%
+22%
Q1/17
1,129
Q4/16Q3/16
1,027
Q2/16
1,066
Q1/16
1,011
28%
9%
63%
Note: Corporate clients split: K1 – annual sales over PLN 500 M and non-banking financial institutions; K2 – annual sales PLN 30 M to PLN 500 M; K3 – annual sales below 30 M.
K3
K2
K1
9%14%
1%
76%
224382 473 511 607
235228
173
110120111
+12%+14%
Q1/17
798
9 71
Q4/16
702
13 68
Q3/16
691
3463
Q2/16
759
5990
Q1/16
713
8112%
33%
24%
31%
313
299 624560 916
777
389380
+17%-13%
Q1/17
2,167
256
1,134
Q4/16
2,496
1,191
Q3/16
2,298
1,357
Q2/16
2,100
1,163
Q1/16
1,845
288
1,258
Investor Presentation – Q1 2017
Summary of Q1/17 in mBank Group
-13%
+14% +19%
|8
Agenda
Summary of Q1/17 in mBank Group
Key Financials
Client acquisition and Market shares
Development of retail and corporate new business
Analysis of Q1/17 Results
Development of Loans and Deposits
Development of Income and Costs
Loan Portfolio Quality
Funding Structure Details
Capital and Liquidity Ratios
Macroeconomic Update
Appendix
Additional Information: Selected Financial Data
Detailed Results of Business Lines
Investor Presentation – Q1 2017

+1.1%
+3.6%
+6.0%
41%
2%
57%
+2.0%
|9
Development of Loans to Customers
Loan growth focused on higher-margin products
Development of Gross Loans and Advances to Customers(PLN M)
+4.3% -0.1%
+4.5%
03/17
84,538
48,338
34,841
1,360
12/16
84,581
48,950
34,174
1,457
09/16
84,199
48,119
34,528
1,552
06/16
83,862
48,272
33,937
1,653
03/16
80,925
46,511
32,805
1,609
Individual clients
Corporate clients
Public sector & Other receivables
-1.2%
+3.9%
03/17
48,338
34,207
2,32611,804
12/16
48,950
35,369
2,35011,231
09/16
48,119
34,624
2,34511,150
06/16
48,272
35,220
2,53210,520
03/16
46,511
34,107
2,5079,897
+1.9%
+6.2%
03/17
34,841
34,759
81
12/16
34,174
34,118
57
09/16
34,528
34,466
62
06/16
33,937
33,805
132
03/16
32,805
32,801
4
Core loans to corporates Reverse repo transactions
Mortgage loans: to Individuals to Microfirms+X.X% Excluding Reverse repo /
buy-sell-back transactions
+X.X% Excluding FX effect
41%
2%
57%
Non-mortgage loans
Analysis of Q1/17 in mBank Group
Investor Presentation – Q1 2017

38%
1%
61%
+1.0%
-2.8%
|10
Development of Deposits
Intentional outflow of corporate term deposits, growth in current accounts
Development of Amounts due to Customers(PLN M)
+8.7% -2.9%+9.4%
03/17
88,744
53,829
33,551
1,364
12/16
91,418
53,495
37,383
540
09/16
85,188
50,735
33,829
624
06/16
85,302
49,453
35,119
731
03/16
81,134
47,835
32,618
681
Individual clients
Corporate clients
Public sector
+X.X% Excluding Repo transactions
+0.6%
+12.5%
03/17
53,829
39,178
14,651
12/16
53,495
38,114
15,381
09/16
50,735
35,498
15,237
06/16
49,453
35,104
14,349
03/16
47,835
33,563
14,272
Core corporate deposits Repo transactions
Sight deposits Term deposits
40%
1%
59%
-10.3%
+2.9%
03/17
33,551
32,080
1,471
12/16
37,383
35,783
1,600
09/16
33,829
31,818
2,011
06/16
35,119
33,832
1,287
03/16
32,618
31,771
847
Investor Presentation – Q1 2017
Analysis of Q1/17 in mBank Group

|11
Income of mBank Group
Development of mBank Group’s Income(PLN M)
+3.5%
Q4/16
1,044.7
753.3
250.6
0.3 26.6
Q3/16
1,038.7
718.7
234.4
0.474.4
2.4
Q2/16
1,203.0
684.4
209.7
2.659.5
244.8
2.0
Q1/16
1,008.9
676.4
211.7
0.084.1
3.4 33.2
Q1/17
+7.2%
4.51.6
249.6
1,081.8
749.0
0.276.9
Net Interest Income
Net Fee and Commission Income
Dividend Income
Net Trading Income
Gains less Losses from Investment Securities1
Net Other Operating Result
-0.6%
-0.4%
+189%
+10.7%
+17.9%
-8.6%
High core revenues despite a seasonally weaker quarter
QoQ YoY
1 Including one-off gain on the settlement of Visa transaction (PLN 251.7 M) in Q2/16;
8.53.110.8
Investor Presentation – Q1 2017
Analysis of Q1/17 in mBank Group

+0.6%+0.4%
|12
Costs of mBank Group
Development of mBank Group’s Costs(PLN M)
116.8
+20.2%
51.1
164.2
223.3
7.0
+17.4%
Q4/16
491.9
220.4
168.4
0.053.9
38.310.9
Q3/16
499.9
219.5
183.3
6.152.7
38.3
Q2/16
490.7
218.9
158.8
12.6
63.4
37.0
Q1/16
480.8
217.9
160.9
11.253.7
37.1 15.4
Q1/17
577.7
+1.3%
-2.5%
+2.5%
+2.0%
Solid cost efficiency despite contributions to the BFG
-5.1% -4.9%
47.7% C/I ratio of mBank Group (quarterly)40.8% 48.1% 47.1% 53.4%
1 Including taxes and fees, contributions to the Social Benefits Fund;
QoQ YoY
Personnel Costs
Material Costs
Other Costs1
Amortization
Contributions to the BFG
Q4/16 costs include additional payment to the BFG related to the bankruptcy of Cooperative Bank in Nadarzyn of PLN 10.9 million.
Q1/17 costs include annual contribution to the Resolution Fundof PLN 116.8 million.
Excluding contributions to the BFGand one-off regulatory costs
+X.X%
45.3% Normalized C/I ratio of mBank Group for Q1/17
Investor Presentation – Q1 2017
Analysis of Q1/17 in mBank Group
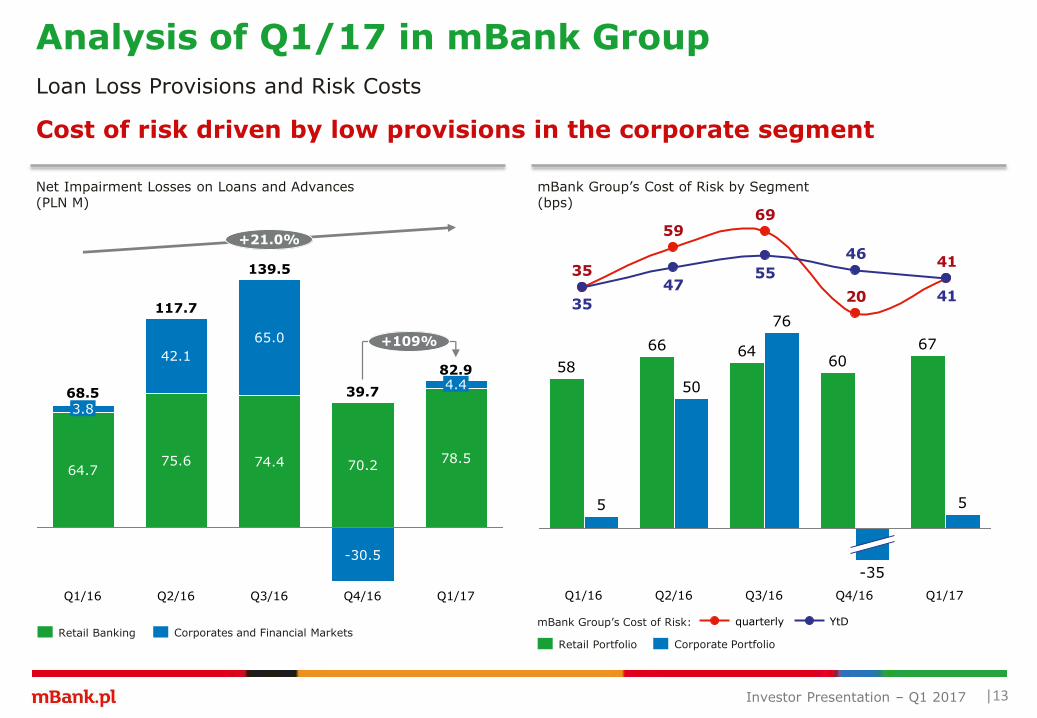
Retail Portfolio Corporate Portfolio
mBank Group’s Cost of Risk:
20
55
69
47
59
35
35
41
41
46
|13
Loan Loss Provisions and Risk Costs
Net Impairment Losses on Loans and Advances(PLN M)
mBank Group’s Cost of Risk by Segment(bps)
68.5
64.7
3.8
Q3/16
139.5
74.4
65.0
Q2/16
117.7
75.6
42.1
Q1/16
+21.0%
+109%
Q1/17
82.9
78.5
4.4
Q4/16
39.7
70.2
-30.5
Retail Banking Corporates and Financial Markets
66
Q1/16
5
58
-35
60
Q3/16
76
64
Q2/16
50
Q1/17
5
67
Q4/16
quarterly YtD
Cost of risk driven by low provisions in the corporate segment
Investor Presentation – Q1 2017
Analysis of Q1/17 in mBank Group
|14
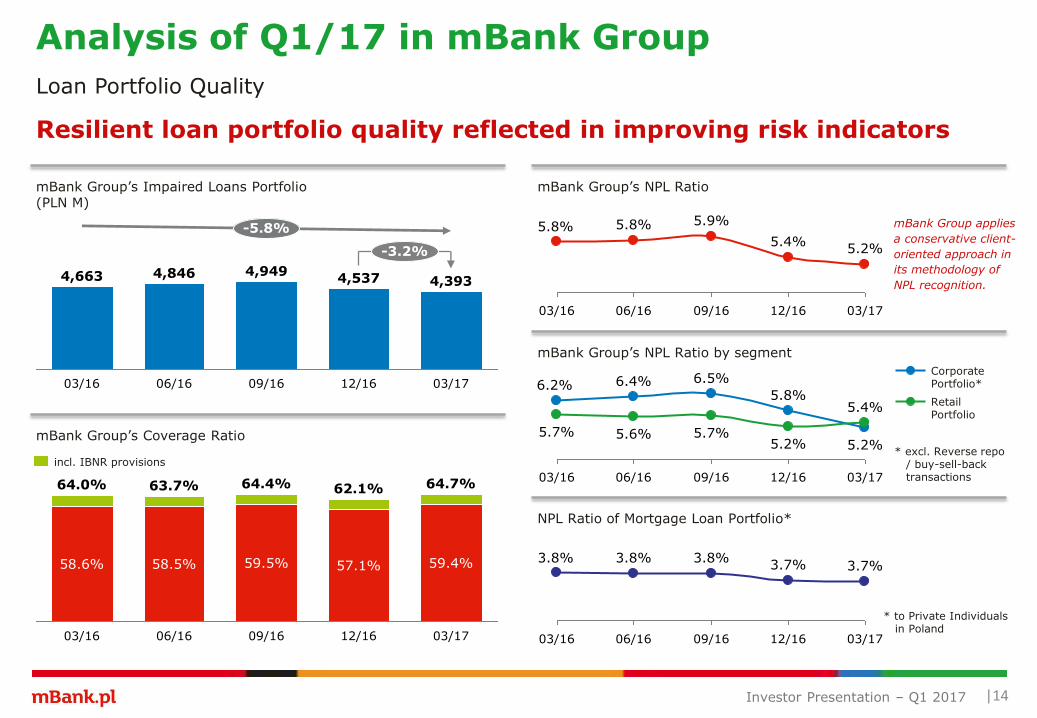
Loan Portfolio Quality
mBank Group’s Impaired Loans Portfolio(PLN M)
-5.8%
-3.2%
03/17
4,393
12/16
4,537
09/16
4,949
06/16
4,846
03/16
4,663
incl. IBNR provisions
03/17
64.7%
59.4%
12/16
62.1%
57.1%
09/16
64.4%
59.5%
06/16
63.7%
58.5%
03/16
64.0%
58.6%
mBank Group’s Coverage Ratio
mBank Group’s NPL Ratio
03/17
5.2%
12/16
5.4%
09/16
5.9%
06/16
5.8%
03/16
5.8%
* excl. Reverse repo/ buy-sell-backtransactions
* to Private Individualsin Poland
NPL Ratio of Mortgage Loan Portfolio*
mBank Group’s NPL Ratio by segment
03/17
3.7%
12/16
3.7%
09/16
3.8%
06/16
3.8%
03/16
3.8%
03/17
5.4%
5.2%
12/16
5.2%
5.8%
09/16
5.7%
6.5%
06/16
5.6%
6.4%
03/16
5.7%
6.2%RetailPortfolio
CorporatePortfolio*
mBank Group applies
a conservative client-
oriented approach in
its methodology of
NPL recognition.
Resilient loan portfolio quality reflected in improving risk indicators
Investor Presentation – Q1 2017
Analysis of Q1/17 in mBank Group
200
776
250
500
200200
50
750
50
750
1,000
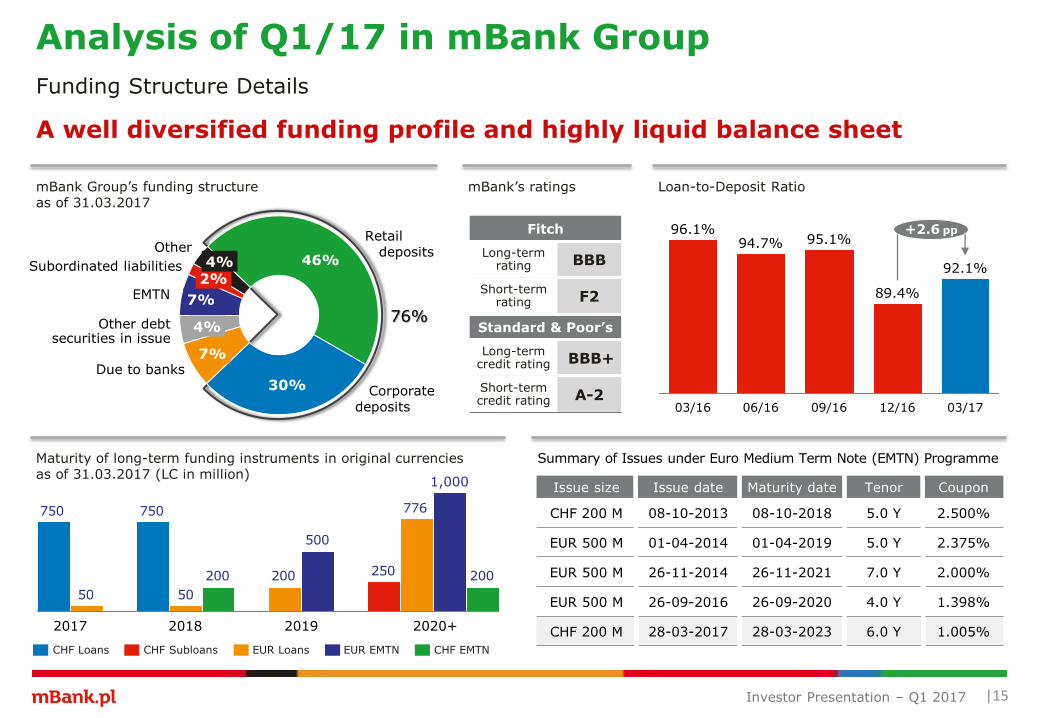
76%
Due to banks
|15
Funding Structure Details
A well diversified funding profile and highly liquid balance sheet
mBank Group’s funding structureas of 31.03.2017
mBank’s ratings Loan-to-Deposit Ratio
Corporatedeposits
Other debt securities in issue
Subordinated liabilities
Other
EMTN
Retaildeposits
Fitch
Long-termrating BBB
Short-termrating F2
Standard & Poor’s
Long-termcredit rating BBB+
Short-termcredit rating A-2
Summary of Issues under Euro Medium Term Note (EMTN) Programme
Issue size Issue date Maturity date Tenor Coupon
CHF 200 M 08-10-2013 08-10-2018 5.0 Y 2.500%
EUR 500 M 01-04-2014 01-04-2019 5.0 Y 2.375%
EUR 500 M 26-11-2014 26-11-2021 7.0 Y 2.000%
EUR 500 M 26-09-2016 26-09-2020 4.0 Y 1.398%
CHF 200 M 28-03-2017 28-03-2023 6.0 Y 1.005%
+2.6 pp
03/17
92.1%
12/16
89.4%
09/16
95.1%
06/16
94.7%
03/16
96.1%
CHF Loans CHF Subloans EUR Loans EUR EMTN CHF EMTN
Maturity of long-term funding instruments in original currencies as of 31.03.2017 (LC in million)
Investor Presentation – Q1 2017
Analysis of Q1/17 in mBank Group
2017 2018 2019 2020+
46%
30%
7%
4%
7%
2%4%
(PLN B)
|16
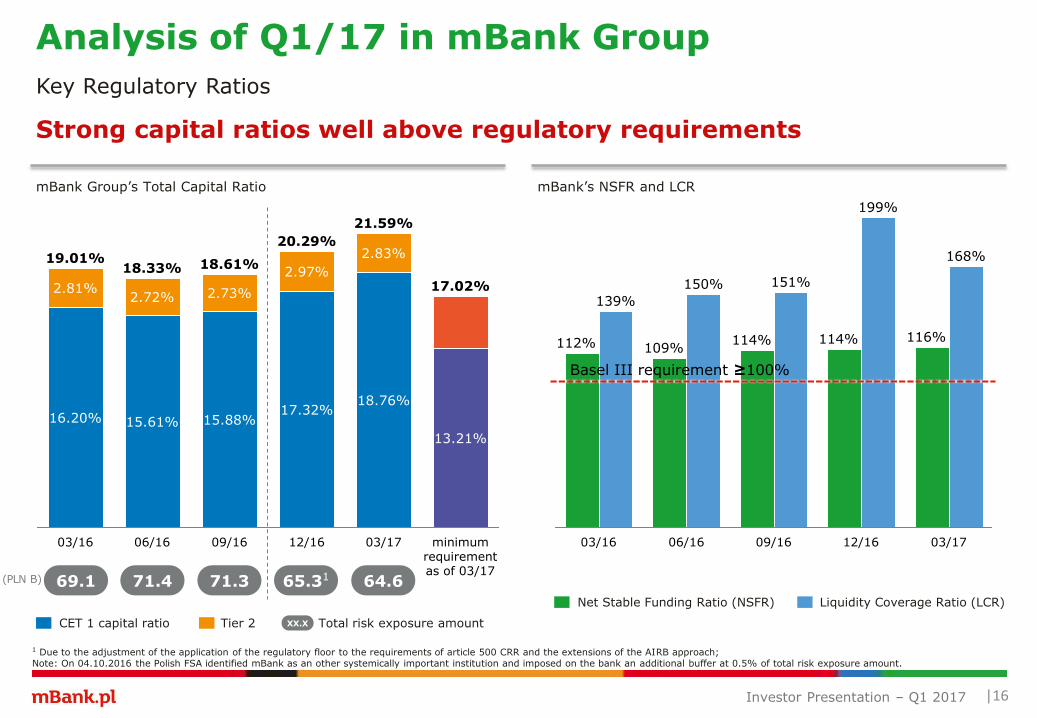
Key Regulatory Ratios
mBank Group’s Total Capital Ratio mBank’s NSFR and LCR
12/16
199%
114%
09/16
151%
114%
06/16
150%
109%
03/16
139%
112%
03/17
168%
116%
Basel III requirement ≥100%
Strong capital ratios well above regulatory requirements
minimumrequirementas of 03/17
17.02%
13.21%
12/16
20.29%
17.32%
2.97%
09/16
18.61%
15.88%
2.73%
06/16
18.33%
15.61%
2.72%
03/16
19.01%
16.20%
2.81%
03/17
21.59%
18.76%
2.83%
Net Stable Funding Ratio (NSFR) Liquidity Coverage Ratio (LCR)
CET 1 capital ratio Tier 2 Total risk exposure amountXX.X
69.1 64.671.4 71.3 65.31
1 Due to the adjustment of the application of the regulatory floor to the requirements of article 500 CRR and the extensions of the AIRB approach;Note: On 04.10.2016 the Polish FSA identified mBank as an other systemically important institution and imposed on the bank an additional buffer at 0.5% of total risk exposure amount.
Investor Presentation – Q1 2017
Analysis of Q1/17 in mBank Group
|17
Agenda
Summary of Q1/17 in mBank Group
Key Financials
Client acquisition and Market shares
Development of retail and corporate new business
Analysis of Q1/17 Results
Development of Loans and Deposits
Development of Income and Costs
Loan Portfolio Quality
Funding Structure Details
Capital and Liquidity Ratios
Macroeconomic Update
Appendix
Additional Information: Selected Financial Data
Detailed Results of Business Lines
Investor Presentation – Q1 2017

The economy rebounded strongly in Q1/17
|18
Macroeconomic Update (1/2)
The economy set to grow by 4% on average in 2017
Tighter labour market across the board, supporting consumption
GDP forecast (% YoY) Inflation spike over, but core inflation is trending up
Source: GUS
2017 began on a positive note, with further acceleration in all monthly measures of economic activity. In particular, investment is rebounding faster than previously anticipated.
The bank revised its GDP forecasts upwards, Q1/17 data was one of the factors behind this. Now the growth is expected to accelerate to 4.0% on average in 2017 with strong contribution from investment.
The biggest economic story in Poland is probably on the labour market: tight conditions, record low unemployment, accelerating wage growth. This bodes well for consumption.
Local peak in inflation in February. The uptrend in core inflation means, however, that inflation will continue to rise once the effects of oil spike fade away.
Source: GUS, NBP Source: GUS, NBP
Source: GUS, NBP
Investor Presentation – Q1 2017
-2%
-1%
0%
1%
2%
3%
4%
5%
2013 2014 2015 2016 2017
Repo rate CPI inflation Core inflation
Repo rate forecast CPI forecast Core CPI forecast
0.00.5
1.82.6
3.1 3.3 3.4 3.33.8
3.3 3.6
4.6
2.9 3.02.4 2.5
3.63.8 4.0
4.4
-3
-2
-1
0
1
2
3
4
5
6
Q1/13 Q3/13 Q1/14 Q3/14 Q1/15 Q3/15 Q1/16 Q3/16 Q1/17 Q3/17
Investment Net exports ConsumptionInventories GDP YoY (%)
mBank’s forecast
-2
-1
0
1
2
3
4
2003 2004 2005 2006 2007 2008 2009 2010 2011 2012 2013 2014 2015 2016 2017
No of job offers per unemployed
Enterprises reporting staffing problems, weighted avg
-30%
-20%
-10%
0%
10%
20%
-2%
0%
2%
4%
6%
8%
Q1/13 Q3/13 Q1/14 Q3/14 Q1/15 Q3/15 Q1/16 Q3/16 Q1/17
Industrial output YoY GDP YoY Construction output YoY (RA)

Source: Bloomberg Source: Bloomberg
|19
Macroeconomic Update (2/2)
Loan-to-deposit ratio heading below 100% as credit growth remains tepid
Corporate loans and deposits (% YoY) Household loans and deposits (% YoY)
The risk premium in Polish assets has declined recently. Strong growth, better fiscal figures and favourable climate for emerging markets all contributed to lower yields and spreads.
Household deposits decelerate as consumption accelerates. Lending is still sluggish and mortgage production remains in line with historical average.
PLN strengthened in lockstep with bonds and equities. Current levels are probably in equilibrium and the case for significant change in either direction is weak at the moment.
Source: NBPSource: NBP
Corporate lending began to rebound at the beginning of 2017 – a likely sign of stronger investment activity. Deposit growth remains moderate.
Risk premium in Polish bonds declined markedly
Investor Presentation – Q1 2017
-10%
0%
10%
20%
30%
Jan-11 Sep-11 May-12 Jan-13 Sep-13 May-14 Jan-15 Sep-15 May-16 Jan-17
Corporate deposits Corporate loans Corporate investment loans
-5%
0%
5%
10%
15%
20%
25%
Jan-11 Sep-11 May-12 Jan-13 Sep-13 May-14 Jan-15 Sep-15 May-16 Jan-17
Household deposits Household loans Mortgage loans
3,60
3,80
4,00
4,20
4,40
4,60
Jan-16 Mar-16 May-16 Jul-16 Sep-16 Nov-16 Jan-17 Mar-17
EUR/PLN USD/PLN CHF/PLN
4.60
4.40
4.20
4.00
3.80
3.60
PLN appreciation likely done
225
250
275
300
325
350
375
Jan-16 Mar-16 May-16 Jul-16 Sep-16 Nov-16 Jan-17 Mar-17
10Y PL-GER spread

2015 2016 2017F
GDP growth (YoY) 3.8% 2.7% 4.0%
Domestic demand (YoY) 3.4% 2.8% 4.5%
Private consumption (YoY) 3.2% 3.6% 4.2%
Investment (YoY) 6.6% -5.5% 5.9%
Inflation (eop) -0.5% 0.8% 1.8%
MPC rate (eop) 1.50 1.50 1.50
CHF/PLN (eop) 3.92 4.11 3.89
EUR/PLN (eop) 4.26 4.40 4.20
|20
2017 in forecasts and the impact on mBank Group
Macroeconomic environment and challenges for the banking sector
Key economic indicators Outlook for mBank
Banking sector – monetary aggregates YoY
2015 2016 2017F
Corporate loans 8.2% 5.0% 9.3%
Mortgage loans 7.0% 4.8% 0.4%
Non-mortgage loans 6.2% 5.9% 7.3%
Corporate deposits 10.3% 7.9% 9.7%
Retail deposits 9.8% 9.7% 4.2%
Source: mBank’s estimates as of 03.04.2017.
Loan Loss Provisions (Neutral)
Resilient asset quality supported by good macroeconomic
situation and low unemployment
Small downside risk due to changing loan book mix
Business-driven costs to remain well-contained
Risk of higher contribution to the BFG under new deposit
guarantee scheme
Rising amortisation due to ongoing investments in IT
Total costs (Slightly negative)
Continued gradual increase of margin driven by changing
structure of loan portfolio
More limited room for reduction of funding costs
Net interest income & NIM (Slightly positive)
Constantly rising client transactionality and strong
acquisition in both retail and corporate segment
Selective adjustment of fees for some services
Net Fee & Commission income (Slightly positive)
Investor Presentation – Q1 2017
|21
Agenda
Summary of Q1/17 in mBank Group
Key Financials
Client acquisition and Market shares
Development of retail and corporate new business
Analysis of Q1/17 Results
Development of Loans and Deposits
Development of Income and Costs
Loan Portfolio Quality
Funding Structure Details
Capital and Liquidity Ratios
Macroeconomic Update
Appendix
Additional Information: Selected Financial Data
Detailed Results of Business Lines
Investor Presentation – Q1 2017
|22
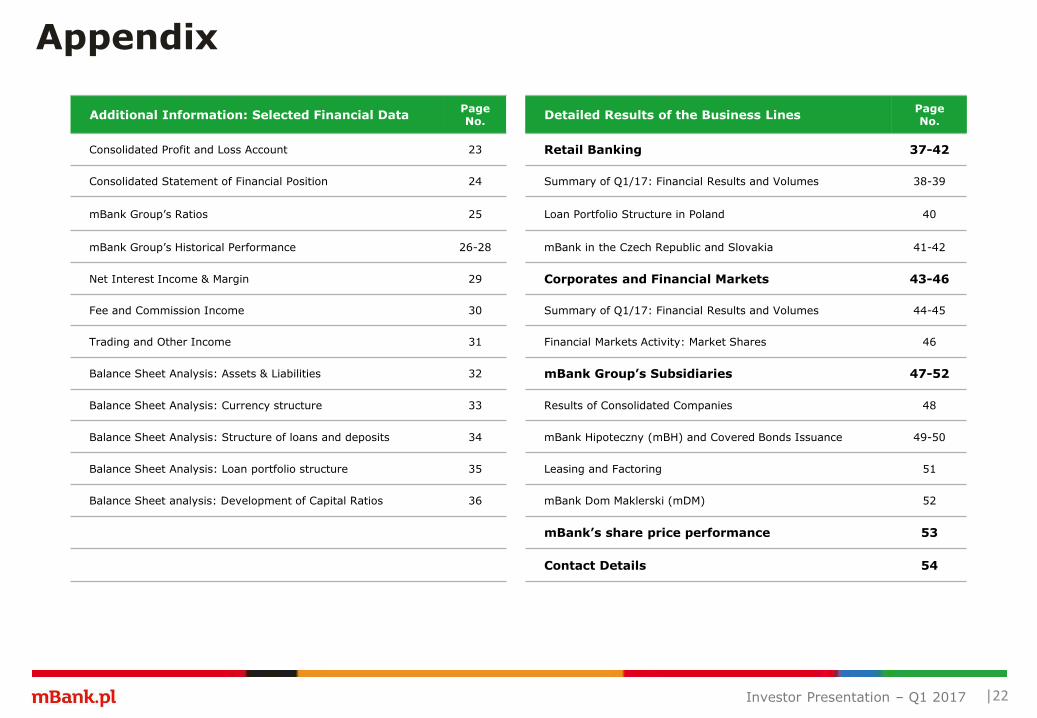
Appendix
Additional Information: Selected Financial DataPageNo.
Detailed Results of the Business LinesPageNo.
Consolidated Profit and Loss Account 23 Retail Banking 37-42
Consolidated Statement of Financial Position 24 Summary of Q1/17: Financial Results and Volumes 38-39
mBank Group’s Ratios 25 Loan Portfolio Structure in Poland 40
mBank Group’s Historical Performance 26-28 mBank in the Czech Republic and Slovakia 41-42
Net Interest Income & Margin 29 Corporates and Financial Markets 43-46
Fee and Commission Income 30 Summary of Q1/17: Financial Results and Volumes 44-45
Trading and Other Income 31 Financial Markets Activity: Market Shares 46
Balance Sheet Analysis: Assets & Liabilities 32 mBank Group’s Subsidiaries 47-52
Balance Sheet Analysis: Currency structure 33 Results of Consolidated Companies 48
Balance Sheet Analysis: Structure of loans and deposits 34 mBank Hipoteczny (mBH) and Covered Bonds Issuance 49-50
Balance Sheet Analysis: Loan portfolio structure 35 Leasing and Factoring 51
Balance Sheet analysis: Development of Capital Ratios 36 mBank Dom Maklerski (mDM) 52
mBank’s share price performance 53
Contact Details 54
Investor Presentation – Q1 2017
|23
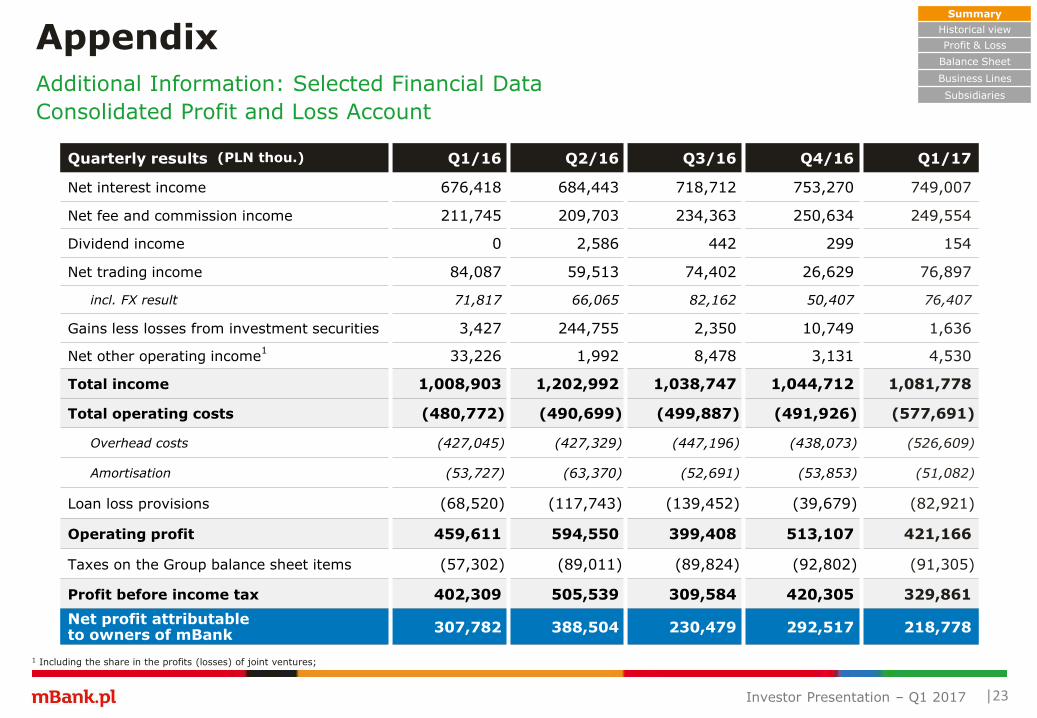
AppendixAdditional Information: Selected Financial Data
Consolidated Profit and Loss Account
Summary
Historical view
Profit & Loss
Balance Sheet
Business Lines
Subsidiaries
Quarterly results (PLN thou.) Q1/16 Q2/16 Q3/16 Q4/16 Q1/17
Net interest income 676,418 684,443 718,712 753,270 749,007
Net fee and commission income 211,745 209,703 234,363 250,634 249,554
Dividend income 0 2,586 442 299 154
Net trading income 84,087 59,513 74,402 26,629 76,897
incl. FX result 71,817 66,065 82,162 50,407 76,407
Gains less losses from investment securities 3,427 244,755 2,350 10,749 1,636
Net other operating income1
33,226 1,992 8,478 3,131 4,530
Total income 1,008,903 1,202,992 1,038,747 1,044,712 1,081,778
Total operating costs (480,772) (490,699) (499,887) (491,926) (577,691)
Overhead costs (427,045) (427,329) (447,196) (438,073) (526,609)
Amortisation (53,727) (63,370) (52,691) (53,853) (51,082)
Loan loss provisions (68,520) (117,743) (139,452) (39,679) (82,921)
Operating profit 459,611 594,550 399,408 513,107 421,166
Taxes on the Group balance sheet items (57,302) (89,011) (89,824) (92,802) (91,305)
Profit before income tax 402,309 505,539 309,584 420,305 329,861
Net profit attributable to owners of mBank
307,782 388,504 230,479 292,517 218,778
1 Including the share in the profits (losses) of joint ventures;
Investor Presentation – Q1 2017

|24
AppendixAdditional Information: Selected Financial Data
Consolidated Statement of Financial Position
Assets (PLN thou.) Q1/16 Q2/16 Q3/16 Q4/16 Q1/17
Cash and balances with Central Bank 4 042 760 6 433 221 5 859 485 9 164 281 7 139 929
Loans and advances to banks 1 120 253 1 680 830 2 920 734 3 082 855 1 976 859
Trading securities 2 849 810 3 233 150 4 177 242 3 800 634 3 538 122
Derivative financial instruments 2 799 170 2 411 457 2 087 395 1 808 847 1 680 769
Loans and advances to customers 77 940 778 80 774 809 81 009 630 81 763 277 81 697 942
Investment securities 31 618 471 31 644 303 31 257 850 31 393 352 31 689 903
Intangible assets 512 481 503 561 501 917 582 663 577 955
Tangible fixed assets 722 279 722 792 710 268 757 371 737 261
Other assets 1 662 378 1 329 362 1 256 202 1 390 222 1 449 641
Total assets 123 268 380 128 733 485 129 780 723 133 743 502 130 488 381
Liabilities (PLN thou.) Q1/16 Q2/16 Q3/16 Q4/16 Q1/17
Amounts due to other banks 10 972 446 12 058 198 11 562 896 8 486 753 8 767 287
Derivative financial instruments 2 355 838 2 157 160 1 766 557 1 599 266 1 557 117
Amounts due to customers 81 133 851 85 302 300 85 188 225 91 417 962 88 744 037
Debt securities in issue 9 697 975 10 115 495 12 192 188 12 660 389 13 260 781
Subordinated liabilities 3 801 673 3 910 457 3 851 380 3 943 349 2 250 473
Other liabilities 2 679 200 2 392 876 2 248 936 2 584 622 2 570 402
Total liabilities 110 640 983 115 936 486 116 810 182 120 692 341 117 150 097
Total equity 12 627 397 12 796 999 12 970 541 13 051 161 13 338 284
Total liabilities and equity 123 268 380 128 733 485 129 780 723 133 743 502 130 488 381
Summary
Historical view
Profit & Loss
Balance Sheet
Business Lines
Subsidiaries
Investor Presentation – Q1 2017

|25
AppendixAdditional Information: Selected Financial Data
mBank Group’s Ratios
Financial Ratios Q1/16 Q2/16 Q3/16 Q4/16 Q1/17
Net Interest Margin (quarterly) 2.29% 2.25% 2.31% 2.35% 2.42%
Net Interest Margin YtD 2.29% 2.27% 2.28% 2.30% 2.42%
Net Interest Margin YtD (excl. CHF portfolio) 2.66% 2.63% 2.64% 2.65% 2.77%
Cost to Income Ratio (quarterly) 47.7% 40.8% 48.1% 47.1% 53.4%
Cost to Income Ratio YtD 47.7% 43.9% 45.3% 45.7% 53.4%
Cost of Risk (quarterly) 0.35% 0.59% 0.69% 0.20% 0.41%
Cost of Risk YtD 0.35% 0.47% 0.55% 0.46% 0.41%
ROE net (quarterly) 10.08% 12.85% 7.61% 9.81% 6.81%
ROE net YtD 10.08% 11.46% 10.18% 10.09% 6.81%
ROA net (quarterly) 0.99% 1.23% 0.71% 0.88% 0.68%
ROA net YtD 0.99% 1.11% 0.98% 0.95% 0.68%
Loan-to-Deposit Ratio 96.1% 94.7% 95.1% 89.4% 92.1%
Total Capital Ratio 19.01% 18.33% 18.61% 20.29% 21.59%
Common Equity Tier 1 Ratio 16.20% 15.61% 15.88% 17.32% 18.76%
Equity / Assets 10.2% 9.9% 10.0% 9.8% 10.2%
TREA / Assets 56.1% 55.4% 54.9% 48.8% 49.5%
NPL ratio 5.8% 5.8% 5.9% 5.4% 5.2%
NPL coverage ratio 58.6% 58.5% 59.5% 57.1% 59.4%
NPL coverage ratio incl. general provisions 64.0% 63.7% 64.4% 62.1% 64.7%
Summary
Historical view
Profit & Loss
Balance Sheet
Business Lines
Subsidiaries
Investor Presentation – Q1 2017
CAGR
Net Interest Income & NIM(PLN M)
CAGR
CAGR
CAGR
|26
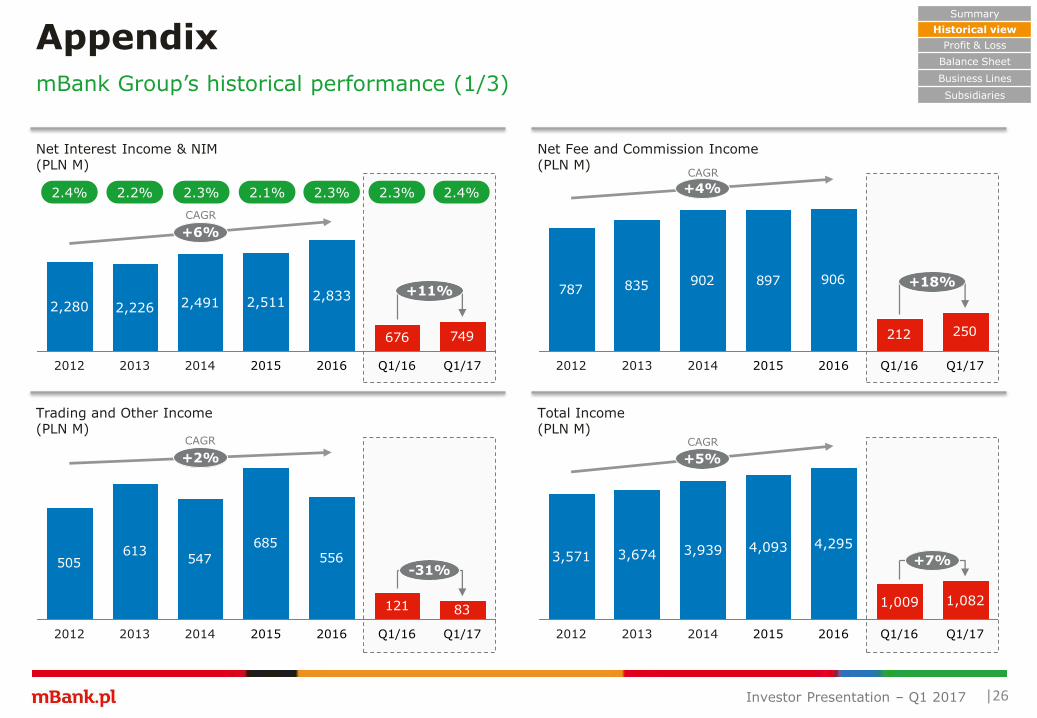
AppendixmBank Group’s historical performance (1/3)
Net Fee and Commission Income(PLN M)
Trading and Other Income(PLN M)
Total Income(PLN M)
749676
Q1/17
+11%
+6%
Q1/162016
2,833
2015
2,511
2014
2,491
2013
2,226
2012
2,280
2.4% 2.2% 2.3% 2.1%
787 835 902 897 906
212 250
+18%
+4%
Q1/1620162015201420132012 Q1/17
505613
547
685556
121 83
-31%
+2%
Q1/1620162015201420132012 Q1/17
4,093 4,295
2016 Q1/16
+5%
+7%
1,009
20152014
3,939
2013
3,674
2012
3,571
Q1/17
1,082
2.3%
Summary
Historical view
Profit & Loss
Balance Sheet
Business Lines
Subsidiaries
2.3% 2.4%
Investor Presentation – Q1 2017

CAGR
bps
|27
AppendixmBank Group’s historical performance (2/3)
Operating Costs(PLN M)
Pre-provision Income & C/I ratio(PLN M)
Loan Loss Provisions & Cost of Risk(PLN M)
Net Profit & Return on Equity(PLN M)
445 478 516421 365
8369
-5%
+21%
Q1/1620162015201420132012 Q1/17
219308
0%
-29%
Q1/17Q1/162016
1,219
2015
1,301
2014
1,287
2013
1,206
2012
1,197
46.5% 45.7% 44.9% 50.1%
CAGR
CAGR
45.7%
14.6% 13.1% 13.1% 11.8% 10.1%
Summary
Historical view
Profit & Loss
Balance Sheet
Business Lines
Subsidiaries
66 70 72 54 46
CAGR
10.1% 6.8%35 41
47.7% 53.4%
504528
-5%
+5%
Q1/17Q1/162016
2,332
2015
2,043
2014
2,169
2013
1,995
2012
1,909
445444
194
37
+20%
+4%
Q1/17Q1/162016
1,952
11
2015
1,857
2014
1,771
2013
1,678
2012
1,661
132
One-off regulatory costs
Investor Presentation – Q1 2017
Contributionsto the BFG
Equity & Total Capital Ratio(PLN M)
CAGR
|28
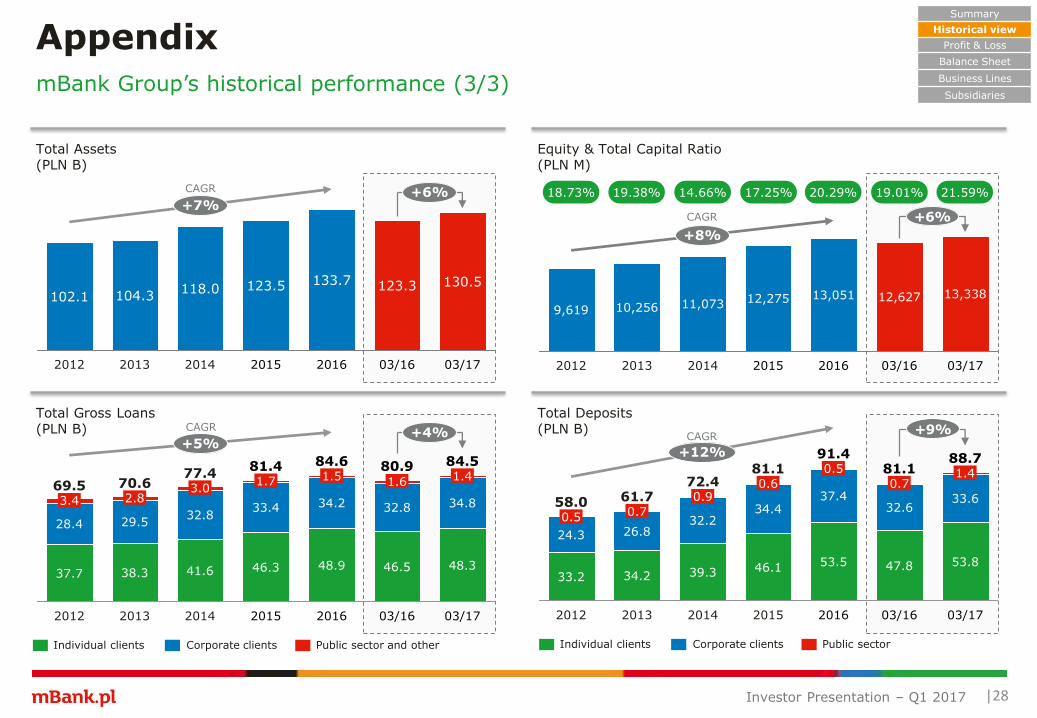
AppendixmBank Group’s historical performance (3/3)
Total Assets (PLN B)
Total Gross Loans (PLN B)
Total Deposits(PLN B)
18.73% 19.38% 14.66% 17.25%
Individual clients Corporate clients Public sector
CAGR
CAGR
20.29%
Summary
Historical view
Profit & Loss
Balance Sheet
Business Lines
Subsidiaries
Individual clients Corporate clients Public sector and other
CAGR
19.01% 21.59%
Investor Presentation – Q1 2017
+8%
+6%
03/17
13,338
03/16
12,627
2016
13,051
2015
12,275
2014
11,073
2013
10,256
2012
9,619
+6%+7%
03/17
130.5
03/16
123.3
2016
133.7
2015
123.5
2014
118.0
2013
104.3
2012
102.1
+4%
03/17
84.5
48.3
34.8
+5%
1.4
03/16
80.9
46.5
32.8
1.6
2016
84.6
48.9
34.2
1.5
2015
81.4
46.3
33.4
1.7
2014
77.4
41.6
32.8
3.0
2013
70.6
38.3
29.5
2.8
2012
69.5
37.7
28.4
3.4
+6%
+9%
+12%
03/17
88.7
53.8
33.6
1.4
03/16
81.1
47.8
32.6
0.7
2016
91.4
53.5
37.4
0.5
2015
81.1
46.1
34.4
0.6
2014
72.4
39.3
32.2
0.9
2013
61.7
34.2
26.8
0.7
2012
58.0
33.2
24.3
0.5
+9%

6%
8%
29%
55%
2%2%
2%
5%
72%
17%
NIM[%]
|29
AppendixAdditional Information: Selected Financial DataNet Interest Income & Margin
Interest Income Structure (PLN M)
Interest Expense Structure (PLN M)
Amounts due to banks
Other Amounts due to customers
Issue of debt securities
Subordinated liabilities
-2.1%
Q4/16
1,003.3
16.7
174.0
25.3
718.1
46.922.3
Q3/16
977.0
14.1
180.1
18.8
700.5
43.220.3
Q2/16
947.1
14.5
175.5
17.1
671.3
47.621.1
Q1/16
945.5
12.0
178.4
15.8 24.3
59.116.9
Q1/17
982.5
663.3
170.8
20.844.5
707.0
15.2
-6.6%
Q4/16
250.0
16.9
143.0
68.4
17.74.0
Q3/16
258.3
20.4
157.7
60.0
17.23.0
Q2/16
262.6
18.6
164.2
60.2
17.02.6
Q1/16
269.1
19.3
173.8
56.9
16.72.4
Q1/17
233.5
13.8
128.3
67.7
18.25.5
2.29 2.25 2.422.352.31
Summary
Historical view
Profit & Loss
Balance Sheet
Business Lines
Subsidiaries
Cash and short-term deposits Loans and advances
Investment securities
Debt securities held for trading
Derivatives classified into banking book
Other
2%
Investor Presentation – Q1 2017

20%
18%
12%
15%
8%
1%
22%
4%
|30
AppendixAdditional Information: Selected Financial DataFee and Commission Income
Fee and Commission Income Structure (PLN M)
QoQ YoY
Q4/16
429.2
85.6
3.715.6
99.1
48.5
72.9
46.6
57.2
Q3/16
404.4
84.5
4.114.7
94.1
35.5
69.5
42.1
60.0
Q2/16
365.3
69.8
3.015.1
80.3
32.0
69.8
41.3
54.0
Q1/16
351.9
68.6
2.713.5
88.5
26.0
68.6
36.8
47.3
Q1/17
407.1
81.4
3.516.7
88.9
32.9
74.7
47.7
61.5
Credit related fees
Accounts & money transfers
Portfolio management
Guarantees and trade finance
Insurance activity
Brokerage activity & securities issue
Payment card fees
Other (incl. custody)
-4.9%
-10.3%
+2.5%
+18.7%
+0.5%
+9.0%
-32.2% +26.4%
+7.4% +29.9%
+2.3% +29.7%
-6.6% +27.0%
+7.1% +23.5%
Summary
Historical view
Profit & Loss
Balance Sheet
Business Lines
Subsidiaries
Investor Presentation – Q1 2017
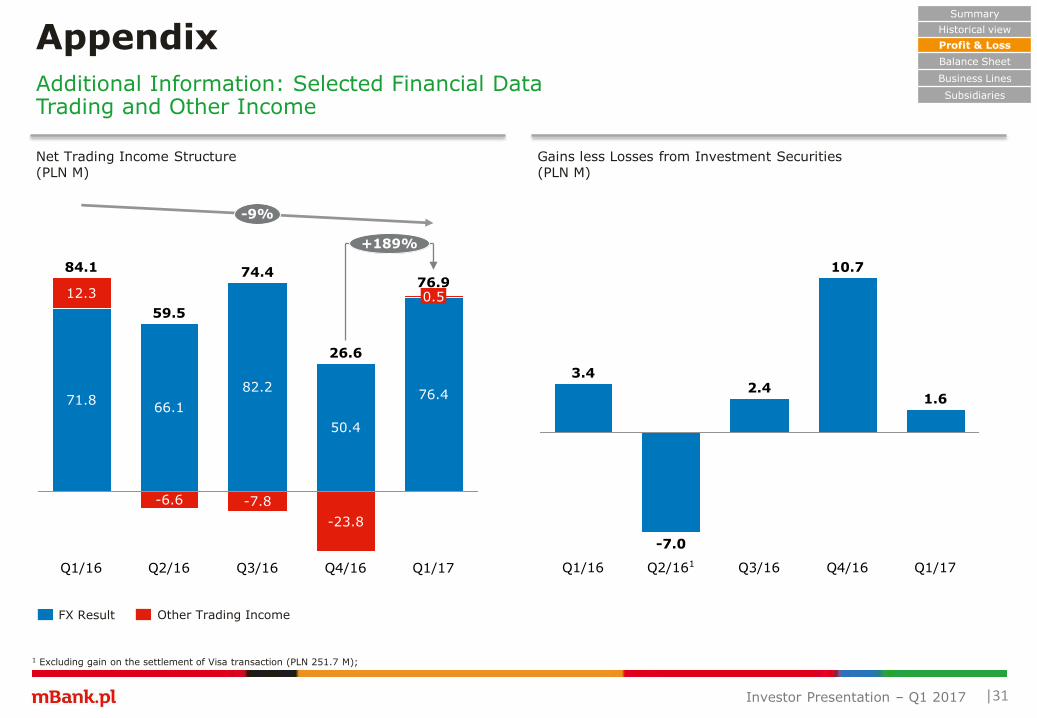
|31
AppendixAdditional Information: Selected Financial DataTrading and Other Income
Net Trading Income Structure(PLN M)
Gains less Losses from Investment Securities(PLN M)
FX Result Other Trading Income
+189%
Q4/16
26.6
50.4
-23.8
Q3/16
74.4
82.2
-7.8
Q2/16
59.5
66.1
-6.6
Q1/16
84.1
71.8
12.3
Q1/17
76.9
76.4
0.5
-9%
Q4/16
10.7
Q3/16
2.4
Q2/161
-7.0
Q1/16
3.4
Q1/17
1.6
Summary
Historical view
Profit & Loss
Balance Sheet
Business Lines
Subsidiaries
1 Excluding gain on the settlement of Visa transaction (PLN 251.7 M);
Investor Presentation – Q1 2017

68%
7%
10%
10%
5%
|32
AppendixAdditional Information: Selected Financial DataBalance Sheet Analysis: Assets & Liabilities
Structure of Assets(PLN B)
Structure of Liabilities and Equity(PLN B)
12/16
133.7
3.1
81.7
3.81.8
31.4
11.9
09/16
129.8
2.9
81.0
4.22.1
31.3
8.3
06/16
128.7
1.7
80.8
3.22.4
31.6
9.0
03/16
123.3
1.1
77.9
2.92.8
31.6
7.0
03/17
130.5
2.0
81.7
3.51.7
31.7
9.9
12/16
133.7
8.5
91.4
12.7
13.0
8.1
09/16
129.8
11.5
85.2
12.2
13.0
7.9
06/16
128.7
12.1
85.3
10.1
12.8
8.4
03/16
123.3
11.0
81.1
9.7
12.6
8.9
03/17
130.5
8.8
88.7
13.3
13.3
6.4
EquityAmounts due to other banks
Amounts due to customers Other
Debt securities in issue
Amounts due from banks
Investment securitiesLoans and advances to customers
Trading securities Other
Derivative financial instruments
Summary
Historical view
Profit & Loss
Balance Sheet
Business Lines
Subsidiaries
63%
1%
24%
8%
1%3%
Investor Presentation – Q1 2017

18%
66%
3%
6%
7%
|33
AppendixAdditional Information: Selected Financial DataBalance Sheet Analysis: Currency Structure
Currency Structure of Loans to Customers (net)(PLN B)
Currency Structure of Amounts due to Banks and Customers1
(PLN B)
1 Including amounts due to other banks and customers and subordinated liabilities;
55%
2%
22%
17%
4%
12/16
81.8
42.9
19.1
14.9
1.53.4
09/16
81.0
42.8
18.8
14.7
1.43.3
06/16
80.8
41.3
19.6
14.9
1.63.4
03/16
77.9
40.0
19.1
14.2
1.53.1
03/17
81.7
45.3
17.9
14.0
1.23.3
12/16
103.8
68.1
9.5
17.3
2.66.3
09/16
100.6
64.8
12.1
15.0
2.85.9
06/16
101.3
66.1
12.6
14.2
2.65.8
03/16
95.9
63.1
12.1
12.9
2.75.1
03/17
99.8
65.4
7.5
18.0
2.66.3
PLN Other (mainly CZK)USDEURCHF PLN Other (mainly CZK)USDEURCHF
Summary
Historical view
Profit & Loss
Balance Sheet
Business Lines
Subsidiaries
Investor Presentation – Q1 2017
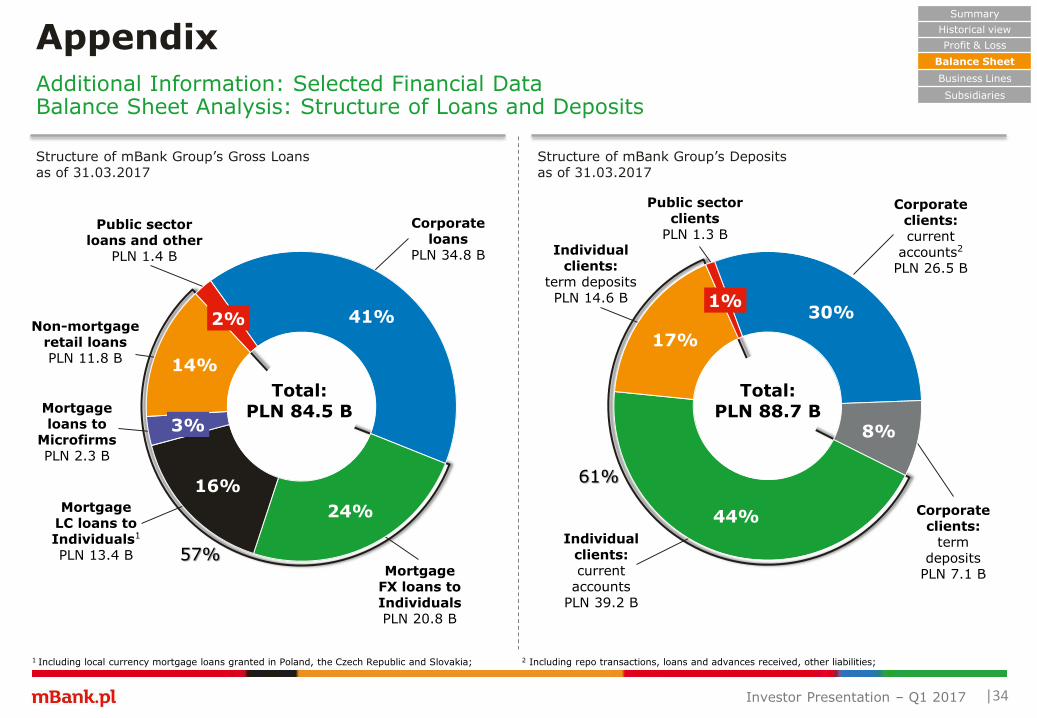
Corporate clients:current
accounts2
PLN 26.5 B
Public sector clients
PLN 1.3 BIndividual
clients:term depositsPLN 14.6 B
61%
Individual clients:current
accountsPLN 39.2 B
57%
Corporate clients:
term deposits
PLN 7.1 B
|34
AppendixAdditional Information: Selected Financial DataBalance Sheet Analysis: Structure of Loans and Deposits
Structure of mBank Group’s Gross Loansas of 31.03.2017
Structure of mBank Group’s Depositsas of 31.03.2017
1 Including local currency mortgage loans granted in Poland, the Czech Republic and Slovakia; 2 Including repo transactions, loans and advances received, other liabilities;
Mortgage FX loans to IndividualsPLN 20.8 B
MortgageLC loans to Individuals1
PLN 13.4 B
Non-mortgage retail loansPLN 11.8 B
Total:PLN 88.7 B
Corporate loans
PLN 34.8 B
Public sector loans and other
PLN 1.4 B
Summary
Historical view
Profit & Loss
Balance Sheet
Business Lines
Subsidiaries
Mortgage loans to
MicrofirmsPLN 2.3 B
Total:PLN 84.5 B
Investor Presentation – Q1 2017
41%
24%
16%
3%
14%
2% 30%
8%
44%
17%
1%

|35
AppendixAdditional Information: Selected Financial DataBalance Sheet Analysis: Loan Portfolio Structure
mBank Group’s Sector Exposure by Industryas of 31.03.2017
A well diversified loan portfolio with granular structure
Summary
Historical view
Profit & Loss
Balance Sheet
Business Lines
Subsidiaries
Total:PLN 84.5 B
Investor Presentation – Q1 2017
57.2%
6.9%
4.5%
2.6%
2.6%
2.2%
2.2%1.9%
1.6% 1.4%
1.4%1.4%
1.2%
1.2%
11.6%
Households
Real estate management
Building industry
Food sector
Transport and logistics
Wholesale trade
Metals
Motorization
Chemicals and plastics
Wood, furniture and stationery
Construction materials
Leasing and rental of movables
Retail trade
Power industry and heating services
Other (below 1.01%)

-0.05
+1.17
+0.28
-0.10 21.59%
Other2Net profit retention
FX impact on TREA
Change in business
Q4/16CURRENT
Q1/17Adjustment of the method
Q4/16PREVIOUS
18.35%
Other1
20.29%
FX impact on TREA
Change in business
Q3/16
18.61%
Net profit retention
FX impact on TREA
Adjustment of the method
Other1
18.76%
15.88%15.66%
Net profit retention
Change in business
Net profit retention
Q4/16CURRENT
17.32%
FX impact on TREA
Other Q1/17Q4/16PREVIOUS
Q3/16 Change in business
|36
AppendixAdditional Information: Selected Financial DataBalance Sheet Analysis: Detailed Development of Capital Ratios
mBank Group’s Common Equity Tier 1 (CET 1) Ratio
mBank Group’s Total Capital Ratio
Summary
Historical view
Profit & Loss
Balance Sheet
Business Lines
Subsidiaries
+0.31 +0.18-0.17
+0.36 +0.18-0.20
-0.54 +1.66
-0.60 +1.94
1 Mainly due to negative valuation of available for sale (AFS) financial instruments; 2 Due to lower percentage of perpetual subordinated debt, which may be included in Tier 2 capital (50% in 2017);
Investor Presentation – Q1 2017
-0.05
+1.17
+0.24
+0.08

|37
Appendix
Retail Banking
Detailed Results of the Business Lines in Q1/17
Summary
Historical view
Profit & Loss
Balance Sheet
Business Lines
Subsidiaries
Investor Presentation – Q1 2017

|38
AppendixRetail BankingSummary of Q1/17: Financial and Business Results
Profit before Tax of the Segment(PLN M, by quarter)
Number of Retail Service Locations
Number of non-cash transactions with payment cards(M, by quarter)
Value of non-cash transactions with payment cards(PLN M, by quarter)
1 Including financial centres and agency service points (data revised for previous quarters);
122 121 116 115 112
84 84 88 98 102
47 46 44 43 4336 36 36 37 37
06/16
303
12 4
03/16 12/16
20 8
316
17 6
09/16
304
14 6
304
11 4
322
03/17
84.2
Q1/17
105.9
+26%-1%
Q4/16
106.8
Q3/16
102.9
Q2/16
97.9
Q1/16 Q4/16
7,283
Q3/16
6,794
Q2/16
6,480
+22%-5%
Q1/17
6,907
Q1/16
5,665
Summary
Historical view
Profit & Loss
Balance Sheet
Business Lines
Subsidiaries
mBank (former MultiBank) Advisory centres
Light branches mKiosks (incl. Partner Kiosks) mBank CZSK
mFinanse1
Retail Banking PL mBank CZSK Gain on Visa transaction
-3.4
227.4
230.9
0.7
Q4/16 Q1/17
+13%
0%
160.6
1.1
Q1/16
200.5
199.8 200.4
3.5
230.5
Q2/16
392.2
227.3
223.1
4.2
Q3/16
203.9
Investor Presentation – Q1 2017
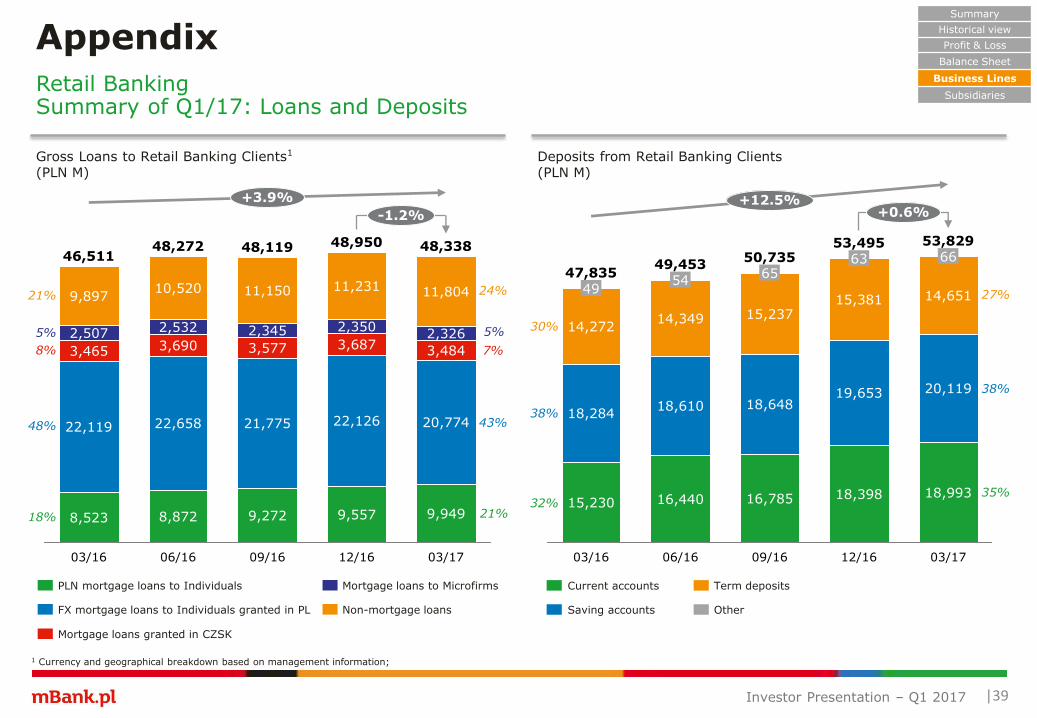
1 Currency and geographical breakdown based on management information;
Retail BankingSummary of Q1/17: Loans and Deposits
AppendixSummary
Historical view
Profit & Loss
Balance Sheet
Business Lines
Subsidiaries
Current accounts
Saving accounts
Term deposits
Other
+0.6%+12.5%
12/16
53,495
18,398
19,653
15,381
63
09/16
50,735
16,785
18,648
15,237
65
06/16
49,453
16,440
18,610
14,349
54
03/16
47,835
15,230
18,284
14,272
49
03/17
53,829
18,993
66
20,119
14,651
|39
Gross Loans to Retail Banking Clients1
(PLN M)Deposits from Retail Banking Clients(PLN M)
-1.2%
+3.9%
12/16
48,950
9,557
22,126
3,687
2,350
11,231
09/16
48,119
9,272
21,775
3,577
2,345
11,150
06/16
48,272
8,872
22,658
3,690
2,532
10,520
03/16
46,511
8,523
22,119
3,465
2,507
9,897
20,774
3,484
2,326
11,804
03/17
48,338
9,949
8%
21%
48%
7%
24%
43%38%
30%
32%
38%
27%
35%
18% 21%
5%5%
PLN mortgage loans to Individuals Mortgage loans to Microfirms
FX mortgage loans to Individuals granted in PL Non-mortgage loans
Mortgage loans granted in CZSK
Investor Presentation – Q1 2017
CAGR
|40
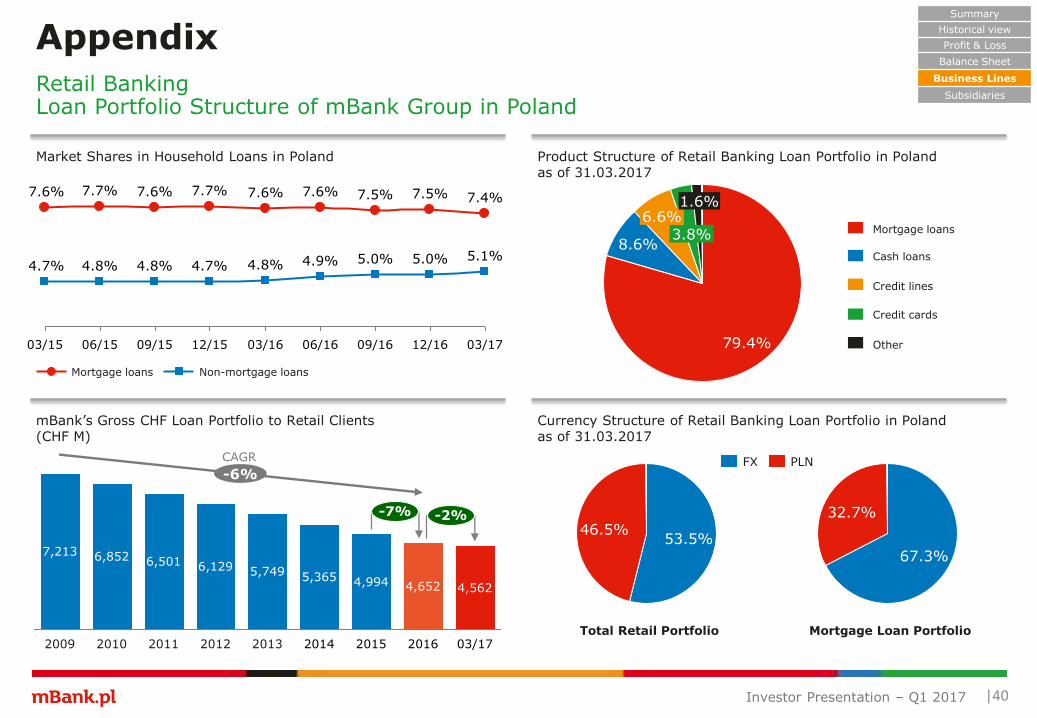
AppendixRetail BankingLoan Portfolio Structure of mBank Group in Poland
Summary
Historical view
Profit & Loss
Balance Sheet
Business Lines
Subsidiaries
Market Shares in Household Loans in Poland Product Structure of Retail Banking Loan Portfolio in Polandas of 31.03.2017
mBank’s Gross CHF Loan Portfolio to Retail Clients(CHF M)
Currency Structure of Retail Banking Loan Portfolio in Polandas of 31.03.2017
12/16
5.0%
7.5%
09/16
5.0%
7.5%
06/16
4.9%
7.6%
03/16
4.8%
7.6%
12/15
4.7%
7.7%
09/15
4.8%
7.6%
06/15
4.8%
7.7%
03/15
4.7%
7.6% 7.4%
03/17
5.1%
Non-mortgage loansMortgage loans
-7%
2016
4,652
2015
4,994
2014
5,365
2013
5,749
2012
6,129
2011
6,501
2010
6,852
2009
7,213
03/17
4,562
-2%
-6%
Total Retail Portfolio Mortgage Loan Portfolio
46.5%53.5%
PLNFX
32.7%
67.3%
3.8%6.6%
8.6%
79.4%
1.6%
Other
Credit cards
Credit lines
Cash loans
Mortgage loans
Investor Presentation – Q1 2017
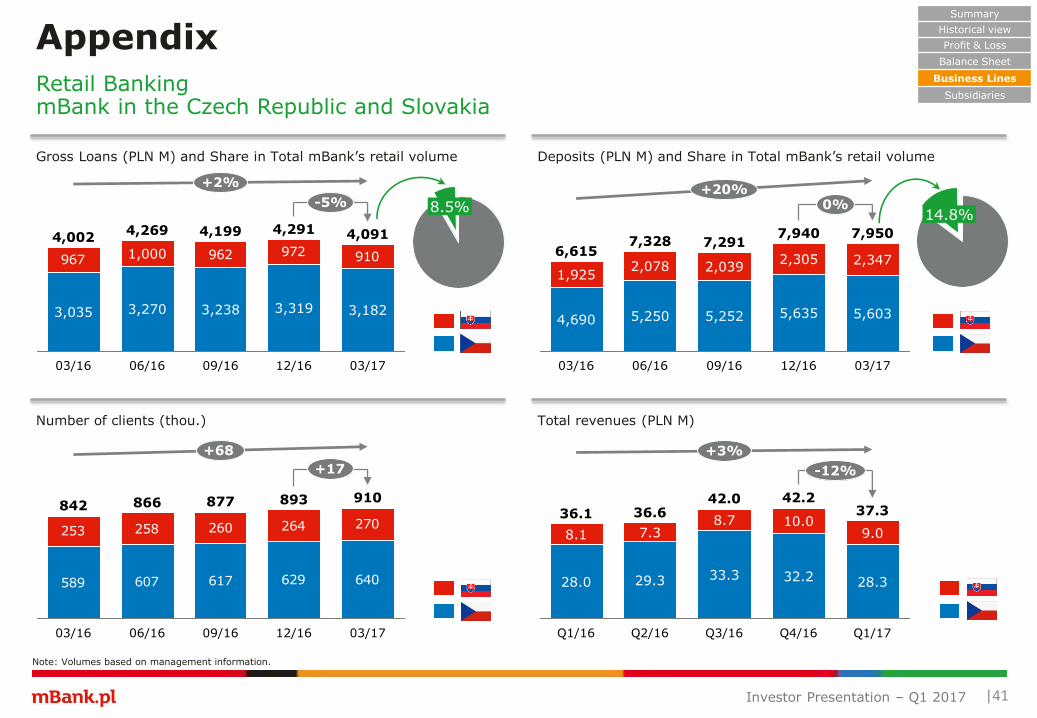
Number of clients (thou.) Total revenues (PLN M)
Gross Loans (PLN M) and Share in Total mBank’s retail volume Deposits (PLN M) and Share in Total mBank’s retail volume
|41
AppendixRetail BankingmBank in the Czech Republic and Slovakia
CZ
SK
Note: Volumes based on management information.
CZ
SK
589 607 617 629 640
253 258 260 264 270
+17
+68
12/16
893
09/16
877
06/16
866
03/16
842
03/17
910
CZ
SK
-12%
+3%
Q4/16
42.2
32.2
10.0
Q3/16
42.0
33.3
8.7
Q2/16
36.6
29.3
7.3
Q1/16
36.1
28.0
8.1
37.3
9.0
28.3
Q1/17
CZ
SK
Summary
Historical view
Profit & Loss
Balance Sheet
Business Lines
Subsidiaries
8.5%14.8%
Investor Presentation – Q1 2017
0%+20%
12/16
7,940
5,635
2,305
09/16
7,291
5,252
2,039
06/16
7,328
5,250
2,078
03/16
6,615
4,690
1,925
03/17
7,950
5,603
2,347967 962 972 910
-5%
+2%
12/16
4,291
3,319
09/16
4,199
3,238
06/16
4,269
3,270
1,000
03/16
4,002
3,035
03/17
4,091
3,182

Retail BankingmBank in the Czech Republic and Slovakia
Mortgage Loans(CZK M)
Mortgage Loans(EUR M)
|42
Appendix
Customer deposits(CZK M)
Customer deposits(EUR M)
Non-mortgage Loans(CZK M)
Non-mortgage Loans(EUR M)
Czech
Republic
Clients:
639.7 thou.
2 light branches,
9 financial
centres &
15 mKiosks
Slovakia
Clients:
270.4 thou.
2 light branches,
4 financial
centres &
5 mKiosks
+4%
0%
03/17
16,884
12/16
16,921
03/16
16,184
+16%
+5%
03/17
3,286
12/16
3,121
03/16
2,835
-8%
-3%
03/17
180.5
12/16
186.7
03/16
196.8
+20%
+7%
03/17
32.3
12/16
30.2
03/16
26.9
Note: Volumes based on management information.
+21%
+4%
03/17
35,911
12/16
34,395
03/16
29,704
556.0
12/16
+7%
03/17
+23%
521.0
03/16
450.9
Investor Presentation – Q1 2017
Summary
Historical view
Profit & Loss
Balance Sheet
Business Lines
Subsidiaries

|43
Appendix
Corporates & Financial Markets
Detailed Results of the Business Lines in Q1/17
Summary
Historical view
Profit & Loss
Balance Sheet
Business Lines
Subsidiaries
Investor Presentation – Q1 2017

|44
AppendixCorporates and Financial Markets Summary of Q1/17: Financial and Business Results
Profit before Tax of the Segment(PLN M, by quarter)
Number of Corporate Service Locations
Loans to enterprises1
(PLN M)Deposits of enterprises1
(PLN M)
1 Corporate loan and deposit volumes according to current NBP rules;
+8%
-11%
03/17
25,399
12/16
28,446
09/16
24,663
06/16
25,639
03/16
23,572
+3%
+4%
03/17
20,753
987
12/16
19,950
951
09/16
20,364
1,045
06/16
20,070
1,060
03/16
19,917
1,141
loans classified as ’securities’
Summary
Historical view
Profit & Loss
Balance Sheet
Business Lines
Subsidiaries
Corporate and Investment Banking Financial Markets
Łódzkie
Zachodnio-Pomorskie
PomorskieWarmińsko-Mazurskie
Podlaskie
Mazowieckie
Lubelskie
Świętokrzyskie
Podkarpackie
Małopolskie
ŚląskieOpolskie
Dolnośląskie
Wielkopolskie
Kujawsko-Pomorskie
Lubuskie
2 21 2
1 1
4 3
2 1
2 3
1
2 2 1 1
3 12
2 1
2
2
1
1
29
17
21
8
5
mBank’s branches,
incl. 6 advisory centres
mBank’s offices
mLeasing
mFaktoring
mBank Hipoteczny
-44%
Investor Presentation – Q1 2017
-43%
Q1/17
107.2
109.4
-2.2
Q4/16
189.0
188.9
0.1
Q3/16
96.8
67.1
29.7
Q2/16
112.6
109.4
3.2
Q1/16
191.0
133.2
57.9
-43%
Lower Q1/17 profit due toone-off booking of annual
contribution to the Resolution Fund
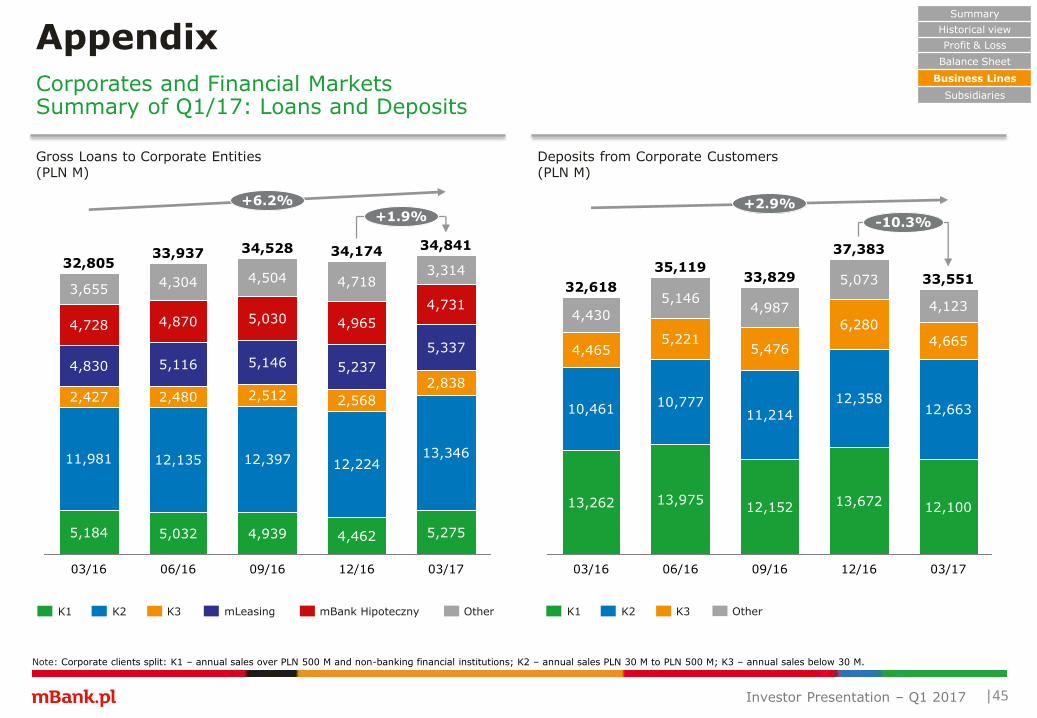
AppendixCorporates and Financial Markets Summary of Q1/17: Loans and Deposits
Summary
Historical view
Profit & Loss
Balance Sheet
Business Lines
Subsidiaries
-10.3%
+2.9%
12/16
37,383
13,672
12,358
6,280
5,073
09/16
33,829
12,152
11,214
5,476
4,987
06/16
35,119
13,975
10,777
5,221
5,146
03/16
32,618
13,262
10,461
4,465
4,430
03/17
33,551
12,100
12,663
4,665
4,123
|45
Gross Loans to Corporate Entities(PLN M)
+1.9%+6.2%
12/16
34,174
4,462
12,224
2,568
5,237
4,965
4,718
09/16
34,528
4,939
12,397
2,512
5,146
5,030
4,504
06/16
33,937
5,032
12,135
2,480
5,116
4,870
4,304
03/16
32,805
5,184
11,981
2,427
4,830
4,728
3,655
03/17
34,841
5,275
13,346
2,838
5,337
4,731
3,314
Deposits from Corporate Customers(PLN M)
K1 K2 K3 mLeasing mBank Hipoteczny Other K1 K2 K3 Other
Note: Corporate clients split: K1 – annual sales over PLN 500 M and non-banking financial institutions; K2 – annual sales PLN 30 M to PLN 500 M; K3 – annual sales below 30 M.
Investor Presentation – Q1 2017

|46
AppendixCorporates and Financial MarketsMarket Shares
mBank’s Market Shares in Investment Banking Services1 mBank in the Market for Non-Treasury Debt2
as of 28.02.2017 (PLN M)
1 mBank calculations based on NBP data as of 28.02.2017; 2 Based on Fitch Polska S.A., Rating & Rynek (excluding BGK road bonds);
9.1%
Mid-term bank Debt
13,644
40,740
Corporate Debt
7,883
69,023
Short-term Debt
1,435
15,702
mBankMarket
11.4%
33.5%
Treasury Bills and Bonds
IRS/FRA
FX Spot & Forward
15.9%8.9%
17.6%
Summary
Historical view
Profit & Loss
Balance Sheet
Business Lines
Subsidiaries
#4 #4 #1
Investor Presentation – Q1 2017

|47
Appendix
Subsidiaries
Detailed Results of mBank Group’s companies in Q1/17
Summary
Historical view
Profit & Loss
Balance Sheet
Business Lines
Subsidiaries
Investor Presentation – Q1 2017
|48
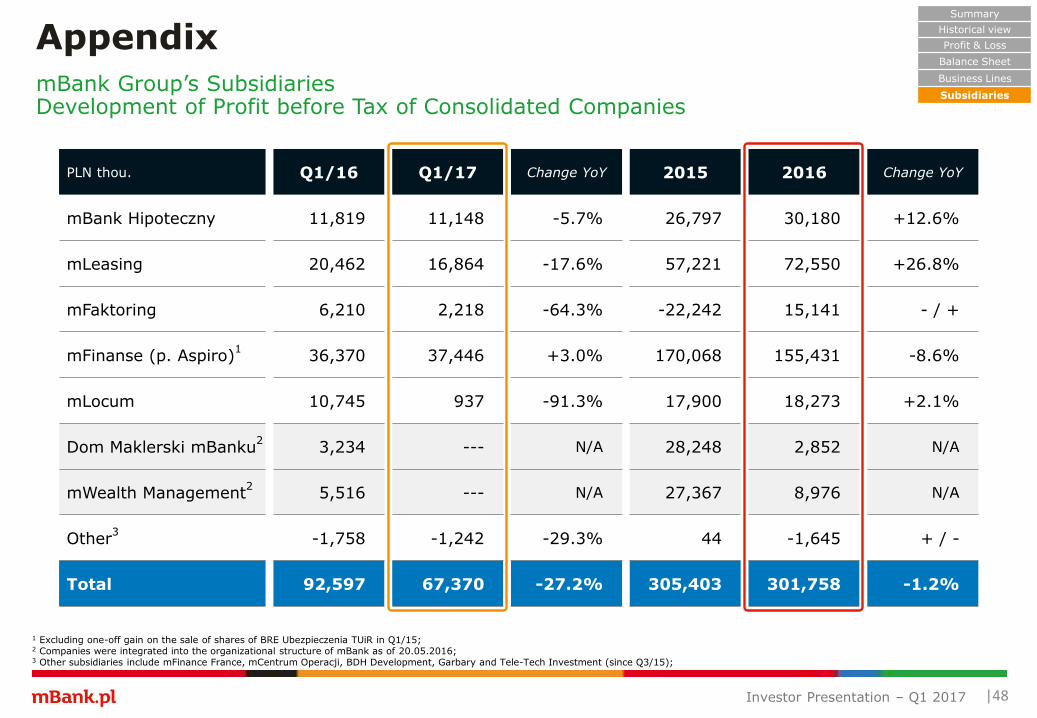
AppendixmBank Group’s SubsidiariesDevelopment of Profit before Tax of Consolidated Companies
Summary
Historical view
Profit & Loss
Balance Sheet
Business Lines
Subsidiaries
1 Excluding one-off gain on the sale of shares of BRE Ubezpieczenia TUiR in Q1/15;2 Companies were integrated into the organizational structure of mBank as of 20.05.2016;3 Other subsidiaries include mFinance France, mCentrum Operacji, BDH Development, Garbary and Tele-Tech Investment (since Q3/15);
PLN thou. Q1/16 Q1/17 Change YoY 2015 2016 Change YoY
mBank Hipoteczny 11,819 11,148 -5.7% 26,797 30,180 +12.6%
mLeasing 20,462 16,864 -17.6% 57,221 72,550 +26.8%
mFaktoring 6,210 2,218 -64.3% -22,242 15,141 - / +
mFinanse (p. Aspiro)1
36,370 37,446 +3.0% 170,068 155,431 -8.6%
mLocum 10,745 937 -91.3% 17,900 18,273 +2.1%
Dom Maklerski mBanku2
3,234 --- N/A 28,248 2,852 N/A
mWealth Management2
5,516 --- N/A 27,367 8,976 N/A
Other3
-1,758 -1,242 -29.3% 44 -1,645 + / -
Total 92,597 67,370 -27.2% 305,403 301,758 -1.2%
Investor Presentation – Q1 2017
|49
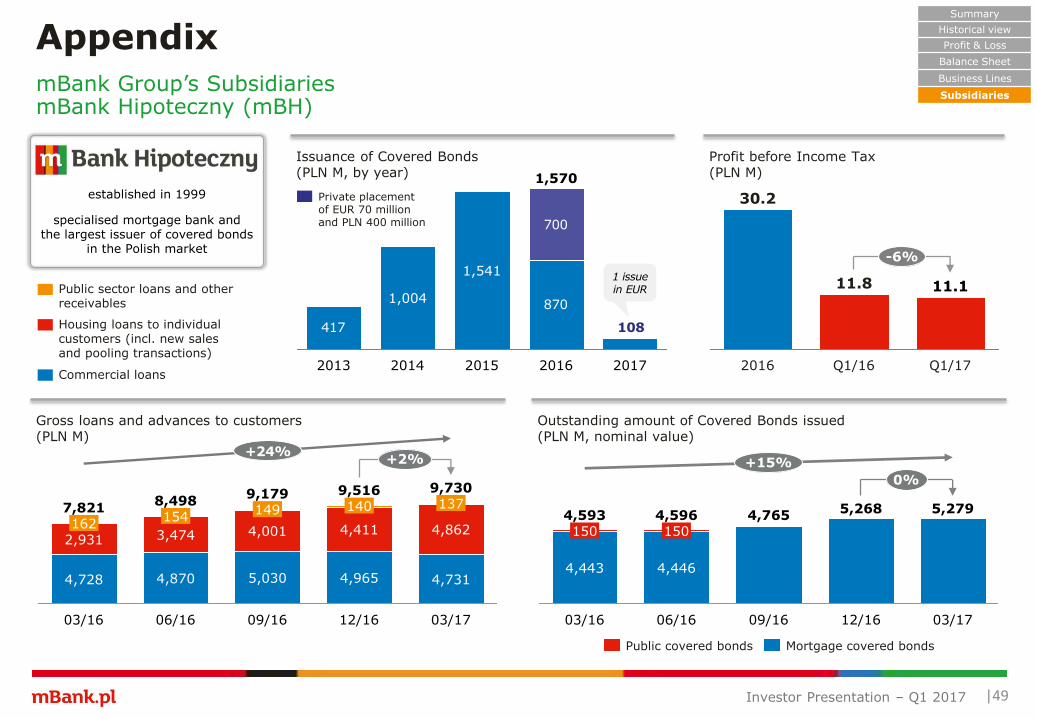
AppendixmBank Group’s SubsidiariesmBank Hipoteczny (mBH)
Housing loans to individual customers (incl. new salesand pooling transactions)
Public sector loans and other receivables
Commercial loans
Profit before Income Tax(PLN M)
Issuance of Covered Bonds(PLN M, by year)
Gross loans and advances to customers(PLN M)
Outstanding amount of Covered Bonds issued(PLN M, nominal value)
0%
+15%
03/17
5,279
12/16
5,268
09/16
4,765
06/16
4,596
4,446
150
03/16
4,593
4,443
150
Mortgage covered bondsPublic covered bonds
established in 1999
specialised mortgage bank andthe largest issuer of covered bonds
in the Polish market
Summary
Historical view
Profit & Loss
Balance Sheet
Business Lines
Subsidiaries
-6%
Q1/17
11.1
Q1/16
11.8
2016
30.2
+24%
Investor Presentation – Q1 2017
417
870
108
700
20172016
1,570
2015
1,541
2014
1,004
2013
Private placementof EUR 70 millionand PLN 400 million
1 issuein EUR
+2%
03/17
9,730
4,731
4,862
137
12/16
9,516
4,965
4,411
140
09/16
9,179
5,030
4,001
149
06/16
8,498
4,870
3,474
154
03/16
7,821
4,728
2,931162

mBank Group’s SubsidiariesmBank Hipoteczny (mBH): Issuance Activity on the Covered Bonds Market
Appendix
|50
Amount Currency Issue date Maturity date Tenor (years) Coupon
7.5 M EUR 17-02-2014 15-02-2018 4.0 EURIBOR 6M+80bps
8.0 M EUR 28-02-2014 28-02-2029 15.0 Fixed (3.50%)
15.0 M EUR 17-03-2014 15-03-2029 15.0 Fixed (3.50%)
20.0 M EUR 30-05-2014 30-05-2029 15.0 Fixed (3.20%)
300.0 M PLN 28-07-2014 28-07-2022 8.0 WIBOR 6M+93bps
200.0 M PLN 04-08-2014 20-02-2023 8.5 WIBOR 6M+93bps
20.0 M EUR 22-10-2014 22-10-2018 4.0 Fixed (1.115%)
50.0 M EUR 28-11-2014 15-10-2019 4.9 EURIBOR 3M + 87bps
200.0 M PLN 20-02-2015 28-04-2022 7.2 WIBOR 6M+78bps
20.0 M EUR 25-02-2015 25-02-2022 7.0 Fixed (1.135%)
250.0 M PLN 15-04-2015 16-10-2023 8.5 WIBOR 6M+87bps
11.0 M EUR 24-04-2015 24-04-2025 10.0 Fixed (1.285%)
50.0 M EUR 24-06-2015 24-06-2020 5.0 EURIBOR 3M + 69bps
500.0 M PLN 17-09-2015 10-09-2020 5.0 WIBOR 3M+110bps
255.0 M PLN 02-12-2015 20-09-2021 5.8 WIBOR 3M+115bps
300.0 M PLN 09-03-2016 05-03-2021 5.0 WIBOR 3M+120bps
50.0 M EUR 23-03-2016 21-06-2021 5.2 EURIBOR 3M + 87bps
50.0 M PLN 28-04-2016 28-04-2020 4.0 Fixed (2.91%)
100.0 M PLN 11-05-2016 28-04-2020 4.0 Fixed (2.91%)
13.0 M EUR 28-09-2016 20-09-2026 10.0 Fixed (1.18%)
35.0 M EUR 26-10-2016 20-09-2026 9.9 Fixed (1.183%)
24.9 M EUR 01-02-2017 01-02-2024 7.0 Fixed (0.94%)
Summary
Historical view
Profit & Loss
Balance Sheet
Business Lines
Subsidiaries
Investor Presentation – Q1 2017
Summary of Mortgage Covered Bonds issued in 2014-2017 (public issues)

Rank
#3
Leasing contracts(PLN M)
Factoring contracts(PLN M)
|51
AppendixmBank Group’s SubsidiariesLeasing and Factoring
Profit before Tax(PLN M)
Profit before Tax(PLN M)
Market share & position – Q1/17
Market share & position – Q1/17
7.5%
Rank
#8
7.1%
Source: Polish Factors Association (PFA)
Source: Polish Leasing Association (PLA)
established
in 1991
provides
financial and
operating
leasing of cars,
trucks,
machinery and
real estate
established
in 1995
offers factoring
services, incl.
domestic and
export recourse
and non-recourse
factoring and
import guarantees
Summary
Historical view
Profit & Loss
Balance Sheet
Business Lines
Subsidiaries
+12%
Q1/17
1,129
Q1/16
1,011
+11%
Q1/17
2,922
Q1/16
2,631
-18%
Q1/17
16.9
Q1/16
20.5
2016
72.6
Investor Presentation – Q1 2017
-64%
Q1/17
2.2
Q1/16
6.2
2016
15.1

mBank Group’s Brokerage ServicesmBank Dom Maklerski (mDM)
|52
Appendix
mDM Bonds Trading on WSE and Market Share in Turnover(PLN M, by quarter)
mDM Options Trading on WSE and Market Share in Turnover(thou. of contracts, by quarter)
Summary
Historical view
Profit & Loss
Balance Sheet
Business Lines
Subsidiaries
Source: mBank calculations based on WSE data.
mDM Equities Trading on WSE and Market Share in Turnover(PLN M, by quarter)
mDM Futures Trading on WSE and Market Share in Turnover(thou. of contracts, by quarter)
Q4/16
6,021
5.1%
Q3/16
5,074
4.4%
Q2/16
3,682
4.1%
Q1/16
3,701
4.0%
Q1/17
5.2%
7,211
Q4/16
93.7
10.0%
Q3/16
70.4
9.3%
Q2/16
36.0
5.2%
Q1/16
38.9
8.2%
5.0%
38.1
Q1/17
Q4/16
508.8
12.3%
Q3/16
386.1
10.9%
Q2/16
476.6
12.5%
Q1/16
498.5
13.5%11.8%
508.8
Q1/17
Q4/16
20.0
9.0%
Q3/16
18.1
10.1%
Q2/16
15.6
9.1%
Q1/16
19.8
11.0%
Q1/17
8.5%
15.7
Investor Presentation – Q1 2017

95
100
105
110
115
120
125
130
31-12-16 14-01-17 28-01-17 11-02-17 25-02-17 11-03-17 25-03-17 08-04-17
mBank WIG-Banks Index WIG-20 Index
WIG-30 2.201%
WIG-20 2.406%
WIG 1.552%
WIG-Banks 5.770%
WIG-Poland 1.597%
|53
mBank’s share price performance in Q1/17
Polish banking stocks remain to be influenced by regulatory and legislative risks
mBank’s index membership and weights* mBank’s share performance v. main indices (rebased to 100)
Listed on the Warsaw Stock Exchange
since October 1992
The only share belonging to WIG-20 blue
chip index since its inception in April 1994
A strategic shareholder, Germany’s
Commerzbank, owns 69.4% of shares
* Share in index as of 18.04.2017
Source: WSE, Bloomberg (data as of 21.04.2017).
+16.2%
+12.5%
+17.1%
mBank’s share price in 2017
ISIN PLBRE0000012
Bloomberg MBK PW
Number of shares issued 42 280 127
Investor Presentation – Q1 2017
01.01.2017 335.25
MIN (01.01.2017) 335.25
MAX (22.02.2017) 427.00
31.03.2017 373.50
|54
Contact details
mBank’s Investor Relations at your service:
E-mail address: [email protected]
Investor Relations website: www.mbank.pl/en/investor-relations/
mBank Analyzer: analyzer.mbank.pl
Ernest Pytlarczyk
Head of Investor Relations and Group Strategy,Chief Economist
Direct dial: +48 22 829 14 34
E-mail: [email protected]
Joanna FilipkowskaDeputy Head of Investor Relations
Direct dial: +48 22 829 04 53
E-mail: [email protected]
Paweł Lipiński Direct dial: +48 22 829 15 33
E-mail: [email protected]
Marta Polańska Direct dial: +48 22 438 31 09
E-mail: [email protected]
Monika Zaręba Direct dial: +48 22 829 08 18
E-mail: [email protected]
mBank S.A.Investor Relations and Group Strategyul. Senatorska 1800-950 Warszawa