results of sampling for wastewater tracers at and near ... · inc., appendix g-2 in kona kai ola...
TRANSCRIPT

Results of Sampling for Wastewater Tracers At and Near Kealakehe
WWTP, Kona, Hawaii
USGS / Hawaii Dept. of Health Cooperative Program — Wastewater Source Tracking —
Briefing presentation, March 13, 2008
Chip HuntGround-Water Hydrologist
U.S. Geological Survey, Honolulu, [email protected]

AcknowledgmentsThanks to Mark Norman and others at Kealakehe WWRF for sampling assistance, and Hawaii County for permission to sample the treated effluent
Thanks to Dave Tarnas for recon and access to monitor wells, and Jacoby Development, Inc for permission to sample
Thanks to Nancy Nakata (Hawaii Dept. of Health) for sampling assistance

Wastewater Treatment Plant

Problem and ApproachTreated wastewater effluent is discharged to disposal pit in lava field; disappears
Where does it go? (expected to form a ground-water plume that discharges at nearby coast / Honokohau Harbor)
Objective—Can we detect or map it?
Approach—Sample nearby wells and springs for chemical wastewater tracers

Multi-Tracer ApproachTracer
NO3 , NH4 , PO415N11B
UV fluorescenceat 445 nm
Indicator bacteriaPharmaceuticals
WW indicators
Possible Indicator of:Animal / human waste, fertilizersAnimal / human N vs soil NLaundry detergents (light 11B)Laundry detergents (optical
brighteners) or DOMFecal source
Domestic wastewaterDomestic wastewater

What should a wastewater plume look like?
Municipal injection plume at Kihei, Maui provides a good example

Kihei wastewater reclamation & injection

3 Mgal/d injection treated effluent
Ambient GW flow 3 Mgal/d per mile of coast
Plume about a mile wide

Saltwater
Saltwater
circulation
Recharge nodes vGW Model of Freshwater Lens Freshwater
Mixing zone
Mixing zone
BrackishBrackish
Brackish waterBrackish water

Salinity Visualization3% le
dge
3% le
dgeInjection Plume CutawayInjection Plume Cutaway
20%20%
40%40%60%60%
80%80%
3%3%
Percent Percent seawaterseawater
100%100%
Effluent = 1% (buoyant)Effluent = 1% (buoyant)ShorelineShoreline
-- looking northwestlooking northwest
Injection interval Injection interval (deep into (deep into
mixing zone mixing zone and saltwater)and saltwater)

100%
0%
Percent effluent
At Kihei, downgradient well in plume showed anoxic conditions, heavy d15N, and other wastewater tracers

Heavy Heavy δδ1515N also N also measured in measured in marine algae marine algae
near Kihei plume near Kihei plume by UH scientistsby UH scientists
HypneaHypnea
UlvaUlva
Celia Smith and Jennifer Celia Smith and Jennifer Smith, Univ. of HawaiiSmith, Univ. of Hawaii

What does 15N signify? Ans: Nitrogen SourceKendall and McDonnell (1998)

Here’s how 15N worked out at Kihei
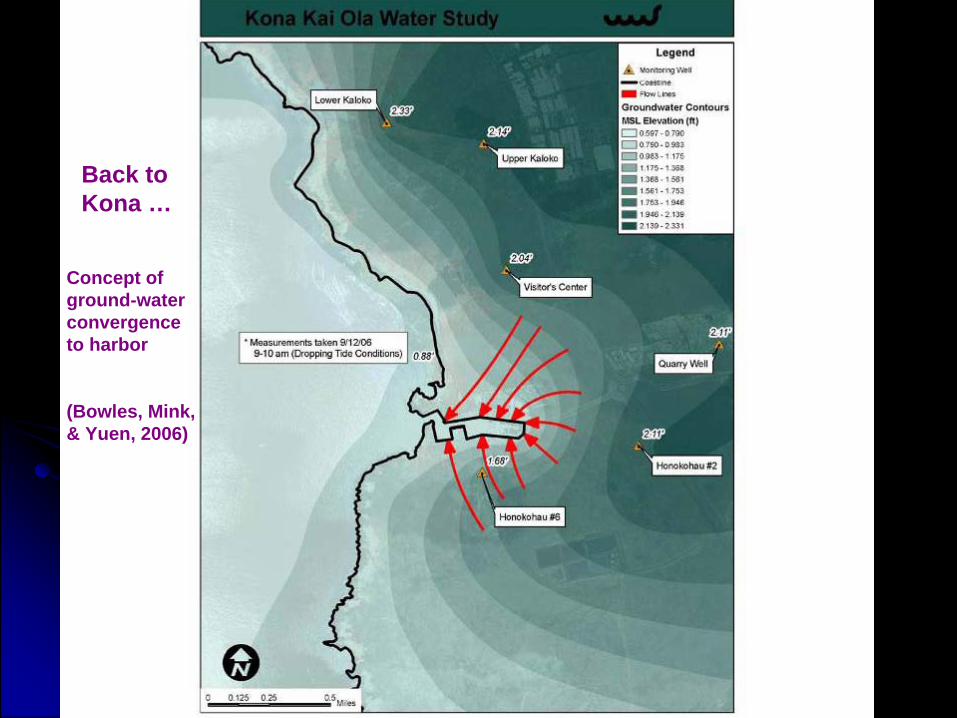
Concept of ground-water convergence to harbor
(Bowles, Mink, & Yuen, 2006)
Back to Kona …
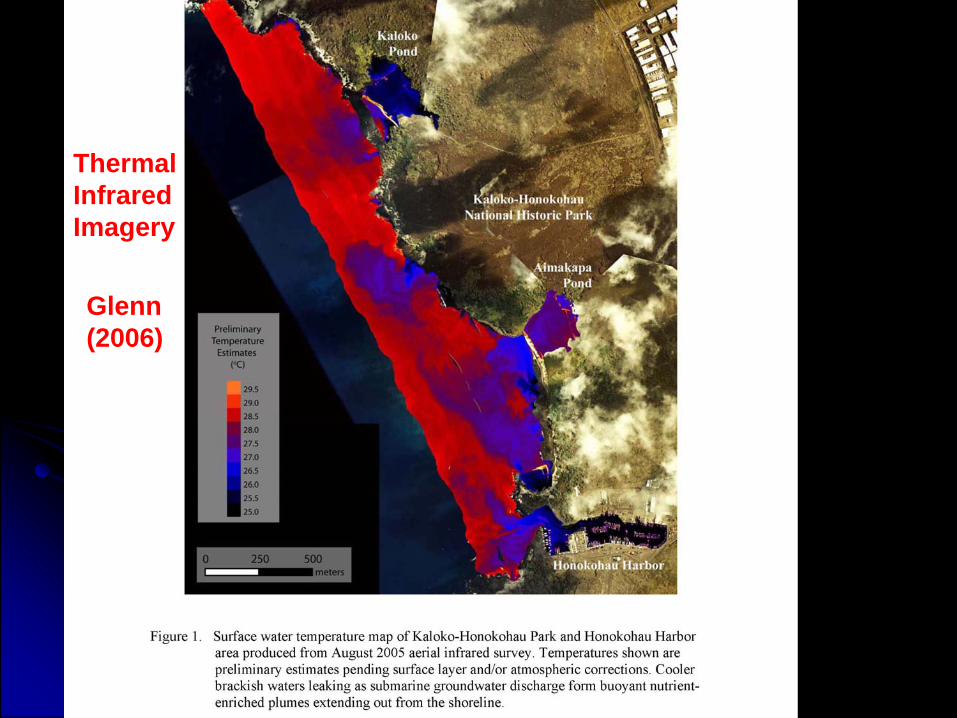
Glenn(2006)
ThermalInfraredImagery

At Kealakehe, At Kealakehe, 3 Mgal/d/mi GW flow 3 Mgal/d/mi GW flow and and 1.5 Mgal/d effluent1.5 Mgal/d effluent
GW flow is 3 Mgal/d per mile of coast
1.5 Mgal/d effluent
GW discharge

Effluent Effluent ddisposal isposal pitpit
Potential sampling sites: monitor wells and Potential sampling sites: monitor wells and borings drilled for harborborings drilled for harbor--expansion study expansion study (recon showed that many are now obstructed)(recon showed that many are now obstructed)
HarborHarbor

Sampled Sites at Kealakehe


(tapwater control = 1)

Optical-brightener readings fall roughly on a trend line, possibly reflecting seawater dilution plus added attenuation of some sort (sorption? degradation?)


(Bowles…2006)
Bowles, Mink, & Yuen, 2006)

Oxygen-isotope compositions fall roughly along an effluent- seawater dilution line

Hydrogen-isotope compositions fall roughly along an effluent- seawater dilution line

(Bowles…2006)
(Bowles…2006)
(Bowles, 2007)
(Glenn, 2006)

Temperatures fall roughly along an effluent / cold-seawater dilution line

Headwall of submarine slump may allow easy entry of cold, sub- thermocline seawater into lava aquifer
(Bowles, 2007)North North Kona Kona SlumpSlump

= 7.3 at Kihei (Hunt, 2007) = 22 at Wahiawa (Hunt)
(Bowles…2006)
(Bowles…2006)


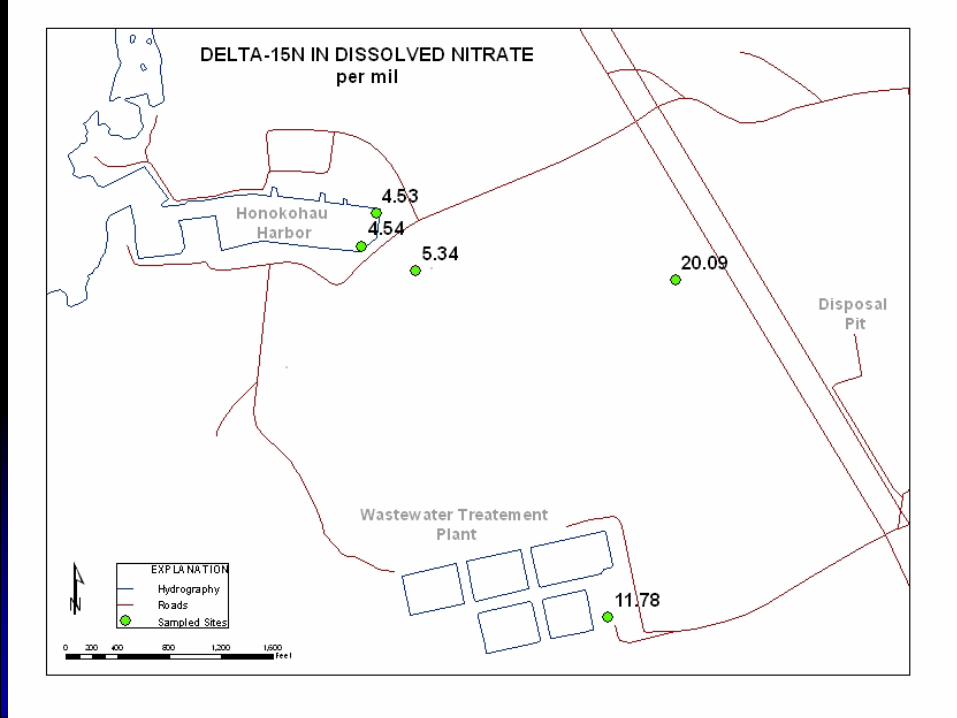

Isotopic composition at well 2 falls on denitrification trend starting from effluent

Kihei again, for comparison


= 1.7 at Kihei (Hunt, 2007) = 2.2 at Wahiawa (Hunt)
(Bowles…2006)
(Bowles…2006)

(Bowles…2006)
(Bowles…2006)

(Bowles…2006)
(Bowles…2006)
(Dollar & Andrews, 1997)

(Bowles…2006)
(Bowles…2006)
(Dollar & Andrews, 1997)

Glenn (2006) showed elevated phosphorus in harbor waters compared to a regional dilution trend between wells and seawater

Glenn(2006)
ThermalInfraredImagery

Seawater = 40
Fresh GW = 48 on Maui
= 32 in Kihei effluent (Hunt, 2007)
Laundry detergent boron = 0(Hunt, 2007)


Summary of ResultsSamples included treated effluent, 2 wells, 2 harbor springs, and a blank
Most measures decreased or increased strongly from effluent to harbor- salinity increased- temperature, nutrients, and most “contaminants” decreased
The pharmaceutical carbamazepine was detected in all samples andsulfamethoxazole in all samples but one (spring E1); carbamazepine is a persistent chemical commonly detected in other studies
Several compounds in effluent were detected at just one other site: the anticorrosive 5-Methyl-1H-benzotriazole and the fire retardant Tris(dichloro_i-pr) phosphate at well 2; and the plasticizer triphenylphosphate at boring 16
Other pharmaceuticals and waste indicator compounds were detected in effluent but not offsite (for example, caffeine and the nicotine metabolite cotinine); this is not uncommon in other studies; compounds can degrade, and concentrations in effluent often are low to begin with

Summary of Results—ContinuedNutrients were highest in effluent and decreased toward the harbor
- phosphorus in all samples was well above “background” in 2 nearby wells- nitrogen in all samples was well above that in one nearby well but not the
other; nitrogen “background” is uncertain because the 2 nearby wells differ so greatly from each other in concentration
- ammonium was highest in effluent and detected in wells but not the springs- 15N isotope composition at well 2 is consistent with denitrification of effluent
Fabric-brightener fluorescence in all samples was highly elevated (above a tapwater control) and was highest in effluent11B showed light “laundry detergent” signature in effluent and at well 2; enough salinity at other sites to “swamp out” signature with seawater boron
Various measures fall along an effluent-seawater mixing line, consistent with mixing of effluent and saltwater from beneath the brackish lens
Fecal-indicator bacteria counts were erratic, with possible interference from surface infiltration into the aquifer and overland runoff into uncased boreholes

Strategies and Possible Future WorkThe strategy followed here was to sample for what can be termed “inherent or ambient tracers”
- that is, things already in wastewater that can be sought for the expense of sampling, and with no concern for timing (sampling too soon? too late?)
- there is ambiguity in assessing “background” against which elevated concentrations are apparent; there also may be interference from other sewage sources in the watershed (cesspools, etc.)
- but there is strength in the multi-tracer emphasis (concurrence of multiple lines of evidence and spatial patterns; initial evidence of processes at work)
- a more extensive areal study with the inherent-tracer approach might better define background concentrations and influences of other sewage sources
Alternately, a “forced tracer” test might also be conducted, such as with rhodamine fluorescent dye. Results might be more conclusive than inherent tracers, but such a test would need to be well planned and executed, and would require repeat sampling over the necessary time span for ground water to flow from disposal pit to wells to harbor

ReferencesBowles, S.P., Mink, J., and Yuen, G., 2006, Geology and ground-water hydrology in the vicinity of
Honokohau Harbor: report by Waimea Water Services. Inc., assisted by Mink and Yuen, Inc., appendix G-1 in Kona Kai Ola environmental impact statement, 16 p.
Bowles, S.P., 2007, Evidence and implications of saline cold ground-water, Honokohau, Hawaii: report by by Waimea Water Services. Inc., appendix G-2 in Kona Kai Ola environmental impact statement, 7 p.
Dollar, Steven, and Andrews, Christine, 1997, Algal blooms off west Maui—assessing causal linkages between land and the coast ocean: Final Report for National Oceanic and Atmospheric Administration Coastal Ocean Program Office and University of Hawaii Sea Grant College Program, 35 p. plus tables and illustrations.
Glenn, C.R., 2006, Assessment of groundwater inputs into coastal waters of Hawaii via natural tracers and aerial imagery: National Science Foundation Annual Report 0451379, Univ. of Hawaii at Manoa, 20 p.
Hunt, C.D. Jr., 2007, Ground-water nutrient flux to coastal waters and numerical simulation of wastewater injection at Kihei, Maui, Hawaii: U.S. Geological Survey Scientific Investigation Report 2006-5283, 69 p.
Kendall, C. and McDonnell, J.J. (Eds.), 1998, Isotope Tracers in Catchment Hydrology: Elsevier Science, Amsterdam, 839 p.
MACTEC Engineering and Consulting, Inc., Boring locations map
Smith, C.M. and Smith, J.E., 2007, Algal blooms in north Kihei: an assessment of patterns & processes relating nutrient dynamics to algal abundance: Report to City and County of Maui, University of Hawaii at Manoa, Hawaii, 65 p.