results of the 2013 anode effect survey - world … · the 2013 anode effect survey generated data...
TRANSCRIPT
International Aluminium Institute | www.world-aluminium.org
International Aluminium Institute
Results of the 2013
Anode Effect
Survey Report on the Aluminium Industry’s Global
Perfluorocarbon Gases Emissions Reduction
Programme
International Aluminium Institute | www.world-aluminium.org
Contents
Global Aluminium Industry PFC Emissions Reduction Performance 2013 ............................. 4
Industry Trends ..................................................................................................................... 5
2013 Anode Effect Survey ..................................................................................................... 6
Adoption of revised GWPs and its consequence ................................................................... 9
Global Emissions Estimations ..............................................................................................13
Uncertainties ........................................................................................................................16
Benchmark Data...................................................................................................................17
Appendix A – Facility Emissions Calculation Methodologies.................................................23
Tables
Table 1 – Aluminium smelting technology categories ............................................................ 6
Table 2 - 2013 Anode Effect Survey participation by technology ........................................... 7
Table 3 - IPCC GWP Values ................................................................................................. 9
Table 4 – Perfluorocarbon emission results from facility data reporting to the 2013 Anode Effect
Survey ..................................................................................................................................11
Table 5 – Production weighted mean PFC emissions per unit production of reporting entities,
2006-2013 ............................................................................................................................12
Table 6 – Total global 2013 PFC emissions .........................................................................14
Table 7 - Slope and overvoltage coefficients by technology, including uncertainty (Source:
IPCC, 2006) .........................................................................................................................24

International Aluminium Institute | www.world-aluminium.org
Figures
Figure 1 –Location of primary aluminium production, 1990 & 2006-2013 (SOURCE: IAI & CRU)
.............................................................................................................................................. 5
Figure 2 – Primary aluminium smelting technology mix, 1990-2013 (SOURCE: IAI & CRU) .. 5
Figure 3 – Reporting production & rate 1990-2013 ................................................................ 8
Figure 4 – Reporting rates (aluminium production) per technology, 2006-2013 ..................... 8
Figure 5 – Median PFC emission rates (as CO2e) of reporting entities, per technology, 2006-
2013 .....................................................................................................................................10
Figure 6 – PFC emissions (as CO2e) per tonne of aluminium production, 2006-2013 ..........15
Figure 7 – Absolute PFC emissions (as CO2e) and primary aluminium production, 1990-2013
.............................................................................................................................................15
Figure 8 – PFC emissions (as CO2e per tonne Al) performance of reporters, benchmarked as
cumulative fraction within technologies, 2013 .......................................................................18
Figure 9 –PFC emissions performance of reporters (t CO2e/t Al), benchmarked as cumulative
production within technologies, 2013 ....................................................................................18
Figure 10 - PFC emissions performance of reporters (t CO2e/t Al), benchmarked as cumulative
production within technologies, 1990 & 2013 ........................................................................19
Figure 11 - Average anode effect frequency of reporters benchmarked by technology type,
2013 .....................................................................................................................................20
Figure 12 - Average anode effect duration of reporters benchmarked by technology type, 2013
.............................................................................................................................................20
Figure 13 - Average anode effect minutes per cell day of reporters benchmarked by technology
type, 2013 ............................................................................................................................21
Figure 14 - Average anode effect overvoltage of reporters benchmarked by technology type,
2013 .....................................................................................................................................22
4
International Aluminium Institute | www.world-aluminium.org
Global Aluminium Industry PFC Emissions Reduction Performance
2013
Global aluminium industry perfluorocarbon (PFC) emissions intensity (as CO2e per tonne of
production) has been reduced by more than 35% since 2006, almost 90% since 1990.
With primary aluminium production having grown by over 150% over the same period,
absolute emissions of PFCs by the aluminium industry have been reduced from approximate
100 million tonnes of CO2e in 1990 to 32 million tonnes in 2013.
The International Aluminium Institute (IAI) has collected anode effect data directly from primary
aluminium producers for the purposes of calculating sectoral PFC emission inventories for
over a decade, with annual surveys carried out since 2000.
The 2013 Anode Effect Survey generated data from 218 reporting entities (smelters & potlines)
representing 20 million tonnes of primary aluminium production, with emissions from the
remaining 30 million tonnes of global primary aluminium production (the majority in China),
modelled using historic, sampled or technology average data.
This survey report outlines year 2013 data collection and analysis methodologies and global
results. Historically IAI has used global warming potential (GWP) values for perfluorocarbon
gases as published in the IPCC Second Assessment Report (1996), to align with a 1998
decision of the Conference of the Parties to the Kyoto Protocol (Decision 2/CP.3). The 2011
decision by the Conference of the Parties serving as the meeting of the Parties to the Kyoto
Protocol (Decision 4/CMP.7) to utilise revised GWPs from the IPCC Fourth Assessment
Report (2007), for the second commitment period (from 2013) has necessitated recalculation
of aluminium industry PFC emissions (as CO2e). This report outlines this process and, where
appropriate, delivers data using both sets of GWP. However, for all future reports (and for
online historic datasets and baselines), only 2006 GWPs will be employed.
Current and historic PFC emissions data (utilising revised GWPs) can also be found on the
International Aluminium Institute’s website http://www.world-
aluminium.org/statistics/perflurocarbon-pfc-emissions/#data. As in this report, separate
company or country PFC emissions data is not published, but rather is aggregated by
production technology

5
International Aluminium Institute | www.world-aluminium.org
Industry Trends
Growth in primary aluminium production continues to be driven by China and the GCC
countries and, since the late 1990s, based on latest point fed prebake technology. Global
primary aluminium production in 2013 was a record 51 million tonnes.
Figure 1 –Location of primary aluminium production, 1990 & 2006-2013 (SOURCE: IAI & CRU)
Figure 2 – Primary aluminium smelting technology mix, 1990-2013 (SOURCE: IAI & CRU)
0
5
10
15
20
25
30
35
40
45
50
55
1990 2006 2007 2008 2009 2010 2011 2012 2013
Pri
mary
Alu
min
ium
Pro
du
cti
on
(millio
n t
on
nes)
China
GCC
Other Asia
Africa
Oceania
South America
CIS
Europe
North America
0
10
20
30
40
50
60
19
90
19
95
19
98
19
99
20
00
20
01
20
02
20
03
20
04
20
05
20
06
20
07
20
08
20
09
20
10
20
11
20
12
20
13
An
nu
al
Pri
mary
Alu
min
ium
Pro
du
cti
on
(m
illi
on
to
nn
es)
HSS
VSS
SWPB
PFPB
CWPB
NB:technology category details in Table 1

6
International Aluminium Institute | www.world-aluminium.org
2013 Anode Effect Survey
Perfluorocarbons, or PFCs, are a group of potent greenhouse gases with long atmospheric
lifetimes (in the tens of thousands of years), of which the greatest volume is emitted from
industrial processes. PFCs can be produced in the primary aluminium electrochemical
smelting process, during events referred to as anode effects.
An anode effect is a process upset condition, where an insufficient amount of alumina (Al2O3),
the raw material for primary aluminium production, is dissolved in the electrolyte bath,
contained in the electrolytic cells (or pots) within a smelter reduction line (potline). This causes
the voltage in the pot to be elevated above the normal operating range, resulting in the
emission of gases containing the PFCs tetrafluoromethane (CF4) and hexafluoroethane
(C2F6).
Data on anode effects generated by process monitoring systems allows one to calculate such
emissions. The International Aluminium Institute has collected anode effect data directly from
primary aluminium producers for the purposes of calculating sectoral PFC emission
inventories for over a decade, with annual surveys carried out since 2000.
The IAI Anode Effect Survey requests data from all aluminium smelting facilities around the
world, via IAI member companies (http://www.world-aluminium.org/about/members/), direct
correspondence with non-member producers and regional industry associations. Facilities
are requested, where possible, to report by potline, and to separate data from different
technologies within a single plant. As well as anode effect process data, reporters are also
asked for information that allows for quality control (by comparison against other facilities and
within reporters’ data over time) and for the IAI to take a snapshot and monitor over time the
adoption of anode effect mitigation technologies such as prediction and automatic termination
software. The reporting form and guidelines (PFC001) can be found from the IAI website
(http://www.world-aluminium.org/media/filer_public/2013/01/15/pfc001.pdf).
BROAD TECHNOLOGY
CATEGORY
TECHNOLOGY
CATEGORY
ALUMINA FEED
CONFIGURATION ACRONYM
Prebake
(anodes pre-baked)
Centre Worked Bar broken centre feed CWPB
Point centre feed PFPB
Side Worked Manual side feed SWPB
Søderberg
(anodes baked in-situ)
Vertical Stud Manual side feed
Point feed VSS
Horizontal Stud Manual side feed HSS
Table 1 – Aluminium smelting technology categories

7
International Aluminium Institute | www.world-aluminium.org
Participation Rate
It is significant that the 2013 survey results include data from 100% of SWPB, VSS and HSS
technology production. On average, these technologies produce more emissions per tonne
of aluminium produced than the CWPB and PFPB categories (see Error! Reference source
not found.).
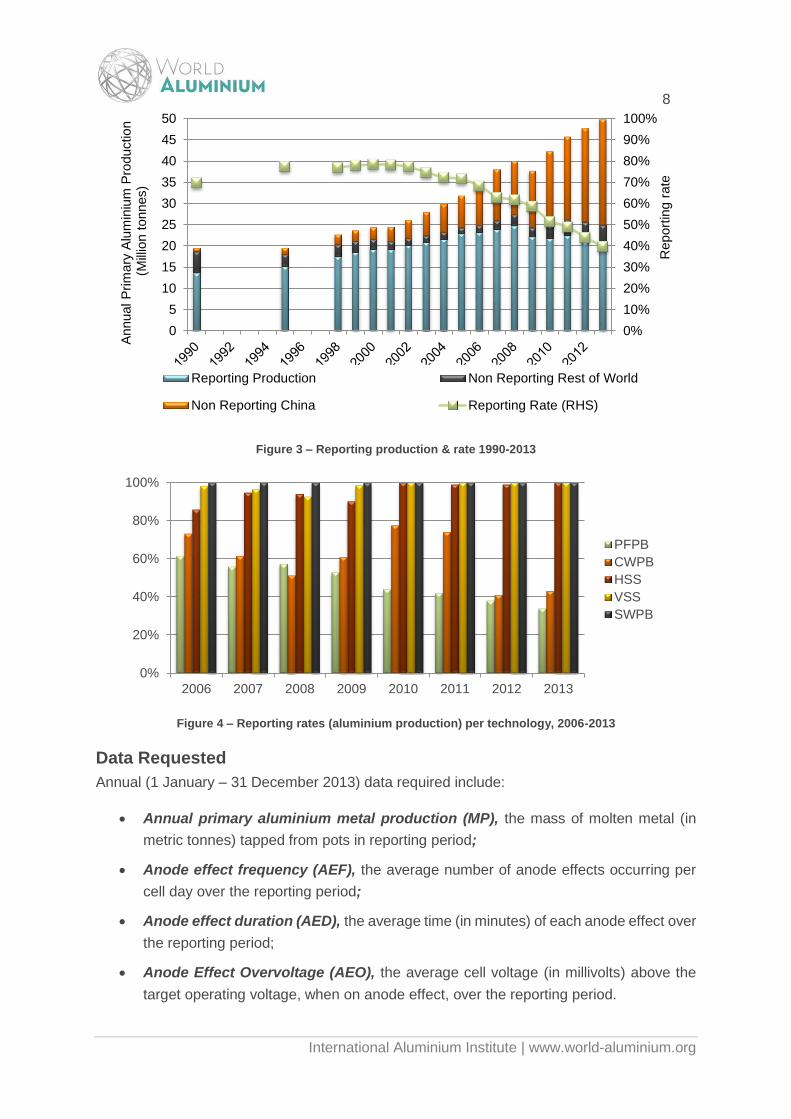
As the aluminium production in China represents an increasing proportion of the industry and
non-reported data are predominantly from China, the overall reporting rate shown in Figure 5
continues to decrease (40% in 2013). Outside China, 24 smelters, representing over 5 million
tonnes of production (equivalent to around 10% of worldwide production), do not report data
to the IAI.
TECHNOLOGY
2013 primary
aluminium production
(1,000 tonnes)
2013 production
represented in survey
(1,000 tonnes)
2013
participation rate
by production
CWPB 1,412 613 43%
PFPB
(Rest of World) 19,988 15,257 76 %
34% PFPB
(China) 24,936 0 0 %
SWPB 514 514 100 %
VSS 3,378 3,378 100 %
HSS 373 373 100 %
All Technologies
(excluding China) 25,666 20,135 78 %
All Technologies
(Including China) 50,602 20,135 40 %
Table 2 - 2013 Anode Effect Survey participation by technology
Note: any inconsistencies due to rounding
The high coverage of the survey data outside China (with respect to both metal production
and emissions) and of the higher emitting technologies, combined with the fact that actual
measurements and secondary information, means that the IAI is able to develop estimates of
PFC emissions from the global aluminium industry, with some degree of accuracy.
8
International Aluminium Institute | www.world-aluminium.org
Figure 3 – Reporting production & rate 1990-2013
Figure 4 – Reporting rates (aluminium production) per technology, 2006-2013
Data Requested
Annual (1 January – 31 December 2013) data required include:
Annual primary aluminium metal production (MP), the mass of molten metal (in
metric tonnes) tapped from pots in reporting period;
Anode effect frequency (AEF), the average number of anode effects occurring per
cell day over the reporting period;
Anode effect duration (AED), the average time (in minutes) of each anode effect over
the reporting period;
Anode Effect Overvoltage (AEO), the average cell voltage (in millivolts) above the
target operating voltage, when on anode effect, over the reporting period.
0%
10%
20%
30%
40%
50%
60%
70%
80%
90%
100%
0
5
10
15
20
25
30
35
40
45
50
Report
ing r
ate
Annual P
rim
ary
Alu
min
ium
Pro
duction
(Mill
ion t
onnes)
Reporting Production Non Reporting Rest of World
Non Reporting China Reporting Rate (RHS)
0%
20%
40%
60%
80%
100%
2006 2007 2008 2009 2010 2011 2012 2013
PFPB
CWPB
HSS
VSS
SWPB
9
International Aluminium Institute | www.world-aluminium.org
Overvoltage is specifically requested from operators employing Rio Tinto Alcan AP-18 or AP-
3x PFPB technologies and SWPB facilities using control technology that records overvoltage
rather than anode effect duration. These anode effect performance data allow for the
calculation, by the Intergovernmental Panel on Climate Change (IPCC) Tier 2 or Tier 3
methodologyF
1F, of facilities’ total annual tetrafluoromethane (CF4) and hexafluoroethane (C2F6)
emissions, and hence tonnes of CO2 equivalent (CO2e) emitted per tonne of aluminium
produced.
It should be noted that the IPCC Tier 1 methodology of multiplying metal production by a
technology-specific coefficient to estimate PFC emissions is not good practice, as the results
are not derived from process data and consequently have a very high uncertainty attached to
them. IAI does not use the Tier 1 methodology in any of its PFC emissions calculations.
Adoption of revised GWPs and its consequence
The 2011 adoption, by the Conference of the Parties to the Kyoto Protocol, of revised global
warming potentials (GWPs) for greenhouse gas emissions calculations in the protocol’s
second commitment period (2013-2020) has necessitated recalculation of the industry’s PFC
data (current and historic).
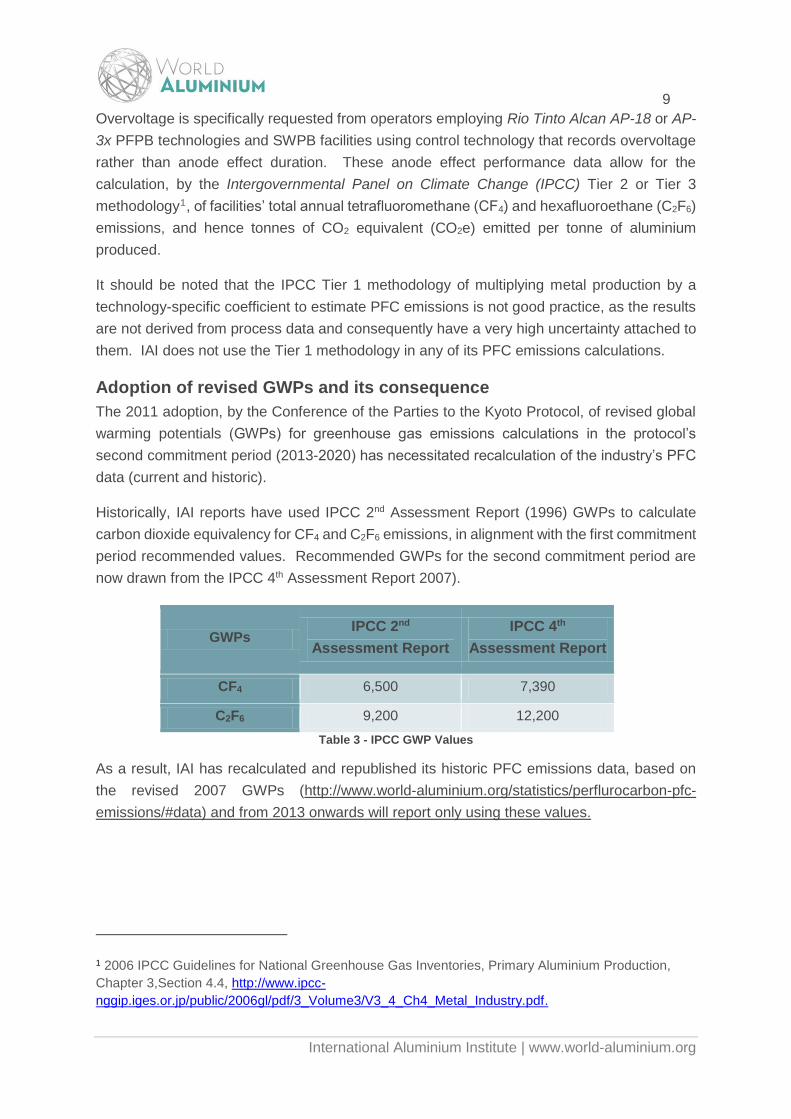
Historically, IAI reports have used IPCC 2nd Assessment Report (1996) GWPs to calculate
carbon dioxide equivalency for CF4 and C2F6 emissions, in alignment with the first commitment
period recommended values. Recommended GWPs for the second commitment period are
now drawn from the IPCC 4th Assessment Report 2007).
GWPs IPCC 2nd
Assessment Report
IPCC 4th
Assessment Report
CF4 6,500 7,390
C2F6 9,200 12,200
Table 3 - IPCC GWP Values
As a result, IAI has recalculated and republished its historic PFC emissions data, based on
the revised 2007 GWPs (http://www.world-aluminium.org/statistics/perflurocarbon-pfc-
emissions/#data) and from 2013 onwards will report only using these values.
1 2006 IPCC Guidelines for National Greenhouse Gas Inventories, Primary Aluminium Production,
Chapter 3,Section 4.4, http://www.ipcc-
nggip.iges.or.jp/public/2006gl/pdf/3_Volume3/V3_4_Ch4_Metal_Industry.pdf.

10
International Aluminium Institute | www.world-aluminium.org
2013 Survey Results
Anode effect data was collected from 218 reporting entities (smelters & potlines) representing
20 million tonnes of primary aluminium production Results are summarised in Error!
Reference source not found. below.
Facilities that have made PFC measurements by which Tier 3 calculation of PFC emissions is
possible account for 46% of the total reported CF4 emissions from survey participants. It
should be noted that Tier 3 calculations typically carry an uncertainty of +/- 15%, with well
controlled systems down to +/- 12%, while uncertainty in Tier 2 calculations can be as high as
+/- 50%."
The range of anode effect and PFC emissions performance within technologies is explored
further in the “Benchmark Data” section below. Changes in median emission performance (in
t CO2e/t Al) within technologies between 2006 and 2013 are shown in Figure 5.
Figure 5 – Median PFC emission rates (as CO2e) of reporting entities, per technology, 2006-2013
Reported average (production weighted mean) PFC emissions (as CO2e) per tonne of
production have been reduced by 36% between 2006 and 2012 (CF4 by 41%, C2F6 by 43%).
0 1 2 3 4 5 6 7 8 9 10
2006
2007
2008
2009
2010
2011
2012
2013
t CO2e/t Al
IPCC 4th GWP
SWPB VSS HSS
CWPB PFPB
0 1 2 3 4 5 6 7 8 9 10
2006
2007
2008
2009
2010
2011
2012
2013
t CO2e/t Al
IPCC 2nd GWP
SWPB VSS HSS
CWPB PFPB

11
International Aluminium Institute | www.world-aluminium.org
Technology IPCC
Tier
No. of
reporting
entities
Reported
production
(kt Al)
Total CF4
emissions
(Gg CF4)
Total C2F6
emissions
(Gg C2F6)
Median
CF4
intensity
(kg CF4/
t Al)
Median
C2F6
intensity
(kg C2F6/
t Al)
Mean
C2F6: CF4
weight
ratio
IPCC 4th GWP IPCC 2nd GWP
Total PFC
emissions2
(kt CO2e)
Median
PFC
intensity
(t CO2e/
t Al)
Mean
PFC
intensity
(t CO2e/
t Al)
Total PFC
emissions
(kt CO2e)
Median
PFC
intensity
(t CO2e/
t Al)
Mean
PFC
intensityr
(t CO2e/
t Al)
CWPB 2 1 324 0.005 0.001
0.022 0.003 0.15 123 0.20 0.20 105 0.17 0.17 3 1 288 0.008 0.001
PFPB
2
Slope
64 5,753 0.151 0.018
0.023 0.003 0.12 4,040 0.20 0.27 3471 0.17 0.23 3
Slope
27 5,413 0.134 0.017
2 OV 18 1,462 0.091 0.011
3 OV 6 1,761 0.082 0.007
SWPB 2 6 111 0.007 0.002
0.264 0.089 0.25 1,875 2.97 3.65 1,581 2.48 3.08 3 2 403 0.107 0.032
VSS 2 67 2,620 0.390 0.021
0.146 0.008 0.06 4,116 1.17 1.22 3,577 1.02 1.06 3 9 759 0.121 0.007
HSS 2 13 162 0.022 0.002
0.150 0.013 0.10 918 1.26 2.46 791 1.09 2.12 3 4 211 0.084 0.009
ALL - 218 20,135 1.269 0.140 - - 0.11 11,072 - 0.55 9,525 0.47
Table 4 – Perfluorocarbon emission results from facility data reporting to the 2013 Anode Effect Survey Note: any inconsistencies due to rounding
2 Carbon dioxide equivalent (CO2e) emissions for survey participants are calculated by multiplying the total tonnes of each PFC component gas by the Global Warming
Potential (GWP) values reported in the IPCC 4th Assessment Report (i.e. 7,390 for CF4 and 12,200 for C2F6). Calculations using GWP contained in the IPCC 2nd
Assessment Report (i.e. 6,500 for CF4 and 9,200 for C2F6) are also listed here for reference.

12
International Aluminium Institute | www.world-aluminium.org
Reporting
production
(kt Al)
Reporting
rate by
production
CF4
emission
factor
(kg CF4/t Al)
C2F6
emission
factor
(kg C2F6/t
Al)
Total PFC
emission
factor
(t CO2e/t
Al)
Total PFC
emission
factor
(t CO2e/t
Al)
IPCC 4th GWP IPCC 2nd GWP
2013 20,135 40% 0.063 0.007 0.55 0.47
2012 21,006 44% 0.069 0.008 0.61 0.52
2011 22,413 51 % 0.079 0.009 0.68 0.60
2010 21,774 53 % 0.071 0.009 0.63 0.54
2009 22,184 60 % 0.069 0.008 0.61 0.52
2008 24,741 63 % 0.089 0.010 0.78 0.67
2007 23,903 63 % 0.106 0.013 0.95 0.81
2006 23,177 68 % 0.116 0.014 1.03 0.87
Table 5 – Production weighted mean PFC emissions per unit production of reporting entities, 2006-2013

13
International Aluminium Institute | www.world-aluminium.org
Global Emissions Estimations
Methodology
A more realistic picture of the global aluminium industry’s PFC emissions inventory should
include some estimate of the non-reporting industry year on year. In fact, the IAI voluntary
objective is an objective for the industry as a whole, not just IAI membership or reporting
companies and so is based on such a global estimate.
The IAI uses median PFC emissions performance per technology (as shown in Error!
Reference source not found. above) applied to non-reporting production by technology in
order to calculate the global PFC emissions inventory from aluminium production.
Non-reporting aluminium production tonnage data is taken from three sources. The majority
(China 2013 primary aluminium production of 24,936,070 metric tonnes) is reported by the
China Nonferrous Metals Industry Association (CNIA). Around 3.5 million tonnes of production
(n=13) is from other IAI surveys – primarily IAI Form 100 “Primary Aluminium Production”
(http://www.world-aluminium.org/media/filer_public/2013/01/15/iai_form_100.pdf). Finally,
just under 1.2 million metric tonnes of production is data kindly provided by the CRU Group
(www.crugroup.com), for facilities where there is no direct IAI data collection (n=7).
Accounting for China
Recent (2008-2013) PFC emissions measurements at 27 PFPB facilities in China have yielded
a median emission factor of 0.80 tonnes CO2e per tonne of aluminium produced (CF4 median
0.100 kg/t Al; C2F6:CF4 weight fraction 0.046), compared with a PFPB survey reporter median
performance of 0.20 tonnes CO2e per tonne of aluminium (0.023 kg CF4/t Al; C2F6:CF4
weight ratio = 0.12).
This China-specific value (0.80 t CO2e/t Al) is applied to the 2013 Chinese non-reporting
PFPB cohort, in place of the IAI PFPB survey median, and has also been applied to historical
Chinese non-reporting production, to derive a time series that more accurately reflects
Chinese smelter performance and global emissions than one based on rest-of-world
averages, albeit one that remains static over time.
14
International Aluminium Institute | www.world-aluminium.org
2013 Global Aluminium Industry PFC Emissions
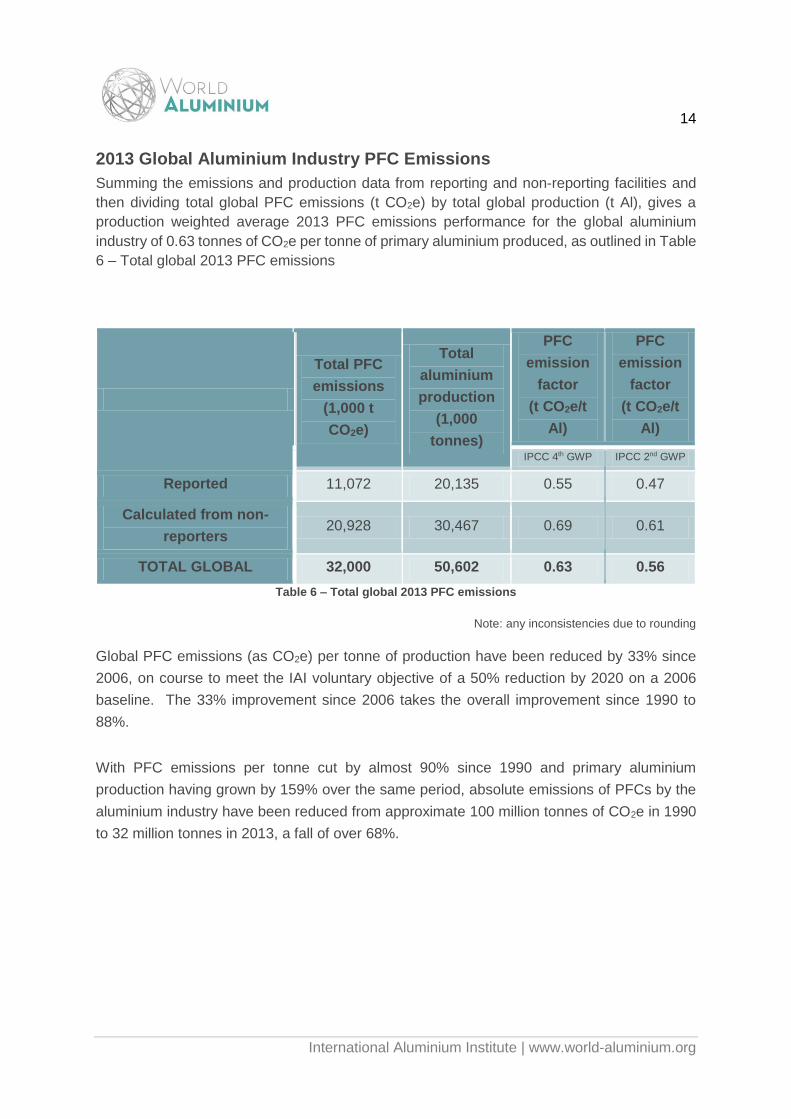
Summing the emissions and production data from reporting and non-reporting facilities and
then dividing total global PFC emissions (t CO2e) by total global production (t Al), gives a
production weighted average 2013 PFC emissions performance for the global aluminium
industry of 0.63 tonnes of CO2e per tonne of primary aluminium produced, as outlined in Table
6 – Total global 2013 PFC emissions
Total PFC
emissions
(1,000 t
CO2e)
Total
aluminium
production
(1,000
tonnes)
PFC
emission
factor
(t CO2e/t
Al)
PFC
emission
factor
(t CO2e/t
Al)
IPCC 4th GWP IPCC 2nd GWP
Reported 11,072 20,135 0.55 0.47
Calculated from non-
reporters 20,928 30,467 0.69 0.61
TOTAL GLOBAL 32,000 50,602 0.63 0.56
Table 6 – Total global 2013 PFC emissions
Note: any inconsistencies due to rounding
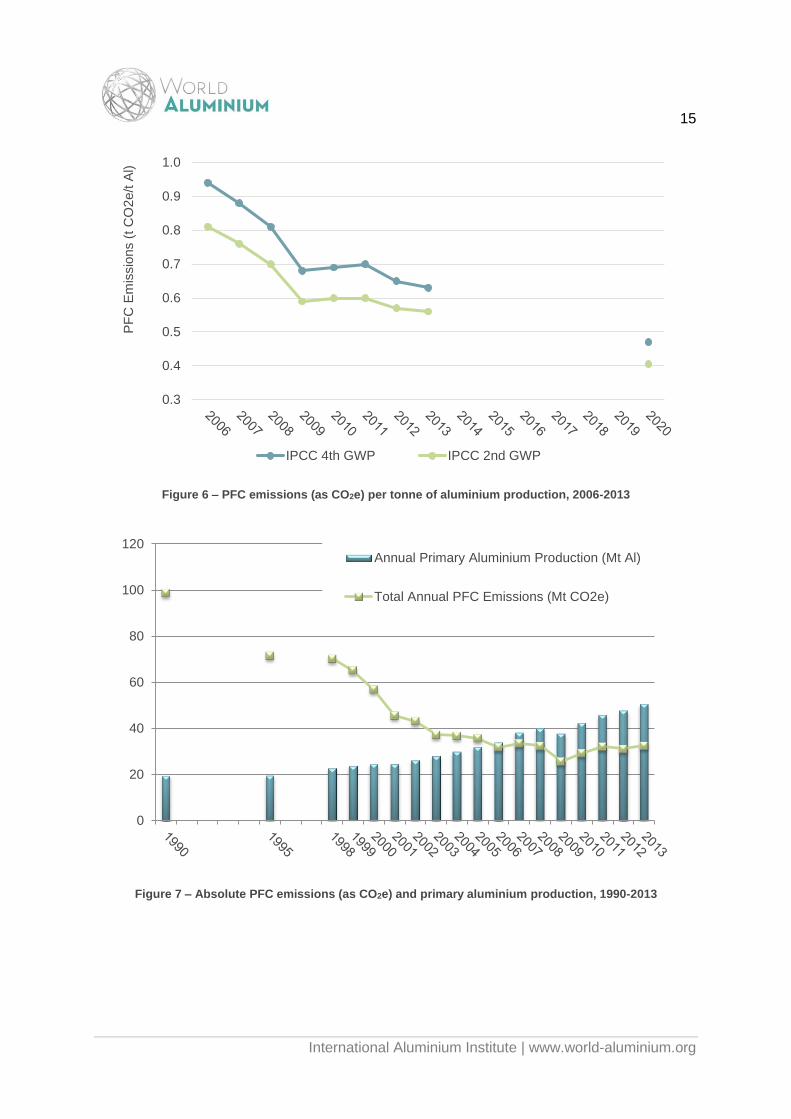
Global PFC emissions (as CO2e) per tonne of production have been reduced by 33% since
2006, on course to meet the IAI voluntary objective of a 50% reduction by 2020 on a 2006
baseline. The 33% improvement since 2006 takes the overall improvement since 1990 to
88%.
With PFC emissions per tonne cut by almost 90% since 1990 and primary aluminium
production having grown by 159% over the same period, absolute emissions of PFCs by the
aluminium industry have been reduced from approximate 100 million tonnes of CO2e in 1990
to 32 million tonnes in 2013, a fall of over 68%.
15
International Aluminium Institute | www.world-aluminium.org
Figure 6 – PFC emissions (as CO2e) per tonne of aluminium production, 2006-2013
Figure 7 – Absolute PFC emissions (as CO2e) and primary aluminium production, 1990-2013
0.3
0.4
0.5
0.6
0.7
0.8
0.9
1.0
PF
C E
mis
sio
ns (
t C
O2
e/t A
l)
IPCC 4th GWP IPCC 2nd GWP
0
20
40
60
80
100
120Annual Primary Aluminium Production (Mt Al)
Total Annual PFC Emissions (Mt CO2e)
16
International Aluminium Institute | www.world-aluminium.org
Uncertainties
Understanding sources and magnitude of uncertainty in the calculation of global industry PFC
emissions is important, not only in terms of the current emissions inventory and its relationship
to top-down measurements of PFCs in the atmosphere, but also with respect to quantifying
the industry’s performance over time.
Given that the 2013 data presented above indicates a significant reduction in total PFC
emissions (as CO2e) since 1990, it is necessary to consider the uncertainties inherent in the
1990 baseline number and the 2013 performance number and to quantify the probability that
the reduction has been made.
Potential significant sources of uncertainty include:
the application of average industry IPCC Tier 2 calculation factors,
use of Tier 2 factors for calculating PFC emissions for survey participants where
suitable facility specific measurements are not available, and,
estimates of PFC emissions for producers that do not participate in the anode effect
survey.
Uncertainty arises from the use of IPCC Tier 2 average industry factors due to the uncertainty
in the mean slope and overvoltage coefficients. Additional PFC measurements will reduce
the uncertainty of the mean coefficient values. However, for all technology groups there is
considerable variance in the individual values of slope and overvoltage coefficients, from
which the means are calculated. For this reason, calculations of PFC emissions with Tier 2
coefficients will be more uncertain than calculations made with Tier 3 coefficients, calculated
from PFC measurements made using good measurement practices. Calculations of PFC
emissions for non-reporters is even more uncertain where, due to lack of availability of anode
effect performance, the median emission factors of reporters per technology is applied to non-
reporters.

17
International Aluminium Institute | www.world-aluminium.org
Benchmark Data
The IAI Anode Effect Survey provides respondents with valuable benchmark information,
allowing producers to judge their performance relative to others operating with similar
technology. The benchmark data are presented in this section in the form of cumulative
probability graphs and calculated PFC emissions benchmark data as both cumulative
probability and cumulative production graphs.
The cumulative probability graphs show, on the horizontal axis, the benchmark parameter:
PFC emissions per tonne of aluminium;
Anode effect frequency (AEF);
Anode effect duration (AED);
Anode effect minutes per cell day (AEM) and
Anode effect overvoltage (AEO).
The vertical axes show the cumulative fraction of reporting facilities that perform at or below
the level chosen on the vertical axis. For facilities reporting data from multiple potlines, a data
point is shown for each potline.
To illustrate how the graph in Figure 8 is interpreted consider, for example, the 0.5 point on
the vertical axis, at which the HSS data point is 1.26 t CO2e/t Al. The interpretation is that
50% of all potlines/facilities reporting HSS anode effect data operate at or below 1.26 t CO2e/t
Al. At 1.0 on the vertical axis the HSS point is 4.64 t CO2e/t Al. The interpretation is that all
HSS facilities reported anode effect data that reflected PFC emissions performance at or
below 4.64 t CO2e/t Al or, in other words, the maximum value calculated for HSS operators in
2013 was 4.64 t CO2e/t Al.
PFC Emissions per Tonne of Aluminium
The lowest PFC emissions per tonne of aluminium produced are produced by PFPB facilities,
although with a wide range of performance. The VSS and HSS facilities show a similar
distribution, but with higher average emissions factor. The highest PFC emissions per tonne
of aluminium produced and the widest range in performance result from SWPB cells.

18
International Aluminium Institute | www.world-aluminium.org
Figure 8 – PFC emissions (as CO2e per tonne Al) performance of reporters, benchmarked as cumulative
fraction within technologies, 2013
Figure 9 –PFC emissions performance of reporters (t CO2e/t Al), benchmarked as cumulative production
within technologies, 2013
0.0
0.1
0.2
0.3
0.4
0.5
0.6
0.7
0.8
0.9
1.0
0.0 1.0 2.0 3.0 4.0 5.0 6.0
Cu
mu
lati
ve F
racti
on
of
Rep
ort
ing
En
titi
es
PFC Emission Factor (t CO2e/t Al)
CWPB & PFPB SWPB HSS VSS
Note: SWPB 86th and 100th percentile
outliers are at 8.1 tCO2e/t Aland 12.6 t CO2e/t Al respectively.
0
2
4
6
8
10
12
14
0 5 10 15 20
PFC
Em
issi
on
s (t
CO
2-e
q/t
on
ne
Al)
Cumulative Aluminium Production of Reporting Facilities (Million tonnes)
PFPB&CWPB
SWPB
HSS
VSS
19
International Aluminium Institute | www.world-aluminium.org
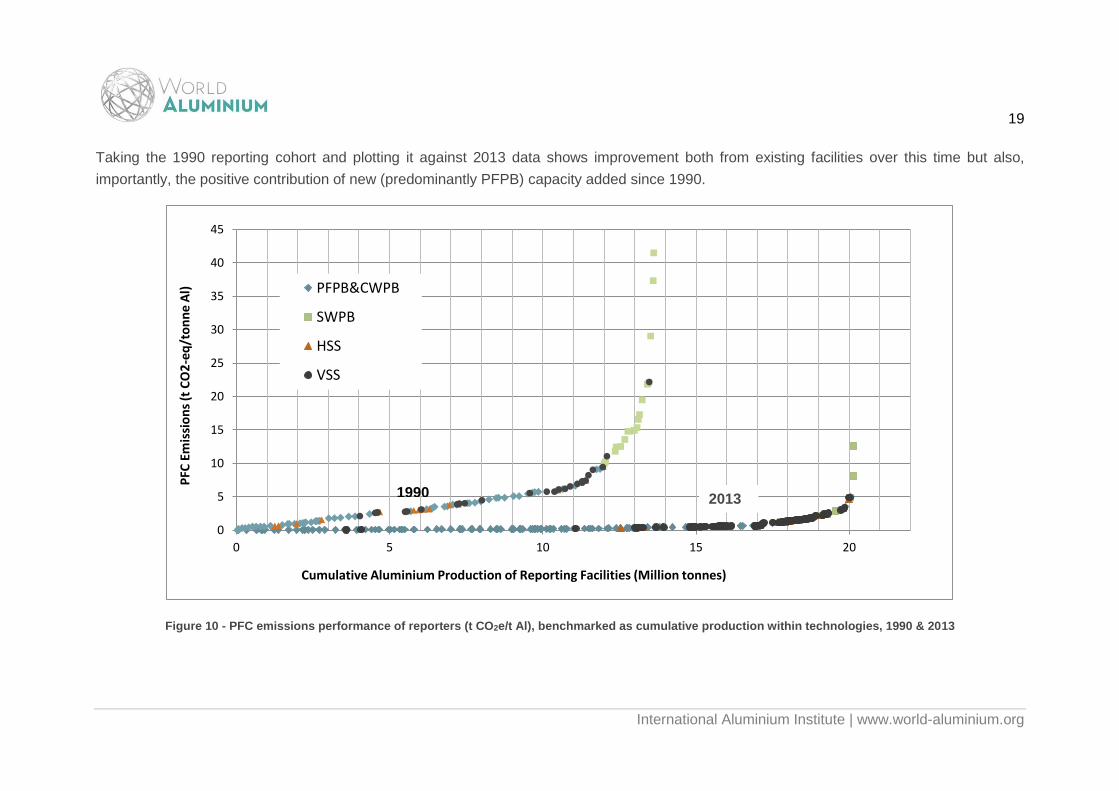
Taking the 1990 reporting cohort and plotting it against 2013 data shows improvement both from existing facilities over this time but also,
importantly, the positive contribution of new (predominantly PFPB) capacity added since 1990.
Figure 10 - PFC emissions performance of reporters (t CO2e/t Al), benchmarked as cumulative production within technologies, 1990 & 2013
0
5
10
15
20
25
30
35
40
45
0 5 10 15 20
PFC
Em
issi
on
s (t
CO
2-e
q/t
on
ne
Al)
Cumulative Aluminium Production of Reporting Facilities (Million tonnes)
PFPB&CWPB
SWPB
HSS
VSS
20131990
20
International Aluminium Institute | www.world-aluminium.org
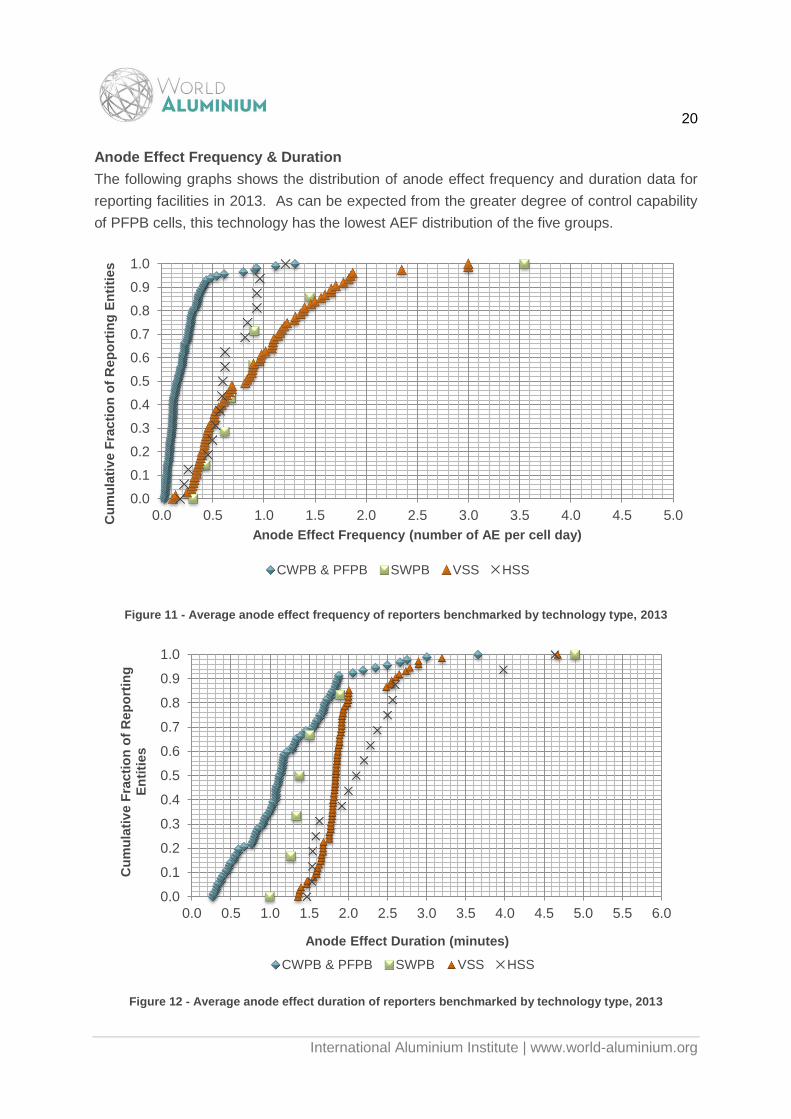
Anode Effect Frequency & Duration
The following graphs shows the distribution of anode effect frequency and duration data for
reporting facilities in 2013. As can be expected from the greater degree of control capability
of PFPB cells, this technology has the lowest AEF distribution of the five groups.
Figure 11 - Average anode effect frequency of reporters benchmarked by technology type, 2013
Figure 12 - Average anode effect duration of reporters benchmarked by technology type, 2013
0.0
0.1
0.2
0.3
0.4
0.5
0.6
0.7
0.8
0.9
1.0
0.0 0.5 1.0 1.5 2.0 2.5 3.0 3.5 4.0 4.5 5.0Cu
mu
lati
ve F
racti
on
of
Rep
ort
ing
En
titi
es
Anode Effect Frequency (number of AE per cell day)
CWPB & PFPB SWPB VSS HSS
0.0
0.1
0.2
0.3
0.4
0.5
0.6
0.7
0.8
0.9
1.0
0.0 0.5 1.0 1.5 2.0 2.5 3.0 3.5 4.0 4.5 5.0 5.5 6.0
Cu
mu
lati
ve F
racti
on
of
Rep
ort
ing
E
nti
ties
Anode Effect Duration (minutes)
CWPB & PFPB SWPB VSS HSS

21
International Aluminium Institute | www.world-aluminium.org
Anode Effect Minutes per Cell Day
Anode Effect Minutes per Cell Day (AEM) are the product of anode effect frequency and
duration and, for facilities employing the Slope Method. AEM relate directly to PFC emissions
per tonne of aluminium produced through a slope factor that is either technology specific (IPCC
Tier 2 methodology) or facility specific (Tier 3 methodology).
𝐸𝐹𝐶𝐹4= 𝑆𝐶𝐹4
× 𝐴𝐸𝑀
Both PFPB and CWPB technologies have the same Tier 2 value for slope: 0.143 kg CF4/t Al
per AEM. However, the IPCC Tier 2 slope parameter for SWPB, VSS and HSS technologies
are considerably different. The slope value is highest for the SWPB technology group, 0.272
kg CF4/t Al per AEM. The comparable slope values for VSS and HSS are 0.092 and 0.099,
respectively.
Figure 13 - Average anode effect minutes per cell day of reporters benchmarked by technology type, 2013
Anode Effect Overvoltage
Figure 14 shows the benchmarking graph for anode effect overvoltage for PFPB cells operating
with Rio Tinto Alcan AP technologies and which calculate PFC emissions from overvoltage
process data. For these operators, the AEO parameter relates directly to anode effect related
PFC emissions per tonne of aluminium produced.
0.0
0.1
0.2
0.3
0.4
0.5
0.6
0.7
0.8
0.9
1.0
0.0 0.5 1.0 1.5 2.0 2.5 3.0 3.5 4.0 4.5 5.0 5.5 6.0 6.5 7.0 7.5 8.0 8.5 9.0
Cu
mu
lati
ve
Fra
cti
on
of
Re
po
rtin
g E
nti
tie
s
Anode Effect Minutes per Cell Day (minutes)
CWPB & PFPB SWPB HSS VSS

22
International Aluminium Institute | www.world-aluminium.org
Figure 14 - Average anode effect overvoltage of reporters benchmarked by technology type, 2013
Positive overvoltage reporting now predominates over algebraic overvoltage reporting. The
positive overvoltage should give a better correlation with PFC emissions per tonne of
aluminium than algebraic overvoltage since algebraic overvoltage recording can result in
subtractions of voltage during the anode effect treatment period that do not relate to PFC
emissions.
0.0
0.1
0.2
0.3
0.4
0.5
0.6
0.7
0.8
0.9
1.0
0 2 4 6 8 10 12 14
Cu
mu
lati
ve
Fra
cti
on
of
Re
po
rtin
g E
nti
tie
s
Anode Effect Overvoltage (mV)
Positive
Algebraic

23
International Aluminium Institute | www.world-aluminium.org
Appendix A – Facility Emissions Calculation Methodologies
Slope Method
The basic equations for calculation of PFC emission rates from facilities reporting anode effect
frequency and duration are:
𝐸𝐶𝐹4= 𝑆𝐶𝐹4
× (𝐴𝐸𝐹 × 𝐴𝐸𝐷) × 𝑀𝑃
and
𝐸𝐶2𝐹6= 𝐸𝐶𝐹4
× 𝐹𝐶2𝐹6/𝐶𝐹4
where
𝐸𝐶𝐹4= kilograms of 𝐶𝐹4emitted
𝐸𝐶2𝐹6= kilograms of 𝐶2𝐹6emitted
𝑆𝐶𝐹4= slope coefficient for 𝐶𝐹4
𝐹𝐶2𝐹6/𝐶𝐹4= weight fraction of 𝐶2𝐹6 to 𝐶𝐹4
While AEF and AED are reported data, the slope coefficient for CF4 can be either “facility
specific” (IPCC Tier 3 methodology), or “technology specific” (IPCC Tier 2 methodology). The
first of these options, Tier 3, is the more certain method for calculating emissions and involves
use of a slope coefficient (and weight fraction) derived from direct measurement of PFC
emissions at the facility. The Tier 2 method involves the use of slope coefficients that are an
average of measurement data available in 2005 taken from facilities around the world within
technology classes.

24
International Aluminium Institute | www.world-aluminium.org
Table 7 - Slope and overvoltage coefficients by technology, including uncertainty (Source: IPCC, 2006)
Participants in the Anode Effect Survey are asked to report if a facility-specific direct
measurement of PFC emissions had been made and if a Tier 3 slope coefficient and weight
fraction are available for calculating PFC emissions from the smelter. The remainder of the
PFC emissions data are calculated using IPCC Tier 2 methodology with industry average
coefficients.
Overvoltage Method
For smelters that report overvoltage data, the following equations are employed:
𝐸𝐶𝐹4= 𝑂𝑉𝐶 ×
𝐴𝐸𝑂
𝐶𝐸100⁄
× 𝑀𝑃
and
𝐸𝐶2𝐹6= 𝐸𝐶𝐹4
× 𝐹𝐶2𝐹6/𝐶𝐹4
where
𝐸𝐶𝐹4= kilograms of 𝐶𝐹4𝑒𝑚𝑖𝑡𝑡𝑒𝑑
𝐸𝐶2𝐹6= kilograms of 𝐶2𝐹6𝑒𝑚𝑖𝑡𝑡𝑒𝑑
𝑂𝑉𝐶 = overvoltage coefficient for 𝐶𝐹4
𝐶𝐸 = current efficiency, expressed as %
𝐹𝐶2𝐹6/𝐶𝐹4= weight fraction of 𝐶2𝐹6 to 𝐶𝐹4

25
International Aluminium Institute | www.world-aluminium.org
Again, a Tier 3 methodology applies a facility specific overvoltage coefficient and weight
fraction, derived from on site PFC measurements and anode effect data and reported as part
of the Survey return. Tier 2 calculations apply technology specific, average coefficients, which
are outlined in the 2006 IPCC Guidelines for National Greenhouse Gas Inventories.
Global Warming Potentials
Carbon dioxide equivalent (CO2e) emissions for survey participants are calculated by
multiplying the total tonnes of each PFC component gas by the Global Warming Potential
(GWP) values reported in the IPCC Fourth Assessment ReportF
3:
𝐸𝐶𝑂2𝑒 = (𝐸𝐶𝐹4× 7390) + (𝐸𝐶2𝐹6
× 12200)
For benchmarking purposes (that is to say, comparing emissions performance between
facilities of the same technology but with different levels of production), total (or “absolute”)
CO2e emissions are divided by relevant aluminium production, to give an emission factor in
tonnes of CO2e per tonne of aluminium produced:
𝐸𝐹𝐶𝑂2𝑒 =𝐸𝐶𝑂2𝑒
𝑀𝑃
3 The latest data published by IPCC in the Fourth Assessment Report reports the CF4 GWP as 7,390
and the C2F6 GWP as 12,200.
Published by:
INTERNATIONAL ALUMINIUM INSTITUTE
10 Charles II Street
London
SW1Y 4AA
United Kingdom
Tel: + 44 (0) 20 7930 0528
Fax: + 44 (0) 20 7321 0183
Email: [email protected]
© International Aluminium Institute
A company limited by guarantee. Registered in London no. 1052007