results of the 2016 nrmp program director survey ...€¦ · introduction nrmp program director...
TRANSCRIPT

Results of the 2016 NRMP Program Director SurveySpecialties Matching Service
www.nrmp.org
October 2016

Requests for permission to use these data as well as questions about the content of this publication or the National Resident Matching Program data and reports may be directed to
Mei Liang, Director of Research, NRMP, at [email protected].
Questions about the NRMP should be directed to Mona M. Signer, President and CEO, NRMP, at [email protected].
Suggested CitationNational Resident Matching Program, Data Release and Research Committee: Results of the
2016 NRMP Program Director Survey, Specialties Matching Service. National Resident Matching Program, Washington, DC. 2016.
Copyright © 2016 National Resident Matching Program. All rights reserved. Permission to use, copy and/or distribute any documentation and/or related images from this publication shall be
expressly obtained from the NRMP.

Introduction .................................................................................................................................................... 1 Response rates ................................................................................................................................................. 2 All Specialties................................................................................................................................................. 3 Charts for Individual Specialties Abdominal Transplant Surgery ..................................................................................................................... 12 Adolescent Medicine ..................................................................................................................................... 21 Allergy and Immunology .............................................................................................................................. 30 Cardiovascular Disease ................................................................................................................................. 39 Child and Adolescent Psychiatry ................................................................................................................. 48 Colon and Rectal Surgery ............................................................................................................................. 57 Developmental-Behavioral Pediatrics ........................................................................................................... 66 Endocrinology, Diabetes, and Metabolism ................................................................................................... 75 Female pelvic medicine and reconstructive surgery .................................................................................... 84 Gastroenterology ........................................................................................................................................... 93 Geriatric Medicine ..................................................................................................................................... 102 Gynecologic Oncology ............................................................................................................................... 111 Hand Surgery ............................................................................................................................................. 120 Hematology and Oncology ......................................................................................................................... 129 Hospice and Palliative Medicine ................................................................................................................. 138 Infectious Disease ....................................................................................................................................... 147 Interventional Radiology ............................................................................................................................ 156 Maternal-Fetal Medicine ............................................................................................................................. 165 Neonatal-Perinatal Medicine ...................................................................................................................... 174 Nephrology.................................................................................................................................................. 183 Neuroradiology .......................................................................................................................................... 192 Obstetric Anesthesiology ........................................................................................................................... 201 Pain Medicine ............................................................................................................................................. 210 Pediatric Anesthesiology ............................................................................................................................ 219 Pediatric Cardiology .................................................................................................................................. 228 Pediatric Critical Care Medicine ................................................................................................................ 237 Pediatric Emergency Medicine .................................................................................................................. 246 Pediatric Endocrinology .............................................................................................................................. 255 Pediatric Gastroenterology ......................................................................................................................... 264 Pediatric Hematology/Oncology ................................................................................................................ 273 Pediatric Hospital Medicine ....................................................................................................................... 282 Pediatric Infectious Diseases ...................................................................................................................... 291 Pediatric Nephrology ................................................................................................................................. 300 Pediatric Pulmonology ............................................................................................................................... 309 Pediatric Rheumatology ............................................................................................................................. 318 Pediatric Surgery ........................................................................................................................................ 327 Psychosomatic Medicine ............................................................................................................................. 336 Pulmonary Disease and Critical Care Medicine ......................................................................................... 345 Reproductive Endocrinology ...................................................................................................................... 354 Rheumatology ............................................................................................................................................. 363 Sleep Medicine ............................................................................................................................................ 372 Sports Medicine ......................................................................................................................................... 381 Surgical Critical Care ................................................................................................................................. 390 Thoracic Surgery ......................................................................................................................................... 399 Vascular Neurology .................................................................................................................................... 408 Vascular Surgery ......................................................................................................................................... 417
Table of Contents

Introduction
1NRMP Program Director Survey, Specialties Matching Service, 2016
In May 2016, the National Resident Matching Program (NRMP) conducted its first survey of the directors of all programs participating in the Specialties Matching Service®. The primary purpose of the survey was to shed light on the factors that program directors use to (1) select applicants to interview and (2) rank applicants for their Fellowship Match. This survey is based largely on the Program Director Survey conducted for the Main Residency Match®.
The survey solicited information on: the factors used for both interview selection and for ranking applicants, the number of applications received, screened, and reviewed, as well as the number of interview invitations extended
and the number of applicants interviewed, whether the program typically interviews and ranks specific applicant groups, use of test scores in considering which applicants to interview and rank, dedicated time for research, and challenges faced by programs in recruting applicants to their specialty.
The survey was sent to 3,807 fellowship program directors and 1,474 responses were received for a 38.7 percent response rate. Response rates among specialties ranged from 0 percent (Oncology, 6 recipients and 0 responses) to 62.7 percent (Pediatric Hematology/Oncology 67 recipients and 42 responses). Specialties for which 10 or more fellowship program directors responded are included in this report. Response rates are listed in the table on the next page. Readers also should keep in mind that Fellowship Matches are conducted throughout the year and that some Match Days occur as long as one year prior to the start of training.
Results are presented for all subspecialties combined and by specialty. Specialty-specific results are included for selected items from the survey. Most graphs display responses to individual survey questions, and numbers of responses are presented. For graphs displaying data from multiple survey questions, the N's are shown. Graphs are suppressed for questions with fewer than three responses.
The NRMP hopes program directors and applicants find these data useful in discussions about and preparation for subspecialty training. _______________The NRMP's data reporting and research activities are guided by its Data Release and Research Committee. NRMP data and reports can be found at: www.nrmp.org/match-data/.

Specialty Surveys Sent Number Responding Response RateAbdominal Transplant Surgery 55 20 36.4%Adolescent Medicine 24 15 62.5%Allergy and Immunology 74 22 29.7%Cardiovascular Disease 185 57 30.8%Child and Adolescent Psychiatry 103 42 40.8%Colon and Rectal Surgery 53 18 34.0%Developmental‐Behavioral Pediatrics 34 16 47.1%Endocrinology, Diabetes, and Metabolism 122 51 41.8%Female Pelvic Medicine and Reconstructive Surgery 45 16 35.6%Gastroenterology 151 54 35.8%Geriatric Medicine 130 45 34.6%Gynecologic Oncology 41 10 24.4%Hand Surgery 79 34 43.0%Hematology and Oncology 130 48 36.9%Hospice and Pall iative Medicine 106 42 39.6%Infectious Disease 133 59 44.4%Interventional Radiology 81 30 37.0%Maternal‐Fetal Medicine 73 26 35.6%Neonatal‐Perinatal Medicine 91 48 52.7%Nephrology 135 45 33.3%Neuroradiology 73 25 34.2%Obstetric Anesthesiology 25 10 40.0%Pain Medicine 84 21 25.0%Pediatric Anesthesiology 51 24 47.1%Pediatric Cardiology 55 28 50.9%Pediatric Critical Care Medicine 63 35 55.6%Pediatric Emergency Medicine 71 32 45.1%Pediatric Endocrinology 55 23 41.8%Pediatric Gastroenterology 54 23 42.6%Pediatric Hematology/Oncology 67 42 62.7%Pediatric Hospital Medicine 29 12 41.4%Pediatric Infectious Diseases 51 29 56.9%Pediatric Nephrology 41 17 41.5%Pediatric Pulmonology 46 20 43.5%Pediatric Rheumatology 28 10 35.7%Pediatric Surgery 37 12 32.4%Psychosomatic Medicine 50 17 34.0%Pulmonary Disease and Critical Care Medicine 136 58 42.6%Reproductive Endocrinology 34 12 35.3%Rheumatology 108 52 48.1%Sleep Medicine 67 26 38.8%Sports Medicine 143 62 43.4%Surgical Critical Care 101 36 35.6%Thoracic Surgery 58 18 31.0%Vascular Neurology 72 26 36.1%Vascular Surgery 92 24 26.1%All other 271 82 30.3%
Total 3,807 1,474 38.7%
Response Rates
2NRMP Program Director Survey, Specialties Matching Service, 2016
All Specialties Combined

Table 1 All SpecialtiesGeneral Information
4,036
9,320
9,893
Number of programs in the Match
Number of positions in the Match
Number of applicants ranking specialty
38.7%Response rate
Appointment Years
Number of responses 1,474
Match Information*
* Source: NRMP Data Warehouse
2016 Survey
2016 2015 2014
3,674
8,503
9,538
3,552
8,243
9,297
4NRMP Program Director Survey, Specialties Matching Service, 2016
100% 50% 0%
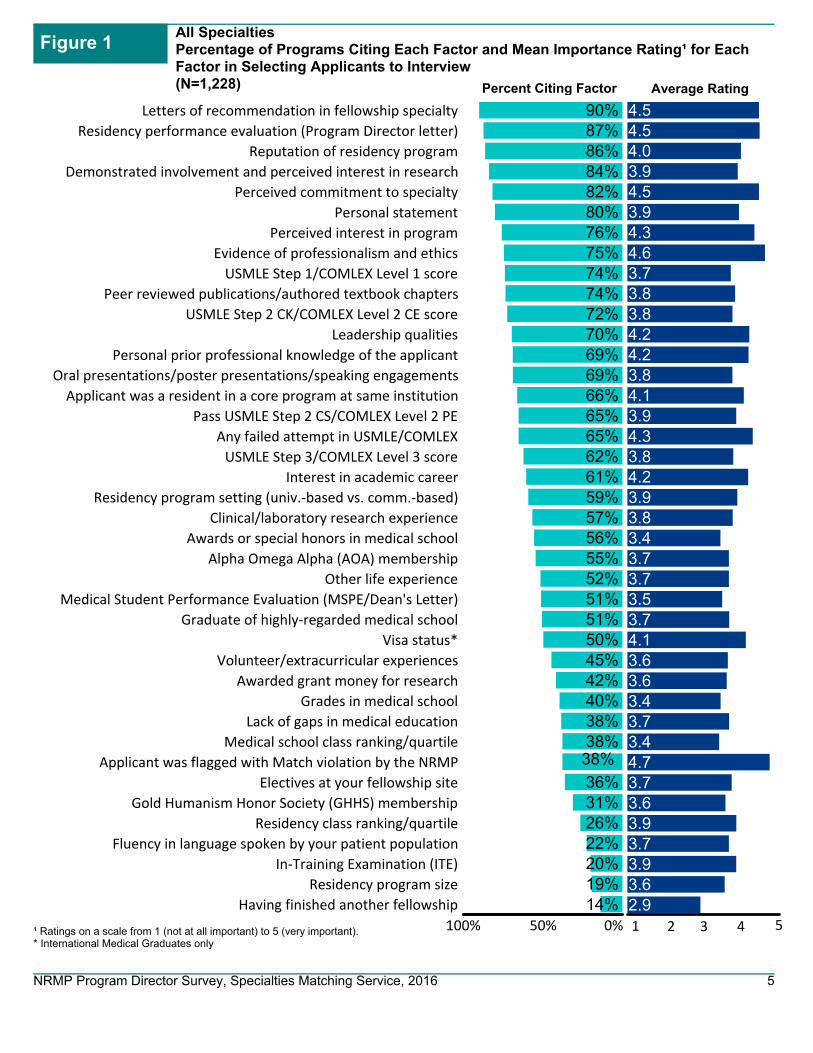
90%87%86%84%82%80%76%75%74%74%72%70%69%69%66%65%65%62%61%59%57%56%55%52%51%51%50%45%42%40%38%38%38%
36%31%26%22%20%19%14%
Letters of recommendation in fellowship specialty
Residency performance evaluation (Program Director letter)
Reputation of residency program
Demonstrated involvement and perceived interest in research
Perceived commitment to specialty
Personal statement
Perceived interest in program
Evidence of professionalism and ethics
USMLE Step 1/COMLEX Level 1 score
Peer reviewed publications/authored textbook chapters
USMLE Step 2 CK/COMLEX Level 2 CE score
Leadership qualities
Personal prior professional knowledge of the applicant
Oral presentations/poster presentations/speaking engagements
Applicant was a resident in a core program at same institution
Pass USMLE Step 2 CS/COMLEX Level 2 PE
Any failed attempt in USMLE/COMLEX
USMLE Step 3/COMLEX Level 3 score
Interest in academic career
Residency program setting (univ.‐based vs. comm.‐based)
Clinical/laboratory research experience
Awards or special honors in medical school
Alpha Omega Alpha (AOA) membership
Other life experience
Medical Student Performance Evaluation (MSPE/Dean's Letter)
Graduate of highly‐regarded medical school
Visa status*
Volunteer/extracurricular experiences
Awarded grant money for research
Grades in medical school
Lack of gaps in medical education
Medical school class ranking/quartile
Applicant was flagged with Match violation by the NRMP
Electives at your fellowship site
Gold Humanism Honor Society (GHHS) membership
Residency class ranking/quartile
Fluency in language spoken by your patient population
In‐Training Examination (ITE)
Residency program size
Having finished another fellowship
1 2 3 4 5
4.54.54.03.94.53.94.34.63.73.83.84.24.23.84.13.94.33.84.23.93.83.43.73.73.53.74.13.63.63.43.73.44.73.73.63.93.73.93.62.9
All SpecialtiesPercentage of Programs Citing Each Factor and Mean Importance Rating¹ for Each Factor in Selecting Applicants to Interview(N=1,228) Percent Citing Factor Average Rating
¹ Ratings on a scale from 1 (not at all important) to 5 (very important).* International Medical Graduates only
5
Figure 1
NRMP Program Director Survey, Specialties Matching Service, 2016

100% 50% 0%
91%91%79%77%73%73%71%71%68%65%64%59%57%56%52%51%50%49%49%44%44%44%43%42%40%33%32%32%32%30%30%29%28%28%28%27%22%20%20%19%17%16%14%13%12%
9%
Interactions with faculty during interview and visitInterpersonal skills
Letters of recommendation in fellowship specialtyInteractions with house staff during interview and visit
Perceived commitment to specialtyFeedback from current residents and fellows
Perceived interest in programDemonstrated involvement and perceived interest in research
Reputation of residency programResidency performance evaluation (Program Director letter)
Evidence of professionalism and ethicsPersonal statement
Personal prior professional knowledge of the applicantLeadership qualities
Peer reviewed publications/authored textbook chaptersInterest in academic career
Applicant was a resident in a core program at same institutionUSMLE Step 1/COMLEX Level 1 score
USMLE Step 2 CK/COMLEX Level 2 CE scoreAny failed attempt in USMLE/COMLEX
Passing USMLE Step 2 CS/COMLEX Level 2 PEClinical/laboratory research experience
USMLE Step 3/COMLEX Level 3 scoreOral presentations/poster presentations/speaking engagements
Residency program setting (univ.‐based vs. comm.‐based)Alpha Omega Alpha (AOA) membership
Other life experienceMedical Student Performance Evaluation (MSPE/Dean's Letter)
Second interview/visitAwards or special honors in medical school
Visa status*Applicant was flagged with Match violation by the NRMP
Graduate of highly‐regarded medical schoolElectives at your fellowship site
Awarded grant money for researchVolunteer/extracurricular experiencesMedical school class ranking/quartile
Lack of gaps in medical educationGrades in medical school
Residency class ranking/quartileFluency in language spoken by your patient population
Gold Humanism Honor Society (GHHS) membershipResidency program size
In‐Training Examination (ITE)Second interview/visit
Having finished another fellowship
All SpecialtiesPercentage of Programs Citing Each Factor and Mean Importance Rating¹ for Each Factor in Ranking Applicants(N=1,164)
1 2 3 4 5
4.94.84.54.74.64.74.54.04.04.44.74.04.34.44.04.34.13.83.94.33.94.03.93.94.03.83.83.74.13.64.24.83.94.13.83.93.53.93.53.93.93.83.74.04.13.4
Average RatingPercent Citing Factor
6
¹ Ratings on a scale from 1 (not at all important) to 5 (very important).* International Medical Graduates only
Figure 2
NRMP Program Director Survey, Specialties Matching Service, 2016

0%
20%
40%
60%
80%
100%
Yes, pass only Yes, target score No, not required
69%
28%
4%
Scores required?
All SpecialtiesPrograms That Use USMLE Step 1 and Step 2 Clinical Knowledge (CK) Scores When Considering Which Applicants to Interview
Programs That Use USMLE Step 1 Score
Programs That Use USMLE Step 2 (CK) Score
0%
20%
40%
60%
80%
100%
Yes, pass only Yes, target score No, not required
67%
29%
4%
Scores required?
0%
20%
40%
60%
80%
100%
Never Seldom Often
17%
69%
15%
Would your program consider applicants who fail theexam on the first attempt?
0%
20%
40%
60%
80%
100%
Never Seldom often
23%
66%
12%
Would your program consider applicants who fail theexam on the first attempt?
N=1,200N=1,175
N=1,203 N=1,174
N=214N=247N=280
IQR* of USMLE Step 1 and Step 2 CK Scores Programs Consider When Granting Interviews
N=243
170
180
190
200
210
220
230
240
250
260
Scores Below Which Programs Generally Do Not Grant Interviews
170
180
190
200
210
220
230
240
250
260
Scores Above Which Programs Almost Always Grant Interviews
*The boxes in the boxplots represent the interquartile range (or IQR, which is the range between the 25th and 75th percentiles), and the line in the box is the median. The x-shaped symbol in the box represents the mean.
USMLE Step 2 CKUSMLE Step 1USMLE Step 2 CKUSMLE Step 1
7
Figure 3
NRMP Program Director Survey, Specialties Matching Service, 2016

0%
10%
20%
30%
40%
50%
60%
70%
80%
90%
100%
Yes, pass only Yes, target score No
56%
17%
27%
COMLEX-USA Level 3*
0%
10%
20%
30%
40%
50%
60%
70%
80%
90%
100%
Yes, pass only Yes, target score No
59%
18%23%
COMLEX-USA Level 1*
N=140%
10%
20%
30%
40%
50%
60%
70%
80%
90%
100%
Yes No
96%
4%
USMLE Step 2 Clinical Skills (CS)
0%
10%
20%
30%
40%
50%
60%
70%
80%
90%
100%
Yes, pass only Yes, target score No
59%
18%23%
COMLEX-USA Level 2-CE*
N=140%
10%
20%
30%
40%
50%
60%
70%
80%
90%
100%
Yes, pass only Yes, target score No
65%
23%
12%
USMLE Step 3
0%
10%
20%
30%
40%
50%
60%
70%
80%
90%
100%
Yes, pass only Yes, target score No
63%
14%
23%
COMLEX-USA Level 2-PE*
N=873 N=872
N=868 N=853
* Osteopathic applicants only
All SpecialtiesPrograms That Use USMLE Step 2 Clinical Skill (CS), Step 3, and COMLEX-USA Scores* When Considering Which Applicants to Interview
N=1,197 N=1,179
Percentage of Programs That Use USMLE Step 2 CS and Step 3 Scores
Percentage of Programs That Use COMLEX-USA Level 1 and Level 2-CE Scores
Percentage of Programs That Use COMLEX-USA Level 2-PE and Level 3 Scores
8
Figure 4
NRMP Program Director Survey, Specialties Matching Service, 2016
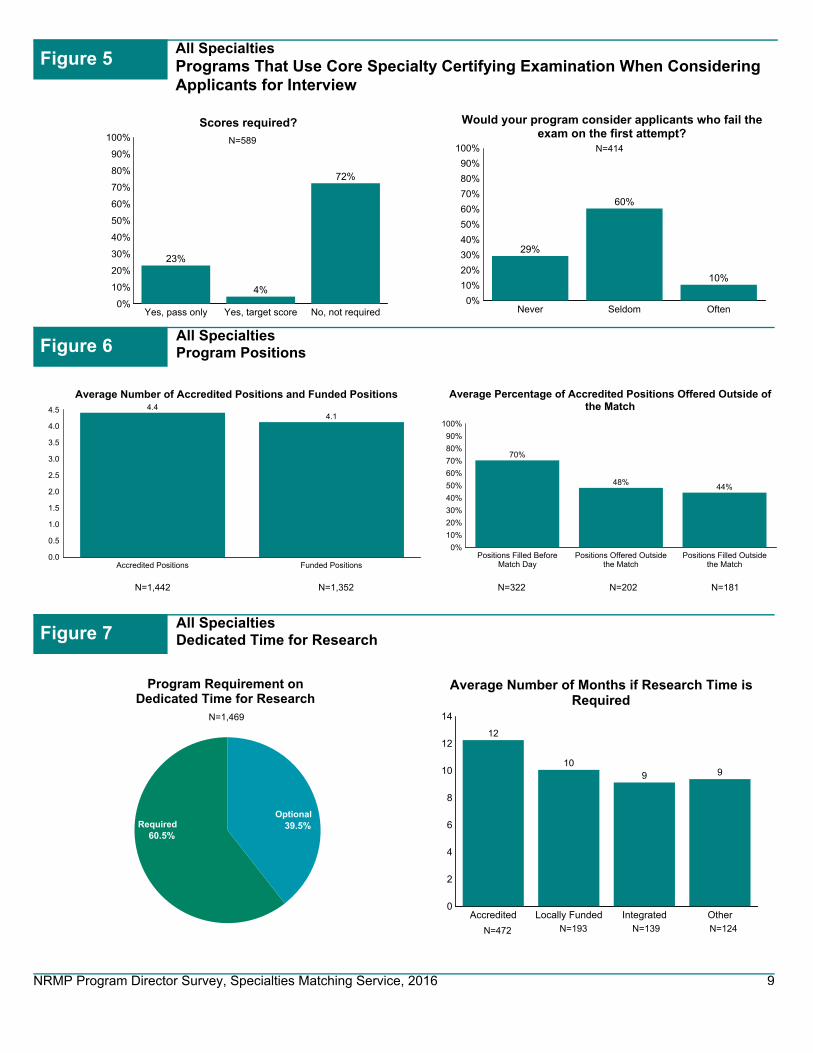
All SpecialtiesPrograms That Use Core Specialty Certifying Examination When Considering Applicants for Interview
9
0%
10%
20%
30%
40%
50%
60%
70%
80%
90%
100%
Never Seldom Often
29%
60%
10%
Would your program consider applicants who fail theexam on the first attempt?
0%
10%
20%
30%
40%
50%
60%
70%
80%
90%
100%
Yes, pass only Yes, target score No, not required
23%
4%
72%
Scores required?
N=414N=589
39.5%Optional
60.5%Required
Program Requirement onDedicated Time for Research
N=1,469
0
2
4
6
8
10
12
14
Accredited Locally Funded Integrated Other
12
109 9
Average Number of Months if Research Time isRequired
N=472 N=193 N=139 N=124
0.0
0.5
1.0
1.5
2.0
2.5
3.0
3.5
4.0
4.5
Accredited Positions Funded Positions
4.44.1
Average Number of Accredited Positions and Funded Positions
0%
10%
20%
30%
40%
50%
60%
70%
80%
90%
100%
Positions Filled BeforeMatch Day
Positions Offered Outsidethe Match
Positions Filled Outsidethe Match
70%
48%44%
Average Percentage of Accredited Positions Offered Outside ofthe Match
N=1,442 N=1,352 N=322 N=202 N=181
All SpecialtiesProgram Positions
Figure 6
All SpecialtiesDedicated Time for Research
Figure 7
Figure 5
NRMP Program Director Survey, Specialties Matching Service, 2016

All SpecialtiesInterviews and Applications
0
20
40
60
80
100
Number of applicationsreceived
Number of interviewinvitations sent
Number of applicantsinterviewed
98
2319
Average Number of Applications Received, Interview Invitations Sent,and Applicants Interviewed
0%
10%
20%
30%
40%
50%
60%
70%
80%
90%
100%
Rejected based on a standardizedscreening process
In-depth review
34%
68%
Average Percentage of Applicants Rejected and Reviewed
N=1,307 N=1,312N=1,338 N=1,338 N=1,339
10
0%
10%
20%
30%
40%
50%
60%
70%
80%
90%
100%
U.S. Graduate Osteopathic Physician Canadian Fifth Pathway U.S. IMG Non-U.S. IMG
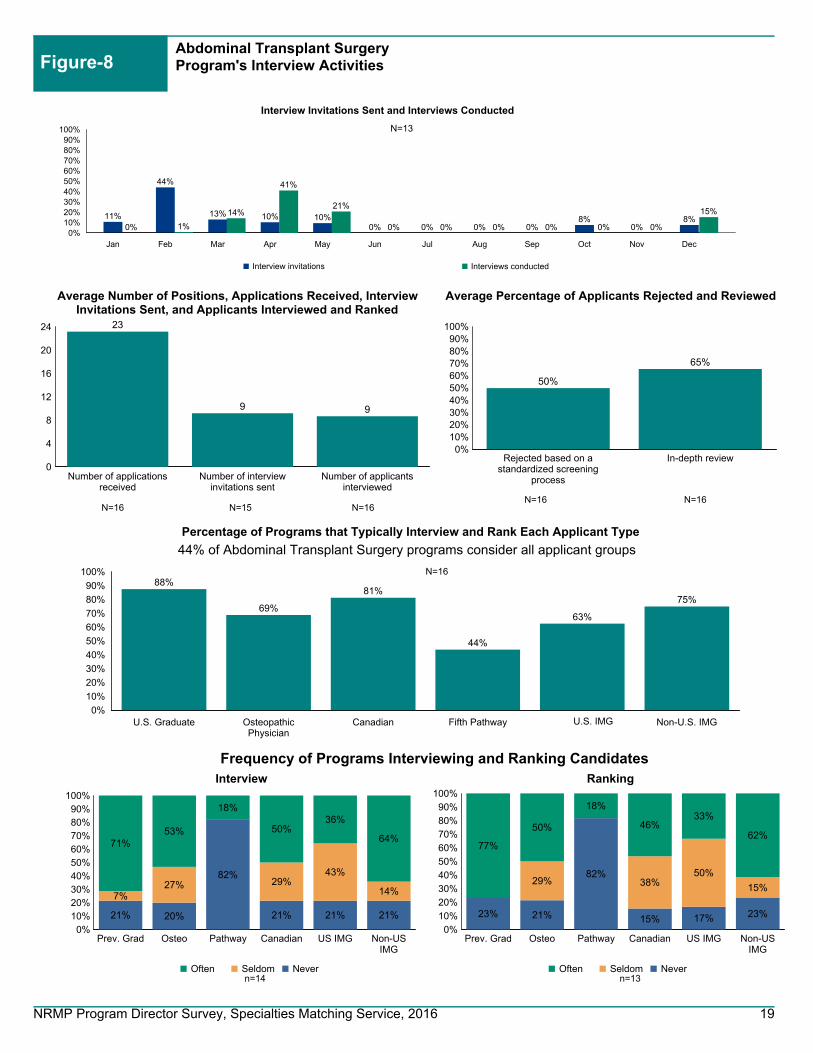
97%
87%
64%
32%
75%
59%
Percentage of Programs that Typically Interview and Rank Each Applicant Type
N=1,269
29% of all programs consider all applicant groups
0%
10%
20%
30%
40%
50%
60%
70%
80%
90%
100%
Prev. Grad Osteo Pathway Canadian US IMG Non-US IMG3% 4%
63%
23%
8%
22%6%
36%
32%
54%
49%
41%
91%
60%
5%
23%
43%37%
Often Seldom Never
Interview
0%
10%
20%
30%
40%
50%
60%
70%
80%
90%
100%
Prev. Grad Osteo Pathway Canadian US IMG Non-US IMG3% 6%
65%
25%
10%
25%
5%
36%
30%
52%
49%
41%
92%
58%
5%
23%
42%34%
Often Seldom Never
Ranking
Frequency of Programs Interviewing and Ranking Candidates
n=1,210n=1,241
0%10%20%30%40%50%60%70%80%90%
100%
Jan Feb Mar Apr May Jun Jul Aug Sep Oct Nov Dec
13%4% 2% 2% 3% 3%
12%
28%20%
8%2% 2%
Interview invitations sent
Interview Invitations Sent and Interviews Conducted
3% 6% 6% 3% 2% 1% 3%9%
25% 26%
8%2%
Interviews conducted
N=1,185
Figure 8
NRMP Program Director Survey, Specialties Matching Service, 2016

All SpecialtiesNumber of Years as Program Director
0% 20% 40% 60% 80% 100%
80%
20%
13%
1%
1%
We consider those applicants on an individual basis
We give those applicants serious consideration if they have shownimprovement
We do not usually consider those applicants
We favor those applicants
Other
All SpecialtiesPotential Challenges in Recruiting Applicants to Your Specialty
11
1 2 3 4 5
Not enough applicants in the specialty
Undesirable income potential as a practicing physician
Undesirable work/life balance as a practicing physician
Long or irregular work hours required by specialty
Fellowship Match scheduled at inconvenient time of year
3.0
2.7
2.7
2.4
2.0
Average rating on a scale of 5 (1=least challenging; 5=most challenging)n=1,117
22.3%Less than 3
24.0%3 to 5
26.5%6 to 10
12.0%11 to 15
15.2%More than 15
At Any Fellowship Program
26.7%Less than 3
25.9%3 to 5
26.8%6 to 10
10.2%11 to 15
10.4%More than 15
At Current Fellowship Program
n=1,122
n=1,266 n=1,216
Figure 9
Figure 10 All SpecialtiesApplicants Who Applied in the Specialty in the Past but Did Not Match
Figure 11
NRMP Program Director Survey, Specialties Matching Service, 2016

Abdominal Transplant Surgery
NRMP Program Director Survey, Specialties Matching Service, 2016 12

Abdominal Transplant SurgeryGeneral Information
Table 1
64
77
89
Number of programs in the Match
Number of positions in the Match
Number of applicants ranking specialty
36.4%Response rate
Appointment Years
Number of responses 20
Match Information*
* Source: NRMP Data Warehouse
2016 Survey
2016 2015 2014
56
70
81
62
73
98
NRMP Program Director Survey, Specialties Matching Service, 2016 13

Figure-1Abdominal Transplant SurgeryPercentage of Programs Citing Each Factor and Mean Importance Rating¹ for Each Factor in Selecting Applicants to Interview(N=14)
Average RatingPercent Citing Factor
¹ Ratings on a scale from 1 (not at all important) to 5 (very important).* International Medical Graduates only
1 2 3 4 5
4.84.44.13.74.54.04.24.33.03.93.54.04.74.04.43.53.53.04.14.03.83.23.04.03.03.54.53.03.64.02.8
4.04.03.04.04.04.03.03.3
100% 50% 0%
86%79%86%79%57%50%71%71%29%57%29%71%64%50%36%29%14%29%50%64%36%36%21%29%21%14%50%14%36%14%29%
0%7%
14%7%7%
21%14%
7%21%
Letters of recommendation in fellowship specialty
Residency performance evaluation (Program Director letter)
Reputation of residency program
Demonstrated involvement and perceived interest in research
Perceived commitment to specialty
Personal statement
Perceived interest in program
Evidence of professionalism and ethics
USMLE Step 1/COMLEX Level 1 score
Peer reviewed publications/authored textbook chapters
USMLE Step 2 CK/COMLEX Level 2 CE score
Leadership qualities
Personal prior professional knowledge of the applicant
Oral presentations/poster presentations/speaking engagements
Applicant was a resident in a core program at same institution
Pass USMLE Step 2 CS/COMLEX Level 2 PE
Any failed attempt in USMLE/COMLEX
USMLE Step 3/COMLEX Level 3 score
Interest in academic career
Residency program setting (univ.‐based vs. comm.‐based)
Clinical/laboratory research experience
Awards or special honors in medical school
Alpha Omega Alpha (AOA) membership
Other life experience
Medical Student Performance Evaluation (MSPE/Dean's Letter)
Graduate of highly‐regarded medical school
Visa status*
Volunteer/extracurricular experiences
Awarded grant money for research
Grades in medical school
Lack of gaps in medical education
Medical school class ranking/quartile
Applicant was flagged with Match violation by the NRMP
Electives at your fellowship site
Gold Humanism Honor Society (GHHS) membership
Residency class ranking/quartile
Fluency in language spoken by your patient population
In‐Training Examination (ITE)
Residency program size
Having finished another fellowship
NRMP Program Director Survey, Specialties Matching Service, 2016 14

Abdominal Transplant SurgeryPercentage of Programs Citing Each Factor and Mean Importance Rating¹ for Each Factor in Ranking Applicants(N=14)
Figure-2
Average RatingPercent Citing Factor
¹ Ratings on a scale from 1 (not at all important) to 5 (very important).* International Medical Graduates only
1 2 3 4 5
5.04.84.54.84.44.74.53.54.34.64.63.74.64.23.33.84.73.33.74.03.53.33.03.84.33.03.44.03.53.04.04.04.04.53.43.04.04.03.0
4.53.04.04.04.04.0
100% 50% 0%
100%85%77%92%62%54%46%62%85%54%62%54%54%46%54%31%23%31%23%15%31%54%31%31%31%8%
38%15%15%23%46%8%
15%15%38%15%8%
15%8%0%
15%8%8%8%8%8%
Interactions with faculty during interview and visitInterpersonal skills
Letters of recommendation in fellowship specialtyInteractions with house staff during interview and visit
Perceived commitment to specialtyFeedback from current residents and fellows
Perceived interest in programDemonstrated involvement and perceived interest in research
Reputation of residency programResidency performance evaluation (Program Director letter)
Evidence of professionalism and ethicsPersonal statement
Personal prior professional knowledge of the applicantLeadership qualities
Peer reviewed publications/authored textbook chaptersInterest in academic career
Applicant was a resident in a core program at same institutionUSMLE Step 1/COMLEX Level 1 score
USMLE Step 2 CK/COMLEX Level 2 CE scoreAny failed attempt in USMLE/COMLEX
Passing USMLE Step 2 CS/COMLEX Level 2 PEClinical/laboratory research experience
USMLE Step 3/COMLEX Level 3 scoreOral presentations/poster presentations/speaking engagements
Residency program setting (univ.‐based vs. comm.‐based)Alpha Omega Alpha (AOA) membership
Other life experienceMedical Student Performance Evaluation (MSPE/Dean's Letter)
Second interview/visitAwards or special honors in medical school
Visa status*Applicant was flagged with Match violation by the NRMP
Graduate of highly‐regarded medical schoolElectives at your fellowship site
Awarded grant money for researchVolunteer/extracurricular experiencesMedical school class ranking/quartile
Lack of gaps in medical educationGrades in medical school
Residency class ranking/quartileFluency in language spoken by your patient population
Gold Humanism Honor Society (GHHS) membershipResidency program size
In‐Training Examination (ITE)Second interview/visit
Having finished another fellowship
NRMP Program Director Survey, Specialties Matching Service, 2016 15

Abdominal Transplant SurgeryPrograms That Use USMLE Step 1 and Step 2 Clinical Knowledge (CK) Scores When Considering Which Applicants to Interview
Figure-3
Percentage of Programs That Use USMLE Step 2 (CK) Score
0%
10%
20%
30%
40%
50%
60%
70%
80%
90%
100%
Never Seldom Often
8%
67%
25%
Would your program consider applicants who fail theexam on the first attempt?
0%
10%
20%
30%
40%
50%
60%
70%
80%
90%
100%
Never Seldom often
8%
67%
25%
Would your program consider applicants who failthe exam on the first attempt?
0%
10%
20%
30%
40%
50%
60%
70%
80%
90%
100%
Yes, pass only Yes, target score No
93%
0%7%
Scores required?
0%
10%
20%
30%
40%
50%
60%
70%
80%
90%
100%
Yes, pass only Yes, target score No
93%
0%7%
Scores required?
N=14
N=12
N=14N=12
IQR* of Average USMLE Step 1 and Step 2 CK Scores Programs Consider When Granting Interviews
Percentage of Programs That Use USMLE Step 1 Score
*The boxes in the boxplots represent the interquartile range (or IQR, which is the range between the 25th and 75th percentiles), and the line in the box is the median. The x-shaped symbol is the mean.
Scores Above Which Programs Almost Always Grant Interviews
Scores Below Which Programs Generally Do Not Grant Interviews
USMLE Step 2 CK not reported
because of low response rate
USMLE Step 1 not reported because of low response
rate
USMLE Step 2 CK not reported
because of low response rate
USMLE Step 1 not reported because of low response
rate
NRMP Program Director Survey, Specialties Matching Service, 2016 16

0%
10%
20%
30%
40%
50%
60%
70%
80%
90%
100%
Yes No
93%
7%
USMLE Step 2 CS
0%
10%
20%
30%
40%
50%
60%
70%
80%
90%
100%
Yes, pass only Yes, target score No
93%
0%7%
USMLE Step 3
0%
10%
20%
30%
40%
50%
60%
70%
80%
90%
100%
Yes, pass only Yes, target score No
56%
0%
44%
COMLEX-USA Level 1*
Abdominal Transplant SurgeryPercentage of Programs That Use USMLE Step 2 Clinical Skill (CS), Step 3, and COMLEX-USA Scores* When Considering Which Applicants to Interview
Figure-4
0%
10%
20%
30%
40%
50%
60%
70%
80%
90%
100%
Yes, pass only Yes, target score No
56%
0%
44%
COMLEX-USA Level 2-CE*
0%
10%
20%
30%
40%
50%
60%
70%
80%
90%
100%
Yes, pass only Yes, target score No
56%
0%
44%
COMLEX-USA Level 3*
0%
10%
20%
30%
40%
50%
60%
70%
80%
90%
100%
Yes, pass only Yes, target score No
56%
0%
44%
COMLEX-USA Level 2-PE*
N=14 N=14
N=9 N=9
N=9 N=9
* Osteopathic applicants only
Percentage of Programs That Use USMLE Step 2 CS and Step 3 Scores
Percentage of Programs That Use COMLEX-USA Level 1 and Level 2-CE Scores
Percentage of Programs That Use COMLEX-USA Level 2-PE and Level 3 Scores
NRMP Program Director Survey, Specialties Matching Service, 2016 17

0%10%20%30%40%50%60%70%80%90%
100%
Never Seldom Often
0%
100%
0%
Would your program consider applicants who fail theexam on the first attempt?
0%
10%
20%
30%
40%
50%
60%
70%
80%
90%
100%
Yes, pass only Yes, target score No, not required
13%
0%
88%
Scores required?
N=2
N=8
85.0%Optional
15.0%Required
Program Requirement on Dedicated Time forResearch
N=20
0
4
8
12
16
20
24
Accredited Locally Funded Integrated Other
12
24
2
Average Number of Months if Research Time isRequired
N=1 N=0 N=1 N=1
0.0
0.2
0.4
0.6
0.8
1.0
1.2
1.4
Accredited Positions Funded Positions
1.31.4
Average Number of Accredited Positions and Funded Positions
0%
10%
20%
30%
40%
50%
60%
70%
80%
90%
100%
Positions Filled BeforeMatch Day
Positions Offered Outsidethe Match
Positions Filled Outsidethe Match
93%
67% 67%
Average Percentage of Accredited Positions Offered Outside ofthe Match
N=18 N=19 N=6 N=2 N=2
Abdominal Transplant SurgeryPrograms That Use Core Specialty Certifying Examination When Considering Applicants for Interview
Figure-5
Abdominal Transplant SurgeryPrograms Positions Figure-6
Abdominal Transplant SurgeryDedicated Time for Research Figure-7
NRMP Program Director Survey, Specialties Matching Service, 2016 18
0%
10%
20%
30%
40%
50%
60%
70%
80%
90%
100%88%
69%
81%
44%
63%
75%
U.S. Graduate OsteopathicPhysician
Canadian Fifth Pathway U.S. IMG Non-U.S. IMG
Percentage of Programs that Typically Interview and Rank Each Applicant Type
Figure-8Abdominal Transplant SurgeryProgram's Interview Activities
0%10%20%30%40%50%60%70%80%90%
100%
Rejected based on astandardized screening
process
In-depth review
50%
65%
Average Percentage of Applicants Rejected and Reviewed
0
4
8
12
16
20
24
Number of applicationsreceived
Number of interviewinvitations sent
Number of applicantsinterviewed
23
9 9
Average Number of Positions, Applications Received, InterviewInvitations Sent, and Applicants Interviewed and Ranked
N=16N=16N=16N=16
N=16
44% of Abdominal Transplant Surgery programs consider all applicant groups
N=15
0%10%20%30%40%50%60%70%80%90%
100%
Prev. Grad Osteo Pathway Canadian US IMG Non-USIMG
21% 20%
82%
21% 21% 21%
7%27% 29%
43%
14%
71%53%
18%
50%36%
64%
Often Seldom Never
Interview
0%10%
20%
30%40%
50%60%
70%80%
90%100%
Prev. Grad Osteo Pathway Canadian US IMG Non-USIMG
23% 21%
82%
15% 17% 23%
29% 38%50%
15%
77%
50%
18%
46%33%
62%
Often Seldom Never
Ranking
n=13
Frequency of Programs Interviewing and Ranking Candidates
n=14
N=13
0%10%20%30%40%50%60%70%80%90%
100%
Jan Feb Mar Apr May Jun Jul Aug Sep Oct Nov Dec
11%
44%
13% 10% 10%0% 0% 0% 0%
8%0%
8%
Interview invitations
Interview Invitations Sent and Interviews Conducted
0% 1%
14%
41%
21%
0% 0% 0% 0% 0% 0%
15%
Interviews conducted
NRMP Program Director Survey, Specialties Matching Service, 2016 19

Figure-9Abdominal Transplant SurgeryPotential Challenges in Recruiting Applicants to Your Specialty
0% 20% 40% 60% 80% 100%
92%
33%
17%
0%
0%
We consider those applicants on an individual basis
We give those applicants serious consideration if they haveshown improvement
We do not usually consider those applicants
We favor those applicants
Other
0 1 2 3 4 5
Not enough applicants in the specialty
Undesirable income potential as a practicing physician
Undesirable work/life balance as a practicing physician
Long or irregular work hours required by specialty
Fellowship Match scheduled at inconvenient time of year
3.5
2.3
4.3
4.6
1.4
Average rating on a scale of 5 (1=least challenging; 5=most challenging)
n=12
28.6%Less than 3
21.4%3 to 5
35.7%6 to 10
7.1%11 to 157.1%
More than 15
At Any Fellowship Program
35.7%Less than 3
21.4%3 to 5
35.7%6 to 10
7.1%More than 15
At Current Fellowship Program
n=12
n=14 n=14
Abdominal Transplant SurgeryApplicants Who Applied in the Specialty in the Past But Did Not Match Figure-10
Abdominal Transplant SurgeryYears as Program Director Figure-11
NRMP Program Director Survey, Specialties Matching Service, 2016 20

Adolescent Medicine
NRMP Program Director Survey, Specialties Matching Service, 2016 21

Adolescent MedicineGeneral Information
Table 1
24
31
29
Number of programs in the Match
Number of positions in the Match
Number of applicants ranking specialty
62.5%Response rate
Appointment Years
Number of responses 15
Match Information*
* Source: NRMP Data Warehouse
2016 Survey
2016 2015 2014
25
36
31
23
35
22
NRMP Program Director Survey, Specialties Matching Service, 2016 22
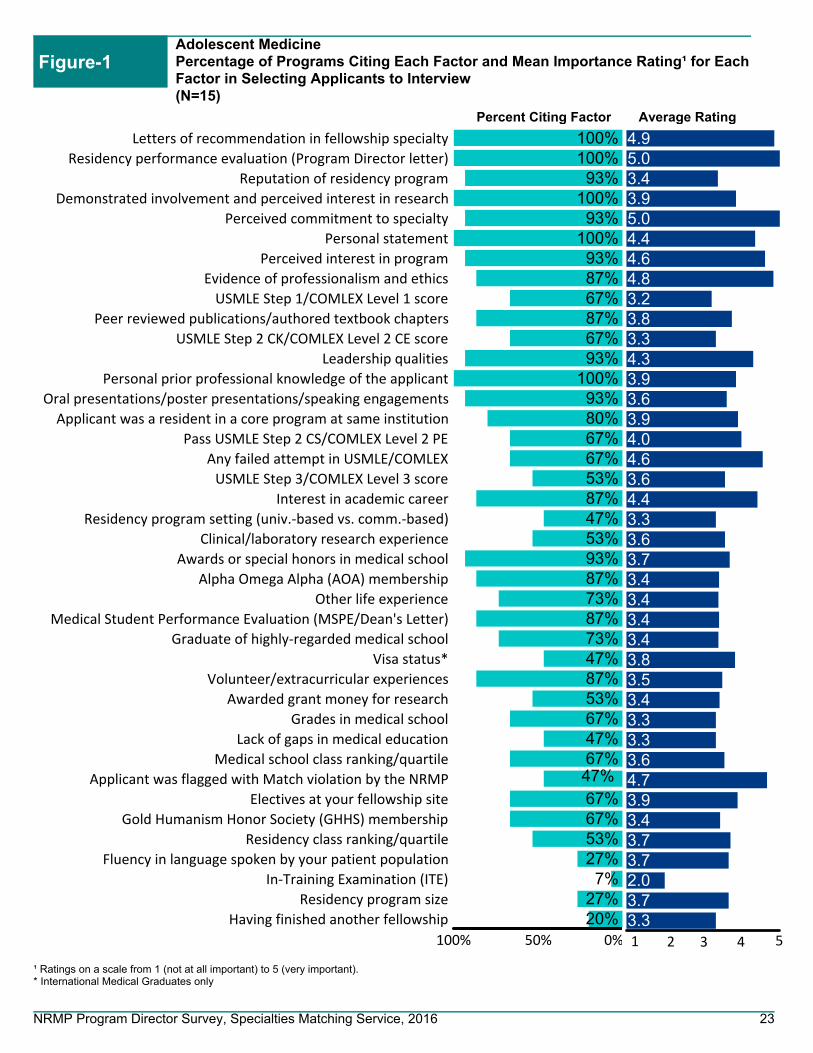
Figure-1Adolescent MedicinePercentage of Programs Citing Each Factor and Mean Importance Rating¹ for Each Factor in Selecting Applicants to Interview(N=15)
Average RatingPercent Citing Factor
¹ Ratings on a scale from 1 (not at all important) to 5 (very important).* International Medical Graduates only
1 2 3 4 5
4.95.03.43.95.04.44.64.83.23.83.34.33.93.63.94.04.63.64.43.33.63.73.43.43.43.43.83.53.43.33.33.64.73.93.43.73.72.03.73.3
100% 50% 0%
100%100%
93%100%
93%100%
93%87%67%87%67%93%
100%93%80%67%67%53%87%47%53%93%87%73%87%73%47%87%53%67%47%67%47%67%67%53%27%
7%27%20%
Letters of recommendation in fellowship specialty
Residency performance evaluation (Program Director letter)
Reputation of residency program
Demonstrated involvement and perceived interest in research
Perceived commitment to specialty
Personal statement
Perceived interest in program
Evidence of professionalism and ethics
USMLE Step 1/COMLEX Level 1 score
Peer reviewed publications/authored textbook chapters
USMLE Step 2 CK/COMLEX Level 2 CE score
Leadership qualities
Personal prior professional knowledge of the applicant
Oral presentations/poster presentations/speaking engagements
Applicant was a resident in a core program at same institution
Pass USMLE Step 2 CS/COMLEX Level 2 PE
Any failed attempt in USMLE/COMLEX
USMLE Step 3/COMLEX Level 3 score
Interest in academic career
Residency program setting (univ.‐based vs. comm.‐based)
Clinical/laboratory research experience
Awards or special honors in medical school
Alpha Omega Alpha (AOA) membership
Other life experience
Medical Student Performance Evaluation (MSPE/Dean's Letter)
Graduate of highly‐regarded medical school
Visa status*
Volunteer/extracurricular experiences
Awarded grant money for research
Grades in medical school
Lack of gaps in medical education
Medical school class ranking/quartile
Applicant was flagged with Match violation by the NRMP
Electives at your fellowship site
Gold Humanism Honor Society (GHHS) membership
Residency class ranking/quartile
Fluency in language spoken by your patient population
In‐Training Examination (ITE)
Residency program size
Having finished another fellowship
NRMP Program Director Survey, Specialties Matching Service, 2016 23

Adolescent MedicinePercentage of Programs Citing Each Factor and Mean Importance Rating¹ for Each Factor in Ranking Applicants(N=15)
Figure-2
Average RatingPercent Citing Factor
¹ Ratings on a scale from 1 (not at all important) to 5 (very important).* International Medical Graduates only
1 2 3 4 5
5.04.94.84.54.94.74.94.44.15.04.84.34.34.73.94.84.03.33.34.44.43.93.43.93.54.03.64.34.43.94.54.64.24.13.63.84.03.53.73.43.04.43.7
4.03.0
100% 50% 0%
100%92%92%85%92%92%85%92%62%85%92%92%77%85%85%77%62%31%31%62%38%54%38%69%31%46%62%62%54%77%31%38%46%69%62%62%15%15%23%38%31%38%23%0%
31%31%
Interactions with faculty during interview and visitInterpersonal skills
Letters of recommendation in fellowship specialtyInteractions with house staff during interview and visit
Perceived commitment to specialtyFeedback from current residents and fellows
Perceived interest in programDemonstrated involvement and perceived interest in research
Reputation of residency programResidency performance evaluation (Program Director letter)
Evidence of professionalism and ethicsPersonal statement
Personal prior professional knowledge of the applicantLeadership qualities
Peer reviewed publications/authored textbook chaptersInterest in academic career
Applicant was a resident in a core program at same institutionUSMLE Step 1/COMLEX Level 1 score
USMLE Step 2 CK/COMLEX Level 2 CE scoreAny failed attempt in USMLE/COMLEX
Passing USMLE Step 2 CS/COMLEX Level 2 PEClinical/laboratory research experience
USMLE Step 3/COMLEX Level 3 scoreOral presentations/poster presentations/speaking engagements
Residency program setting (univ.‐based vs. comm.‐based)Alpha Omega Alpha (AOA) membership
Other life experienceMedical Student Performance Evaluation (MSPE/Dean's Letter)
Second interview/visitAwards or special honors in medical school
Visa status*Applicant was flagged with Match violation by the NRMP
Graduate of highly‐regarded medical schoolElectives at your fellowship site
Awarded grant money for researchVolunteer/extracurricular experiencesMedical school class ranking/quartile
Lack of gaps in medical educationGrades in medical school
Residency class ranking/quartileFluency in language spoken by your patient population
Gold Humanism Honor Society (GHHS) membershipResidency program size
In‐Training Examination (ITE)Second interview/visit
Having finished another fellowship
NRMP Program Director Survey, Specialties Matching Service, 2016 24

Adolescent MedicinePrograms That Use USMLE Step 1 and Step 2 Clinical Knowledge (CK) Scores When Considering Which Applicants to Interview
Figure-3
Percentage of Programs That Use USMLE Step 2 (CK) Score
0%
10%
20%
30%
40%
50%
60%
70%
80%
90%
100%
Never Seldom Often
0%
50% 50%
Would your program consider applicants who fail theexam on the first attempt?
0%
10%
20%
30%
40%
50%
60%
70%
80%
90%
100%
Never Seldom often
0%
67%
33%
Would your program consider applicants who failthe exam on the first attempt?
0%
10%
20%
30%
40%
50%
60%
70%
80%
90%
100%
Yes, pass only Yes, target score No
93%
7%0%
Scores required?
0%
10%
20%
30%
40%
50%
60%
70%
80%
90%
100%
Yes, pass only Yes, target score No
93%
7%0%
Scores required?
N=15
N=14
N=15N=15
IQR* of Average USMLE Step 1 and Step 2 CK Scores Programs Consider When Granting Interviews
Percentage of Programs That Use USMLE Step 1 Score
*The boxes in the boxplots represent the interquartile range (or IQR, which is the range between the 25th and 75th percentiles), and the line in the box is the median. The x-shaped symbol is the mean.
Scores Above Which Programs Almost Always Grant Interviews
Scores Below Which Programs Generally Do Not Grant Interviews
USMLE Step 2 CK not reported
because of low response rate
USMLE Step 1 not reported because of low response
rate
USMLE Step 2 CK not reported
because of low response rate
USMLE Step 1 not reported because of low response
rate
NRMP Program Director Survey, Specialties Matching Service, 2016 25

0%
10%
20%
30%
40%
50%
60%
70%
80%
90%
100%
Yes No
100%
0%
USMLE Step 2 CS
0%
10%
20%
30%
40%
50%
60%
70%
80%
90%
100%
Yes, pass only Yes, target score No
80%
7%13%
USMLE Step 3
0%
10%
20%
30%
40%
50%
60%
70%
80%
90%
100%
Yes, pass only Yes, target score No
67%
8%
25%
COMLEX-USA Level 1*
Adolescent MedicinePercentage of Programs That Use USMLE Step 2 Clinical Skill (CS), Step 3, and COMLEX-USA Scores* When Considering Which Applicants to Interview
Figure-4
0%
10%
20%
30%
40%
50%
60%
70%
80%
90%
100%
Yes, pass only Yes, target score No
67%
8%
25%
COMLEX-USA Level 2-CE*
0%
10%
20%
30%
40%
50%
60%
70%
80%
90%
100%
Yes, pass only Yes, target score No
58%
8%
33%
COMLEX-USA Level 3*
0%
10%
20%
30%
40%
50%
60%
70%
80%
90%
100%
Yes, pass only Yes, target score No
67%
8%
25%
COMLEX-USA Level 2-PE*
N=15 N=15
N=12 N=12
N=12 N=12
* Osteopathic applicants only
Percentage of Programs That Use USMLE Step 2 CS and Step 3 Scores
Percentage of Programs That Use COMLEX-USA Level 1 and Level 2-CE Scores
Percentage of Programs That Use COMLEX-USA Level 2-PE and Level 3 Scores
NRMP Program Director Survey, Specialties Matching Service, 2016 26

0%10%20%30%40%50%60%70%80%90%
100%
Never Seldom Often
20%
40% 40%
Would your program consider applicants who fail theexam on the first attempt?
0%
10%
20%
30%
40%
50%
60%
70%
80%
90%
100%
Yes, pass only Yes, target score No, not required
29%
0%
71%
Scores required?
N=5
N=7
13.3%Optional
86.7%Required
Program Requirement on Dedicated Time forResearch
N=15
0
4
8
12
16
20
Accredited Locally Funded Integrated Other
15
18 18
Average Number of Months if Research Time isRequired
N=6 N=0 N=2 N=1
0.0
0.4
0.8
1.2
1.6
2.0
2.4
2.8
Accredited Positions Funded Positions
2.7
2.1
Average Number of Accredited Positions and Funded Positions
0%
10%
20%
30%
40%
50%
60%
70%
80%
90%
100%
Positions Filled BeforeMatch Day
Positions Offered Outsidethe Match
Positions Filled Outsidethe Match
55% 54% 54%
Average Percentage of Accredited Positions Offered Outside ofthe Match
N=15 N=14 N=5 N=4 N=4
Adolescent MedicinePrograms That Use Core Specialty Certifying Examination When Considering Applicants for Interview
Figure-5
Adolescent MedicinePrograms Positions Figure-6
Adolescent MedicineDedicated Time for Research Figure-7
NRMP Program Director Survey, Specialties Matching Service, 2016 27

0%
10%
20%
30%
40%
50%
60%
70%
80%
90%
100%100%
87%
53%
0%
73%
40%
U.S. Graduate OsteopathicPhysician
Canadian Fifth Pathway U.S. IMG Non-U.S. IMG
Percentage of Programs that Typically Interview and Rank Each Applicant Type
Figure-8Adolescent MedicineProgram's Interview Activities
0%10%20%30%40%50%60%70%80%90%
100%
Rejected based on astandardized screening
process
In-depth review
12%
89%
Average Percentage of Applicants Rejected and Reviewed
0
2
4
6
8
10
12
14
Number of applicationsreceived
Number of interviewinvitations sent
Number of applicantsinterviewed
12
87
Average Number of Positions, Applications Received, InterviewInvitations Sent, and Applicants Interviewed and Ranked
N=15N=15N=15N=15
N=15
0% of Adolescent Medicine programs consider all applicant groups
N=15
0%10%20%30%40%50%60%70%80%90%
100%
Prev. Grad Osteo Pathway Canadian US IMG Non-USIMG
92%
21% 20%36%40%
8%
50%67%
64%
100%
60%
29%13%
Often Seldom Never
Interview
0%10%
20%
30%40%
50%60%
70%80%
90%100%
Prev. Grad Osteo Pathway Canadian US IMG Non-USIMG
100%
21% 20%36%40%
50%67%
64%
100%
60%
29%13%
Often Seldom Never
Ranking
n=15
Frequency of Programs Interviewing and Ranking Candidates
n=15
N=14
0%10%20%30%40%50%60%70%80%90%
100%
Jan Feb Mar Apr May Jun Jul Aug Sep Oct Nov Dec
0% 0% 0% 0% 0% 0%
29%
41%
29%
2% 0% 0%
Interview invitations
Interview Invitations Sent and Interviews Conducted
0% 0% 0% 0% 0% 0% 2%
17%
42%38%
1% 0%
Interviews conducted
NRMP Program Director Survey, Specialties Matching Service, 2016 28

Figure-9Adolescent MedicinePotential Challenges in Recruiting Applicants to Your Specialty
0% 20% 40% 60% 80% 100%
92%
17%
8%
0%
8%
We consider those applicants on an individual basis
We give those applicants serious consideration if they haveshown improvement
We do not usually consider those applicants
We favor those applicants
Other
0 1 2 3 4 5
Not enough applicants in the specialty
Undesirable income potential as a practicing physician
Undesirable work/life balance as a practicing physician
Long or irregular work hours required by specialty
Fellowship Match scheduled at inconvenient time of year
4.9
3.9
1.7
1.2
1.5
Average rating on a scale of 5 (1=least challenging; 5=most challenging)n=14
25.0%Less than 3
41.7%3 to 5
16.7%6 to 10
16.7%More than 15
At Any Fellowship Program
30.0%Less than 3
30.0%3 to 5
30.0%6 to 10
10.0%More than 15
At Current Fellowship Program
n=12
n=12 n=10
Adolescent MedicineApplicants Who Applied in the Specialty in the Past But Did Not Match Figure-10
Adolescent MedicineYears as Program Director Figure-11
NRMP Program Director Survey, Specialties Matching Service, 2016 29

Allergy and Immunology
NRMP Program Director Survey, Specialties Matching Service, 2016 30

Allergy and ImmunologyGeneral Information
Table 1
86
137
151
Number of programs in the Match
Number of positions in the Match
Number of applicants ranking specialty
29.7%Response rate
Appointment Years
Number of responses 22
Match Information*
* Source: NRMP Data Warehouse
2016 Survey
2016 2015 2014
82
126
155
81
132
179
NRMP Program Director Survey, Specialties Matching Service, 2016 31
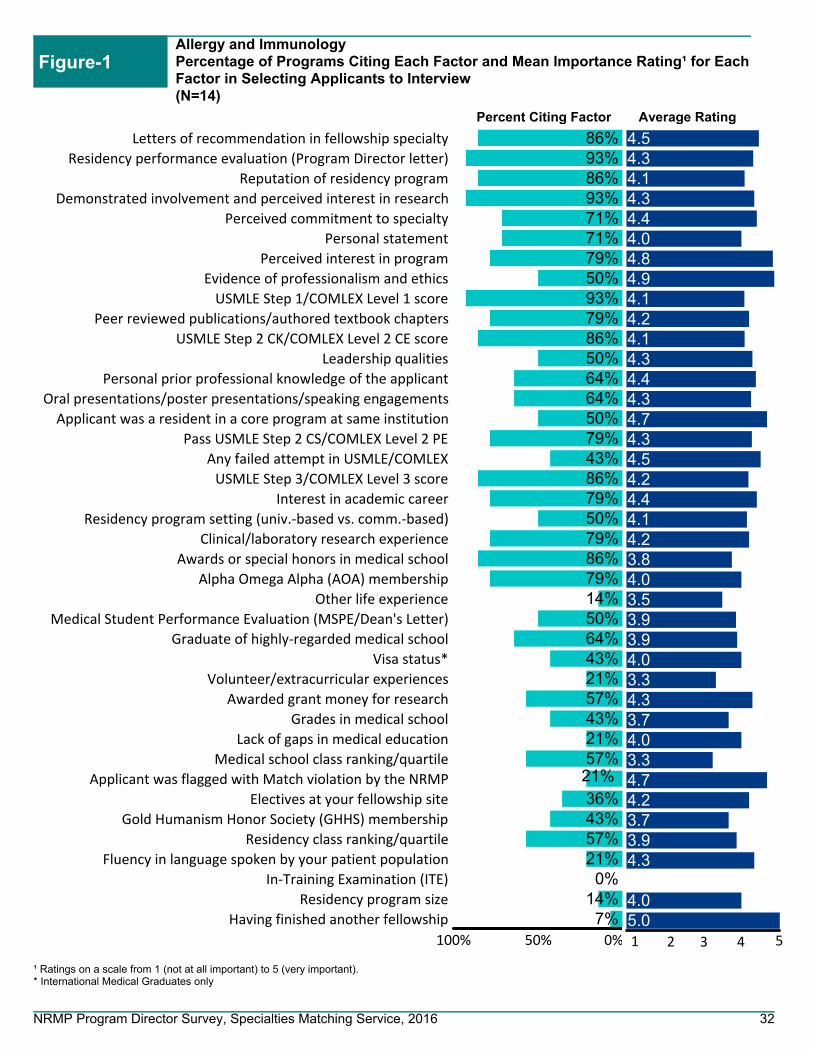
Figure-1Allergy and ImmunologyPercentage of Programs Citing Each Factor and Mean Importance Rating¹ for Each Factor in Selecting Applicants to Interview(N=14)
Average RatingPercent Citing Factor
¹ Ratings on a scale from 1 (not at all important) to 5 (very important).* International Medical Graduates only
1 2 3 4 5
4.54.34.14.34.44.04.84.94.14.24.14.34.44.34.74.34.54.24.44.14.23.84.03.53.93.94.03.34.33.74.03.34.74.23.73.94.3
4.05.0
100% 50% 0%
86%93%86%93%71%71%79%50%93%79%86%50%64%64%50%79%43%86%79%50%79%86%79%14%50%64%43%21%57%43%21%57%21%36%43%57%21%
0%14%
7%
Letters of recommendation in fellowship specialty
Residency performance evaluation (Program Director letter)
Reputation of residency program
Demonstrated involvement and perceived interest in research
Perceived commitment to specialty
Personal statement
Perceived interest in program
Evidence of professionalism and ethics
USMLE Step 1/COMLEX Level 1 score
Peer reviewed publications/authored textbook chapters
USMLE Step 2 CK/COMLEX Level 2 CE score
Leadership qualities
Personal prior professional knowledge of the applicant
Oral presentations/poster presentations/speaking engagements
Applicant was a resident in a core program at same institution
Pass USMLE Step 2 CS/COMLEX Level 2 PE
Any failed attempt in USMLE/COMLEX
USMLE Step 3/COMLEX Level 3 score
Interest in academic career
Residency program setting (univ.‐based vs. comm.‐based)
Clinical/laboratory research experience
Awards or special honors in medical school
Alpha Omega Alpha (AOA) membership
Other life experience
Medical Student Performance Evaluation (MSPE/Dean's Letter)
Graduate of highly‐regarded medical school
Visa status*
Volunteer/extracurricular experiences
Awarded grant money for research
Grades in medical school
Lack of gaps in medical education
Medical school class ranking/quartile
Applicant was flagged with Match violation by the NRMP
Electives at your fellowship site
Gold Humanism Honor Society (GHHS) membership
Residency class ranking/quartile
Fluency in language spoken by your patient population
In‐Training Examination (ITE)
Residency program size
Having finished another fellowship
NRMP Program Director Survey, Specialties Matching Service, 2016 32

Allergy and ImmunologyPercentage of Programs Citing Each Factor and Mean Importance Rating¹ for Each Factor in Ranking Applicants(N=14)
Figure-2
Average RatingPercent Citing Factor
¹ Ratings on a scale from 1 (not at all important) to 5 (very important).* International Medical Graduates only
1 2 3 4 5
4.74.64.54.74.54.74.34.74.24.44.94.24.34.54.64.84.34.44.44.64.44.64.34.54.24.3
4.74.73.94.55.04.04.34.83.54.04.74.54.04.04.04.5
5.05.0
100% 50% 0%
93%100%86%71%57%86%86%71%71%64%57%36%57%29%64%64%50%57%57%50%50%57%64%57%36%57%0%
29%21%50%14%7%
43%21%43%14%29%21%14%29%7%
14%14%0%
21%7%
Interactions with faculty during interview and visitInterpersonal skills
Letters of recommendation in fellowship specialtyInteractions with house staff during interview and visit
Perceived commitment to specialtyFeedback from current residents and fellows
Perceived interest in programDemonstrated involvement and perceived interest in research
Reputation of residency programResidency performance evaluation (Program Director letter)
Evidence of professionalism and ethicsPersonal statement
Personal prior professional knowledge of the applicantLeadership qualities
Peer reviewed publications/authored textbook chaptersInterest in academic career
Applicant was a resident in a core program at same institutionUSMLE Step 1/COMLEX Level 1 score
USMLE Step 2 CK/COMLEX Level 2 CE scoreAny failed attempt in USMLE/COMLEX
Passing USMLE Step 2 CS/COMLEX Level 2 PEClinical/laboratory research experience
USMLE Step 3/COMLEX Level 3 scoreOral presentations/poster presentations/speaking engagements
Residency program setting (univ.‐based vs. comm.‐based)Alpha Omega Alpha (AOA) membership
Other life experienceMedical Student Performance Evaluation (MSPE/Dean's Letter)
Second interview/visitAwards or special honors in medical school
Visa status*Applicant was flagged with Match violation by the NRMP
Graduate of highly‐regarded medical schoolElectives at your fellowship site
Awarded grant money for researchVolunteer/extracurricular experiencesMedical school class ranking/quartile
Lack of gaps in medical educationGrades in medical school
Residency class ranking/quartileFluency in language spoken by your patient population
Gold Humanism Honor Society (GHHS) membershipResidency program size
In‐Training Examination (ITE)Second interview/visit
Having finished another fellowship
NRMP Program Director Survey, Specialties Matching Service, 2016 33

170
180
190
200
210
220
230
240
250
260
Allergy and ImmunologyPrograms That Use USMLE Step 1 and Step 2 Clinical Knowledge (CK) Scores When Considering Which Applicants to Interview
Figure-3
Percentage of Programs That Use USMLE Step 2 (CK) Score
0%
10%
20%
30%
40%
50%
60%
70%
80%
90%
100%
Never Seldom Often
15%
85%
0%
Would your program consider applicants who fail theexam on the first attempt?
0%
10%
20%
30%
40%
50%
60%
70%
80%
90%
100%
Never Seldom often
38%
62%
0%
Would your program consider applicants who failthe exam on the first attempt?
0%
10%
20%
30%
40%
50%
60%
70%
80%
90%
100%
Yes, pass only Yes, target score No
36%
57%
7%
Scores required?
0%
10%
20%
30%
40%
50%
60%
70%
80%
90%
100%
Yes, pass only Yes, target score No
36%
57%
7%
Scores required?
N=14
N=13
N=14N=13
N=5N=6 N=7 N=6
IQR* of Average USMLE Step 1 and Step 2 CK Scores Programs Consider When Granting Interviews
Percentage of Programs That Use USMLE Step 1 Score
170
180
190
200
210
220
230
240
250
260
USMLE Step 2 CKUSMLE Step 1 USMLE Step 1 USMLE Step 2 CK
*The boxes in the boxplots represent the interquartile range (or IQR, which is the range between the 25th and 75th percentiles), and the line in the box is the median. The x-shaped symbol is the mean.
Scores Above Which Programs Almost Always Grant Interviews
Scores Below Which Programs Generally Do Not Grant Interviews
NRMP Program Director Survey, Specialties Matching Service, 2016 34

0%
10%
20%
30%
40%
50%
60%
70%
80%
90%
100%
Yes No
93%
7%
USMLE Step 2 CS
0%
10%
20%
30%
40%
50%
60%
70%
80%
90%
100%
Yes, pass only Yes, target score No
36%
50%
14%
USMLE Step 3
0%
10%
20%
30%
40%
50%
60%
70%
80%
90%
100%
Yes, pass only Yes, target score No
11%
44% 44%
COMLEX-USA Level 1*
Allergy and ImmunologyPercentage of Programs That Use USMLE Step 2 Clinical Skill (CS), Step 3, and COMLEX-USA Scores* When Considering Which Applicants to Interview
Figure-4
0%
10%
20%
30%
40%
50%
60%
70%
80%
90%
100%
Yes, pass only Yes, target score No
11%
44% 44%
COMLEX-USA Level 2-CE*
0%
10%
20%
30%
40%
50%
60%
70%
80%
90%
100%
Yes, pass only Yes, target score No
11%
33%
56%
COMLEX-USA Level 3*
0%
10%
20%
30%
40%
50%
60%
70%
80%
90%
100%
Yes, pass only Yes, target score No
22%
33%
44%
COMLEX-USA Level 2-PE*
N=14 N=14
N=9 N=9
N=9 N=9
* Osteopathic applicants only
Percentage of Programs That Use USMLE Step 2 CS and Step 3 Scores
Percentage of Programs That Use COMLEX-USA Level 1 and Level 2-CE Scores
Percentage of Programs That Use COMLEX-USA Level 2-PE and Level 3 Scores
NRMP Program Director Survey, Specialties Matching Service, 2016 35

0%10%20%30%40%50%60%70%80%90%
100%
Never Seldom Often
33%
67%
0%
Would your program consider applicants who fail theexam on the first attempt?
0%
10%
20%
30%
40%
50%
60%
70%
80%
90%
100%
Yes, pass only Yes, target score No, not required
20% 20%
60%
Scores required?
N=6
N=10
13.6%Optional
86.4%Required
Program Requirement on Dedicated Time forResearch
N=22
0
4
8
12
16
20
24
Accredited Locally Funded Integrated Other
7
9
24
6
Average Number of Months if Research Time isRequired
N=11 N=7 N=1 N=1
0.0
0.5
1.0
1.5
2.0
2.5
3.0
3.5
4.0
Accredited Positions Funded Positions
3.8
3.3
Average Number of Accredited Positions and Funded Positions
0%
10%
20%
30%
40%
50%
60%
70%
80%
90%
100%
Positions Filled BeforeMatch Day
Positions Offered Outsidethe Match
Positions Filled Outsidethe Match
71%
29% 30%
Average Percentage of Accredited Positions Offered Outside ofthe Match
N=21 N=20 N=7 N=4 N=3
Allergy and ImmunologyPrograms That Use Core Specialty Certifying Examination When Considering Applicants for Interview
Figure-5
Allergy and ImmunologyPrograms Positions Figure-6
Allergy and ImmunologyDedicated Time for Research Figure-7
NRMP Program Director Survey, Specialties Matching Service, 2016 36

0%
10%
20%
30%
40%
50%
60%
70%
80%
90%
100% 93%
64%57%
36%
71%
43%
U.S. Graduate OsteopathicPhysician
Canadian Fifth Pathway U.S. IMG Non-U.S. IMG
Percentage of Programs that Typically Interview and Rank Each Applicant Type
Figure-8Allergy and ImmunologyProgram's Interview Activities
0%10%20%30%40%50%60%70%80%90%
100%
Rejected based on astandardized screening
process
In-depth review
49%60%
Average Percentage of Applicants Rejected and Reviewed
0
10
20
30
40
50
60
70
Number of applicationsreceived
Number of interviewinvitations sent
Number of applicantsinterviewed
62
1815
Average Number of Positions, Applications Received, InterviewInvitations Sent, and Applicants Interviewed and Ranked
N=16N=15N=18N=18
N=14
29% of Allergy and Immunology programs consider all applicant groups
N=18
0%10%20%30%40%50%60%70%80%90%
100%
Prev. Grad Osteo Pathway Canadian US IMG Non-USIMG
13% 13%
53%
27%13%
47%
47%
47%
60%
53%
40%
88%
40%
13%33%
13%
Often Seldom Never
Interview
0%10%
20%
30%40%
50%60%
70%80%
90%100%
Prev. Grad Osteo Pathway Canadian US IMG Non-USIMG
13%27%
53%33%
13%
47%
33%
47%
60%
53%
53%
87%
40%
7%
33%
Often Seldom Never
Ranking
n=15
Frequency of Programs Interviewing and Ranking Candidates
n=16
N=14
0%10%20%30%40%50%60%70%80%90%
100%
Jan Feb Mar Apr May Jun Jul Aug Sep Oct Nov Dec
0% 0% 0% 0% 0% 0%10%
58%
20%12%
0% 0%
Interview invitations
Interview Invitations Sent and Interviews Conducted
0% 0% 0% 0% 0% 0% 0%8%
49%
30%
7%0%
Interviews conducted
NRMP Program Director Survey, Specialties Matching Service, 2016 37

Figure-9Allergy and ImmunologyPotential Challenges in Recruiting Applicants to Your Specialty
0% 20% 40% 60% 80% 100%
85%
15%
15%
0%
0%
We consider those applicants on an individual basis
We give those applicants serious consideration if they haveshown improvement
We do not usually consider those applicants
We favor those applicants
Other
0 1 2 3 4 5
Not enough applicants in the specialty
Undesirable income potential as a practicing physician
Undesirable work/life balance as a practicing physician
Long or irregular work hours required by specialty
Fellowship Match scheduled at inconvenient time of year
2.2
1.8
1.2
1.2
1.3
Average rating on a scale of 5 (1=least challenging; 5=most challenging)
n=14
26.7%3 to 5
40.0%6 to 10
13.3%11 to
15
20.0%More than 15
At Any Fellowship Program
7.1%Less than 3
21.4%3 to 5
35.7%6 to 10
14.3%11 to 15
21.4%More than 15
At Current Fellowship Program
n=13
n=15 n=14
Allergy and ImmunologyApplicants Who Applied in the Specialty in the Past But Did Not Match Figure-10
Allergy and ImmunologyYears as Program Director Figure-11
NRMP Program Director Survey, Specialties Matching Service, 2016 38

Cardiovascular Disease
NRMP Program Director Survey, Specialties Matching Service, 2016 39

Cardiovascular DiseaseGeneral Information
Table 1
193
844
1,108
Number of programs in the Match
Number of positions in the Match
Number of applicants ranking specialty
30.8%Response rate
Appointment Years
Number of responses 57
Match Information*
* Source: NRMP Data Warehouse
2016 Survey
2016 2015 2014
187
835
1,142
181
800
1,106
NRMP Program Director Survey, Specialties Matching Service, 2016 40

Figure-1Cardiovascular DiseasePercentage of Programs Citing Each Factor and Mean Importance Rating¹ for Each Factor in Selecting Applicants to Interview(N=48)
Average RatingPercent Citing Factor
¹ Ratings on a scale from 1 (not at all important) to 5 (very important).* International Medical Graduates only
1 2 3 4 5
4.44.54.54.04.03.54.24.54.04.04.04.14.24.04.24.34.74.14.04.43.63.54.23.53.43.84.13.83.83.43.73.54.83.93.53.93.63.03.32.6
100% 50% 0%
81%88%94%90%60%69%73%67%81%79%83%77%67%71%79%63%83%79%52%75%52%54%52%46%46%54%44%31%40%23%48%31%52%27%25%56%19%10%10%19%
Letters of recommendation in fellowship specialty
Residency performance evaluation (Program Director letter)
Reputation of residency program
Demonstrated involvement and perceived interest in research
Perceived commitment to specialty
Personal statement
Perceived interest in program
Evidence of professionalism and ethics
USMLE Step 1/COMLEX Level 1 score
Peer reviewed publications/authored textbook chapters
USMLE Step 2 CK/COMLEX Level 2 CE score
Leadership qualities
Personal prior professional knowledge of the applicant
Oral presentations/poster presentations/speaking engagements
Applicant was a resident in a core program at same institution
Pass USMLE Step 2 CS/COMLEX Level 2 PE
Any failed attempt in USMLE/COMLEX
USMLE Step 3/COMLEX Level 3 score
Interest in academic career
Residency program setting (univ.‐based vs. comm.‐based)
Clinical/laboratory research experience
Awards or special honors in medical school
Alpha Omega Alpha (AOA) membership
Other life experience
Medical Student Performance Evaluation (MSPE/Dean's Letter)
Graduate of highly‐regarded medical school
Visa status*
Volunteer/extracurricular experiences
Awarded grant money for research
Grades in medical school
Lack of gaps in medical education
Medical school class ranking/quartile
Applicant was flagged with Match violation by the NRMP
Electives at your fellowship site
Gold Humanism Honor Society (GHHS) membership
Residency class ranking/quartile
Fluency in language spoken by your patient population
In‐Training Examination (ITE)
Residency program size
Having finished another fellowship
NRMP Program Director Survey, Specialties Matching Service, 2016 41
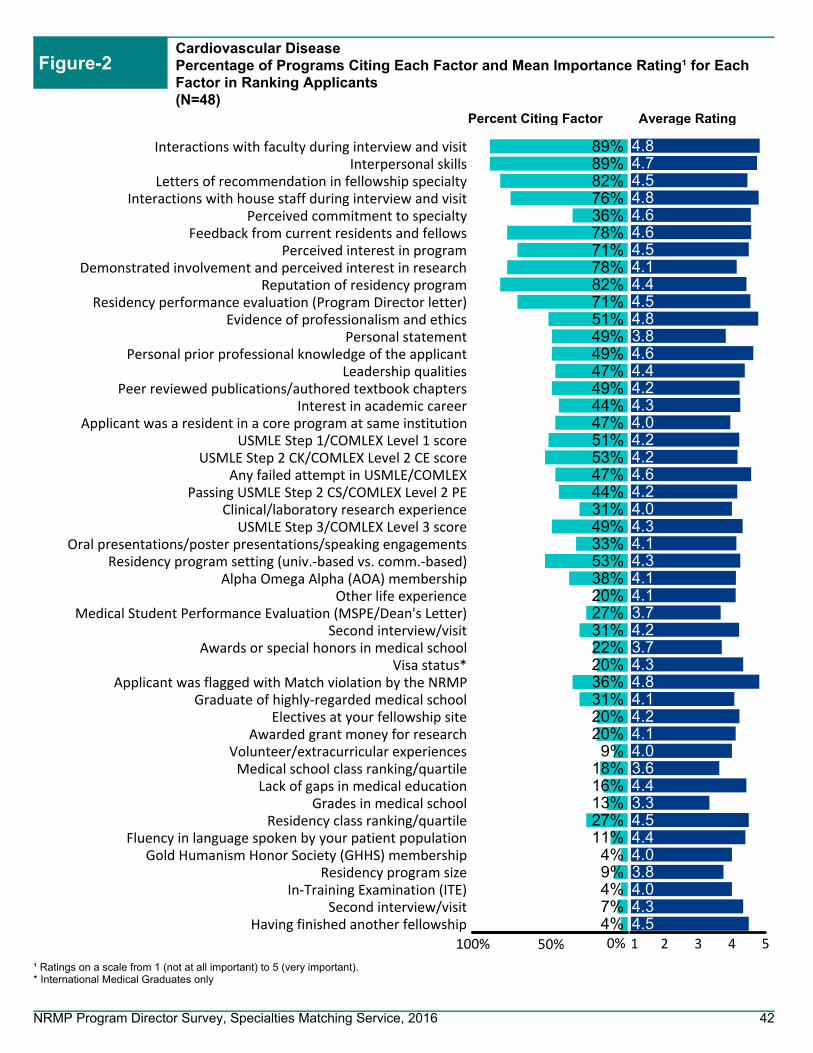
Cardiovascular DiseasePercentage of Programs Citing Each Factor and Mean Importance Rating¹ for Each Factor in Ranking Applicants(N=48)
Figure-2
Average RatingPercent Citing Factor
¹ Ratings on a scale from 1 (not at all important) to 5 (very important).* International Medical Graduates only
1 2 3 4 5
4.84.74.54.84.64.64.54.14.44.54.83.84.64.44.24.34.04.24.24.64.24.04.34.14.34.14.13.74.23.74.34.84.14.24.14.03.64.43.34.54.44.03.84.04.34.5
100% 50% 0%
89%89%82%76%36%78%71%78%82%71%51%49%49%47%49%44%47%51%53%47%44%31%49%33%53%38%20%27%31%22%20%36%31%20%20%9%
18%16%13%27%11%4%9%4%7%4%
Interactions with faculty during interview and visitInterpersonal skills
Letters of recommendation in fellowship specialtyInteractions with house staff during interview and visit
Perceived commitment to specialtyFeedback from current residents and fellows
Perceived interest in programDemonstrated involvement and perceived interest in research
Reputation of residency programResidency performance evaluation (Program Director letter)
Evidence of professionalism and ethicsPersonal statement
Personal prior professional knowledge of the applicantLeadership qualities
Peer reviewed publications/authored textbook chaptersInterest in academic career
Applicant was a resident in a core program at same institutionUSMLE Step 1/COMLEX Level 1 score
USMLE Step 2 CK/COMLEX Level 2 CE scoreAny failed attempt in USMLE/COMLEX
Passing USMLE Step 2 CS/COMLEX Level 2 PEClinical/laboratory research experience
USMLE Step 3/COMLEX Level 3 scoreOral presentations/poster presentations/speaking engagements
Residency program setting (univ.‐based vs. comm.‐based)Alpha Omega Alpha (AOA) membership
Other life experienceMedical Student Performance Evaluation (MSPE/Dean's Letter)
Second interview/visitAwards or special honors in medical school
Visa status*Applicant was flagged with Match violation by the NRMP
Graduate of highly‐regarded medical schoolElectives at your fellowship site
Awarded grant money for researchVolunteer/extracurricular experiencesMedical school class ranking/quartile
Lack of gaps in medical educationGrades in medical school
Residency class ranking/quartileFluency in language spoken by your patient population
Gold Humanism Honor Society (GHHS) membershipResidency program size
In‐Training Examination (ITE)Second interview/visit
Having finished another fellowship
NRMP Program Director Survey, Specialties Matching Service, 2016 42

170
180
190
200
210
220
230
240
250
260
Cardiovascular DiseasePrograms That Use USMLE Step 1 and Step 2 Clinical Knowledge (CK) Scores When Considering Which Applicants to Interview
Figure-3
Percentage of Programs That Use USMLE Step 2 (CK) Score
0%
10%
20%
30%
40%
50%
60%
70%
80%
90%
100%
Never Seldom Often
38%
58%
4%
Would your program consider applicants who fail theexam on the first attempt?
0%
10%
20%
30%
40%
50%
60%
70%
80%
90%
100%
Never Seldom often
38%
58%
4%
Would your program consider applicants who failthe exam on the first attempt?
0%
10%
20%
30%
40%
50%
60%
70%
80%
90%
100%
Yes, pass only Yes, target score No
46%
54%
0%
Scores required?
0%
10%
20%
30%
40%
50%
60%
70%
80%
90%
100%
Yes, pass only Yes, target score No
46%54%
0%
Scores required?
N=48
N=48
N=48N=48
N=20N=24 N=18 N=14
IQR* of Average USMLE Step 1 and Step 2 CK Scores Programs Consider When Granting Interviews
Percentage of Programs That Use USMLE Step 1 Score
170
180
190
200
210
220
230
240
250
260
USMLE Step 2 CKUSMLE Step 1 USMLE Step 1 USMLE Step 2 CK
*The boxes in the boxplots represent the interquartile range (or IQR, which is the range between the 25th and 75th percentiles), and the line in the box is the median. The x-shaped symbol is the mean.
Scores Above Which Programs Almost Always Grant Interviews
Scores Below Which Programs Generally Do Not Grant Interviews
NRMP Program Director Survey, Specialties Matching Service, 2016 43

0%
10%
20%
30%
40%
50%
60%
70%
80%
90%
100%
Yes No
100%
0%
USMLE Step 2 CS
0%
10%
20%
30%
40%
50%
60%
70%
80%
90%
100%
Yes, pass only Yes, target score No
35%
52%
13%
USMLE Step 3
0%
10%
20%
30%
40%
50%
60%
70%
80%
90%
100%
Yes, pass only Yes, target score No
45%
32%24%
COMLEX-USA Level 1*
Cardiovascular DiseasePercentage of Programs That Use USMLE Step 2 Clinical Skill (CS), Step 3, and COMLEX-USA Scores* When Considering Which Applicants to Interview
Figure-4
0%
10%
20%
30%
40%
50%
60%
70%
80%
90%
100%
Yes, pass only Yes, target score No
45%
32%24%
COMLEX-USA Level 2-CE*
0%
10%
20%
30%
40%
50%
60%
70%
80%
90%
100%
Yes, pass only Yes, target score No
37% 34%29%
COMLEX-USA Level 3*
0%
10%
20%
30%
40%
50%
60%
70%
80%
90%
100%
Yes, pass only Yes, target score No
54%
22% 24%
COMLEX-USA Level 2-PE*
N=48 N=46
N=38 N=38
N=37 N=35
* Osteopathic applicants only
Percentage of Programs That Use USMLE Step 2 CS and Step 3 Scores
Percentage of Programs That Use COMLEX-USA Level 1 and Level 2-CE Scores
Percentage of Programs That Use COMLEX-USA Level 2-PE and Level 3 Scores
NRMP Program Director Survey, Specialties Matching Service, 2016 44

0%10%20%30%40%50%60%70%80%90%
100%
Never Seldom Often
44%50%
6%
Would your program consider applicants who fail theexam on the first attempt?
0%
10%
20%
30%
40%
50%
60%
70%
80%
90%
100%
Yes, pass only Yes, target score No, not required
23%
8%
69%
Scores required?
N=18
N=26
37.5%Optional
62.5%Required
Program Requirement on Dedicated Time forResearch
N=56
0
1
2
3
4
5
6
Accredited Locally Funded Integrated Other
5
4
3
2
Average Number of Months if Research Time isRequired
N=20 N=9 N=5 N=6
0
2
4
6
8
10
12
Accredited Positions Funded Positions
10.910.3
Average Number of Accredited Positions and Funded Positions
0%
10%
20%
30%
40%
50%
60%
70%
80%
90%
100%
Positions Filled BeforeMatch Day
Positions Offered Outsidethe Match
Positions Filled Outsidethe Match
58%
20%15%
Average Percentage of Accredited Positions Offered Outside ofthe Match
N=56 N=54 N=17 N=9 N=8
Cardiovascular DiseasePrograms That Use Core Specialty Certifying Examination When Considering Applicants for Interview
Figure-5
Cardiovascular DiseasePrograms Positions Figure-6
Cardiovascular DiseaseDedicated Time for Research Figure-7
NRMP Program Director Survey, Specialties Matching Service, 2016 45
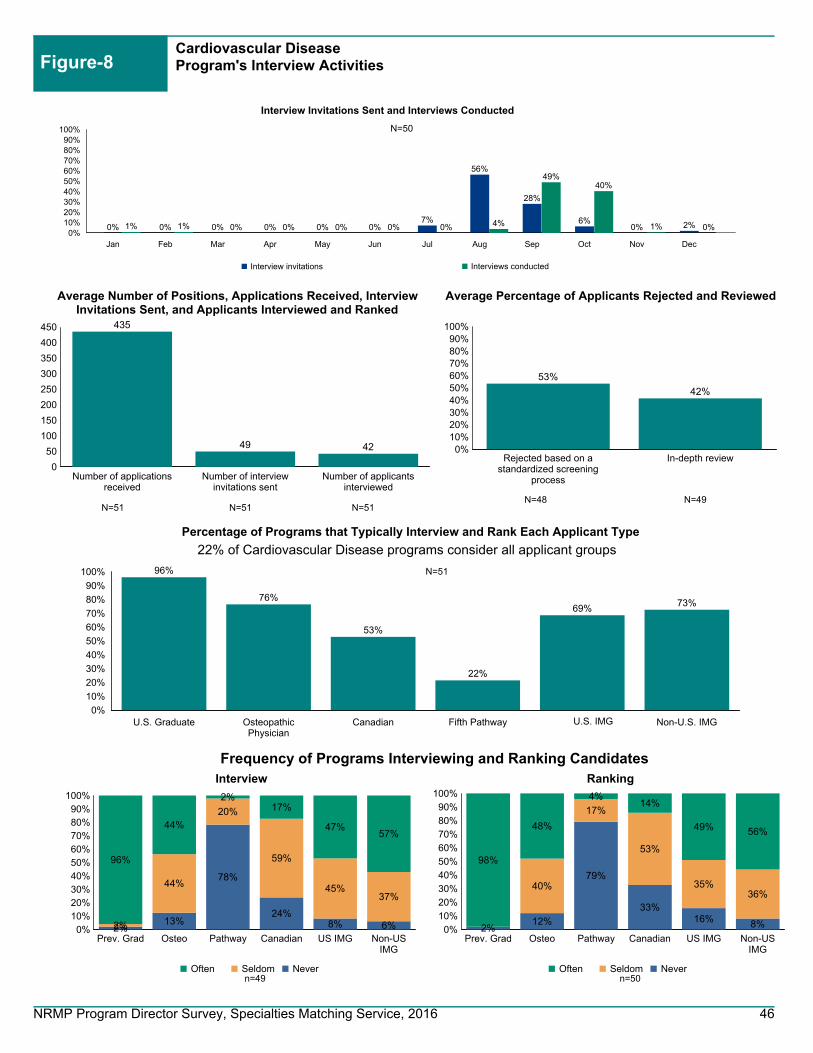
0%
10%
20%
30%
40%
50%
60%
70%
80%
90%
100% 96%
76%
53%
22%
69%73%
U.S. Graduate OsteopathicPhysician
Canadian Fifth Pathway U.S. IMG Non-U.S. IMG
Percentage of Programs that Typically Interview and Rank Each Applicant Type
Figure-8Cardiovascular DiseaseProgram's Interview Activities
0%10%20%30%40%50%60%70%80%90%
100%
Rejected based on astandardized screening
process
In-depth review
53%
42%
Average Percentage of Applicants Rejected and Reviewed
0
50
100
150
200
250
300
350
400
450
Number of applicationsreceived
Number of interviewinvitations sent
Number of applicantsinterviewed
435
49 42
Average Number of Positions, Applications Received, InterviewInvitations Sent, and Applicants Interviewed and Ranked
N=49N=48N=51N=51
N=51
22% of Cardiovascular Disease programs consider all applicant groups
N=51
0%10%20%30%40%50%60%70%80%90%
100%
Prev. Grad Osteo Pathway Canadian US IMG Non-USIMG
2%13%
78%
24%8% 6%2%
44%
20%
59%
45%37%
96%
44%
2%17%
47%57%
Often Seldom Never
Interview
0%10%
20%
30%40%
50%60%
70%80%
90%100%
Prev. Grad Osteo Pathway Canadian US IMG Non-USIMG
2%12%
79%
33%16% 8%
40%
17%
53%
35%36%
98%
48%
4%14%
49% 56%
Often Seldom Never
Ranking
n=50
Frequency of Programs Interviewing and Ranking Candidates
n=49
N=50
0%10%20%30%40%50%60%70%80%90%
100%
Jan Feb Mar Apr May Jun Jul Aug Sep Oct Nov Dec
0% 0% 0% 0% 0% 0%7%
56%
28%
6%0% 2%
Interview invitations
Interview Invitations Sent and Interviews Conducted
1% 1% 0% 0% 0% 0% 0% 4%
49%40%
1% 0%
Interviews conducted
NRMP Program Director Survey, Specialties Matching Service, 2016 46

Figure-9Cardiovascular DiseasePotential Challenges in Recruiting Applicants to Your Specialty
0% 10% 20% 30% 40% 50% 60% 70% 80%
71%
20%
20%
0%
0%
We consider those applicants on an individual basis
We give those applicants serious consideration if they haveshown improvement
We do not usually consider those applicants
We favor those applicants
Other
0 1 2 3 4 5
Not enough applicants in the specialty
Undesirable income potential as a practicing physician
Undesirable work/life balance as a practicing physician
Long or irregular work hours required by specialty
Fellowship Match scheduled at inconvenient time of year
1.4
1.5
2.9
2.8
1.9
Average rating on a scale of 5 (1=least challenging; 5=most challenging)
n=43
16.0%Less than 3
26.0%3 to 5
28.0%6 to 10
10.0%11 to
15
20.0%More than 15
At Any Fellowship Program
21.3%Less than 3
29.8%3 to 529.8%
6 to 10
10.6%11 to 15
8.5%More than 15
At Current Fellowship Program
n=45
n=50 n=47
Cardiovascular DiseaseApplicants Who Applied in the Specialty in the Past But Did Not Match Figure-10
Cardiovascular DiseaseYears as Program Director Figure-11
NRMP Program Director Survey, Specialties Matching Service, 2016 47

Child and Adolescent Psychiatry
NRMP Program Director Survey, Specialties Matching Service, 2016 48
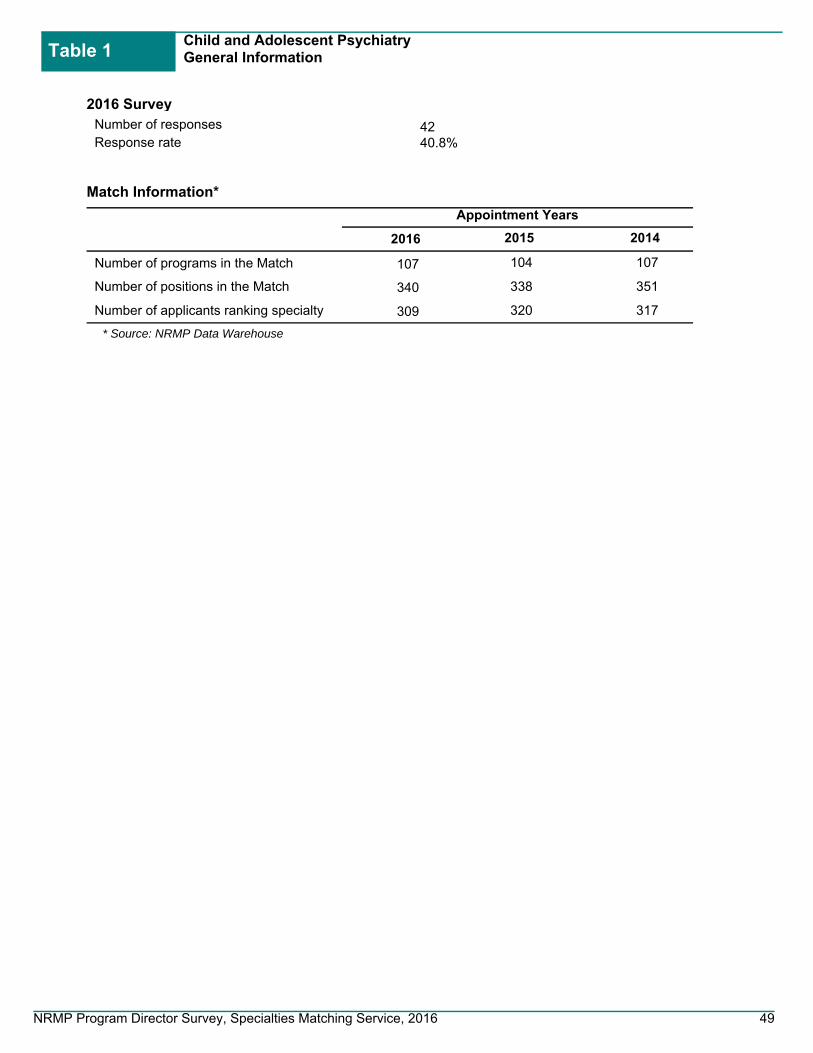
Child and Adolescent PsychiatryGeneral Information
Table 1
107
340
309
Number of programs in the Match
Number of positions in the Match
Number of applicants ranking specialty
40.8%Response rate
Appointment Years
Number of responses 42
Match Information*
* Source: NRMP Data Warehouse
2016 Survey
2016 2015 2014
104
338
320
107
351
317
NRMP Program Director Survey, Specialties Matching Service, 2016 49

Figure-1Child and Adolescent PsychiatryPercentage of Programs Citing Each Factor and Mean Importance Rating¹ for Each Factor in Selecting Applicants to Interview(N=33)
Average RatingPercent Citing Factor
¹ Ratings on a scale from 1 (not at all important) to 5 (very important).* International Medical Graduates only
1 2 3 4 5
4.34.83.63.14.64.24.44.83.23.43.34.14.03.54.13.63.53.43.53.13.13.53.43.93.83.34.03.83.43.33.73.34.83.53.33.73.83.53.03.0
100% 50% 0%
88%79%82%73%88%94%82%85%55%61%55%67%61%61%73%61%79%64%45%33%48%48%48%79%70%42%52%67%39%42%67%45%48%18%52%18%58%12%
6%12%
Letters of recommendation in fellowship specialty
Residency performance evaluation (Program Director letter)
Reputation of residency program
Demonstrated involvement and perceived interest in research
Perceived commitment to specialty
Personal statement
Perceived interest in program
Evidence of professionalism and ethics
USMLE Step 1/COMLEX Level 1 score
Peer reviewed publications/authored textbook chapters
USMLE Step 2 CK/COMLEX Level 2 CE score
Leadership qualities
Personal prior professional knowledge of the applicant
Oral presentations/poster presentations/speaking engagements
Applicant was a resident in a core program at same institution
Pass USMLE Step 2 CS/COMLEX Level 2 PE
Any failed attempt in USMLE/COMLEX
USMLE Step 3/COMLEX Level 3 score
Interest in academic career
Residency program setting (univ.‐based vs. comm.‐based)
Clinical/laboratory research experience
Awards or special honors in medical school
Alpha Omega Alpha (AOA) membership
Other life experience
Medical Student Performance Evaluation (MSPE/Dean's Letter)
Graduate of highly‐regarded medical school
Visa status*
Volunteer/extracurricular experiences
Awarded grant money for research
Grades in medical school
Lack of gaps in medical education
Medical school class ranking/quartile
Applicant was flagged with Match violation by the NRMP
Electives at your fellowship site
Gold Humanism Honor Society (GHHS) membership
Residency class ranking/quartile
Fluency in language spoken by your patient population
In‐Training Examination (ITE)
Residency program size
Having finished another fellowship
NRMP Program Director Survey, Specialties Matching Service, 2016 50

Child and Adolescent PsychiatryPercentage of Programs Citing Each Factor and Mean Importance Rating¹ for Each Factor in Ranking Applicants(N=33)
Figure-2
Average RatingPercent Citing Factor
¹ Ratings on a scale from 1 (not at all important) to 5 (very important).* International Medical Graduates only
1 2 3 4 5
4.94.94.44.94.74.94.53.33.94.74.84.34.34.33.63.84.53.53.73.83.93.33.63.63.73.54.03.93.93.44.24.93.74.03.23.93.63.73.34.03.93.53.03.74.03.3
100% 50% 0%
100%100%69%
100%81%97%81%63%53%63%75%75%56%63%50%38%63%34%34%63%50%38%50%50%19%25%47%50%47%47%38%44%28%13%28%47%28%31%31%16%34%25%3%9%9%9%
Interactions with faculty during interview and visitInterpersonal skills
Letters of recommendation in fellowship specialtyInteractions with house staff during interview and visit
Perceived commitment to specialtyFeedback from current residents and fellows
Perceived interest in programDemonstrated involvement and perceived interest in research
Reputation of residency programResidency performance evaluation (Program Director letter)
Evidence of professionalism and ethicsPersonal statement
Personal prior professional knowledge of the applicantLeadership qualities
Peer reviewed publications/authored textbook chaptersInterest in academic career
Applicant was a resident in a core program at same institutionUSMLE Step 1/COMLEX Level 1 score
USMLE Step 2 CK/COMLEX Level 2 CE scoreAny failed attempt in USMLE/COMLEX
Passing USMLE Step 2 CS/COMLEX Level 2 PEClinical/laboratory research experience
USMLE Step 3/COMLEX Level 3 scoreOral presentations/poster presentations/speaking engagements
Residency program setting (univ.‐based vs. comm.‐based)Alpha Omega Alpha (AOA) membership
Other life experienceMedical Student Performance Evaluation (MSPE/Dean's Letter)
Second interview/visitAwards or special honors in medical school
Visa status*Applicant was flagged with Match violation by the NRMP
Graduate of highly‐regarded medical schoolElectives at your fellowship site
Awarded grant money for researchVolunteer/extracurricular experiencesMedical school class ranking/quartile
Lack of gaps in medical educationGrades in medical school
Residency class ranking/quartileFluency in language spoken by your patient population
Gold Humanism Honor Society (GHHS) membershipResidency program size
In‐Training Examination (ITE)Second interview/visit
Having finished another fellowship
NRMP Program Director Survey, Specialties Matching Service, 2016 51

Child and Adolescent PsychiatryPrograms That Use USMLE Step 1 and Step 2 Clinical Knowledge (CK) Scores When Considering Which Applicants to Interview
Figure-3
Percentage of Programs That Use USMLE Step 2 (CK) Score
0%
10%
20%
30%
40%
50%
60%
70%
80%
90%
100%
Never Seldom Often
3%
45%52%
Would your program consider applicants who fail theexam on the first attempt?
0%
10%
20%
30%
40%
50%
60%
70%
80%
90%
100%
Never Seldom often
3%
48% 48%
Would your program consider applicants who failthe exam on the first attempt?
0%
10%
20%
30%
40%
50%
60%
70%
80%
90%
100%
Yes, pass only Yes, target score No
94%
6%0%
Scores required?
0%
10%
20%
30%
40%
50%
60%
70%
80%
90%
100%
Yes, pass only Yes, target score No
94%
6%0%
Scores required?
N=33
N=33
N=33N=33
IQR* of Average USMLE Step 1 and Step 2 CK Scores Programs Consider When Granting Interviews
Percentage of Programs That Use USMLE Step 1 Score
*The boxes in the boxplots represent the interquartile range (or IQR, which is the range between the 25th and 75th percentiles), and the line in the box is the median. The x-shaped symbol is the mean.
Scores Above Which Programs Almost Always Grant Interviews
Scores Below Which Programs Generally Do Not Grant Interviews
USMLE Step 2 CK not reported
because of low response rate
USMLE Step 1 not reported because of low response
rate
USMLE Step 2 CK not reported
because of low response rate
USMLE Step 1 not reported because of low response
rate
NRMP Program Director Survey, Specialties Matching Service, 2016 52

0%
10%
20%
30%
40%
50%
60%
70%
80%
90%
100%
Yes No
100%
0%
USMLE Step 2 CS
0%
10%
20%
30%
40%
50%
60%
70%
80%
90%
100%
Yes, pass only Yes, target score No
91%
6% 3%
USMLE Step 3
0%
10%
20%
30%
40%
50%
60%
70%
80%
90%
100%
Yes, pass only Yes, target score No
88%
3%9%
COMLEX-USA Level 1*
Child and Adolescent PsychiatryPercentage of Programs That Use USMLE Step 2 Clinical Skill (CS), Step 3, and COMLEX-USA Scores* When Considering Which Applicants to Interview
Figure-4
0%
10%
20%
30%
40%
50%
60%
70%
80%
90%
100%
Yes, pass only Yes, target score No
87%
3%10%
COMLEX-USA Level 2-CE*
0%
10%
20%
30%
40%
50%
60%
70%
80%
90%
100%
Yes, pass only Yes, target score No
84%
3%
13%
COMLEX-USA Level 3*
0%
10%
20%
30%
40%
50%
60%
70%
80%
90%
100%
Yes, pass only Yes, target score No
87%
3%10%
COMLEX-USA Level 2-PE*
N=33 N=33
N=32 N=31
N=31 N=31
* Osteopathic applicants only
Percentage of Programs That Use USMLE Step 2 CS and Step 3 Scores
Percentage of Programs That Use COMLEX-USA Level 1 and Level 2-CE Scores
Percentage of Programs That Use COMLEX-USA Level 2-PE and Level 3 Scores
NRMP Program Director Survey, Specialties Matching Service, 2016 53

0%10%20%30%40%50%60%70%80%90%
100%
Never Seldom Often
0% 0%
100%
Would your program consider applicants who fail theexam on the first attempt?
0%
10%
20%
30%
40%
50%
60%
70%
80%
90%
100%
Yes, pass only Yes, target score No, not required
0% 0%
100%
Scores required?
N=2
N=12
81.0%Optional
19.0%Required
Program Requirement on Dedicated Time forResearch
N=42
0
1
2
3
4
5
6
7
Accredited Locally Funded Integrated Other
1
5
1
7
Average Number of Months if Research Time isRequired
N=1 N=1 N=1 N=4
0
1
2
3
4
5
6
7
Accredited Positions Funded Positions
6.0
5.5
Average Number of Accredited Positions and Funded Positions
0%
10%
20%
30%
40%
50%
60%
70%
80%
90%
100%
Positions Filled BeforeMatch Day
Positions Offered Outsidethe Match
Positions Filled Outsidethe Match
62%
43% 43%
Average Percentage of Accredited Positions Offered Outside ofthe Match
N=40 N=40 N=10 N=11 N=11
Child and Adolescent PsychiatryPrograms That Use Core Specialty Certifying Examination When Considering Applicants for Interview
Figure-5
Child and Adolescent PsychiatryPrograms Positions Figure-6
Child and Adolescent PsychiatryDedicated Time for Research Figure-7
NRMP Program Director Survey, Specialties Matching Service, 2016 54

0%
10%
20%
30%
40%
50%
60%
70%
80%
90%
100% 97% 94%
74%
44%
94%85%
U.S. Graduate OsteopathicPhysician
Canadian Fifth Pathway U.S. IMG Non-U.S. IMG
Percentage of Programs that Typically Interview and Rank Each Applicant Type
Figure-8Child and Adolescent PsychiatryProgram's Interview Activities
0%10%20%30%40%50%60%70%80%90%
100%
Rejected based on astandardized screening
process
In-depth review
23%
84%
Average Percentage of Applicants Rejected and Reviewed
0
5
10
15
20
25
30
35
40
45
50
Number of applicationsreceived
Number of interviewinvitations sent
Number of applicantsinterviewed
46
2318
Average Number of Positions, Applications Received, InterviewInvitations Sent, and Applicants Interviewed and Ranked
N=38N=38N=38N=38
N=34
38% of Child and Adolescent Psychiatry programs consider all applicant groups
N=38
0%10%20%30%40%50%60%70%80%90%
100%
Prev. Grad Osteo Pathway Canadian US IMG Non-USIMG
3%
50%
23%6%
9% 18%
43%
55%
27%33%
88% 82%
7%23%
73%61%
Often Seldom Never
Interview
0%10%
20%
30%40%
50%60%
70%80%
90%100%
Prev. Grad Osteo Pathway Canadian US IMG Non-USIMG
3%
53%
23%12%6% 13%
40%
58%
30%
27%
91% 87%
7%19%
70%61%
Often Seldom Never
Ranking
n=32
Frequency of Programs Interviewing and Ranking Candidates
n=34
N=32
0%10%20%30%40%50%60%70%80%90%
100%
Jan Feb Mar Apr May Jun Jul Aug Sep Oct Nov Dec
3% 0% 0% 0% 0% 0% 3%
21%
43%
25%
5%0%
Interview invitations
Interview Invitations Sent and Interviews Conducted
3% 0% 0% 0% 0% 0% 0% 1%
18%
40%
28%
6%
Interviews conducted
NRMP Program Director Survey, Specialties Matching Service, 2016 55

Figure-9Child and Adolescent PsychiatryPotential Challenges in Recruiting Applicants to Your Specialty
0% 20% 40% 60% 80% 100%
88%
28%
6%
6%
3%
We consider those applicants on an individual basis
We give those applicants serious consideration if they haveshown improvement
We do not usually consider those applicants
We favor those applicants
Other
0 1 2 3 4 5
Not enough applicants in the specialty
Undesirable income potential as a practicing physician
Undesirable work/life balance as a practicing physician
Long or irregular work hours required by specialty
Fellowship Match scheduled at inconvenient time of year
4.5
3.0
2.0
1.8
2.1
Average rating on a scale of 5 (1=least challenging; 5=most challenging)
n=31
17.9%Less than 3
20.5%3 to 5
23.1%6 to 10
17.9%11 to 15
20.5%More than
15
At Any Fellowship Program
28.9%Less than 3
18.4%3 to 5
26.3%6 to 10
13.2%11 to 15
13.2%More than 15
At Current Fellowship Program
n=32
n=39 n=38
Child and Adolescent PsychiatryApplicants Who Applied in the Specialty in the Past But Did Not Match Figure-10
Child and Adolescent PsychiatryYears as Program Director Figure-11
NRMP Program Director Survey, Specialties Matching Service, 2016 56

Colon and Rectal Surgery
NRMP Program Director Survey, Specialties Matching Service, 2016 57

Colon and Rectal SurgeryGeneral Information
Table 1
54
93
110
Number of programs in the Match
Number of positions in the Match
Number of applicants ranking specialty
34.0%Response rate
Appointment Years
Number of responses 18
Match Information*
* Source: NRMP Data Warehouse
2016 Survey
2016 2015 2014
55
93
110
54
92
128
NRMP Program Director Survey, Specialties Matching Service, 2016 58
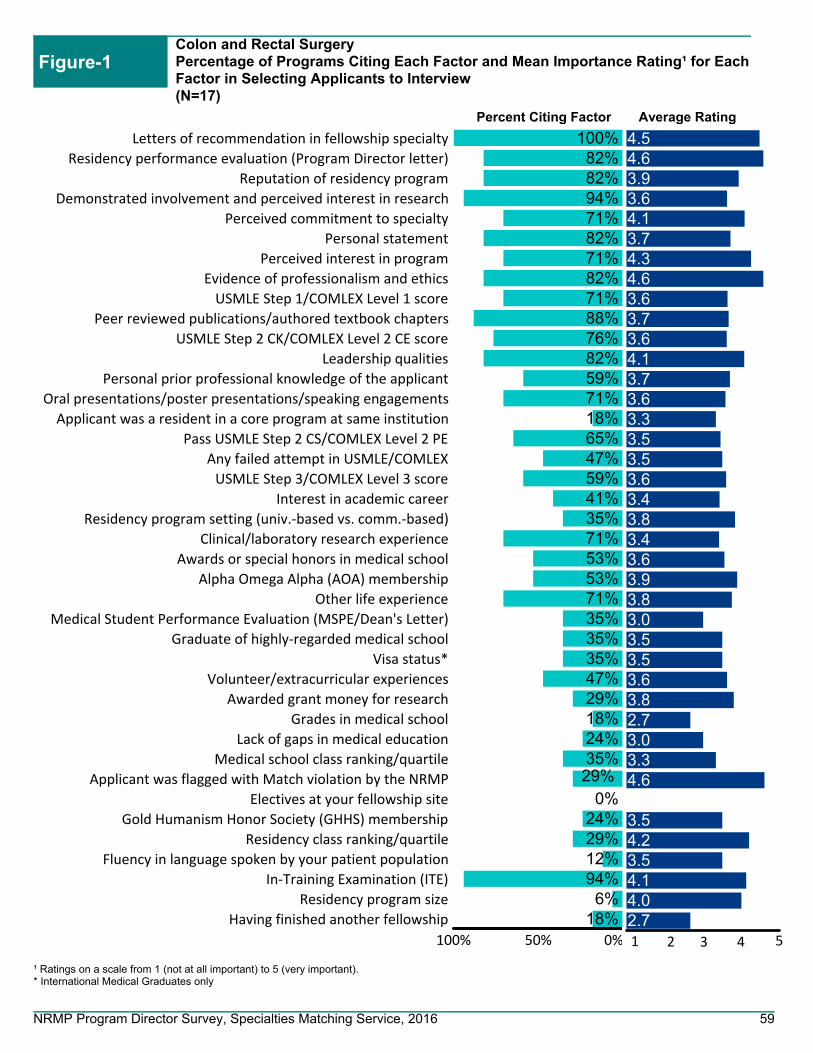
Figure-1Colon and Rectal SurgeryPercentage of Programs Citing Each Factor and Mean Importance Rating¹ for Each Factor in Selecting Applicants to Interview(N=17)
Average RatingPercent Citing Factor
¹ Ratings on a scale from 1 (not at all important) to 5 (very important).* International Medical Graduates only
1 2 3 4 5
4.54.63.93.64.13.74.34.63.63.73.64.13.73.63.33.53.53.63.43.83.43.63.93.83.03.53.53.63.82.73.03.34.6
3.54.23.54.14.02.7
100% 50% 0%
100%82%82%94%71%82%71%82%71%88%76%82%59%71%18%65%47%59%41%35%71%53%53%71%35%35%35%47%29%18%24%35%29%
0%24%29%12%94%
6%18%
Letters of recommendation in fellowship specialty
Residency performance evaluation (Program Director letter)
Reputation of residency program
Demonstrated involvement and perceived interest in research
Perceived commitment to specialty
Personal statement
Perceived interest in program
Evidence of professionalism and ethics
USMLE Step 1/COMLEX Level 1 score
Peer reviewed publications/authored textbook chapters
USMLE Step 2 CK/COMLEX Level 2 CE score
Leadership qualities
Personal prior professional knowledge of the applicant
Oral presentations/poster presentations/speaking engagements
Applicant was a resident in a core program at same institution
Pass USMLE Step 2 CS/COMLEX Level 2 PE
Any failed attempt in USMLE/COMLEX
USMLE Step 3/COMLEX Level 3 score
Interest in academic career
Residency program setting (univ.‐based vs. comm.‐based)
Clinical/laboratory research experience
Awards or special honors in medical school
Alpha Omega Alpha (AOA) membership
Other life experience
Medical Student Performance Evaluation (MSPE/Dean's Letter)
Graduate of highly‐regarded medical school
Visa status*
Volunteer/extracurricular experiences
Awarded grant money for research
Grades in medical school
Lack of gaps in medical education
Medical school class ranking/quartile
Applicant was flagged with Match violation by the NRMP
Electives at your fellowship site
Gold Humanism Honor Society (GHHS) membership
Residency class ranking/quartile
Fluency in language spoken by your patient population
In‐Training Examination (ITE)
Residency program size
Having finished another fellowship
NRMP Program Director Survey, Specialties Matching Service, 2016 59

Colon and Rectal SurgeryPercentage of Programs Citing Each Factor and Mean Importance Rating¹ for Each Factor in Ranking Applicants(N=17)
Figure-2
Average RatingPercent Citing Factor
¹ Ratings on a scale from 1 (not at all important) to 5 (very important).* International Medical Graduates only
1 2 3 4 5
4.84.84.34.64.14.44.43.63.74.14.53.54.14.33.63.5
4.04.04.24.04.03.53.82.54.74.22.74.33.54.05.04.05.04.04.54.04.5
4.54.05.0
4.03.52.0
100% 50% 0%
100%94%81%94%50%63%56%50%63%56%50%50%44%38%31%13%0%
25%25%31%19%13%25%25%13%19%31%19%19%25%25%19%13%6%
13%25%6%
13%0%
13%6%6%0%
69%13%6%
Interactions with faculty during interview and visitInterpersonal skills
Letters of recommendation in fellowship specialtyInteractions with house staff during interview and visit
Perceived commitment to specialtyFeedback from current residents and fellows
Perceived interest in programDemonstrated involvement and perceived interest in research
Reputation of residency programResidency performance evaluation (Program Director letter)
Evidence of professionalism and ethicsPersonal statement
Personal prior professional knowledge of the applicantLeadership qualities
Peer reviewed publications/authored textbook chaptersInterest in academic career
Applicant was a resident in a core program at same institutionUSMLE Step 1/COMLEX Level 1 score
USMLE Step 2 CK/COMLEX Level 2 CE scoreAny failed attempt in USMLE/COMLEX
Passing USMLE Step 2 CS/COMLEX Level 2 PEClinical/laboratory research experience
USMLE Step 3/COMLEX Level 3 scoreOral presentations/poster presentations/speaking engagements
Residency program setting (univ.‐based vs. comm.‐based)Alpha Omega Alpha (AOA) membership
Other life experienceMedical Student Performance Evaluation (MSPE/Dean's Letter)
Second interview/visitAwards or special honors in medical school
Visa status*Applicant was flagged with Match violation by the NRMP
Graduate of highly‐regarded medical schoolElectives at your fellowship site
Awarded grant money for researchVolunteer/extracurricular experiencesMedical school class ranking/quartile
Lack of gaps in medical educationGrades in medical school
Residency class ranking/quartileFluency in language spoken by your patient population
Gold Humanism Honor Society (GHHS) membershipResidency program size
In‐Training Examination (ITE)Second interview/visit
Having finished another fellowship
NRMP Program Director Survey, Specialties Matching Service, 2016 60
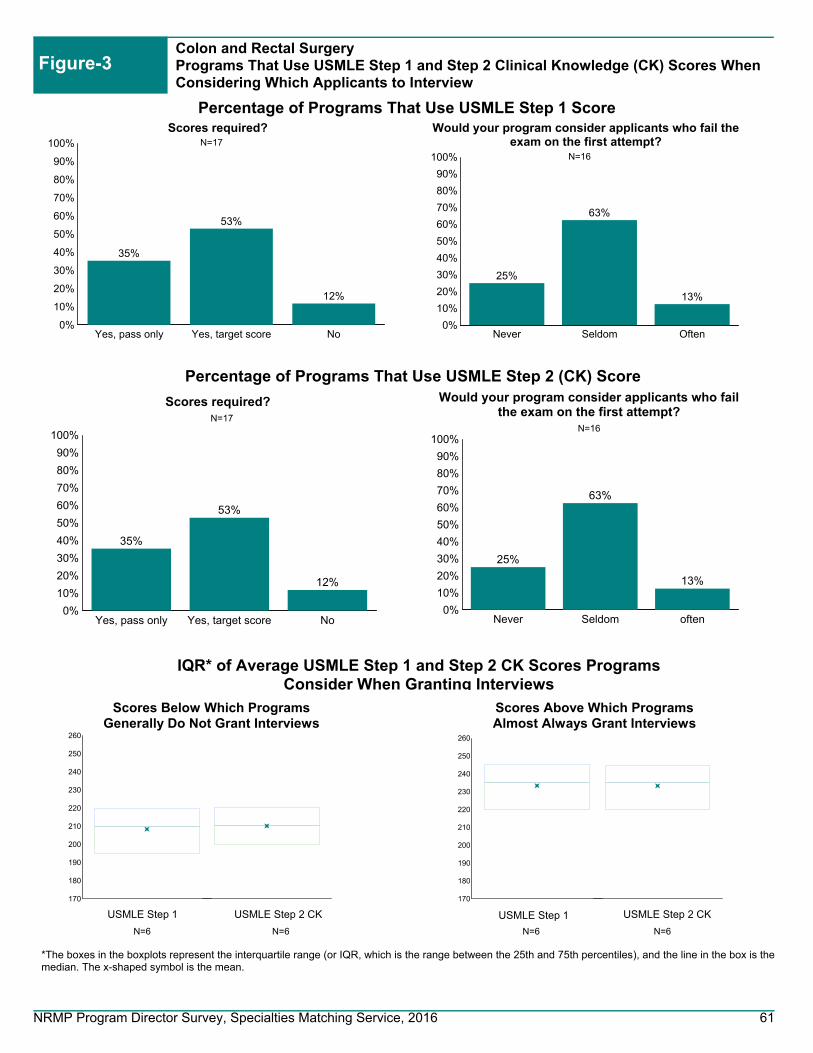
170
180
190
200
210
220
230
240
250
260
Colon and Rectal SurgeryPrograms That Use USMLE Step 1 and Step 2 Clinical Knowledge (CK) Scores When Considering Which Applicants to Interview
Figure-3
Percentage of Programs That Use USMLE Step 2 (CK) Score
0%
10%
20%
30%
40%
50%
60%
70%
80%
90%
100%
Never Seldom Often
25%
63%
13%
Would your program consider applicants who fail theexam on the first attempt?
0%
10%
20%
30%
40%
50%
60%
70%
80%
90%
100%
Never Seldom often
25%
63%
13%
Would your program consider applicants who failthe exam on the first attempt?
0%
10%
20%
30%
40%
50%
60%
70%
80%
90%
100%
Yes, pass only Yes, target score No
35%
53%
12%
Scores required?
0%
10%
20%
30%
40%
50%
60%
70%
80%
90%
100%
Yes, pass only Yes, target score No
35%
53%
12%
Scores required?
N=17
N=16
N=17N=16
N=6N=6 N=6 N=6
IQR* of Average USMLE Step 1 and Step 2 CK Scores Programs Consider When Granting Interviews
Percentage of Programs That Use USMLE Step 1 Score
170
180
190
200
210
220
230
240
250
260
USMLE Step 2 CKUSMLE Step 1 USMLE Step 1 USMLE Step 2 CK
*The boxes in the boxplots represent the interquartile range (or IQR, which is the range between the 25th and 75th percentiles), and the line in the box is the median. The x-shaped symbol is the mean.
Scores Above Which Programs Almost Always Grant Interviews
Scores Below Which Programs Generally Do Not Grant Interviews
NRMP Program Director Survey, Specialties Matching Service, 2016 61

0%
10%
20%
30%
40%
50%
60%
70%
80%
90%
100%
Yes No
88%
12%
USMLE Step 2 CS
0%
10%
20%
30%
40%
50%
60%
70%
80%
90%
100%
Yes, pass only Yes, target score No
47%41%
12%
USMLE Step 3
0%
10%
20%
30%
40%
50%
60%
70%
80%
90%
100%
Yes, pass only Yes, target score No
40%
10%
50%
COMLEX-USA Level 1*
Colon and Rectal SurgeryPercentage of Programs That Use USMLE Step 2 Clinical Skill (CS), Step 3, and COMLEX-USA Scores* When Considering Which Applicants to Interview
Figure-4
0%
10%
20%
30%
40%
50%
60%
70%
80%
90%
100%
Yes, pass only Yes, target score No
40%
10%
50%
COMLEX-USA Level 2-CE*
0%
10%
20%
30%
40%
50%
60%
70%
80%
90%
100%
Yes, pass only Yes, target score No
40%
10%
50%
COMLEX-USA Level 3*
0%
10%
20%
30%
40%
50%
60%
70%
80%
90%
100%
Yes, pass only Yes, target score No
40%
10%
50%
COMLEX-USA Level 2-PE*
N=17 N=17
N=10 N=10
N=10 N=10
* Osteopathic applicants only
Percentage of Programs That Use USMLE Step 2 CS and Step 3 Scores
Percentage of Programs That Use COMLEX-USA Level 1 and Level 2-CE Scores
Percentage of Programs That Use COMLEX-USA Level 2-PE and Level 3 Scores
NRMP Program Director Survey, Specialties Matching Service, 2016 62

0%10%20%30%40%50%60%70%80%90%
100%
Never Seldom Often
20%
60%
20%
Would your program consider applicants who fail theexam on the first attempt?
0%
10%
20%
30%
40%
50%
60%
70%
80%
90%
100%
Yes, pass only Yes, target score No, not required
29% 29%
43%
Scores required?
N=5
N=7
83.3%Optional
16.7%Required
Program Requirement on Dedicated Time forResearch
N=18
0
2
4
6
8
10
12
Accredited Locally Funded Integrated Other
12
8
Average Number of Months if Research Time isRequired
N=0 N=1 N=2 N=0
0.0
0.2
0.4
0.6
0.8
1.0
1.2
1.4
1.6
1.8
Accredited Positions Funded Positions
1.6
1.5
Average Number of Accredited Positions and Funded Positions
0%
10%
20%
30%
40%
50%
60%
70%
80%
90%
100%
Positions Filled BeforeMatch Day
Positions Offered Outsidethe Match
Positions Filled Outsidethe Match
83%
61% 61%
Average Percentage of Accredited Positions Offered Outside ofthe Match
N=17 N=16 N=3 N=4 N=3
Colon and Rectal SurgeryPrograms That Use Core Specialty Certifying Examination When Considering Applicants for Interview
Figure-5
Colon and Rectal SurgeryPrograms Positions Figure-6
Colon and Rectal SurgeryDedicated Time for Research Figure-7
NRMP Program Director Survey, Specialties Matching Service, 2016 63
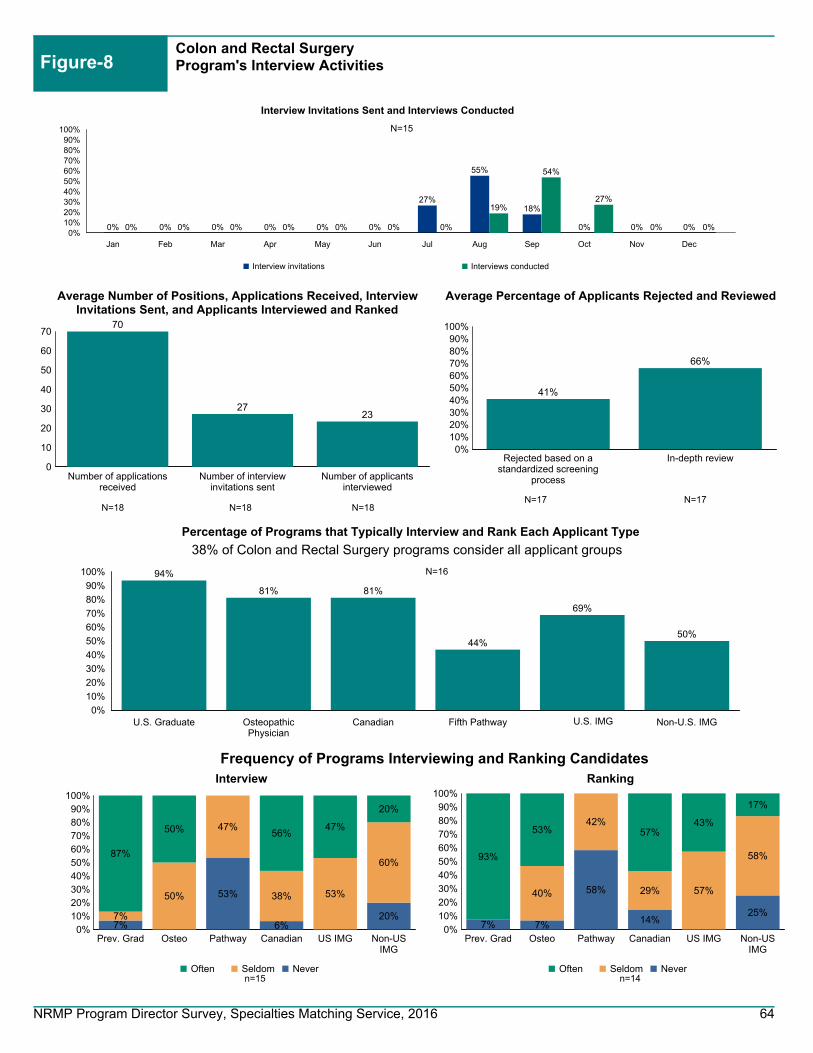
0%
10%
20%
30%
40%
50%
60%
70%
80%
90%
100% 94%
81% 81%
44%
69%
50%
U.S. Graduate OsteopathicPhysician
Canadian Fifth Pathway U.S. IMG Non-U.S. IMG
Percentage of Programs that Typically Interview and Rank Each Applicant Type
Figure-8Colon and Rectal SurgeryProgram's Interview Activities
0%10%20%30%40%50%60%70%80%90%
100%
Rejected based on astandardized screening
process
In-depth review
41%
66%
Average Percentage of Applicants Rejected and Reviewed
0
10
20
30
40
50
60
70
Number of applicationsreceived
Number of interviewinvitations sent
Number of applicantsinterviewed
70
2723
Average Number of Positions, Applications Received, InterviewInvitations Sent, and Applicants Interviewed and Ranked
N=17N=17N=18N=18
N=16
38% of Colon and Rectal Surgery programs consider all applicant groups
N=18
0%10%20%30%40%50%60%70%80%90%
100%
Prev. Grad Osteo Pathway Canadian US IMG Non-USIMG
7%
53%
6%20%7%
50%
47%
38% 53%
60%87%
50% 56%47%
20%
Often Seldom Never
Interview
0%10%
20%
30%40%
50%60%
70%80%
90%100%
Prev. Grad Osteo Pathway Canadian US IMG Non-USIMG
7% 7%
58%
14%25%
40%
42%
29% 57%
58%93%
53% 57%43%
17%
Often Seldom Never
Ranking
n=14
Frequency of Programs Interviewing and Ranking Candidates
n=15
N=15
0%10%20%30%40%50%60%70%80%90%
100%
Jan Feb Mar Apr May Jun Jul Aug Sep Oct Nov Dec
0% 0% 0% 0% 0% 0%
27%
55%
18%
0% 0% 0%
Interview invitations
Interview Invitations Sent and Interviews Conducted
0% 0% 0% 0% 0% 0% 0%
19%
54%
27%
0% 0%
Interviews conducted
NRMP Program Director Survey, Specialties Matching Service, 2016 64

Figure-9Colon and Rectal SurgeryPotential Challenges in Recruiting Applicants to Your Specialty
0% 20% 40% 60% 80% 100%
87%
33%
0%
0%
0%
We consider those applicants on an individual basis
We give those applicants serious consideration if they haveshown improvement
We do not usually consider those applicants
We favor those applicants
Other
0 1 2 3 4 5
Not enough applicants in the specialty
Undesirable income potential as a practicing physician
Undesirable work/life balance as a practicing physician
Long or irregular work hours required by specialty
Fellowship Match scheduled at inconvenient time of year
2.0
1.9
2.1
2.5
2.1
Average rating on a scale of 5 (1=least challenging; 5=most challenging)
n=15
8.3%Less than 3
8.3%3 to 5
50.0%6 to 10
8.3%11 to 15
25.0%More than
15
At Any Fellowship Program
8.3%Less than 3
8.3%3 to 5
58.3%6 to 10
8.3%11 to 15
16.7%More than 15
At Current Fellowship Program
n=15
n=12 n=12
Colon and Rectal SurgeryApplicants Who Applied in the Specialty in the Past But Did Not Match Figure-10
Colon and Rectal SurgeryYears as Program Director Figure-11
NRMP Program Director Survey, Specialties Matching Service, 2016 65

Developmental-Behavioral Pediatrics
NRMP Program Director Survey, Specialties Matching Service, 2016 66

Developmental-Behavioral PediatricsGeneral Information
Table 1
36
48
28
Number of programs in the Match
Number of positions in the Match
Number of applicants ranking specialty
47.1%Response rate
Appointment Years
Number of responses 16
Match Information*
* Source: NRMP Data Warehouse
2016 Survey
2016 2015 2014
33
41
38
29
38
28
NRMP Program Director Survey, Specialties Matching Service, 2016 67

Figure-1Developmental-Behavioral PediatricsPercentage of Programs Citing Each Factor and Mean Importance Rating¹ for Each Factor in Selecting Applicants to Interview(N=14)
Average RatingPercent Citing Factor
¹ Ratings on a scale from 1 (not at all important) to 5 (very important).* International Medical Graduates only
1 2 3 4 5
4.74.83.53.84.84.54.55.03.43.73.64.74.03.53.93.63.93.94.33.83.73.93.63.83.33.54.53.73.73.44.03.45.03.74.04.03.43.02.03.0
100% 50% 0%
86%86%93%79%93%
100%93%86%57%79%50%93%79%71%71%50%57%50%71%29%64%64%50%64%64%71%79%79%50%50%14%50%21%50%36%21%50%
7%7%7%
Letters of recommendation in fellowship specialty
Residency performance evaluation (Program Director letter)
Reputation of residency program
Demonstrated involvement and perceived interest in research
Perceived commitment to specialty
Personal statement
Perceived interest in program
Evidence of professionalism and ethics
USMLE Step 1/COMLEX Level 1 score
Peer reviewed publications/authored textbook chapters
USMLE Step 2 CK/COMLEX Level 2 CE score
Leadership qualities
Personal prior professional knowledge of the applicant
Oral presentations/poster presentations/speaking engagements
Applicant was a resident in a core program at same institution
Pass USMLE Step 2 CS/COMLEX Level 2 PE
Any failed attempt in USMLE/COMLEX
USMLE Step 3/COMLEX Level 3 score
Interest in academic career
Residency program setting (univ.‐based vs. comm.‐based)
Clinical/laboratory research experience
Awards or special honors in medical school
Alpha Omega Alpha (AOA) membership
Other life experience
Medical Student Performance Evaluation (MSPE/Dean's Letter)
Graduate of highly‐regarded medical school
Visa status*
Volunteer/extracurricular experiences
Awarded grant money for research
Grades in medical school
Lack of gaps in medical education
Medical school class ranking/quartile
Applicant was flagged with Match violation by the NRMP
Electives at your fellowship site
Gold Humanism Honor Society (GHHS) membership
Residency class ranking/quartile
Fluency in language spoken by your patient population
In‐Training Examination (ITE)
Residency program size
Having finished another fellowship
NRMP Program Director Survey, Specialties Matching Service, 2016 68

Developmental-Behavioral PediatricsPercentage of Programs Citing Each Factor and Mean Importance Rating¹ for Each Factor in Ranking Applicants(N=14)
Figure-2
Average RatingPercent Citing Factor
¹ Ratings on a scale from 1 (not at all important) to 5 (very important).* International Medical Graduates only
1 2 3 4 5
4.94.94.74.54.94.44.74.23.44.94.94.54.04.94.04.54.03.83.84.73.64.03.93.83.04.04.03.74.04.04.55.03.73.74.33.94.05.03.73.83.64.0
4.0
4.0100% 50% 0%
93%86%93%79%86%79%79%86%71%64%86%71%50%79%57%71%57%36%43%43%50%50%50%50%7%
43%64%43%29%29%43%21%50%43%43%57%21%7%
50%29%50%36%0%7%0%7%
Interactions with faculty during interview and visitInterpersonal skills
Letters of recommendation in fellowship specialtyInteractions with house staff during interview and visit
Perceived commitment to specialtyFeedback from current residents and fellows
Perceived interest in programDemonstrated involvement and perceived interest in research
Reputation of residency programResidency performance evaluation (Program Director letter)
Evidence of professionalism and ethicsPersonal statement
Personal prior professional knowledge of the applicantLeadership qualities
Peer reviewed publications/authored textbook chaptersInterest in academic career
Applicant was a resident in a core program at same institutionUSMLE Step 1/COMLEX Level 1 score
USMLE Step 2 CK/COMLEX Level 2 CE scoreAny failed attempt in USMLE/COMLEX
Passing USMLE Step 2 CS/COMLEX Level 2 PEClinical/laboratory research experience
USMLE Step 3/COMLEX Level 3 scoreOral presentations/poster presentations/speaking engagements
Residency program setting (univ.‐based vs. comm.‐based)Alpha Omega Alpha (AOA) membership
Other life experienceMedical Student Performance Evaluation (MSPE/Dean's Letter)
Second interview/visitAwards or special honors in medical school
Visa status*Applicant was flagged with Match violation by the NRMP
Graduate of highly‐regarded medical schoolElectives at your fellowship site
Awarded grant money for researchVolunteer/extracurricular experiencesMedical school class ranking/quartile
Lack of gaps in medical educationGrades in medical school
Residency class ranking/quartileFluency in language spoken by your patient population
Gold Humanism Honor Society (GHHS) membershipResidency program size
In‐Training Examination (ITE)Second interview/visit
Having finished another fellowship
NRMP Program Director Survey, Specialties Matching Service, 2016 69

Developmental-Behavioral PediatricsPrograms That Use USMLE Step 1 and Step 2 Clinical Knowledge (CK) Scores When Considering Which Applicants to Interview
Figure-3
Percentage of Programs That Use USMLE Step 2 (CK) Score
0%
10%
20%
30%
40%
50%
60%
70%
80%
90%
100%
Never Seldom Often
7%
86%
7%
Would your program consider applicants who fail theexam on the first attempt?
0%
10%
20%
30%
40%
50%
60%
70%
80%
90%
100%
Never Seldom often
14%
79%
7%
Would your program consider applicants who failthe exam on the first attempt?
0%
10%
20%
30%
40%
50%
60%
70%
80%
90%
100%
Yes, pass only Yes, target score No
77%
15%8%
Scores required?
0%
10%
20%
30%
40%
50%
60%
70%
80%
90%
100%
Yes, pass only Yes, target score No
77%
15%8%
Scores required?
N=13
N=14
N=13N=14
IQR* of Average USMLE Step 1 and Step 2 CK Scores Programs Consider When Granting Interviews
Percentage of Programs That Use USMLE Step 1 Score
*The boxes in the boxplots represent the interquartile range (or IQR, which is the range between the 25th and 75th percentiles), and the line in the box is the median. The x-shaped symbol is the mean.
Scores Above Which Programs Almost Always Grant Interviews
Scores Below Which Programs Generally Do Not Grant Interviews
USMLE Step 2 CK not reported
because of low response rate
USMLE Step 1 not reported because of low response
rate
USMLE Step 2 CK not reported
because of low response rate
USMLE Step 1 not reported because of low response
rate
NRMP Program Director Survey, Specialties Matching Service, 2016 70

0%
10%
20%
30%
40%
50%
60%
70%
80%
90%
100%
Yes No
92%
8%
USMLE Step 2 CS
0%
10%
20%
30%
40%
50%
60%
70%
80%
90%
100%
Yes, pass only Yes, target score No
77%
15%8%
USMLE Step 3
0%
10%
20%
30%
40%
50%
60%
70%
80%
90%
100%
Yes, pass only Yes, target score No
67%
17% 17%
COMLEX-USA Level 1*
Developmental-Behavioral PediatricsPercentage of Programs That Use USMLE Step 2 Clinical Skill (CS), Step 3, and COMLEX-USA Scores* When Considering Which Applicants to Interview
Figure-4
0%
10%
20%
30%
40%
50%
60%
70%
80%
90%
100%
Yes, pass only Yes, target score No
75%
8%
17%
COMLEX-USA Level 2-CE*
0%
10%
20%
30%
40%
50%
60%
70%
80%
90%
100%
Yes, pass only Yes, target score No
67%
17% 17%
COMLEX-USA Level 3*
0%
10%
20%
30%
40%
50%
60%
70%
80%
90%
100%
Yes, pass only Yes, target score No
75%
8%
17%
COMLEX-USA Level 2-PE*
N=13 N=13
N=12 N=12
N=12 N=12
* Osteopathic applicants only
Percentage of Programs That Use USMLE Step 2 CS and Step 3 Scores
Percentage of Programs That Use COMLEX-USA Level 1 and Level 2-CE Scores
Percentage of Programs That Use COMLEX-USA Level 2-PE and Level 3 Scores
NRMP Program Director Survey, Specialties Matching Service, 2016 71

0%10%20%30%40%50%60%70%80%90%
100%
Never Seldom Often
17%
83%
0%
Would your program consider applicants who fail theexam on the first attempt?
0%
10%
20%
30%
40%
50%
60%
70%
80%
90%
100%
Yes, pass only Yes, target score No, not required
0% 0%
100%
Scores required?
N=6
N=8
6.3%Optional
93.8%Required
Program Requirement on Dedicated Time forResearch
N=16
0
4
8
12
16
20
24
Accredited Locally Funded Integrated Other
15
21
12
14
Average Number of Months if Research Time isRequired
N=3 N=4 N=2 N=1
0.0
0.5
1.0
1.5
2.0
2.5
3.0
3.5
4.0
Accredited Positions Funded Positions
3.6
2.6
Average Number of Accredited Positions and Funded Positions
0%
10%
20%
30%
40%
50%
60%
70%
80%
90%
100%
Positions Filled BeforeMatch Day
Positions Offered Outsidethe Match
Positions Filled Outsidethe Match
58%
Average Percentage of Accredited Positions Offered Outside ofthe Match
N=16 N=16 N=2 N=0 N=0
Developmental-Behavioral PediatricsPrograms That Use Core Specialty Certifying Examination When Considering Applicants for Interview
Figure-5
Developmental-Behavioral PediatricsPrograms Positions Figure-6
Developmental-Behavioral PediatricsDedicated Time for Research Figure-7
NRMP Program Director Survey, Specialties Matching Service, 2016 72

0%
10%
20%
30%
40%
50%
60%
70%
80%
90%
100%100% 100%
54%
23%
69%
38%
U.S. Graduate OsteopathicPhysician
Canadian Fifth Pathway U.S. IMG Non-U.S. IMG
Percentage of Programs that Typically Interview and Rank Each Applicant Type
Figure-8Developmental-Behavioral PediatricsProgram's Interview Activities
0%10%20%30%40%50%60%70%80%90%
100%
Rejected based on astandardized screening
process
In-depth review
14%
88%
Average Percentage of Applicants Rejected and Reviewed
0
2
4
6
8
10
Number of applicationsreceived
Number of interviewinvitations sent
Number of applicantsinterviewed
8
65
Average Number of Positions, Applications Received, InterviewInvitations Sent, and Applicants Interviewed and Ranked
N=14N=14N=14N=14
N=13
15% of Developmental-Behavioral Pediatrics programs consider all applicant groups
N=14
0%10%20%30%40%50%60%70%80%90%
100%
Prev. Grad Osteo Pathway Canadian US IMG Non-USIMG
14%
85%
54%
29%46%
21%
15%
31%
21%
23%86% 79%
15%
50%31%
Often Seldom Never
Interview
0%10%
20%
30%40%
50%60%
70%80%
90%100%
Prev. Grad Osteo Pathway Canadian US IMG Non-USIMG
14%
83%
58%
23%
50%
21%
17%
25%
31%
17%86% 79%
17%
46%33%
Often Seldom Never
Ranking
n=14
Frequency of Programs Interviewing and Ranking Candidates
n=14
N=14
0%10%20%30%40%50%60%70%80%90%
100%
Jan Feb Mar Apr May Jun Jul Aug Sep Oct Nov Dec
0% 0% 0% 0% 0%7% 5%
34%40%
9%4% 1%
Interview invitations
Interview Invitations Sent and Interviews Conducted
0% 0% 0% 0% 0% 0% 0%7%
23%
54%
8%1%
Interviews conducted
NRMP Program Director Survey, Specialties Matching Service, 2016 73

Figure-9Developmental-Behavioral PediatricsPotential Challenges in Recruiting Applicants to Your Specialty
0% 20% 40% 60% 80% 100%
100%
7%
0%
0%
0%
We consider those applicants on an individual basis
We give those applicants serious consideration if they haveshown improvement
We do not usually consider those applicants
We favor those applicants
Other
0 1 2 3 4 5
Not enough applicants in the specialty
Undesirable income potential as a practicing physician
Undesirable work/life balance as a practicing physician
Long or irregular work hours required by specialty
Fellowship Match scheduled at inconvenient time of year
4.7
4.2
2.2
1.4
1.4
Average rating on a scale of 5 (1=least challenging; 5=most challenging)
n=14
20.0%Less than 3
6.7%3 to 5
26.7%6 to 1020.0%
11 to 15
26.7%More than 15
At Any Fellowship Program
20.0%Less than 3
20.0%3 to 5
33.3%6 to 10
26.7%11 to 15
At Current Fellowship Program
n=14
n=15 n=15
Developmental-Behavioral PediatricsApplicants Who Applied in the Specialty in the Past But Did Not Match Figure-10
Developmental-Behavioral PediatricsYears as Program Director Figure-11
NRMP Program Director Survey, Specialties Matching Service, 2016 74
Endocrinology, Diabetes, and Metabolism
NRMP Program Director Survey, Specialties Matching Service, 2016 75

Endocrinology, Diabetes, and MetabolismGeneral Information
Table 1
136
270
325
Number of programs in the Match
Number of positions in the Match
Number of applicants ranking specialty
41.8%Response rate
Appointment Years
Number of responses 51
Match Information*
* Source: NRMP Data Warehouse
2016 Survey
2016 2015 2014
134
271
324
128
261
306
NRMP Program Director Survey, Specialties Matching Service, 2016 76

Figure-1Endocrinology, Diabetes, and MetabolismPercentage of Programs Citing Each Factor and Mean Importance Rating¹ for Each Factor in Selecting Applicants to Interview(N=45)
Average RatingPercent Citing Factor
¹ Ratings on a scale from 1 (not at all important) to 5 (very important).* International Medical Graduates only
1 2 3 4 5
4.34.74.24.24.53.94.44.64.04.34.04.24.33.94.24.04.44.14.23.84.23.44.03.63.74.34.23.44.13.63.53.44.83.73.34.33.83.03.22.9
100% 50% 0%
87%78%84%89%82%80%76%67%69%87%71%62%78%82%82%60%80%62%60%71%58%64%62%42%58%62%73%47%44%51%44%47%36%51%31%29%22%
9%20%16%
Letters of recommendation in fellowship specialty
Residency performance evaluation (Program Director letter)
Reputation of residency program
Demonstrated involvement and perceived interest in research
Perceived commitment to specialty
Personal statement
Perceived interest in program
Evidence of professionalism and ethics
USMLE Step 1/COMLEX Level 1 score
Peer reviewed publications/authored textbook chapters
USMLE Step 2 CK/COMLEX Level 2 CE score
Leadership qualities
Personal prior professional knowledge of the applicant
Oral presentations/poster presentations/speaking engagements
Applicant was a resident in a core program at same institution
Pass USMLE Step 2 CS/COMLEX Level 2 PE
Any failed attempt in USMLE/COMLEX
USMLE Step 3/COMLEX Level 3 score
Interest in academic career
Residency program setting (univ.‐based vs. comm.‐based)
Clinical/laboratory research experience
Awards or special honors in medical school
Alpha Omega Alpha (AOA) membership
Other life experience
Medical Student Performance Evaluation (MSPE/Dean's Letter)
Graduate of highly‐regarded medical school
Visa status*
Volunteer/extracurricular experiences
Awarded grant money for research
Grades in medical school
Lack of gaps in medical education
Medical school class ranking/quartile
Applicant was flagged with Match violation by the NRMP
Electives at your fellowship site
Gold Humanism Honor Society (GHHS) membership
Residency class ranking/quartile
Fluency in language spoken by your patient population
In‐Training Examination (ITE)
Residency program size
Having finished another fellowship
NRMP Program Director Survey, Specialties Matching Service, 2016 77

Endocrinology, Diabetes, and MetabolismPercentage of Programs Citing Each Factor and Mean Importance Rating¹ for Each Factor in Ranking Applicants(N=45)
Figure-2
Average RatingPercent Citing Factor
¹ Ratings on a scale from 1 (not at all important) to 5 (very important).* International Medical Graduates only
1 2 3 4 5
4.94.94.54.84.74.84.64.24.34.54.73.94.34.44.04.54.33.93.94.43.84.24.03.94.04.63.53.73.83.84.24.84.24.23.83.93.33.73.84.33.94.63.03.05.02.8
100% 50% 0%
93%93%73%78%76%71%93%88%68%71%76%68%68%63%63%61%73%51%59%44%46%56%44%54%59%29%32%39%32%34%49%37%37%34%32%17%32%27%17%20%24%15%17%5%5%
10%
Interactions with faculty during interview and visitInterpersonal skills
Letters of recommendation in fellowship specialtyInteractions with house staff during interview and visit
Perceived commitment to specialtyFeedback from current residents and fellows
Perceived interest in programDemonstrated involvement and perceived interest in research
Reputation of residency programResidency performance evaluation (Program Director letter)
Evidence of professionalism and ethicsPersonal statement
Personal prior professional knowledge of the applicantLeadership qualities
Peer reviewed publications/authored textbook chaptersInterest in academic career
Applicant was a resident in a core program at same institutionUSMLE Step 1/COMLEX Level 1 score
USMLE Step 2 CK/COMLEX Level 2 CE scoreAny failed attempt in USMLE/COMLEX
Passing USMLE Step 2 CS/COMLEX Level 2 PEClinical/laboratory research experience
USMLE Step 3/COMLEX Level 3 scoreOral presentations/poster presentations/speaking engagements
Residency program setting (univ.‐based vs. comm.‐based)Alpha Omega Alpha (AOA) membership
Other life experienceMedical Student Performance Evaluation (MSPE/Dean's Letter)
Second interview/visitAwards or special honors in medical school
Visa status*Applicant was flagged with Match violation by the NRMP
Graduate of highly‐regarded medical schoolElectives at your fellowship site
Awarded grant money for researchVolunteer/extracurricular experiencesMedical school class ranking/quartile
Lack of gaps in medical educationGrades in medical school
Residency class ranking/quartileFluency in language spoken by your patient population
Gold Humanism Honor Society (GHHS) membershipResidency program size
In‐Training Examination (ITE)Second interview/visit
Having finished another fellowship
NRMP Program Director Survey, Specialties Matching Service, 2016 78

170
180
190
200
210
220
230
240
250
260
Endocrinology, Diabetes, and MetabolismPrograms That Use USMLE Step 1 and Step 2 Clinical Knowledge (CK) Scores When Considering Which Applicants to Interview
Figure-3
Percentage of Programs That Use USMLE Step 2 (CK) Score
0%
10%
20%
30%
40%
50%
60%
70%
80%
90%
100%
Never Seldom Often
17%
81%
2%
Would your program consider applicants who fail theexam on the first attempt?
0%
10%
20%
30%
40%
50%
60%
70%
80%
90%
100%
Never Seldom often
35%
63%
2%
Would your program consider applicants who failthe exam on the first attempt?
0%
10%
20%
30%
40%
50%
60%
70%
80%
90%
100%
Yes, pass only Yes, target score No
55%
45%
0%
Scores required?
0%
10%
20%
30%
40%
50%
60%
70%
80%
90%
100%
Yes, pass only Yes, target score No
57%
43%
0%
Scores required?
N=42
N=42
N=42N=43
N=12N=14 N=12 N=10
IQR* of Average USMLE Step 1 and Step 2 CK Scores Programs Consider When Granting Interviews
Percentage of Programs That Use USMLE Step 1 Score
170
180
190
200
210
220
230
240
250
260
USMLE Step 2 CKUSMLE Step 1 USMLE Step 1 USMLE Step 2 CK
*The boxes in the boxplots represent the interquartile range (or IQR, which is the range between the 25th and 75th percentiles), and the line in the box is the median. The x-shaped symbol is the mean.
Scores Above Which Programs Almost Always Grant Interviews
Scores Below Which Programs Generally Do Not Grant Interviews
NRMP Program Director Survey, Specialties Matching Service, 2016 79

0%
10%
20%
30%
40%
50%
60%
70%
80%
90%
100%
Yes No
100%
0%
USMLE Step 2 CS
0%
10%
20%
30%
40%
50%
60%
70%
80%
90%
100%
Yes, pass only Yes, target score No
49%44%
7%
USMLE Step 3
0%
10%
20%
30%
40%
50%
60%
70%
80%
90%
100%
Yes, pass only Yes, target score No
45%
21%
34%
COMLEX-USA Level 1*
Endocrinology, Diabetes, and MetabolismPercentage of Programs That Use USMLE Step 2 Clinical Skill (CS), Step 3, and COMLEX-USA Scores* When Considering Which Applicants to Interview
Figure-4
0%
10%
20%
30%
40%
50%
60%
70%
80%
90%
100%
Yes, pass only Yes, target score No
46%
21%
32%
COMLEX-USA Level 2-CE*
0%
10%
20%
30%
40%
50%
60%
70%
80%
90%
100%
Yes, pass only Yes, target score No
38%
28%34%
COMLEX-USA Level 3*
0%
10%
20%
30%
40%
50%
60%
70%
80%
90%
100%
Yes, pass only Yes, target score No
46%
18%
36%
COMLEX-USA Level 2-PE*
N=42 N=41
N=29 N=28
N=28 N=29
* Osteopathic applicants only
Percentage of Programs That Use USMLE Step 2 CS and Step 3 Scores
Percentage of Programs That Use COMLEX-USA Level 1 and Level 2-CE Scores
Percentage of Programs That Use COMLEX-USA Level 2-PE and Level 3 Scores
NRMP Program Director Survey, Specialties Matching Service, 2016 80

0%10%20%30%40%50%60%70%80%90%
100%
Never Seldom Often
38%
63%
0%
Would your program consider applicants who fail theexam on the first attempt?
0%
10%
20%
30%
40%
50%
60%
70%
80%
90%
100%
Yes, pass only Yes, target score No, not required
0% 0%
100%
Scores required?
N=8
N=16
26.0%Optional
74.0%Required
Program Requirement on Dedicated Time forResearch
N=50
0
2
4
6
8
10
12
Accredited Locally Funded Integrated Other
1110
8
6
Average Number of Months if Research Time isRequired
N=16 N=13 N=9 N=6
0.0
0.5
1.0
1.5
2.0
2.5
3.0
3.5
4.0
Accredited Positions Funded Positions
3.63.5
Average Number of Accredited Positions and Funded Positions
0%
10%
20%
30%
40%
50%
60%
70%
80%
90%
100%
Positions Filled BeforeMatch Day
Positions Offered Outsidethe Match
Positions Filled Outsidethe Match
78%
42%50%
Average Percentage of Accredited Positions Offered Outside ofthe Match
N=49 N=44 N=10 N=4 N=3
Endocrinology, Diabetes, and MetabolismPrograms That Use Core Specialty Certifying Examination When Considering Applicants for Interview
Figure-5
Endocrinology, Diabetes, and MetabolismPrograms Positions Figure-6
Endocrinology, Diabetes, and MetabolismDedicated Time for Research Figure-7
NRMP Program Director Survey, Specialties Matching Service, 2016 81

0%
10%
20%
30%
40%
50%
60%
70%
80%
90%
100% 98%
77%70%
39%
82%75%
U.S. Graduate OsteopathicPhysician
Canadian Fifth Pathway U.S. IMG Non-U.S. IMG
Percentage of Programs that Typically Interview and Rank Each Applicant Type
Figure-8Endocrinology, Diabetes, and MetabolismProgram's Interview Activities
0%10%20%30%40%50%60%70%80%90%
100%
Rejected based on astandardized screening
process
In-depth review
49% 49%
Average Percentage of Applicants Rejected and Reviewed
0
20
40
60
80
100
120
Number of applicationsreceived
Number of interviewinvitations sent
Number of applicantsinterviewed
116
24 19
Average Number of Positions, Applications Received, InterviewInvitations Sent, and Applicants Interviewed and Ranked
N=43N=43N=45N=43
N=44
36% of Endocrinology, Diabetes, and Metabolism programs consider all applicant groups
N=45
0%10%20%30%40%50%60%70%80%90%
100%
Prev. Grad Osteo Pathway Canadian US IMG Non-USIMG
9%
57%
12%2% 7%7%
42%
38%
70%
39% 30%
93%
49%
5%19%
59% 63%
Often Seldom Never
Interview
0%10%
20%
30%40%
50%60%
70%80%
90%100%
Prev. Grad Osteo Pathway Canadian US IMG Non-USIMG
12%
57%
20%5% 8%10%
40%
43%
65%
40% 33%
90%
49%
15%
55% 60%
Often Seldom Never
Ranking
n=41
Frequency of Programs Interviewing and Ranking Candidates
n=44
N=40
0%10%20%30%40%50%60%70%80%90%
100%
Jan Feb Mar Apr May Jun Jul Aug Sep Oct Nov Dec
0% 0% 0% 0% 0% 0%
14%
44%37%
6%0% 0%
Interview invitations
Interview Invitations Sent and Interviews Conducted
0% 0% 0% 0% 0% 0% 0%6%
48%38%
6%0%
Interviews conducted
NRMP Program Director Survey, Specialties Matching Service, 2016 82

Figure-9Endocrinology, Diabetes, and MetabolismPotential Challenges in Recruiting Applicants to Your Specialty
0% 10% 20% 30% 40% 50% 60% 70% 80%
78%
7%
17%
0%
0%
We consider those applicants on an individual basis
We give those applicants serious consideration if they haveshown improvement
We do not usually consider those applicants
We favor those applicants
Other
0 1 2 3 4 5
Not enough applicants in the specialty
Undesirable income potential as a practicing physician
Undesirable work/life balance as a practicing physician
Long or irregular work hours required by specialty
Fellowship Match scheduled at inconvenient time of year
3.4
3.8
2.0
1.8
2.0
Average rating on a scale of 5 (1=least challenging; 5=most challenging)
n=37
29.8%Less than 3
23.4%3 to 5
36.2%6 to10
2.1%11 to 158.5%
More than 15
At Any Fellowship Program
36.2%Less than 3
27.7%3 to
5
27.7%6 to 10
8.5%More than 15
At Current Fellowship Program
n=41
n=47 n=47
Endocrinology, Diabetes, and MetabolismApplicants Who Applied in the Specialty in the Past But Did Not Match Figure-10
Endocrinology, Diabetes, and MetabolismYears as Program Director Figure-11
NRMP Program Director Survey, Specialties Matching Service, 2016 83

Female Pelvic Medicine and Reconstructive Surgery
NRMP Program Director Survey, Specialties Matching Service, 2016 84
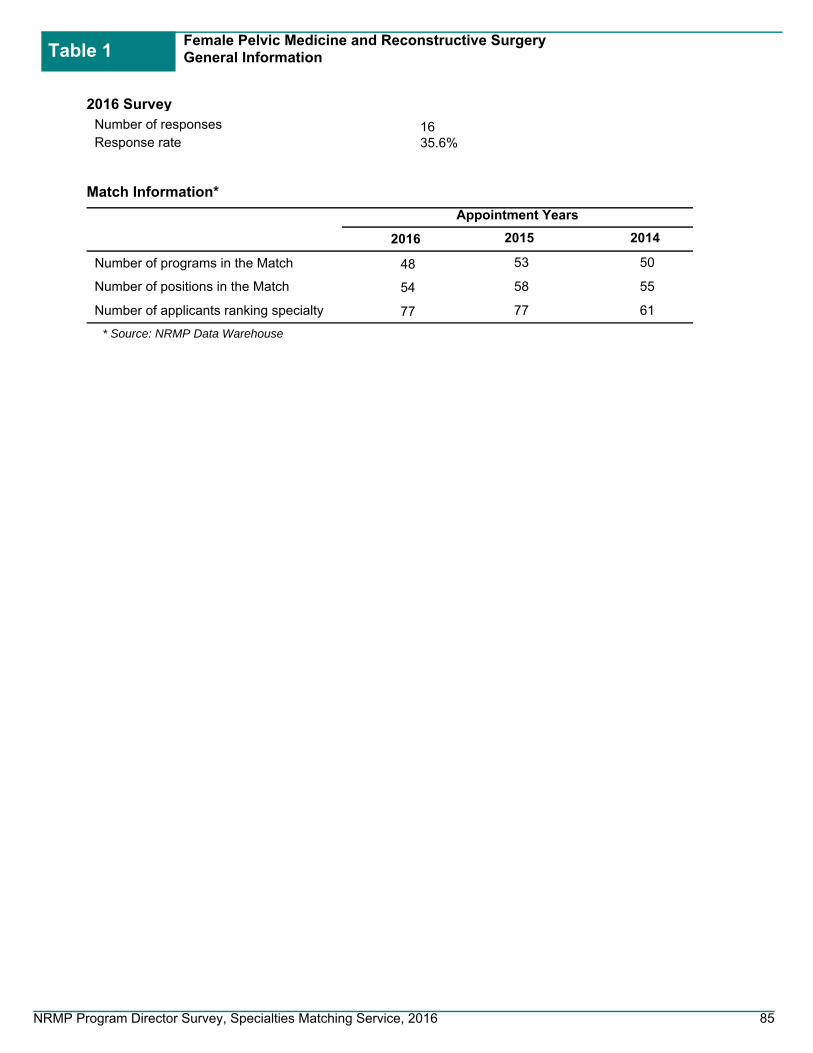
Female Pelvic Medicine and Reconstructive Surgery General Information
Table 1
48
54
77
Number of programs in the Match
Number of positions in the Match
Number of applicants ranking specialty
35.6%Response rate
Appointment Years
Number of responses 16
Match Information*
* Source: NRMP Data Warehouse
2016 Survey
2016 2015 2014
53
58
77
50
55
61
NRMP Program Director Survey, Specialties Matching Service, 2016 85

Figure-1Female Pelvic Medicine and Reconstructive Surgery Percentage of Programs Citing Each Factor and Mean Importance Rating¹ for Each Factor in Selecting Applicants to Interview(N=12)
Average RatingPercent Citing Factor
¹ Ratings on a scale from 1 (not at all important) to 5 (very important).* International Medical Graduates only
1 2 3 4 5
4.74.13.24.44.33.54.14.73.24.73.24.63.94.33.73.14.03.34.43.34.43.43.34.03.53.54.24.34.33.03.04.04.04.03.04.04.04.0
4.0100% 50% 0%
100%92%83%
100%92%83%75%92%83%75%83%92%75%83%25%83%50%58%75%67%75%58%58%50%17%33%42%33%50%17%33%
8%8%
25%33%
8%25%33%
0%8%
Letters of recommendation in fellowship specialty
Residency performance evaluation (Program Director letter)
Reputation of residency program
Demonstrated involvement and perceived interest in research
Perceived commitment to specialty
Personal statement
Perceived interest in program
Evidence of professionalism and ethics
USMLE Step 1/COMLEX Level 1 score
Peer reviewed publications/authored textbook chapters
USMLE Step 2 CK/COMLEX Level 2 CE score
Leadership qualities
Personal prior professional knowledge of the applicant
Oral presentations/poster presentations/speaking engagements
Applicant was a resident in a core program at same institution
Pass USMLE Step 2 CS/COMLEX Level 2 PE
Any failed attempt in USMLE/COMLEX
USMLE Step 3/COMLEX Level 3 score
Interest in academic career
Residency program setting (univ.‐based vs. comm.‐based)
Clinical/laboratory research experience
Awards or special honors in medical school
Alpha Omega Alpha (AOA) membership
Other life experience
Medical Student Performance Evaluation (MSPE/Dean's Letter)
Graduate of highly‐regarded medical school
Visa status*
Volunteer/extracurricular experiences
Awarded grant money for research
Grades in medical school
Lack of gaps in medical education
Medical school class ranking/quartile
Applicant was flagged with Match violation by the NRMP
Electives at your fellowship site
Gold Humanism Honor Society (GHHS) membership
Residency class ranking/quartile
Fluency in language spoken by your patient population
In‐Training Examination (ITE)
Residency program size
Having finished another fellowship
NRMP Program Director Survey, Specialties Matching Service, 2016 86

Female Pelvic Medicine and Reconstructive Surgery Percentage of Programs Citing Each Factor and Mean Importance Rating¹ for Each Factor in Ranking Applicants(N=12)
Figure-2
Average RatingPercent Citing Factor
¹ Ratings on a scale from 1 (not at all important) to 5 (very important).* International Medical Graduates only
1 2 3 4 5
4.94.84.65.04.44.84.14.53.44.34.84.04.54.74.04.63.03.03.03.03.54.23.54.03.34.04.3
4.53.05.05.0
4.33.54.0
3.0
4.04.04.04.04.0
100% 50% 0%
82%91%91%73%91%82%82%91%45%64%91%64%36%82%55%73%9%9%9%9%
18%45%18%45%55%9%
27%0%
36%9%9%9%0%
27%18%27%0%9%0%0%
18%9%9%9%
18%0%
Interactions with faculty during interview and visitInterpersonal skills
Letters of recommendation in fellowship specialtyInteractions with house staff during interview and visit
Perceived commitment to specialtyFeedback from current residents and fellows
Perceived interest in programDemonstrated involvement and perceived interest in research
Reputation of residency programResidency performance evaluation (Program Director letter)
Evidence of professionalism and ethicsPersonal statement
Personal prior professional knowledge of the applicantLeadership qualities
Peer reviewed publications/authored textbook chaptersInterest in academic career
Applicant was a resident in a core program at same institutionUSMLE Step 1/COMLEX Level 1 score
USMLE Step 2 CK/COMLEX Level 2 CE scoreAny failed attempt in USMLE/COMLEX
Passing USMLE Step 2 CS/COMLEX Level 2 PEClinical/laboratory research experience
USMLE Step 3/COMLEX Level 3 scoreOral presentations/poster presentations/speaking engagements
Residency program setting (univ.‐based vs. comm.‐based)Alpha Omega Alpha (AOA) membership
Other life experienceMedical Student Performance Evaluation (MSPE/Dean's Letter)
Second interview/visitAwards or special honors in medical school
Visa status*Applicant was flagged with Match violation by the NRMP
Graduate of highly‐regarded medical schoolElectives at your fellowship site
Awarded grant money for researchVolunteer/extracurricular experiencesMedical school class ranking/quartile
Lack of gaps in medical educationGrades in medical school
Residency class ranking/quartileFluency in language spoken by your patient population
Gold Humanism Honor Society (GHHS) membershipResidency program size
In‐Training Examination (ITE)Second interview/visit
Having finished another fellowship
NRMP Program Director Survey, Specialties Matching Service, 2016 87

Female Pelvic Medicine and Reconstructive Surgery Programs That Use USMLE Step 1 and Step 2 Clinical Knowledge (CK) Scores When Considering Which Applicants to Interview
Figure-3
Percentage of Programs That Use USMLE Step 2 (CK) Score
0%
10%
20%
30%
40%
50%
60%
70%
80%
90%
100%
Never Seldom Often
33%
58%
8%
Would your program consider applicants who fail theexam on the first attempt?
0%
10%
20%
30%
40%
50%
60%
70%
80%
90%
100%
Never Seldom often
33%
58%
8%
Would your program consider applicants who failthe exam on the first attempt?
0%
10%
20%
30%
40%
50%
60%
70%
80%
90%
100%
Yes, pass only Yes, target score No
67%
17% 17%
Scores required?
0%
10%
20%
30%
40%
50%
60%
70%
80%
90%
100%
Yes, pass only Yes, target score No
67%
17% 17%
Scores required?
N=12
N=12
N=12N=12
IQR* of Average USMLE Step 1 and Step 2 CK Scores Programs Consider When Granting Interviews
Percentage of Programs That Use USMLE Step 1 Score
*The boxes in the boxplots represent the interquartile range (or IQR, which is the range between the 25th and 75th percentiles), and the line in the box is the median. The x-shaped symbol is the mean.
Scores Above Which Programs Almost Always Grant Interviews
Scores Below Which Programs Generally Do Not Grant Interviews
USMLE Step 2 CK not reported
because of low response rate
USMLE Step 1 not reported because of low response
rate
USMLE Step 2 CK not reported
because of low response rate
USMLE Step 1 not reported because of low response
rate
NRMP Program Director Survey, Specialties Matching Service, 2016 88

0%
10%
20%
30%
40%
50%
60%
70%
80%
90%
100%
Yes No
83%
17%
USMLE Step 2 CS
0%
10%
20%
30%
40%
50%
60%
70%
80%
90%
100%
Yes, pass only Yes, target score No
67%
8%
25%
USMLE Step 3
0%
10%
20%
30%
40%
50%
60%
70%
80%
90%
100%
Yes, pass only Yes, target score No
50%
10%
40%
COMLEX-USA Level 1*
Female Pelvic Medicine and Reconstructive Surgery Percentage of Programs That Use USMLE Step 2 Clinical Skill (CS), Step 3, and COMLEX-USA Scores* When Considering Which Applicants to Interview
Figure-4
0%
10%
20%
30%
40%
50%
60%
70%
80%
90%
100%
Yes, pass only Yes, target score No
50%
10%
40%
COMLEX-USA Level 2-CE*
0%
10%
20%
30%
40%
50%
60%
70%
80%
90%
100%
Yes, pass only Yes, target score No
50%
10%
40%
COMLEX-USA Level 3*
0%
10%
20%
30%
40%
50%
60%
70%
80%
90%
100%
Yes, pass only Yes, target score No
50%
10%
40%
COMLEX-USA Level 2-PE*
N=12 N=12
N=10 N=10
N=10 N=10
* Osteopathic applicants only
Percentage of Programs That Use USMLE Step 2 CS and Step 3 Scores
Percentage of Programs That Use COMLEX-USA Level 1 and Level 2-CE Scores
Percentage of Programs That Use COMLEX-USA Level 2-PE and Level 3 Scores
NRMP Program Director Survey, Specialties Matching Service, 2016 89

0%10%20%30%40%50%60%70%80%90%
100%
Never Seldom Often
60%
40%
0%
Would your program consider applicants who fail theexam on the first attempt?
0%
10%
20%
30%
40%
50%
60%
70%
80%
90%
100%
Yes, pass only Yes, target score No, not required
38%
0%
63%
Scores required?
N=5
N=8
100.0%Required
Program Requirement on Dedicated Time forResearch
N=16
0
2
4
6
8
10
12
Accredited Locally Funded Integrated Other
12 12 12 12
Average Number of Months if Research Time isRequired
N=13 N=1 N=1 N=1
0.0
0.4
0.8
1.2
1.6
2.0
2.4
2.8
3.2
Accredited Positions Funded Positions
3.1
2.7
Average Number of Accredited Positions and Funded Positions
0%
10%
20%
30%
40%
50%
60%
70%
80%
90%
100%
Positions Filled BeforeMatch Day
Positions Offered Outsidethe Match
Positions Filled Outsidethe Match
78%
Average Percentage of Accredited Positions Offered Outside ofthe Match
N=16 N=15 N=3 N=0 N=0
Female Pelvic Medicine and Reconstructive Surgery Programs That Use Core Specialty Certifying Examination When Considering Applicants for Interview
Figure-5
Female Pelvic Medicine and Reconstructive Surgery Programs Positions Figure-6
Female Pelvic Medicine and Reconstructive Surgery Dedicated Time for Research Figure-7
NRMP Program Director Survey, Specialties Matching Service, 2016 90

0%
10%
20%
30%
40%
50%
60%
70%
80%
90%
100%100%
85%
54%
15%
46%
31%
U.S. Graduate OsteopathicPhysician
Canadian Fifth Pathway U.S. IMG Non-U.S. IMG
Percentage of Programs that Typically Interview and Rank Each Applicant Type
Figure-8Female Pelvic Medicine and Reconstructive Surgery Program's Interview Activities
0%10%20%30%40%50%60%70%80%90%
100%
Rejected based on astandardized screening
process
In-depth review
21%
86%
Average Percentage of Applicants Rejected and Reviewed
0
5
10
15
20
25
30
35
40
45
Number of applicationsreceived
Number of interviewinvitations sent
Number of applicantsinterviewed
41
20
15
Average Number of Positions, Applications Received, InterviewInvitations Sent, and Applicants Interviewed and Ranked
N=16N=16N=16N=16
N=13
8% of Female Pelvic Medicine and Reconstructive Surgery programs consider all applicant groups
N=16
0%10%20%30%40%50%60%70%80%90%
100%
Prev. Grad Osteo Pathway Canadian US IMG Non-USIMG
70%
25% 23%
50%
15%
38%
30%
67%
46%
50%
85%
62%
8%
31%
Often Seldom Never
Interview
0%10%
20%
30%40%
50%60%
70%80%
90%100%
Prev. Grad Osteo Pathway Canadian US IMG Non-USIMG
73%
25% 23%
50%
17%
46%
27%
67%
46%
50%
83%
54%
8%
31%
Often Seldom Never
Ranking
n=12
Frequency of Programs Interviewing and Ranking Candidates
n=13
N=14
0%10%20%30%40%50%60%70%80%90%
100%
Jan Feb Mar Apr May Jun Jul Aug Sep Oct Nov Dec
0%7%
55%
16% 14%
0% 0% 0% 0% 0% 0%7%
Interview invitations
Interview Invitations Sent and Interviews Conducted
0% 0% 0%
25%
57%
10%0% 0% 0% 0% 0%
8%
Interviews conducted
NRMP Program Director Survey, Specialties Matching Service, 2016 91

Figure-9Female Pelvic Medicine and Reconstructive Surgery Potential Challenges in Recruiting Applicants to Your Specialty
0% 10% 20% 30% 40% 50% 60% 70% 80%
75%
25%
17%
0%
0%
We consider those applicants on an individual basis
We give those applicants serious consideration if they haveshown improvement
We do not usually consider those applicants
We favor those applicants
Other
0 1 2 3 4 5
Not enough applicants in the specialty
Undesirable income potential as a practicing physician
Undesirable work/life balance as a practicing physician
Long or irregular work hours required by specialty
Fellowship Match scheduled at inconvenient time of year
2.0
2.0
1.5
1.7
2.5
Average rating on a scale of 5 (1=least challenging; 5=most challenging)
n=12
26.7%Less than 3
20.0%3 to 5
33.3%6 to 10
13.3%11 to 15
6.7%More than 15
At Any Fellowship Program
30.8%Less than 3
30.8%3 to 5
23.1%6 to 10
7.7%11 to 157.7%
More than15
At Current Fellowship Program
n=12
n=15 n=13
Female Pelvic Medicine and Reconstructive Surgery Applicants Who Applied in the Specialty in the Past But Did Not Match Figure-10
Female Pelvic Medicine and Reconstructive Surgery Years as Program Director Figure-11
NRMP Program Director Survey, Specialties Matching Service, 2016 92

Gastroenterology
NRMP Program Director Survey, Specialties Matching Service, 2016 93

GastroenterologyGeneral Information
Table 1
179
466
718
Number of programs in the Match
Number of positions in the Match
Number of applicants ranking specialty
35.8%Response rate
Appointment Years
Number of responses 54
Match Information*
* Source: NRMP Data Warehouse
2016 Survey
2016 2015 2014
181
464
717
173
461
703
NRMP Program Director Survey, Specialties Matching Service, 2016 94

Figure-1GastroenterologyPercentage of Programs Citing Each Factor and Mean Importance Rating¹ for Each Factor in Selecting Applicants to Interview(N=43)
Average RatingPercent Citing Factor
¹ Ratings on a scale from 1 (not at all important) to 5 (very important).* International Medical Graduates only
1 2 3 4 5
4.54.54.34.14.33.54.34.54.14.14.24.14.04.13.94.34.64.24.34.33.93.73.74.13.83.84.63.93.63.64.03.84.83.73.54.33.63.33.33.5
100% 50% 0%
88%93%93%91%72%79%70%81%81%86%77%72%60%81%72%63%72%63%65%81%63%58%65%42%53%58%47%44%42%44%56%42%40%30%28%47%16%21%12%
5%
Letters of recommendation in fellowship specialty
Residency performance evaluation (Program Director letter)
Reputation of residency program
Demonstrated involvement and perceived interest in research
Perceived commitment to specialty
Personal statement
Perceived interest in program
Evidence of professionalism and ethics
USMLE Step 1/COMLEX Level 1 score
Peer reviewed publications/authored textbook chapters
USMLE Step 2 CK/COMLEX Level 2 CE score
Leadership qualities
Personal prior professional knowledge of the applicant
Oral presentations/poster presentations/speaking engagements
Applicant was a resident in a core program at same institution
Pass USMLE Step 2 CS/COMLEX Level 2 PE
Any failed attempt in USMLE/COMLEX
USMLE Step 3/COMLEX Level 3 score
Interest in academic career
Residency program setting (univ.‐based vs. comm.‐based)
Clinical/laboratory research experience
Awards or special honors in medical school
Alpha Omega Alpha (AOA) membership
Other life experience
Medical Student Performance Evaluation (MSPE/Dean's Letter)
Graduate of highly‐regarded medical school
Visa status*
Volunteer/extracurricular experiences
Awarded grant money for research
Grades in medical school
Lack of gaps in medical education
Medical school class ranking/quartile
Applicant was flagged with Match violation by the NRMP
Electives at your fellowship site
Gold Humanism Honor Society (GHHS) membership
Residency class ranking/quartile
Fluency in language spoken by your patient population
In‐Training Examination (ITE)
Residency program size
Having finished another fellowship
NRMP Program Director Survey, Specialties Matching Service, 2016 95

GastroenterologyPercentage of Programs Citing Each Factor and Mean Importance Rating¹ for Each Factor in Ranking Applicants(N=43)
Figure-2
Average RatingPercent Citing Factor
¹ Ratings on a scale from 1 (not at all important) to 5 (very important).* International Medical Graduates only
1 2 3 4 5
4.84.84.34.74.74.74.44.24.24.44.63.84.44.24.34.44.14.04.04.54.14.24.14.34.14.04.23.53.93.84.44.93.63.94.24.13.73.93.84.23.83.33.53.64.03.0
100% 50% 0%
93%95%73%73%44%68%54%78%76%63%61%39%46%51%61%49%56%54%54%49%46%46%41%56%61%39%22%51%29%34%29%29%20%22%24%24%27%37%24%37%12%17%10%12%5%5%
Interactions with faculty during interview and visitInterpersonal skills
Letters of recommendation in fellowship specialtyInteractions with house staff during interview and visit
Perceived commitment to specialtyFeedback from current residents and fellows
Perceived interest in programDemonstrated involvement and perceived interest in research
Reputation of residency programResidency performance evaluation (Program Director letter)
Evidence of professionalism and ethicsPersonal statement
Personal prior professional knowledge of the applicantLeadership qualities
Peer reviewed publications/authored textbook chaptersInterest in academic career
Applicant was a resident in a core program at same institutionUSMLE Step 1/COMLEX Level 1 score
USMLE Step 2 CK/COMLEX Level 2 CE scoreAny failed attempt in USMLE/COMLEX
Passing USMLE Step 2 CS/COMLEX Level 2 PEClinical/laboratory research experience
USMLE Step 3/COMLEX Level 3 scoreOral presentations/poster presentations/speaking engagements
Residency program setting (univ.‐based vs. comm.‐based)Alpha Omega Alpha (AOA) membership
Other life experienceMedical Student Performance Evaluation (MSPE/Dean's Letter)
Second interview/visitAwards or special honors in medical school
Visa status*Applicant was flagged with Match violation by the NRMP
Graduate of highly‐regarded medical schoolElectives at your fellowship site
Awarded grant money for researchVolunteer/extracurricular experiencesMedical school class ranking/quartile
Lack of gaps in medical educationGrades in medical school
Residency class ranking/quartileFluency in language spoken by your patient population
Gold Humanism Honor Society (GHHS) membershipResidency program size
In‐Training Examination (ITE)Second interview/visit
Having finished another fellowship
NRMP Program Director Survey, Specialties Matching Service, 2016 96

170
180
190
200
210
220
230
240
250
260
GastroenterologyPrograms That Use USMLE Step 1 and Step 2 Clinical Knowledge (CK) Scores When Considering Which Applicants to Interview
Figure-3
Percentage of Programs That Use USMLE Step 2 (CK) Score
0%
10%
20%
30%
40%
50%
60%
70%
80%
90%
100%
Never Seldom Often
17%
79%
5%
Would your program consider applicants who fail theexam on the first attempt?
0%
10%
20%
30%
40%
50%
60%
70%
80%
90%
100%
Never Seldom often
45%52%
2%
Would your program consider applicants who failthe exam on the first attempt?
0%
10%
20%
30%
40%
50%
60%
70%
80%
90%
100%
Yes, pass only Yes, target score No
43%
55%
2%
Scores required?
0%
10%
20%
30%
40%
50%
60%
70%
80%
90%
100%
Yes, pass only Yes, target score No
45%52%
2%
Scores required?
N=44
N=42
N=44N=42
N=17N=21 N=14 N=11
IQR* of Average USMLE Step 1 and Step 2 CK Scores Programs Consider When Granting Interviews
Percentage of Programs That Use USMLE Step 1 Score
170
180
190
200
210
220
230
240
250
260
USMLE Step 2 CKUSMLE Step 1 USMLE Step 1 USMLE Step 2 CK
*The boxes in the boxplots represent the interquartile range (or IQR, which is the range between the 25th and 75th percentiles), and the line in the box is the median. The x-shaped symbol is the mean.
Scores Above Which Programs Almost Always Grant Interviews
Scores Below Which Programs Generally Do Not Grant Interviews
NRMP Program Director Survey, Specialties Matching Service, 2016 97
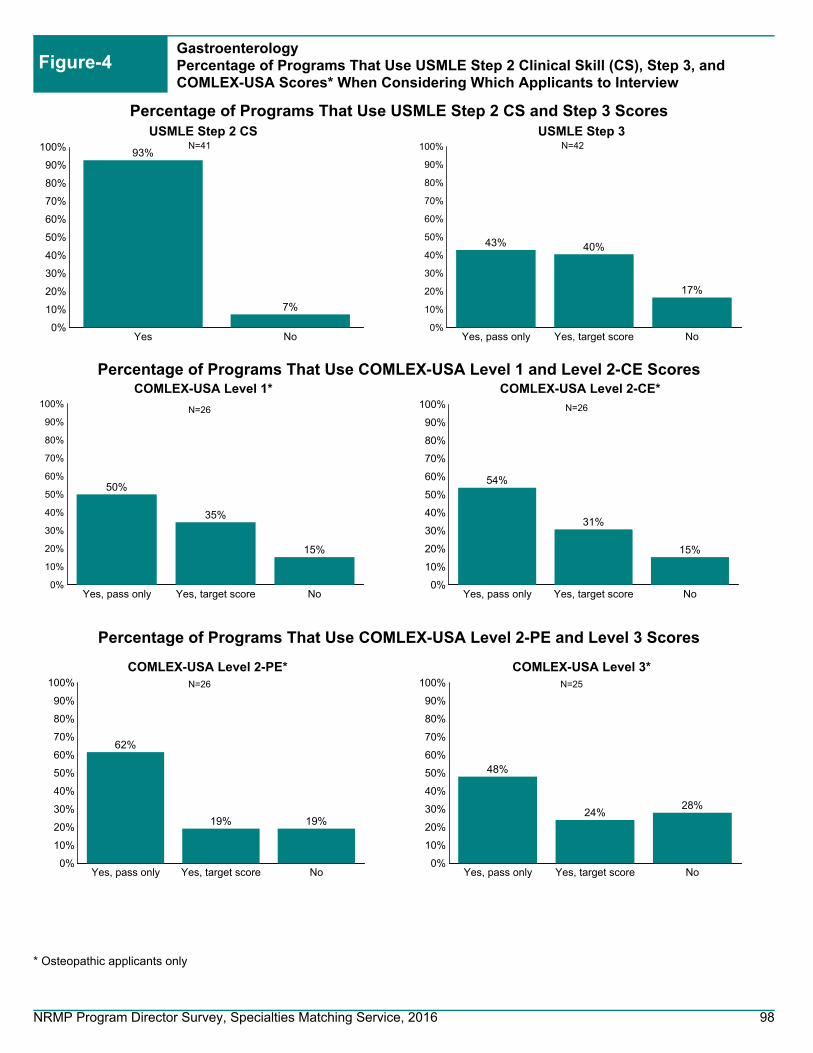
0%
10%
20%
30%
40%
50%
60%
70%
80%
90%
100%
Yes No
93%
7%
USMLE Step 2 CS
0%
10%
20%
30%
40%
50%
60%
70%
80%
90%
100%
Yes, pass only Yes, target score No
43% 40%
17%
USMLE Step 3
0%
10%
20%
30%
40%
50%
60%
70%
80%
90%
100%
Yes, pass only Yes, target score No
50%
35%
15%
COMLEX-USA Level 1*
GastroenterologyPercentage of Programs That Use USMLE Step 2 Clinical Skill (CS), Step 3, and COMLEX-USA Scores* When Considering Which Applicants to Interview
Figure-4
0%
10%
20%
30%
40%
50%
60%
70%
80%
90%
100%
Yes, pass only Yes, target score No
54%
31%
15%
COMLEX-USA Level 2-CE*
0%
10%
20%
30%
40%
50%
60%
70%
80%
90%
100%
Yes, pass only Yes, target score No
48%
24%28%
COMLEX-USA Level 3*
0%
10%
20%
30%
40%
50%
60%
70%
80%
90%
100%
Yes, pass only Yes, target score No
62%
19% 19%
COMLEX-USA Level 2-PE*
N=41 N=42
N=26 N=26
N=26 N=25
* Osteopathic applicants only
Percentage of Programs That Use USMLE Step 2 CS and Step 3 Scores
Percentage of Programs That Use COMLEX-USA Level 1 and Level 2-CE Scores
Percentage of Programs That Use COMLEX-USA Level 2-PE and Level 3 Scores
NRMP Program Director Survey, Specialties Matching Service, 2016 98

0%10%20%30%40%50%60%70%80%90%
100%
Never Seldom Often
50%43%
7%
Would your program consider applicants who fail theexam on the first attempt?
0%
10%
20%
30%
40%
50%
60%
70%
80%
90%
100%
Yes, pass only Yes, target score No, not required
31%
0%
69%
Scores required?
N=14
N=16
16.7%Optional
83.3%Required
Program Requirement on Dedicated Time forResearch
N=54
0
1
2
3
4
5
6
7
Accredited Locally Funded Integrated Other
7
4
5
4
Average Number of Months if Research Time isRequired
N=24 N=9 N=9 N=7
0
2
4
6
8
10
Accredited Positions Funded Positions
8.37.8
Average Number of Accredited Positions and Funded Positions
0%
10%
20%
30%
40%
50%
60%
70%
80%
90%
100%
Positions Filled BeforeMatch Day
Positions Offered Outsidethe Match
Positions Filled Outsidethe Match
82%
12% 12%
Average Percentage of Accredited Positions Offered Outside ofthe Match
N=53 N=48 N=6 N=5 N=4
GastroenterologyPrograms That Use Core Specialty Certifying Examination When Considering Applicants for Interview
Figure-5
GastroenterologyPrograms Positions Figure-6
GastroenterologyDedicated Time for Research Figure-7
NRMP Program Director Survey, Specialties Matching Service, 2016 99
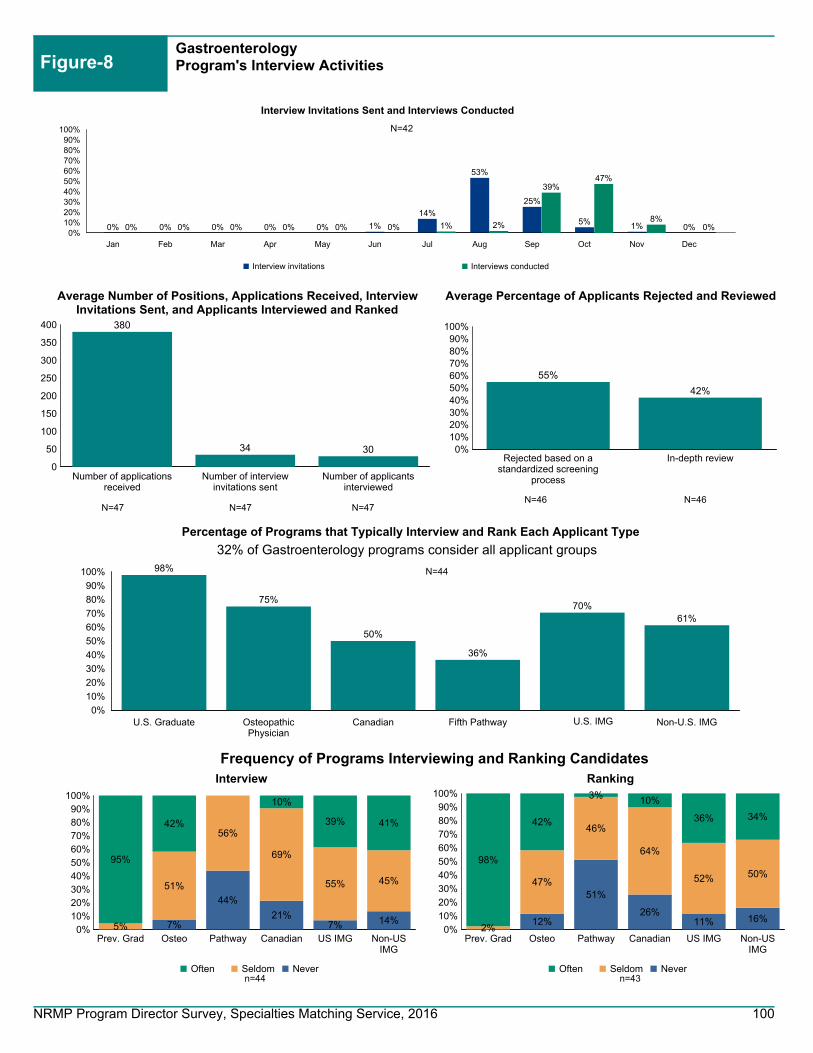
0%
10%
20%
30%
40%
50%
60%
70%
80%
90%
100% 98%
75%
50%
36%
70%61%
U.S. Graduate OsteopathicPhysician
Canadian Fifth Pathway U.S. IMG Non-U.S. IMG
Percentage of Programs that Typically Interview and Rank Each Applicant Type
Figure-8GastroenterologyProgram's Interview Activities
0%10%20%30%40%50%60%70%80%90%
100%
Rejected based on astandardized screening
process
In-depth review
55%
42%
Average Percentage of Applicants Rejected and Reviewed
0
50
100
150
200
250
300
350
400
Number of applicationsreceived
Number of interviewinvitations sent
Number of applicantsinterviewed
380
34 30
Average Number of Positions, Applications Received, InterviewInvitations Sent, and Applicants Interviewed and Ranked
N=46N=46N=47N=47
N=44
32% of Gastroenterology programs consider all applicant groups
N=47
0%10%20%30%40%50%60%70%80%90%
100%
Prev. Grad Osteo Pathway Canadian US IMG Non-USIMG
7%
44%
21%7% 14%
5%
51%
56%
69%
55% 45%
95%
42%
10%
39% 41%
Often Seldom Never
Interview
0%10%
20%
30%40%
50%60%
70%80%
90%100%
Prev. Grad Osteo Pathway Canadian US IMG Non-USIMG
12%
51%
26%11% 16%
2%
47%
46%
64%
52% 50%
98%
42%
3% 10%
36% 34%
Often Seldom Never
Ranking
n=43
Frequency of Programs Interviewing and Ranking Candidates
n=44
N=42
0%10%20%30%40%50%60%70%80%90%
100%
Jan Feb Mar Apr May Jun Jul Aug Sep Oct Nov Dec
0% 0% 0% 0% 0% 1%
14%
53%
25%
5% 1% 0%
Interview invitations
Interview Invitations Sent and Interviews Conducted
0% 0% 0% 0% 0% 0% 1% 2%
39%47%
8%0%
Interviews conducted
NRMP Program Director Survey, Specialties Matching Service, 2016 100

Figure-9GastroenterologyPotential Challenges in Recruiting Applicants to Your Specialty
0% 20% 40% 60% 80% 100%
85%
25%
10%
0%
0%
We consider those applicants on an individual basis
We give those applicants serious consideration if they haveshown improvement
We do not usually consider those applicants
We favor those applicants
Other
0 1 2 3 4 5
Not enough applicants in the specialty
Undesirable income potential as a practicing physician
Undesirable work/life balance as a practicing physician
Long or irregular work hours required by specialty
Fellowship Match scheduled at inconvenient time of year
1.2
1.5
2.2
2.1
1.8
Average rating on a scale of 5 (1=least challenging; 5=most challenging)
n=39
26.1%Less than 3
23.9%3 to 5
23.9%6 to 10
8.7%11 to 15
17.4%More than 15
At Any Fellowship Program
31.8%Less than 3
20.5%3 to 5
25.0%6 to 10
11.4%11 to 15
11.4%More than 15
At Current Fellowship Program
n=40
n=46 n=44
GastroenterologyApplicants Who Applied in the Specialty in the Past But Did Not Match Figure-10
GastroenterologyYears as Program Director Figure-11
NRMP Program Director Survey, Specialties Matching Service, 2016 101

Geriatric Medicine
NRMP Program Director Survey, Specialties Matching Service, 2016 102

Geriatric MedicineGeneral Information
Table 1
137
385
213
Number of programs in the Match
Number of positions in the Match
Number of applicants ranking specialty
34.6%Response rate
Appointment Years
Number of responses 45
Match Information*
* Source: NRMP Data Warehouse
2016 Survey
2016 2015 2014
126
353
163
109
297
132
NRMP Program Director Survey, Specialties Matching Service, 2016 103

Figure-1Geriatric MedicinePercentage of Programs Citing Each Factor and Mean Importance Rating¹ for Each Factor in Selecting Applicants to Interview(N=42)
Average RatingPercent Citing Factor
¹ Ratings on a scale from 1 (not at all important) to 5 (very important).* International Medical Graduates only
1 2 3 4 5
4.34.63.73.34.64.44.64.73.23.03.44.24.33.44.33.63.93.53.73.23.03.03.53.93.53.54.33.42.43.53.73.34.93.53.44.03.94.33.02.4
100% 50% 0%
74%81%67%48%93%90%88%83%81%38%79%52%62%43%64%69%62%64%45%36%24%48%29%48%45%36%45%33%21%38%38%29%36%19%21%
7%26%
7%5%
12%
Letters of recommendation in fellowship specialty
Residency performance evaluation (Program Director letter)
Reputation of residency program
Demonstrated involvement and perceived interest in research
Perceived commitment to specialty
Personal statement
Perceived interest in program
Evidence of professionalism and ethics
USMLE Step 1/COMLEX Level 1 score
Peer reviewed publications/authored textbook chapters
USMLE Step 2 CK/COMLEX Level 2 CE score
Leadership qualities
Personal prior professional knowledge of the applicant
Oral presentations/poster presentations/speaking engagements
Applicant was a resident in a core program at same institution
Pass USMLE Step 2 CS/COMLEX Level 2 PE
Any failed attempt in USMLE/COMLEX
USMLE Step 3/COMLEX Level 3 score
Interest in academic career
Residency program setting (univ.‐based vs. comm.‐based)
Clinical/laboratory research experience
Awards or special honors in medical school
Alpha Omega Alpha (AOA) membership
Other life experience
Medical Student Performance Evaluation (MSPE/Dean's Letter)
Graduate of highly‐regarded medical school
Visa status*
Volunteer/extracurricular experiences
Awarded grant money for research
Grades in medical school
Lack of gaps in medical education
Medical school class ranking/quartile
Applicant was flagged with Match violation by the NRMP
Electives at your fellowship site
Gold Humanism Honor Society (GHHS) membership
Residency class ranking/quartile
Fluency in language spoken by your patient population
In‐Training Examination (ITE)
Residency program size
Having finished another fellowship
NRMP Program Director Survey, Specialties Matching Service, 2016 104

Geriatric MedicinePercentage of Programs Citing Each Factor and Mean Importance Rating¹ for Each Factor in Ranking Applicants(N=42)
Figure-2
Average RatingPercent Citing Factor
¹ Ratings on a scale from 1 (not at all important) to 5 (very important).* International Medical Graduates only
1 2 3 4 5
5.04.84.44.84.74.74.63.93.74.34.84.34.54.33.24.24.53.63.74.13.63.23.63.53.72.83.93.44.23.34.24.84.03.93.43.62.73.93.03.84.24.0
4.54.3
100% 50% 0%
88%90%60%74%88%67%79%38%55%71%69%83%52%43%21%33%50%43%43%36%43%14%38%19%17%12%26%21%31%19%40%33%14%19%12%21%14%24%14%12%21%7%0%5%
14%0%
Interactions with faculty during interview and visitInterpersonal skills
Letters of recommendation in fellowship specialtyInteractions with house staff during interview and visit
Perceived commitment to specialtyFeedback from current residents and fellows
Perceived interest in programDemonstrated involvement and perceived interest in research
Reputation of residency programResidency performance evaluation (Program Director letter)
Evidence of professionalism and ethicsPersonal statement
Personal prior professional knowledge of the applicantLeadership qualities
Peer reviewed publications/authored textbook chaptersInterest in academic career
Applicant was a resident in a core program at same institutionUSMLE Step 1/COMLEX Level 1 score
USMLE Step 2 CK/COMLEX Level 2 CE scoreAny failed attempt in USMLE/COMLEX
Passing USMLE Step 2 CS/COMLEX Level 2 PEClinical/laboratory research experience
USMLE Step 3/COMLEX Level 3 scoreOral presentations/poster presentations/speaking engagements
Residency program setting (univ.‐based vs. comm.‐based)Alpha Omega Alpha (AOA) membership
Other life experienceMedical Student Performance Evaluation (MSPE/Dean's Letter)
Second interview/visitAwards or special honors in medical school
Visa status*Applicant was flagged with Match violation by the NRMP
Graduate of highly‐regarded medical schoolElectives at your fellowship site
Awarded grant money for researchVolunteer/extracurricular experiencesMedical school class ranking/quartile
Lack of gaps in medical educationGrades in medical school
Residency class ranking/quartileFluency in language spoken by your patient population
Gold Humanism Honor Society (GHHS) membershipResidency program size
In‐Training Examination (ITE)Second interview/visit
Having finished another fellowship
NRMP Program Director Survey, Specialties Matching Service, 2016 105

Geriatric MedicinePrograms That Use USMLE Step 1 and Step 2 Clinical Knowledge (CK) Scores When Considering Which Applicants to Interview
Figure-3
Percentage of Programs That Use USMLE Step 2 (CK) Score
0%
10%
20%
30%
40%
50%
60%
70%
80%
90%
100%
Never Seldom Often
2%
73%
24%
Would your program consider applicants who fail theexam on the first attempt?
0%
10%
20%
30%
40%
50%
60%
70%
80%
90%
100%
Never Seldom often
5%
76%
20%
Would your program consider applicants who failthe exam on the first attempt?
0%
10%
20%
30%
40%
50%
60%
70%
80%
90%
100%
Yes, pass only Yes, target score No
84%
14%
2%
Scores required?
0%
10%
20%
30%
40%
50%
60%
70%
80%
90%
100%
Yes, pass only Yes, target score No
81%
16%
2%
Scores required?
N=43
N=41
N=43N=41
IQR* of Average USMLE Step 1 and Step 2 CK Scores Programs Consider When Granting Interviews
Percentage of Programs That Use USMLE Step 1 Score
*The boxes in the boxplots represent the interquartile range (or IQR, which is the range between the 25th and 75th percentiles), and the line in the box is the median. The x-shaped symbol is the mean.
Scores Above Which Programs Almost Always Grant Interviews
Scores Below Which Programs Generally Do Not Grant Interviews
USMLE Step 2 CK not reported
because of low response rate
USMLE Step 1 not reported because of low response
rate
USMLE Step 2 CK not reported
because of low response rate
USMLE Step 1 not reported because of low response
rate
NRMP Program Director Survey, Specialties Matching Service, 2016 106

0%
10%
20%
30%
40%
50%
60%
70%
80%
90%
100%
Yes No
98%
2%
USMLE Step 2 CS
0%
10%
20%
30%
40%
50%
60%
70%
80%
90%
100%
Yes, pass only Yes, target score No
79%
12% 10%
USMLE Step 3
0%
10%
20%
30%
40%
50%
60%
70%
80%
90%
100%
Yes, pass only Yes, target score No
71%
7%
21%
COMLEX-USA Level 1*
Geriatric MedicinePercentage of Programs That Use USMLE Step 2 Clinical Skill (CS), Step 3, and COMLEX-USA Scores* When Considering Which Applicants to Interview
Figure-4
0%
10%
20%
30%
40%
50%
60%
70%
80%
90%
100%
Yes, pass only Yes, target score No
71%
7%
21%
COMLEX-USA Level 2-CE*
0%
10%
20%
30%
40%
50%
60%
70%
80%
90%
100%
Yes, pass only Yes, target score No
75%
4%
21%
COMLEX-USA Level 3*
0%
10%
20%
30%
40%
50%
60%
70%
80%
90%
100%
Yes, pass only Yes, target score No
71%
7%
21%
COMLEX-USA Level 2-PE*
N=43 N=42
N=28 N=28
N=28 N=28
* Osteopathic applicants only
Percentage of Programs That Use USMLE Step 2 CS and Step 3 Scores
Percentage of Programs That Use COMLEX-USA Level 1 and Level 2-CE Scores
Percentage of Programs That Use COMLEX-USA Level 2-PE and Level 3 Scores
NRMP Program Director Survey, Specialties Matching Service, 2016 107

0%10%20%30%40%50%60%70%80%90%
100%
Never Seldom Often
0%
72%
28%
Would your program consider applicants who fail theexam on the first attempt?
0%
10%
20%
30%
40%
50%
60%
70%
80%
90%
100%
Yes, pass only Yes, target score No, not required
20%
0%
80%
Scores required?
N=18
N=20
86.7%Optional
13.3%Required
Program Requirement on Dedicated Time forResearch
N=45
0
2
4
6
8
10
12
14
Accredited Locally Funded Integrated Other
1
12
2
Average Number of Months if Research Time isRequired
N=0 N=1 N=4 N=1
0.0
0.5
1.0
1.5
2.0
2.5
3.0
3.5
4.0
Accredited Positions Funded Positions
3.7
3.4
Average Number of Accredited Positions and Funded Positions
0%
10%
20%
30%
40%
50%
60%
70%
80%
90%
100%
Positions Filled BeforeMatch Day
Positions Offered Outsidethe Match
Positions Filled Outsidethe Match
43% 40% 41%
Average Percentage of Accredited Positions Offered Outside ofthe Match
N=45 N=44 N=10 N=16 N=15
Geriatric MedicinePrograms That Use Core Specialty Certifying Examination When Considering Applicants for Interview
Figure-5
Geriatric MedicinePrograms Positions Figure-6
Geriatric MedicineDedicated Time for Research Figure-7
NRMP Program Director Survey, Specialties Matching Service, 2016 108

0%
10%
20%
30%
40%
50%
60%
70%
80%
90%
100% 98%91%
60%
35%
74%
53%
U.S. Graduate OsteopathicPhysician
Canadian Fifth Pathway U.S. IMG Non-U.S. IMG
Percentage of Programs that Typically Interview and Rank Each Applicant Type
Figure-8Geriatric MedicineProgram's Interview Activities
0%10%20%30%40%50%60%70%80%90%
100%
Rejected based on astandardized screening
process
In-depth review
26%
77%
Average Percentage of Applicants Rejected and Reviewed
0
2
4
6
8
10
12
14
16
18
Number of applicationsreceived
Number of interviewinvitations sent
Number of applicantsinterviewed
17
10
8
Average Number of Positions, Applications Received, InterviewInvitations Sent, and Applicants Interviewed and Ranked
N=43N=42N=44N=44
N=43
28% of Geriatric Medicine programs consider all applicant groups
N=44
0%10%20%30%40%50%60%70%80%90%
100%
Prev. Grad Osteo Pathway Canadian US IMG Non-USIMG
5%
66%
28%10%
24%5%
21%
21%
53%
28%
21%
95%
74%
13% 20%
63% 55%
Often Seldom Never
Interview
0%10%
20%
30%40%
50%60%
70%80%
90%100%
Prev. Grad Osteo Pathway Canadian US IMG Non-USIMG
3%
65%
24%8%
24%
3%
20%
24%
43%
26%
19%
98%78%
12%
32%
66%57%
Often Seldom Never
Ranking
n=40
Frequency of Programs Interviewing and Ranking Candidates
n=42
N=38
0%10%20%30%40%50%60%70%80%90%
100%
Jan Feb Mar Apr May Jun Jul Aug Sep Oct Nov Dec
3% 0% 0% 0% 1% 1%7%
26%
38%
14%3% 7%
Interview invitations
Interview Invitations Sent and Interviews Conducted
0% 0% 0% 0% 0% 0% 1%7%
25%34%
13%8%
Interviews conducted
NRMP Program Director Survey, Specialties Matching Service, 2016 109

Figure-9Geriatric MedicinePotential Challenges in Recruiting Applicants to Your Specialty
0% 20% 40% 60% 80% 100%
92%
17%
6%
0%
0%
We consider those applicants on an individual basis
We give those applicants serious consideration if they haveshown improvement
We do not usually consider those applicants
We favor those applicants
Other
0 1 2 3 4 5
Not enough applicants in the specialty
Undesirable income potential as a practicing physician
Undesirable work/life balance as a practicing physician
Long or irregular work hours required by specialty
Fellowship Match scheduled at inconvenient time of year
4.8
4.5
2.0
1.6
2.3
Average rating on a scale of 5 (1=least challenging; 5=most challenging)
n=39
29.3%Less than 3
17.1%3 to 5
19.5%6 to 10
12.2%11 to 15
22.0%More than 15
At Any Fellowship Program
35.1%Less than 3
16.2%3 to 5
27.0%6 to 10
10.8%11 to 15
10.8%More than 15
At Current Fellowship Program
n=36
n=41 n=37
Geriatric MedicineApplicants Who Applied in the Specialty in the Past But Did Not Match Figure-10
Geriatric MedicineYears as Program Director Figure-11
NRMP Program Director Survey, Specialties Matching Service, 2016 110

Gynecologic Oncology
NRMP Program Director Survey, Specialties Matching Service, 2016 111

Gynecologic OncologyGeneral Information
Table 1
41
56
80
Number of programs in the Match
Number of positions in the Match
Number of applicants ranking specialty
24.4%Response rate
Appointment Years
Number of responses 10
Match Information*
* Source: NRMP Data Warehouse
2016 Survey
2016 2015 2014
44
52
91
40
53
87
NRMP Program Director Survey, Specialties Matching Service, 2016 112

Figure-1Gynecologic OncologyPercentage of Programs Citing Each Factor and Mean Importance Rating¹ for Each Factor in Selecting Applicants to Interview(N=9)
Average RatingPercent Citing Factor
¹ Ratings on a scale from 1 (not at all important) to 5 (very important).* International Medical Graduates only
1 2 3 4 5
4.84.04.34.44.73.54.04.63.64.13.64.45.04.03.53.54.83.64.54.44.43.53.43.62.83.84.53.83.03.04.04.04.85.03.73.5
4.53.02.0
100% 50% 0%
78%78%
100%100%
78%67%44%78%78%
100%78%89%56%78%56%67%67%78%89%78%78%56%78%56%67%56%67%44%56%22%33%33%56%22%44%22%
0%67%22%11%
Letters of recommendation in fellowship specialty
Residency performance evaluation (Program Director letter)
Reputation of residency program
Demonstrated involvement and perceived interest in research
Perceived commitment to specialty
Personal statement
Perceived interest in program
Evidence of professionalism and ethics
USMLE Step 1/COMLEX Level 1 score
Peer reviewed publications/authored textbook chapters
USMLE Step 2 CK/COMLEX Level 2 CE score
Leadership qualities
Personal prior professional knowledge of the applicant
Oral presentations/poster presentations/speaking engagements
Applicant was a resident in a core program at same institution
Pass USMLE Step 2 CS/COMLEX Level 2 PE
Any failed attempt in USMLE/COMLEX
USMLE Step 3/COMLEX Level 3 score
Interest in academic career
Residency program setting (univ.‐based vs. comm.‐based)
Clinical/laboratory research experience
Awards or special honors in medical school
Alpha Omega Alpha (AOA) membership
Other life experience
Medical Student Performance Evaluation (MSPE/Dean's Letter)
Graduate of highly‐regarded medical school
Visa status*
Volunteer/extracurricular experiences
Awarded grant money for research
Grades in medical school
Lack of gaps in medical education
Medical school class ranking/quartile
Applicant was flagged with Match violation by the NRMP
Electives at your fellowship site
Gold Humanism Honor Society (GHHS) membership
Residency class ranking/quartile
Fluency in language spoken by your patient population
In‐Training Examination (ITE)
Residency program size
Having finished another fellowship
NRMP Program Director Survey, Specialties Matching Service, 2016 113
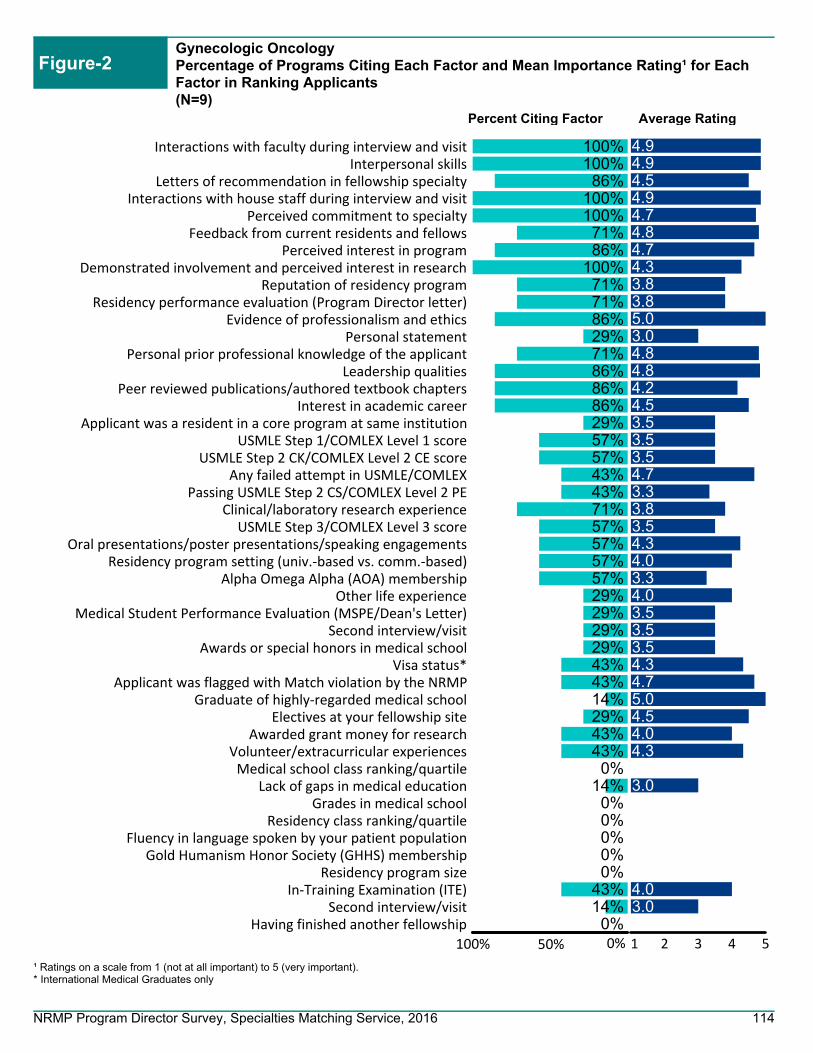
Gynecologic OncologyPercentage of Programs Citing Each Factor and Mean Importance Rating¹ for Each Factor in Ranking Applicants(N=9)
Figure-2
Average RatingPercent Citing Factor
¹ Ratings on a scale from 1 (not at all important) to 5 (very important).* International Medical Graduates only
1 2 3 4 5
4.94.94.54.94.74.84.74.33.83.85.03.04.84.84.24.53.53.53.54.73.33.83.54.34.03.34.03.53.53.54.34.75.04.54.04.3
3.0
4.03.0
100% 50% 0%
100%100%86%
100%100%71%86%
100%71%71%86%29%71%86%86%86%29%57%57%43%43%71%57%57%57%57%29%29%29%29%43%43%14%29%43%43%0%
14%0%0%0%0%0%
43%14%0%
Interactions with faculty during interview and visitInterpersonal skills
Letters of recommendation in fellowship specialtyInteractions with house staff during interview and visit
Perceived commitment to specialtyFeedback from current residents and fellows
Perceived interest in programDemonstrated involvement and perceived interest in research
Reputation of residency programResidency performance evaluation (Program Director letter)
Evidence of professionalism and ethicsPersonal statement
Personal prior professional knowledge of the applicantLeadership qualities
Peer reviewed publications/authored textbook chaptersInterest in academic career
Applicant was a resident in a core program at same institutionUSMLE Step 1/COMLEX Level 1 score
USMLE Step 2 CK/COMLEX Level 2 CE scoreAny failed attempt in USMLE/COMLEX
Passing USMLE Step 2 CS/COMLEX Level 2 PEClinical/laboratory research experience
USMLE Step 3/COMLEX Level 3 scoreOral presentations/poster presentations/speaking engagements
Residency program setting (univ.‐based vs. comm.‐based)Alpha Omega Alpha (AOA) membership
Other life experienceMedical Student Performance Evaluation (MSPE/Dean's Letter)
Second interview/visitAwards or special honors in medical school
Visa status*Applicant was flagged with Match violation by the NRMP
Graduate of highly‐regarded medical schoolElectives at your fellowship site
Awarded grant money for researchVolunteer/extracurricular experiencesMedical school class ranking/quartile
Lack of gaps in medical educationGrades in medical school
Residency class ranking/quartileFluency in language spoken by your patient population
Gold Humanism Honor Society (GHHS) membershipResidency program size
In‐Training Examination (ITE)Second interview/visit
Having finished another fellowship
NRMP Program Director Survey, Specialties Matching Service, 2016 114

Gynecologic OncologyPrograms That Use USMLE Step 1 and Step 2 Clinical Knowledge (CK) Scores When Considering Which Applicants to Interview
Figure-3
Percentage of Programs That Use USMLE Step 2 (CK) Score
0%
10%
20%
30%
40%
50%
60%
70%
80%
90%
100%
Never Seldom Often
22%
56%
22%
Would your program consider applicants who fail theexam on the first attempt?
0%
10%
20%
30%
40%
50%
60%
70%
80%
90%
100%
Never Seldom often
44% 44%
11%
Would your program consider applicants who failthe exam on the first attempt?
0%
10%
20%
30%
40%
50%
60%
70%
80%
90%
100%
Yes, pass only Yes, target score No
56%
33%
11%
Scores required?
0%
10%
20%
30%
40%
50%
60%
70%
80%
90%
100%
Yes, pass only Yes, target score No
56%
33%
11%
Scores required?
N=9
N=9
N=9N=9
IQR* of Average USMLE Step 1 and Step 2 CK Scores Programs Consider When Granting Interviews
Percentage of Programs That Use USMLE Step 1 Score
*The boxes in the boxplots represent the interquartile range (or IQR, which is the range between the 25th and 75th percentiles), and the line in the box is the median. The x-shaped symbol is the mean.
Scores Above Which Programs Almost Always Grant Interviews
Scores Below Which Programs Generally Do Not Grant Interviews
USMLE Step 2 CK not reported
because of low response rate
USMLE Step 1 not reported because of low response
rate
USMLE Step 2 CK not reported
because of low response rate
USMLE Step 1 not reported because of low response
rate
NRMP Program Director Survey, Specialties Matching Service, 2016 115
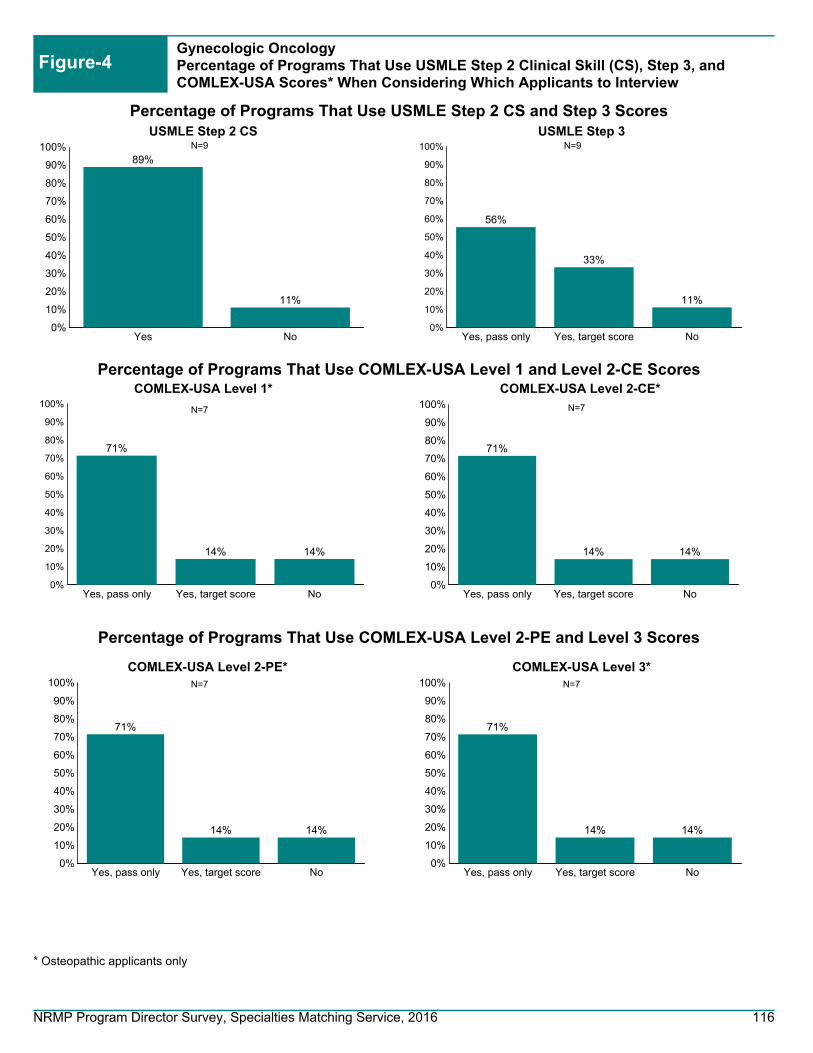
0%
10%
20%
30%
40%
50%
60%
70%
80%
90%
100%
Yes No
89%
11%
USMLE Step 2 CS
0%
10%
20%
30%
40%
50%
60%
70%
80%
90%
100%
Yes, pass only Yes, target score No
56%
33%
11%
USMLE Step 3
0%
10%
20%
30%
40%
50%
60%
70%
80%
90%
100%
Yes, pass only Yes, target score No
71%
14% 14%
COMLEX-USA Level 1*
Gynecologic OncologyPercentage of Programs That Use USMLE Step 2 Clinical Skill (CS), Step 3, and COMLEX-USA Scores* When Considering Which Applicants to Interview
Figure-4
0%
10%
20%
30%
40%
50%
60%
70%
80%
90%
100%
Yes, pass only Yes, target score No
71%
14% 14%
COMLEX-USA Level 2-CE*
0%
10%
20%
30%
40%
50%
60%
70%
80%
90%
100%
Yes, pass only Yes, target score No
71%
14% 14%
COMLEX-USA Level 3*
0%
10%
20%
30%
40%
50%
60%
70%
80%
90%
100%
Yes, pass only Yes, target score No
71%
14% 14%
COMLEX-USA Level 2-PE*
N=9 N=9
N=7 N=7
N=7 N=7
* Osteopathic applicants only
Percentage of Programs That Use USMLE Step 2 CS and Step 3 Scores
Percentage of Programs That Use COMLEX-USA Level 1 and Level 2-CE Scores
Percentage of Programs That Use COMLEX-USA Level 2-PE and Level 3 Scores
NRMP Program Director Survey, Specialties Matching Service, 2016 116
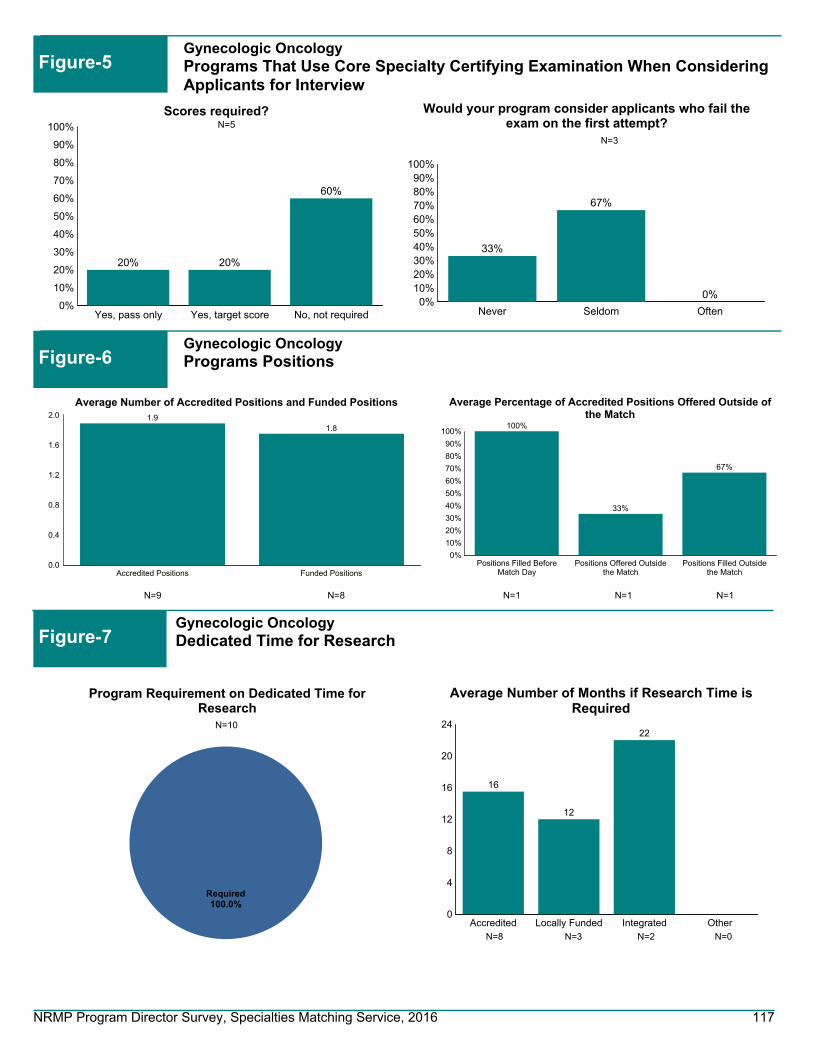
0%10%20%30%40%50%60%70%80%90%
100%
Never Seldom Often
33%
67%
0%
Would your program consider applicants who fail theexam on the first attempt?
0%
10%
20%
30%
40%
50%
60%
70%
80%
90%
100%
Yes, pass only Yes, target score No, not required
20% 20%
60%
Scores required?
N=3
N=5
100.0%Required
Program Requirement on Dedicated Time forResearch
N=10
0
4
8
12
16
20
24
Accredited Locally Funded Integrated Other
16
12
22
Average Number of Months if Research Time isRequired
N=8 N=3 N=2 N=0
0.0
0.4
0.8
1.2
1.6
2.0
Accredited Positions Funded Positions
1.91.8
Average Number of Accredited Positions and Funded Positions
0%
10%
20%
30%
40%
50%
60%
70%
80%
90%
100%
Positions Filled BeforeMatch Day
Positions Offered Outsidethe Match
Positions Filled Outsidethe Match
100%
33%
67%
Average Percentage of Accredited Positions Offered Outside ofthe Match
N=9 N=8 N=1 N=1 N=1
Gynecologic OncologyPrograms That Use Core Specialty Certifying Examination When Considering Applicants for Interview
Figure-5
Gynecologic OncologyPrograms Positions Figure-6
Gynecologic OncologyDedicated Time for Research Figure-7
NRMP Program Director Survey, Specialties Matching Service, 2016 117

0%
10%
20%
30%
40%
50%
60%
70%
80%
90%
100%100%
80%
90%
40%
80%
70%
U.S. Graduate OsteopathicPhysician
Canadian Fifth Pathway U.S. IMG Non-U.S. IMG
Percentage of Programs that Typically Interview and Rank Each Applicant Type
Figure-8Gynecologic OncologyProgram's Interview Activities
0%10%20%30%40%50%60%70%80%90%
100%
Rejected based on astandardized screening
process
In-depth review
33%
89%
Average Percentage of Applicants Rejected and Reviewed
0
20
40
60
80
100
Number of applicationsreceived
Number of interviewinvitations sent
Number of applicantsinterviewed
87
23 21
Average Number of Positions, Applications Received, InterviewInvitations Sent, and Applicants Interviewed and Ranked
N=10N=10N=10N=10
N=10
40% of Gynecologic Oncology programs consider all applicant groups
N=10
0%10%20%30%40%50%60%70%80%90%
100%
Prev. Grad Osteo Pathway Canadian US IMG Non-USIMG
60%
10% 10%30%
90%
40%
50%
80%
70%
100%
10%
40%
10%
Often Seldom Never
Interview
0%10%
20%
30%40%
50%60%
70%80%
90%100%
Prev. Grad Osteo Pathway Canadian US IMG Non-USIMG
10%
70%
10% 10%
40%
70%
30%
50%
80%
50%
100%
20%40%
10% 10%
Often Seldom Never
Ranking
n=10
Frequency of Programs Interviewing and Ranking Candidates
n=10
N=10
0%10%20%30%40%50%60%70%80%90%
100%
Jan Feb Mar Apr May Jun Jul Aug Sep Oct Nov Dec
0% 0% 0%
35%
53%
12%
0% 0% 0% 0% 0% 0%
Interview invitations
Interview Invitations Sent and Interviews Conducted
0% 0% 0% 0%10%
25%
45%
20%
0% 0% 0% 0%
Interviews conducted
NRMP Program Director Survey, Specialties Matching Service, 2016 118

Figure-9Gynecologic OncologyPotential Challenges in Recruiting Applicants to Your Specialty
0% 10% 20% 30% 40% 50% 60% 70% 80%
71%
29%
14%
0%
0%
We consider those applicants on an individual basis
We give those applicants serious consideration if they haveshown improvement
We do not usually consider those applicants
We favor those applicants
Other
0 1 2 3 4 5
Not enough applicants in the specialty
Undesirable income potential as a practicing physician
Undesirable work/life balance as a practicing physician
Long or irregular work hours required by specialty
Fellowship Match scheduled at inconvenient time of year
1.5
1.7
2.2
2.5
1.5
Average rating on a scale of 5 (1=least challenging; 5=most challenging)
n=6
12.5%Less than 3
50.0%3 to 5
37.5%More than 15
At Any Fellowship Program
25.0%Less than 3
37.5%3 to 5
37.5%More than 15
At Current Fellowship Program
n=7
n=8 n=8
Gynecologic OncologyApplicants Who Applied in the Specialty in the Past But Did Not Match Figure-10
Gynecologic OncologyYears as Program Director Figure-11
NRMP Program Director Survey, Specialties Matching Service, 2016 119

Hand Surgery
NRMP Program Director Survey, Specialties Matching Service, 2016 120

Hand SurgeryGeneral Information
Table 1
82
168
199
Number of programs in the Match
Number of positions in the Match
Number of applicants ranking specialty
43.0%Response rate
Appointment Years
Number of responses 34
Match Information*
* Source: NRMP Data Warehouse
2016 Survey
2016 2015 2014
83
166
173
80
160
205
NRMP Program Director Survey, Specialties Matching Service, 2016 121

Figure-1Hand SurgeryPercentage of Programs Citing Each Factor and Mean Importance Rating¹ for Each Factor in Selecting Applicants to Interview(N=33)
Average RatingPercent Citing Factor
¹ Ratings on a scale from 1 (not at all important) to 5 (very important).* International Medical Graduates only
1 2 3 4 5
4.74.53.84.04.33.94.34.73.53.73.44.43.93.63.83.94.13.44.13.83.73.33.33.93.43.04.33.83.23.13.73.34.84.03.43.73.43.23.32.4
100% 50% 0%
97%85%94%88%76%88%70%70%79%70%76%67%76%61%36%58%30%48%58%45%55%73%73%67%61%48%36%61%39%52%30%58%45%18%30%33%21%18%
9%21%
Letters of recommendation in fellowship specialty
Residency performance evaluation (Program Director letter)
Reputation of residency program
Demonstrated involvement and perceived interest in research
Perceived commitment to specialty
Personal statement
Perceived interest in program
Evidence of professionalism and ethics
USMLE Step 1/COMLEX Level 1 score
Peer reviewed publications/authored textbook chapters
USMLE Step 2 CK/COMLEX Level 2 CE score
Leadership qualities
Personal prior professional knowledge of the applicant
Oral presentations/poster presentations/speaking engagements
Applicant was a resident in a core program at same institution
Pass USMLE Step 2 CS/COMLEX Level 2 PE
Any failed attempt in USMLE/COMLEX
USMLE Step 3/COMLEX Level 3 score
Interest in academic career
Residency program setting (univ.‐based vs. comm.‐based)
Clinical/laboratory research experience
Awards or special honors in medical school
Alpha Omega Alpha (AOA) membership
Other life experience
Medical Student Performance Evaluation (MSPE/Dean's Letter)
Graduate of highly‐regarded medical school
Visa status*
Volunteer/extracurricular experiences
Awarded grant money for research
Grades in medical school
Lack of gaps in medical education
Medical school class ranking/quartile
Applicant was flagged with Match violation by the NRMP
Electives at your fellowship site
Gold Humanism Honor Society (GHHS) membership
Residency class ranking/quartile
Fluency in language spoken by your patient population
In‐Training Examination (ITE)
Residency program size
Having finished another fellowship
NRMP Program Director Survey, Specialties Matching Service, 2016 122

Hand SurgeryPercentage of Programs Citing Each Factor and Mean Importance Rating¹ for Each Factor in Ranking Applicants(N=33)
Figure-2
Average RatingPercent Citing Factor
¹ Ratings on a scale from 1 (not at all important) to 5 (very important).* International Medical Graduates only
1 2 3 4 5
4.84.74.74.84.44.84.33.84.04.54.64.04.04.43.74.03.83.83.94.93.93.63.73.83.53.74.13.64.03.14.44.93.33.83.53.93.43.83.33.73.73.52.02.83.74.0
100% 50% 0%
97%97%97%90%74%77%68%87%71%74%61%77%61%61%61%45%26%55%39%23%32%45%32%42%35%48%42%45%23%45%23%35%19%16%23%39%29%16%29%19%10%19%3%
16%10%13%
Interactions with faculty during interview and visitInterpersonal skills
Letters of recommendation in fellowship specialtyInteractions with house staff during interview and visit
Perceived commitment to specialtyFeedback from current residents and fellows
Perceived interest in programDemonstrated involvement and perceived interest in research
Reputation of residency programResidency performance evaluation (Program Director letter)
Evidence of professionalism and ethicsPersonal statement
Personal prior professional knowledge of the applicantLeadership qualities
Peer reviewed publications/authored textbook chaptersInterest in academic career
Applicant was a resident in a core program at same institutionUSMLE Step 1/COMLEX Level 1 score
USMLE Step 2 CK/COMLEX Level 2 CE scoreAny failed attempt in USMLE/COMLEX
Passing USMLE Step 2 CS/COMLEX Level 2 PEClinical/laboratory research experience
USMLE Step 3/COMLEX Level 3 scoreOral presentations/poster presentations/speaking engagements
Residency program setting (univ.‐based vs. comm.‐based)Alpha Omega Alpha (AOA) membership
Other life experienceMedical Student Performance Evaluation (MSPE/Dean's Letter)
Second interview/visitAwards or special honors in medical school
Visa status*Applicant was flagged with Match violation by the NRMP
Graduate of highly‐regarded medical schoolElectives at your fellowship site
Awarded grant money for researchVolunteer/extracurricular experiencesMedical school class ranking/quartile
Lack of gaps in medical educationGrades in medical school
Residency class ranking/quartileFluency in language spoken by your patient population
Gold Humanism Honor Society (GHHS) membershipResidency program size
In‐Training Examination (ITE)Second interview/visit
Having finished another fellowship
NRMP Program Director Survey, Specialties Matching Service, 2016 123

170
180
190
200
210
220
230
240
250
260
Hand SurgeryPrograms That Use USMLE Step 1 and Step 2 Clinical Knowledge (CK) Scores When Considering Which Applicants to Interview
Figure-3
Percentage of Programs That Use USMLE Step 2 (CK) Score
0%
10%
20%
30%
40%
50%
60%
70%
80%
90%
100%
Never Seldom Often
33%
63%
3%
Would your program consider applicants who fail theexam on the first attempt?
0%
10%
20%
30%
40%
50%
60%
70%
80%
90%
100%
Never Seldom often
40%
57%
3%
Would your program consider applicants who failthe exam on the first attempt?
0%
10%
20%
30%
40%
50%
60%
70%
80%
90%
100%
Yes, pass only Yes, target score No
65%
29%
6%
Scores required?
0%
10%
20%
30%
40%
50%
60%
70%
80%
90%
100%
Yes, pass only Yes, target score No
73%
23%
3%
Scores required?
N=31
N=30
N=30N=30
N=7N=8 N=8 N=7
IQR* of Average USMLE Step 1 and Step 2 CK Scores Programs Consider When Granting Interviews
Percentage of Programs That Use USMLE Step 1 Score
170
180
190
200
210
220
230
240
250
260
USMLE Step 2 CKUSMLE Step 1 USMLE Step 1 USMLE Step 2 CK
*The boxes in the boxplots represent the interquartile range (or IQR, which is the range between the 25th and 75th percentiles), and the line in the box is the median. The x-shaped symbol is the mean.
Scores Above Which Programs Almost Always Grant Interviews
Scores Below Which Programs Generally Do Not Grant Interviews
NRMP Program Director Survey, Specialties Matching Service, 2016 124

0%
10%
20%
30%
40%
50%
60%
70%
80%
90%
100%
Yes No
94%
6%
USMLE Step 2 CS
0%
10%
20%
30%
40%
50%
60%
70%
80%
90%
100%
Yes, pass only Yes, target score No
72%
10%17%
USMLE Step 3
0%
10%
20%
30%
40%
50%
60%
70%
80%
90%
100%
Yes, pass only Yes, target score No
27%
0%
73%
COMLEX-USA Level 1*
Hand SurgeryPercentage of Programs That Use USMLE Step 2 Clinical Skill (CS), Step 3, and COMLEX-USA Scores* When Considering Which Applicants to Interview
Figure-4
0%
10%
20%
30%
40%
50%
60%
70%
80%
90%
100%
Yes, pass only Yes, target score No
27%
0%
73%
COMLEX-USA Level 2-CE*
0%
10%
20%
30%
40%
50%
60%
70%
80%
90%
100%
Yes, pass only Yes, target score No
27%
0%
73%
COMLEX-USA Level 3*
0%
10%
20%
30%
40%
50%
60%
70%
80%
90%
100%
Yes, pass only Yes, target score No
27%
0%
73%
COMLEX-USA Level 2-PE*
N=31 N=29
N=11 N=11
N=11 N=11
* Osteopathic applicants only
Percentage of Programs That Use USMLE Step 2 CS and Step 3 Scores
Percentage of Programs That Use COMLEX-USA Level 1 and Level 2-CE Scores
Percentage of Programs That Use COMLEX-USA Level 2-PE and Level 3 Scores
NRMP Program Director Survey, Specialties Matching Service, 2016 125

0%10%20%30%40%50%60%70%80%90%
100%
Never Seldom Often
56%
44%
0%
Would your program consider applicants who fail theexam on the first attempt?
0%
10%
20%
30%
40%
50%
60%
70%
80%
90%
100%
Yes, pass only Yes, target score No, not required
10%
0%
90%
Scores required?
N=9
N=10
47.1%Optional
52.9%Required
Program Requirement on Dedicated Time forResearch
N=34
0.0
0.5
1.0
1.5
2.0
2.5
3.0
3.5
4.0
Accredited Locally Funded Integrated Other
3
3
4
2
Average Number of Months if Research Time isRequired
N=5 N=5 N=4 N=2
0.0
0.4
0.8
1.2
1.6
2.0
2.4
2.8
Accredited Positions Funded Positions
2.52.3
Average Number of Accredited Positions and Funded Positions
0%
10%
20%
30%
40%
50%
60%
70%
80%
90%
100%
Positions Filled BeforeMatch Day
Positions Offered Outsidethe Match
Positions Filled Outsidethe Match
100%
Average Percentage of Accredited Positions Offered Outside ofthe Match
N=34 N=28 N=10 N=0 N=0
Hand SurgeryPrograms That Use Core Specialty Certifying Examination When Considering Applicants for Interview
Figure-5
Hand SurgeryPrograms Positions Figure-6
Hand SurgeryDedicated Time for Research Figure-7
NRMP Program Director Survey, Specialties Matching Service, 2016 126

0%
10%
20%
30%
40%
50%
60%
70%
80%
90%
100%100%
70%77%
17% 17% 13%
U.S. Graduate OsteopathicPhysician
Canadian Fifth Pathway U.S. IMG Non-U.S. IMG
Percentage of Programs that Typically Interview and Rank Each Applicant Type
Figure-8Hand SurgeryProgram's Interview Activities
0%10%20%30%40%50%60%70%80%90%
100%
Rejected based on astandardized screening
process
In-depth review
31%
79%
Average Percentage of Applicants Rejected and Reviewed
0
10
20
30
40
50
60
70
80
Number of applicationsreceived
Number of interviewinvitations sent
Number of applicantsinterviewed
75
3530
Average Number of Positions, Applications Received, InterviewInvitations Sent, and Applicants Interviewed and Ranked
N=33N=33N=33N=33
N=30
7% of Hand Surgery programs consider all applicant groups
N=33
0%10%20%30%40%50%60%70%80%90%
100%
Prev. Grad Osteo Pathway Canadian US IMG Non-USIMG
6% 13%
64%
7%
31%45%
13%
50%
36%
53%
66%55%
81%
38% 40%
3%
Often Seldom Never
Interview
0%10%
20%
30%40%
50%60%
70%80%
90%100%
Prev. Grad Osteo Pathway Canadian US IMG Non-USIMG
3%23%
68%
7%
36%54%
14%
50%
29%
53%
57%
46%
83%
27%
4%
40%
7%
Often Seldom Never
Ranking
n=29
Frequency of Programs Interviewing and Ranking Candidates
n=32
N=31
0%10%20%30%40%50%60%70%80%90%
100%
Jan Feb Mar Apr May Jun Jul Aug Sep Oct Nov Dec
77%
8%0%
5%0% 0% 0% 0% 0% 1% 2% 6%
Interview invitations
Interview Invitations Sent and Interviews Conducted
13%
50%
23%
5% 3% 0% 0% 0% 0% 0% 0% 3%
Interviews conducted
NRMP Program Director Survey, Specialties Matching Service, 2016 127

Figure-9Hand SurgeryPotential Challenges in Recruiting Applicants to Your Specialty
0% 10% 20% 30% 40% 50% 60% 70% 80%
77%
20%
13%
0%
0%
We consider those applicants on an individual basis
We give those applicants serious consideration if they haveshown improvement
We do not usually consider those applicants
We favor those applicants
Other
0 1 2 3 4 5
Not enough applicants in the specialty
Undesirable income potential as a practicing physician
Undesirable work/life balance as a practicing physician
Long or irregular work hours required by specialty
Fellowship Match scheduled at inconvenient time of year
1.5
2.2
2.4
2.5
1.9
Average rating on a scale of 5 (1=least challenging; 5=most challenging)
n=31
17.2%Less than
3
13.8%3 to 5
24.1%6 to 1013.8%
11 to 15
31.0%More than 15
At Any Fellowship Program
14.3%Less than 3
14.3%3 to 5
35.7%6 to 10
3.6%11 to 15
32.1%More than 15
At Current Fellowship Program
n=30
n=29 n=28
Hand SurgeryApplicants Who Applied in the Specialty in the Past But Did Not Match Figure-10
Hand SurgeryYears as Program Director Figure-11
NRMP Program Director Survey, Specialties Matching Service, 2016 128

Hematology and Oncology
NRMP Program Director Survey, Specialties Matching Service, 2016 129

Hematology and OncologyGeneral Information
Table 1
131
521
693
Number of programs in the Match
Number of positions in the Match
Number of applicants ranking specialty
36.9%Response rate
Appointment Years
Number of responses 48
Match Information*
* Source: NRMP Data Warehouse
2016 Survey
2016 2015 2014
134
521
725
130
517
689
NRMP Program Director Survey, Specialties Matching Service, 2016 130

Figure-1Hematology and OncologyPercentage of Programs Citing Each Factor and Mean Importance Rating¹ for Each Factor in Selecting Applicants to Interview(N=36)
Average RatingPercent Citing Factor
¹ Ratings on a scale from 1 (not at all important) to 5 (very important).* International Medical Graduates only
1 2 3 4 5
4.24.44.14.14.53.84.44.73.94.34.04.14.34.14.14.04.53.84.54.14.03.64.03.63.73.74.03.23.83.34.03.54.73.53.43.93.8
3.22.8
100% 50% 0%
72%89%92%94%61%67%69%61%83%75%81%50%69%67%83%75%81%72%67%81%75%39%56%56%50%64%56%33%50%31%36%39%36%42%25%22%22%
0%17%14%
Letters of recommendation in fellowship specialty
Residency performance evaluation (Program Director letter)
Reputation of residency program
Demonstrated involvement and perceived interest in research
Perceived commitment to specialty
Personal statement
Perceived interest in program
Evidence of professionalism and ethics
USMLE Step 1/COMLEX Level 1 score
Peer reviewed publications/authored textbook chapters
USMLE Step 2 CK/COMLEX Level 2 CE score
Leadership qualities
Personal prior professional knowledge of the applicant
Oral presentations/poster presentations/speaking engagements
Applicant was a resident in a core program at same institution
Pass USMLE Step 2 CS/COMLEX Level 2 PE
Any failed attempt in USMLE/COMLEX
USMLE Step 3/COMLEX Level 3 score
Interest in academic career
Residency program setting (univ.‐based vs. comm.‐based)
Clinical/laboratory research experience
Awards or special honors in medical school
Alpha Omega Alpha (AOA) membership
Other life experience
Medical Student Performance Evaluation (MSPE/Dean's Letter)
Graduate of highly‐regarded medical school
Visa status*
Volunteer/extracurricular experiences
Awarded grant money for research
Grades in medical school
Lack of gaps in medical education
Medical school class ranking/quartile
Applicant was flagged with Match violation by the NRMP
Electives at your fellowship site
Gold Humanism Honor Society (GHHS) membership
Residency class ranking/quartile
Fluency in language spoken by your patient population
In‐Training Examination (ITE)
Residency program size
Having finished another fellowship
NRMP Program Director Survey, Specialties Matching Service, 2016 131

Hematology and OncologyPercentage of Programs Citing Each Factor and Mean Importance Rating¹ for Each Factor in Ranking Applicants(N=36)
Figure-2
Average RatingPercent Citing Factor
¹ Ratings on a scale from 1 (not at all important) to 5 (very important).* International Medical Graduates only
1 2 3 4 5
5.04.84.34.74.54.54.34.23.94.44.63.94.44.24.24.44.13.93.94.74.04.13.94.14.13.73.73.84.34.04.34.93.94.23.93.83.44.53.74.04.03.03.5
5.03.3
100% 50% 0%
85%85%58%73%61%76%61%91%67%64%64%55%48%48%67%64%52%64%58%52%58%67%48%42%45%36%21%18%27%21%36%27%24%18%42%12%21%6%9%
21%21%12%6%0%3%9%
Interactions with faculty during interview and visitInterpersonal skills
Letters of recommendation in fellowship specialtyInteractions with house staff during interview and visit
Perceived commitment to specialtyFeedback from current residents and fellows
Perceived interest in programDemonstrated involvement and perceived interest in research
Reputation of residency programResidency performance evaluation (Program Director letter)
Evidence of professionalism and ethicsPersonal statement
Personal prior professional knowledge of the applicantLeadership qualities
Peer reviewed publications/authored textbook chaptersInterest in academic career
Applicant was a resident in a core program at same institutionUSMLE Step 1/COMLEX Level 1 score
USMLE Step 2 CK/COMLEX Level 2 CE scoreAny failed attempt in USMLE/COMLEX
Passing USMLE Step 2 CS/COMLEX Level 2 PEClinical/laboratory research experience
USMLE Step 3/COMLEX Level 3 scoreOral presentations/poster presentations/speaking engagements
Residency program setting (univ.‐based vs. comm.‐based)Alpha Omega Alpha (AOA) membership
Other life experienceMedical Student Performance Evaluation (MSPE/Dean's Letter)
Second interview/visitAwards or special honors in medical school
Visa status*Applicant was flagged with Match violation by the NRMP
Graduate of highly‐regarded medical schoolElectives at your fellowship site
Awarded grant money for researchVolunteer/extracurricular experiencesMedical school class ranking/quartile
Lack of gaps in medical educationGrades in medical school
Residency class ranking/quartileFluency in language spoken by your patient population
Gold Humanism Honor Society (GHHS) membershipResidency program size
In‐Training Examination (ITE)Second interview/visit
Having finished another fellowship
NRMP Program Director Survey, Specialties Matching Service, 2016 132

170
180
190
200
210
220
230
240
250
260
Hematology and OncologyPrograms That Use USMLE Step 1 and Step 2 Clinical Knowledge (CK) Scores When Considering Which Applicants to Interview
Figure-3
Percentage of Programs That Use USMLE Step 2 (CK) Score
0%
10%
20%
30%
40%
50%
60%
70%
80%
90%
100%
Never Seldom Often
17%
81%
3%
Would your program consider applicants who fail theexam on the first attempt?
0%
10%
20%
30%
40%
50%
60%
70%
80%
90%
100%
Never Seldom often
26%
71%
3%
Would your program consider applicants who failthe exam on the first attempt?
0%
10%
20%
30%
40%
50%
60%
70%
80%
90%
100%
Yes, pass only Yes, target score No
63%
37%
0%
Scores required?
0%
10%
20%
30%
40%
50%
60%
70%
80%
90%
100%
Yes, pass only Yes, target score No
67%
33%
0%
Scores required?
N=35
N=36
N=36N=35
N=11N=12 N=9 N=8
IQR* of Average USMLE Step 1 and Step 2 CK Scores Programs Consider When Granting Interviews
Percentage of Programs That Use USMLE Step 1 Score
170
180
190
200
210
220
230
240
250
260
USMLE Step 2 CKUSMLE Step 1 USMLE Step 1 USMLE Step 2 CK
*The boxes in the boxplots represent the interquartile range (or IQR, which is the range between the 25th and 75th percentiles), and the line in the box is the median. The x-shaped symbol is the mean.
Scores Above Which Programs Almost Always Grant Interviews
Scores Below Which Programs Generally Do Not Grant Interviews
NRMP Program Director Survey, Specialties Matching Service, 2016 133

0%
10%
20%
30%
40%
50%
60%
70%
80%
90%
100%
Yes No
100%
0%
USMLE Step 2 CS
0%
10%
20%
30%
40%
50%
60%
70%
80%
90%
100%
Yes, pass only Yes, target score No
51%
37%
11%
USMLE Step 3
0%
10%
20%
30%
40%
50%
60%
70%
80%
90%
100%
Yes, pass only Yes, target score No
64%
32%
5%
COMLEX-USA Level 1*
Hematology and OncologyPercentage of Programs That Use USMLE Step 2 Clinical Skill (CS), Step 3, and COMLEX-USA Scores* When Considering Which Applicants to Interview
Figure-4
0%
10%
20%
30%
40%
50%
60%
70%
80%
90%
100%
Yes, pass only Yes, target score No
64%
32%
5%
COMLEX-USA Level 2-CE*
0%
10%
20%
30%
40%
50%
60%
70%
80%
90%
100%
Yes, pass only Yes, target score No
55%
36%
9%
COMLEX-USA Level 3*
0%
10%
20%
30%
40%
50%
60%
70%
80%
90%
100%
Yes, pass only Yes, target score No
68%
27%
5%
COMLEX-USA Level 2-PE*
N=36 N=35
N=22 N=22
N=22 N=22
* Osteopathic applicants only
Percentage of Programs That Use USMLE Step 2 CS and Step 3 Scores
Percentage of Programs That Use COMLEX-USA Level 1 and Level 2-CE Scores
Percentage of Programs That Use COMLEX-USA Level 2-PE and Level 3 Scores
NRMP Program Director Survey, Specialties Matching Service, 2016 134

0%10%20%30%40%50%60%70%80%90%
100%
Never Seldom Often
25%
63%
13%
Would your program consider applicants who fail theexam on the first attempt?
0%
10%
20%
30%
40%
50%
60%
70%
80%
90%
100%
Yes, pass only Yes, target score No, not required
15%8%
77%
Scores required?
N=8
N=13
31.3%Optional
68.8%Required
Program Requirement on Dedicated Time forResearch
N=48
0
2
4
6
8
10
12
Accredited Locally Funded Integrated Other
12
10
7 7
Average Number of Months if Research Time isRequired
N=14 N=11 N=5 N=5
0
2
4
6
8
10
Accredited Positions Funded Positions
9.0 8.8
Average Number of Accredited Positions and Funded Positions
0%
10%
20%
30%
40%
50%
60%
70%
80%
90%
100%
Positions Filled BeforeMatch Day
Positions Offered Outsidethe Match
Positions Filled Outsidethe Match
68%
31% 31%
Average Percentage of Accredited Positions Offered Outside ofthe Match
N=47 N=45 N=8 N=6 N=6
Hematology and OncologyPrograms That Use Core Specialty Certifying Examination When Considering Applicants for Interview
Figure-5
Hematology and OncologyPrograms Positions Figure-6
Hematology and OncologyDedicated Time for Research Figure-7
NRMP Program Director Survey, Specialties Matching Service, 2016 135

0%
10%
20%
30%
40%
50%
60%
70%
80%
90%
100% 93%84%
72%
42%
88%84%
U.S. Graduate OsteopathicPhysician
Canadian Fifth Pathway U.S. IMG Non-U.S. IMG
Percentage of Programs that Typically Interview and Rank Each Applicant Type
Figure-8Hematology and OncologyProgram's Interview Activities
0%10%20%30%40%50%60%70%80%90%
100%
Rejected based on astandardized screening
process
In-depth review
51%41%
Average Percentage of Applicants Rejected and Reviewed
0
40
80
120
160
200
240
280
320
Number of applicationsreceived
Number of interviewinvitations sent
Number of applicantsinterviewed
302
44 37
Average Number of Positions, Applications Received, InterviewInvitations Sent, and Applicants Interviewed and Ranked
N=42N=41N=44N=44
N=43
40% of Hematology and Oncology programs consider all applicant groups
N=44
0%10%20%30%40%50%60%70%80%90%
100%
Prev. Grad Osteo Pathway Canadian US IMG Non-USIMG
2%
56%
13% 5%5%
52%
38%
64%
44%17%
93%
48%
5%23%
56%
78%
Often Seldom Never
Interview
0%10%
20%
30%40%
50%60%
70%80%
90%100%
Prev. Grad Osteo Pathway Canadian US IMG Non-USIMG
3% 3%
55%
13%3% 8%
48%
39%
63%
46%23%
98%
50%
5%24%
51%69%
Often Seldom Never
Ranking
n=40
Frequency of Programs Interviewing and Ranking Candidates
n=42
N=37
0%10%20%30%40%50%60%70%80%90%
100%
Jan Feb Mar Apr May Jun Jul Aug Sep Oct Nov Dec
0% 0% 0% 0% 3% 0%11%
47%
34%
6%1% 0%
Interview invitations
Interview Invitations Sent and Interviews Conducted
0% 0% 0% 0% 0% 0% 0%5%
38%46%
3% 0%
Interviews conducted
NRMP Program Director Survey, Specialties Matching Service, 2016 136

Figure-9Hematology and OncologyPotential Challenges in Recruiting Applicants to Your Specialty
0% 10% 20% 30% 40% 50% 60% 70% 80%
77%
16%
16%
0%
3%
We consider those applicants on an individual basis
We give those applicants serious consideration if they haveshown improvement
We do not usually consider those applicants
We favor those applicants
Other
0 1 2 3 4 5
Not enough applicants in the specialty
Undesirable income potential as a practicing physician
Undesirable work/life balance as a practicing physician
Long or irregular work hours required by specialty
Fellowship Match scheduled at inconvenient time of year
1.4
1.7
2.8
2.4
1.8
Average rating on a scale of 5 (1=least challenging; 5=most challenging)
n=31
13.6%Less than 3
27.3%3 to 5
25.0%6 to 10
13.6%11 to 15
20.5%More than
15
At Any Fellowship Program
17.1%Less than 3
29.3%3 to 5
22.0%6 to 10
14.6%11 to 15
17.1%More than 15
At Current Fellowship Program
n=31
n=44 n=41
Hematology and OncologyApplicants Who Applied in the Specialty in the Past But Did Not Match Figure-10
Hematology and OncologyYears as Program Director Figure-11
NRMP Program Director Survey, Specialties Matching Service, 2016 137
Hospice and Palliative Medicine
NRMP Program Director Survey, Specialties Matching Service, 2016 138

Hospice and Palliative MedicineGeneral Information
Table 1
122
280
259
Number of programs in the Match
Number of positions in the Match
Number of applicants ranking specialty
39.6%Response rate
Appointment Years
Number of responses 42
Match Information*
* Source: NRMP Data Warehouse
2016 Survey
2016 2015 2014
NRMP Program Director Survey, Specialties Matching Service, 2016 139

Figure-1Hospice and Palliative MedicinePercentage of Programs Citing Each Factor and Mean Importance Rating¹ for Each Factor in Selecting Applicants to Interview(N=38)
Average RatingPercent Citing Factor
¹ Ratings on a scale from 1 (not at all important) to 5 (very important).* International Medical Graduates only
1 2 3 4 5
4.44.44.03.54.74.64.54.83.63.63.74.14.13.74.03.94.33.63.73.93.23.43.94.13.63.84.53.84.03.53.53.34.74.24.23.53.73.03.53.2
100% 50% 0%
92%89%79%66%95%95%79%82%61%55%53%71%71%63%55%55%58%45%34%34%16%63%47%76%63%61%45%50%13%47%32%42%39%45%37%24%39%
8%5%
26%
Letters of recommendation in fellowship specialty
Residency performance evaluation (Program Director letter)
Reputation of residency program
Demonstrated involvement and perceived interest in research
Perceived commitment to specialty
Personal statement
Perceived interest in program
Evidence of professionalism and ethics
USMLE Step 1/COMLEX Level 1 score
Peer reviewed publications/authored textbook chapters
USMLE Step 2 CK/COMLEX Level 2 CE score
Leadership qualities
Personal prior professional knowledge of the applicant
Oral presentations/poster presentations/speaking engagements
Applicant was a resident in a core program at same institution
Pass USMLE Step 2 CS/COMLEX Level 2 PE
Any failed attempt in USMLE/COMLEX
USMLE Step 3/COMLEX Level 3 score
Interest in academic career
Residency program setting (univ.‐based vs. comm.‐based)
Clinical/laboratory research experience
Awards or special honors in medical school
Alpha Omega Alpha (AOA) membership
Other life experience
Medical Student Performance Evaluation (MSPE/Dean's Letter)
Graduate of highly‐regarded medical school
Visa status*
Volunteer/extracurricular experiences
Awarded grant money for research
Grades in medical school
Lack of gaps in medical education
Medical school class ranking/quartile
Applicant was flagged with Match violation by the NRMP
Electives at your fellowship site
Gold Humanism Honor Society (GHHS) membership
Residency class ranking/quartile
Fluency in language spoken by your patient population
In‐Training Examination (ITE)
Residency program size
Having finished another fellowship
NRMP Program Director Survey, Specialties Matching Service, 2016 140

Hospice and Palliative MedicinePercentage of Programs Citing Each Factor and Mean Importance Rating¹ for Each Factor in Ranking Applicants(N=38)
Figure-2
Average RatingPercent Citing Factor
¹ Ratings on a scale from 1 (not at all important) to 5 (very important).* International Medical Graduates only
1 2 3 4 5
4.94.94.54.84.74.74.63.54.04.54.84.74.24.44.13.94.13.63.64.33.93.63.73.83.83.74.23.94.23.84.34.83.94.54.23.83.73.83.54.04.33.83.04.04.43.6
100% 50% 0%
92%92%81%68%89%59%81%35%54%54%73%76%59%46%35%30%46%27%30%41%27%14%27%35%30%30%46%43%24%30%24%30%27%30%14%27%19%11%16%22%27%22%3%5%
14%19%
Interactions with faculty during interview and visitInterpersonal skills
Letters of recommendation in fellowship specialtyInteractions with house staff during interview and visit
Perceived commitment to specialtyFeedback from current residents and fellows
Perceived interest in programDemonstrated involvement and perceived interest in research
Reputation of residency programResidency performance evaluation (Program Director letter)
Evidence of professionalism and ethicsPersonal statement
Personal prior professional knowledge of the applicantLeadership qualities
Peer reviewed publications/authored textbook chaptersInterest in academic career
Applicant was a resident in a core program at same institutionUSMLE Step 1/COMLEX Level 1 score
USMLE Step 2 CK/COMLEX Level 2 CE scoreAny failed attempt in USMLE/COMLEX
Passing USMLE Step 2 CS/COMLEX Level 2 PEClinical/laboratory research experience
USMLE Step 3/COMLEX Level 3 scoreOral presentations/poster presentations/speaking engagements
Residency program setting (univ.‐based vs. comm.‐based)Alpha Omega Alpha (AOA) membership
Other life experienceMedical Student Performance Evaluation (MSPE/Dean's Letter)
Second interview/visitAwards or special honors in medical school
Visa status*Applicant was flagged with Match violation by the NRMP
Graduate of highly‐regarded medical schoolElectives at your fellowship site
Awarded grant money for researchVolunteer/extracurricular experiencesMedical school class ranking/quartile
Lack of gaps in medical educationGrades in medical school
Residency class ranking/quartileFluency in language spoken by your patient population
Gold Humanism Honor Society (GHHS) membershipResidency program size
In‐Training Examination (ITE)Second interview/visit
Having finished another fellowship
NRMP Program Director Survey, Specialties Matching Service, 2016 141

Hospice and Palliative MedicinePrograms That Use USMLE Step 1 and Step 2 Clinical Knowledge (CK) Scores When Considering Which Applicants to Interview
Figure-3
Percentage of Programs That Use USMLE Step 2 (CK) Score
0%
10%
20%
30%
40%
50%
60%
70%
80%
90%
100%
Never Seldom Often
23%
52%
26%
Would your program consider applicants who fail theexam on the first attempt?
0%
10%
20%
30%
40%
50%
60%
70%
80%
90%
100%
Never Seldom often
26%
55%
19%
Would your program consider applicants who failthe exam on the first attempt?
0%
10%
20%
30%
40%
50%
60%
70%
80%
90%
100%
Yes, pass only Yes, target score No
74%
20%
6%
Scores required?
0%
10%
20%
30%
40%
50%
60%
70%
80%
90%
100%
Yes, pass only Yes, target score No
74%
20%
6%
Scores required?
N=35
N=31
N=35N=31
IQR* of Average USMLE Step 1 and Step 2 CK Scores Programs Consider When Granting Interviews
Percentage of Programs That Use USMLE Step 1 Score
*The boxes in the boxplots represent the interquartile range (or IQR, which is the range between the 25th and 75th percentiles), and the line in the box is the median. The x-shaped symbol is the mean.
Scores Above Which Programs Almost Always Grant Interviews
Scores Below Which Programs Generally Do Not Grant Interviews
USMLE Step 2 CK not reported
because of low response rate
USMLE Step 1 not reported because of low response
rate
USMLE Step 2 CK not reported
because of low response rate
USMLE Step 1 not reported because of low response
rate
NRMP Program Director Survey, Specialties Matching Service, 2016 142

0%
10%
20%
30%
40%
50%
60%
70%
80%
90%
100%
Yes No
94%
6%
USMLE Step 2 CS
0%
10%
20%
30%
40%
50%
60%
70%
80%
90%
100%
Yes, pass only Yes, target score No
78%
17%
6%
USMLE Step 3
0%
10%
20%
30%
40%
50%
60%
70%
80%
90%
100%
Yes, pass only Yes, target score No
76%
12% 12%
COMLEX-USA Level 1*
Hospice and Palliative MedicinePercentage of Programs That Use USMLE Step 2 Clinical Skill (CS), Step 3, and COMLEX-USA Scores* When Considering Which Applicants to Interview
Figure-4
0%
10%
20%
30%
40%
50%
60%
70%
80%
90%
100%
Yes, pass only Yes, target score No
76%
12% 12%
COMLEX-USA Level 2-CE*
0%
10%
20%
30%
40%
50%
60%
70%
80%
90%
100%
Yes, pass only Yes, target score No
75%
13% 13%
COMLEX-USA Level 3*
0%
10%
20%
30%
40%
50%
60%
70%
80%
90%
100%
Yes, pass only Yes, target score No
76%
12% 12%
COMLEX-USA Level 2-PE*
N=35 N=36
N=25 N=25
N=25 N=24
* Osteopathic applicants only
Percentage of Programs That Use USMLE Step 2 CS and Step 3 Scores
Percentage of Programs That Use COMLEX-USA Level 1 and Level 2-CE Scores
Percentage of Programs That Use COMLEX-USA Level 2-PE and Level 3 Scores
NRMP Program Director Survey, Specialties Matching Service, 2016 143
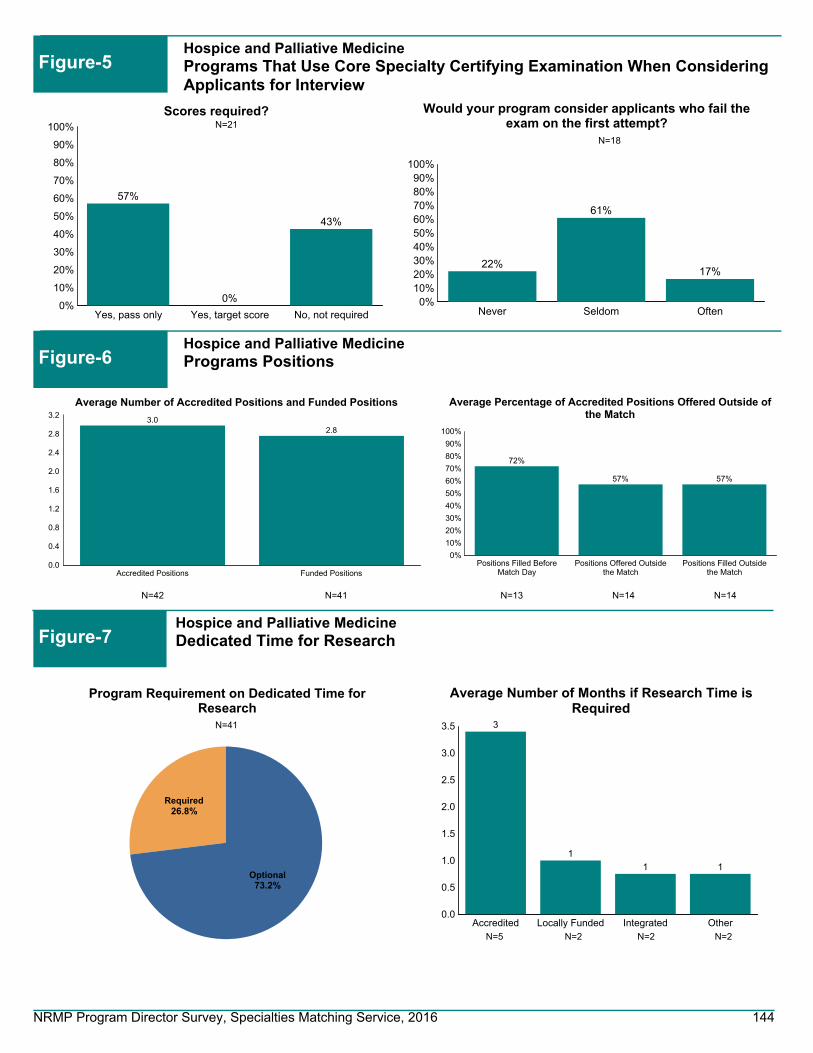
0%10%20%30%40%50%60%70%80%90%
100%
Never Seldom Often
22%
61%
17%
Would your program consider applicants who fail theexam on the first attempt?
0%
10%
20%
30%
40%
50%
60%
70%
80%
90%
100%
Yes, pass only Yes, target score No, not required
57%
0%
43%
Scores required?
N=18
N=21
73.2%Optional
26.8%Required
Program Requirement on Dedicated Time forResearch
N=41
0.0
0.5
1.0
1.5
2.0
2.5
3.0
3.5
Accredited Locally Funded Integrated Other
3
1
1 1
Average Number of Months if Research Time isRequired
N=5 N=2 N=2 N=2
0.0
0.4
0.8
1.2
1.6
2.0
2.4
2.8
3.2
Accredited Positions Funded Positions
3.02.8
Average Number of Accredited Positions and Funded Positions
0%
10%
20%
30%
40%
50%
60%
70%
80%
90%
100%
Positions Filled BeforeMatch Day
Positions Offered Outsidethe Match
Positions Filled Outsidethe Match
72%
57% 57%
Average Percentage of Accredited Positions Offered Outside ofthe Match
N=42 N=41 N=13 N=14 N=14
Hospice and Palliative MedicinePrograms That Use Core Specialty Certifying Examination When Considering Applicants for Interview
Figure-5
Hospice and Palliative MedicinePrograms Positions Figure-6
Hospice and Palliative MedicineDedicated Time for Research Figure-7
NRMP Program Director Survey, Specialties Matching Service, 2016 144

0%
10%
20%
30%
40%
50%
60%
70%
80%
90%
100% 97% 97%
47%
13%
68%
39%
U.S. Graduate OsteopathicPhysician
Canadian Fifth Pathway U.S. IMG Non-U.S. IMG
Percentage of Programs that Typically Interview and Rank Each Applicant Type
Figure-8Hospice and Palliative MedicineProgram's Interview Activities
0%10%20%30%40%50%60%70%80%90%
100%
Rejected based on astandardized screening
process
In-depth review
30%
76%
Average Percentage of Applicants Rejected and Reviewed
0
5
10
15
20
25
30
35
Number of applicationsreceived
Number of interviewinvitations sent
Number of applicantsinterviewed
33
1613
Average Number of Positions, Applications Received, InterviewInvitations Sent, and Applicants Interviewed and Ranked
N=38N=37N=39N=39
N=38
11% of Hospice and Palliative Medicine programs consider all applicant groups
N=39
0%10%20%30%40%50%60%70%80%90%
100%
Prev. Grad Osteo Pathway Canadian US IMG Non-USIMG
3%
79%
44%
16%35%
16%
15%
31%
51%
46%100%
82%
6%25% 32%
19%
Often Seldom Never
Interview
0%10%
20%
30%40%
50%60%
70%80%
90%100%
Prev. Grad Osteo Pathway Canadian US IMG Non-USIMG
3% 3%
82%
49%
17%
50%
16%
12%
29%
53%
39%
97%81%
6%23% 31%
11%
Often Seldom Never
Ranking
n=37
Frequency of Programs Interviewing and Ranking Candidates
n=37
N=38
0%10%20%30%40%50%60%70%80%90%
100%
Jan Feb Mar Apr May Jun Jul Aug Sep Oct Nov Dec
1% 1% 0% 0% 1% 3%
16%
35%24%
8% 6% 3%
Interview invitations
Interview Invitations Sent and Interviews Conducted
0% 0% 3% 0% 0% 0% 1%
17%
33% 31%
7% 6%
Interviews conducted
NRMP Program Director Survey, Specialties Matching Service, 2016 145

Figure-9Hospice and Palliative MedicinePotential Challenges in Recruiting Applicants to Your Specialty
0% 20% 40% 60% 80% 100%
91%
27%
0%
0%
0%
We consider those applicants on an individual basis
We give those applicants serious consideration if they haveshown improvement
We do not usually consider those applicants
We favor those applicants
Other
0 1 2 3 4 5
Not enough applicants in the specialty
Undesirable income potential as a practicing physician
Undesirable work/life balance as a practicing physician
Long or irregular work hours required by specialty
Fellowship Match scheduled at inconvenient time of year
3.8
2.6
2.3
1.7
2.5
Average rating on a scale of 5 (1=least challenging; 5=most challenging)
n=34
27.5%Less than 3
32.5%3 to 5
30.0%6 to 10
7.5%11 to
15 2.5%More than 15
At Any Fellowship Program
33.3%Less than
3
35.9%3 to 5
25.6%6 to 10
5.1%11 to 15
At Current Fellowship Program
n=33
n=40 n=39
Hospice and Palliative MedicineApplicants Who Applied in the Specialty in the Past But Did Not Match Figure-10
Hospice and Palliative MedicineYears as Program Director Figure-11
NRMP Program Director Survey, Specialties Matching Service, 2016 146

Infectious Disease
NRMP Program Director Survey, Specialties Matching Service, 2016 147

Infectious DiseaseGeneral Information
Table 1
142
335
229
Number of programs in the Match
Number of positions in the Match
Number of applicants ranking specialty
44.4%Response rate
Appointment Years
Number of responses 59
Match Information*
* Source: NRMP Data Warehouse
2016 Survey
2016 2015 2014
138
327
254
134
328
276
NRMP Program Director Survey, Specialties Matching Service, 2016 148

Figure-1Infectious DiseasePercentage of Programs Citing Each Factor and Mean Importance Rating¹ for Each Factor in Selecting Applicants to Interview(N=50)
Average RatingPercent Citing Factor
¹ Ratings on a scale from 1 (not at all important) to 5 (very important).* International Medical Graduates only
1 2 3 4 5
4.34.43.94.04.33.94.44.63.53.83.64.14.33.84.33.64.13.54.24.14.03.53.83.93.54.04.03.53.43.43.73.54.73.53.84.13.64.43.73.0
100% 50% 0%
84%90%82%62%82%78%66%68%74%58%74%48%56%52%66%72%72%70%40%68%52%48%50%44%60%46%42%42%36%36%34%44%36%24%26%30%22%10%24%
6%
Letters of recommendation in fellowship specialty
Residency performance evaluation (Program Director letter)
Reputation of residency program
Demonstrated involvement and perceived interest in research
Perceived commitment to specialty
Personal statement
Perceived interest in program
Evidence of professionalism and ethics
USMLE Step 1/COMLEX Level 1 score
Peer reviewed publications/authored textbook chapters
USMLE Step 2 CK/COMLEX Level 2 CE score
Leadership qualities
Personal prior professional knowledge of the applicant
Oral presentations/poster presentations/speaking engagements
Applicant was a resident in a core program at same institution
Pass USMLE Step 2 CS/COMLEX Level 2 PE
Any failed attempt in USMLE/COMLEX
USMLE Step 3/COMLEX Level 3 score
Interest in academic career
Residency program setting (univ.‐based vs. comm.‐based)
Clinical/laboratory research experience
Awards or special honors in medical school
Alpha Omega Alpha (AOA) membership
Other life experience
Medical Student Performance Evaluation (MSPE/Dean's Letter)
Graduate of highly‐regarded medical school
Visa status*
Volunteer/extracurricular experiences
Awarded grant money for research
Grades in medical school
Lack of gaps in medical education
Medical school class ranking/quartile
Applicant was flagged with Match violation by the NRMP
Electives at your fellowship site
Gold Humanism Honor Society (GHHS) membership
Residency class ranking/quartile
Fluency in language spoken by your patient population
In‐Training Examination (ITE)
Residency program size
Having finished another fellowship
NRMP Program Director Survey, Specialties Matching Service, 2016 149
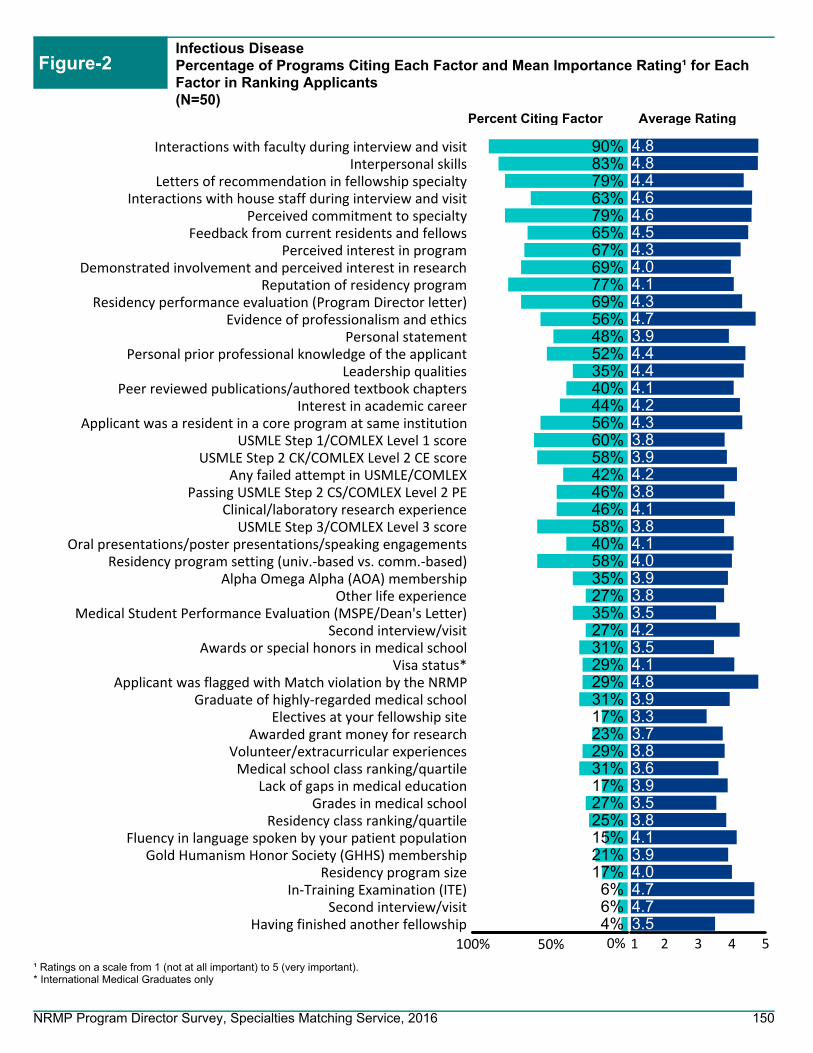
Infectious DiseasePercentage of Programs Citing Each Factor and Mean Importance Rating¹ for Each Factor in Ranking Applicants(N=50)
Figure-2
Average RatingPercent Citing Factor
¹ Ratings on a scale from 1 (not at all important) to 5 (very important).* International Medical Graduates only
1 2 3 4 5
4.84.84.44.64.64.54.34.04.14.34.73.94.44.44.14.24.33.83.94.23.84.13.84.14.03.93.83.54.23.54.14.83.93.33.73.83.63.93.53.84.13.94.04.74.73.5
100% 50% 0%
90%83%79%63%79%65%67%69%77%69%56%48%52%35%40%44%56%60%58%42%46%46%58%40%58%35%27%35%27%31%29%29%31%17%23%29%31%17%27%25%15%21%17%6%6%4%
Interactions with faculty during interview and visitInterpersonal skills
Letters of recommendation in fellowship specialtyInteractions with house staff during interview and visit
Perceived commitment to specialtyFeedback from current residents and fellows
Perceived interest in programDemonstrated involvement and perceived interest in research
Reputation of residency programResidency performance evaluation (Program Director letter)
Evidence of professionalism and ethicsPersonal statement
Personal prior professional knowledge of the applicantLeadership qualities
Peer reviewed publications/authored textbook chaptersInterest in academic career
Applicant was a resident in a core program at same institutionUSMLE Step 1/COMLEX Level 1 score
USMLE Step 2 CK/COMLEX Level 2 CE scoreAny failed attempt in USMLE/COMLEX
Passing USMLE Step 2 CS/COMLEX Level 2 PEClinical/laboratory research experience
USMLE Step 3/COMLEX Level 3 scoreOral presentations/poster presentations/speaking engagements
Residency program setting (univ.‐based vs. comm.‐based)Alpha Omega Alpha (AOA) membership
Other life experienceMedical Student Performance Evaluation (MSPE/Dean's Letter)
Second interview/visitAwards or special honors in medical school
Visa status*Applicant was flagged with Match violation by the NRMP
Graduate of highly‐regarded medical schoolElectives at your fellowship site
Awarded grant money for researchVolunteer/extracurricular experiencesMedical school class ranking/quartile
Lack of gaps in medical educationGrades in medical school
Residency class ranking/quartileFluency in language spoken by your patient population
Gold Humanism Honor Society (GHHS) membershipResidency program size
In‐Training Examination (ITE)Second interview/visit
Having finished another fellowship
NRMP Program Director Survey, Specialties Matching Service, 2016 150

170
180
190
200
210
220
230
240
250
260
Infectious DiseasePrograms That Use USMLE Step 1 and Step 2 Clinical Knowledge (CK) Scores When Considering Which Applicants to Interview
Figure-3
Percentage of Programs That Use USMLE Step 2 (CK) Score
0%
10%
20%
30%
40%
50%
60%
70%
80%
90%
100%
Never Seldom Often
10%
60%
30%
Would your program consider applicants who fail theexam on the first attempt?
0%
10%
20%
30%
40%
50%
60%
70%
80%
90%
100%
Never Seldom often
12%
58%
30%
Would your program consider applicants who failthe exam on the first attempt?
0%
10%
20%
30%
40%
50%
60%
70%
80%
90%
100%
Yes, pass only Yes, target score No
80%
16%
4%
Scores required?
0%
10%
20%
30%
40%
50%
60%
70%
80%
90%
100%
Yes, pass only Yes, target score No
80%
16%
4%
Scores required?
N=50
N=50
N=50N=50
N=6N=6 N=6 N=6
IQR* of Average USMLE Step 1 and Step 2 CK Scores Programs Consider When Granting Interviews
Percentage of Programs That Use USMLE Step 1 Score
170
180
190
200
210
220
230
240
250
260
USMLE Step 2 CKUSMLE Step 1 USMLE Step 1 USMLE Step 2 CK
*The boxes in the boxplots represent the interquartile range (or IQR, which is the range between the 25th and 75th percentiles), and the line in the box is the median. The x-shaped symbol is the mean.
Scores Above Which Programs Almost Always Grant Interviews
Scores Below Which Programs Generally Do Not Grant Interviews
NRMP Program Director Survey, Specialties Matching Service, 2016 151

0%
10%
20%
30%
40%
50%
60%
70%
80%
90%
100%
Yes No
96%
4%
USMLE Step 2 CS
0%
10%
20%
30%
40%
50%
60%
70%
80%
90%
100%
Yes, pass only Yes, target score No
75%
13% 13%
USMLE Step 3
0%
10%
20%
30%
40%
50%
60%
70%
80%
90%
100%
Yes, pass only Yes, target score No
74%
5%
21%
COMLEX-USA Level 1*
Infectious DiseasePercentage of Programs That Use USMLE Step 2 Clinical Skill (CS), Step 3, and COMLEX-USA Scores* When Considering Which Applicants to Interview
Figure-4
0%
10%
20%
30%
40%
50%
60%
70%
80%
90%
100%
Yes, pass only Yes, target score No
74%
5%
21%
COMLEX-USA Level 2-CE*
0%
10%
20%
30%
40%
50%
60%
70%
80%
90%
100%
Yes, pass only Yes, target score No
69%
6%
25%
COMLEX-USA Level 3*
0%
10%
20%
30%
40%
50%
60%
70%
80%
90%
100%
Yes, pass only Yes, target score No
74%
5%
21%
COMLEX-USA Level 2-PE*
N=49 N=48
N=39 N=38
N=39 N=36
* Osteopathic applicants only
Percentage of Programs That Use USMLE Step 2 CS and Step 3 Scores
Percentage of Programs That Use COMLEX-USA Level 1 and Level 2-CE Scores
Percentage of Programs That Use COMLEX-USA Level 2-PE and Level 3 Scores
NRMP Program Director Survey, Specialties Matching Service, 2016 152

0%10%20%30%40%50%60%70%80%90%
100%
Never Seldom Often
7%
67%
27%
Would your program consider applicants who fail theexam on the first attempt?
0%
10%
20%
30%
40%
50%
60%
70%
80%
90%
100%
Yes, pass only Yes, target score No, not required
23%
0%
77%
Scores required?
N=15
N=22
17.2%Optional
82.8%Required
Program Requirement on Dedicated Time forResearch
N=58
0
2
4
6
8
10
12
Accredited Locally Funded Integrated Other
9
8
7
11
Average Number of Months if Research Time isRequired
N=28 N=11 N=4 N=7
0.0
0.5
1.0
1.5
2.0
2.5
3.0
3.5
4.0
4.5
Accredited Positions Funded Positions
4.24.0
Average Number of Accredited Positions and Funded Positions
0%
10%
20%
30%
40%
50%
60%
70%
80%
90%
100%
Positions Filled BeforeMatch Day
Positions Offered Outsidethe Match
Positions Filled Outsidethe Match
52%59%
46%
Average Percentage of Accredited Positions Offered Outside ofthe Match
N=58 N=55 N=20 N=20 N=18
Infectious DiseasePrograms That Use Core Specialty Certifying Examination When Considering Applicants for Interview
Figure-5
Infectious DiseasePrograms Positions Figure-6
Infectious DiseaseDedicated Time for Research Figure-7
NRMP Program Director Survey, Specialties Matching Service, 2016 153

0%
10%
20%
30%
40%
50%
60%
70%
80%
90%
100% 98%90%
66%
40%
92%
80%
U.S. Graduate OsteopathicPhysician
Canadian Fifth Pathway U.S. IMG Non-U.S. IMG
Percentage of Programs that Typically Interview and Rank Each Applicant Type
Figure-8Infectious DiseaseProgram's Interview Activities
0%10%20%30%40%50%60%70%80%90%
100%
Rejected based on astandardized screening
process
In-depth review
22%
80%
Average Percentage of Applicants Rejected and Reviewed
0
5
10
15
20
25
30
35
40
45
Number of applicationsreceived
Number of interviewinvitations sent
Number of applicantsinterviewed
42
24
15
Average Number of Positions, Applications Received, InterviewInvitations Sent, and Applicants Interviewed and Ranked
N=54N=55N=55N=55
N=50
36% of Infectious Disease programs consider all applicant groups
N=54
0%10%20%30%40%50%60%70%80%90%
100%
Prev. Grad Osteo Pathway Canadian US IMG Non-USIMG
2% 4%
51%31%
2% 10%6%
30%
45%
46%
38% 26%
92%
66%
4%23%
60% 64%
Often Seldom Never
Interview
0%10%
20%
30%40%
50%60%
70%80%
90%100%
Prev. Grad Osteo Pathway Canadian US IMG Non-USIMG
2% 4%
57%
32%
2%10%2%
34%
38%
38%
37%31%
96%
62%
4%
30%
61% 59%
Often Seldom Never
Ranking
n=49
Frequency of Programs Interviewing and Ranking Candidates
n=50
N=48
0%10%20%30%40%50%60%70%80%90%
100%
Jan Feb Mar Apr May Jun Jul Aug Sep Oct Nov Dec
2% 0% 1% 1% 0% 0%
31%36%
19%9%
1% 0%
Interview invitations
Interview Invitations Sent and Interviews Conducted
0% 1% 2% 1% 0% 0% 1%
15%
38% 35%
4% 0%
Interviews conducted
NRMP Program Director Survey, Specialties Matching Service, 2016 154

Figure-9Infectious DiseasePotential Challenges in Recruiting Applicants to Your Specialty
0% 10% 20% 30% 40% 50% 60% 70% 80%
76%
20%
24%
0%
2%
We consider those applicants on an individual basis
We give those applicants serious consideration if they haveshown improvement
We do not usually consider those applicants
We favor those applicants
Other
0 1 2 3 4 5
Not enough applicants in the specialty
Undesirable income potential as a practicing physician
Undesirable work/life balance as a practicing physician
Long or irregular work hours required by specialty
Fellowship Match scheduled at inconvenient time of year
4.9
4.7
3.3
3.0
1.9
Average rating on a scale of 5 (1=least challenging; 5=most challenging)
n=46
19.6%Less than 3
21.6%3 to 5
25.5%6 to 10
13.7%11 to 15
19.6%More than
15
At Any Fellowship Program
23.5%Less than 3
21.6%3 to 5
25.5%6 to 10
15.7%11 to 15
13.7%More than 15
At Current Fellowship Program
n=46
n=51 n=51
Infectious DiseaseApplicants Who Applied in the Specialty in the Past But Did Not Match Figure-10
Infectious DiseaseYears as Program Director Figure-11
NRMP Program Director Survey, Specialties Matching Service, 2016 155

Interventional Radiology
NRMP Program Director Survey, Specialties Matching Service, 2016 156

Interventional RadiologyGeneral Information
Table 1
81
238
240
Number of programs in the Match
Number of positions in the Match
Number of applicants ranking specialty
37.0%Response rate
Appointment Years
Number of responses 30
Match Information*
* Source: NRMP Data Warehouse
2016 Survey
2016 2015 2014
82
234
270
81
227
275
NRMP Program Director Survey, Specialties Matching Service, 2016 157

Figure-1Interventional RadiologyPercentage of Programs Citing Each Factor and Mean Importance Rating¹ for Each Factor in Selecting Applicants to Interview(N=24)
Average RatingPercent Citing Factor
¹ Ratings on a scale from 1 (not at all important) to 5 (very important).* International Medical Graduates only
1 2 3 4 5
4.84.54.03.64.53.94.34.43.63.83.64.34.43.74.43.43.93.43.83.53.52.93.13.92.73.14.03.63.63.23.03.44.83.63.84.23.75.04.03.0
100% 50% 0%
92%88%92%
100%79%79%88%63%79%83%71%79%71%75%67%63%67%50%46%54%63%63%63%58%67%46%50%46%46%42%29%42%38%46%17%25%13%
4%8%
17%
Letters of recommendation in fellowship specialty
Residency performance evaluation (Program Director letter)
Reputation of residency program
Demonstrated involvement and perceived interest in research
Perceived commitment to specialty
Personal statement
Perceived interest in program
Evidence of professionalism and ethics
USMLE Step 1/COMLEX Level 1 score
Peer reviewed publications/authored textbook chapters
USMLE Step 2 CK/COMLEX Level 2 CE score
Leadership qualities
Personal prior professional knowledge of the applicant
Oral presentations/poster presentations/speaking engagements
Applicant was a resident in a core program at same institution
Pass USMLE Step 2 CS/COMLEX Level 2 PE
Any failed attempt in USMLE/COMLEX
USMLE Step 3/COMLEX Level 3 score
Interest in academic career
Residency program setting (univ.‐based vs. comm.‐based)
Clinical/laboratory research experience
Awards or special honors in medical school
Alpha Omega Alpha (AOA) membership
Other life experience
Medical Student Performance Evaluation (MSPE/Dean's Letter)
Graduate of highly‐regarded medical school
Visa status*
Volunteer/extracurricular experiences
Awarded grant money for research
Grades in medical school
Lack of gaps in medical education
Medical school class ranking/quartile
Applicant was flagged with Match violation by the NRMP
Electives at your fellowship site
Gold Humanism Honor Society (GHHS) membership
Residency class ranking/quartile
Fluency in language spoken by your patient population
In‐Training Examination (ITE)
Residency program size
Having finished another fellowship
NRMP Program Director Survey, Specialties Matching Service, 2016 158
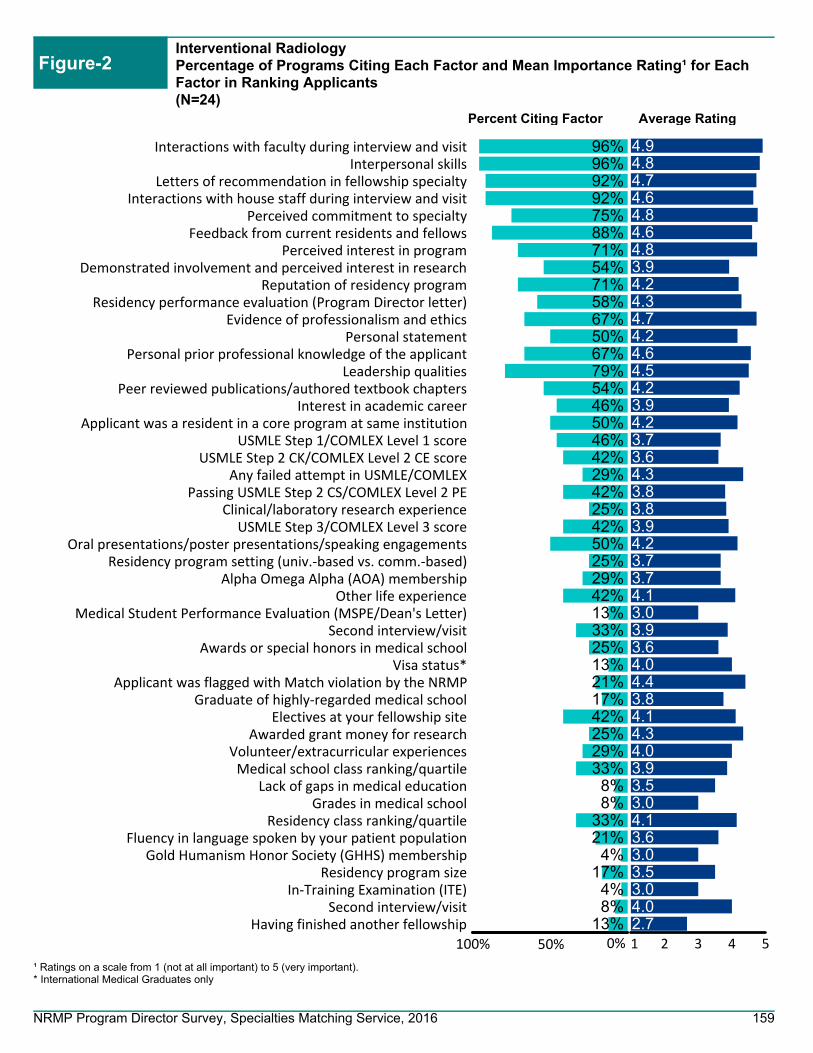
Interventional RadiologyPercentage of Programs Citing Each Factor and Mean Importance Rating¹ for Each Factor in Ranking Applicants(N=24)
Figure-2
Average RatingPercent Citing Factor
¹ Ratings on a scale from 1 (not at all important) to 5 (very important).* International Medical Graduates only
1 2 3 4 5
4.94.84.74.64.84.64.83.94.24.34.74.24.64.54.23.94.23.73.64.33.83.83.94.23.73.74.13.03.93.64.04.43.84.14.34.03.93.53.04.13.63.03.53.04.02.7
100% 50% 0%
96%96%92%92%75%88%71%54%71%58%67%50%67%79%54%46%50%46%42%29%42%25%42%50%25%29%42%13%33%25%13%21%17%42%25%29%33%8%8%
33%21%4%
17%4%8%
13%
Interactions with faculty during interview and visitInterpersonal skills
Letters of recommendation in fellowship specialtyInteractions with house staff during interview and visit
Perceived commitment to specialtyFeedback from current residents and fellows
Perceived interest in programDemonstrated involvement and perceived interest in research
Reputation of residency programResidency performance evaluation (Program Director letter)
Evidence of professionalism and ethicsPersonal statement
Personal prior professional knowledge of the applicantLeadership qualities
Peer reviewed publications/authored textbook chaptersInterest in academic career
Applicant was a resident in a core program at same institutionUSMLE Step 1/COMLEX Level 1 score
USMLE Step 2 CK/COMLEX Level 2 CE scoreAny failed attempt in USMLE/COMLEX
Passing USMLE Step 2 CS/COMLEX Level 2 PEClinical/laboratory research experience
USMLE Step 3/COMLEX Level 3 scoreOral presentations/poster presentations/speaking engagements
Residency program setting (univ.‐based vs. comm.‐based)Alpha Omega Alpha (AOA) membership
Other life experienceMedical Student Performance Evaluation (MSPE/Dean's Letter)
Second interview/visitAwards or special honors in medical school
Visa status*Applicant was flagged with Match violation by the NRMP
Graduate of highly‐regarded medical schoolElectives at your fellowship site
Awarded grant money for researchVolunteer/extracurricular experiencesMedical school class ranking/quartile
Lack of gaps in medical educationGrades in medical school
Residency class ranking/quartileFluency in language spoken by your patient population
Gold Humanism Honor Society (GHHS) membershipResidency program size
In‐Training Examination (ITE)Second interview/visit
Having finished another fellowship
NRMP Program Director Survey, Specialties Matching Service, 2016 159

170
180
190
200
210
220
230
240
250
260
Interventional RadiologyPrograms That Use USMLE Step 1 and Step 2 Clinical Knowledge (CK) Scores When Considering Which Applicants to Interview
Figure-3
Percentage of Programs That Use USMLE Step 2 (CK) Score
0%
10%
20%
30%
40%
50%
60%
70%
80%
90%
100%
Never Seldom Often
25%
71%
4%
Would your program consider applicants who fail theexam on the first attempt?
0%
10%
20%
30%
40%
50%
60%
70%
80%
90%
100%
Never Seldom often
25%
71%
4%
Would your program consider applicants who failthe exam on the first attempt?
0%
10%
20%
30%
40%
50%
60%
70%
80%
90%
100%
Yes, pass only Yes, target score No
44%
56%
0%
Scores required?
0%
10%
20%
30%
40%
50%
60%
70%
80%
90%
100%
Yes, pass only Yes, target score No
60%
40%
0%
Scores required?
N=25
N=24
N=25N=24
N=8 N=7
IQR* of Average USMLE Step 1 and Step 2 CK Scores Programs Consider When Granting Interviews
Percentage of Programs That Use USMLE Step 1 Score
170
180
190
200
210
220
230
240
250
260
USMLE Step 1 USMLE Step 1
*The boxes in the boxplots represent the interquartile range (or IQR, which is the range between the 25th and 75th percentiles), and the line in the box is the median. The x-shaped symbol is the mean.
Scores Above Which Programs Almost Always Grant Interviews
Scores Below Which Programs Generally Do Not Grant Interviews
USMLE Step 2 CK not reported
because of low response rate
USMLE Step 2 CK not reported
because of low response rate
NRMP Program Director Survey, Specialties Matching Service, 2016 160
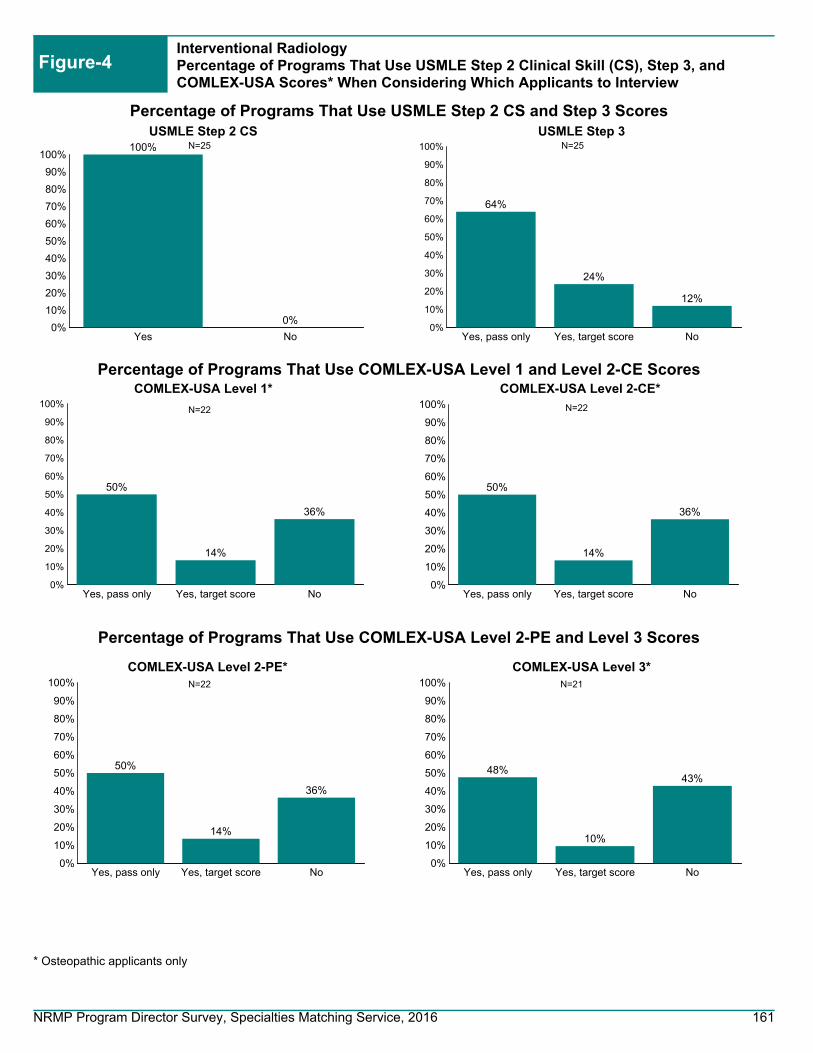
0%
10%
20%
30%
40%
50%
60%
70%
80%
90%
100%
Yes No
100%
0%
USMLE Step 2 CS
0%
10%
20%
30%
40%
50%
60%
70%
80%
90%
100%
Yes, pass only Yes, target score No
64%
24%
12%
USMLE Step 3
0%
10%
20%
30%
40%
50%
60%
70%
80%
90%
100%
Yes, pass only Yes, target score No
50%
14%
36%
COMLEX-USA Level 1*
Interventional RadiologyPercentage of Programs That Use USMLE Step 2 Clinical Skill (CS), Step 3, and COMLEX-USA Scores* When Considering Which Applicants to Interview
Figure-4
0%
10%
20%
30%
40%
50%
60%
70%
80%
90%
100%
Yes, pass only Yes, target score No
50%
14%
36%
COMLEX-USA Level 2-CE*
0%
10%
20%
30%
40%
50%
60%
70%
80%
90%
100%
Yes, pass only Yes, target score No
48%
10%
43%
COMLEX-USA Level 3*
0%
10%
20%
30%
40%
50%
60%
70%
80%
90%
100%
Yes, pass only Yes, target score No
50%
14%
36%
COMLEX-USA Level 2-PE*
N=25 N=25
N=22 N=22
N=22 N=21
* Osteopathic applicants only
Percentage of Programs That Use USMLE Step 2 CS and Step 3 Scores
Percentage of Programs That Use COMLEX-USA Level 1 and Level 2-CE Scores
Percentage of Programs That Use COMLEX-USA Level 2-PE and Level 3 Scores
NRMP Program Director Survey, Specialties Matching Service, 2016 161

0%10%20%30%40%50%60%70%80%90%
100%
Never Seldom Often
36%
64%
0%
Would your program consider applicants who fail theexam on the first attempt?
0%
10%
20%
30%
40%
50%
60%
70%
80%
90%
100%
Yes, pass only Yes, target score No, not required
29%
6%
65%
Scores required?
N=11
N=17
90.0%Optional
10.0%Required
Program Requirement on Dedicated Time forResearch
N=30
0.0
0.2
0.4
0.6
0.8
1.0
Accredited Locally Funded Integrated Other
1
0
Average Number of Months if Research Time isRequired
N=3 N=0 N=1 N=0
0.0
0.5
1.0
1.5
2.0
2.5
3.0
3.5
4.0
Accredited Positions Funded Positions
3.83.6
Average Number of Accredited Positions and Funded Positions
0%
10%
20%
30%
40%
50%
60%
70%
80%
90%
100%
Positions Filled BeforeMatch Day
Positions Offered Outsidethe Match
Positions Filled Outsidethe Match
77%
40%44%
Average Percentage of Accredited Positions Offered Outside ofthe Match
N=29 N=27 N=5 N=4 N=3
Interventional RadiologyPrograms That Use Core Specialty Certifying Examination When Considering Applicants for Interview
Figure-5
Interventional RadiologyPrograms Positions Figure-6
Interventional RadiologyDedicated Time for Research Figure-7
NRMP Program Director Survey, Specialties Matching Service, 2016 162

0%
10%
20%
30%
40%
50%
60%
70%
80%
90%
100%89%
96%89%
41%
78%
41%
U.S. Graduate OsteopathicPhysician
Canadian Fifth Pathway U.S. IMG Non-U.S. IMG
Percentage of Programs that Typically Interview and Rank Each Applicant Type
Figure-8Interventional RadiologyProgram's Interview Activities
0%10%20%30%40%50%60%70%80%90%
100%
Rejected based on astandardized screening
process
In-depth review
21%
73%
Average Percentage of Applicants Rejected and Reviewed
0
20
40
60
80
100
120
Number of applicationsreceived
Number of interviewinvitations sent
Number of applicantsinterviewed
105
36 32
Average Number of Positions, Applications Received, InterviewInvitations Sent, and Applicants Interviewed and Ranked
N=27N=27N=28N=28
N=27
37% of Interventional Radiology programs consider all applicant groups
N=28
0%10%20%30%40%50%60%70%80%90%
100%
Prev. Grad Osteo Pathway Canadian US IMG Non-USIMG
4%
31%
4% 7%
37%
7%
41%
69%
81% 70%
52%89%
59%
15% 22%11%
Often Seldom Never
Interview
0%10%
20%
30%40%
50%60%
70%80%
90%100%
Prev. Grad Osteo Pathway Canadian US IMG Non-USIMG
40%
8% 12%
36%
8%
42%
52%
69% 62%
48%92%
58%
8%23% 27%
16%
Often Seldom Never
Ranking
n=26
Frequency of Programs Interviewing and Ranking Candidates
n=27
N=25
0%10%20%30%40%50%60%70%80%90%
100%
Jan Feb Mar Apr May Jun Jul Aug Sep Oct Nov Dec
49%
30%
5%0% 0% 0% 0% 0% 0% 0% 3%
13%
Interview invitations
Interview Invitations Sent and Interviews Conducted
8%
30%38%
17%
3% 0% 0% 0% 0% 0% 0% 0%
Interviews conducted
NRMP Program Director Survey, Specialties Matching Service, 2016 163

Figure-9Interventional RadiologyPotential Challenges in Recruiting Applicants to Your Specialty
0% 20% 40% 60% 80% 100%
88%
13%
21%
0%
0%
We consider those applicants on an individual basis
We give those applicants serious consideration if they haveshown improvement
We do not usually consider those applicants
We favor those applicants
Other
0 1 2 3 4 5
Not enough applicants in the specialty
Undesirable income potential as a practicing physician
Undesirable work/life balance as a practicing physician
Long or irregular work hours required by specialty
Fellowship Match scheduled at inconvenient time of year
1.8
1.5
3.1
3.2
2.5
Average rating on a scale of 5 (1=least challenging; 5=most challenging)
n=23
20.0%Less than 3
28.0%3 to 5
24.0%6 to 10
12.0%11 to 15
16.0%More than 15
At Any Fellowship Program
27.3%Less than 3
36.4%3 to 5
18.2%6 to 10
4.5%11 to 15
13.6%More than
15
At Current Fellowship Program
n=24
n=25 n=22
Interventional RadiologyApplicants Who Applied in the Specialty in the Past But Did Not Match Figure-10
Interventional RadiologyYears as Program Director Figure-11
NRMP Program Director Survey, Specialties Matching Service, 2016 164
Maternal-Fetal Medicine
NRMP Program Director Survey, Specialties Matching Service, 2016 165

Maternal-Fetal MedicineGeneral Information
Table 1
75
104
140
Number of programs in the Match
Number of positions in the Match
Number of applicants ranking specialty
35.6%Response rate
Appointment Years
Number of responses 26
Match Information*
* Source: NRMP Data Warehouse
2016 Survey
2016 2015 2014
70
97
144
73
101
142
NRMP Program Director Survey, Specialties Matching Service, 2016 166

Figure-1Maternal-Fetal MedicinePercentage of Programs Citing Each Factor and Mean Importance Rating¹ for Each Factor in Selecting Applicants to Interview(N=15)
Average RatingPercent Citing Factor
¹ Ratings on a scale from 1 (not at all important) to 5 (very important).* International Medical Graduates only
1 2 3 4 5
4.04.23.84.34.13.43.94.23.64.13.73.93.64.13.63.64.43.74.03.63.93.43.43.33.03.14.32.83.53.43.83.05.04.04.04.04.34.32.02.0
100% 50% 0%
93%87%80%
100%73%87%60%87%80%93%80%53%67%73%53%80%87%73%87%87%73%53%53%53%47%60%67%27%27%53%40%40%20%
7%33%
7%20%20%
7%7%
Letters of recommendation in fellowship specialty
Residency performance evaluation (Program Director letter)
Reputation of residency program
Demonstrated involvement and perceived interest in research
Perceived commitment to specialty
Personal statement
Perceived interest in program
Evidence of professionalism and ethics
USMLE Step 1/COMLEX Level 1 score
Peer reviewed publications/authored textbook chapters
USMLE Step 2 CK/COMLEX Level 2 CE score
Leadership qualities
Personal prior professional knowledge of the applicant
Oral presentations/poster presentations/speaking engagements
Applicant was a resident in a core program at same institution
Pass USMLE Step 2 CS/COMLEX Level 2 PE
Any failed attempt in USMLE/COMLEX
USMLE Step 3/COMLEX Level 3 score
Interest in academic career
Residency program setting (univ.‐based vs. comm.‐based)
Clinical/laboratory research experience
Awards or special honors in medical school
Alpha Omega Alpha (AOA) membership
Other life experience
Medical Student Performance Evaluation (MSPE/Dean's Letter)
Graduate of highly‐regarded medical school
Visa status*
Volunteer/extracurricular experiences
Awarded grant money for research
Grades in medical school
Lack of gaps in medical education
Medical school class ranking/quartile
Applicant was flagged with Match violation by the NRMP
Electives at your fellowship site
Gold Humanism Honor Society (GHHS) membership
Residency class ranking/quartile
Fluency in language spoken by your patient population
In‐Training Examination (ITE)
Residency program size
Having finished another fellowship
NRMP Program Director Survey, Specialties Matching Service, 2016 167

Maternal-Fetal MedicinePercentage of Programs Citing Each Factor and Mean Importance Rating¹ for Each Factor in Ranking Applicants(N=15)
Figure-2
Average RatingPercent Citing Factor
¹ Ratings on a scale from 1 (not at all important) to 5 (very important).* International Medical Graduates only
1 2 3 4 5
5.04.93.84.54.34.54.44.23.54.14.33.33.63.54.04.13.03.53.74.23.73.53.44.03.22.83.24.04.23.05.05.02.05.02.52.05.05.03.33.54.03.3
5.04.02.0
100% 50% 0%
100%100%85%85%77%85%54%92%62%54%69%46%54%62%62%77%15%46%46%46%46%46%38%54%38%38%38%8%
38%8%
31%23%8%8%
23%8%8%
23%31%15%15%23%0%8%8%8%
Interactions with faculty during interview and visitInterpersonal skills
Letters of recommendation in fellowship specialtyInteractions with house staff during interview and visit
Perceived commitment to specialtyFeedback from current residents and fellows
Perceived interest in programDemonstrated involvement and perceived interest in research
Reputation of residency programResidency performance evaluation (Program Director letter)
Evidence of professionalism and ethicsPersonal statement
Personal prior professional knowledge of the applicantLeadership qualities
Peer reviewed publications/authored textbook chaptersInterest in academic career
Applicant was a resident in a core program at same institutionUSMLE Step 1/COMLEX Level 1 score
USMLE Step 2 CK/COMLEX Level 2 CE scoreAny failed attempt in USMLE/COMLEX
Passing USMLE Step 2 CS/COMLEX Level 2 PEClinical/laboratory research experience
USMLE Step 3/COMLEX Level 3 scoreOral presentations/poster presentations/speaking engagements
Residency program setting (univ.‐based vs. comm.‐based)Alpha Omega Alpha (AOA) membership
Other life experienceMedical Student Performance Evaluation (MSPE/Dean's Letter)
Second interview/visitAwards or special honors in medical school
Visa status*Applicant was flagged with Match violation by the NRMP
Graduate of highly‐regarded medical schoolElectives at your fellowship site
Awarded grant money for researchVolunteer/extracurricular experiencesMedical school class ranking/quartile
Lack of gaps in medical educationGrades in medical school
Residency class ranking/quartileFluency in language spoken by your patient population
Gold Humanism Honor Society (GHHS) membershipResidency program size
In‐Training Examination (ITE)Second interview/visit
Having finished another fellowship
NRMP Program Director Survey, Specialties Matching Service, 2016 168

Maternal-Fetal MedicinePrograms That Use USMLE Step 1 and Step 2 Clinical Knowledge (CK) Scores When Considering Which Applicants to Interview
Figure-3
Percentage of Programs That Use USMLE Step 2 (CK) Score
0%
10%
20%
30%
40%
50%
60%
70%
80%
90%
100%
Never Seldom Often
13%
73%
13%
Would your program consider applicants who fail theexam on the first attempt?
0%
10%
20%
30%
40%
50%
60%
70%
80%
90%
100%
Never Seldom often
20%
67%
13%
Would your program consider applicants who failthe exam on the first attempt?
0%
10%
20%
30%
40%
50%
60%
70%
80%
90%
100%
Yes, pass only Yes, target score No
73%
20%
7%
Scores required?
0%
10%
20%
30%
40%
50%
60%
70%
80%
90%
100%
Yes, pass only Yes, target score No
67%
27%
7%
Scores required?
N=15
N=15
N=15N=15
IQR* of Average USMLE Step 1 and Step 2 CK Scores Programs Consider When Granting Interviews
Percentage of Programs That Use USMLE Step 1 Score
*The boxes in the boxplots represent the interquartile range (or IQR, which is the range between the 25th and 75th percentiles), and the line in the box is the median. The x-shaped symbol is the mean.
Scores Above Which Programs Almost Always Grant Interviews
Scores Below Which Programs Generally Do Not Grant Interviews
USMLE Step 2 CK not reported
because of low response rate
USMLE Step 1 not reported because of low response
rate
USMLE Step 2 CK not reported
because of low response rate
USMLE Step 1 not reported because of low response
rate
NRMP Program Director Survey, Specialties Matching Service, 2016 169

0%
10%
20%
30%
40%
50%
60%
70%
80%
90%
100%
Yes No
93%
7%
USMLE Step 2 CS
0%
10%
20%
30%
40%
50%
60%
70%
80%
90%
100%
Yes, pass only Yes, target score No
67%
20%13%
USMLE Step 3
0%
10%
20%
30%
40%
50%
60%
70%
80%
90%
100%
Yes, pass only Yes, target score No
56%
22% 22%
COMLEX-USA Level 1*
Maternal-Fetal MedicinePercentage of Programs That Use USMLE Step 2 Clinical Skill (CS), Step 3, and COMLEX-USA Scores* When Considering Which Applicants to Interview
Figure-4
0%
10%
20%
30%
40%
50%
60%
70%
80%
90%
100%
Yes, pass only Yes, target score No
56%
22% 22%
COMLEX-USA Level 2-CE*
0%
10%
20%
30%
40%
50%
60%
70%
80%
90%
100%
Yes, pass only Yes, target score No
56%
11%
33%
COMLEX-USA Level 3*
0%
10%
20%
30%
40%
50%
60%
70%
80%
90%
100%
Yes, pass only Yes, target score No
56%
22% 22%
COMLEX-USA Level 2-PE*
N=15 N=15
N=9 N=9
N=9 N=9
* Osteopathic applicants only
Percentage of Programs That Use USMLE Step 2 CS and Step 3 Scores
Percentage of Programs That Use COMLEX-USA Level 1 and Level 2-CE Scores
Percentage of Programs That Use COMLEX-USA Level 2-PE and Level 3 Scores
NRMP Program Director Survey, Specialties Matching Service, 2016 170

0%10%20%30%40%50%60%70%80%90%
100%
Never Seldom Often
50% 50%
0%
Would your program consider applicants who fail theexam on the first attempt?
0%
10%
20%
30%
40%
50%
60%
70%
80%
90%
100%
Yes, pass only Yes, target score No, not required
20%
0%
80%
Scores required?
N=2
N=5
3.8%Optional
96.2%Required
Program Requirement on Dedicated Time forResearch
N=26
0
2
4
6
8
10
12
14
Accredited Locally Funded Integrated Other
13
10
12 12
Average Number of Months if Research Time isRequired
N=18 N=6 N=1 N=2
0.0
0.4
0.8
1.2
1.6
2.0
2.4
2.8
Accredited Positions Funded Positions
2.5
2.1
Average Number of Accredited Positions and Funded Positions
0%
10%
20%
30%
40%
50%
60%
70%
80%
90%
100%
Positions Filled BeforeMatch Day
Positions Offered Outsidethe Match
Positions Filled Outsidethe Match
100%
Average Percentage of Accredited Positions Offered Outside ofthe Match
N=26 N=20 N=2 N=0 N=0
Maternal-Fetal MedicinePrograms That Use Core Specialty Certifying Examination When Considering Applicants for Interview
Figure-5
Maternal-Fetal MedicinePrograms Positions Figure-6
Maternal-Fetal MedicineDedicated Time for Research Figure-7
NRMP Program Director Survey, Specialties Matching Service, 2016 171

0%
10%
20%
30%
40%
50%
60%
70%
80%
90%
100%
84%
100%
74%
32%
79%
63%
U.S. Graduate OsteopathicPhysician
Canadian Fifth Pathway U.S. IMG Non-U.S. IMG
Percentage of Programs that Typically Interview and Rank Each Applicant Type
Figure-8Maternal-Fetal MedicineProgram's Interview Activities
0%10%20%30%40%50%60%70%80%90%
100%
Rejected based on astandardized screening
process
In-depth review
42%
72%
Average Percentage of Applicants Rejected and Reviewed
0
10
20
30
40
50
60
Number of applicationsreceived
Number of interviewinvitations sent
Number of applicantsinterviewed
55
2017
Average Number of Positions, Applications Received, InterviewInvitations Sent, and Applicants Interviewed and Ranked
N=19N=20N=19N=21
N=19
26% of Maternal-Fetal Medicine programs consider all applicant groups
N=20
0%10%20%30%40%50%60%70%80%90%
100%
Prev. Grad Osteo Pathway Canadian US IMG Non-USIMG
11%
50%
22%6%
28%22%
39%
56%
56%
39%89%
78%
11%22%
39% 33%
Often Seldom Never
Interview
0%10%
20%
30%40%
50%60%
70%80%
90%100%
Prev. Grad Osteo Pathway Canadian US IMG Non-USIMG
11%
56%
33%
6%
28%39%
33%
56%
67%
67%89%
61%
11% 11%28%
6%
Often Seldom Never
Ranking
n=18
Frequency of Programs Interviewing and Ranking Candidates
n=18
N=19
0%10%20%30%40%50%60%70%80%90%
100%
Jan Feb Mar Apr May Jun Jul Aug Sep Oct Nov Dec
0% 0% 0% 2%
22%
56%
12% 8%2% 0% 0% 0%
Interview invitations
Interview Invitations Sent and Interviews Conducted
0% 0% 0% 0% 1% 5%
34%41%
8%0% 0% 0%
Interviews conducted
NRMP Program Director Survey, Specialties Matching Service, 2016 172

Figure-9Maternal-Fetal MedicinePotential Challenges in Recruiting Applicants to Your Specialty
0% 20% 40% 60% 80% 100%
92%
15%
0%
0%
0%
We consider those applicants on an individual basis
We give those applicants serious consideration if they haveshown improvement
We do not usually consider those applicants
We favor those applicants
Other
0 1 2 3 4 5
Not enough applicants in the specialty
Undesirable income potential as a practicing physician
Undesirable work/life balance as a practicing physician
Long or irregular work hours required by specialty
Fellowship Match scheduled at inconvenient time of year
1.7
1.8
3.1
3.2
2.3
Average rating on a scale of 5 (1=least challenging; 5=most challenging)
n=13
30.4%Less than 3
17.4%3 to 5
21.7%6 to 10
17.4%11 to 15
13.0%More than 15
At Any Fellowship Program
27.3%Less than 3
27.3%3 to 5
27.3%6 to 10
4.5%11 to 15
13.6%More than
15
At Current Fellowship Program
n=13
n=23 n=22
Maternal-Fetal MedicineApplicants Who Applied in the Specialty in the Past But Did Not Match Figure-10
Maternal-Fetal MedicineYears as Program Director Figure-11
NRMP Program Director Survey, Specialties Matching Service, 2016 173

Neonatal-Perinatal Medicine
NRMP Program Director Survey, Specialties Matching Service, 2016 174

Neonatal-Perinatal MedicineGeneral Information
Table 1
91
252
249
Number of programs in the Match
Number of positions in the Match
Number of applicants ranking specialty
52.7%Response rate
Appointment Years
Number of responses 48
Match Information*
* Source: NRMP Data Warehouse
2016 Survey
2016 2015 2014
92
242
295
90
241
248
NRMP Program Director Survey, Specialties Matching Service, 2016 175

Figure-1Neonatal-Perinatal MedicinePercentage of Programs Citing Each Factor and Mean Importance Rating¹ for Each Factor in Selecting Applicants to Interview(N=38)
Average RatingPercent Citing Factor
¹ Ratings on a scale from 1 (not at all important) to 5 (very important).* International Medical Graduates only
1 2 3 4 5
4.54.74.24.34.44.04.34.74.03.94.14.34.43.94.04.14.44.14.63.94.03.63.83.53.73.53.73.24.03.53.53.54.83.63.54.43.24.03.53.5
100% 50% 0%
95%86%89%95%82%84%82%74%79%82%82%84%76%68%84%71%95%71%79%79%79%59%65%47%53%61%57%41%61%54%51%32%47%32%46%27%14%19%29%11%
Letters of recommendation in fellowship specialty
Residency performance evaluation (Program Director letter)
Reputation of residency program
Demonstrated involvement and perceived interest in research
Perceived commitment to specialty
Personal statement
Perceived interest in program
Evidence of professionalism and ethics
USMLE Step 1/COMLEX Level 1 score
Peer reviewed publications/authored textbook chapters
USMLE Step 2 CK/COMLEX Level 2 CE score
Leadership qualities
Personal prior professional knowledge of the applicant
Oral presentations/poster presentations/speaking engagements
Applicant was a resident in a core program at same institution
Pass USMLE Step 2 CS/COMLEX Level 2 PE
Any failed attempt in USMLE/COMLEX
USMLE Step 3/COMLEX Level 3 score
Interest in academic career
Residency program setting (univ.‐based vs. comm.‐based)
Clinical/laboratory research experience
Awards or special honors in medical school
Alpha Omega Alpha (AOA) membership
Other life experience
Medical Student Performance Evaluation (MSPE/Dean's Letter)
Graduate of highly‐regarded medical school
Visa status*
Volunteer/extracurricular experiences
Awarded grant money for research
Grades in medical school
Lack of gaps in medical education
Medical school class ranking/quartile
Applicant was flagged with Match violation by the NRMP
Electives at your fellowship site
Gold Humanism Honor Society (GHHS) membership
Residency class ranking/quartile
Fluency in language spoken by your patient population
In‐Training Examination (ITE)
Residency program size
Having finished another fellowship
NRMP Program Director Survey, Specialties Matching Service, 2016 176

Neonatal-Perinatal MedicinePercentage of Programs Citing Each Factor and Mean Importance Rating¹ for Each Factor in Ranking Applicants(N=38)
Figure-2
Average RatingPercent Citing Factor
¹ Ratings on a scale from 1 (not at all important) to 5 (very important).* International Medical Graduates only
1 2 3 4 5
4.94.94.44.94.54.84.54.44.14.44.94.14.24.74.44.44.04.54.54.64.54.54.54.24.24.04.13.74.33.63.85.04.24.04.44.13.64.34.14.23.34.03.54.64.34.0
100% 50% 0%
94%94%81%78%78%83%69%86%72%69%61%58%64%67%58%69%61%67%67%75%61%61%58%50%47%43%23%39%31%37%43%31%36%31%39%20%22%23%23%17%11%23%22%14%17%9%
Interactions with faculty during interview and visitInterpersonal skills
Letters of recommendation in fellowship specialtyInteractions with house staff during interview and visit
Perceived commitment to specialtyFeedback from current residents and fellows
Perceived interest in programDemonstrated involvement and perceived interest in research
Reputation of residency programResidency performance evaluation (Program Director letter)
Evidence of professionalism and ethicsPersonal statement
Personal prior professional knowledge of the applicantLeadership qualities
Peer reviewed publications/authored textbook chaptersInterest in academic career
Applicant was a resident in a core program at same institutionUSMLE Step 1/COMLEX Level 1 score
USMLE Step 2 CK/COMLEX Level 2 CE scoreAny failed attempt in USMLE/COMLEX
Passing USMLE Step 2 CS/COMLEX Level 2 PEClinical/laboratory research experience
USMLE Step 3/COMLEX Level 3 scoreOral presentations/poster presentations/speaking engagements
Residency program setting (univ.‐based vs. comm.‐based)Alpha Omega Alpha (AOA) membership
Other life experienceMedical Student Performance Evaluation (MSPE/Dean's Letter)
Second interview/visitAwards or special honors in medical school
Visa status*Applicant was flagged with Match violation by the NRMP
Graduate of highly‐regarded medical schoolElectives at your fellowship site
Awarded grant money for researchVolunteer/extracurricular experiencesMedical school class ranking/quartile
Lack of gaps in medical educationGrades in medical school
Residency class ranking/quartileFluency in language spoken by your patient population
Gold Humanism Honor Society (GHHS) membershipResidency program size
In‐Training Examination (ITE)Second interview/visit
Having finished another fellowship
NRMP Program Director Survey, Specialties Matching Service, 2016 177
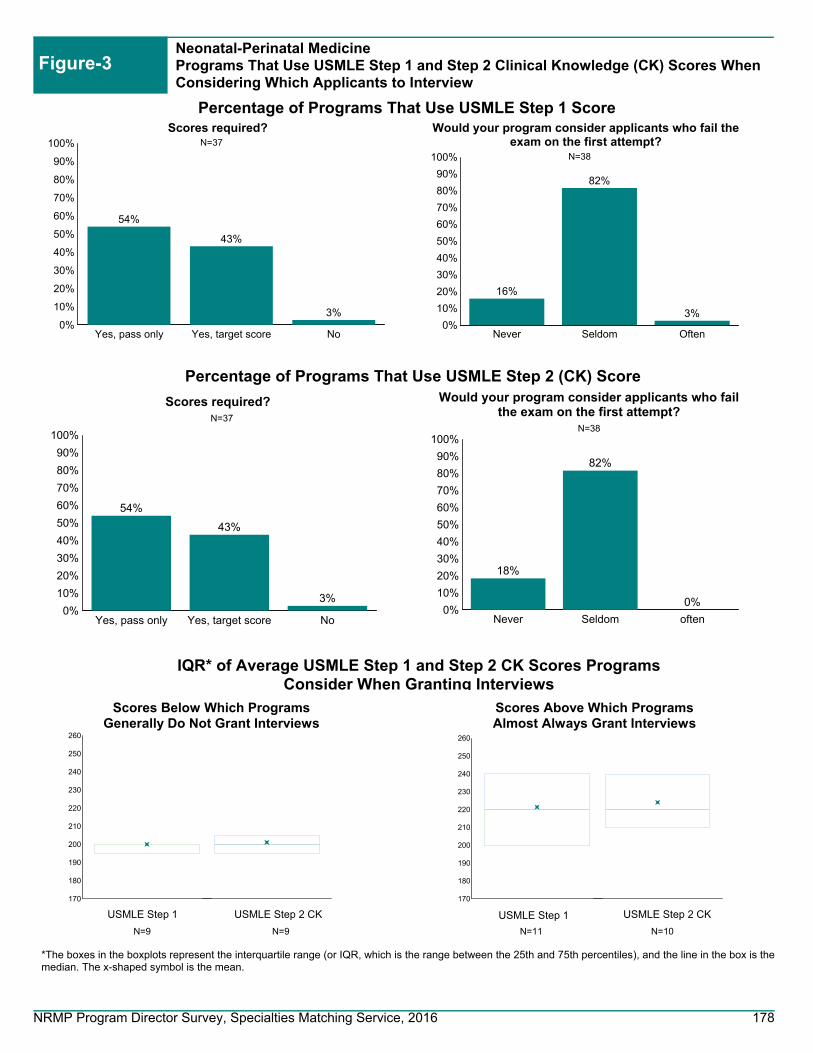
170
180
190
200
210
220
230
240
250
260
Neonatal-Perinatal MedicinePrograms That Use USMLE Step 1 and Step 2 Clinical Knowledge (CK) Scores When Considering Which Applicants to Interview
Figure-3
Percentage of Programs That Use USMLE Step 2 (CK) Score
0%
10%
20%
30%
40%
50%
60%
70%
80%
90%
100%
Never Seldom Often
16%
82%
3%
Would your program consider applicants who fail theexam on the first attempt?
0%
10%
20%
30%
40%
50%
60%
70%
80%
90%
100%
Never Seldom often
18%
82%
0%
Would your program consider applicants who failthe exam on the first attempt?
0%
10%
20%
30%
40%
50%
60%
70%
80%
90%
100%
Yes, pass only Yes, target score No
54%
43%
3%
Scores required?
0%
10%
20%
30%
40%
50%
60%
70%
80%
90%
100%
Yes, pass only Yes, target score No
54%
43%
3%
Scores required?
N=37
N=38
N=37N=38
N=9N=9 N=11 N=10
IQR* of Average USMLE Step 1 and Step 2 CK Scores Programs Consider When Granting Interviews
Percentage of Programs That Use USMLE Step 1 Score
170
180
190
200
210
220
230
240
250
260
USMLE Step 2 CKUSMLE Step 1 USMLE Step 1 USMLE Step 2 CK
*The boxes in the boxplots represent the interquartile range (or IQR, which is the range between the 25th and 75th percentiles), and the line in the box is the median. The x-shaped symbol is the mean.
Scores Above Which Programs Almost Always Grant Interviews
Scores Below Which Programs Generally Do Not Grant Interviews
NRMP Program Director Survey, Specialties Matching Service, 2016 178

0%
10%
20%
30%
40%
50%
60%
70%
80%
90%
100%
Yes No
97%
3%
USMLE Step 2 CS
0%
10%
20%
30%
40%
50%
60%
70%
80%
90%
100%
Yes, pass only Yes, target score No
50%
36%
14%
USMLE Step 3
0%
10%
20%
30%
40%
50%
60%
70%
80%
90%
100%
Yes, pass only Yes, target score No
61%
27%
12%
COMLEX-USA Level 1*
Neonatal-Perinatal MedicinePercentage of Programs That Use USMLE Step 2 Clinical Skill (CS), Step 3, and COMLEX-USA Scores* When Considering Which Applicants to Interview
Figure-4
0%
10%
20%
30%
40%
50%
60%
70%
80%
90%
100%
Yes, pass only Yes, target score No
59%
29%
12%
COMLEX-USA Level 2-CE*
0%
10%
20%
30%
40%
50%
60%
70%
80%
90%
100%
Yes, pass only Yes, target score No
55%
27%
18%
COMLEX-USA Level 3*
0%
10%
20%
30%
40%
50%
60%
70%
80%
90%
100%
Yes, pass only Yes, target score No
65%
24%
12%
COMLEX-USA Level 2-PE*
N=37 N=36
N=33 N=34
N=34 N=33
* Osteopathic applicants only
Percentage of Programs That Use USMLE Step 2 CS and Step 3 Scores
Percentage of Programs That Use COMLEX-USA Level 1 and Level 2-CE Scores
Percentage of Programs That Use COMLEX-USA Level 2-PE and Level 3 Scores
NRMP Program Director Survey, Specialties Matching Service, 2016 179

0%10%20%30%40%50%60%70%80%90%
100%
Never Seldom Often
40%
60%
0%
Would your program consider applicants who fail theexam on the first attempt?
0%
10%
20%
30%
40%
50%
60%
70%
80%
90%
100%
Yes, pass only Yes, target score No, not required
21%16%
63%
Scores required?
N=15
N=19
8.3%Optional
91.7%Required
Program Requirement on Dedicated Time forResearch
N=48
0
4
8
12
16
20
Accredited Locally Funded Integrated Other
2018 18 18
Average Number of Months if Research Time isRequired
N=29 N=12 N=4 N=4
0
1
2
3
4
5
6
7
Accredited Positions Funded Positions
6.8 6.8
Average Number of Accredited Positions and Funded Positions
0%
10%
20%
30%
40%
50%
60%
70%
80%
90%
100%
Positions Filled BeforeMatch Day
Positions Offered Outsidethe Match
Positions Filled Outsidethe Match
76%
39% 39%
Average Percentage of Accredited Positions Offered Outside ofthe Match
N=48 N=43 N=11 N=2 N=2
Neonatal-Perinatal MedicinePrograms That Use Core Specialty Certifying Examination When Considering Applicants for Interview
Figure-5
Neonatal-Perinatal MedicinePrograms Positions Figure-6
Neonatal-Perinatal MedicineDedicated Time for Research Figure-7
NRMP Program Director Survey, Specialties Matching Service, 2016 180

0%
10%
20%
30%
40%
50%
60%
70%
80%
90%
100% 95% 95%
68%
24%
87%79%
U.S. Graduate OsteopathicPhysician
Canadian Fifth Pathway U.S. IMG Non-U.S. IMG
Percentage of Programs that Typically Interview and Rank Each Applicant Type
Figure-8Neonatal-Perinatal MedicineProgram's Interview Activities
0%10%20%30%40%50%60%70%80%90%
100%
Rejected based on astandardized screening
process
In-depth review
34%
69%
Average Percentage of Applicants Rejected and Reviewed
0
10
20
30
40
50
60
70
80
Number of applicationsreceived
Number of interviewinvitations sent
Number of applicantsinterviewed
73
2621
Average Number of Positions, Applications Received, InterviewInvitations Sent, and Applicants Interviewed and Ranked
N=44N=44N=44N=44
N=38
21% of Neonatal-Perinatal Medicine programs consider all applicant groups
N=44
0%10%20%30%40%50%60%70%80%90%
100%
Prev. Grad Osteo Pathway Canadian US IMG Non-USIMG
5%
64%
22%3%
14%8%32%
33%
61%
57%53%
86%68%
3%17%
41% 33%
Often Seldom Never
Interview
0%10%
20%
30%40%
50%60%
70%80%
90%100%
Prev. Grad Osteo Pathway Canadian US IMG Non-USIMG
5% 3%
63%
22%3%
14%8%
37%
37%
59%
58%
57%
86%
61%
19%
39%30%
Often Seldom Never
Ranking
n=37
Frequency of Programs Interviewing and Ranking Candidates
n=37
N=37
0%10%20%30%40%50%60%70%80%90%
100%
Jan Feb Mar Apr May Jun Jul Aug Sep Oct Nov Dec
2% 2% 1% 1% 0% 2%
22%
40%
23%
6%1% 0%
Interview invitations
Interview Invitations Sent and Interviews Conducted
0% 1% 1% 1% 1% 0% 1%11%
40%34%
11%0%
Interviews conducted
NRMP Program Director Survey, Specialties Matching Service, 2016 181

Figure-9Neonatal-Perinatal MedicinePotential Challenges in Recruiting Applicants to Your Specialty
0% 10% 20% 30% 40% 50% 60% 70% 80%
72%
8%
25%
0%
0%
We consider those applicants on an individual basis
We give those applicants serious consideration if they haveshown improvement
We do not usually consider those applicants
We favor those applicants
Other
0 1 2 3 4 5
Not enough applicants in the specialty
Undesirable income potential as a practicing physician
Undesirable work/life balance as a practicing physician
Long or irregular work hours required by specialty
Fellowship Match scheduled at inconvenient time of year
2.2
2.0
3.7
3.7
1.8
Average rating on a scale of 5 (1=least challenging; 5=most challenging)
n=35
22.0%Less than 3
12.2%3 to 5
22.0%6 to 104.9%
11 to 15
39.0%More than 15
At Any Fellowship Program
26.8%Less than 3
12.2%3 to 5
22.0%6 to 10
12.2%11 to 15
26.8%More than 15
At Current Fellowship Program
n=36
n=41 n=41
Neonatal-Perinatal MedicineApplicants Who Applied in the Specialty in the Past But Did Not Match Figure-10
Neonatal-Perinatal MedicineYears as Program Director Figure-11
NRMP Program Director Survey, Specialties Matching Service, 2016 182
Nephrology
NRMP Program Director Survey, Specialties Matching Service, 2016 183

NephrologyGeneral Information
Table 1
158
466
298
Number of programs in the Match
Number of positions in the Match
Number of applicants ranking specialty
33.3%Response rate
Appointment Years
Number of responses 45
Match Information*
* Source: NRMP Data Warehouse
2016 Survey
2016 2015 2014
134
374
276
145
403
323
NRMP Program Director Survey, Specialties Matching Service, 2016 184

Figure-1NephrologyPercentage of Programs Citing Each Factor and Mean Importance Rating¹ for Each Factor in Selecting Applicants to Interview(N=39)
Average RatingPercent Citing Factor
¹ Ratings on a scale from 1 (not at all important) to 5 (very important).* International Medical Graduates only
1 2 3 4 5
4.34.44.13.94.23.54.24.63.83.73.84.04.63.54.74.04.33.83.93.84.03.44.03.63.23.83.93.33.63.23.53.34.83.73.73.43.7
3.82.6
100% 50% 0%
90%95%85%72%82%74%72%72%79%74%74%67%67%67%79%82%79%67%46%67%54%51%56%41%64%62%54%38%44%54%44%41%67%49%38%36%33%
0%33%13%
Letters of recommendation in fellowship specialty
Residency performance evaluation (Program Director letter)
Reputation of residency program
Demonstrated involvement and perceived interest in research
Perceived commitment to specialty
Personal statement
Perceived interest in program
Evidence of professionalism and ethics
USMLE Step 1/COMLEX Level 1 score
Peer reviewed publications/authored textbook chapters
USMLE Step 2 CK/COMLEX Level 2 CE score
Leadership qualities
Personal prior professional knowledge of the applicant
Oral presentations/poster presentations/speaking engagements
Applicant was a resident in a core program at same institution
Pass USMLE Step 2 CS/COMLEX Level 2 PE
Any failed attempt in USMLE/COMLEX
USMLE Step 3/COMLEX Level 3 score
Interest in academic career
Residency program setting (univ.‐based vs. comm.‐based)
Clinical/laboratory research experience
Awards or special honors in medical school
Alpha Omega Alpha (AOA) membership
Other life experience
Medical Student Performance Evaluation (MSPE/Dean's Letter)
Graduate of highly‐regarded medical school
Visa status*
Volunteer/extracurricular experiences
Awarded grant money for research
Grades in medical school
Lack of gaps in medical education
Medical school class ranking/quartile
Applicant was flagged with Match violation by the NRMP
Electives at your fellowship site
Gold Humanism Honor Society (GHHS) membership
Residency class ranking/quartile
Fluency in language spoken by your patient population
In‐Training Examination (ITE)
Residency program size
Having finished another fellowship
NRMP Program Director Survey, Specialties Matching Service, 2016 185

NephrologyPercentage of Programs Citing Each Factor and Mean Importance Rating¹ for Each Factor in Ranking Applicants(N=39)
Figure-2
Average RatingPercent Citing Factor
¹ Ratings on a scale from 1 (not at all important) to 5 (very important).* International Medical Graduates only
1 2 3 4 5
4.74.74.24.74.34.74.33.84.04.34.53.84.54.04.14.04.83.83.74.43.94.13.83.43.93.73.63.34.23.34.04.63.74.33.53.23.03.43.34.03.54.03.9
3.04.0
100% 50% 0%
95%92%68%76%68%74%61%58%74%61%55%45%58%50%47%42%61%45%45%45%45%37%45%32%58%42%21%26%34%21%29%24%32%34%29%16%21%13%24%26%21%8%
34%3%5%3%
Interactions with faculty during interview and visitInterpersonal skills
Letters of recommendation in fellowship specialtyInteractions with house staff during interview and visit
Perceived commitment to specialtyFeedback from current residents and fellows
Perceived interest in programDemonstrated involvement and perceived interest in research
Reputation of residency programResidency performance evaluation (Program Director letter)
Evidence of professionalism and ethicsPersonal statement
Personal prior professional knowledge of the applicantLeadership qualities
Peer reviewed publications/authored textbook chaptersInterest in academic career
Applicant was a resident in a core program at same institutionUSMLE Step 1/COMLEX Level 1 score
USMLE Step 2 CK/COMLEX Level 2 CE scoreAny failed attempt in USMLE/COMLEX
Passing USMLE Step 2 CS/COMLEX Level 2 PEClinical/laboratory research experience
USMLE Step 3/COMLEX Level 3 scoreOral presentations/poster presentations/speaking engagements
Residency program setting (univ.‐based vs. comm.‐based)Alpha Omega Alpha (AOA) membership
Other life experienceMedical Student Performance Evaluation (MSPE/Dean's Letter)
Second interview/visitAwards or special honors in medical school
Visa status*Applicant was flagged with Match violation by the NRMP
Graduate of highly‐regarded medical schoolElectives at your fellowship site
Awarded grant money for researchVolunteer/extracurricular experiencesMedical school class ranking/quartile
Lack of gaps in medical educationGrades in medical school
Residency class ranking/quartileFluency in language spoken by your patient population
Gold Humanism Honor Society (GHHS) membershipResidency program size
In‐Training Examination (ITE)Second interview/visit
Having finished another fellowship
NRMP Program Director Survey, Specialties Matching Service, 2016 186

170
180
190
200
210
220
230
240
250
260
NephrologyPrograms That Use USMLE Step 1 and Step 2 Clinical Knowledge (CK) Scores When Considering Which Applicants to Interview
Figure-3
Percentage of Programs That Use USMLE Step 2 (CK) Score
0%
10%
20%
30%
40%
50%
60%
70%
80%
90%
100%
Never Seldom Often
13%
63%
24%
Would your program consider applicants who fail theexam on the first attempt?
0%
10%
20%
30%
40%
50%
60%
70%
80%
90%
100%
Never Seldom often
16%
61%
24%
Would your program consider applicants who failthe exam on the first attempt?
0%
10%
20%
30%
40%
50%
60%
70%
80%
90%
100%
Yes, pass only Yes, target score No
76%
24%
0%
Scores required?
0%
10%
20%
30%
40%
50%
60%
70%
80%
90%
100%
Yes, pass only Yes, target score No
76%
24%
0%
Scores required?
N=38
N=38
N=38N=38
N=8N=8 N=7 N=7
IQR* of Average USMLE Step 1 and Step 2 CK Scores Programs Consider When Granting Interviews
Percentage of Programs That Use USMLE Step 1 Score
170
180
190
200
210
220
230
240
250
260
USMLE Step 2 CKUSMLE Step 1 USMLE Step 1 USMLE Step 2 CK
*The boxes in the boxplots represent the interquartile range (or IQR, which is the range between the 25th and 75th percentiles), and the line in the box is the median. The x-shaped symbol is the mean.
Scores Above Which Programs Almost Always Grant Interviews
Scores Below Which Programs Generally Do Not Grant Interviews
NRMP Program Director Survey, Specialties Matching Service, 2016 187

0%
10%
20%
30%
40%
50%
60%
70%
80%
90%
100%
Yes No
100%
0%
USMLE Step 2 CS
0%
10%
20%
30%
40%
50%
60%
70%
80%
90%
100%
Yes, pass only Yes, target score No
76%
16%8%
USMLE Step 3
0%
10%
20%
30%
40%
50%
60%
70%
80%
90%
100%
Yes, pass only Yes, target score No
72%
3%
24%
COMLEX-USA Level 1*
NephrologyPercentage of Programs That Use USMLE Step 2 Clinical Skill (CS), Step 3, and COMLEX-USA Scores* When Considering Which Applicants to Interview
Figure-4
0%
10%
20%
30%
40%
50%
60%
70%
80%
90%
100%
Yes, pass only Yes, target score No
72%
3%
24%
COMLEX-USA Level 2-CE*
0%
10%
20%
30%
40%
50%
60%
70%
80%
90%
100%
Yes, pass only Yes, target score No
72%
0%
28%
COMLEX-USA Level 3*
0%
10%
20%
30%
40%
50%
60%
70%
80%
90%
100%
Yes, pass only Yes, target score No
76%
0%
24%
COMLEX-USA Level 2-PE*
N=38 N=37
N=29 N=29
N=29 N=29
* Osteopathic applicants only
Percentage of Programs That Use USMLE Step 2 CS and Step 3 Scores
Percentage of Programs That Use COMLEX-USA Level 1 and Level 2-CE Scores
Percentage of Programs That Use COMLEX-USA Level 2-PE and Level 3 Scores
NRMP Program Director Survey, Specialties Matching Service, 2016 188

0%10%20%30%40%50%60%70%80%90%
100%
Never Seldom Often
25%
50%
25%
Would your program consider applicants who fail theexam on the first attempt?
0%
10%
20%
30%
40%
50%
60%
70%
80%
90%
100%
Yes, pass only Yes, target score No, not required
13%
0%
87%
Scores required?
N=8
N=15
33.3%Optional
66.7%Required
Program Requirement on Dedicated Time forResearch
N=45
0
1
2
3
4
5
6
7
Accredited Locally Funded Integrated Other
7
66
7
Average Number of Months if Research Time isRequired
N=16 N=9 N=3 N=6
0
1
2
3
4
5
6
Accredited Positions Funded Positions
5.65.2
Average Number of Accredited Positions and Funded Positions
0%
10%
20%
30%
40%
50%
60%
70%
80%
90%
100%
Positions Filled BeforeMatch Day
Positions Offered Outsidethe Match
Positions Filled Outsidethe Match
81%
71% 71%
Average Percentage of Accredited Positions Offered Outside ofthe Match
N=44 N=43 N=8 N=2 N=2
NephrologyPrograms That Use Core Specialty Certifying Examination When Considering Applicants for Interview
Figure-5
NephrologyPrograms Positions Figure-6
NephrologyDedicated Time for Research Figure-7
NRMP Program Director Survey, Specialties Matching Service, 2016 189

0%
10%
20%
30%
40%
50%
60%
70%
80%
90%
100% 95%89%
74%
50%
92% 92%
U.S. Graduate OsteopathicPhysician
Canadian Fifth Pathway U.S. IMG Non-U.S. IMG
Percentage of Programs that Typically Interview and Rank Each Applicant Type
Figure-8NephrologyProgram's Interview Activities
0%10%20%30%40%50%60%70%80%90%
100%
Rejected based on astandardized screening
process
In-depth review
27%
76%
Average Percentage of Applicants Rejected and Reviewed
0
10
20
30
40
50
60
70
80
Number of applicationsreceived
Number of interviewinvitations sent
Number of applicantsinterviewed
71
35
21
Average Number of Positions, Applications Received, InterviewInvitations Sent, and Applicants Interviewed and Ranked
N=39N=39N=40N=40
N=38
45% of Nephrology programs consider all applicant groups
N=40
0%10%20%30%40%50%60%70%80%90%
100%
Prev. Grad Osteo Pathway Canadian US IMG Non-USIMG
3%
63%
18%3%
16%
43%
31%
61%
36%19%
81%
57%
6%21%
64%78%
Often Seldom Never
Interview
0%10%
20%
30%40%
50%60%
70%80%
90%100%
Prev. Grad Osteo Pathway Canadian US IMG Non-USIMG
3% 3%
63%
21%3% 6%6%
38%
25%
59%
34%19%
91%
59%
13% 21%
63%75%
Often Seldom Never
Ranking
n=35
Frequency of Programs Interviewing and Ranking Candidates
n=37
N=36
0%10%20%30%40%50%60%70%80%90%
100%
Jan Feb Mar Apr May Jun Jul Aug Sep Oct Nov Dec
0% 3% 0% 0% 0% 2%
28%
42%
19%
4% 3% 0%
Interview invitations
Interview Invitations Sent and Interviews Conducted
0% 0% 0% 1% 1% 0% 1%
13%
50%
30%
4% 0%
Interviews conducted
NRMP Program Director Survey, Specialties Matching Service, 2016 190

Figure-9NephrologyPotential Challenges in Recruiting Applicants to Your Specialty
0% 10% 20% 30% 40% 50% 60% 70% 80%
76%
11%
19%
3%
0%
We consider those applicants on an individual basis
We give those applicants serious consideration if they haveshown improvement
We do not usually consider those applicants
We favor those applicants
Other
0 1 2 3 4 5
Not enough applicants in the specialty
Undesirable income potential as a practicing physician
Undesirable work/life balance as a practicing physician
Long or irregular work hours required by specialty
Fellowship Match scheduled at inconvenient time of year
4.8
4.1
4.2
3.7
2.6
Average rating on a scale of 5 (1=least challenging; 5=most challenging)
n=38
23.7%Less than 3
15.8%3 to 5
31.6%6 to10
21.1%11 to 15
7.9%More than 15
At Any Fellowship Program
28.6%Less than 3
17.1%3 to
531.4%6 to 10
17.1%11 to 15
5.7%More than 15
At Current Fellowship Program
n=37
n=38 n=35
NephrologyApplicants Who Applied in the Specialty in the Past But Did Not Match Figure-10
NephrologyYears as Program Director Figure-11
NRMP Program Director Survey, Specialties Matching Service, 2016 191

Neuroradiology
NRMP Program Director Survey, Specialties Matching Service, 2016 192
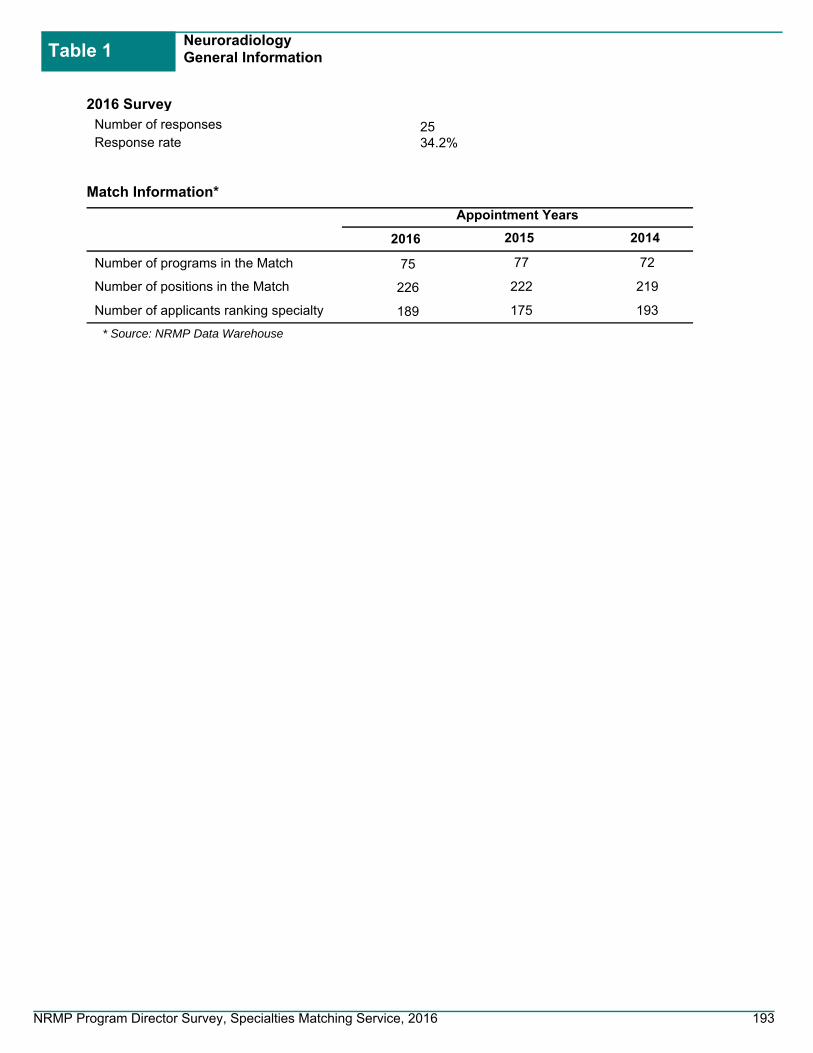
NeuroradiologyGeneral Information
Table 1
75
226
189
Number of programs in the Match
Number of positions in the Match
Number of applicants ranking specialty
34.2%Response rate
Appointment Years
Number of responses 25
Match Information*
* Source: NRMP Data Warehouse
2016 Survey
2016 2015 2014
77
222
175
72
219
193
NRMP Program Director Survey, Specialties Matching Service, 2016 193

Figure-1NeuroradiologyPercentage of Programs Citing Each Factor and Mean Importance Rating¹ for Each Factor in Selecting Applicants to Interview(N=17)
Average RatingPercent Citing Factor
¹ Ratings on a scale from 1 (not at all important) to 5 (very important).* International Medical Graduates only
1 2 3 4 5
4.54.13.93.53.83.54.14.63.73.53.63.74.83.44.53.44.03.53.33.82.93.33.72.73.43.34.73.13.23.63.53.34.94.02.53.53.02.72.82.0
100% 50% 0%
82%88%88%94%76%82%94%82%94%71%94%82%65%76%71%76%47%71%71%59%47%71%65%41%53%65%53%47%59%53%41%53%47%
6%12%35%18%18%35%
6%
Letters of recommendation in fellowship specialty
Residency performance evaluation (Program Director letter)
Reputation of residency program
Demonstrated involvement and perceived interest in research
Perceived commitment to specialty
Personal statement
Perceived interest in program
Evidence of professionalism and ethics
USMLE Step 1/COMLEX Level 1 score
Peer reviewed publications/authored textbook chapters
USMLE Step 2 CK/COMLEX Level 2 CE score
Leadership qualities
Personal prior professional knowledge of the applicant
Oral presentations/poster presentations/speaking engagements
Applicant was a resident in a core program at same institution
Pass USMLE Step 2 CS/COMLEX Level 2 PE
Any failed attempt in USMLE/COMLEX
USMLE Step 3/COMLEX Level 3 score
Interest in academic career
Residency program setting (univ.‐based vs. comm.‐based)
Clinical/laboratory research experience
Awards or special honors in medical school
Alpha Omega Alpha (AOA) membership
Other life experience
Medical Student Performance Evaluation (MSPE/Dean's Letter)
Graduate of highly‐regarded medical school
Visa status*
Volunteer/extracurricular experiences
Awarded grant money for research
Grades in medical school
Lack of gaps in medical education
Medical school class ranking/quartile
Applicant was flagged with Match violation by the NRMP
Electives at your fellowship site
Gold Humanism Honor Society (GHHS) membership
Residency class ranking/quartile
Fluency in language spoken by your patient population
In‐Training Examination (ITE)
Residency program size
Having finished another fellowship
NRMP Program Director Survey, Specialties Matching Service, 2016 194

NeuroradiologyPercentage of Programs Citing Each Factor and Mean Importance Rating¹ for Each Factor in Ranking Applicants(N=17)
Figure-2
Average RatingPercent Citing Factor
¹ Ratings on a scale from 1 (not at all important) to 5 (very important).* International Medical Graduates only
1 2 3 4 5
5.04.84.74.94.15.04.33.64.14.24.63.74.93.83.53.54.53.73.44.33.23.03.53.83.83.13.33.03.23.24.55.03.32.53.03.73.35.03.02.73.52.52.43.01.02.0
100% 50% 0%
94%88%63%88%63%69%75%63%75%69%56%63%50%56%44%25%69%56%56%38%38%19%38%31%63%44%19%31%44%31%38%25%44%13%19%19%25%19%25%25%13%13%31%6%6%6%
Interactions with faculty during interview and visitInterpersonal skills
Letters of recommendation in fellowship specialtyInteractions with house staff during interview and visit
Perceived commitment to specialtyFeedback from current residents and fellows
Perceived interest in programDemonstrated involvement and perceived interest in research
Reputation of residency programResidency performance evaluation (Program Director letter)
Evidence of professionalism and ethicsPersonal statement
Personal prior professional knowledge of the applicantLeadership qualities
Peer reviewed publications/authored textbook chaptersInterest in academic career
Applicant was a resident in a core program at same institutionUSMLE Step 1/COMLEX Level 1 score
USMLE Step 2 CK/COMLEX Level 2 CE scoreAny failed attempt in USMLE/COMLEX
Passing USMLE Step 2 CS/COMLEX Level 2 PEClinical/laboratory research experience
USMLE Step 3/COMLEX Level 3 scoreOral presentations/poster presentations/speaking engagements
Residency program setting (univ.‐based vs. comm.‐based)Alpha Omega Alpha (AOA) membership
Other life experienceMedical Student Performance Evaluation (MSPE/Dean's Letter)
Second interview/visitAwards or special honors in medical school
Visa status*Applicant was flagged with Match violation by the NRMP
Graduate of highly‐regarded medical schoolElectives at your fellowship site
Awarded grant money for researchVolunteer/extracurricular experiencesMedical school class ranking/quartile
Lack of gaps in medical educationGrades in medical school
Residency class ranking/quartileFluency in language spoken by your patient population
Gold Humanism Honor Society (GHHS) membershipResidency program size
In‐Training Examination (ITE)Second interview/visit
Having finished another fellowship
NRMP Program Director Survey, Specialties Matching Service, 2016 195

170
180
190
200
210
220
230
240
250
260
NeuroradiologyPrograms That Use USMLE Step 1 and Step 2 Clinical Knowledge (CK) Scores When Considering Which Applicants to Interview
Figure-3
Percentage of Programs That Use USMLE Step 2 (CK) Score
0%
10%
20%
30%
40%
50%
60%
70%
80%
90%
100%
Never Seldom Often
31%
50%
19%
Would your program consider applicants who fail theexam on the first attempt?
0%
10%
20%
30%
40%
50%
60%
70%
80%
90%
100%
Never Seldom often
25%
56%
19%
Would your program consider applicants who failthe exam on the first attempt?
0%
10%
20%
30%
40%
50%
60%
70%
80%
90%
100%
Yes, pass only Yes, target score No
65%
35%
0%
Scores required?
0%
10%
20%
30%
40%
50%
60%
70%
80%
90%
100%
Yes, pass only Yes, target score No
71%
29%
0%
Scores required?
N=17
N=16
N=17N=16
N=5 N=5
IQR* of Average USMLE Step 1 and Step 2 CK Scores Programs Consider When Granting Interviews
Percentage of Programs That Use USMLE Step 1 Score
170
180
190
200
210
220
230
240
250
260
USMLE Step 1 USMLE Step 1
*The boxes in the boxplots represent the interquartile range (or IQR, which is the range between the 25th and 75th percentiles), and the line in the box is the median. The x-shaped symbol is the mean.
Scores Above Which Programs Almost Always Grant Interviews
Scores Below Which Programs Generally Do Not Grant Interviews
USMLE Step 2 CK not reported
because of low response rate
USMLE Step 2 CK not reported
because of low response rate
NRMP Program Director Survey, Specialties Matching Service, 2016 196

0%
10%
20%
30%
40%
50%
60%
70%
80%
90%
100%
Yes No
100%
0%
USMLE Step 2 CS
0%
10%
20%
30%
40%
50%
60%
70%
80%
90%
100%
Yes, pass only Yes, target score No
88%
12%
0%
USMLE Step 3
0%
10%
20%
30%
40%
50%
60%
70%
80%
90%
100%
Yes, pass only Yes, target score No
53%
20%27%
COMLEX-USA Level 1*
NeuroradiologyPercentage of Programs That Use USMLE Step 2 Clinical Skill (CS), Step 3, and COMLEX-USA Scores* When Considering Which Applicants to Interview
Figure-4
0%
10%
20%
30%
40%
50%
60%
70%
80%
90%
100%
Yes, pass only Yes, target score No
60%
13%
27%
COMLEX-USA Level 2-CE*
0%
10%
20%
30%
40%
50%
60%
70%
80%
90%
100%
Yes, pass only Yes, target score No
67%
7%
27%
COMLEX-USA Level 3*
0%
10%
20%
30%
40%
50%
60%
70%
80%
90%
100%
Yes, pass only Yes, target score No
60%
13%
27%
COMLEX-USA Level 2-PE*
N=17 N=17
N=15 N=15
N=15 N=15
* Osteopathic applicants only
Percentage of Programs That Use USMLE Step 2 CS and Step 3 Scores
Percentage of Programs That Use COMLEX-USA Level 1 and Level 2-CE Scores
Percentage of Programs That Use COMLEX-USA Level 2-PE and Level 3 Scores
NRMP Program Director Survey, Specialties Matching Service, 2016 197

0%10%20%30%40%50%60%70%80%90%
100%
Never Seldom Often
25%
63%
13%
Would your program consider applicants who fail theexam on the first attempt?
0%
10%
20%
30%
40%
50%
60%
70%
80%
90%
100%
Yes, pass only Yes, target score No, not required
70%
10%
20%
Scores required?
N=8
N=10
75.0%Optional
25.0%Required
Program Requirement on Dedicated Time forResearch
N=24
0.0
0.2
0.4
0.6
0.8
1.0
Accredited Locally Funded Integrated Other
1
11
Average Number of Months if Research Time isRequired
N=3 N=1 N=3 N=0
0.0
0.5
1.0
1.5
2.0
2.5
3.0
3.5
Accredited Positions Funded Positions
3.5 3.4
Average Number of Accredited Positions and Funded Positions
0%
10%
20%
30%
40%
50%
60%
70%
80%
90%
100%
Positions Filled BeforeMatch Day
Positions Offered Outsidethe Match
Positions Filled Outsidethe Match
44% 41%47%
Average Percentage of Accredited Positions Offered Outside ofthe Match
N=24 N=21 N=8 N=8 N=7
NeuroradiologyPrograms That Use Core Specialty Certifying Examination When Considering Applicants for Interview
Figure-5
NeuroradiologyPrograms Positions Figure-6
NeuroradiologyDedicated Time for Research Figure-7
NRMP Program Director Survey, Specialties Matching Service, 2016 198

0%
10%
20%
30%
40%
50%
60%
70%
80%
90%
100%89%
83%
67%
28%
50%
39%
U.S. Graduate OsteopathicPhysician
Canadian Fifth Pathway U.S. IMG Non-U.S. IMG
Percentage of Programs that Typically Interview and Rank Each Applicant Type
Figure-8NeuroradiologyProgram's Interview Activities
0%10%20%30%40%50%60%70%80%90%
100%
Rejected based on astandardized screening
process
In-depth review
21%
70%
Average Percentage of Applicants Rejected and Reviewed
0
4
8
12
16
20
24
28
32
Number of applicationsreceived
Number of interviewinvitations sent
Number of applicantsinterviewed
29
1716
Average Number of Positions, Applications Received, InterviewInvitations Sent, and Applicants Interviewed and Ranked
N=23N=23N=23N=23
N=18
22% of Neuroradiology programs consider all applicant groups
N=23
0%10%20%30%40%50%60%70%80%90%
100%
Prev. Grad Osteo Pathway Canadian US IMG Non-USIMG
6%
53%
20% 13% 7%12%
38%
47%
53%80% 87%
82%63%
27%7% 7%
Often Seldom Never
Interview
0%10%
20%
30%40%
50%60%
70%80%
90%100%
Prev. Grad Osteo Pathway Canadian US IMG Non-USIMG
6%
50%
19% 13% 6%13% 29%
50%
56%81% 88%
81%71%
25%6% 6%
Often Seldom Never
Ranking
n=16
Frequency of Programs Interviewing and Ranking Candidates
n=17
N=17
0%10%20%30%40%50%60%70%80%90%
100%
Jan Feb Mar Apr May Jun Jul Aug Sep Oct Nov Dec
59%
5% 7% 6%0% 0% 0% 0% 0%
11% 9%4%
Interview invitations
Interview Invitations Sent and Interviews Conducted
31%
17% 15%7%
1% 0% 1% 0% 0% 0% 5%
17%
Interviews conducted
NRMP Program Director Survey, Specialties Matching Service, 2016 199

Figure-9NeuroradiologyPotential Challenges in Recruiting Applicants to Your Specialty
0% 10% 20% 30% 40% 50% 60% 70% 80%
71%
7%
21%
0%
0%
We consider those applicants on an individual basis
We give those applicants serious consideration if they haveshown improvement
We do not usually consider those applicants
We favor those applicants
Other
0 1 2 3 4 5
Not enough applicants in the specialty
Undesirable income potential as a practicing physician
Undesirable work/life balance as a practicing physician
Long or irregular work hours required by specialty
Fellowship Match scheduled at inconvenient time of year
3.6
1.8
2.1
1.9
2.5
Average rating on a scale of 5 (1=least challenging; 5=most challenging)
n=15
30.4%Less than 3
17.4%3 to 5
26.1%6 to 10
17.4%11 to
15
8.7%More than 15
At Any Fellowship Program
33.3%Less than
3
14.3%3 to 533.3%
6 to 10
9.5%11 to 15
9.5%More than 15
At Current Fellowship Program
n=14
n=23 n=21
NeuroradiologyApplicants Who Applied in the Specialty in the Past But Did Not Match Figure-10
NeuroradiologyYears as Program Director Figure-11
NRMP Program Director Survey, Specialties Matching Service, 2016 200

Obstetric Anesthesiology
NRMP Program Director Survey, Specialties Matching Service, 2016 201

Obstetric AnesthesiologyGeneral Information
Table 1
28
48
25
Number of programs in the Match
Number of positions in the Match
Number of applicants ranking specialty
40.0%Response rate
Appointment Years
Number of responses 10
Match Information*
* Source: NRMP Data Warehouse
2016 Survey
2016 2015 2014
NRMP Program Director Survey, Specialties Matching Service, 2016 202

Figure-1Obstetric AnesthesiologyPercentage of Programs Citing Each Factor and Mean Importance Rating¹ for Each Factor in Selecting Applicants to Interview(N=10)
Average RatingPercent Citing Factor
¹ Ratings on a scale from 1 (not at all important) to 5 (very important).* International Medical Graduates only
1 2 3 4 5
4.24.73.94.24.33.94.54.94.43.84.34.53.33.74.04.34.54.34.64.33.83.82.83.53.82.83.03.03.53.03.02.65.01.03.04.03.34.02.0
100% 50% 0%
90%60%90%90%
100%70%80%80%50%50%40%80%60%60%40%40%20%40%50%30%40%40%50%20%60%40%10%30%40%30%20%50%30%10%40%40%30%10%10%
0%
Letters of recommendation in fellowship specialty
Residency performance evaluation (Program Director letter)
Reputation of residency program
Demonstrated involvement and perceived interest in research
Perceived commitment to specialty
Personal statement
Perceived interest in program
Evidence of professionalism and ethics
USMLE Step 1/COMLEX Level 1 score
Peer reviewed publications/authored textbook chapters
USMLE Step 2 CK/COMLEX Level 2 CE score
Leadership qualities
Personal prior professional knowledge of the applicant
Oral presentations/poster presentations/speaking engagements
Applicant was a resident in a core program at same institution
Pass USMLE Step 2 CS/COMLEX Level 2 PE
Any failed attempt in USMLE/COMLEX
USMLE Step 3/COMLEX Level 3 score
Interest in academic career
Residency program setting (univ.‐based vs. comm.‐based)
Clinical/laboratory research experience
Awards or special honors in medical school
Alpha Omega Alpha (AOA) membership
Other life experience
Medical Student Performance Evaluation (MSPE/Dean's Letter)
Graduate of highly‐regarded medical school
Visa status*
Volunteer/extracurricular experiences
Awarded grant money for research
Grades in medical school
Lack of gaps in medical education
Medical school class ranking/quartile
Applicant was flagged with Match violation by the NRMP
Electives at your fellowship site
Gold Humanism Honor Society (GHHS) membership
Residency class ranking/quartile
Fluency in language spoken by your patient population
In‐Training Examination (ITE)
Residency program size
Having finished another fellowship
NRMP Program Director Survey, Specialties Matching Service, 2016 203

Obstetric AnesthesiologyPercentage of Programs Citing Each Factor and Mean Importance Rating¹ for Each Factor in Ranking Applicants(N=10)
Figure-2
Average RatingPercent Citing Factor
¹ Ratings on a scale from 1 (not at all important) to 5 (very important).* International Medical Graduates only
1 2 3 4 5
4.44.34.34.44.44.84.24.03.54.64.34.03.54.04.74.34.54.03.74.03.54.54.04.03.0
3.03.64.33.3
4.53.35.03.73.52.72.5
4.03.03.5
4.05.0
100% 50% 0%
90%90%80%80%80%60%60%80%80%50%70%50%40%50%30%40%20%40%30%20%30%30%20%30%10%0%
20%50%30%30%0%
20%30%10%30%20%30%20%0%
30%10%20%0%
20%20%0%
Interactions with faculty during interview and visitInterpersonal skills
Letters of recommendation in fellowship specialtyInteractions with house staff during interview and visit
Perceived commitment to specialtyFeedback from current residents and fellows
Perceived interest in programDemonstrated involvement and perceived interest in research
Reputation of residency programResidency performance evaluation (Program Director letter)
Evidence of professionalism and ethicsPersonal statement
Personal prior professional knowledge of the applicantLeadership qualities
Peer reviewed publications/authored textbook chaptersInterest in academic career
Applicant was a resident in a core program at same institutionUSMLE Step 1/COMLEX Level 1 score
USMLE Step 2 CK/COMLEX Level 2 CE scoreAny failed attempt in USMLE/COMLEX
Passing USMLE Step 2 CS/COMLEX Level 2 PEClinical/laboratory research experience
USMLE Step 3/COMLEX Level 3 scoreOral presentations/poster presentations/speaking engagements
Residency program setting (univ.‐based vs. comm.‐based)Alpha Omega Alpha (AOA) membership
Other life experienceMedical Student Performance Evaluation (MSPE/Dean's Letter)
Second interview/visitAwards or special honors in medical school
Visa status*Applicant was flagged with Match violation by the NRMP
Graduate of highly‐regarded medical schoolElectives at your fellowship site
Awarded grant money for researchVolunteer/extracurricular experiencesMedical school class ranking/quartile
Lack of gaps in medical educationGrades in medical school
Residency class ranking/quartileFluency in language spoken by your patient population
Gold Humanism Honor Society (GHHS) membershipResidency program size
In‐Training Examination (ITE)Second interview/visit
Having finished another fellowship
NRMP Program Director Survey, Specialties Matching Service, 2016 204

Obstetric AnesthesiologyPrograms That Use USMLE Step 1 and Step 2 Clinical Knowledge (CK) Scores When Considering Which Applicants to Interview
Figure-3
Percentage of Programs That Use USMLE Step 2 (CK) Score
0%
10%
20%
30%
40%
50%
60%
70%
80%
90%
100%
Never Seldom Often
0%
88%
13%
Would your program consider applicants who fail theexam on the first attempt?
0%
10%
20%
30%
40%
50%
60%
70%
80%
90%
100%
Never Seldom often
0%
88%
13%
Would your program consider applicants who failthe exam on the first attempt?
0%
10%
20%
30%
40%
50%
60%
70%
80%
90%
100%
Yes, pass only Yes, target score No
78%
22%
0%
Scores required?
0%
10%
20%
30%
40%
50%
60%
70%
80%
90%
100%
Yes, pass only Yes, target score No
89%
11%
0%
Scores required?
N=9
N=8
N=9N=8
IQR* of Average USMLE Step 1 and Step 2 CK Scores Programs Consider When Granting Interviews
Percentage of Programs That Use USMLE Step 1 Score
*The boxes in the boxplots represent the interquartile range (or IQR, which is the range between the 25th and 75th percentiles), and the line in the box is the median. The x-shaped symbol is the mean.
Scores Above Which Programs Almost Always Grant Interviews
Scores Below Which Programs Generally Do Not Grant Interviews
USMLE Step 2 CK not reported
because of low response rate
USMLE Step 1 not reported because of low response
rate
USMLE Step 2 CK not reported
because of low response rate
USMLE Step 1 not reported because of low response
rate
NRMP Program Director Survey, Specialties Matching Service, 2016 205

0%
10%
20%
30%
40%
50%
60%
70%
80%
90%
100%
Yes No
89%
11%
USMLE Step 2 CS
0%
10%
20%
30%
40%
50%
60%
70%
80%
90%
100%
Yes, pass only Yes, target score No
80%
20%
0%
USMLE Step 3
0%
10%
20%
30%
40%
50%
60%
70%
80%
90%
100%
Yes, pass only Yes, target score No
80%
20%
0%
COMLEX-USA Level 1*
Obstetric AnesthesiologyPercentage of Programs That Use USMLE Step 2 Clinical Skill (CS), Step 3, and COMLEX-USA Scores* When Considering Which Applicants to Interview
Figure-4
0%
10%
20%
30%
40%
50%
60%
70%
80%
90%
100%
Yes, pass only Yes, target score No
80%
20%
0%
COMLEX-USA Level 2-CE*
0%
10%
20%
30%
40%
50%
60%
70%
80%
90%
100%
Yes, pass only Yes, target score No
80%
20%
0%
COMLEX-USA Level 3*
0%
10%
20%
30%
40%
50%
60%
70%
80%
90%
100%
Yes, pass only Yes, target score No
80%
20%
0%
COMLEX-USA Level 2-PE*
N=9 N=10
N=5 N=5
N=5 N=5
* Osteopathic applicants only
Percentage of Programs That Use USMLE Step 2 CS and Step 3 Scores
Percentage of Programs That Use COMLEX-USA Level 1 and Level 2-CE Scores
Percentage of Programs That Use COMLEX-USA Level 2-PE and Level 3 Scores
NRMP Program Director Survey, Specialties Matching Service, 2016 206

0%10%20%30%40%50%60%70%80%90%
100%
Never Seldom Often
20%
60%
20%
Would your program consider applicants who fail theexam on the first attempt?
0%
10%
20%
30%
40%
50%
60%
70%
80%
90%
100%
Yes, pass only Yes, target score No, not required
0%
17%
83%
Scores required?
N=5
N=6
100.0%Required
Program Requirement on Dedicated Time forResearch
N=10
0.0
0.4
0.8
1.2
1.6
2.0
2.4
2.8
3.2
Accredited Locally Funded Integrated Other
3 3
2
Average Number of Months if Research Time isRequired
N=8 N=1 N=0 N=2
0.0
0.4
0.8
1.2
1.6
2.0
Accredited Positions Funded Positions
1.9 1.9
Average Number of Accredited Positions and Funded Positions
0%
10%
20%
30%
40%
50%
60%
70%
80%
90%
100%
Positions Filled BeforeMatch Day
Positions Offered Outsidethe Match
Positions Filled Outsidethe Match
100% 100%
50%
Average Percentage of Accredited Positions Offered Outside ofthe Match
N=10 N=9 N=1 N=1 N=1
Obstetric AnesthesiologyPrograms That Use Core Specialty Certifying Examination When Considering Applicants for Interview
Figure-5
Obstetric AnesthesiologyPrograms Positions Figure-6
Obstetric AnesthesiologyDedicated Time for Research Figure-7
NRMP Program Director Survey, Specialties Matching Service, 2016 207

0%
10%
20%
30%
40%
50%
60%
70%
80%
90%
100%100%
90%
50%
10%
30%
10%
U.S. Graduate OsteopathicPhysician
Canadian Fifth Pathway U.S. IMG Non-U.S. IMG
Percentage of Programs that Typically Interview and Rank Each Applicant Type
Figure-8Obstetric AnesthesiologyProgram's Interview Activities
0%10%20%30%40%50%60%70%80%90%
100%
Rejected based on astandardized screening
process
In-depth review
34%
66%
Average Percentage of Applicants Rejected and Reviewed
0
1
2
3
4
5
6
7
8
Number of applicationsreceived
Number of interviewinvitations sent
Number of applicantsinterviewed
8
5 5
Average Number of Positions, Applications Received, InterviewInvitations Sent, and Applicants Interviewed and Ranked
N=8N=8N=8N=8
N=10
10% of Obstetric Anesthesiology programs consider all applicant groups
N=8
0%10%20%30%40%50%60%70%80%90%
100%
Prev. Grad Osteo Pathway Canadian US IMG Non-USIMG
75%
44%
22%
56%50%
13%
33%
56%
33%
100%
50%
13%22% 22%
11%
Often Seldom Never
Interview
0%10%
20%
30%40%
50%60%
70%80%
90%100%
Prev. Grad Osteo Pathway Canadian US IMG Non-USIMG
75%
44%33%
67%
40%
13%
33%44%
22%
100%
60%
13%22% 22%
11%
Often Seldom Never
Ranking
n=10
Frequency of Programs Interviewing and Ranking Candidates
n=10
N=7
0%10%20%30%40%50%60%70%80%90%
100%
Jan Feb Mar Apr May Jun Jul Aug Sep Oct Nov Dec
0% 0% 3%
40%
28%
0% 0% 1%
14%5% 3% 6%
Interview invitations
Interview Invitations Sent and Interviews Conducted
0% 0% 0%10%
45%
15%
1% 1%
14%
0%8% 6%
Interviews conducted
NRMP Program Director Survey, Specialties Matching Service, 2016 208

Figure-9Obstetric AnesthesiologyPotential Challenges in Recruiting Applicants to Your Specialty
0% 20% 40% 60% 80% 100%
88%
38%
25%
0%
0%
We consider those applicants on an individual basis
We give those applicants serious consideration if they haveshown improvement
We do not usually consider those applicants
We favor those applicants
Other
0 1 2 3 4 5
Not enough applicants in the specialty
Undesirable income potential as a practicing physician
Undesirable work/life balance as a practicing physician
Long or irregular work hours required by specialty
Fellowship Match scheduled at inconvenient time of year
3.9
2.2
2.4
2.2
3.2
Average rating on a scale of 5 (1=least challenging; 5=most challenging)
n=10
22.2%Less than 3
44.4%3 to 5
22.2%6 to 10
11.1%11 to 15
At Any Fellowship Program
22.2%Less than 3
55.6%3 to
5
22.2%6 to 10
At Current Fellowship Program
n=8
n=9 n=9
Obstetric AnesthesiologyApplicants Who Applied in the Specialty in the Past But Did Not Match Figure-10
Obstetric AnesthesiologyYears as Program Director Figure-11
NRMP Program Director Survey, Specialties Matching Service, 2016 209

Pain Medicine
NRMP Program Director Survey, Specialties Matching Service, 2016 210

Pain MedicineGeneral Information
Table 1
90
305
416
Number of programs in the Match
Number of positions in the Match
Number of applicants ranking specialty
25.0%Response rate
Appointment Years
Number of responses 21
Match Information*
* Source: NRMP Data Warehouse
2016 Survey
2016 2015 2014
84
286
397
82
261
398
NRMP Program Director Survey, Specialties Matching Service, 2016 211

Figure-1Pain MedicinePercentage of Programs Citing Each Factor and Mean Importance Rating¹ for Each Factor in Selecting Applicants to Interview(N=17)
Average RatingPercent Citing Factor
¹ Ratings on a scale from 1 (not at all important) to 5 (very important).* International Medical Graduates only
1 2 3 4 5
4.64.43.43.54.54.34.64.84.23.84.04.24.43.64.04.74.74.14.04.53.43.53.63.94.44.33.03.53.83.44.33.74.34.14.04.33.54.3
3.0100% 50% 0%
76%59%53%76%82%71%82%53%76%71%71%65%59%47%59%47%53%65%35%24%29%24%29%41%29%24%24%29%29%29%35%18%35%41%12%29%12%59%
0%6%
Letters of recommendation in fellowship specialty
Residency performance evaluation (Program Director letter)
Reputation of residency program
Demonstrated involvement and perceived interest in research
Perceived commitment to specialty
Personal statement
Perceived interest in program
Evidence of professionalism and ethics
USMLE Step 1/COMLEX Level 1 score
Peer reviewed publications/authored textbook chapters
USMLE Step 2 CK/COMLEX Level 2 CE score
Leadership qualities
Personal prior professional knowledge of the applicant
Oral presentations/poster presentations/speaking engagements
Applicant was a resident in a core program at same institution
Pass USMLE Step 2 CS/COMLEX Level 2 PE
Any failed attempt in USMLE/COMLEX
USMLE Step 3/COMLEX Level 3 score
Interest in academic career
Residency program setting (univ.‐based vs. comm.‐based)
Clinical/laboratory research experience
Awards or special honors in medical school
Alpha Omega Alpha (AOA) membership
Other life experience
Medical Student Performance Evaluation (MSPE/Dean's Letter)
Graduate of highly‐regarded medical school
Visa status*
Volunteer/extracurricular experiences
Awarded grant money for research
Grades in medical school
Lack of gaps in medical education
Medical school class ranking/quartile
Applicant was flagged with Match violation by the NRMP
Electives at your fellowship site
Gold Humanism Honor Society (GHHS) membership
Residency class ranking/quartile
Fluency in language spoken by your patient population
In‐Training Examination (ITE)
Residency program size
Having finished another fellowship
NRMP Program Director Survey, Specialties Matching Service, 2016 212

Pain MedicinePercentage of Programs Citing Each Factor and Mean Importance Rating¹ for Each Factor in Ranking Applicants(N=17)
Figure-2
Average RatingPercent Citing Factor
¹ Ratings on a scale from 1 (not at all important) to 5 (very important).* International Medical Graduates only
1 2 3 4 5
5.05.04.74.74.84.85.04.13.84.75.04.44.64.44.04.64.14.85.04.75.03.84.74.54.24.03.84.84.45.04.54.05.04.04.23.74.54.85.04.03.54.04.04.64.03.0
100% 50% 0%
81%88%81%69%63%75%69%50%38%38%44%44%50%63%50%31%56%38%38%44%38%31%38%25%31%19%25%25%31%13%13%13%13%19%31%19%13%31%6%
13%13%13%6%
50%19%6%
Interactions with faculty during interview and visitInterpersonal skills
Letters of recommendation in fellowship specialtyInteractions with house staff during interview and visit
Perceived commitment to specialtyFeedback from current residents and fellows
Perceived interest in programDemonstrated involvement and perceived interest in research
Reputation of residency programResidency performance evaluation (Program Director letter)
Evidence of professionalism and ethicsPersonal statement
Personal prior professional knowledge of the applicantLeadership qualities
Peer reviewed publications/authored textbook chaptersInterest in academic career
Applicant was a resident in a core program at same institutionUSMLE Step 1/COMLEX Level 1 score
USMLE Step 2 CK/COMLEX Level 2 CE scoreAny failed attempt in USMLE/COMLEX
Passing USMLE Step 2 CS/COMLEX Level 2 PEClinical/laboratory research experience
USMLE Step 3/COMLEX Level 3 scoreOral presentations/poster presentations/speaking engagements
Residency program setting (univ.‐based vs. comm.‐based)Alpha Omega Alpha (AOA) membership
Other life experienceMedical Student Performance Evaluation (MSPE/Dean's Letter)
Second interview/visitAwards or special honors in medical school
Visa status*Applicant was flagged with Match violation by the NRMP
Graduate of highly‐regarded medical schoolElectives at your fellowship site
Awarded grant money for researchVolunteer/extracurricular experiencesMedical school class ranking/quartile
Lack of gaps in medical educationGrades in medical school
Residency class ranking/quartileFluency in language spoken by your patient population
Gold Humanism Honor Society (GHHS) membershipResidency program size
In‐Training Examination (ITE)Second interview/visit
Having finished another fellowship
NRMP Program Director Survey, Specialties Matching Service, 2016 213

Pain MedicinePrograms That Use USMLE Step 1 and Step 2 Clinical Knowledge (CK) Scores When Considering Which Applicants to Interview
Figure-3
Percentage of Programs That Use USMLE Step 2 (CK) Score
0%
10%
20%
30%
40%
50%
60%
70%
80%
90%
100%
Never Seldom Often
29%
71%
0%
Would your program consider applicants who fail theexam on the first attempt?
0%
10%
20%
30%
40%
50%
60%
70%
80%
90%
100%
Never Seldom often
29%
71%
0%
Would your program consider applicants who failthe exam on the first attempt?
0%
10%
20%
30%
40%
50%
60%
70%
80%
90%
100%
Yes, pass only Yes, target score No
67%
33%
0%
Scores required?
0%
10%
20%
30%
40%
50%
60%
70%
80%
90%
100%
Yes, pass only Yes, target score No
81%
19%
0%
Scores required?
N=15
N=14
N=16N=14
N=5
IQR* of Average USMLE Step 1 and Step 2 CK Scores Programs Consider When Granting Interviews
Percentage of Programs That Use USMLE Step 1 Score
170
180
190
200
210
220
230
240
250
260
USMLE Step 1
*The boxes in the boxplots represent the interquartile range (or IQR, which is the range between the 25th and 75th percentiles), and the line in the box is the median. The x-shaped symbol is the mean.
Scores Above Which Programs Almost Always Grant Interviews
Scores Below Which Programs Generally Do Not Grant Interviews
USMLE Step 2 CK not reported
because of low response rate
USMLE Step 1 not reported because of low response
rate
USMLE Step 2 CK not reported
because of low response rate
NRMP Program Director Survey, Specialties Matching Service, 2016 214

0%
10%
20%
30%
40%
50%
60%
70%
80%
90%
100%
Yes No
100%
0%
USMLE Step 2 CS
0%
10%
20%
30%
40%
50%
60%
70%
80%
90%
100%
Yes, pass only Yes, target score No
75%
19%
6%
USMLE Step 3
0%
10%
20%
30%
40%
50%
60%
70%
80%
90%
100%
Yes, pass only Yes, target score No
67%
25%
8%
COMLEX-USA Level 1*
Pain MedicinePercentage of Programs That Use USMLE Step 2 Clinical Skill (CS), Step 3, and COMLEX-USA Scores* When Considering Which Applicants to Interview
Figure-4
0%
10%
20%
30%
40%
50%
60%
70%
80%
90%
100%
Yes, pass only Yes, target score No
67%
25%
8%
COMLEX-USA Level 2-CE*
0%
10%
20%
30%
40%
50%
60%
70%
80%
90%
100%
Yes, pass only Yes, target score No
67%
25%
8%
COMLEX-USA Level 3*
0%
10%
20%
30%
40%
50%
60%
70%
80%
90%
100%
Yes, pass only Yes, target score No
67%
25%
8%
COMLEX-USA Level 2-PE*
N=15 N=16
N=12 N=12
N=12 N=12
* Osteopathic applicants only
Percentage of Programs That Use USMLE Step 2 CS and Step 3 Scores
Percentage of Programs That Use COMLEX-USA Level 1 and Level 2-CE Scores
Percentage of Programs That Use COMLEX-USA Level 2-PE and Level 3 Scores
NRMP Program Director Survey, Specialties Matching Service, 2016 215

0%10%20%30%40%50%60%70%80%90%
100%
Never Seldom Often
0%
100%
0%
Would your program consider applicants who fail theexam on the first attempt?
0%
10%
20%
30%
40%
50%
60%
70%
80%
90%
100%
Yes, pass only Yes, target score No, not required
57%
14%
29%
Scores required?
N=8
N=7
90.5%Optional
9.5%Required
Program Requirement on Dedicated Time forResearch
N=21
0.0
0.2
0.4
0.6
0.8
1.0
Accredited Locally Funded Integrated Other
1 1
Average Number of Months if Research Time isRequired
N=1 N=0 N=2 N=0
0.0
0.5
1.0
1.5
2.0
2.5
3.0
3.5
4.0
Accredited Positions Funded Positions
3.63.4
Average Number of Accredited Positions and Funded Positions
0%
10%
20%
30%
40%
50%
60%
70%
80%
90%
100%
Positions Filled BeforeMatch Day
Positions Offered Outsidethe Match
Positions Filled Outsidethe Match
100%
67%
33%
Average Percentage of Accredited Positions Offered Outside ofthe Match
N=21 N=19 N=4 N=2 N=1
Pain MedicinePrograms That Use Core Specialty Certifying Examination When Considering Applicants for Interview
Figure-5
Pain MedicinePrograms Positions Figure-6
Pain MedicineDedicated Time for Research Figure-7
NRMP Program Director Survey, Specialties Matching Service, 2016 216

0%
10%
20%
30%
40%
50%
60%
70%
80%
90%
100%89%
95%
63%
42%
84%
53%
U.S. Graduate OsteopathicPhysician
Canadian Fifth Pathway U.S. IMG Non-U.S. IMG
Percentage of Programs that Typically Interview and Rank Each Applicant Type
Figure-8Pain MedicineProgram's Interview Activities
0%10%20%30%40%50%60%70%80%90%
100%
Rejected based on astandardized screening
process
In-depth review
43%48%
Average Percentage of Applicants Rejected and Reviewed
0
20
40
60
80
100
120
140
160
Number of applicationsreceived
Number of interviewinvitations sent
Number of applicantsinterviewed
150
33 29
Average Number of Positions, Applications Received, InterviewInvitations Sent, and Applicants Interviewed and Ranked
N=19N=19N=19N=19
N=19
42% of Pain Medicine programs consider all applicant groups
N=20
0%10%20%30%40%50%60%70%80%90%
100%
Prev. Grad Osteo Pathway Canadian US IMG Non-USIMG
6%
39%
16%5%
16%17% 21%
50%
74%
63%
68%
78% 79%
11% 11%
32%16%
Often Seldom Never
Interview
0%10%
20%
30%40%
50%60%
70%80%
90%100%
Prev. Grad Osteo Pathway Canadian US IMG Non-USIMG
41%22%
6%18%18% 22%
53%72%
67%
71%82% 78%
6% 6%
28%12%
Often Seldom Never
Ranking
n=17
Frequency of Programs Interviewing and Ranking Candidates
n=18
N=18
0%10%20%30%40%50%60%70%80%90%
100%
Jan Feb Mar Apr May Jun Jul Aug Sep Oct Nov Dec
0% 0% 0%10%
27% 29%
14%19%
1% 0% 0% 0%
Interview invitations
Interview Invitations Sent and Interviews Conducted
0% 0% 0% 0% 1%9%
28%
45%
2% 0% 0% 0%
Interviews conducted
NRMP Program Director Survey, Specialties Matching Service, 2016 217

Figure-9Pain MedicinePotential Challenges in Recruiting Applicants to Your Specialty
0% 10% 20% 30% 40% 50% 60% 70%
69%
19%
19%
0%
0%
We consider those applicants on an individual basis
We give those applicants serious consideration if they haveshown improvement
We do not usually consider those applicants
We favor those applicants
Other
0 1 2 3 4 5
Not enough applicants in the specialty
Undesirable income potential as a practicing physician
Undesirable work/life balance as a practicing physician
Long or irregular work hours required by specialty
Fellowship Match scheduled at inconvenient time of year
1.8
1.8
1.9
1.9
2.5
Average rating on a scale of 5 (1=least challenging; 5=most challenging)
n=15
17.6%Less than 3
35.3%3 to 529.4%
6 to10
11.8%11 to 15 5.9%
More than 15
At Any Fellowship Program
35.3%Less than 3
29.4%3 to
5
29.4%6 to 10
5.9%More than 15
At Current Fellowship Program
n=16
n=17 n=17
Pain MedicineApplicants Who Applied in the Specialty in the Past But Did Not Match Figure-10
Pain MedicineYears as Program Director Figure-11
NRMP Program Director Survey, Specialties Matching Service, 2016 218

Pediatric Anesthesiology
NRMP Program Director Survey, Specialties Matching Service, 2016 219

Pediatric AnesthesiologyGeneral Information
Table 1
52
190
209
Number of programs in the Match
Number of positions in the Match
Number of applicants ranking specialty
47.1%Response rate
Appointment Years
Number of responses 24
Match Information*
* Source: NRMP Data Warehouse
2016 Survey
2016 2015 2014
46
185
207
44
171
182
NRMP Program Director Survey, Specialties Matching Service, 2016 220

Figure-1Pediatric AnesthesiologyPercentage of Programs Citing Each Factor and Mean Importance Rating¹ for Each Factor in Selecting Applicants to Interview(N=21)
Average RatingPercent Citing Factor
¹ Ratings on a scale from 1 (not at all important) to 5 (very important).* International Medical Graduates only
1 2 3 4 5
4.44.33.73.44.54.24.74.73.93.93.84.14.23.83.93.74.33.94.13.93.63.53.83.53.93.73.73.73.53.34.43.05.04.03.63.83.64.5
4.0100% 50% 0%
71%90%90%81%76%81%67%86%76%48%81%71%52%67%71%62%48%52%43%38%43%48%62%43%38%38%33%38%43%24%33%19%24%10%29%33%29%95%
0%19%
Letters of recommendation in fellowship specialty
Residency performance evaluation (Program Director letter)
Reputation of residency program
Demonstrated involvement and perceived interest in research
Perceived commitment to specialty
Personal statement
Perceived interest in program
Evidence of professionalism and ethics
USMLE Step 1/COMLEX Level 1 score
Peer reviewed publications/authored textbook chapters
USMLE Step 2 CK/COMLEX Level 2 CE score
Leadership qualities
Personal prior professional knowledge of the applicant
Oral presentations/poster presentations/speaking engagements
Applicant was a resident in a core program at same institution
Pass USMLE Step 2 CS/COMLEX Level 2 PE
Any failed attempt in USMLE/COMLEX
USMLE Step 3/COMLEX Level 3 score
Interest in academic career
Residency program setting (univ.‐based vs. comm.‐based)
Clinical/laboratory research experience
Awards or special honors in medical school
Alpha Omega Alpha (AOA) membership
Other life experience
Medical Student Performance Evaluation (MSPE/Dean's Letter)
Graduate of highly‐regarded medical school
Visa status*
Volunteer/extracurricular experiences
Awarded grant money for research
Grades in medical school
Lack of gaps in medical education
Medical school class ranking/quartile
Applicant was flagged with Match violation by the NRMP
Electives at your fellowship site
Gold Humanism Honor Society (GHHS) membership
Residency class ranking/quartile
Fluency in language spoken by your patient population
In‐Training Examination (ITE)
Residency program size
Having finished another fellowship
NRMP Program Director Survey, Specialties Matching Service, 2016 221

Pediatric AnesthesiologyPercentage of Programs Citing Each Factor and Mean Importance Rating¹ for Each Factor in Ranking Applicants(N=21)
Figure-2
Average RatingPercent Citing Factor
¹ Ratings on a scale from 1 (not at all important) to 5 (very important).* International Medical Graduates only
1 2 3 4 5
4.94.84.44.84.64.94.23.63.94.44.64.04.73.84.24.03.84.34.15.04.43.84.24.74.03.83.93.84.23.54.55.04.04.04.53.83.04.03.03.74.03.0
4.44.53.3
100% 50% 0%
95%95%43%90%52%48%71%52%48%38%62%38%29%38%29%38%48%48%43%19%24%24%24%14%19%29%38%24%33%19%10%19%14%14%19%29%10%10%14%14%5%
10%0%
62%19%14%
Interactions with faculty during interview and visitInterpersonal skills
Letters of recommendation in fellowship specialtyInteractions with house staff during interview and visit
Perceived commitment to specialtyFeedback from current residents and fellows
Perceived interest in programDemonstrated involvement and perceived interest in research
Reputation of residency programResidency performance evaluation (Program Director letter)
Evidence of professionalism and ethicsPersonal statement
Personal prior professional knowledge of the applicantLeadership qualities
Peer reviewed publications/authored textbook chaptersInterest in academic career
Applicant was a resident in a core program at same institutionUSMLE Step 1/COMLEX Level 1 score
USMLE Step 2 CK/COMLEX Level 2 CE scoreAny failed attempt in USMLE/COMLEX
Passing USMLE Step 2 CS/COMLEX Level 2 PEClinical/laboratory research experience
USMLE Step 3/COMLEX Level 3 scoreOral presentations/poster presentations/speaking engagements
Residency program setting (univ.‐based vs. comm.‐based)Alpha Omega Alpha (AOA) membership
Other life experienceMedical Student Performance Evaluation (MSPE/Dean's Letter)
Second interview/visitAwards or special honors in medical school
Visa status*Applicant was flagged with Match violation by the NRMP
Graduate of highly‐regarded medical schoolElectives at your fellowship site
Awarded grant money for researchVolunteer/extracurricular experiencesMedical school class ranking/quartile
Lack of gaps in medical educationGrades in medical school
Residency class ranking/quartileFluency in language spoken by your patient population
Gold Humanism Honor Society (GHHS) membershipResidency program size
In‐Training Examination (ITE)Second interview/visit
Having finished another fellowship
NRMP Program Director Survey, Specialties Matching Service, 2016 222

170
180
190
200
210
220
230
240
250
260
Pediatric AnesthesiologyPrograms That Use USMLE Step 1 and Step 2 Clinical Knowledge (CK) Scores When Considering Which Applicants to Interview
Figure-3
Percentage of Programs That Use USMLE Step 2 (CK) Score
0%
10%
20%
30%
40%
50%
60%
70%
80%
90%
100%
Never Seldom Often
25%
55%
20%
Would your program consider applicants who fail theexam on the first attempt?
0%
10%
20%
30%
40%
50%
60%
70%
80%
90%
100%
Never Seldom often
37%42%
21%
Would your program consider applicants who failthe exam on the first attempt?
0%
10%
20%
30%
40%
50%
60%
70%
80%
90%
100%
Yes, pass only Yes, target score No
55%
45%
0%
Scores required?
0%
10%
20%
30%
40%
50%
60%
70%
80%
90%
100%
Yes, pass only Yes, target score No
70%
30%
0%
Scores required?
N=20
N=20
N=20N=19
N=6N=9 N=7
IQR* of Average USMLE Step 1 and Step 2 CK Scores Programs Consider When Granting Interviews
Percentage of Programs That Use USMLE Step 1 Score
170
180
190
200
210
220
230
240
250
260
USMLE Step 2 CKUSMLE Step 1 USMLE Step 1
*The boxes in the boxplots represent the interquartile range (or IQR, which is the range between the 25th and 75th percentiles), and the line in the box is the median. The x-shaped symbol is the mean.
Scores Above Which Programs Almost Always Grant Interviews
Scores Below Which Programs Generally Do Not Grant Interviews
USMLE Step 2 CK not reported
because of low response rate
NRMP Program Director Survey, Specialties Matching Service, 2016 223

0%
10%
20%
30%
40%
50%
60%
70%
80%
90%
100%
Yes No
100%
0%
USMLE Step 2 CS
0%
10%
20%
30%
40%
50%
60%
70%
80%
90%
100%
Yes, pass only Yes, target score No
60%
35%
5%
USMLE Step 3
0%
10%
20%
30%
40%
50%
60%
70%
80%
90%
100%
Yes, pass only Yes, target score No
56%
25%19%
COMLEX-USA Level 1*
Pediatric AnesthesiologyPercentage of Programs That Use USMLE Step 2 Clinical Skill (CS), Step 3, and COMLEX-USA Scores* When Considering Which Applicants to Interview
Figure-4
0%
10%
20%
30%
40%
50%
60%
70%
80%
90%
100%
Yes, pass only Yes, target score No
59%
18%24%
COMLEX-USA Level 2-CE*
0%
10%
20%
30%
40%
50%
60%
70%
80%
90%
100%
Yes, pass only Yes, target score No
56%
25%19%
COMLEX-USA Level 3*
0%
10%
20%
30%
40%
50%
60%
70%
80%
90%
100%
Yes, pass only Yes, target score No
69%
13%19%
COMLEX-USA Level 2-PE*
N=20 N=20
N=16 N=17
N=16 N=16
* Osteopathic applicants only
Percentage of Programs That Use USMLE Step 2 CS and Step 3 Scores
Percentage of Programs That Use COMLEX-USA Level 1 and Level 2-CE Scores
Percentage of Programs That Use COMLEX-USA Level 2-PE and Level 3 Scores
NRMP Program Director Survey, Specialties Matching Service, 2016 224

0%10%20%30%40%50%60%70%80%90%
100%
Never Seldom Often
27%
60%
13%
Would your program consider applicants who fail theexam on the first attempt?
0%
10%
20%
30%
40%
50%
60%
70%
80%
90%
100%
Yes, pass only Yes, target score No, not required
33%
20%
47%
Scores required?
N=15
N=15
83.3%Optional
16.7%Required
Program Requirement on Dedicated Time forResearch
N=24
0.0
0.2
0.4
0.6
0.8
1.0
Accredited Locally Funded Integrated Other
1 1
Average Number of Months if Research Time isRequired
N=2 N=0 N=0 N=2
0.0
0.5
1.0
1.5
2.0
2.5
3.0
3.5
4.0
4.5
Accredited Positions Funded Positions
4.2 4.2
Average Number of Accredited Positions and Funded Positions
0%
10%
20%
30%
40%
50%
60%
70%
80%
90%
100%
Positions Filled BeforeMatch Day
Positions Offered Outsidethe Match
Positions Filled Outsidethe Match
71%
35%31%
Average Percentage of Accredited Positions Offered Outside ofthe Match
N=23 N=22 N=8 N=4 N=3
Pediatric AnesthesiologyPrograms That Use Core Specialty Certifying Examination When Considering Applicants for Interview
Figure-5
Pediatric AnesthesiologyPrograms Positions Figure-6
Pediatric AnesthesiologyDedicated Time for Research Figure-7
NRMP Program Director Survey, Specialties Matching Service, 2016 225

0%
10%
20%
30%
40%
50%
60%
70%
80%
90%
100% 95%
77%
55%
14%
64%
36%
U.S. Graduate OsteopathicPhysician
Canadian Fifth Pathway U.S. IMG Non-U.S. IMG
Percentage of Programs that Typically Interview and Rank Each Applicant Type
Figure-8Pediatric AnesthesiologyProgram's Interview Activities
0%10%20%30%40%50%60%70%80%90%
100%
Rejected based on astandardized screening
process
In-depth review
28%
74%
Average Percentage of Applicants Rejected and Reviewed
0
10
20
30
40
50
60
Number of applicationsreceived
Number of interviewinvitations sent
Number of applicantsinterviewed
54
27 26
Average Number of Positions, Applications Received, InterviewInvitations Sent, and Applicants Interviewed and Ranked
N=21N=21N=20N=21
N=22
14% of Pediatric Anesthesiology programs consider all applicant groups
N=21
0%10%20%30%40%50%60%70%80%90%
100%
Prev. Grad Osteo Pathway Canadian US IMG Non-USIMG
5% 5%
77%
27%14%
23%32%
23%
55%
45%
64%95%
64%
18%
41%
14%
Often Seldom Never
Interview
0%10%
20%
30%40%
50%60%
70%80%
90%100%
Prev. Grad Osteo Pathway Canadian US IMG Non-USIMG
5% 9%
82%
32%18%
36%23%
18%
55%
41%
50%95%
68%
14%
41%
14%
Often Seldom Never
Ranking
n=21
Frequency of Programs Interviewing and Ranking Candidates
n=22
N=20
0%10%20%30%40%50%60%70%80%90%
100%
Jan Feb Mar Apr May Jun Jul Aug Sep Oct Nov Dec
3% 5%
21%
37%
18%11%
6%1% 0% 0% 0% 0%
Interview invitations
Interview Invitations Sent and Interviews Conducted
0% 1% 2%12%
29% 29%
14% 11%3% 0% 0% 0%
Interviews conducted
NRMP Program Director Survey, Specialties Matching Service, 2016 226

Figure-9Pediatric AnesthesiologyPotential Challenges in Recruiting Applicants to Your Specialty
0% 20% 40% 60% 80% 100%
85%
20%
5%
0%
0%
We consider those applicants on an individual basis
We give those applicants serious consideration if they haveshown improvement
We do not usually consider those applicants
We favor those applicants
Other
0 1 2 3 4 5
Not enough applicants in the specialty
Undesirable income potential as a practicing physician
Undesirable work/life balance as a practicing physician
Long or irregular work hours required by specialty
Fellowship Match scheduled at inconvenient time of year
2.1
1.9
2.6
2.8
2.5
Average rating on a scale of 5 (1=least challenging; 5=most challenging)
n=17
25.0%Less than 3
40.0%3 to 5
20.0%6 to 10
5.0%11 to 1510.0%
More than 15
At Any Fellowship Program
23.5%Less than 3
35.3%3 to 5
29.4%6 to 10
5.9%11 to 155.9%
More than 15
At Current Fellowship Program
n=20
n=20 n=17
Pediatric AnesthesiologyApplicants Who Applied in the Specialty in the Past But Did Not Match Figure-10
Pediatric AnesthesiologyYears as Program Director Figure-11
NRMP Program Director Survey, Specialties Matching Service, 2016 227

Pediatric Cardiology
NRMP Program Director Survey, Specialties Matching Service, 2016 228

Pediatric CardiologyGeneral Information
Table 1
56
139
162
Number of programs in the Match
Number of positions in the Match
Number of applicants ranking specialty
50.9%Response rate
Appointment Years
Number of responses 28
Match Information*
* Source: NRMP Data Warehouse
2016 Survey
2016 2015 2014
57
141
181
57
141
167
NRMP Program Director Survey, Specialties Matching Service, 2016 229

Figure-1Pediatric CardiologyPercentage of Programs Citing Each Factor and Mean Importance Rating¹ for Each Factor in Selecting Applicants to Interview(N=23)
Average RatingPercent Citing Factor
¹ Ratings on a scale from 1 (not at all important) to 5 (very important).* International Medical Graduates only
1 2 3 4 5
4.44.54.34.04.13.44.04.53.93.93.74.04.33.74.04.04.43.84.24.33.93.23.53.83.33.83.73.33.43.44.03.35.03.83.74.34.35.04.32.9
100% 50% 0%
96%96%
100%100%
70%78%43%78%78%96%78%87%78%78%70%65%74%65%78%74%78%61%74%57%48%65%43%57%83%30%39%43%52%35%35%22%26%13%52%43%
Letters of recommendation in fellowship specialty
Residency performance evaluation (Program Director letter)
Reputation of residency program
Demonstrated involvement and perceived interest in research
Perceived commitment to specialty
Personal statement
Perceived interest in program
Evidence of professionalism and ethics
USMLE Step 1/COMLEX Level 1 score
Peer reviewed publications/authored textbook chapters
USMLE Step 2 CK/COMLEX Level 2 CE score
Leadership qualities
Personal prior professional knowledge of the applicant
Oral presentations/poster presentations/speaking engagements
Applicant was a resident in a core program at same institution
Pass USMLE Step 2 CS/COMLEX Level 2 PE
Any failed attempt in USMLE/COMLEX
USMLE Step 3/COMLEX Level 3 score
Interest in academic career
Residency program setting (univ.‐based vs. comm.‐based)
Clinical/laboratory research experience
Awards or special honors in medical school
Alpha Omega Alpha (AOA) membership
Other life experience
Medical Student Performance Evaluation (MSPE/Dean's Letter)
Graduate of highly‐regarded medical school
Visa status*
Volunteer/extracurricular experiences
Awarded grant money for research
Grades in medical school
Lack of gaps in medical education
Medical school class ranking/quartile
Applicant was flagged with Match violation by the NRMP
Electives at your fellowship site
Gold Humanism Honor Society (GHHS) membership
Residency class ranking/quartile
Fluency in language spoken by your patient population
In‐Training Examination (ITE)
Residency program size
Having finished another fellowship
NRMP Program Director Survey, Specialties Matching Service, 2016 230

Pediatric CardiologyPercentage of Programs Citing Each Factor and Mean Importance Rating¹ for Each Factor in Ranking Applicants(N=23)
Figure-2
Average RatingPercent Citing Factor
¹ Ratings on a scale from 1 (not at all important) to 5 (very important).* International Medical Graduates only
1 2 3 4 5
4.94.84.44.84.24.83.84.14.34.44.53.54.24.24.04.13.93.83.94.63.83.93.93.74.53.53.73.83.53.64.05.03.63.33.23.64.04.23.73.74.33.64.1
5.03.4
100% 50% 0%
95%95%95%95%81%76%67%95%86%81%76%67%76%67%67%81%67%67%57%57%57%67%43%52%62%57%52%33%38%43%19%43%48%33%48%38%29%33%24%19%24%33%38%0%5%
29%
Interactions with faculty during interview and visitInterpersonal skills
Letters of recommendation in fellowship specialtyInteractions with house staff during interview and visit
Perceived commitment to specialtyFeedback from current residents and fellows
Perceived interest in programDemonstrated involvement and perceived interest in research
Reputation of residency programResidency performance evaluation (Program Director letter)
Evidence of professionalism and ethicsPersonal statement
Personal prior professional knowledge of the applicantLeadership qualities
Peer reviewed publications/authored textbook chaptersInterest in academic career
Applicant was a resident in a core program at same institutionUSMLE Step 1/COMLEX Level 1 score
USMLE Step 2 CK/COMLEX Level 2 CE scoreAny failed attempt in USMLE/COMLEX
Passing USMLE Step 2 CS/COMLEX Level 2 PEClinical/laboratory research experience
USMLE Step 3/COMLEX Level 3 scoreOral presentations/poster presentations/speaking engagements
Residency program setting (univ.‐based vs. comm.‐based)Alpha Omega Alpha (AOA) membership
Other life experienceMedical Student Performance Evaluation (MSPE/Dean's Letter)
Second interview/visitAwards or special honors in medical school
Visa status*Applicant was flagged with Match violation by the NRMP
Graduate of highly‐regarded medical schoolElectives at your fellowship site
Awarded grant money for researchVolunteer/extracurricular experiencesMedical school class ranking/quartile
Lack of gaps in medical educationGrades in medical school
Residency class ranking/quartileFluency in language spoken by your patient population
Gold Humanism Honor Society (GHHS) membershipResidency program size
In‐Training Examination (ITE)Second interview/visit
Having finished another fellowship
NRMP Program Director Survey, Specialties Matching Service, 2016 231

170
180
190
200
210
220
230
240
250
260
Pediatric CardiologyPrograms That Use USMLE Step 1 and Step 2 Clinical Knowledge (CK) Scores When Considering Which Applicants to Interview
Figure-3
Percentage of Programs That Use USMLE Step 2 (CK) Score
0%
10%
20%
30%
40%
50%
60%
70%
80%
90%
100%
Never Seldom Often
14%
86%
0%
Would your program consider applicants who fail theexam on the first attempt?
0%
10%
20%
30%
40%
50%
60%
70%
80%
90%
100%
Never Seldom often
20%
80%
0%
Would your program consider applicants who failthe exam on the first attempt?
0%
10%
20%
30%
40%
50%
60%
70%
80%
90%
100%
Yes, pass only Yes, target score No
52%
35%
13%
Scores required?
0%
10%
20%
30%
40%
50%
60%
70%
80%
90%
100%
Yes, pass only Yes, target score No
57%
30%
13%
Scores required?
N=23
N=21
N=23N=20
N=6N=8 N=8 N=6
IQR* of Average USMLE Step 1 and Step 2 CK Scores Programs Consider When Granting Interviews
Percentage of Programs That Use USMLE Step 1 Score
170
180
190
200
210
220
230
240
250
260
USMLE Step 2 CKUSMLE Step 1 USMLE Step 1 USMLE Step 2 CK
*The boxes in the boxplots represent the interquartile range (or IQR, which is the range between the 25th and 75th percentiles), and the line in the box is the median. The x-shaped symbol is the mean.
Scores Above Which Programs Almost Always Grant Interviews
Scores Below Which Programs Generally Do Not Grant Interviews
NRMP Program Director Survey, Specialties Matching Service, 2016 232
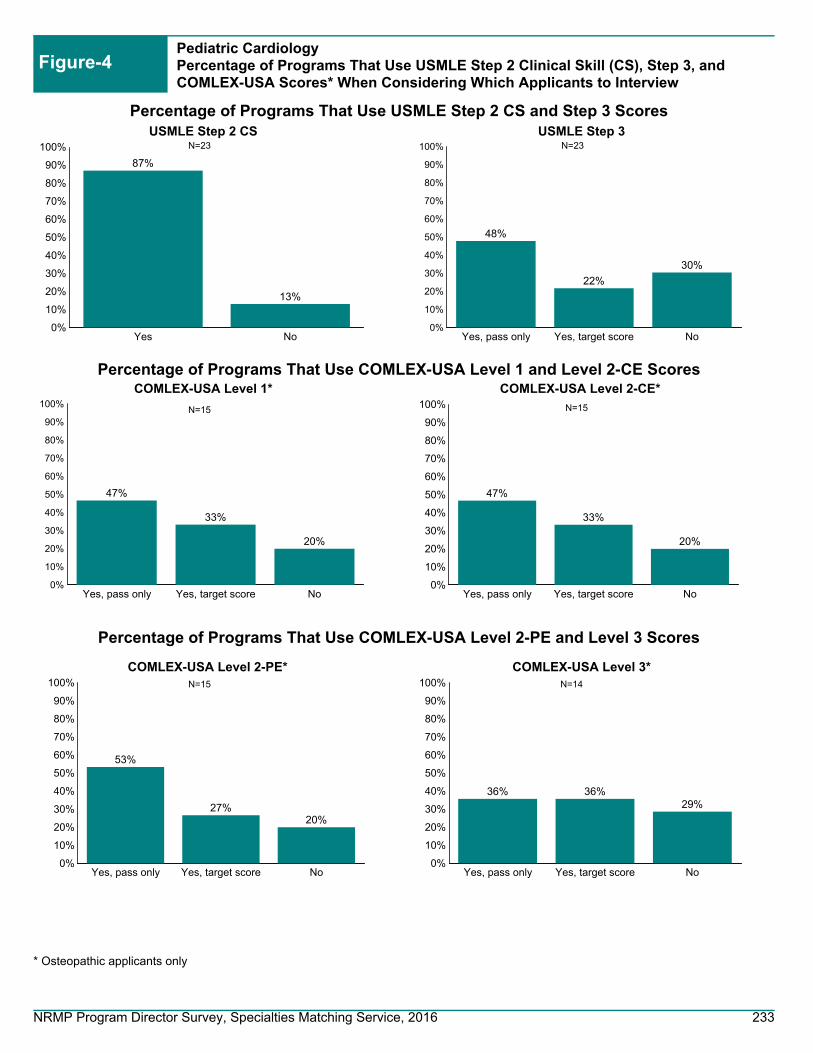
0%
10%
20%
30%
40%
50%
60%
70%
80%
90%
100%
Yes No
87%
13%
USMLE Step 2 CS
0%
10%
20%
30%
40%
50%
60%
70%
80%
90%
100%
Yes, pass only Yes, target score No
48%
22%
30%
USMLE Step 3
0%
10%
20%
30%
40%
50%
60%
70%
80%
90%
100%
Yes, pass only Yes, target score No
47%
33%
20%
COMLEX-USA Level 1*
Pediatric CardiologyPercentage of Programs That Use USMLE Step 2 Clinical Skill (CS), Step 3, and COMLEX-USA Scores* When Considering Which Applicants to Interview
Figure-4
0%
10%
20%
30%
40%
50%
60%
70%
80%
90%
100%
Yes, pass only Yes, target score No
47%
33%
20%
COMLEX-USA Level 2-CE*
0%
10%
20%
30%
40%
50%
60%
70%
80%
90%
100%
Yes, pass only Yes, target score No
36% 36%29%
COMLEX-USA Level 3*
0%
10%
20%
30%
40%
50%
60%
70%
80%
90%
100%
Yes, pass only Yes, target score No
53%
27%20%
COMLEX-USA Level 2-PE*
N=23 N=23
N=15 N=15
N=15 N=14
* Osteopathic applicants only
Percentage of Programs That Use USMLE Step 2 CS and Step 3 Scores
Percentage of Programs That Use COMLEX-USA Level 1 and Level 2-CE Scores
Percentage of Programs That Use COMLEX-USA Level 2-PE and Level 3 Scores
NRMP Program Director Survey, Specialties Matching Service, 2016 233
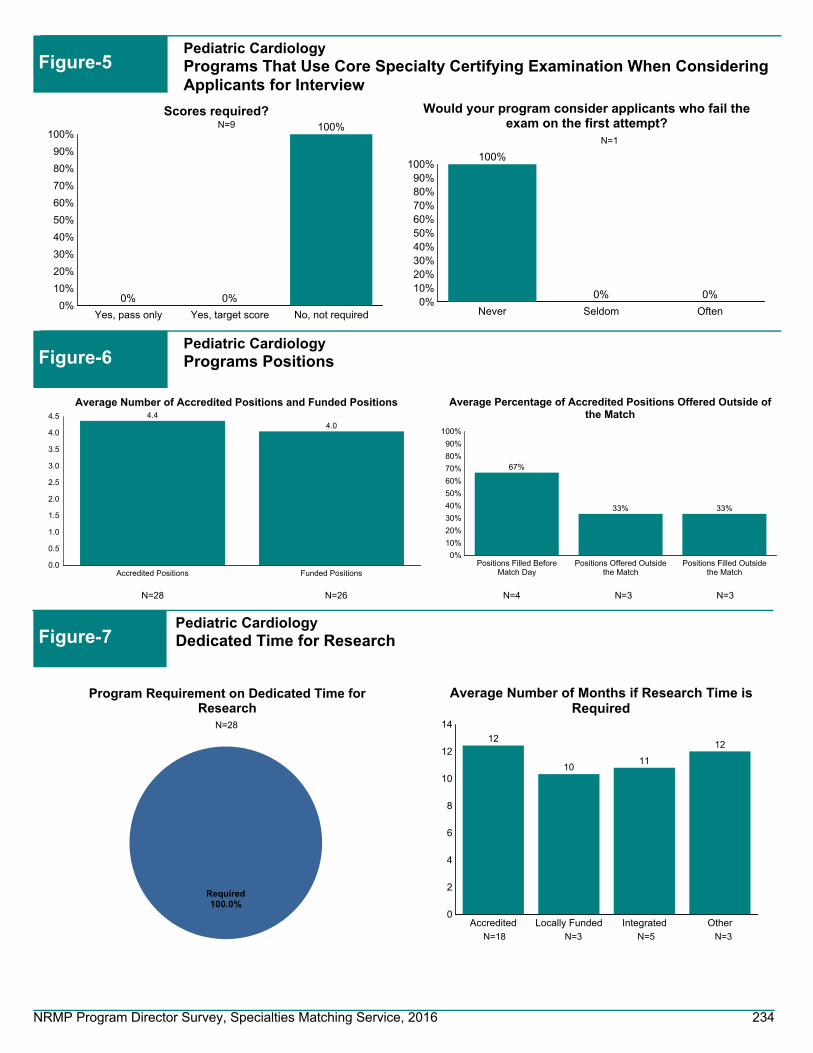
0%10%20%30%40%50%60%70%80%90%
100%
Never Seldom Often
100%
0% 0%
Would your program consider applicants who fail theexam on the first attempt?
0%
10%
20%
30%
40%
50%
60%
70%
80%
90%
100%
Yes, pass only Yes, target score No, not required
0% 0%
100%
Scores required?
N=1
N=9
100.0%Required
Program Requirement on Dedicated Time forResearch
N=28
0
2
4
6
8
10
12
14
Accredited Locally Funded Integrated Other
12
1011
12
Average Number of Months if Research Time isRequired
N=18 N=3 N=5 N=3
0.0
0.5
1.0
1.5
2.0
2.5
3.0
3.5
4.0
4.5
Accredited Positions Funded Positions
4.44.0
Average Number of Accredited Positions and Funded Positions
0%
10%
20%
30%
40%
50%
60%
70%
80%
90%
100%
Positions Filled BeforeMatch Day
Positions Offered Outsidethe Match
Positions Filled Outsidethe Match
67%
33% 33%
Average Percentage of Accredited Positions Offered Outside ofthe Match
N=28 N=26 N=4 N=3 N=3
Pediatric CardiologyPrograms That Use Core Specialty Certifying Examination When Considering Applicants for Interview
Figure-5
Pediatric CardiologyPrograms Positions Figure-6
Pediatric CardiologyDedicated Time for Research Figure-7
NRMP Program Director Survey, Specialties Matching Service, 2016 234
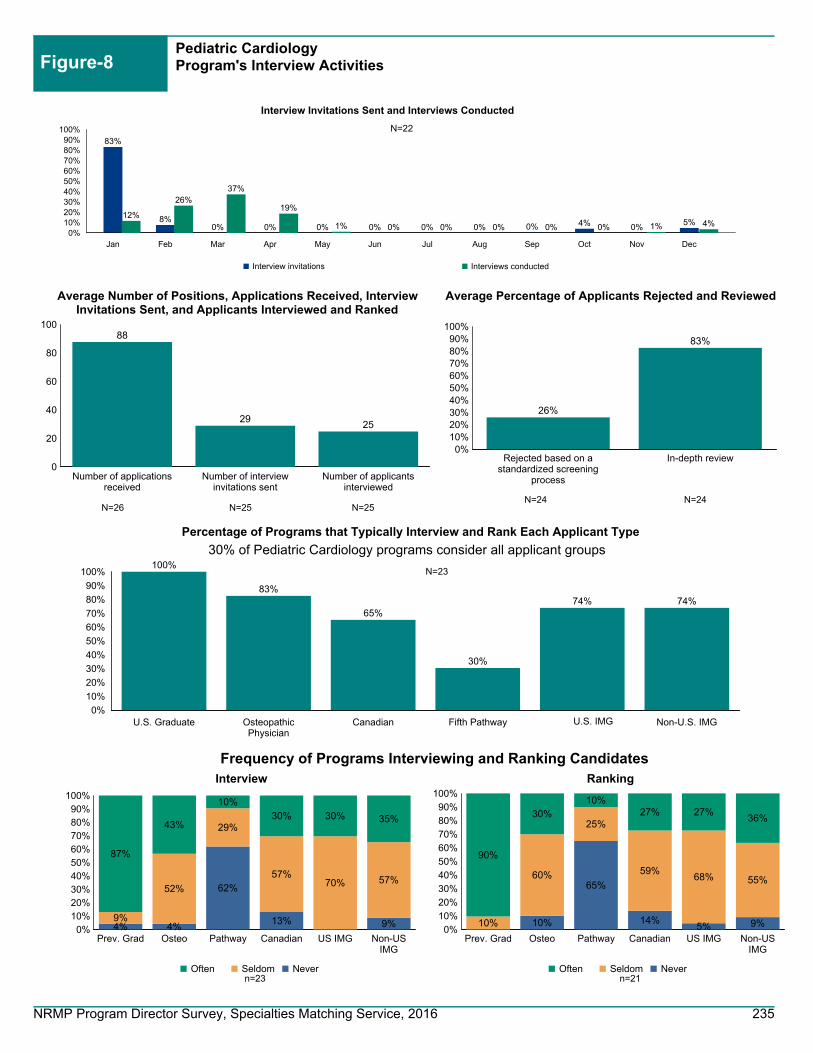
0%
10%
20%
30%
40%
50%
60%
70%
80%
90%
100%100%
83%
65%
30%
74% 74%
U.S. Graduate OsteopathicPhysician
Canadian Fifth Pathway U.S. IMG Non-U.S. IMG
Percentage of Programs that Typically Interview and Rank Each Applicant Type
Figure-8Pediatric CardiologyProgram's Interview Activities
0%10%20%30%40%50%60%70%80%90%
100%
Rejected based on astandardized screening
process
In-depth review
26%
83%
Average Percentage of Applicants Rejected and Reviewed
0
20
40
60
80
100
Number of applicationsreceived
Number of interviewinvitations sent
Number of applicantsinterviewed
88
2925
Average Number of Positions, Applications Received, InterviewInvitations Sent, and Applicants Interviewed and Ranked
N=24N=24N=25N=26
N=23
30% of Pediatric Cardiology programs consider all applicant groups
N=25
0%10%20%30%40%50%60%70%80%90%
100%
Prev. Grad Osteo Pathway Canadian US IMG Non-USIMG
4% 4%
62%
13% 9%9%
52%
29%
57%70% 57%
87%
43%
10%
30% 30% 35%
Often Seldom Never
Interview
0%10%
20%
30%40%
50%60%
70%80%
90%100%
Prev. Grad Osteo Pathway Canadian US IMG Non-USIMG
10%
65%
14%5% 9%10%
60%
25%
59%68% 55%
90%
30%10%
27% 27%36%
Often Seldom Never
Ranking
n=21
Frequency of Programs Interviewing and Ranking Candidates
n=23
N=22
0%10%20%30%40%50%60%70%80%90%
100%
Jan Feb Mar Apr May Jun Jul Aug Sep Oct Nov Dec
83%
8%0% 0% 0% 0% 0% 0% 0% 4% 0%
5%
Interview invitations
Interview Invitations Sent and Interviews Conducted
12%
26%37%
19%
1% 0% 0% 0% 0% 0% 1% 4%
Interviews conducted
NRMP Program Director Survey, Specialties Matching Service, 2016 235

Figure-9Pediatric CardiologyPotential Challenges in Recruiting Applicants to Your Specialty
0% 10% 20% 30% 40% 50% 60% 70%
67%
24%
24%
0%
0%
We consider those applicants on an individual basis
We give those applicants serious consideration if they haveshown improvement
We do not usually consider those applicants
We favor those applicants
Other
0 1 2 3 4 5
Not enough applicants in the specialty
Undesirable income potential as a practicing physician
Undesirable work/life balance as a practicing physician
Long or irregular work hours required by specialty
Fellowship Match scheduled at inconvenient time of year
1.6
1.8
3.3
3.1
2.4
Average rating on a scale of 5 (1=least challenging; 5=most challenging)
n=21
32.0%Less than 3
16.0%3 to 532.0%
6 to 10
16.0%11 to 15
4.0%More than 15
At Any Fellowship Program
39.1%Less than 3
13.0%3 to 5
26.1%6 to 10
17.4%11 to
15
4.3%More than 15
At Current Fellowship Program
n=21
n=25 n=23
Pediatric CardiologyApplicants Who Applied in the Specialty in the Past But Did Not Match Figure-10
Pediatric CardiologyYears as Program Director Figure-11
NRMP Program Director Survey, Specialties Matching Service, 2016 236

Pediatric Critical Care Medicine
NRMP Program Director Survey, Specialties Matching Service, 2016 237

Pediatric Critical Care MedicineGeneral Information
Table 1
65
175
186
Number of programs in the Match
Number of positions in the Match
Number of applicants ranking specialty
55.6%Response rate
Appointment Years
Number of responses 35
Match Information*
* Source: NRMP Data Warehouse
2016 Survey
2016 2015 2014
62
168
206
63
169
168
NRMP Program Director Survey, Specialties Matching Service, 2016 238

Figure-1Pediatric Critical Care MedicinePercentage of Programs Citing Each Factor and Mean Importance Rating¹ for Each Factor in Selecting Applicants to Interview(N=24)
Average RatingPercent Citing Factor
¹ Ratings on a scale from 1 (not at all important) to 5 (very important).* International Medical Graduates only
1 2 3 4 5
4.34.34.14.04.23.74.24.83.63.63.74.14.33.73.93.64.03.64.13.93.53.13.73.72.83.44.53.23.83.43.72.84.93.14.03.03.34.04.03.3
100% 50% 0%
92%88%96%92%75%71%71%67%67%75%67%63%75%67%71%58%79%63%58%71%63%58%54%42%54%58%46%38%50%25%38%33%38%33%29%25%17%
4%50%29%
Letters of recommendation in fellowship specialty
Residency performance evaluation (Program Director letter)
Reputation of residency program
Demonstrated involvement and perceived interest in research
Perceived commitment to specialty
Personal statement
Perceived interest in program
Evidence of professionalism and ethics
USMLE Step 1/COMLEX Level 1 score
Peer reviewed publications/authored textbook chapters
USMLE Step 2 CK/COMLEX Level 2 CE score
Leadership qualities
Personal prior professional knowledge of the applicant
Oral presentations/poster presentations/speaking engagements
Applicant was a resident in a core program at same institution
Pass USMLE Step 2 CS/COMLEX Level 2 PE
Any failed attempt in USMLE/COMLEX
USMLE Step 3/COMLEX Level 3 score
Interest in academic career
Residency program setting (univ.‐based vs. comm.‐based)
Clinical/laboratory research experience
Awards or special honors in medical school
Alpha Omega Alpha (AOA) membership
Other life experience
Medical Student Performance Evaluation (MSPE/Dean's Letter)
Graduate of highly‐regarded medical school
Visa status*
Volunteer/extracurricular experiences
Awarded grant money for research
Grades in medical school
Lack of gaps in medical education
Medical school class ranking/quartile
Applicant was flagged with Match violation by the NRMP
Electives at your fellowship site
Gold Humanism Honor Society (GHHS) membership
Residency class ranking/quartile
Fluency in language spoken by your patient population
In‐Training Examination (ITE)
Residency program size
Having finished another fellowship
NRMP Program Director Survey, Specialties Matching Service, 2016 239

Pediatric Critical Care MedicinePercentage of Programs Citing Each Factor and Mean Importance Rating¹ for Each Factor in Ranking Applicants(N=24)
Figure-2
Average RatingPercent Citing Factor
¹ Ratings on a scale from 1 (not at all important) to 5 (very important).* International Medical Graduates only
1 2 3 4 5
4.84.94.14.74.44.64.44.34.24.34.63.44.54.33.74.34.13.83.84.43.84.14.03.94.13.94.03.34.03.84.24.63.74.33.63.83.33.73.73.83.03.74.15.03.84.0
100% 50% 0%
96%91%87%78%70%78%74%74%78%74%74%39%83%70%65%52%61%48%48%48%39%52%43%43%43%35%22%30%48%26%26%39%30%35%39%17%13%30%13%17%17%26%39%4%
17%30%
Interactions with faculty during interview and visitInterpersonal skills
Letters of recommendation in fellowship specialtyInteractions with house staff during interview and visit
Perceived commitment to specialtyFeedback from current residents and fellows
Perceived interest in programDemonstrated involvement and perceived interest in research
Reputation of residency programResidency performance evaluation (Program Director letter)
Evidence of professionalism and ethicsPersonal statement
Personal prior professional knowledge of the applicantLeadership qualities
Peer reviewed publications/authored textbook chaptersInterest in academic career
Applicant was a resident in a core program at same institutionUSMLE Step 1/COMLEX Level 1 score
USMLE Step 2 CK/COMLEX Level 2 CE scoreAny failed attempt in USMLE/COMLEX
Passing USMLE Step 2 CS/COMLEX Level 2 PEClinical/laboratory research experience
USMLE Step 3/COMLEX Level 3 scoreOral presentations/poster presentations/speaking engagements
Residency program setting (univ.‐based vs. comm.‐based)Alpha Omega Alpha (AOA) membership
Other life experienceMedical Student Performance Evaluation (MSPE/Dean's Letter)
Second interview/visitAwards or special honors in medical school
Visa status*Applicant was flagged with Match violation by the NRMP
Graduate of highly‐regarded medical schoolElectives at your fellowship site
Awarded grant money for researchVolunteer/extracurricular experiencesMedical school class ranking/quartile
Lack of gaps in medical educationGrades in medical school
Residency class ranking/quartileFluency in language spoken by your patient population
Gold Humanism Honor Society (GHHS) membershipResidency program size
In‐Training Examination (ITE)Second interview/visit
Having finished another fellowship
NRMP Program Director Survey, Specialties Matching Service, 2016 240

170
180
190
200
210
220
230
240
250
260
Pediatric Critical Care MedicinePrograms That Use USMLE Step 1 and Step 2 Clinical Knowledge (CK) Scores When Considering Which Applicants to Interview
Figure-3
Percentage of Programs That Use USMLE Step 2 (CK) Score
0%
10%
20%
30%
40%
50%
60%
70%
80%
90%
100%
Never Seldom Often
16%
64%
20%
Would your program consider applicants who fail theexam on the first attempt?
0%
10%
20%
30%
40%
50%
60%
70%
80%
90%
100%
Never Seldom often
16%
68%
16%
Would your program consider applicants who failthe exam on the first attempt?
0%
10%
20%
30%
40%
50%
60%
70%
80%
90%
100%
Yes, pass only Yes, target score No
76%
24%
0%
Scores required?
0%
10%
20%
30%
40%
50%
60%
70%
80%
90%
100%
Yes, pass only Yes, target score No
80%
20%
0%
Scores required?
N=25
N=25
N=25N=25
N=6 N=5
IQR* of Average USMLE Step 1 and Step 2 CK Scores Programs Consider When Granting Interviews
Percentage of Programs That Use USMLE Step 1 Score
170
180
190
200
210
220
230
240
250
260
USMLE Step 1 USMLE Step 1
*The boxes in the boxplots represent the interquartile range (or IQR, which is the range between the 25th and 75th percentiles), and the line in the box is the median. The x-shaped symbol is the mean.
Scores Above Which Programs Almost Always Grant Interviews
Scores Below Which Programs Generally Do Not Grant Interviews
USMLE Step 2 CK not reported
because of low response rate
USMLE Step 2 CK not reported
because of low response rate
NRMP Program Director Survey, Specialties Matching Service, 2016 241

0%
10%
20%
30%
40%
50%
60%
70%
80%
90%
100%
Yes No
100%
0%
USMLE Step 2 CS
0%
10%
20%
30%
40%
50%
60%
70%
80%
90%
100%
Yes, pass only Yes, target score No
72%
20%
8%
USMLE Step 3
0%
10%
20%
30%
40%
50%
60%
70%
80%
90%
100%
Yes, pass only Yes, target score No
65%
15%20%
COMLEX-USA Level 1*
Pediatric Critical Care MedicinePercentage of Programs That Use USMLE Step 2 Clinical Skill (CS), Step 3, and COMLEX-USA Scores* When Considering Which Applicants to Interview
Figure-4
0%
10%
20%
30%
40%
50%
60%
70%
80%
90%
100%
Yes, pass only Yes, target score No
65%
15%20%
COMLEX-USA Level 2-CE*
0%
10%
20%
30%
40%
50%
60%
70%
80%
90%
100%
Yes, pass only Yes, target score No
67%
11%
22%
COMLEX-USA Level 3*
0%
10%
20%
30%
40%
50%
60%
70%
80%
90%
100%
Yes, pass only Yes, target score No
70%
10%
20%
COMLEX-USA Level 2-PE*
N=25 N=25
N=20 N=20
N=20 N=18
* Osteopathic applicants only
Percentage of Programs That Use USMLE Step 2 CS and Step 3 Scores
Percentage of Programs That Use COMLEX-USA Level 1 and Level 2-CE Scores
Percentage of Programs That Use COMLEX-USA Level 2-PE and Level 3 Scores
NRMP Program Director Survey, Specialties Matching Service, 2016 242

0%10%20%30%40%50%60%70%80%90%
100%
Never Seldom Often
25%
75%
0%
Would your program consider applicants who fail theexam on the first attempt?
0%
10%
20%
30%
40%
50%
60%
70%
80%
90%
100%
Yes, pass only Yes, target score No, not required
27%
0%
73%
Scores required?
N=4
N=11
8.6%Optional
91.4%Required
Program Requirement on Dedicated Time forResearch
N=35
0
4
8
12
16
20
Accredited Locally Funded Integrated Other
16
19
1716
Average Number of Months if Research Time isRequired
N=17 N=4 N=2 N=5
0
1
2
3
4
5
6
7
Accredited Positions Funded Positions
6.35.8
Average Number of Accredited Positions and Funded Positions
0%
10%
20%
30%
40%
50%
60%
70%
80%
90%
100%
Positions Filled BeforeMatch Day
Positions Offered Outsidethe Match
Positions Filled Outsidethe Match
98%
43%
63%
Average Percentage of Accredited Positions Offered Outside ofthe Match
N=32 N=26 N=5 N=3 N=2
Pediatric Critical Care MedicinePrograms That Use Core Specialty Certifying Examination When Considering Applicants for Interview
Figure-5
Pediatric Critical Care MedicinePrograms Positions Figure-6
Pediatric Critical Care MedicineDedicated Time for Research Figure-7
NRMP Program Director Survey, Specialties Matching Service, 2016 243

0%
10%
20%
30%
40%
50%
60%
70%
80%
90%
100%100%
93%
63%
33%
78%
56%
U.S. Graduate OsteopathicPhysician
Canadian Fifth Pathway U.S. IMG Non-U.S. IMG
Percentage of Programs that Typically Interview and Rank Each Applicant Type
Figure-8Pediatric Critical Care MedicineProgram's Interview Activities
0%10%20%30%40%50%60%70%80%90%
100%
Rejected based on astandardized screening
process
In-depth review
29%
65%
Average Percentage of Applicants Rejected and Reviewed
0
10
20
30
40
50
60
70
Number of applicationsreceived
Number of interviewinvitations sent
Number of applicantsinterviewed
62
2724
Average Number of Positions, Applications Received, InterviewInvitations Sent, and Applicants Interviewed and Ranked
N=29N=29N=29N=29
N=27
26% of Pediatric Critical Care Medicine programs consider all applicant groups
N=29
0%10%20%30%40%50%60%70%80%90%
100%
Prev. Grad Osteo Pathway Canadian US IMG Non-USIMG
67%
12%22%
4%
26%
25%
60%
63%
56%96%
74%
8%28%
37%22%
Often Seldom Never
Interview
0%10%
20%
30%40%
50%60%
70%80%
90%100%
Prev. Grad Osteo Pathway Canadian US IMG Non-USIMG
4%
75%
16%7%
30%33%
17%
56%
52%
48%96%
67%
8%28%
41%22%
Often Seldom Never
Ranking
n=27
Frequency of Programs Interviewing and Ranking Candidates
n=27
N=25
0%10%20%30%40%50%60%70%80%90%
100%
Jan Feb Mar Apr May Jun Jul Aug Sep Oct Nov Dec
0% 0% 4% 0% 0% 0%
21%
51%
16%9%
1% 0%
Interview invitations
Interview Invitations Sent and Interviews Conducted
0% 0% 4% 0% 0% 0% 1%12%
35% 37%
8%0%
Interviews conducted
NRMP Program Director Survey, Specialties Matching Service, 2016 244

Figure-9Pediatric Critical Care MedicinePotential Challenges in Recruiting Applicants to Your Specialty
0% 10% 20% 30% 40% 50% 60% 70% 80%
71%
10%
24%
0%
0%
We consider those applicants on an individual basis
We give those applicants serious consideration if they haveshown improvement
We do not usually consider those applicants
We favor those applicants
Other
0 1 2 3 4 5
Not enough applicants in the specialty
Undesirable income potential as a practicing physician
Undesirable work/life balance as a practicing physician
Long or irregular work hours required by specialty
Fellowship Match scheduled at inconvenient time of year
2.2
1.9
4.0
3.7
2.0
Average rating on a scale of 5 (1=least challenging; 5=most challenging)
n=22
26.9%Less than 3
34.6%3 to 5
11.5%6 to 10
19.2%11 to 15
7.7%More than
15
At Any Fellowship Program
38.5%Less than 3
34.6%3 to 5
15.4%6 to 10
3.8%11 to 157.7%
More than15
At Current Fellowship Program
n=21
n=26 n=26
Pediatric Critical Care MedicineApplicants Who Applied in the Specialty in the Past But Did Not Match Figure-10
Pediatric Critical Care MedicineYears as Program Director Figure-11
NRMP Program Director Survey, Specialties Matching Service, 2016 245

Pediatric Emergency Medicine
NRMP Program Director Survey, Specialties Matching Service, 2016 246
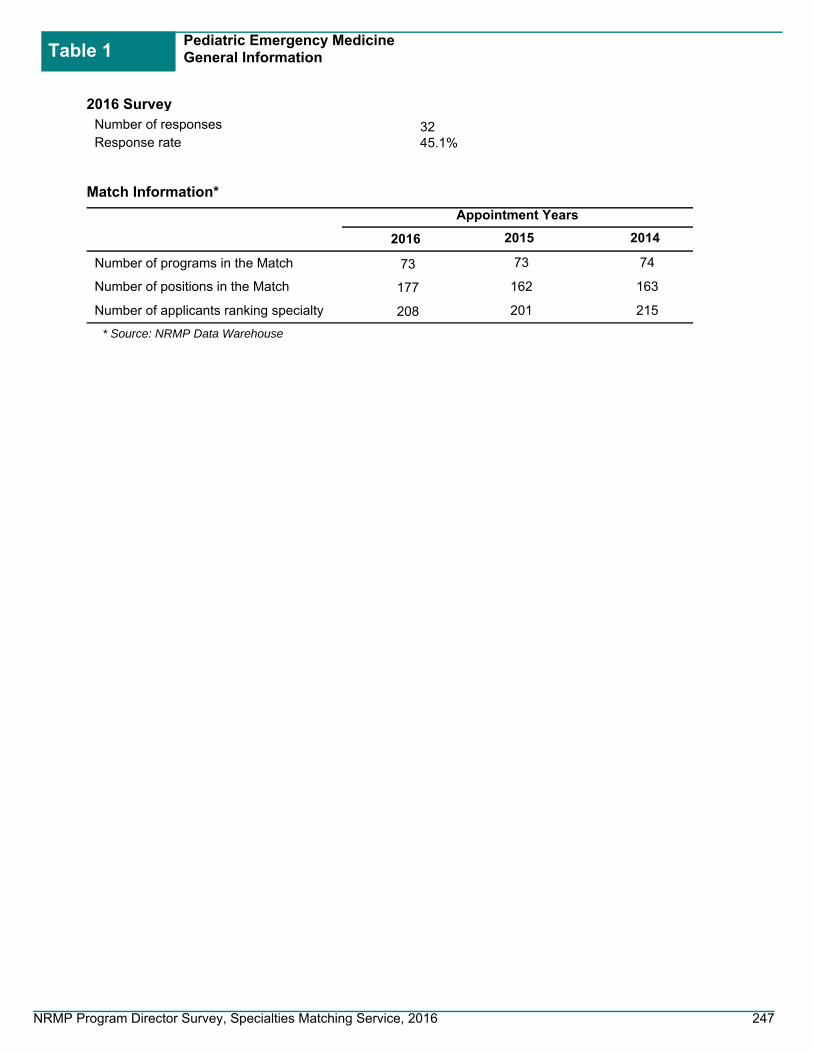
Pediatric Emergency MedicineGeneral Information
Table 1
73
177
208
Number of programs in the Match
Number of positions in the Match
Number of applicants ranking specialty
45.1%Response rate
Appointment Years
Number of responses 32
Match Information*
* Source: NRMP Data Warehouse
2016 Survey
2016 2015 2014
73
162
201
74
163
215
NRMP Program Director Survey, Specialties Matching Service, 2016 247

Figure-1Pediatric Emergency MedicinePercentage of Programs Citing Each Factor and Mean Importance Rating¹ for Each Factor in Selecting Applicants to Interview(N=27)
Average RatingPercent Citing Factor
¹ Ratings on a scale from 1 (not at all important) to 5 (very important).* International Medical Graduates only
1 2 3 4 5
4.54.44.13.84.43.54.34.63.83.53.74.04.03.54.03.64.43.74.03.73.73.13.03.42.83.14.23.72.92.93.13.24.33.42.73.63.34.03.62.0
100% 50% 0%
96%96%89%93%93%89%85%78%78%70%81%78%81%74%78%67%89%67%74%59%48%56%63%78%48%56%70%52%44%37%48%41%37%30%33%19%15%
7%33%19%
Letters of recommendation in fellowship specialty
Residency performance evaluation (Program Director letter)
Reputation of residency program
Demonstrated involvement and perceived interest in research
Perceived commitment to specialty
Personal statement
Perceived interest in program
Evidence of professionalism and ethics
USMLE Step 1/COMLEX Level 1 score
Peer reviewed publications/authored textbook chapters
USMLE Step 2 CK/COMLEX Level 2 CE score
Leadership qualities
Personal prior professional knowledge of the applicant
Oral presentations/poster presentations/speaking engagements
Applicant was a resident in a core program at same institution
Pass USMLE Step 2 CS/COMLEX Level 2 PE
Any failed attempt in USMLE/COMLEX
USMLE Step 3/COMLEX Level 3 score
Interest in academic career
Residency program setting (univ.‐based vs. comm.‐based)
Clinical/laboratory research experience
Awards or special honors in medical school
Alpha Omega Alpha (AOA) membership
Other life experience
Medical Student Performance Evaluation (MSPE/Dean's Letter)
Graduate of highly‐regarded medical school
Visa status*
Volunteer/extracurricular experiences
Awarded grant money for research
Grades in medical school
Lack of gaps in medical education
Medical school class ranking/quartile
Applicant was flagged with Match violation by the NRMP
Electives at your fellowship site
Gold Humanism Honor Society (GHHS) membership
Residency class ranking/quartile
Fluency in language spoken by your patient population
In‐Training Examination (ITE)
Residency program size
Having finished another fellowship
NRMP Program Director Survey, Specialties Matching Service, 2016 248

Pediatric Emergency MedicinePercentage of Programs Citing Each Factor and Mean Importance Rating¹ for Each Factor in Ranking Applicants(N=27)
Figure-2
Average RatingPercent Citing Factor
¹ Ratings on a scale from 1 (not at all important) to 5 (very important).* International Medical Graduates only
1 2 3 4 5
5.05.04.34.94.84.84.64.04.04.54.73.74.34.33.44.13.83.63.53.83.63.83.53.43.82.73.83.24.03.54.54.33.73.73.23.93.23.43.04.02.02.84.03.04.32.0
100% 50% 0%
96%92%88%85%77%73%81%73%73%50%50%54%62%65%46%69%58%62%58%62%46%35%50%38%31%27%50%23%42%31%38%23%23%23%19%42%19%19%12%19%8%
15%23%8%
12%8%
Interactions with faculty during interview and visitInterpersonal skills
Letters of recommendation in fellowship specialtyInteractions with house staff during interview and visit
Perceived commitment to specialtyFeedback from current residents and fellows
Perceived interest in programDemonstrated involvement and perceived interest in research
Reputation of residency programResidency performance evaluation (Program Director letter)
Evidence of professionalism and ethicsPersonal statement
Personal prior professional knowledge of the applicantLeadership qualities
Peer reviewed publications/authored textbook chaptersInterest in academic career
Applicant was a resident in a core program at same institutionUSMLE Step 1/COMLEX Level 1 score
USMLE Step 2 CK/COMLEX Level 2 CE scoreAny failed attempt in USMLE/COMLEX
Passing USMLE Step 2 CS/COMLEX Level 2 PEClinical/laboratory research experience
USMLE Step 3/COMLEX Level 3 scoreOral presentations/poster presentations/speaking engagements
Residency program setting (univ.‐based vs. comm.‐based)Alpha Omega Alpha (AOA) membership
Other life experienceMedical Student Performance Evaluation (MSPE/Dean's Letter)
Second interview/visitAwards or special honors in medical school
Visa status*Applicant was flagged with Match violation by the NRMP
Graduate of highly‐regarded medical schoolElectives at your fellowship site
Awarded grant money for researchVolunteer/extracurricular experiencesMedical school class ranking/quartile
Lack of gaps in medical educationGrades in medical school
Residency class ranking/quartileFluency in language spoken by your patient population
Gold Humanism Honor Society (GHHS) membershipResidency program size
In‐Training Examination (ITE)Second interview/visit
Having finished another fellowship
NRMP Program Director Survey, Specialties Matching Service, 2016 249

Pediatric Emergency MedicinePrograms That Use USMLE Step 1 and Step 2 Clinical Knowledge (CK) Scores When Considering Which Applicants to Interview
Figure-3
Percentage of Programs That Use USMLE Step 2 (CK) Score
0%
10%
20%
30%
40%
50%
60%
70%
80%
90%
100%
Never Seldom Often
4%
78%
19%
Would your program consider applicants who fail theexam on the first attempt?
0%
10%
20%
30%
40%
50%
60%
70%
80%
90%
100%
Never Seldom often
4%
93%
4%
Would your program consider applicants who failthe exam on the first attempt?
0%
10%
20%
30%
40%
50%
60%
70%
80%
90%
100%
Yes, pass only Yes, target score No
73%
23%
4%
Scores required?
0%
10%
20%
30%
40%
50%
60%
70%
80%
90%
100%
Yes, pass only Yes, target score No
73%
23%
4%
Scores required?
N=26
N=27
N=26N=27
N=6N=6
IQR* of Average USMLE Step 1 and Step 2 CK Scores Programs Consider When Granting Interviews
Percentage of Programs That Use USMLE Step 1 Score
170
180
190
200
210
220
230
240
250
260
USMLE Step 2 CKUSMLE Step 1
*The boxes in the boxplots represent the interquartile range (or IQR, which is the range between the 25th and 75th percentiles), and the line in the box is the median. The x-shaped symbol is the mean.
Scores Above Which Programs Almost Always Grant Interviews
Scores Below Which Programs Generally Do Not Grant Interviews
USMLE Step 1 not reported because of low response
rate
USMLE Step 2 CK not reported
because of low response rate
NRMP Program Director Survey, Specialties Matching Service, 2016 250

0%
10%
20%
30%
40%
50%
60%
70%
80%
90%
100%
Yes No
96%
4%
USMLE Step 2 CS
0%
10%
20%
30%
40%
50%
60%
70%
80%
90%
100%
Yes, pass only Yes, target score No
65%
19%15%
USMLE Step 3
0%
10%
20%
30%
40%
50%
60%
70%
80%
90%
100%
Yes, pass only Yes, target score No
70%
22%
9%
COMLEX-USA Level 1*
Pediatric Emergency MedicinePercentage of Programs That Use USMLE Step 2 Clinical Skill (CS), Step 3, and COMLEX-USA Scores* When Considering Which Applicants to Interview
Figure-4
0%
10%
20%
30%
40%
50%
60%
70%
80%
90%
100%
Yes, pass only Yes, target score No
70%
22%
9%
COMLEX-USA Level 2-CE*
0%
10%
20%
30%
40%
50%
60%
70%
80%
90%
100%
Yes, pass only Yes, target score No
59%
23%18%
COMLEX-USA Level 3*
0%
10%
20%
30%
40%
50%
60%
70%
80%
90%
100%
Yes, pass only Yes, target score No
70%
22%
9%
COMLEX-USA Level 2-PE*
N=26 N=26
N=23 N=23
N=23 N=22
* Osteopathic applicants only
Percentage of Programs That Use USMLE Step 2 CS and Step 3 Scores
Percentage of Programs That Use COMLEX-USA Level 1 and Level 2-CE Scores
Percentage of Programs That Use COMLEX-USA Level 2-PE and Level 3 Scores
NRMP Program Director Survey, Specialties Matching Service, 2016 251

0%10%20%30%40%50%60%70%80%90%
100%
Never Seldom Often
30%
70%
0%
Would your program consider applicants who fail theexam on the first attempt?
0%
10%
20%
30%
40%
50%
60%
70%
80%
90%
100%
Yes, pass only Yes, target score No, not required
33%
0%
67%
Scores required?
N=10
N=18
21.9%Optional
78.1%Required
Program Requirement on Dedicated Time forResearch
N=32
0
2
4
6
8
10
12
Accredited Locally Funded Integrated Other
1112 12
5
Average Number of Months if Research Time isRequired
N=16 N=3 N=2 N=5
0
1
2
3
4
5
Accredited Positions Funded Positions
4.84.5
Average Number of Accredited Positions and Funded Positions
0%
10%
20%
30%
40%
50%
60%
70%
80%
90%
100%
Positions Filled BeforeMatch Day
Positions Offered Outsidethe Match
Positions Filled Outsidethe Match
54%
18% 18%
Average Percentage of Accredited Positions Offered Outside ofthe Match
N=31 N=27 N=4 N=4 N=4
Pediatric Emergency MedicinePrograms That Use Core Specialty Certifying Examination When Considering Applicants for Interview
Figure-5
Pediatric Emergency MedicinePrograms Positions Figure-6
Pediatric Emergency MedicineDedicated Time for Research Figure-7
NRMP Program Director Survey, Specialties Matching Service, 2016 252
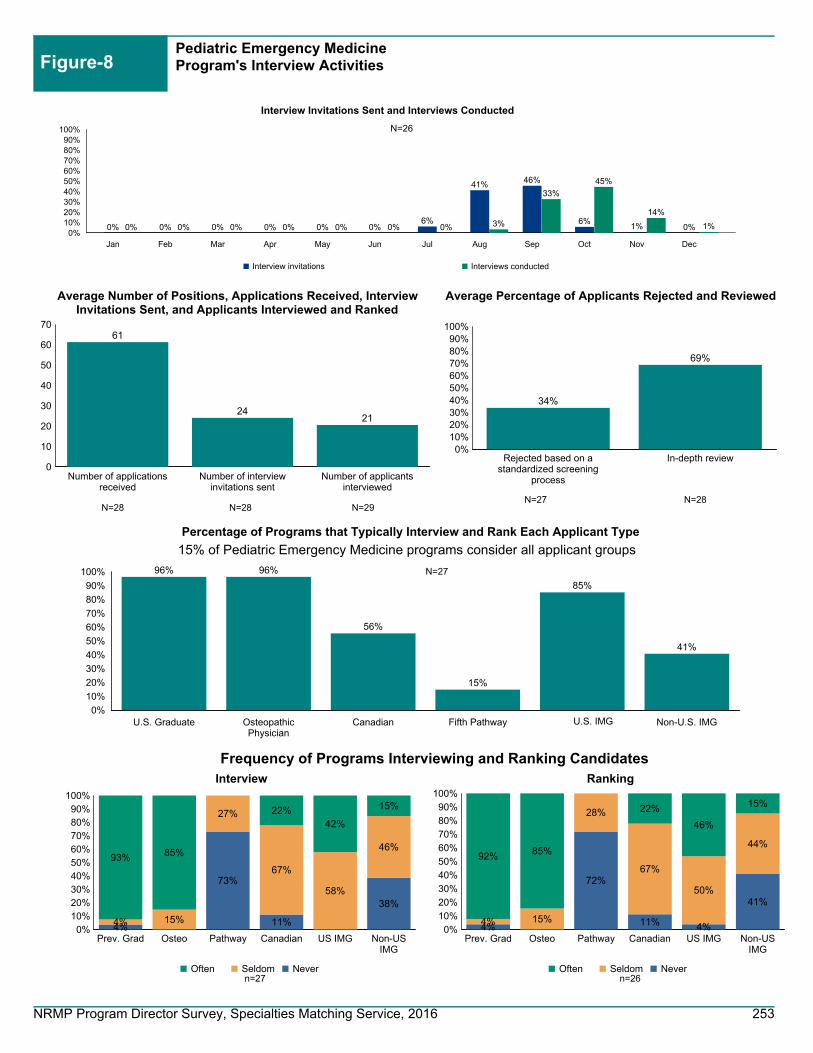
0%
10%
20%
30%
40%
50%
60%
70%
80%
90%
100% 96% 96%
56%
15%
85%
41%
U.S. Graduate OsteopathicPhysician
Canadian Fifth Pathway U.S. IMG Non-U.S. IMG
Percentage of Programs that Typically Interview and Rank Each Applicant Type
Figure-8Pediatric Emergency MedicineProgram's Interview Activities
0%10%20%30%40%50%60%70%80%90%
100%
Rejected based on astandardized screening
process
In-depth review
34%
69%
Average Percentage of Applicants Rejected and Reviewed
0
10
20
30
40
50
60
70
Number of applicationsreceived
Number of interviewinvitations sent
Number of applicantsinterviewed
61
2421
Average Number of Positions, Applications Received, InterviewInvitations Sent, and Applicants Interviewed and Ranked
N=28N=27N=29N=28
N=27
15% of Pediatric Emergency Medicine programs consider all applicant groups
N=28
0%10%20%30%40%50%60%70%80%90%
100%
Prev. Grad Osteo Pathway Canadian US IMG Non-USIMG
4%
73%
11%
38%
4% 15%
27%
67%
58%
46%93% 85%
22%42%
15%
Often Seldom Never
Interview
0%10%
20%
30%40%
50%60%
70%80%
90%100%
Prev. Grad Osteo Pathway Canadian US IMG Non-USIMG
4%
72%
11% 4%
41%
4% 15%
28%
67%
50%
44%92% 85%
22%
46%
15%
Often Seldom Never
Ranking
n=26
Frequency of Programs Interviewing and Ranking Candidates
n=27
N=26
0%10%20%30%40%50%60%70%80%90%
100%
Jan Feb Mar Apr May Jun Jul Aug Sep Oct Nov Dec
0% 0% 0% 0% 0% 0%6%
41% 46%
6%1% 0%
Interview invitations
Interview Invitations Sent and Interviews Conducted
0% 0% 0% 0% 0% 0% 0% 3%
33%
45%
14%
1%
Interviews conducted
NRMP Program Director Survey, Specialties Matching Service, 2016 253

Figure-9Pediatric Emergency MedicinePotential Challenges in Recruiting Applicants to Your Specialty
0% 20% 40% 60% 80% 100%
88%
33%
8%
0%
0%
We consider those applicants on an individual basis
We give those applicants serious consideration if they haveshown improvement
We do not usually consider those applicants
We favor those applicants
Other
0 1 2 3 4 5
Not enough applicants in the specialty
Undesirable income potential as a practicing physician
Undesirable work/life balance as a practicing physician
Long or irregular work hours required by specialty
Fellowship Match scheduled at inconvenient time of year
1.7
1.6
2.0
2.0
1.5
Average rating on a scale of 5 (1=least challenging; 5=most challenging)
n=25
17.9%Less than 3
32.1%3 to 5
21.4%6 to 10
14.3%11 to 15
14.3%More than
15
At Any Fellowship Program
20.0%Less than 3
28.0%3 to 5
24.0%6 to 10
12.0%11 to 15
16.0%More than 15
At Current Fellowship Program
n=24
n=28 n=25
Pediatric Emergency MedicineApplicants Who Applied in the Specialty in the Past But Did Not Match Figure-10
Pediatric Emergency MedicineYears as Program Director Figure-11
NRMP Program Director Survey, Specialties Matching Service, 2016 254

Pediatric Endocrinology
NRMP Program Director Survey, Specialties Matching Service, 2016 255

Pediatric EndocrinologyGeneral Information
Table 1
55
83
56
Number of programs in the Match
Number of positions in the Match
Number of applicants ranking specialty
41.8%Response rate
Appointment Years
Number of responses 23
Match Information*
* Source: NRMP Data Warehouse
2016 Survey
2016 2015 2014
57
85
75
60
84
71
NRMP Program Director Survey, Specialties Matching Service, 2016 256

Figure-1Pediatric EndocrinologyPercentage of Programs Citing Each Factor and Mean Importance Rating¹ for Each Factor in Selecting Applicants to Interview(N=19)
Average RatingPercent Citing Factor
¹ Ratings on a scale from 1 (not at all important) to 5 (very important).* International Medical Graduates only
1 2 3 4 5
4.44.73.84.04.43.84.24.43.53.53.84.04.23.74.13.64.63.44.13.63.63.63.83.23.93.74.03.43.73.43.53.24.43.83.33.74.04.03.5
100% 50% 0%
95%89%95%95%95%89%95%74%74%63%68%68%68%63%68%63%53%63%79%63%58%53%32%53%47%42%68%58%32%42%32%53%37%37%16%16%32%11%11%
0%
Letters of recommendation in fellowship specialty
Residency performance evaluation (Program Director letter)
Reputation of residency program
Demonstrated involvement and perceived interest in research
Perceived commitment to specialty
Personal statement
Perceived interest in program
Evidence of professionalism and ethics
USMLE Step 1/COMLEX Level 1 score
Peer reviewed publications/authored textbook chapters
USMLE Step 2 CK/COMLEX Level 2 CE score
Leadership qualities
Personal prior professional knowledge of the applicant
Oral presentations/poster presentations/speaking engagements
Applicant was a resident in a core program at same institution
Pass USMLE Step 2 CS/COMLEX Level 2 PE
Any failed attempt in USMLE/COMLEX
USMLE Step 3/COMLEX Level 3 score
Interest in academic career
Residency program setting (univ.‐based vs. comm.‐based)
Clinical/laboratory research experience
Awards or special honors in medical school
Alpha Omega Alpha (AOA) membership
Other life experience
Medical Student Performance Evaluation (MSPE/Dean's Letter)
Graduate of highly‐regarded medical school
Visa status*
Volunteer/extracurricular experiences
Awarded grant money for research
Grades in medical school
Lack of gaps in medical education
Medical school class ranking/quartile
Applicant was flagged with Match violation by the NRMP
Electives at your fellowship site
Gold Humanism Honor Society (GHHS) membership
Residency class ranking/quartile
Fluency in language spoken by your patient population
In‐Training Examination (ITE)
Residency program size
Having finished another fellowship
NRMP Program Director Survey, Specialties Matching Service, 2016 257
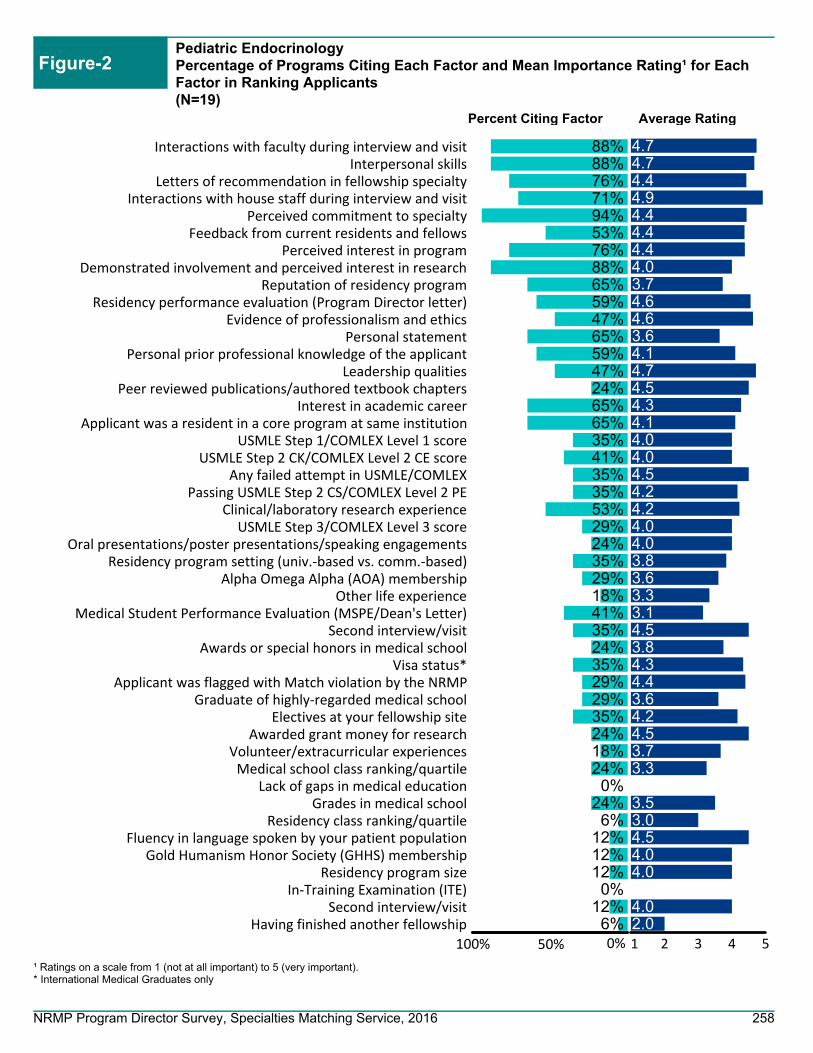
Pediatric EndocrinologyPercentage of Programs Citing Each Factor and Mean Importance Rating¹ for Each Factor in Ranking Applicants(N=19)
Figure-2
Average RatingPercent Citing Factor
¹ Ratings on a scale from 1 (not at all important) to 5 (very important).* International Medical Graduates only
1 2 3 4 5
4.74.74.44.94.44.44.44.03.74.64.63.64.14.74.54.34.14.04.04.54.24.24.04.03.83.63.33.14.53.84.34.43.64.24.53.73.3
3.53.04.54.04.0
4.02.0
100% 50% 0%
88%88%76%71%94%53%76%88%65%59%47%65%59%47%24%65%65%35%41%35%35%53%29%24%35%29%18%41%35%24%35%29%29%35%24%18%24%0%
24%6%
12%12%12%0%
12%6%
Interactions with faculty during interview and visitInterpersonal skills
Letters of recommendation in fellowship specialtyInteractions with house staff during interview and visit
Perceived commitment to specialtyFeedback from current residents and fellows
Perceived interest in programDemonstrated involvement and perceived interest in research
Reputation of residency programResidency performance evaluation (Program Director letter)
Evidence of professionalism and ethicsPersonal statement
Personal prior professional knowledge of the applicantLeadership qualities
Peer reviewed publications/authored textbook chaptersInterest in academic career
Applicant was a resident in a core program at same institutionUSMLE Step 1/COMLEX Level 1 score
USMLE Step 2 CK/COMLEX Level 2 CE scoreAny failed attempt in USMLE/COMLEX
Passing USMLE Step 2 CS/COMLEX Level 2 PEClinical/laboratory research experience
USMLE Step 3/COMLEX Level 3 scoreOral presentations/poster presentations/speaking engagements
Residency program setting (univ.‐based vs. comm.‐based)Alpha Omega Alpha (AOA) membership
Other life experienceMedical Student Performance Evaluation (MSPE/Dean's Letter)
Second interview/visitAwards or special honors in medical school
Visa status*Applicant was flagged with Match violation by the NRMP
Graduate of highly‐regarded medical schoolElectives at your fellowship site
Awarded grant money for researchVolunteer/extracurricular experiencesMedical school class ranking/quartile
Lack of gaps in medical educationGrades in medical school
Residency class ranking/quartileFluency in language spoken by your patient population
Gold Humanism Honor Society (GHHS) membershipResidency program size
In‐Training Examination (ITE)Second interview/visit
Having finished another fellowship
NRMP Program Director Survey, Specialties Matching Service, 2016 258

Pediatric EndocrinologyPrograms That Use USMLE Step 1 and Step 2 Clinical Knowledge (CK) Scores When Considering Which Applicants to Interview
Figure-3
Percentage of Programs That Use USMLE Step 2 (CK) Score
0%
10%
20%
30%
40%
50%
60%
70%
80%
90%
100%
Never Seldom Often
11%
84%
5%
Would your program consider applicants who fail theexam on the first attempt?
0%
10%
20%
30%
40%
50%
60%
70%
80%
90%
100%
Never Seldom often
21%
74%
5%
Would your program consider applicants who failthe exam on the first attempt?
0%
10%
20%
30%
40%
50%
60%
70%
80%
90%
100%
Yes, pass only Yes, target score No
85%
15%
0%
Scores required?
0%
10%
20%
30%
40%
50%
60%
70%
80%
90%
100%
Yes, pass only Yes, target score No
80%
15%
5%
Scores required?
N=20
N=19
N=20N=19
IQR* of Average USMLE Step 1 and Step 2 CK Scores Programs Consider When Granting Interviews
Percentage of Programs That Use USMLE Step 1 Score
*The boxes in the boxplots represent the interquartile range (or IQR, which is the range between the 25th and 75th percentiles), and the line in the box is the median. The x-shaped symbol is the mean.
Scores Above Which Programs Almost Always Grant Interviews
Scores Below Which Programs Generally Do Not Grant Interviews
USMLE Step 2 CK not reported
because of low response rate
USMLE Step 1 not reported because of low response
rate
USMLE Step 2 CK not reported
because of low response rate
USMLE Step 1 not reported because of low response
rate
NRMP Program Director Survey, Specialties Matching Service, 2016 259
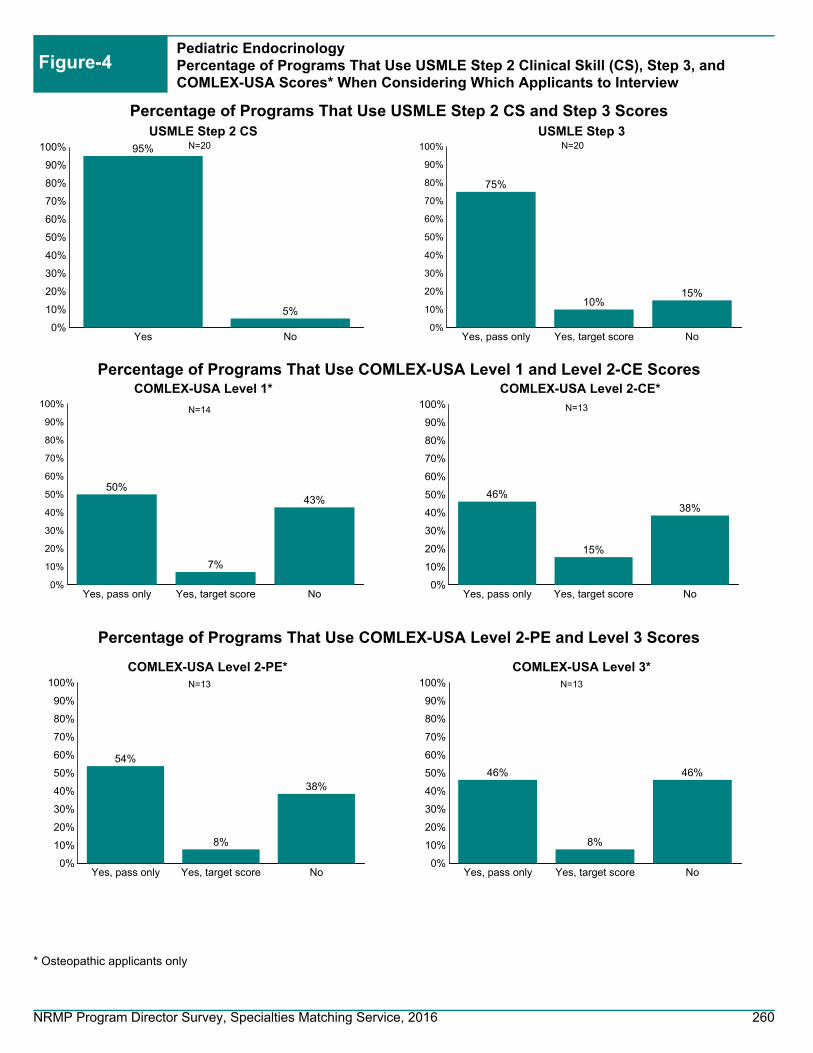
0%
10%
20%
30%
40%
50%
60%
70%
80%
90%
100%
Yes No
95%
5%
USMLE Step 2 CS
0%
10%
20%
30%
40%
50%
60%
70%
80%
90%
100%
Yes, pass only Yes, target score No
75%
10%15%
USMLE Step 3
0%
10%
20%
30%
40%
50%
60%
70%
80%
90%
100%
Yes, pass only Yes, target score No
50%
7%
43%
COMLEX-USA Level 1*
Pediatric EndocrinologyPercentage of Programs That Use USMLE Step 2 Clinical Skill (CS), Step 3, and COMLEX-USA Scores* When Considering Which Applicants to Interview
Figure-4
0%
10%
20%
30%
40%
50%
60%
70%
80%
90%
100%
Yes, pass only Yes, target score No
46%
15%
38%
COMLEX-USA Level 2-CE*
0%
10%
20%
30%
40%
50%
60%
70%
80%
90%
100%
Yes, pass only Yes, target score No
46%
8%
46%
COMLEX-USA Level 3*
0%
10%
20%
30%
40%
50%
60%
70%
80%
90%
100%
Yes, pass only Yes, target score No
54%
8%
38%
COMLEX-USA Level 2-PE*
N=20 N=20
N=14 N=13
N=13 N=13
* Osteopathic applicants only
Percentage of Programs That Use USMLE Step 2 CS and Step 3 Scores
Percentage of Programs That Use COMLEX-USA Level 1 and Level 2-CE Scores
Percentage of Programs That Use COMLEX-USA Level 2-PE and Level 3 Scores
NRMP Program Director Survey, Specialties Matching Service, 2016 260

0%10%20%30%40%50%60%70%80%90%
100%
Never Seldom Often
14%
86%
0%
Would your program consider applicants who fail theexam on the first attempt?
0%
10%
20%
30%
40%
50%
60%
70%
80%
90%
100%
Yes, pass only Yes, target score No, not required
13%
0%
88%
Scores required?
N=7
N=8
4.3%Optional
95.7%Required
Program Requirement on Dedicated Time forResearch
N=23
0
4
8
12
16
20
24
Accredited Locally Funded Integrated Other
21
18
23
15
Average Number of Months if Research Time isRequired
N=10 N=6 N=3 N=2
0.0
0.5
1.0
1.5
2.0
2.5
3.0
3.5
Accredited Positions Funded Positions
3.1
2.6
Average Number of Accredited Positions and Funded Positions
0%
10%
20%
30%
40%
50%
60%
70%
80%
90%
100%
Positions Filled BeforeMatch Day
Positions Offered Outsidethe Match
Positions Filled Outsidethe Match
62%
51% 51%
Average Percentage of Accredited Positions Offered Outside ofthe Match
N=21 N=20 N=9 N=8 N=7
Pediatric EndocrinologyPrograms That Use Core Specialty Certifying Examination When Considering Applicants for Interview
Figure-5
Pediatric EndocrinologyPrograms Positions Figure-6
Pediatric EndocrinologyDedicated Time for Research Figure-7
NRMP Program Director Survey, Specialties Matching Service, 2016 261

0%
10%
20%
30%
40%
50%
60%
70%
80%
90%
100%100% 100%
60%
35%
95%
55%
U.S. Graduate OsteopathicPhysician
Canadian Fifth Pathway U.S. IMG Non-U.S. IMG
Percentage of Programs that Typically Interview and Rank Each Applicant Type
Figure-8Pediatric EndocrinologyProgram's Interview Activities
0%10%20%30%40%50%60%70%80%90%
100%
Rejected based on astandardized screening
process
In-depth review
38%
62%
Average Percentage of Applicants Rejected and Reviewed
0
4
8
12
16
20
24
Number of applicationsreceived
Number of interviewinvitations sent
Number of applicantsinterviewed
22
108
Average Number of Positions, Applications Received, InterviewInvitations Sent, and Applicants Interviewed and Ranked
N=17N=18N=18N=18
N=20
35% of Pediatric Endocrinology programs consider all applicant groups
N=18
0%10%20%30%40%50%60%70%80%90%
100%
Prev. Grad Osteo Pathway Canadian US IMG Non-USIMG
5%
75%
35%
5%
35%15%
50%
25%
40%
60%15%
80%
50%
25%35%
50%
Often Seldom Never
Interview
0%10%
20%
30%40%
50%60%
70%80%
90%100%
Prev. Grad Osteo Pathway Canadian US IMG Non-USIMG
5%
78%
37%
5%
40%15%
65%
22%
42%
65%15%
80%
35%21%
30%45%
Often Seldom Never
Ranking
n=20
Frequency of Programs Interviewing and Ranking Candidates
n=20
N=18
0%10%20%30%40%50%60%70%80%90%
100%
Jan Feb Mar Apr May Jun Jul Aug Sep Oct Nov Dec
5%0% 0% 0% 0% 1%
21%29% 26%
11%1% 6%
Interview invitations
Interview Invitations Sent and Interviews Conducted
5% 4% 2% 0% 0% 0%5% 4%
23% 27%
13%3%
Interviews conducted
NRMP Program Director Survey, Specialties Matching Service, 2016 262

Figure-9Pediatric EndocrinologyPotential Challenges in Recruiting Applicants to Your Specialty
0% 10% 20% 30% 40% 50% 60% 70% 80%
78%
22%
6%
0%
0%
We consider those applicants on an individual basis
We give those applicants serious consideration if they haveshown improvement
We do not usually consider those applicants
We favor those applicants
Other
0 1 2 3 4 5
Not enough applicants in the specialty
Undesirable income potential as a practicing physician
Undesirable work/life balance as a practicing physician
Long or irregular work hours required by specialty
Fellowship Match scheduled at inconvenient time of year
4.9
4.2
2.6
2.4
2.5
Average rating on a scale of 5 (1=least challenging; 5=most challenging)
n=16
25.0%Less than 3
25.0%3 to 5
25.0%6 to10
20.0%11 to 15
5.0%More than 15
At Any Fellowship Program
31.6%Less than 3
21.1%3 to 5
26.3%6 to 10
15.8%11 to 15
5.3%More than 15
At Current Fellowship Program
n=18
n=20 n=19
Pediatric EndocrinologyApplicants Who Applied in the Specialty in the Past But Did Not Match Figure-10
Pediatric EndocrinologyYears as Program Director Figure-11
NRMP Program Director Survey, Specialties Matching Service, 2016 263

Pediatric Gastroenterology
NRMP Program Director Survey, Specialties Matching Service, 2016 264

Pediatric GastroenterologyGeneral Information
Table 1
55
93
107
Number of programs in the Match
Number of positions in the Match
Number of applicants ranking specialty
42.6%Response rate
Appointment Years
Number of responses 23
Match Information*
* Source: NRMP Data Warehouse
2016 Survey
2016 2015 2014
51
85
117
52
84
97
NRMP Program Director Survey, Specialties Matching Service, 2016 265
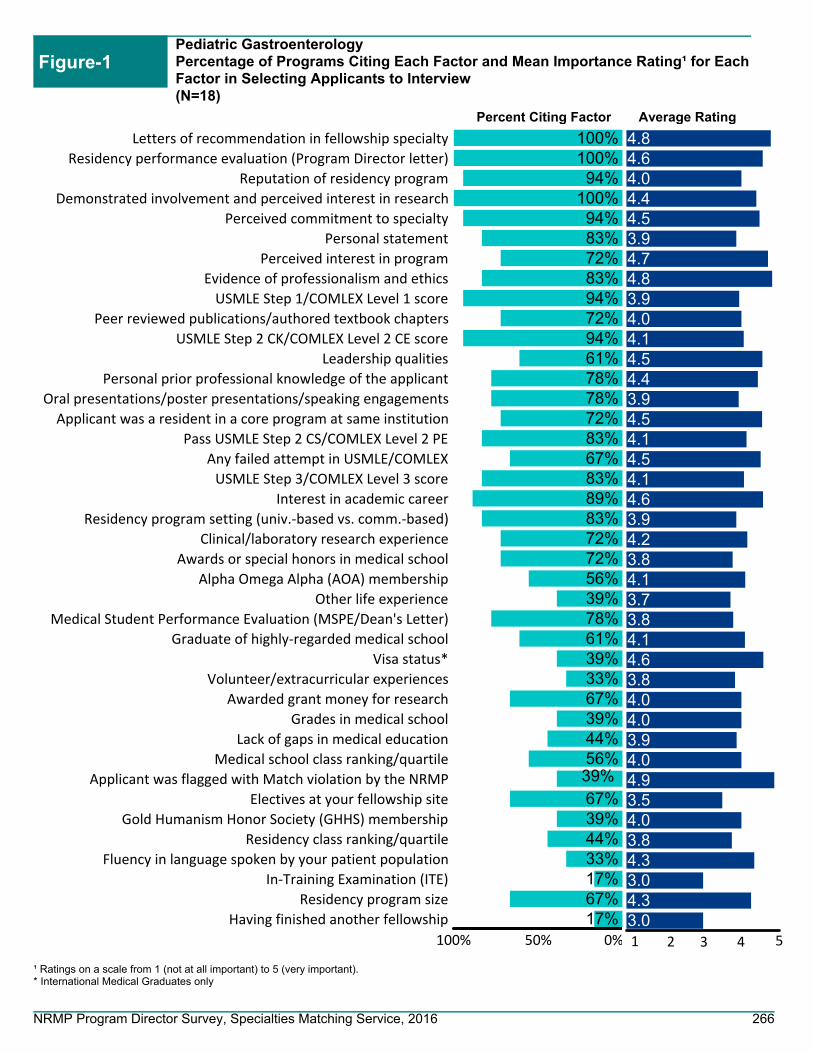
Figure-1Pediatric GastroenterologyPercentage of Programs Citing Each Factor and Mean Importance Rating¹ for Each Factor in Selecting Applicants to Interview(N=18)
Average RatingPercent Citing Factor
¹ Ratings on a scale from 1 (not at all important) to 5 (very important).* International Medical Graduates only
1 2 3 4 5
4.84.64.04.44.53.94.74.83.94.04.14.54.43.94.54.14.54.14.63.94.23.84.13.73.84.14.63.84.04.03.94.04.93.54.03.84.33.04.33.0
100% 50% 0%
100%100%
94%100%
94%83%72%83%94%72%94%61%78%78%72%83%67%83%89%83%72%72%56%39%78%61%39%33%67%39%44%56%39%67%39%44%33%17%67%17%
Letters of recommendation in fellowship specialty
Residency performance evaluation (Program Director letter)
Reputation of residency program
Demonstrated involvement and perceived interest in research
Perceived commitment to specialty
Personal statement
Perceived interest in program
Evidence of professionalism and ethics
USMLE Step 1/COMLEX Level 1 score
Peer reviewed publications/authored textbook chapters
USMLE Step 2 CK/COMLEX Level 2 CE score
Leadership qualities
Personal prior professional knowledge of the applicant
Oral presentations/poster presentations/speaking engagements
Applicant was a resident in a core program at same institution
Pass USMLE Step 2 CS/COMLEX Level 2 PE
Any failed attempt in USMLE/COMLEX
USMLE Step 3/COMLEX Level 3 score
Interest in academic career
Residency program setting (univ.‐based vs. comm.‐based)
Clinical/laboratory research experience
Awards or special honors in medical school
Alpha Omega Alpha (AOA) membership
Other life experience
Medical Student Performance Evaluation (MSPE/Dean's Letter)
Graduate of highly‐regarded medical school
Visa status*
Volunteer/extracurricular experiences
Awarded grant money for research
Grades in medical school
Lack of gaps in medical education
Medical school class ranking/quartile
Applicant was flagged with Match violation by the NRMP
Electives at your fellowship site
Gold Humanism Honor Society (GHHS) membership
Residency class ranking/quartile
Fluency in language spoken by your patient population
In‐Training Examination (ITE)
Residency program size
Having finished another fellowship
NRMP Program Director Survey, Specialties Matching Service, 2016 266

Pediatric GastroenterologyPercentage of Programs Citing Each Factor and Mean Importance Rating¹ for Each Factor in Ranking Applicants(N=18)
Figure-2
Average RatingPercent Citing Factor
¹ Ratings on a scale from 1 (not at all important) to 5 (very important).* International Medical Graduates only
1 2 3 4 5
4.94.84.74.84.84.84.84.54.44.74.84.14.64.94.44.74.64.24.34.74.24.44.14.34.54.34.04.34.54.14.64.84.04.14.34.04.44.54.23.84.74.04.14.05.04.0
100% 50% 0%
94%94%94%81%75%69%88%88%88%81%81%63%56%56%50%81%69%69%63%56%63%69%50%44%63%38%19%44%13%56%44%38%50%69%50%13%31%13%38%38%19%19%44%6%6%6%
Interactions with faculty during interview and visitInterpersonal skills
Letters of recommendation in fellowship specialtyInteractions with house staff during interview and visit
Perceived commitment to specialtyFeedback from current residents and fellows
Perceived interest in programDemonstrated involvement and perceived interest in research
Reputation of residency programResidency performance evaluation (Program Director letter)
Evidence of professionalism and ethicsPersonal statement
Personal prior professional knowledge of the applicantLeadership qualities
Peer reviewed publications/authored textbook chaptersInterest in academic career
Applicant was a resident in a core program at same institutionUSMLE Step 1/COMLEX Level 1 score
USMLE Step 2 CK/COMLEX Level 2 CE scoreAny failed attempt in USMLE/COMLEX
Passing USMLE Step 2 CS/COMLEX Level 2 PEClinical/laboratory research experience
USMLE Step 3/COMLEX Level 3 scoreOral presentations/poster presentations/speaking engagements
Residency program setting (univ.‐based vs. comm.‐based)Alpha Omega Alpha (AOA) membership
Other life experienceMedical Student Performance Evaluation (MSPE/Dean's Letter)
Second interview/visitAwards or special honors in medical school
Visa status*Applicant was flagged with Match violation by the NRMP
Graduate of highly‐regarded medical schoolElectives at your fellowship site
Awarded grant money for researchVolunteer/extracurricular experiencesMedical school class ranking/quartile
Lack of gaps in medical educationGrades in medical school
Residency class ranking/quartileFluency in language spoken by your patient population
Gold Humanism Honor Society (GHHS) membershipResidency program size
In‐Training Examination (ITE)Second interview/visit
Having finished another fellowship
NRMP Program Director Survey, Specialties Matching Service, 2016 267

170
180
190
200
210
220
230
240
250
260
Pediatric GastroenterologyPrograms That Use USMLE Step 1 and Step 2 Clinical Knowledge (CK) Scores When Considering Which Applicants to Interview
Figure-3
Percentage of Programs That Use USMLE Step 2 (CK) Score
0%
10%
20%
30%
40%
50%
60%
70%
80%
90%
100%
Never Seldom Often
11%
67%
22%
Would your program consider applicants who fail theexam on the first attempt?
0%
10%
20%
30%
40%
50%
60%
70%
80%
90%
100%
Never Seldom often
17%
61%
22%
Would your program consider applicants who failthe exam on the first attempt?
0%
10%
20%
30%
40%
50%
60%
70%
80%
90%
100%
Yes, pass only Yes, target score No
56%
44%
0%
Scores required?
0%
10%
20%
30%
40%
50%
60%
70%
80%
90%
100%
Yes, pass only Yes, target score No
50% 50%
0%
Scores required?
N=18
N=18
N=18N=18
N=5N=5 N=5 N=5
IQR* of Average USMLE Step 1 and Step 2 CK Scores Programs Consider When Granting Interviews
Percentage of Programs That Use USMLE Step 1 Score
170
180
190
200
210
220
230
240
250
260
USMLE Step 2 CKUSMLE Step 1 USMLE Step 1 USMLE Step 2 CK
*The boxes in the boxplots represent the interquartile range (or IQR, which is the range between the 25th and 75th percentiles), and the line in the box is the median. The x-shaped symbol is the mean.
Scores Above Which Programs Almost Always Grant Interviews
Scores Below Which Programs Generally Do Not Grant Interviews
NRMP Program Director Survey, Specialties Matching Service, 2016 268
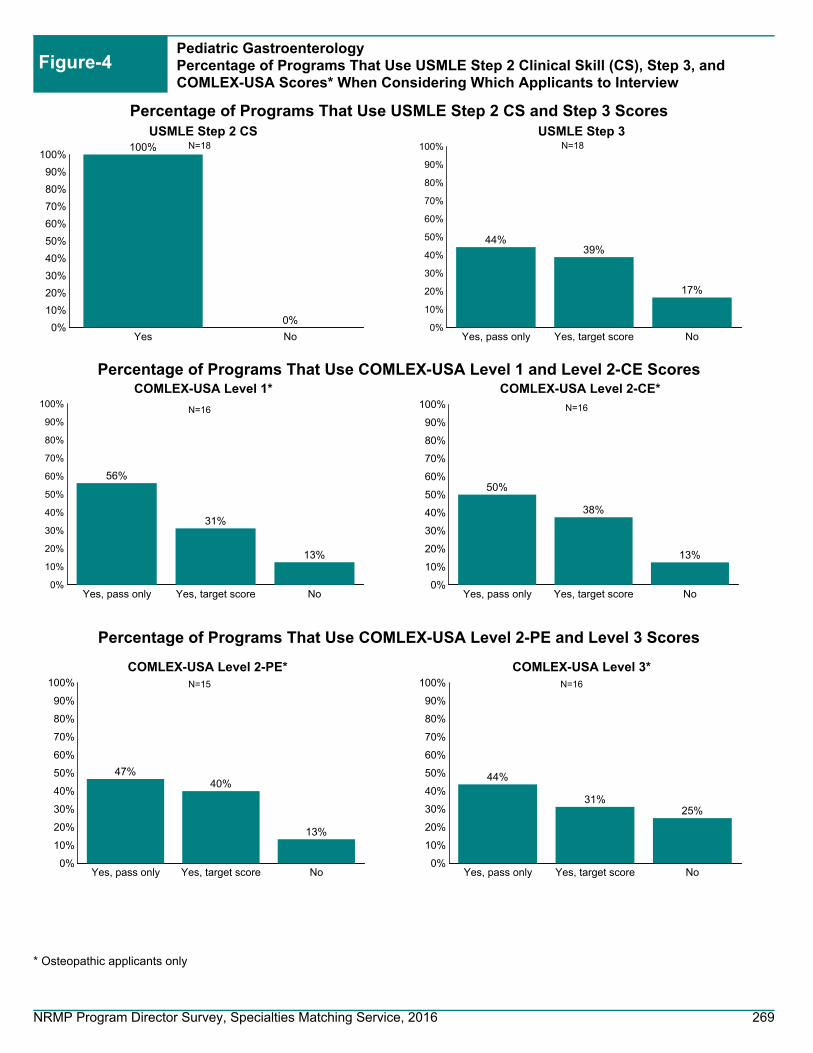
0%
10%
20%
30%
40%
50%
60%
70%
80%
90%
100%
Yes No
100%
0%
USMLE Step 2 CS
0%
10%
20%
30%
40%
50%
60%
70%
80%
90%
100%
Yes, pass only Yes, target score No
44%39%
17%
USMLE Step 3
0%
10%
20%
30%
40%
50%
60%
70%
80%
90%
100%
Yes, pass only Yes, target score No
56%
31%
13%
COMLEX-USA Level 1*
Pediatric GastroenterologyPercentage of Programs That Use USMLE Step 2 Clinical Skill (CS), Step 3, and COMLEX-USA Scores* When Considering Which Applicants to Interview
Figure-4
0%
10%
20%
30%
40%
50%
60%
70%
80%
90%
100%
Yes, pass only Yes, target score No
50%
38%
13%
COMLEX-USA Level 2-CE*
0%
10%
20%
30%
40%
50%
60%
70%
80%
90%
100%
Yes, pass only Yes, target score No
44%
31%25%
COMLEX-USA Level 3*
0%
10%
20%
30%
40%
50%
60%
70%
80%
90%
100%
Yes, pass only Yes, target score No
47%40%
13%
COMLEX-USA Level 2-PE*
N=18 N=18
N=16 N=16
N=15 N=16
* Osteopathic applicants only
Percentage of Programs That Use USMLE Step 2 CS and Step 3 Scores
Percentage of Programs That Use COMLEX-USA Level 1 and Level 2-CE Scores
Percentage of Programs That Use COMLEX-USA Level 2-PE and Level 3 Scores
NRMP Program Director Survey, Specialties Matching Service, 2016 269

0%10%20%30%40%50%60%70%80%90%
100%
Never Seldom Often
0%
83%
17%
Would your program consider applicants who fail theexam on the first attempt?
0%
10%
20%
30%
40%
50%
60%
70%
80%
90%
100%
Yes, pass only Yes, target score No, not required
29%
0%
71%
Scores required?
N=6
N=7
17.4%Optional
82.6%Required
Program Requirement on Dedicated Time forResearch
N=23
0
4
8
12
16
20
24
Accredited Locally Funded Integrated Other
2322
16
Average Number of Months if Research Time isRequired
N=11 N=5 N=0 N=2
0.0
0.5
1.0
1.5
2.0
2.5
3.0
3.5
Accredited Positions Funded Positions
3.3
2.8
Average Number of Accredited Positions and Funded Positions
0%
10%
20%
30%
40%
50%
60%
70%
80%
90%
100%
Positions Filled BeforeMatch Day
Positions Offered Outsidethe Match
Positions Filled Outsidethe Match
75%
37% 37%
Average Percentage of Accredited Positions Offered Outside ofthe Match
N=23 N=23 N=4 N=3 N=3
Pediatric GastroenterologyPrograms That Use Core Specialty Certifying Examination When Considering Applicants for Interview
Figure-5
Pediatric GastroenterologyPrograms Positions Figure-6
Pediatric GastroenterologyDedicated Time for Research Figure-7
NRMP Program Director Survey, Specialties Matching Service, 2016 270

0%
10%
20%
30%
40%
50%
60%
70%
80%
90%
100% 94%100%
82%
41%
100%
82%
U.S. Graduate OsteopathicPhysician
Canadian Fifth Pathway U.S. IMG Non-U.S. IMG
Percentage of Programs that Typically Interview and Rank Each Applicant Type
Figure-8Pediatric GastroenterologyProgram's Interview Activities
0%10%20%30%40%50%60%70%80%90%
100%
Rejected based on astandardized screening
process
In-depth review
34%
60%
Average Percentage of Applicants Rejected and Reviewed
0
10
20
30
40
50
60
Number of applicationsreceived
Number of interviewinvitations sent
Number of applicantsinterviewed
56
1916
Average Number of Positions, Applications Received, InterviewInvitations Sent, and Applicants Interviewed and Ranked
N=22N=22N=22N=22
N=17
41% of Pediatric Gastroenterology programs consider all applicant groups
N=22
0%10%20%30%40%50%60%70%80%90%
100%
Prev. Grad Osteo Pathway Canadian US IMG Non-USIMG
6%
63%
24%12%6%
29%
31%
53%
35%
53%
88%71%
6%24%
65%
35%
Often Seldom Never
Interview
0%10%
20%
30%40%
50%60%
70%80%
90%100%
Prev. Grad Osteo Pathway Canadian US IMG Non-USIMG
6%
73%
25%13%6%
44%
27%
56%
44%
56%
88%
56%
19%
56%
31%
Often Seldom Never
Ranking
n=16
Frequency of Programs Interviewing and Ranking Candidates
n=17
N=13
0%10%20%30%40%50%60%70%80%90%
100%
Jan Feb Mar Apr May Jun Jul Aug Sep Oct Nov Dec
50%
14% 12% 8%0% 0% 0% 4% 4% 6% 2% 0%
Interview invitations
Interview Invitations Sent and Interviews Conducted
16%
30%20%
9%0% 0% 0% 3% 3% 0% 0% 0%
Interviews conducted
NRMP Program Director Survey, Specialties Matching Service, 2016 271
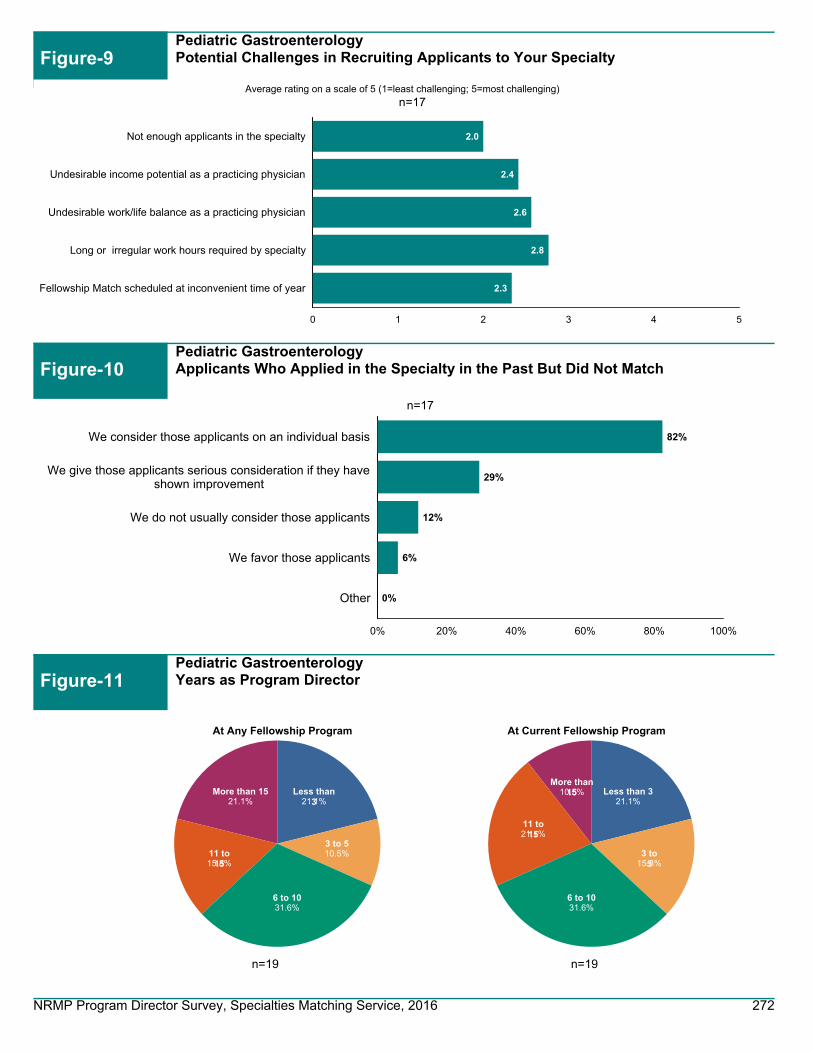
Figure-9Pediatric GastroenterologyPotential Challenges in Recruiting Applicants to Your Specialty
0% 20% 40% 60% 80% 100%
82%
29%
12%
6%
0%
We consider those applicants on an individual basis
We give those applicants serious consideration if they haveshown improvement
We do not usually consider those applicants
We favor those applicants
Other
0 1 2 3 4 5
Not enough applicants in the specialty
Undesirable income potential as a practicing physician
Undesirable work/life balance as a practicing physician
Long or irregular work hours required by specialty
Fellowship Match scheduled at inconvenient time of year
2.0
2.4
2.6
2.8
2.3
Average rating on a scale of 5 (1=least challenging; 5=most challenging)
n=17
21.1%Less than
3
10.5%3 to 5
31.6%6 to 10
15.8%11 to
15
21.1%More than 15
At Any Fellowship Program
21.1%Less than 3
15.8%3 to
5
31.6%6 to 10
21.1%11 to
15
10.5%More than
15
At Current Fellowship Program
n=17
n=19 n=19
Pediatric GastroenterologyApplicants Who Applied in the Specialty in the Past But Did Not Match Figure-10
Pediatric GastroenterologyYears as Program Director Figure-11
NRMP Program Director Survey, Specialties Matching Service, 2016 272

Pediatric Hematology/Oncology
NRMP Program Director Survey, Specialties Matching Service, 2016 273

Pediatric Hematology/OncologyGeneral Information
Table 1
67
164
201
Number of programs in the Match
Number of positions in the Match
Number of applicants ranking specialty
62.7%Response rate
Appointment Years
Number of responses 42
Match Information*
* Source: NRMP Data Warehouse
2016 Survey
2016 2015 2014
65
162
181
62
157
178
NRMP Program Director Survey, Specialties Matching Service, 2016 274

Figure-1Pediatric Hematology/OncologyPercentage of Programs Citing Each Factor and Mean Importance Rating¹ for Each Factor in Selecting Applicants to Interview(N=39)
Average RatingPercent Citing Factor
¹ Ratings on a scale from 1 (not at all important) to 5 (very important).* International Medical Graduates only
1 2 3 4 5
4.44.34.34.44.84.24.34.63.74.23.74.34.13.93.93.94.63.74.64.24.33.73.83.43.74.04.13.63.93.43.53.64.83.73.53.62.84.33.73.0
100% 50% 0%
95%82%85%95%87%77%67%67%74%79%72%72%77%87%77%67%82%59%82%67%79%54%62%69%64%62%56%54%59%44%38%41%41%44%28%33%26%10%62%
8%
Letters of recommendation in fellowship specialty
Residency performance evaluation (Program Director letter)
Reputation of residency program
Demonstrated involvement and perceived interest in research
Perceived commitment to specialty
Personal statement
Perceived interest in program
Evidence of professionalism and ethics
USMLE Step 1/COMLEX Level 1 score
Peer reviewed publications/authored textbook chapters
USMLE Step 2 CK/COMLEX Level 2 CE score
Leadership qualities
Personal prior professional knowledge of the applicant
Oral presentations/poster presentations/speaking engagements
Applicant was a resident in a core program at same institution
Pass USMLE Step 2 CS/COMLEX Level 2 PE
Any failed attempt in USMLE/COMLEX
USMLE Step 3/COMLEX Level 3 score
Interest in academic career
Residency program setting (univ.‐based vs. comm.‐based)
Clinical/laboratory research experience
Awards or special honors in medical school
Alpha Omega Alpha (AOA) membership
Other life experience
Medical Student Performance Evaluation (MSPE/Dean's Letter)
Graduate of highly‐regarded medical school
Visa status*
Volunteer/extracurricular experiences
Awarded grant money for research
Grades in medical school
Lack of gaps in medical education
Medical school class ranking/quartile
Applicant was flagged with Match violation by the NRMP
Electives at your fellowship site
Gold Humanism Honor Society (GHHS) membership
Residency class ranking/quartile
Fluency in language spoken by your patient population
In‐Training Examination (ITE)
Residency program size
Having finished another fellowship
NRMP Program Director Survey, Specialties Matching Service, 2016 275

Pediatric Hematology/OncologyPercentage of Programs Citing Each Factor and Mean Importance Rating¹ for Each Factor in Ranking Applicants(N=39)
Figure-2
Average RatingPercent Citing Factor
¹ Ratings on a scale from 1 (not at all important) to 5 (very important).* International Medical Graduates only
1 2 3 4 5
4.94.94.64.74.64.54.34.64.34.64.94.14.34.54.34.83.94.14.14.74.24.34.14.04.14.04.04.14.13.94.34.94.24.34.23.63.94.14.13.93.24.14.04.54.12.5
100% 50% 0%
97%94%94%75%92%86%86%94%81%69%81%69%69%69%75%78%50%58%58%64%58%81%50%75%58%56%42%47%47%50%44%42%44%33%53%39%42%28%19%25%17%19%53%6%
22%6%
Interactions with faculty during interview and visitInterpersonal skills
Letters of recommendation in fellowship specialtyInteractions with house staff during interview and visit
Perceived commitment to specialtyFeedback from current residents and fellows
Perceived interest in programDemonstrated involvement and perceived interest in research
Reputation of residency programResidency performance evaluation (Program Director letter)
Evidence of professionalism and ethicsPersonal statement
Personal prior professional knowledge of the applicantLeadership qualities
Peer reviewed publications/authored textbook chaptersInterest in academic career
Applicant was a resident in a core program at same institutionUSMLE Step 1/COMLEX Level 1 score
USMLE Step 2 CK/COMLEX Level 2 CE scoreAny failed attempt in USMLE/COMLEX
Passing USMLE Step 2 CS/COMLEX Level 2 PEClinical/laboratory research experience
USMLE Step 3/COMLEX Level 3 scoreOral presentations/poster presentations/speaking engagements
Residency program setting (univ.‐based vs. comm.‐based)Alpha Omega Alpha (AOA) membership
Other life experienceMedical Student Performance Evaluation (MSPE/Dean's Letter)
Second interview/visitAwards or special honors in medical school
Visa status*Applicant was flagged with Match violation by the NRMP
Graduate of highly‐regarded medical schoolElectives at your fellowship site
Awarded grant money for researchVolunteer/extracurricular experiencesMedical school class ranking/quartile
Lack of gaps in medical educationGrades in medical school
Residency class ranking/quartileFluency in language spoken by your patient population
Gold Humanism Honor Society (GHHS) membershipResidency program size
In‐Training Examination (ITE)Second interview/visit
Having finished another fellowship
NRMP Program Director Survey, Specialties Matching Service, 2016 276

170
180
190
200
210
220
230
240
250
260
Pediatric Hematology/OncologyPrograms That Use USMLE Step 1 and Step 2 Clinical Knowledge (CK) Scores When Considering Which Applicants to Interview
Figure-3
Percentage of Programs That Use USMLE Step 2 (CK) Score
0%
10%
20%
30%
40%
50%
60%
70%
80%
90%
100%
Never Seldom Often
16%
79%
5%
Would your program consider applicants who fail theexam on the first attempt?
0%
10%
20%
30%
40%
50%
60%
70%
80%
90%
100%
Never Seldom often
24%
71%
5%
Would your program consider applicants who failthe exam on the first attempt?
0%
10%
20%
30%
40%
50%
60%
70%
80%
90%
100%
Yes, pass only Yes, target score No
64%
28%
8%
Scores required?
0%
10%
20%
30%
40%
50%
60%
70%
80%
90%
100%
Yes, pass only Yes, target score No
64%
28%
8%
Scores required?
N=39
N=38
N=39N=38
N=8N=9 N=9 N=9
IQR* of Average USMLE Step 1 and Step 2 CK Scores Programs Consider When Granting Interviews
Percentage of Programs That Use USMLE Step 1 Score
170
180
190
200
210
220
230
240
250
260
USMLE Step 2 CKUSMLE Step 1 USMLE Step 1 USMLE Step 2 CK
*The boxes in the boxplots represent the interquartile range (or IQR, which is the range between the 25th and 75th percentiles), and the line in the box is the median. The x-shaped symbol is the mean.
Scores Above Which Programs Almost Always Grant Interviews
Scores Below Which Programs Generally Do Not Grant Interviews
NRMP Program Director Survey, Specialties Matching Service, 2016 277

0%
10%
20%
30%
40%
50%
60%
70%
80%
90%
100%
Yes No
92%
8%
USMLE Step 2 CS
0%
10%
20%
30%
40%
50%
60%
70%
80%
90%
100%
Yes, pass only Yes, target score No
62%
22%16%
USMLE Step 3
0%
10%
20%
30%
40%
50%
60%
70%
80%
90%
100%
Yes, pass only Yes, target score No
52%
31%
17%
COMLEX-USA Level 1*
Pediatric Hematology/OncologyPercentage of Programs That Use USMLE Step 2 Clinical Skill (CS), Step 3, and COMLEX-USA Scores* When Considering Which Applicants to Interview
Figure-4
0%
10%
20%
30%
40%
50%
60%
70%
80%
90%
100%
Yes, pass only Yes, target score No
52%
31%
17%
COMLEX-USA Level 2-CE*
0%
10%
20%
30%
40%
50%
60%
70%
80%
90%
100%
Yes, pass only Yes, target score No
57%
21% 21%
COMLEX-USA Level 3*
0%
10%
20%
30%
40%
50%
60%
70%
80%
90%
100%
Yes, pass only Yes, target score No
57%
25%18%
COMLEX-USA Level 2-PE*
N=38 N=37
N=29 N=29
N=28 N=28
* Osteopathic applicants only
Percentage of Programs That Use USMLE Step 2 CS and Step 3 Scores
Percentage of Programs That Use COMLEX-USA Level 1 and Level 2-CE Scores
Percentage of Programs That Use COMLEX-USA Level 2-PE and Level 3 Scores
NRMP Program Director Survey, Specialties Matching Service, 2016 278
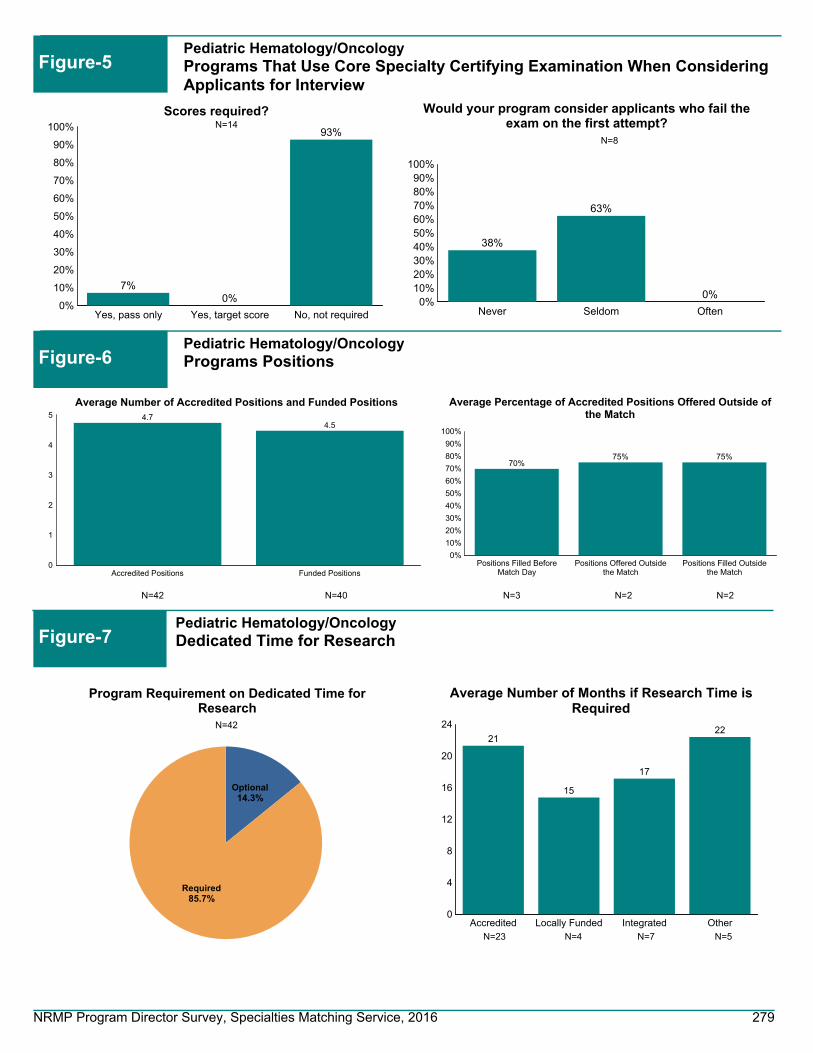
0%10%20%30%40%50%60%70%80%90%
100%
Never Seldom Often
38%
63%
0%
Would your program consider applicants who fail theexam on the first attempt?
0%
10%
20%
30%
40%
50%
60%
70%
80%
90%
100%
Yes, pass only Yes, target score No, not required
7%0%
93%
Scores required?
N=8
N=14
14.3%Optional
85.7%Required
Program Requirement on Dedicated Time forResearch
N=42
0
4
8
12
16
20
24
Accredited Locally Funded Integrated Other
21
15
17
22
Average Number of Months if Research Time isRequired
N=23 N=4 N=7 N=5
0
1
2
3
4
5
Accredited Positions Funded Positions
4.74.5
Average Number of Accredited Positions and Funded Positions
0%
10%
20%
30%
40%
50%
60%
70%
80%
90%
100%
Positions Filled BeforeMatch Day
Positions Offered Outsidethe Match
Positions Filled Outsidethe Match
70%75% 75%
Average Percentage of Accredited Positions Offered Outside ofthe Match
N=42 N=40 N=3 N=2 N=2
Pediatric Hematology/OncologyPrograms That Use Core Specialty Certifying Examination When Considering Applicants for Interview
Figure-5
Pediatric Hematology/OncologyPrograms Positions Figure-6
Pediatric Hematology/OncologyDedicated Time for Research Figure-7
NRMP Program Director Survey, Specialties Matching Service, 2016 279

0%
10%
20%
30%
40%
50%
60%
70%
80%
90%
100% 95% 95%
68%
33%
83%
73%
U.S. Graduate OsteopathicPhysician
Canadian Fifth Pathway U.S. IMG Non-U.S. IMG
Percentage of Programs that Typically Interview and Rank Each Applicant Type
Figure-8Pediatric Hematology/OncologyProgram's Interview Activities
0%10%20%30%40%50%60%70%80%90%
100%
Rejected based on astandardized screening
process
In-depth review
36%
76%
Average Percentage of Applicants Rejected and Reviewed
0
10
20
30
40
50
60
70
Number of applicationsreceived
Number of interviewinvitations sent
Number of applicantsinterviewed
62
2320
Average Number of Positions, Applications Received, InterviewInvitations Sent, and Applicants Interviewed and Ranked
N=41N=41N=41N=41
N=40
33% of Pediatric Hematology/Oncology programs consider all applicant groups
N=41
0%10%20%30%40%50%60%70%80%90%
100%
Prev. Grad Osteo Pathway Canadian US IMG Non-USIMG
3% 3%
68%
21%5%
16%3%21%
24%
45%
51%42%
95%77%
8%
34%44% 42%
Often Seldom Never
Interview
0%10%
20%
30%40%
50%60%
70%80%
90%100%
Prev. Grad Osteo Pathway Canadian US IMG Non-USIMG
3% 5%
69%
22%8%
16%3%
24%
25%
46%58%
54%95%
71%
6%
32% 34% 30%
Often Seldom Never
Ranking
n=38
Frequency of Programs Interviewing and Ranking Candidates
n=39
N=39
0%10%20%30%40%50%60%70%80%90%
100%
Jan Feb Mar Apr May Jun Jul Aug Sep Oct Nov Dec
78%
11%2% 1% 0% 0% 0% 0% 0% 0% 0%
8%
Interview invitations
Interview Invitations Sent and Interviews Conducted
22%33% 30%
8%1% 0% 0% 0% 0% 0% 0% 3%
Interviews conducted
NRMP Program Director Survey, Specialties Matching Service, 2016 280
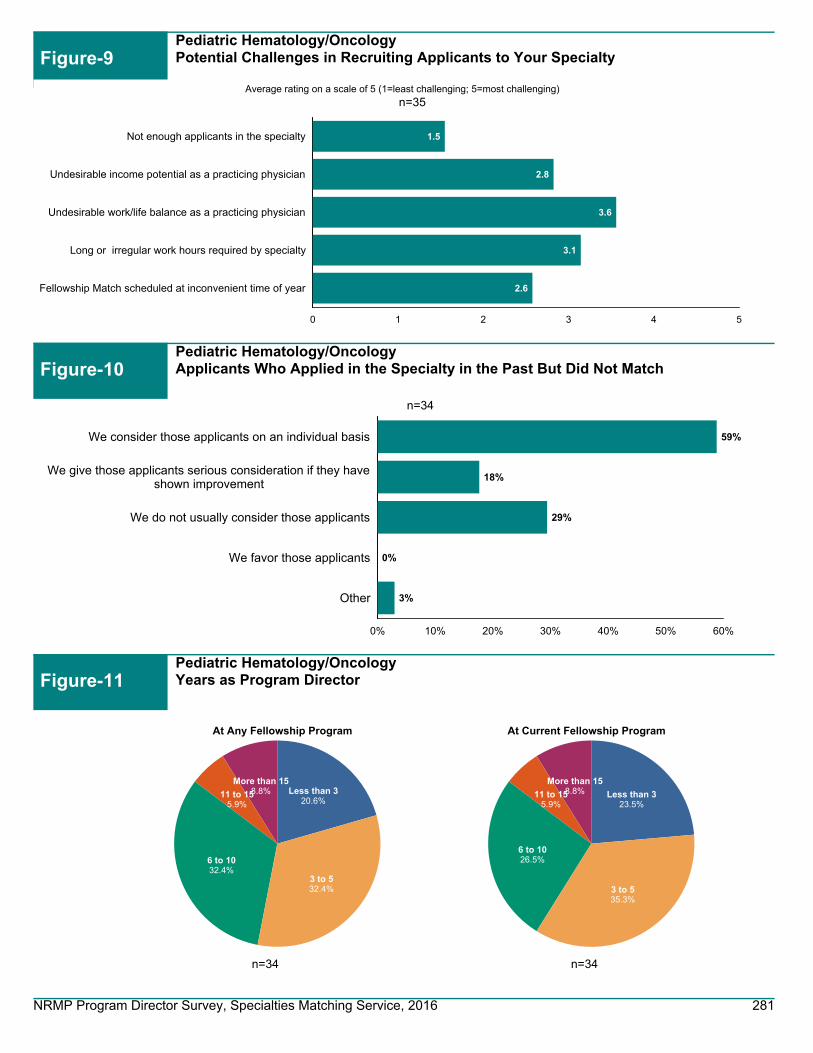
Figure-9Pediatric Hematology/OncologyPotential Challenges in Recruiting Applicants to Your Specialty
0% 10% 20% 30% 40% 50% 60%
59%
18%
29%
0%
3%
We consider those applicants on an individual basis
We give those applicants serious consideration if they haveshown improvement
We do not usually consider those applicants
We favor those applicants
Other
0 1 2 3 4 5
Not enough applicants in the specialty
Undesirable income potential as a practicing physician
Undesirable work/life balance as a practicing physician
Long or irregular work hours required by specialty
Fellowship Match scheduled at inconvenient time of year
1.5
2.8
3.6
3.1
2.6
Average rating on a scale of 5 (1=least challenging; 5=most challenging)
n=35
20.6%Less than 3
32.4%3 to 5
32.4%6 to 10
5.9%11 to 158.8%
More than 15
At Any Fellowship Program
23.5%Less than 3
35.3%3 to 5
26.5%6 to 10
5.9%11 to 158.8%
More than 15
At Current Fellowship Program
n=34
n=34 n=34
Pediatric Hematology/OncologyApplicants Who Applied in the Specialty in the Past But Did Not Match Figure-10
Pediatric Hematology/OncologyYears as Program Director Figure-11
NRMP Program Director Survey, Specialties Matching Service, 2016 281

Pediatric Hospital Medicine
NRMP Program Director Survey, Specialties Matching Service, 2016 282

Pediatric Hospital MedicineGeneral Information
Table 1
30
38
38
Number of programs in the Match
Number of positions in the Match
Number of applicants ranking specialty
41.4%Response rate
Appointment Years
Number of responses 12
Match Information*
* Source: NRMP Data Warehouse
2016 Survey
2016 2015 2014
24
30
37
NRMP Program Director Survey, Specialties Matching Service, 2016 283

Figure-1Pediatric Hospital MedicinePercentage of Programs Citing Each Factor and Mean Importance Rating¹ for Each Factor in Selecting Applicants to Interview(N=12)
Average RatingPercent Citing Factor
¹ Ratings on a scale from 1 (not at all important) to 5 (very important).* International Medical Graduates only
1 2 3 4 5
4.54.43.73.64.84.34.34.83.04.03.24.43.83.83.83.53.03.24.13.52.73.53.03.3
3.43.83.53.03.73.54.04.2
3.33.02.74.03.7
100% 50% 0%
92%92%83%75%92%92%
100%92%50%42%58%75%
100%50%58%58%42%50%92%58%33%42%67%42%
8%50%75%42%17%33%17%17%58%
0%42%
8%25%
8%33%
0%
Letters of recommendation in fellowship specialty
Residency performance evaluation (Program Director letter)
Reputation of residency program
Demonstrated involvement and perceived interest in research
Perceived commitment to specialty
Personal statement
Perceived interest in program
Evidence of professionalism and ethics
USMLE Step 1/COMLEX Level 1 score
Peer reviewed publications/authored textbook chapters
USMLE Step 2 CK/COMLEX Level 2 CE score
Leadership qualities
Personal prior professional knowledge of the applicant
Oral presentations/poster presentations/speaking engagements
Applicant was a resident in a core program at same institution
Pass USMLE Step 2 CS/COMLEX Level 2 PE
Any failed attempt in USMLE/COMLEX
USMLE Step 3/COMLEX Level 3 score
Interest in academic career
Residency program setting (univ.‐based vs. comm.‐based)
Clinical/laboratory research experience
Awards or special honors in medical school
Alpha Omega Alpha (AOA) membership
Other life experience
Medical Student Performance Evaluation (MSPE/Dean's Letter)
Graduate of highly‐regarded medical school
Visa status*
Volunteer/extracurricular experiences
Awarded grant money for research
Grades in medical school
Lack of gaps in medical education
Medical school class ranking/quartile
Applicant was flagged with Match violation by the NRMP
Electives at your fellowship site
Gold Humanism Honor Society (GHHS) membership
Residency class ranking/quartile
Fluency in language spoken by your patient population
In‐Training Examination (ITE)
Residency program size
Having finished another fellowship
NRMP Program Director Survey, Specialties Matching Service, 2016 284

Pediatric Hospital MedicinePercentage of Programs Citing Each Factor and Mean Importance Rating¹ for Each Factor in Ranking Applicants(N=12)
Figure-2
Average RatingPercent Citing Factor
¹ Ratings on a scale from 1 (not at all important) to 5 (very important).* International Medical Graduates only
1 2 3 4 5
4.94.94.34.64.84.65.03.63.64.84.64.34.84.64.04.34.05.05.03.04.02.05.03.03.34.03.74.04.24.04.04.73.04.0
3.74.04.0
2.04.53.73.54.5
100% 50% 0%
82%82%82%45%91%73%64%73%55%82%73%73%36%64%9%
73%27%9%9%
18%18%9%9%9%
36%9%
27%9%
45%9%
36%27%9%9%0%
27%9%9%0%0%9%
18%36%18%18%0%
Interactions with faculty during interview and visitInterpersonal skills
Letters of recommendation in fellowship specialtyInteractions with house staff during interview and visit
Perceived commitment to specialtyFeedback from current residents and fellows
Perceived interest in programDemonstrated involvement and perceived interest in research
Reputation of residency programResidency performance evaluation (Program Director letter)
Evidence of professionalism and ethicsPersonal statement
Personal prior professional knowledge of the applicantLeadership qualities
Peer reviewed publications/authored textbook chaptersInterest in academic career
Applicant was a resident in a core program at same institutionUSMLE Step 1/COMLEX Level 1 score
USMLE Step 2 CK/COMLEX Level 2 CE scoreAny failed attempt in USMLE/COMLEX
Passing USMLE Step 2 CS/COMLEX Level 2 PEClinical/laboratory research experience
USMLE Step 3/COMLEX Level 3 scoreOral presentations/poster presentations/speaking engagements
Residency program setting (univ.‐based vs. comm.‐based)Alpha Omega Alpha (AOA) membership
Other life experienceMedical Student Performance Evaluation (MSPE/Dean's Letter)
Second interview/visitAwards or special honors in medical school
Visa status*Applicant was flagged with Match violation by the NRMP
Graduate of highly‐regarded medical schoolElectives at your fellowship site
Awarded grant money for researchVolunteer/extracurricular experiencesMedical school class ranking/quartile
Lack of gaps in medical educationGrades in medical school
Residency class ranking/quartileFluency in language spoken by your patient population
Gold Humanism Honor Society (GHHS) membershipResidency program size
In‐Training Examination (ITE)Second interview/visit
Having finished another fellowship
NRMP Program Director Survey, Specialties Matching Service, 2016 285

Pediatric Hospital MedicinePrograms That Use USMLE Step 1 and Step 2 Clinical Knowledge (CK) Scores When Considering Which Applicants to Interview
Figure-3
Percentage of Programs That Use USMLE Step 2 (CK) Score
0%
10%
20%
30%
40%
50%
60%
70%
80%
90%
100%
Never Seldom Often
8%
67%
25%
Would your program consider applicants who fail theexam on the first attempt?
0%
10%
20%
30%
40%
50%
60%
70%
80%
90%
100%
Never Seldom often
8%
75%
17%
Would your program consider applicants who failthe exam on the first attempt?
0%
10%
20%
30%
40%
50%
60%
70%
80%
90%
100%
Yes, pass only Yes, target score No
83%
8% 8%
Scores required?
0%
10%
20%
30%
40%
50%
60%
70%
80%
90%
100%
Yes, pass only Yes, target score No
83%
8% 8%
Scores required?
N=12
N=12
N=12N=12
IQR* of Average USMLE Step 1 and Step 2 CK Scores Programs Consider When Granting Interviews
Percentage of Programs That Use USMLE Step 1 Score
*The boxes in the boxplots represent the interquartile range (or IQR, which is the range between the 25th and 75th percentiles), and the line in the box is the median. The x-shaped symbol is the mean.
Scores Above Which Programs Almost Always Grant Interviews
Scores Below Which Programs Generally Do Not Grant Interviews
USMLE Step 2 CK not reported
because of low response rate
USMLE Step 1 not reported because of low response
rate
USMLE Step 2 CK not reported
because of low response rate
USMLE Step 1 not reported because of low response
rate
NRMP Program Director Survey, Specialties Matching Service, 2016 286
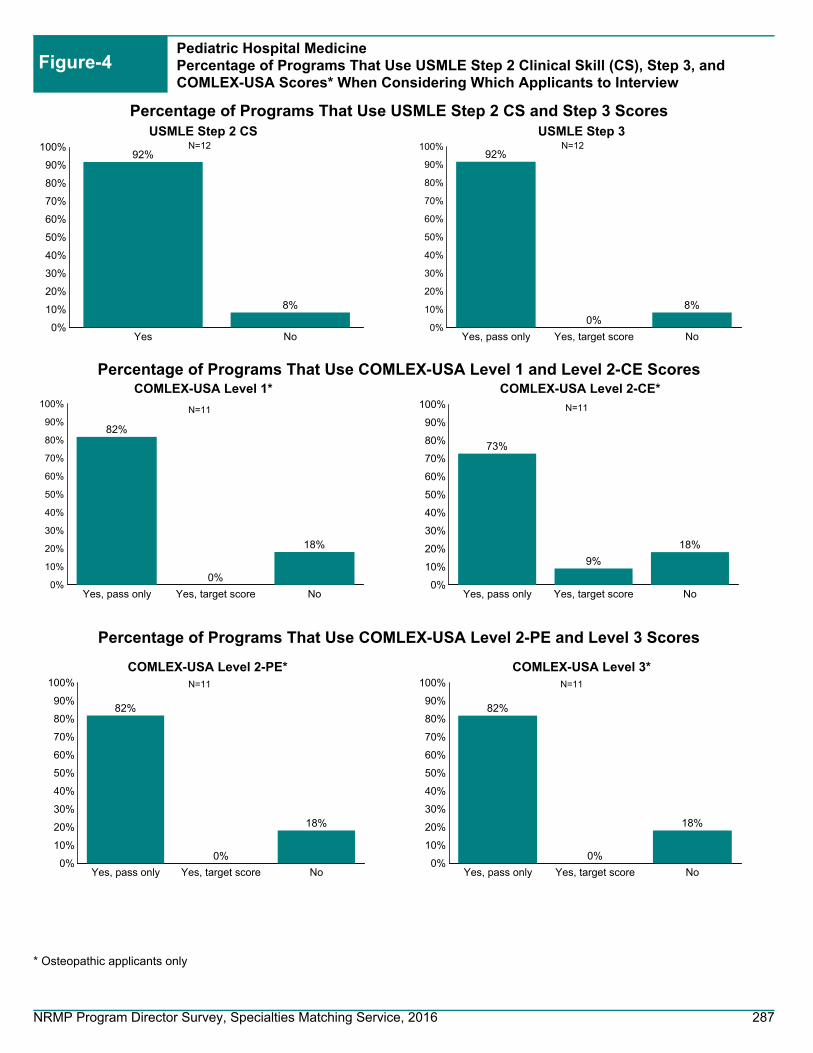
0%
10%
20%
30%
40%
50%
60%
70%
80%
90%
100%
Yes No
92%
8%
USMLE Step 2 CS
0%
10%
20%
30%
40%
50%
60%
70%
80%
90%
100%
Yes, pass only Yes, target score No
92%
0%
8%
USMLE Step 3
0%
10%
20%
30%
40%
50%
60%
70%
80%
90%
100%
Yes, pass only Yes, target score No
82%
0%
18%
COMLEX-USA Level 1*
Pediatric Hospital MedicinePercentage of Programs That Use USMLE Step 2 Clinical Skill (CS), Step 3, and COMLEX-USA Scores* When Considering Which Applicants to Interview
Figure-4
0%
10%
20%
30%
40%
50%
60%
70%
80%
90%
100%
Yes, pass only Yes, target score No
73%
9%
18%
COMLEX-USA Level 2-CE*
0%
10%
20%
30%
40%
50%
60%
70%
80%
90%
100%
Yes, pass only Yes, target score No
82%
0%
18%
COMLEX-USA Level 3*
0%
10%
20%
30%
40%
50%
60%
70%
80%
90%
100%
Yes, pass only Yes, target score No
82%
0%
18%
COMLEX-USA Level 2-PE*
N=12 N=12
N=11 N=11
N=11 N=11
* Osteopathic applicants only
Percentage of Programs That Use USMLE Step 2 CS and Step 3 Scores
Percentage of Programs That Use COMLEX-USA Level 1 and Level 2-CE Scores
Percentage of Programs That Use COMLEX-USA Level 2-PE and Level 3 Scores
NRMP Program Director Survey, Specialties Matching Service, 2016 287

0%10%20%30%40%50%60%70%80%90%
100%
Never Seldom Often
33% 33% 33%
Would your program consider applicants who fail theexam on the first attempt?
0%
10%
20%
30%
40%
50%
60%
70%
80%
90%
100%
Yes, pass only Yes, target score No, not required
0% 0%
100%
Scores required?
N=3
N=6
16.7%Optional
83.3%Required
Program Requirement on Dedicated Time forResearch
N=12
0
2
4
6
8
10
12
Accredited Locally Funded Integrated Other
8
11
6
7
Average Number of Months if Research Time isRequired
N=1 N=3 N=3 N=3
0.0
0.2
0.4
0.6
0.8
1.0
1.2
1.4
Accredited Positions Funded Positions
1.3 1.4
Average Number of Accredited Positions and Funded Positions
0%
10%
20%
30%
40%
50%
60%
70%
80%
90%
100%
Positions Filled BeforeMatch Day
Positions Offered Outsidethe Match
Positions Filled Outsidethe Match
100%
Average Percentage of Accredited Positions Offered Outside ofthe Match
N=12 N=11 N=2 N=0 N=0
Pediatric Hospital MedicinePrograms That Use Core Specialty Certifying Examination When Considering Applicants for Interview
Figure-5
Pediatric Hospital MedicinePrograms Positions Figure-6
Pediatric Hospital MedicineDedicated Time for Research Figure-7
NRMP Program Director Survey, Specialties Matching Service, 2016 288

0%
10%
20%
30%
40%
50%
60%
70%
80%
90%
100%100% 100%
50% 50%
75%
42%
U.S. Graduate OsteopathicPhysician
Canadian Fifth Pathway U.S. IMG Non-U.S. IMG
Percentage of Programs that Typically Interview and Rank Each Applicant Type
Figure-8Pediatric Hospital MedicineProgram's Interview Activities
0%10%20%30%40%50%60%70%80%90%
100%
Rejected based on astandardized screening
process
In-depth review
8%
96%
Average Percentage of Applicants Rejected and Reviewed
0
2
4
6
8
10
Number of applicationsreceived
Number of interviewinvitations sent
Number of applicantsinterviewed
9
76
Average Number of Positions, Applications Received, InterviewInvitations Sent, and Applicants Interviewed and Ranked
N=11N=11N=11N=11
N=12
42% of Pediatric Hospital Medicine programs consider all applicant groups
N=11
0%10%20%30%40%50%60%70%80%90%
100%
Prev. Grad Osteo Pathway Canadian US IMG Non-USIMG
75%58% 58%
8%
25%
33%
67%
25%
100%92%
8%
33%17%
Often Seldom Never
Interview
0%10%
20%
30%40%
50%60%
70%80%
90%100%
Prev. Grad Osteo Pathway Canadian US IMG Non-USIMG
73%55% 58%
8%
27%
36%
67%
25%
100%92%
9%
33%17%
Often Seldom Never
Ranking
n=12
Frequency of Programs Interviewing and Ranking Candidates
n=12
N=12
0%10%20%30%40%50%60%70%80%90%
100%
Jan Feb Mar Apr May Jun Jul Aug Sep Oct Nov Dec
0%8%
0% 0% 0% 0% 0%
15%
43%33%
1% 0%
Interview invitations
Interview Invitations Sent and Interviews Conducted
0% 0% 0% 0% 0% 0% 0% 2%
21%
35% 32%
0%
Interviews conducted
NRMP Program Director Survey, Specialties Matching Service, 2016 289

Figure-9Pediatric Hospital MedicinePotential Challenges in Recruiting Applicants to Your Specialty
0% 20% 40% 60% 80% 100%
100%
22%
0%
0%
0%
We consider those applicants on an individual basis
We give those applicants serious consideration if they haveshown improvement
We do not usually consider those applicants
We favor those applicants
Other
0 1 2 3 4 5
Not enough applicants in the specialty
Undesirable income potential as a practicing physician
Undesirable work/life balance as a practicing physician
Long or irregular work hours required by specialty
Fellowship Match scheduled at inconvenient time of year
2.8
2.6
2.2
2.4
1.6
Average rating on a scale of 5 (1=least challenging; 5=most challenging)
n=10
58.3%Less than 3
33.3%3 to 5
8.3%6 to 10
At Any Fellowship Program
58.3%Less than 3
33.3%3 to
5
8.3%6 to 10
At Current Fellowship Program
n=9
n=12 n=12
Pediatric Hospital MedicineApplicants Who Applied in the Specialty in the Past But Did Not Match Figure-10
Pediatric Hospital MedicineYears as Program Director Figure-11
NRMP Program Director Survey, Specialties Matching Service, 2016 290

Pediatric Infectious Diseases
NRMP Program Director Survey, Specialties Matching Service, 2016 291

Pediatric Infectious DiseasesGeneral Information
Table 1
53
70
49
Number of programs in the Match
Number of positions in the Match
Number of applicants ranking specialty
56.9%Response rate
Appointment Years
Number of responses 29
Match Information*
* Source: NRMP Data Warehouse
2016 Survey
2016 2015 2014
51
66
34
48
64
48
NRMP Program Director Survey, Specialties Matching Service, 2016 292

Figure-1Pediatric Infectious DiseasesPercentage of Programs Citing Each Factor and Mean Importance Rating¹ for Each Factor in Selecting Applicants to Interview(N=24)
Average RatingPercent Citing Factor
¹ Ratings on a scale from 1 (not at all important) to 5 (very important).* International Medical Graduates only
1 2 3 4 5
4.34.54.04.04.63.84.34.63.63.63.64.13.83.53.73.84.23.64.54.03.63.53.63.43.53.63.83.03.33.33.33.44.73.63.33.43.53.03.63.0
100% 50% 0%
100%100%
92%92%
100%100%
83%83%71%92%75%71%54%83%54%67%58%50%96%63%88%63%54%46%50%63%67%29%63%38%42%38%38%29%17%21%25%
8%33%
8%
Letters of recommendation in fellowship specialty
Residency performance evaluation (Program Director letter)
Reputation of residency program
Demonstrated involvement and perceived interest in research
Perceived commitment to specialty
Personal statement
Perceived interest in program
Evidence of professionalism and ethics
USMLE Step 1/COMLEX Level 1 score
Peer reviewed publications/authored textbook chapters
USMLE Step 2 CK/COMLEX Level 2 CE score
Leadership qualities
Personal prior professional knowledge of the applicant
Oral presentations/poster presentations/speaking engagements
Applicant was a resident in a core program at same institution
Pass USMLE Step 2 CS/COMLEX Level 2 PE
Any failed attempt in USMLE/COMLEX
USMLE Step 3/COMLEX Level 3 score
Interest in academic career
Residency program setting (univ.‐based vs. comm.‐based)
Clinical/laboratory research experience
Awards or special honors in medical school
Alpha Omega Alpha (AOA) membership
Other life experience
Medical Student Performance Evaluation (MSPE/Dean's Letter)
Graduate of highly‐regarded medical school
Visa status*
Volunteer/extracurricular experiences
Awarded grant money for research
Grades in medical school
Lack of gaps in medical education
Medical school class ranking/quartile
Applicant was flagged with Match violation by the NRMP
Electives at your fellowship site
Gold Humanism Honor Society (GHHS) membership
Residency class ranking/quartile
Fluency in language spoken by your patient population
In‐Training Examination (ITE)
Residency program size
Having finished another fellowship
NRMP Program Director Survey, Specialties Matching Service, 2016 293

Pediatric Infectious DiseasesPercentage of Programs Citing Each Factor and Mean Importance Rating¹ for Each Factor in Ranking Applicants(N=24)
Figure-2
Average RatingPercent Citing Factor
¹ Ratings on a scale from 1 (not at all important) to 5 (very important).* International Medical Graduates only
1 2 3 4 5
4.94.74.34.74.74.64.54.03.94.44.74.24.24.13.64.64.13.73.84.54.04.03.93.74.03.63.03.74.13.74.04.63.63.03.63.33.34.03.33.74.03.83.83.04.03.0
100% 50% 0%
88%92%
100%71%88%75%79%83%79%83%63%71%50%58%58%88%29%63%67%46%54%63%46%42%42%42%29%46%33%38%33%21%50%25%42%29%29%17%33%13%21%25%25%13%13%8%
Interactions with faculty during interview and visitInterpersonal skills
Letters of recommendation in fellowship specialtyInteractions with house staff during interview and visit
Perceived commitment to specialtyFeedback from current residents and fellows
Perceived interest in programDemonstrated involvement and perceived interest in research
Reputation of residency programResidency performance evaluation (Program Director letter)
Evidence of professionalism and ethicsPersonal statement
Personal prior professional knowledge of the applicantLeadership qualities
Peer reviewed publications/authored textbook chaptersInterest in academic career
Applicant was a resident in a core program at same institutionUSMLE Step 1/COMLEX Level 1 score
USMLE Step 2 CK/COMLEX Level 2 CE scoreAny failed attempt in USMLE/COMLEX
Passing USMLE Step 2 CS/COMLEX Level 2 PEClinical/laboratory research experience
USMLE Step 3/COMLEX Level 3 scoreOral presentations/poster presentations/speaking engagements
Residency program setting (univ.‐based vs. comm.‐based)Alpha Omega Alpha (AOA) membership
Other life experienceMedical Student Performance Evaluation (MSPE/Dean's Letter)
Second interview/visitAwards or special honors in medical school
Visa status*Applicant was flagged with Match violation by the NRMP
Graduate of highly‐regarded medical schoolElectives at your fellowship site
Awarded grant money for researchVolunteer/extracurricular experiencesMedical school class ranking/quartile
Lack of gaps in medical educationGrades in medical school
Residency class ranking/quartileFluency in language spoken by your patient population
Gold Humanism Honor Society (GHHS) membershipResidency program size
In‐Training Examination (ITE)Second interview/visit
Having finished another fellowship
NRMP Program Director Survey, Specialties Matching Service, 2016 294

Pediatric Infectious DiseasesPrograms That Use USMLE Step 1 and Step 2 Clinical Knowledge (CK) Scores When Considering Which Applicants to Interview
Figure-3
Percentage of Programs That Use USMLE Step 2 (CK) Score
0%
10%
20%
30%
40%
50%
60%
70%
80%
90%
100%
Never Seldom Often
4%
87%
9%
Would your program consider applicants who fail theexam on the first attempt?
0%
10%
20%
30%
40%
50%
60%
70%
80%
90%
100%
Never Seldom often
26%
65%
9%
Would your program consider applicants who failthe exam on the first attempt?
0%
10%
20%
30%
40%
50%
60%
70%
80%
90%
100%
Yes, pass only Yes, target score No
74%
22%
4%
Scores required?
0%
10%
20%
30%
40%
50%
60%
70%
80%
90%
100%
Yes, pass only Yes, target score No
75%
21%
4%
Scores required?
N=23
N=23
N=24N=23
IQR* of Average USMLE Step 1 and Step 2 CK Scores Programs Consider When Granting Interviews
Percentage of Programs That Use USMLE Step 1 Score
*The boxes in the boxplots represent the interquartile range (or IQR, which is the range between the 25th and 75th percentiles), and the line in the box is the median. The x-shaped symbol is the mean.
Scores Above Which Programs Almost Always Grant Interviews
Scores Below Which Programs Generally Do Not Grant Interviews
USMLE Step 2 CK not reported
because of low response rate
USMLE Step 1 not reported because of low response
rate
USMLE Step 2 CK not reported
because of low response rate
USMLE Step 1 not reported because of low response
rate
NRMP Program Director Survey, Specialties Matching Service, 2016 295
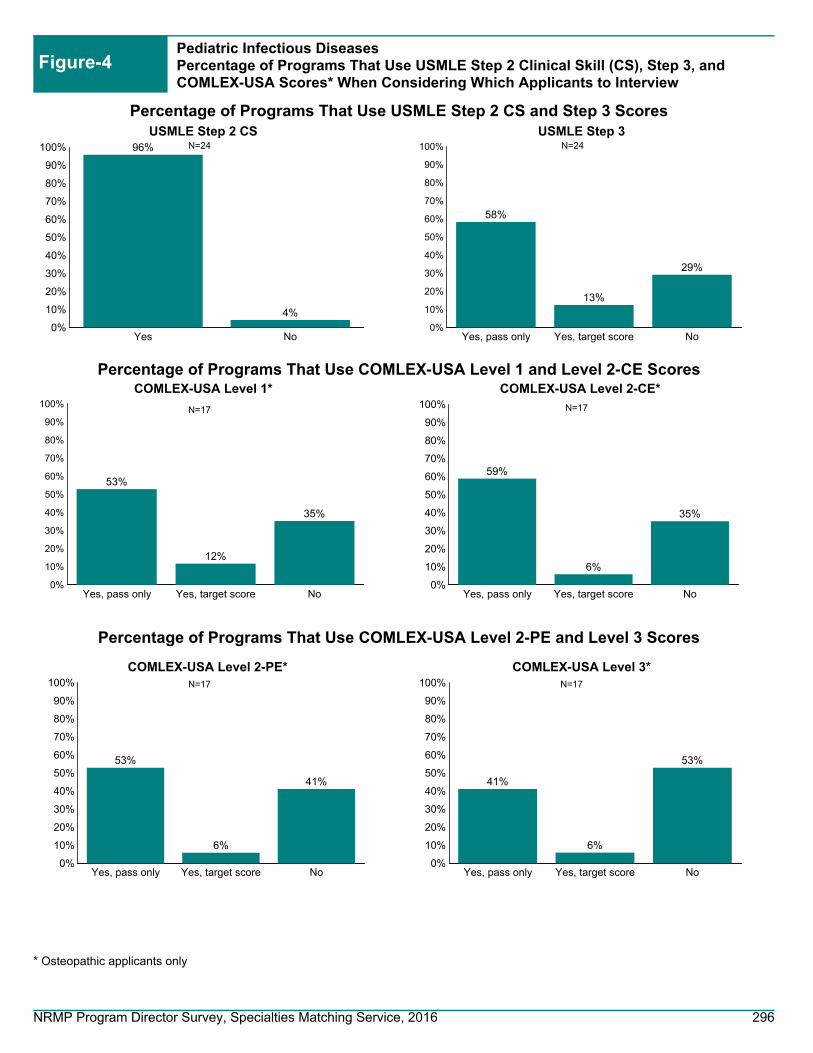
0%
10%
20%
30%
40%
50%
60%
70%
80%
90%
100%
Yes No
96%
4%
USMLE Step 2 CS
0%
10%
20%
30%
40%
50%
60%
70%
80%
90%
100%
Yes, pass only Yes, target score No
58%
13%
29%
USMLE Step 3
0%
10%
20%
30%
40%
50%
60%
70%
80%
90%
100%
Yes, pass only Yes, target score No
53%
12%
35%
COMLEX-USA Level 1*
Pediatric Infectious DiseasesPercentage of Programs That Use USMLE Step 2 Clinical Skill (CS), Step 3, and COMLEX-USA Scores* When Considering Which Applicants to Interview
Figure-4
0%
10%
20%
30%
40%
50%
60%
70%
80%
90%
100%
Yes, pass only Yes, target score No
59%
6%
35%
COMLEX-USA Level 2-CE*
0%
10%
20%
30%
40%
50%
60%
70%
80%
90%
100%
Yes, pass only Yes, target score No
41%
6%
53%
COMLEX-USA Level 3*
0%
10%
20%
30%
40%
50%
60%
70%
80%
90%
100%
Yes, pass only Yes, target score No
53%
6%
41%
COMLEX-USA Level 2-PE*
N=24 N=24
N=17 N=17
N=17 N=17
* Osteopathic applicants only
Percentage of Programs That Use USMLE Step 2 CS and Step 3 Scores
Percentage of Programs That Use COMLEX-USA Level 1 and Level 2-CE Scores
Percentage of Programs That Use COMLEX-USA Level 2-PE and Level 3 Scores
NRMP Program Director Survey, Specialties Matching Service, 2016 296

0%10%20%30%40%50%60%70%80%90%
100%
Never Seldom Often
50% 50%
0%
Would your program consider applicants who fail theexam on the first attempt?
0%
10%
20%
30%
40%
50%
60%
70%
80%
90%
100%
Yes, pass only Yes, target score No, not required
0% 0%
100%
Scores required?
N=10
N=14
3.4%Optional
96.6%Required
Program Requirement on Dedicated Time forResearch
N=29
0
4
8
12
16
20
24
Accredited Locally Funded Integrated Other
21
1819
22
Average Number of Months if Research Time isRequired
N=16 N=4 N=4 N=5
0.0
0.4
0.8
1.2
1.6
2.0
2.4
2.8
3.2
Accredited Positions Funded Positions
2.9
2.6
Average Number of Accredited Positions and Funded Positions
0%
10%
20%
30%
40%
50%
60%
70%
80%
90%
100%
Positions Filled BeforeMatch Day
Positions Offered Outsidethe Match
Positions Filled Outsidethe Match
57%
32% 31%
Average Percentage of Accredited Positions Offered Outside ofthe Match
N=28 N=27 N=10 N=5 N=4
Pediatric Infectious DiseasesPrograms That Use Core Specialty Certifying Examination When Considering Applicants for Interview
Figure-5
Pediatric Infectious DiseasesPrograms Positions Figure-6
Pediatric Infectious DiseasesDedicated Time for Research Figure-7
NRMP Program Director Survey, Specialties Matching Service, 2016 297

0%
10%
20%
30%
40%
50%
60%
70%
80%
90%
100%100% 96%
69%
42%
73%
62%
U.S. Graduate OsteopathicPhysician
Canadian Fifth Pathway U.S. IMG Non-U.S. IMG
Percentage of Programs that Typically Interview and Rank Each Applicant Type
Figure-8Pediatric Infectious DiseasesProgram's Interview Activities
0%10%20%30%40%50%60%70%80%90%
100%
Rejected based on astandardized screening
process
In-depth review
25%
76%
Average Percentage of Applicants Rejected and Reviewed
0
2
4
6
8
10
12
14
16
Number of applicationsreceived
Number of interviewinvitations sent
Number of applicantsinterviewed
15
87
Average Number of Positions, Applications Received, InterviewInvitations Sent, and Applicants Interviewed and Ranked
N=24N=24N=26N=25
N=26
42% of Pediatric Infectious Diseases programs consider all applicant groups
N=25
0%10%20%30%40%50%60%70%80%90%
100%
Prev. Grad Osteo Pathway Canadian US IMG Non-USIMG
8%
68%
35%
8%19%4%
58%
32%
50%
65%62%
88%
42%
15%27% 19%
Often Seldom Never
Interview
0%10%
20%
30%40%
50%60%
70%80%
90%100%
Prev. Grad Osteo Pathway Canadian US IMG Non-USIMG
8% 8%
68%
31%
8%23%8%
54%
32%
46%
58%
58%85%
38%23%
35%19%
Often Seldom Never
Ranking
n=26
Frequency of Programs Interviewing and Ranking Candidates
n=26
N=23
0%10%20%30%40%50%60%70%80%90%
100%
Jan Feb Mar Apr May Jun Jul Aug Sep Oct Nov Dec
4% 0% 0% 0% 0% 0%
15%
38%29%
11%3% 0%
Interview invitations
Interview Invitations Sent and Interviews Conducted
4% 0% 0% 0% 0% 0% 1%
12%
27%34%
9% 6%
Interviews conducted
NRMP Program Director Survey, Specialties Matching Service, 2016 298

Figure-9Pediatric Infectious DiseasesPotential Challenges in Recruiting Applicants to Your Specialty
0% 20% 40% 60% 80% 100%
92%
17%
8%
0%
0%
We consider those applicants on an individual basis
We give those applicants serious consideration if they haveshown improvement
We do not usually consider those applicants
We favor those applicants
Other
0 1 2 3 4 5
Not enough applicants in the specialty
Undesirable income potential as a practicing physician
Undesirable work/life balance as a practicing physician
Long or irregular work hours required by specialty
Fellowship Match scheduled at inconvenient time of year
4.8
4.7
2.7
2.0
1.6
Average rating on a scale of 5 (1=least challenging; 5=most challenging)
n=24
17.9%Less than 3
25.0%3 to 5
35.7%6 to 10
3.6%11 to
15
17.9%More than 15
At Any Fellowship Program
18.5%Less than 3
25.9%3 to 5
37.0%6 to 10
3.7%11 to 15
14.8%More than
15
At Current Fellowship Program
n=24
n=28 n=27
Pediatric Infectious DiseasesApplicants Who Applied in the Specialty in the Past But Did Not Match Figure-10
Pediatric Infectious DiseasesYears as Program Director Figure-11
NRMP Program Director Survey, Specialties Matching Service, 2016 299

Pediatric Nephrology
NRMP Program Director Survey, Specialties Matching Service, 2016 300

Pediatric NephrologyGeneral Information
Table 1
41
62
28
Number of programs in the Match
Number of positions in the Match
Number of applicants ranking specialty
41.5%Response rate
Appointment Years
Number of responses 17
Match Information*
* Source: NRMP Data Warehouse
2016 Survey
2016 2015 2014
39
58
23
42
61
37
NRMP Program Director Survey, Specialties Matching Service, 2016 301
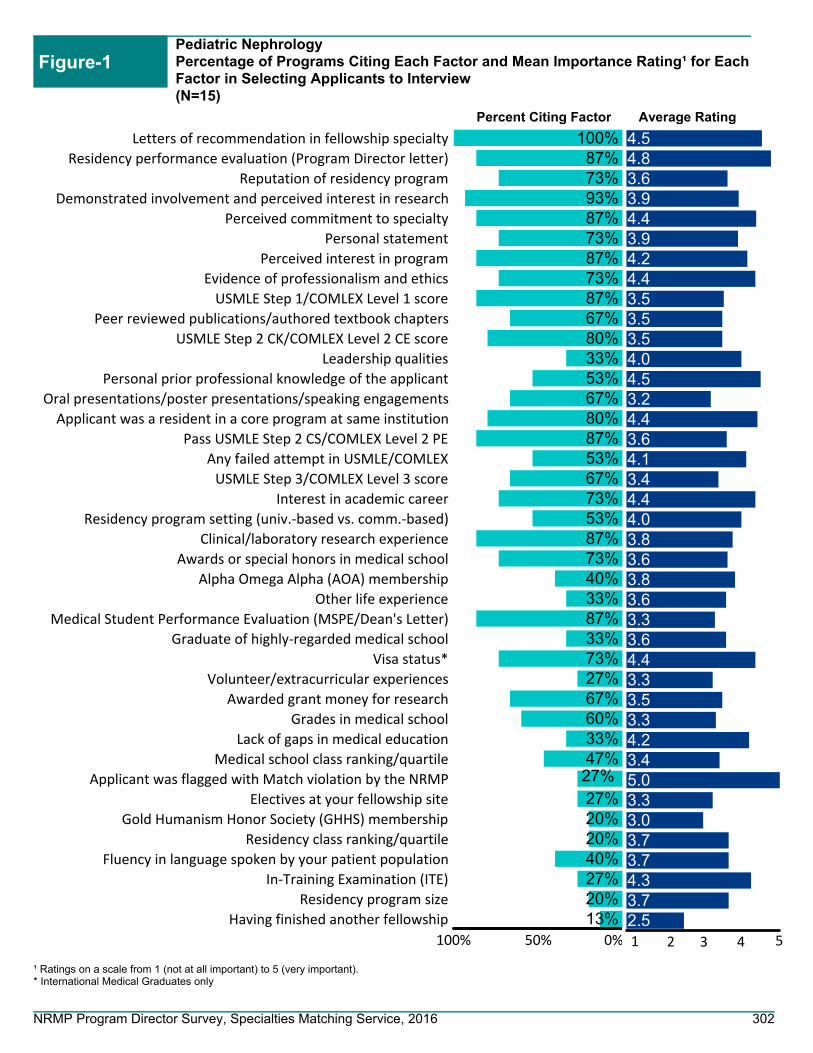
Figure-1Pediatric NephrologyPercentage of Programs Citing Each Factor and Mean Importance Rating¹ for Each Factor in Selecting Applicants to Interview(N=15)
Average RatingPercent Citing Factor
¹ Ratings on a scale from 1 (not at all important) to 5 (very important).* International Medical Graduates only
1 2 3 4 5
4.54.83.63.94.43.94.24.43.53.53.54.04.53.24.43.64.13.44.44.03.83.63.83.63.33.64.43.33.53.34.23.45.03.33.03.73.74.33.72.5
100% 50% 0%
100%87%73%93%87%73%87%73%87%67%80%33%53%67%80%87%53%67%73%53%87%73%40%33%87%33%73%27%67%60%33%47%27%27%20%20%40%27%20%13%
Letters of recommendation in fellowship specialty
Residency performance evaluation (Program Director letter)
Reputation of residency program
Demonstrated involvement and perceived interest in research
Perceived commitment to specialty
Personal statement
Perceived interest in program
Evidence of professionalism and ethics
USMLE Step 1/COMLEX Level 1 score
Peer reviewed publications/authored textbook chapters
USMLE Step 2 CK/COMLEX Level 2 CE score
Leadership qualities
Personal prior professional knowledge of the applicant
Oral presentations/poster presentations/speaking engagements
Applicant was a resident in a core program at same institution
Pass USMLE Step 2 CS/COMLEX Level 2 PE
Any failed attempt in USMLE/COMLEX
USMLE Step 3/COMLEX Level 3 score
Interest in academic career
Residency program setting (univ.‐based vs. comm.‐based)
Clinical/laboratory research experience
Awards or special honors in medical school
Alpha Omega Alpha (AOA) membership
Other life experience
Medical Student Performance Evaluation (MSPE/Dean's Letter)
Graduate of highly‐regarded medical school
Visa status*
Volunteer/extracurricular experiences
Awarded grant money for research
Grades in medical school
Lack of gaps in medical education
Medical school class ranking/quartile
Applicant was flagged with Match violation by the NRMP
Electives at your fellowship site
Gold Humanism Honor Society (GHHS) membership
Residency class ranking/quartile
Fluency in language spoken by your patient population
In‐Training Examination (ITE)
Residency program size
Having finished another fellowship
NRMP Program Director Survey, Specialties Matching Service, 2016 302

Pediatric NephrologyPercentage of Programs Citing Each Factor and Mean Importance Rating¹ for Each Factor in Ranking Applicants(N=15)
Figure-2
Average RatingPercent Citing Factor
¹ Ratings on a scale from 1 (not at all important) to 5 (very important).* International Medical Graduates only
1 2 3 4 5
4.84.74.54.84.54.84.33.73.84.54.43.64.54.33.84.34.43.33.44.03.53.63.74.04.03.04.03.83.83.74.15.03.83.83.43.73.03.53.73.63.63.53.04.04.52.0
100% 50% 0%
100%100%73%87%93%73%73%87%60%67%60%47%40%20%53%67%67%27%33%33%40%73%20%33%27%20%20%33%40%40%60%20%33%40%53%20%20%27%20%33%33%13%13%20%13%7%
Interactions with faculty during interview and visitInterpersonal skills
Letters of recommendation in fellowship specialtyInteractions with house staff during interview and visit
Perceived commitment to specialtyFeedback from current residents and fellows
Perceived interest in programDemonstrated involvement and perceived interest in research
Reputation of residency programResidency performance evaluation (Program Director letter)
Evidence of professionalism and ethicsPersonal statement
Personal prior professional knowledge of the applicantLeadership qualities
Peer reviewed publications/authored textbook chaptersInterest in academic career
Applicant was a resident in a core program at same institutionUSMLE Step 1/COMLEX Level 1 score
USMLE Step 2 CK/COMLEX Level 2 CE scoreAny failed attempt in USMLE/COMLEX
Passing USMLE Step 2 CS/COMLEX Level 2 PEClinical/laboratory research experience
USMLE Step 3/COMLEX Level 3 scoreOral presentations/poster presentations/speaking engagements
Residency program setting (univ.‐based vs. comm.‐based)Alpha Omega Alpha (AOA) membership
Other life experienceMedical Student Performance Evaluation (MSPE/Dean's Letter)
Second interview/visitAwards or special honors in medical school
Visa status*Applicant was flagged with Match violation by the NRMP
Graduate of highly‐regarded medical schoolElectives at your fellowship site
Awarded grant money for researchVolunteer/extracurricular experiencesMedical school class ranking/quartile
Lack of gaps in medical educationGrades in medical school
Residency class ranking/quartileFluency in language spoken by your patient population
Gold Humanism Honor Society (GHHS) membershipResidency program size
In‐Training Examination (ITE)Second interview/visit
Having finished another fellowship
NRMP Program Director Survey, Specialties Matching Service, 2016 303

Pediatric NephrologyPrograms That Use USMLE Step 1 and Step 2 Clinical Knowledge (CK) Scores When Considering Which Applicants to Interview
Figure-3
Percentage of Programs That Use USMLE Step 2 (CK) Score
0%
10%
20%
30%
40%
50%
60%
70%
80%
90%
100%
Never Seldom Often
20%
67%
13%
Would your program consider applicants who fail theexam on the first attempt?
0%
10%
20%
30%
40%
50%
60%
70%
80%
90%
100%
Never Seldom often
20%
67%
13%
Would your program consider applicants who failthe exam on the first attempt?
0%
10%
20%
30%
40%
50%
60%
70%
80%
90%
100%
Yes, pass only Yes, target score No
87%
13%
0%
Scores required?
0%
10%
20%
30%
40%
50%
60%
70%
80%
90%
100%
Yes, pass only Yes, target score No
87%
13%
0%
Scores required?
N=15
N=15
N=15N=15
IQR* of Average USMLE Step 1 and Step 2 CK Scores Programs Consider When Granting Interviews
Percentage of Programs That Use USMLE Step 1 Score
*The boxes in the boxplots represent the interquartile range (or IQR, which is the range between the 25th and 75th percentiles), and the line in the box is the median. The x-shaped symbol is the mean.
Scores Above Which Programs Almost Always Grant Interviews
Scores Below Which Programs Generally Do Not Grant Interviews
USMLE Step 2 CK not reported
because of low response rate
USMLE Step 1 not reported because of low response
rate
USMLE Step 2 CK not reported
because of low response rate
USMLE Step 1 not reported because of low response
rate
NRMP Program Director Survey, Specialties Matching Service, 2016 304

0%
10%
20%
30%
40%
50%
60%
70%
80%
90%
100%
Yes No
100%
0%
USMLE Step 2 CS
0%
10%
20%
30%
40%
50%
60%
70%
80%
90%
100%
Yes, pass only Yes, target score No
80%
7%13%
USMLE Step 3
0%
10%
20%
30%
40%
50%
60%
70%
80%
90%
100%
Yes, pass only Yes, target score No
75%
0%
25%
COMLEX-USA Level 1*
Pediatric NephrologyPercentage of Programs That Use USMLE Step 2 Clinical Skill (CS), Step 3, and COMLEX-USA Scores* When Considering Which Applicants to Interview
Figure-4
0%
10%
20%
30%
40%
50%
60%
70%
80%
90%
100%
Yes, pass only Yes, target score No
75%
0%
25%
COMLEX-USA Level 2-CE*
0%
10%
20%
30%
40%
50%
60%
70%
80%
90%
100%
Yes, pass only Yes, target score No
75%
0%
25%
COMLEX-USA Level 3*
0%
10%
20%
30%
40%
50%
60%
70%
80%
90%
100%
Yes, pass only Yes, target score No
75%
0%
25%
COMLEX-USA Level 2-PE*
N=15 N=15
N=8 N=8
N=8 N=8
* Osteopathic applicants only
Percentage of Programs That Use USMLE Step 2 CS and Step 3 Scores
Percentage of Programs That Use COMLEX-USA Level 1 and Level 2-CE Scores
Percentage of Programs That Use COMLEX-USA Level 2-PE and Level 3 Scores
NRMP Program Director Survey, Specialties Matching Service, 2016 305

0%10%20%30%40%50%60%70%80%90%
100%
Never Seldom Often
17%
50%
33%
Would your program consider applicants who fail theexam on the first attempt?
0%
10%
20%
30%
40%
50%
60%
70%
80%
90%
100%
Yes, pass only Yes, target score No, not required
0% 0%
100%
Scores required?
N=6
N=7
100.0%Required
Program Requirement on Dedicated Time forResearch
N=17
0
4
8
12
16
20
24
Accredited Locally Funded Integrated Other
2021
18 18
Average Number of Months if Research Time isRequired
N=15 N=2 N=1 N=1
0.0
0.4
0.8
1.2
1.6
2.0
2.4
2.8
3.2
Accredited Positions Funded Positions
2.8 2.9
Average Number of Accredited Positions and Funded Positions
0%
10%
20%
30%
40%
50%
60%
70%
80%
90%
100%
Positions Filled BeforeMatch Day
Positions Offered Outsidethe Match
Positions Filled Outsidethe Match
54%
75% 75%
Average Percentage of Accredited Positions Offered Outside ofthe Match
N=17 N=16 N=3 N=4 N=4
Pediatric NephrologyPrograms That Use Core Specialty Certifying Examination When Considering Applicants for Interview
Figure-5
Pediatric NephrologyPrograms Positions Figure-6
Pediatric NephrologyDedicated Time for Research Figure-7
NRMP Program Director Survey, Specialties Matching Service, 2016 306

0%
10%
20%
30%
40%
50%
60%
70%
80%
90%
100%100%
93%
80%
40%
87%
67%
U.S. Graduate OsteopathicPhysician
Canadian Fifth Pathway U.S. IMG Non-U.S. IMG
Percentage of Programs that Typically Interview and Rank Each Applicant Type
Figure-8Pediatric NephrologyProgram's Interview Activities
0%10%20%30%40%50%60%70%80%90%
100%
Rejected based on astandardized screening
process
In-depth review
12%
91%
Average Percentage of Applicants Rejected and Reviewed
0
2
4
6
8
10
12
Number of applicationsreceived
Number of interviewinvitations sent
Number of applicantsinterviewed
10
8
6
Average Number of Positions, Applications Received, InterviewInvitations Sent, and Applicants Interviewed and Ranked
N=16N=16N=17N=16
N=15
40% of Pediatric Nephrology programs consider all applicant groups
N=17
0%10%20%30%40%50%60%70%80%90%
100%
Prev. Grad Osteo Pathway Canadian US IMG Non-USIMG
71%
14% 7%20%13%
60%
29%
71%
50% 20%
87%
40%
14%
43%60%
Often Seldom Never
Interview
0%10%
20%
30%40%
50%60%
70%80%
90%100%
Prev. Grad Osteo Pathway Canadian US IMG Non-USIMG
7%
71%
14% 7%20%
7%
33%
29%
64%
36%27%
93%
60%
21%
57% 53%
Often Seldom Never
Ranking
n=15
Frequency of Programs Interviewing and Ranking Candidates
n=15
N=11
0%10%20%30%40%50%60%70%80%90%
100%
Jan Feb Mar Apr May Jun Jul Aug Sep Oct Nov Dec
0% 0% 0% 0% 0% 0%
35% 35%
13% 10% 6% 3%
Interview invitations
Interview Invitations Sent and Interviews Conducted
0% 0% 0% 0% 0% 0% 1%12%
29%36%
11%4%
Interviews conducted
NRMP Program Director Survey, Specialties Matching Service, 2016 307

Figure-9Pediatric NephrologyPotential Challenges in Recruiting Applicants to Your Specialty
0% 10% 20% 30% 40% 50% 60%
60%
33%
20%
0%
0%
We consider those applicants on an individual basis
We give those applicants serious consideration if they haveshown improvement
We do not usually consider those applicants
We favor those applicants
Other
0 1 2 3 4 5
Not enough applicants in the specialty
Undesirable income potential as a practicing physician
Undesirable work/life balance as a practicing physician
Long or irregular work hours required by specialty
Fellowship Match scheduled at inconvenient time of year
4.9
3.8
3.9
3.6
1.9
Average rating on a scale of 5 (1=least challenging; 5=most challenging)
n=15
20.0%Less than 3
60.0%3 to 5
6.7%6 to10
13.3%11 to 15
At Any Fellowship Program
14.3%Less than 3
64.3%3 to 5
14.3%6 to 10
7.1%11 to 15
At Current Fellowship Program
n=15
n=15 n=14
Pediatric NephrologyApplicants Who Applied in the Specialty in the Past But Did Not Match Figure-10
Pediatric NephrologyYears as Program Director Figure-11
NRMP Program Director Survey, Specialties Matching Service, 2016 308

Pediatric Pulmonology
NRMP Program Director Survey, Specialties Matching Service, 2016 309

Pediatric PulmonologyGeneral Information
Table 1
47
66
44
Number of programs in the Match
Number of positions in the Match
Number of applicants ranking specialty
43.5%Response rate
Appointment Years
Number of responses 20
Match Information*
* Source: NRMP Data Warehouse
2016 Survey
2016 2015 2014
43
61
33
41
56
32
NRMP Program Director Survey, Specialties Matching Service, 2016 310

Figure-1Pediatric PulmonologyPercentage of Programs Citing Each Factor and Mean Importance Rating¹ for Each Factor in Selecting Applicants to Interview(N=14)
Average RatingPercent Citing Factor
¹ Ratings on a scale from 1 (not at all important) to 5 (very important).* International Medical Graduates only
1 2 3 4 5
4.54.53.83.84.84.54.74.53.83.33.93.94.03.54.14.54.44.04.53.93.53.33.53.43.84.04.13.63.43.43.33.34.23.43.73.33.04.03.02.3
100% 50% 0%
100%100%100%100%
93%86%93%71%64%86%64%86%79%79%86%79%57%57%86%64%79%71%50%64%64%57%50%57%57%50%29%50%36%71%43%21%36%
7%43%21%
Letters of recommendation in fellowship specialty
Residency performance evaluation (Program Director letter)
Reputation of residency program
Demonstrated involvement and perceived interest in research
Perceived commitment to specialty
Personal statement
Perceived interest in program
Evidence of professionalism and ethics
USMLE Step 1/COMLEX Level 1 score
Peer reviewed publications/authored textbook chapters
USMLE Step 2 CK/COMLEX Level 2 CE score
Leadership qualities
Personal prior professional knowledge of the applicant
Oral presentations/poster presentations/speaking engagements
Applicant was a resident in a core program at same institution
Pass USMLE Step 2 CS/COMLEX Level 2 PE
Any failed attempt in USMLE/COMLEX
USMLE Step 3/COMLEX Level 3 score
Interest in academic career
Residency program setting (univ.‐based vs. comm.‐based)
Clinical/laboratory research experience
Awards or special honors in medical school
Alpha Omega Alpha (AOA) membership
Other life experience
Medical Student Performance Evaluation (MSPE/Dean's Letter)
Graduate of highly‐regarded medical school
Visa status*
Volunteer/extracurricular experiences
Awarded grant money for research
Grades in medical school
Lack of gaps in medical education
Medical school class ranking/quartile
Applicant was flagged with Match violation by the NRMP
Electives at your fellowship site
Gold Humanism Honor Society (GHHS) membership
Residency class ranking/quartile
Fluency in language spoken by your patient population
In‐Training Examination (ITE)
Residency program size
Having finished another fellowship
NRMP Program Director Survey, Specialties Matching Service, 2016 311
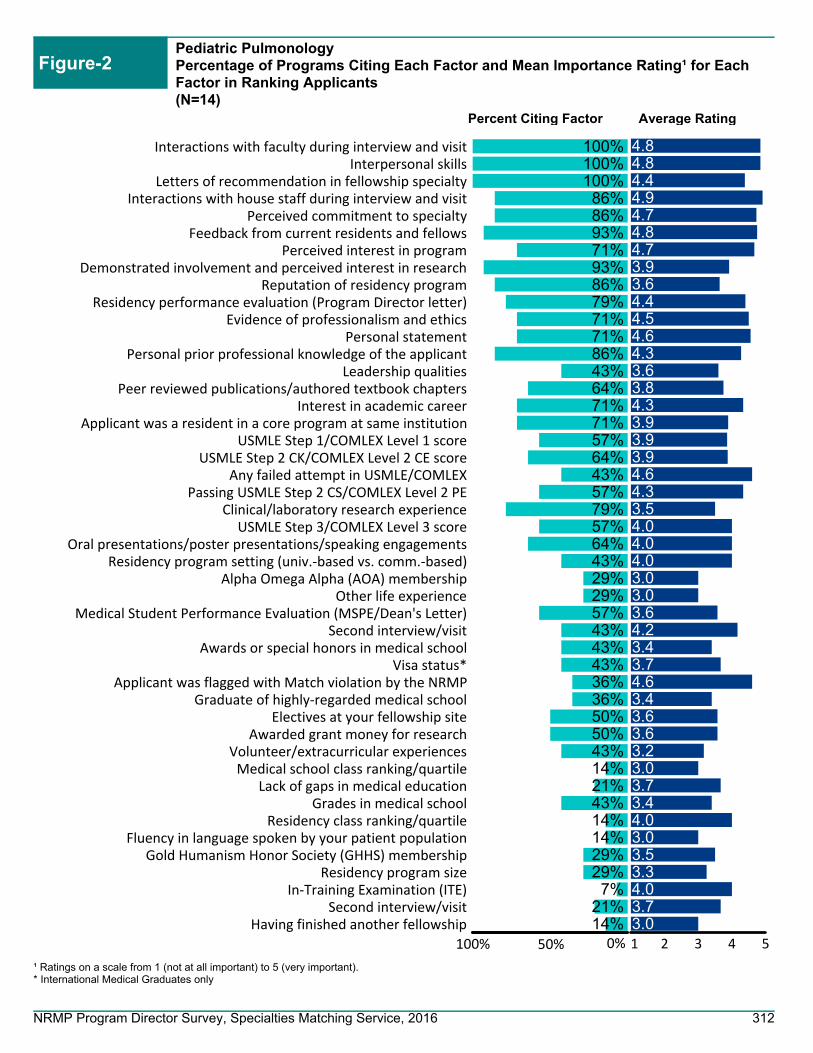
Pediatric PulmonologyPercentage of Programs Citing Each Factor and Mean Importance Rating¹ for Each Factor in Ranking Applicants(N=14)
Figure-2
Average RatingPercent Citing Factor
¹ Ratings on a scale from 1 (not at all important) to 5 (very important).* International Medical Graduates only
1 2 3 4 5
4.84.84.44.94.74.84.73.93.64.44.54.64.33.63.84.33.93.93.94.64.33.54.04.04.03.03.03.64.23.43.74.63.43.63.63.23.03.73.44.03.03.53.34.03.73.0
100% 50% 0%
100%100%100%86%86%93%71%93%86%79%71%71%86%43%64%71%71%57%64%43%57%79%57%64%43%29%29%57%43%43%43%36%36%50%50%43%14%21%43%14%14%29%29%7%
21%14%
Interactions with faculty during interview and visitInterpersonal skills
Letters of recommendation in fellowship specialtyInteractions with house staff during interview and visit
Perceived commitment to specialtyFeedback from current residents and fellows
Perceived interest in programDemonstrated involvement and perceived interest in research
Reputation of residency programResidency performance evaluation (Program Director letter)
Evidence of professionalism and ethicsPersonal statement
Personal prior professional knowledge of the applicantLeadership qualities
Peer reviewed publications/authored textbook chaptersInterest in academic career
Applicant was a resident in a core program at same institutionUSMLE Step 1/COMLEX Level 1 score
USMLE Step 2 CK/COMLEX Level 2 CE scoreAny failed attempt in USMLE/COMLEX
Passing USMLE Step 2 CS/COMLEX Level 2 PEClinical/laboratory research experience
USMLE Step 3/COMLEX Level 3 scoreOral presentations/poster presentations/speaking engagements
Residency program setting (univ.‐based vs. comm.‐based)Alpha Omega Alpha (AOA) membership
Other life experienceMedical Student Performance Evaluation (MSPE/Dean's Letter)
Second interview/visitAwards or special honors in medical school
Visa status*Applicant was flagged with Match violation by the NRMP
Graduate of highly‐regarded medical schoolElectives at your fellowship site
Awarded grant money for researchVolunteer/extracurricular experiencesMedical school class ranking/quartile
Lack of gaps in medical educationGrades in medical school
Residency class ranking/quartileFluency in language spoken by your patient population
Gold Humanism Honor Society (GHHS) membershipResidency program size
In‐Training Examination (ITE)Second interview/visit
Having finished another fellowship
NRMP Program Director Survey, Specialties Matching Service, 2016 312

Pediatric PulmonologyPrograms That Use USMLE Step 1 and Step 2 Clinical Knowledge (CK) Scores When Considering Which Applicants to Interview
Figure-3
Percentage of Programs That Use USMLE Step 2 (CK) Score
0%
10%
20%
30%
40%
50%
60%
70%
80%
90%
100%
Never Seldom Often
0%
71%
29%
Would your program consider applicants who fail theexam on the first attempt?
0%
10%
20%
30%
40%
50%
60%
70%
80%
90%
100%
Never Seldom often
7%
86%
7%
Would your program consider applicants who failthe exam on the first attempt?
0%
10%
20%
30%
40%
50%
60%
70%
80%
90%
100%
Yes, pass only Yes, target score No
79%
21%
0%
Scores required?
0%
10%
20%
30%
40%
50%
60%
70%
80%
90%
100%
Yes, pass only Yes, target score No
79%
21%
0%
Scores required?
N=14
N=14
N=14N=14
IQR* of Average USMLE Step 1 and Step 2 CK Scores Programs Consider When Granting Interviews
Percentage of Programs That Use USMLE Step 1 Score
*The boxes in the boxplots represent the interquartile range (or IQR, which is the range between the 25th and 75th percentiles), and the line in the box is the median. The x-shaped symbol is the mean.
Scores Above Which Programs Almost Always Grant Interviews
Scores Below Which Programs Generally Do Not Grant Interviews
USMLE Step 2 CK not reported
because of low response rate
USMLE Step 1 not reported because of low response
rate
USMLE Step 2 CK not reported
because of low response rate
USMLE Step 1 not reported because of low response
rate
NRMP Program Director Survey, Specialties Matching Service, 2016 313

0%
10%
20%
30%
40%
50%
60%
70%
80%
90%
100%
Yes No
100%
0%
USMLE Step 2 CS
0%
10%
20%
30%
40%
50%
60%
70%
80%
90%
100%
Yes, pass only Yes, target score No
75%
17%
8%
USMLE Step 3
0%
10%
20%
30%
40%
50%
60%
70%
80%
90%
100%
Yes, pass only Yes, target score No
75%
25%
0%
COMLEX-USA Level 1*
Pediatric PulmonologyPercentage of Programs That Use USMLE Step 2 Clinical Skill (CS), Step 3, and COMLEX-USA Scores* When Considering Which Applicants to Interview
Figure-4
0%
10%
20%
30%
40%
50%
60%
70%
80%
90%
100%
Yes, pass only Yes, target score No
75%
25%
0%
COMLEX-USA Level 2-CE*
0%
10%
20%
30%
40%
50%
60%
70%
80%
90%
100%
Yes, pass only Yes, target score No
70%
30%
0%
COMLEX-USA Level 3*
0%
10%
20%
30%
40%
50%
60%
70%
80%
90%
100%
Yes, pass only Yes, target score No
75%
25%
0%
COMLEX-USA Level 2-PE*
N=14 N=12
N=12 N=12
N=12 N=10
* Osteopathic applicants only
Percentage of Programs That Use USMLE Step 2 CS and Step 3 Scores
Percentage of Programs That Use COMLEX-USA Level 1 and Level 2-CE Scores
Percentage of Programs That Use COMLEX-USA Level 2-PE and Level 3 Scores
NRMP Program Director Survey, Specialties Matching Service, 2016 314
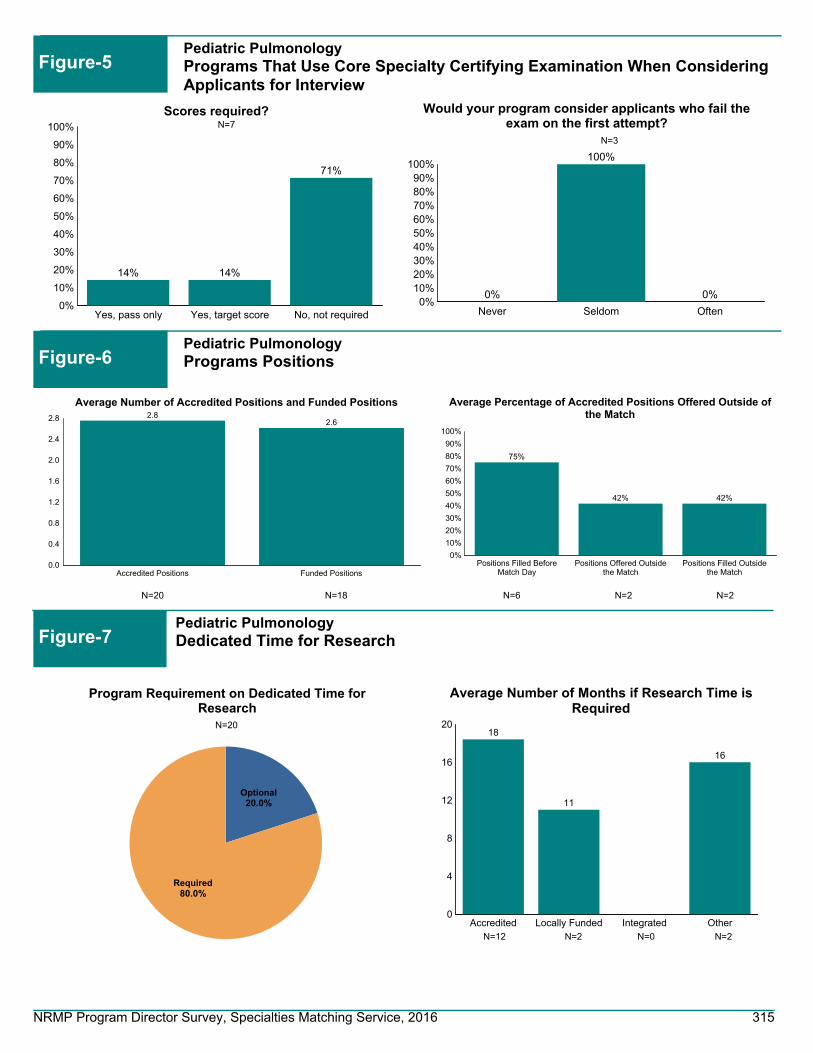
0%10%20%30%40%50%60%70%80%90%
100%
Never Seldom Often
0%
100%
0%
Would your program consider applicants who fail theexam on the first attempt?
0%
10%
20%
30%
40%
50%
60%
70%
80%
90%
100%
Yes, pass only Yes, target score No, not required
14% 14%
71%
Scores required?
N=3
N=7
20.0%Optional
80.0%Required
Program Requirement on Dedicated Time forResearch
N=20
0
4
8
12
16
20
Accredited Locally Funded Integrated Other
18
11
16
Average Number of Months if Research Time isRequired
N=12 N=2 N=0 N=2
0.0
0.4
0.8
1.2
1.6
2.0
2.4
2.8
Accredited Positions Funded Positions
2.82.6
Average Number of Accredited Positions and Funded Positions
0%
10%
20%
30%
40%
50%
60%
70%
80%
90%
100%
Positions Filled BeforeMatch Day
Positions Offered Outsidethe Match
Positions Filled Outsidethe Match
75%
42% 42%
Average Percentage of Accredited Positions Offered Outside ofthe Match
N=20 N=18 N=6 N=2 N=2
Pediatric PulmonologyPrograms That Use Core Specialty Certifying Examination When Considering Applicants for Interview
Figure-5
Pediatric PulmonologyPrograms Positions Figure-6
Pediatric PulmonologyDedicated Time for Research Figure-7
NRMP Program Director Survey, Specialties Matching Service, 2016 315

0%
10%
20%
30%
40%
50%
60%
70%
80%
90%
100% 93%86%
57%
14%
86%79%
U.S. Graduate OsteopathicPhysician
Canadian Fifth Pathway U.S. IMG Non-U.S. IMG
Percentage of Programs that Typically Interview and Rank Each Applicant Type
Figure-8Pediatric PulmonologyProgram's Interview Activities
0%10%20%30%40%50%60%70%80%90%
100%
Rejected based on astandardized screening
process
In-depth review
19%
79%
Average Percentage of Applicants Rejected and Reviewed
0
2
4
6
8
10
12
14
16
Number of applicationsreceived
Number of interviewinvitations sent
Number of applicantsinterviewed
15
109
Average Number of Positions, Applications Received, InterviewInvitations Sent, and Applicants Interviewed and Ranked
N=17N=17N=17N=17
N=14
14% of Pediatric Pulmonology programs consider all applicant groups
N=17
0%10%20%30%40%50%60%70%80%90%
100%
Prev. Grad Osteo Pathway Canadian US IMG Non-USIMG
69%
38%
15%
46%
31%
38%
69%54%
85%
54%
23% 31%46%
Often Seldom Never
Interview
0%10%
20%
30%40%
50%60%
70%80%
90%100%
Prev. Grad Osteo Pathway Canadian US IMG Non-USIMG
69%
38%
8%15%
38%
31%
46%
85%
46%
85%
62%
15% 15%
46%
Often Seldom Never
Ranking
n=13
Frequency of Programs Interviewing and Ranking Candidates
n=13
N=14
0%10%20%30%40%50%60%70%80%90%
100%
Jan Feb Mar Apr May Jun Jul Aug Sep Oct Nov Dec
49%
37%
7%2% 0% 0% 0% 0% 0% 0% 0%
7%
Interview invitations
Interview Invitations Sent and Interviews Conducted
11%
25% 27%16%
0% 0% 0% 0% 0%7%
0% 0%
Interviews conducted
NRMP Program Director Survey, Specialties Matching Service, 2016 316

Figure-9Pediatric PulmonologyPotential Challenges in Recruiting Applicants to Your Specialty
0% 20% 40% 60% 80% 100%
92%
23%
0%
8%
0%
We consider those applicants on an individual basis
We give those applicants serious consideration if they haveshown improvement
We do not usually consider those applicants
We favor those applicants
Other
0 1 2 3 4 5
Not enough applicants in the specialty
Undesirable income potential as a practicing physician
Undesirable work/life balance as a practicing physician
Long or irregular work hours required by specialty
Fellowship Match scheduled at inconvenient time of year
4.9
4.0
3.2
1.8
2.8
Average rating on a scale of 5 (1=least challenging; 5=most challenging)
n=14
29.4%Less than
3
11.8%3 to 5
29.4%6 to 10
17.6%11 to 15
11.8%More than 15
At Any Fellowship Program
35.3%Less than 3
11.8%3 to 529.4%
6 to 10
17.6%11 to 15
5.9%More than 15
At Current Fellowship Program
n=13
n=17 n=17
Pediatric PulmonologyApplicants Who Applied in the Specialty in the Past But Did Not Match Figure-10
Pediatric PulmonologyYears as Program Director Figure-11
NRMP Program Director Survey, Specialties Matching Service, 2016 317

Pediatric Rheumatology
NRMP Program Director Survey, Specialties Matching Service, 2016 318

Pediatric RheumatologyGeneral Information
Table 1
28
37
29
Number of programs in the Match
Number of positions in the Match
Number of applicants ranking specialty
35.7%Response rate
Appointment Years
Number of responses 10
Match Information*
* Source: NRMP Data Warehouse
2016 Survey
2016 2015 2014
30
40
27
29
38
30
NRMP Program Director Survey, Specialties Matching Service, 2016 319

Figure-1Pediatric RheumatologyPercentage of Programs Citing Each Factor and Mean Importance Rating¹ for Each Factor in Selecting Applicants to Interview(N=9)
Average RatingPercent Citing Factor
¹ Ratings on a scale from 1 (not at all important) to 5 (very important).* International Medical Graduates only
1 2 3 4 5
4.14.64.03.94.74.44.44.53.83.73.83.83.83.03.83.94.03.74.54.23.63.74.13.43.84.13.83.73.74.03.33.84.53.54.24.04.5
3.5
100% 50% 0%
89%100%
67%100%
78%89%89%78%
100%89%
100%67%56%78%56%
100%67%89%
100%56%
100%78%89%67%78%89%44%78%78%56%44%56%22%67%78%22%22%11%22%
0%
Letters of recommendation in fellowship specialty
Residency performance evaluation (Program Director letter)
Reputation of residency program
Demonstrated involvement and perceived interest in research
Perceived commitment to specialty
Personal statement
Perceived interest in program
Evidence of professionalism and ethics
USMLE Step 1/COMLEX Level 1 score
Peer reviewed publications/authored textbook chapters
USMLE Step 2 CK/COMLEX Level 2 CE score
Leadership qualities
Personal prior professional knowledge of the applicant
Oral presentations/poster presentations/speaking engagements
Applicant was a resident in a core program at same institution
Pass USMLE Step 2 CS/COMLEX Level 2 PE
Any failed attempt in USMLE/COMLEX
USMLE Step 3/COMLEX Level 3 score
Interest in academic career
Residency program setting (univ.‐based vs. comm.‐based)
Clinical/laboratory research experience
Awards or special honors in medical school
Alpha Omega Alpha (AOA) membership
Other life experience
Medical Student Performance Evaluation (MSPE/Dean's Letter)
Graduate of highly‐regarded medical school
Visa status*
Volunteer/extracurricular experiences
Awarded grant money for research
Grades in medical school
Lack of gaps in medical education
Medical school class ranking/quartile
Applicant was flagged with Match violation by the NRMP
Electives at your fellowship site
Gold Humanism Honor Society (GHHS) membership
Residency class ranking/quartile
Fluency in language spoken by your patient population
In‐Training Examination (ITE)
Residency program size
Having finished another fellowship
NRMP Program Director Survey, Specialties Matching Service, 2016 320

Pediatric RheumatologyPercentage of Programs Citing Each Factor and Mean Importance Rating¹ for Each Factor in Ranking Applicants(N=9)
Figure-2
Average RatingPercent Citing Factor
¹ Ratings on a scale from 1 (not at all important) to 5 (very important).* International Medical Graduates only
1 2 3 4 5
4.64.74.34.74.23.84.34.34.04.44.34.04.54.03.84.8
3.83.84.03.83.83.6
4.54.54.04.3
4.34.04.74.04.04.54.04.34.03.34.0
5.0
3.5
100% 50% 0%
100%100%86%86%86%57%86%86%71%71%43%
100%29%71%57%71%0%
86%86%29%71%57%71%0%
57%57%29%57%0%
57%29%43%57%29%29%29%43%29%43%43%0%
29%0%0%
29%0%
Interactions with faculty during interview and visitInterpersonal skills
Letters of recommendation in fellowship specialtyInteractions with house staff during interview and visit
Perceived commitment to specialtyFeedback from current residents and fellows
Perceived interest in programDemonstrated involvement and perceived interest in research
Reputation of residency programResidency performance evaluation (Program Director letter)
Evidence of professionalism and ethicsPersonal statement
Personal prior professional knowledge of the applicantLeadership qualities
Peer reviewed publications/authored textbook chaptersInterest in academic career
Applicant was a resident in a core program at same institutionUSMLE Step 1/COMLEX Level 1 score
USMLE Step 2 CK/COMLEX Level 2 CE scoreAny failed attempt in USMLE/COMLEX
Passing USMLE Step 2 CS/COMLEX Level 2 PEClinical/laboratory research experience
USMLE Step 3/COMLEX Level 3 scoreOral presentations/poster presentations/speaking engagements
Residency program setting (univ.‐based vs. comm.‐based)Alpha Omega Alpha (AOA) membership
Other life experienceMedical Student Performance Evaluation (MSPE/Dean's Letter)
Second interview/visitAwards or special honors in medical school
Visa status*Applicant was flagged with Match violation by the NRMP
Graduate of highly‐regarded medical schoolElectives at your fellowship site
Awarded grant money for researchVolunteer/extracurricular experiencesMedical school class ranking/quartile
Lack of gaps in medical educationGrades in medical school
Residency class ranking/quartileFluency in language spoken by your patient population
Gold Humanism Honor Society (GHHS) membershipResidency program size
In‐Training Examination (ITE)Second interview/visit
Having finished another fellowship
NRMP Program Director Survey, Specialties Matching Service, 2016 321

Pediatric RheumatologyPrograms That Use USMLE Step 1 and Step 2 Clinical Knowledge (CK) Scores When Considering Which Applicants to Interview
Figure-3
Percentage of Programs That Use USMLE Step 2 (CK) Score
0%
10%
20%
30%
40%
50%
60%
70%
80%
90%
100%
Never Seldom Often
0%
88%
13%
Would your program consider applicants who fail theexam on the first attempt?
0%
10%
20%
30%
40%
50%
60%
70%
80%
90%
100%
Never Seldom often
25%
63%
13%
Would your program consider applicants who failthe exam on the first attempt?
0%
10%
20%
30%
40%
50%
60%
70%
80%
90%
100%
Yes, pass only Yes, target score No
63%
13%
25%
Scores required?
0%
10%
20%
30%
40%
50%
60%
70%
80%
90%
100%
Yes, pass only Yes, target score No
63%
13%
25%
Scores required?
N=8
N=8
N=8N=8
IQR* of Average USMLE Step 1 and Step 2 CK Scores Programs Consider When Granting Interviews
Percentage of Programs That Use USMLE Step 1 Score
*The boxes in the boxplots represent the interquartile range (or IQR, which is the range between the 25th and 75th percentiles), and the line in the box is the median. The x-shaped symbol is the mean.
Scores Above Which Programs Almost Always Grant Interviews
Scores Below Which Programs Generally Do Not Grant Interviews
USMLE Step 2 CK not reported
because of low response rate
USMLE Step 1 not reported because of low response
rate
USMLE Step 2 CK not reported
because of low response rate
USMLE Step 1 not reported because of low response
rate
NRMP Program Director Survey, Specialties Matching Service, 2016 322

0%
10%
20%
30%
40%
50%
60%
70%
80%
90%
100%
Yes No
75%
25%
USMLE Step 2 CS
0%
10%
20%
30%
40%
50%
60%
70%
80%
90%
100%
Yes, pass only Yes, target score No
50%
13%
38%
USMLE Step 3
0%
10%
20%
30%
40%
50%
60%
70%
80%
90%
100%
Yes, pass only Yes, target score No
40%
20%
40%
COMLEX-USA Level 1*
Pediatric RheumatologyPercentage of Programs That Use USMLE Step 2 Clinical Skill (CS), Step 3, and COMLEX-USA Scores* When Considering Which Applicants to Interview
Figure-4
0%
10%
20%
30%
40%
50%
60%
70%
80%
90%
100%
Yes, pass only Yes, target score No
40%
20%
40%
COMLEX-USA Level 2-CE*
0%
10%
20%
30%
40%
50%
60%
70%
80%
90%
100%
Yes, pass only Yes, target score No
40%
20%
40%
COMLEX-USA Level 3*
0%
10%
20%
30%
40%
50%
60%
70%
80%
90%
100%
Yes, pass only Yes, target score No
40%
20%
40%
COMLEX-USA Level 2-PE*
N=8 N=8
N=5 N=5
N=5 N=5
* Osteopathic applicants only
Percentage of Programs That Use USMLE Step 2 CS and Step 3 Scores
Percentage of Programs That Use COMLEX-USA Level 1 and Level 2-CE Scores
Percentage of Programs That Use COMLEX-USA Level 2-PE and Level 3 Scores
NRMP Program Director Survey, Specialties Matching Service, 2016 323

0%10%20%30%40%50%60%70%80%90%
100%
Never Seldom Often
40% 40%
20%
Would your program consider applicants who fail theexam on the first attempt?
0%
10%
20%
30%
40%
50%
60%
70%
80%
90%
100%
Yes, pass only Yes, target score No, not required
0% 0%
100%
Scores required?
N=5
N=4
10.0%Optional
90.0%Required
Program Requirement on Dedicated Time forResearch
N=10
0
4
8
12
16
20
24
Accredited Locally Funded Integrated Other
22
19
24 24
Average Number of Months if Research Time isRequired
N=5 N=4 N=1 N=1
0.0
0.5
1.0
1.5
2.0
2.5
3.0
3.5
Accredited Positions Funded Positions
3.1
2.4
Average Number of Accredited Positions and Funded Positions
0%
10%
20%
30%
40%
50%
60%
70%
80%
90%
100%
Positions Filled BeforeMatch Day
Positions Offered Outsidethe Match
Positions Filled Outsidethe Match
61%
50% 50%
Average Percentage of Accredited Positions Offered Outside ofthe Match
N=10 N=10 N=3 N=2 N=2
Pediatric RheumatologyPrograms That Use Core Specialty Certifying Examination When Considering Applicants for Interview
Figure-5
Pediatric RheumatologyPrograms Positions Figure-6
Pediatric RheumatologyDedicated Time for Research Figure-7
NRMP Program Director Survey, Specialties Matching Service, 2016 324

0%
10%
20%
30%
40%
50%
60%
70%
80%
90%
100%90%
80%
70% 70%
80% 80%
U.S. Graduate OsteopathicPhysician
Canadian Fifth Pathway U.S. IMG Non-U.S. IMG
Percentage of Programs that Typically Interview and Rank Each Applicant Type
Figure-8Pediatric RheumatologyProgram's Interview Activities
0%10%20%30%40%50%60%70%80%90%
100%
Rejected based on astandardized screening
process
In-depth review
16%
90%
Average Percentage of Applicants Rejected and Reviewed
0
2
4
6
8
10
12
Number of applicationsreceived
Number of interviewinvitations sent
Number of applicantsinterviewed
12
87
Average Number of Positions, Applications Received, InterviewInvitations Sent, and Applicants Interviewed and Ranked
N=9N=9N=10N=9
N=10
60% of Pediatric Rheumatology programs consider all applicant groups
N=10
0%10%20%30%40%50%60%70%80%90%
100%
Prev. Grad Osteo Pathway Canadian US IMG Non-USIMG
13%
43%
13%
13% 38%
57%
88%
63%75%
75%63%
38%25%
Often Seldom Never
Interview
0%10%
20%
30%40%
50%60%
70%80%
90%100%
Prev. Grad Osteo Pathway Canadian US IMG Non-USIMG
14%33%
14%14%
14%
67%86%
71% 71%
86%71%
29% 29%
Often Seldom Never
Ranking
n=7
Frequency of Programs Interviewing and Ranking Candidates
n=8
N=8
0%10%20%30%40%50%60%70%80%90%
100%
Jan Feb Mar Apr May Jun Jul Aug Sep Oct Nov Dec
13%
0% 0% 0% 0% 0% 4%
52%
23%
5% 4% 0%
Interview invitations
Interview Invitations Sent and Interviews Conducted
0% 0%11%
0% 0% 0% 0% 2%
31%40%
5%0%
Interviews conducted
NRMP Program Director Survey, Specialties Matching Service, 2016 325

Figure-9Pediatric RheumatologyPotential Challenges in Recruiting Applicants to Your Specialty
0% 10% 20% 30% 40% 50% 60%
57%
29%
29%
0%
0%
We consider those applicants on an individual basis
We give those applicants serious consideration if they haveshown improvement
We do not usually consider those applicants
We favor those applicants
Other
0 1 2 3 4 5
Not enough applicants in the specialty
Undesirable income potential as a practicing physician
Undesirable work/life balance as a practicing physician
Long or irregular work hours required by specialty
Fellowship Match scheduled at inconvenient time of year
4.8
3.7
2.0
1.7
2.0
Average rating on a scale of 5 (1=least challenging; 5=most challenging)
n=7
30.0%Less than 3
50.0%6 to 10
10.0%11 to 15
10.0%More than 15
At Any Fellowship Program
22.2%Less than 3
66.7%6 to 10
11.1%11 to 15
At Current Fellowship Program
n=7
n=10 n=9
Pediatric RheumatologyApplicants Who Applied in the Specialty in the Past But Did Not Match Figure-10
Pediatric RheumatologyYears as Program Director Figure-11
NRMP Program Director Survey, Specialties Matching Service, 2016 326

Pediatric Surgery
NRMP Program Director Survey, Specialties Matching Service, 2016 327

Pediatric SurgeryGeneral Information
Table 1
38
39
77
Number of programs in the Match
Number of positions in the Match
Number of applicants ranking specialty
32.4%Response rate
Appointment Years
Number of responses 12
Match Information*
* Source: NRMP Data Warehouse
2016 Survey
2016 2015 2014
47
48
83
37
38
71
NRMP Program Director Survey, Specialties Matching Service, 2016 328

Figure-1Pediatric SurgeryPercentage of Programs Citing Each Factor and Mean Importance Rating¹ for Each Factor in Selecting Applicants to Interview(N=11)
Average RatingPercent Citing Factor
¹ Ratings on a scale from 1 (not at all important) to 5 (very important).* International Medical Graduates only
1 2 3 4 5
4.64.84.63.43.84.23.74.83.84.43.84.44.44.13.03.84.04.04.04.34.13.33.23.63.04.33.03.34.03.5
3.05.0
2.74.04.54.13.72.3
100% 50% 0%
91%82%
100%82%55%73%27%91%64%82%64%91%82%91%36%36%45%45%36%82%82%45%73%73%
9%36%18%36%45%64%
0%18%45%
0%36%
9%27%
100%36%36%
Letters of recommendation in fellowship specialty
Residency performance evaluation (Program Director letter)
Reputation of residency program
Demonstrated involvement and perceived interest in research
Perceived commitment to specialty
Personal statement
Perceived interest in program
Evidence of professionalism and ethics
USMLE Step 1/COMLEX Level 1 score
Peer reviewed publications/authored textbook chapters
USMLE Step 2 CK/COMLEX Level 2 CE score
Leadership qualities
Personal prior professional knowledge of the applicant
Oral presentations/poster presentations/speaking engagements
Applicant was a resident in a core program at same institution
Pass USMLE Step 2 CS/COMLEX Level 2 PE
Any failed attempt in USMLE/COMLEX
USMLE Step 3/COMLEX Level 3 score
Interest in academic career
Residency program setting (univ.‐based vs. comm.‐based)
Clinical/laboratory research experience
Awards or special honors in medical school
Alpha Omega Alpha (AOA) membership
Other life experience
Medical Student Performance Evaluation (MSPE/Dean's Letter)
Graduate of highly‐regarded medical school
Visa status*
Volunteer/extracurricular experiences
Awarded grant money for research
Grades in medical school
Lack of gaps in medical education
Medical school class ranking/quartile
Applicant was flagged with Match violation by the NRMP
Electives at your fellowship site
Gold Humanism Honor Society (GHHS) membership
Residency class ranking/quartile
Fluency in language spoken by your patient population
In‐Training Examination (ITE)
Residency program size
Having finished another fellowship
NRMP Program Director Survey, Specialties Matching Service, 2016 329

Pediatric SurgeryPercentage of Programs Citing Each Factor and Mean Importance Rating¹ for Each Factor in Ranking Applicants(N=11)
Figure-2
Average RatingPercent Citing Factor
¹ Ratings on a scale from 1 (not at all important) to 5 (very important).* International Medical Graduates only
1 2 3 4 5
4.94.74.74.75.05.04.33.75.04.44.43.84.34.44.04.02.54.34.34.34.54.24.54.04.83.33.3
3.54.04.55.04.5
4.04.04.03.04.0
4.53.04.04.3
3.0100% 50% 0%
70%80%60%70%20%50%30%30%90%50%70%50%40%70%50%30%20%30%30%30%20%50%20%40%50%30%30%0%
20%20%20%20%20%0%
20%10%10%10%20%0%
20%10%10%70%0%
20%
Interactions with faculty during interview and visitInterpersonal skills
Letters of recommendation in fellowship specialtyInteractions with house staff during interview and visit
Perceived commitment to specialtyFeedback from current residents and fellows
Perceived interest in programDemonstrated involvement and perceived interest in research
Reputation of residency programResidency performance evaluation (Program Director letter)
Evidence of professionalism and ethicsPersonal statement
Personal prior professional knowledge of the applicantLeadership qualities
Peer reviewed publications/authored textbook chaptersInterest in academic career
Applicant was a resident in a core program at same institutionUSMLE Step 1/COMLEX Level 1 score
USMLE Step 2 CK/COMLEX Level 2 CE scoreAny failed attempt in USMLE/COMLEX
Passing USMLE Step 2 CS/COMLEX Level 2 PEClinical/laboratory research experience
USMLE Step 3/COMLEX Level 3 scoreOral presentations/poster presentations/speaking engagements
Residency program setting (univ.‐based vs. comm.‐based)Alpha Omega Alpha (AOA) membership
Other life experienceMedical Student Performance Evaluation (MSPE/Dean's Letter)
Second interview/visitAwards or special honors in medical school
Visa status*Applicant was flagged with Match violation by the NRMP
Graduate of highly‐regarded medical schoolElectives at your fellowship site
Awarded grant money for researchVolunteer/extracurricular experiencesMedical school class ranking/quartile
Lack of gaps in medical educationGrades in medical school
Residency class ranking/quartileFluency in language spoken by your patient population
Gold Humanism Honor Society (GHHS) membershipResidency program size
In‐Training Examination (ITE)Second interview/visit
Having finished another fellowship
NRMP Program Director Survey, Specialties Matching Service, 2016 330

Pediatric SurgeryPrograms That Use USMLE Step 1 and Step 2 Clinical Knowledge (CK) Scores When Considering Which Applicants to Interview
Figure-3
Percentage of Programs That Use USMLE Step 2 (CK) Score
0%
10%
20%
30%
40%
50%
60%
70%
80%
90%
100%
Never Seldom Often
0%
100%
0%
Would your program consider applicants who fail theexam on the first attempt?
0%
10%
20%
30%
40%
50%
60%
70%
80%
90%
100%
Never Seldom often
0%
90%
10%
Would your program consider applicants who failthe exam on the first attempt?
0%
10%
20%
30%
40%
50%
60%
70%
80%
90%
100%
Yes, pass only Yes, target score No
60%
30%
10%
Scores required?
0%
10%
20%
30%
40%
50%
60%
70%
80%
90%
100%
Yes, pass only Yes, target score No
60%
30%
10%
Scores required?
N=10
N=10
N=10N=10
IQR* of Average USMLE Step 1 and Step 2 CK Scores Programs Consider When Granting Interviews
Percentage of Programs That Use USMLE Step 1 Score
*The boxes in the boxplots represent the interquartile range (or IQR, which is the range between the 25th and 75th percentiles), and the line in the box is the median. The x-shaped symbol is the mean.
Scores Above Which Programs Almost Always Grant Interviews
Scores Below Which Programs Generally Do Not Grant Interviews
USMLE Step 2 CK not reported
because of low response rate
USMLE Step 1 not reported because of low response
rate
USMLE Step 2 CK not reported
because of low response rate
USMLE Step 1 not reported because of low response
rate
NRMP Program Director Survey, Specialties Matching Service, 2016 331

0%
10%
20%
30%
40%
50%
60%
70%
80%
90%
100%
Yes No
90%
10%
USMLE Step 2 CS
0%
10%
20%
30%
40%
50%
60%
70%
80%
90%
100%
Yes, pass only Yes, target score No
78%
11% 11%
USMLE Step 3
Pediatric SurgeryPercentage of Programs That Use USMLE Step 2 Clinical Skill (CS), Step 3, and COMLEX-USA Scores* When Considering Which Applicants to Interview
Figure-4
N=10 N=9
* Osteopathic applicants only
Percentage of Programs That Use USMLE Step 2 CS and Step 3 Scores
Percentage of Programs That Use COMLEX-USA Level 1 and Level 2-CE Scores
Percentage of Programs That Use COMLEX-USA Level 2-PE and Level 3 Scores
Not reported because of low response rate
Not reported because of low response rate
Not reported because of low response rate
Not reported because of low response rate
NRMP Program Director Survey, Specialties Matching Service, 2016 332

0%10%20%30%40%50%60%70%80%90%
100%
Never Seldom Often
25%
75%
0%
Would your program consider applicants who fail theexam on the first attempt?
0%
10%
20%
30%
40%
50%
60%
70%
80%
90%
100%
Yes, pass only Yes, target score No, not required
0%
25%
75%
Scores required?
N=4
N=4
100.0%Optional
Program Requirement on Dedicated Time forResearch
N=12
-6
-4
-2
0
2
4
6
Accredited Locally Funded Integrated Other
Average Number of Months if Research Time isRequired
N=0 N=0 N=0 N=0
0.0
0.2
0.4
0.6
0.8
1.0
1.2
Accredited Positions Funded Positions
1.2 1.2
Average Number of Accredited Positions and Funded Positions
0%
10%
20%
30%
40%
50%
60%
70%
80%
90%
100%
Positions Filled BeforeMatch Day
Positions Offered Outsidethe Match
Positions Filled Outsidethe Match
100% 100% 100%
Average Percentage of Accredited Positions Offered Outside ofthe Match
N=12 N=12 N=1 N=1 N=1
Pediatric SurgeryPrograms That Use Core Specialty Certifying Examination When Considering Applicants for Interview
Figure-5
Pediatric SurgeryPrograms Positions Figure-6
Pediatric SurgeryDedicated Time for Research Figure-7
NRMP Program Director Survey, Specialties Matching Service, 2016 333

0%
10%
20%
30%
40%
50%
60%
70%
80%
90%
100%100%
33%
50%
25%33%
25%
U.S. Graduate OsteopathicPhysician
Canadian Fifth Pathway U.S. IMG Non-U.S. IMG
Percentage of Programs that Typically Interview and Rank Each Applicant Type
Figure-8Pediatric SurgeryProgram's Interview Activities
0%10%20%30%40%50%60%70%80%90%
100%
Rejected based on astandardized screening
process
In-depth review
47%
83%
Average Percentage of Applicants Rejected and Reviewed
0
10
20
30
40
50
60
70
80
90
Number of applicationsreceived
Number of interviewinvitations sent
Number of applicantsinterviewed
80
27 26
Average Number of Positions, Applications Received, InterviewInvitations Sent, and Applicants Interviewed and Ranked
N=11N=10N=11N=11
N=12
25% of Pediatric Surgery programs consider all applicant groups
N=11
0%10%20%30%40%50%60%70%80%90%
100%
Prev. Grad Osteo Pathway Canadian US IMG Non-USIMG
18%
55%
18%
73%
45%
64%
100%73%
100%
9%
36%
9%
Often Seldom Never
Interview
0%10%
20%
30%40%
50%60%
70%80%
90%100%
Prev. Grad Osteo Pathway Canadian US IMG Non-USIMG
45%55%
9% 9%27%
55%45%
55%
91%73%
100%
36%
Often Seldom Never
Ranking
n=10
Frequency of Programs Interviewing and Ranking Candidates
n=11
N=10
0%10%20%30%40%50%60%70%80%90%
100%
Jan Feb Mar Apr May Jun Jul Aug Sep Oct Nov Dec
78%
4%9% 9%
0% 0% 0% 0% 0% 0% 0% 0%
Interview invitations
Interview Invitations Sent and Interviews Conducted
8%
26%34%
14%
0% 0% 0% 0% 0% 0% 0% 0%
Interviews conducted
NRMP Program Director Survey, Specialties Matching Service, 2016 334

Figure-9Pediatric SurgeryPotential Challenges in Recruiting Applicants to Your Specialty
0% 20% 40% 60% 80% 100%
90%
40%
0%
0%
0%
We consider those applicants on an individual basis
We give those applicants serious consideration if they haveshown improvement
We do not usually consider those applicants
We favor those applicants
Other
0 1 2 3 4 5
Not enough applicants in the specialty
Undesirable income potential as a practicing physician
Undesirable work/life balance as a practicing physician
Long or irregular work hours required by specialty
Fellowship Match scheduled at inconvenient time of year
1.4
1.7
2.6
2.8
1.8
Average rating on a scale of 5 (1=least challenging; 5=most challenging)
n=9
37.5%Less than 3
25.0%3 to 5
25.0%6 to 10
12.5%More than 15
At Any Fellowship Program
37.5%Less than 3
37.5%3 to 5
12.5%6 to 10
12.5%More than 15
At Current Fellowship Program
n=10
n=8 n=8
Pediatric SurgeryApplicants Who Applied in the Specialty in the Past But Did Not Match Figure-10
Pediatric SurgeryYears as Program Director Figure-11
NRMP Program Director Survey, Specialties Matching Service, 2016 335

Psychosomatic Medicine
NRMP Program Director Survey, Specialties Matching Service, 2016 336

Psychosomatic MedicineGeneral Information
Table 1
51
101
80
Number of programs in the Match
Number of positions in the Match
Number of applicants ranking specialty
34.0%Response rate
Appointment Years
Number of responses 17
Match Information*
* Source: NRMP Data Warehouse
2016 Survey
2016 2015 2014
50
93
68
51
95
73
NRMP Program Director Survey, Specialties Matching Service, 2016 337
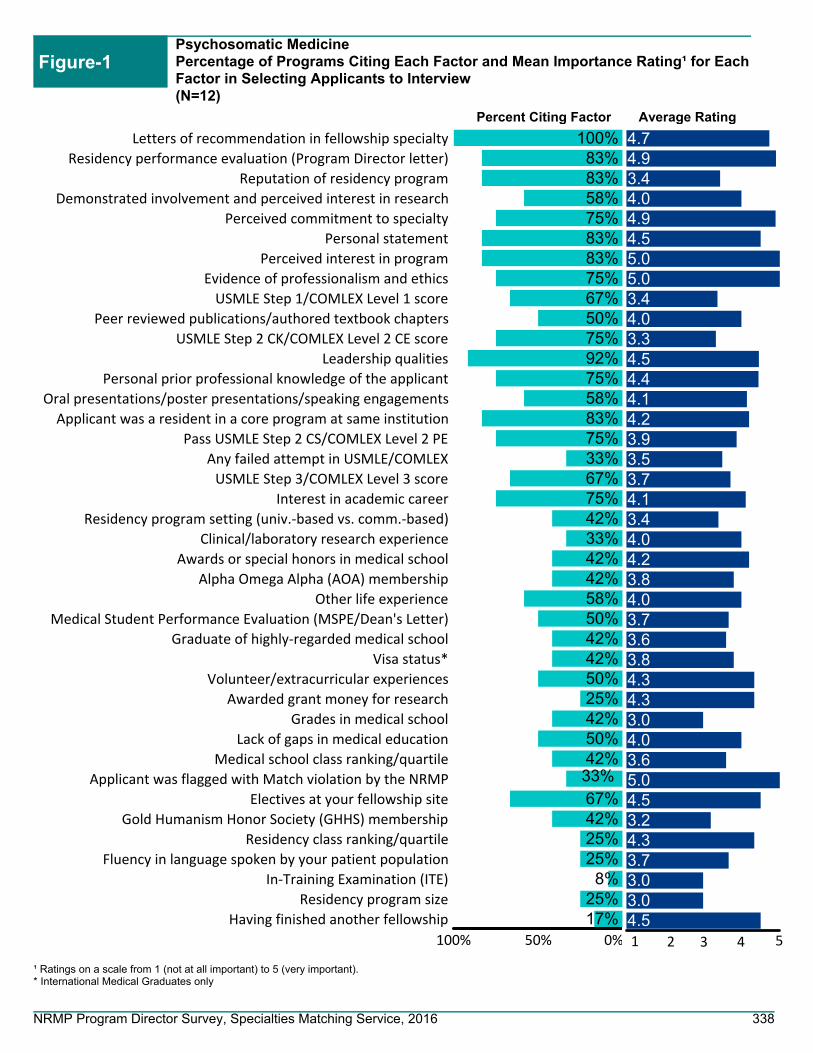
Figure-1Psychosomatic MedicinePercentage of Programs Citing Each Factor and Mean Importance Rating¹ for Each Factor in Selecting Applicants to Interview(N=12)
Average RatingPercent Citing Factor
¹ Ratings on a scale from 1 (not at all important) to 5 (very important).* International Medical Graduates only
1 2 3 4 5
4.74.93.44.04.94.55.05.03.44.03.34.54.44.14.23.93.53.74.13.44.04.23.84.03.73.63.84.34.33.04.03.65.04.53.24.33.73.03.04.5
100% 50% 0%
100%83%83%58%75%83%83%75%67%50%75%92%75%58%83%75%33%67%75%42%33%42%42%58%50%42%42%50%25%42%50%42%33%67%42%25%25%
8%25%17%
Letters of recommendation in fellowship specialty
Residency performance evaluation (Program Director letter)
Reputation of residency program
Demonstrated involvement and perceived interest in research
Perceived commitment to specialty
Personal statement
Perceived interest in program
Evidence of professionalism and ethics
USMLE Step 1/COMLEX Level 1 score
Peer reviewed publications/authored textbook chapters
USMLE Step 2 CK/COMLEX Level 2 CE score
Leadership qualities
Personal prior professional knowledge of the applicant
Oral presentations/poster presentations/speaking engagements
Applicant was a resident in a core program at same institution
Pass USMLE Step 2 CS/COMLEX Level 2 PE
Any failed attempt in USMLE/COMLEX
USMLE Step 3/COMLEX Level 3 score
Interest in academic career
Residency program setting (univ.‐based vs. comm.‐based)
Clinical/laboratory research experience
Awards or special honors in medical school
Alpha Omega Alpha (AOA) membership
Other life experience
Medical Student Performance Evaluation (MSPE/Dean's Letter)
Graduate of highly‐regarded medical school
Visa status*
Volunteer/extracurricular experiences
Awarded grant money for research
Grades in medical school
Lack of gaps in medical education
Medical school class ranking/quartile
Applicant was flagged with Match violation by the NRMP
Electives at your fellowship site
Gold Humanism Honor Society (GHHS) membership
Residency class ranking/quartile
Fluency in language spoken by your patient population
In‐Training Examination (ITE)
Residency program size
Having finished another fellowship
NRMP Program Director Survey, Specialties Matching Service, 2016 338

Psychosomatic MedicinePercentage of Programs Citing Each Factor and Mean Importance Rating¹ for Each Factor in Ranking Applicants(N=12)
Figure-2
Average RatingPercent Citing Factor
¹ Ratings on a scale from 1 (not at all important) to 5 (very important).* International Medical Graduates only
1 2 3 4 5
4.95.04.74.94.74.94.54.33.54.74.94.44.64.64.44.44.23.73.73.34.03.83.84.23.54.04.54.24.54.23.05.04.04.84.34.44.04.84.03.84.03.75.03.04.84.0
100% 50% 0%
92%92%
100%92%92%83%83%58%58%75%83%92%75%83%42%67%83%58%58%33%58%42%58%50%17%42%50%50%50%42%17%33%42%33%25%58%42%33%42%42%25%25%8%
17%42%25%
Interactions with faculty during interview and visitInterpersonal skills
Letters of recommendation in fellowship specialtyInteractions with house staff during interview and visit
Perceived commitment to specialtyFeedback from current residents and fellows
Perceived interest in programDemonstrated involvement and perceived interest in research
Reputation of residency programResidency performance evaluation (Program Director letter)
Evidence of professionalism and ethicsPersonal statement
Personal prior professional knowledge of the applicantLeadership qualities
Peer reviewed publications/authored textbook chaptersInterest in academic career
Applicant was a resident in a core program at same institutionUSMLE Step 1/COMLEX Level 1 score
USMLE Step 2 CK/COMLEX Level 2 CE scoreAny failed attempt in USMLE/COMLEX
Passing USMLE Step 2 CS/COMLEX Level 2 PEClinical/laboratory research experience
USMLE Step 3/COMLEX Level 3 scoreOral presentations/poster presentations/speaking engagements
Residency program setting (univ.‐based vs. comm.‐based)Alpha Omega Alpha (AOA) membership
Other life experienceMedical Student Performance Evaluation (MSPE/Dean's Letter)
Second interview/visitAwards or special honors in medical school
Visa status*Applicant was flagged with Match violation by the NRMP
Graduate of highly‐regarded medical schoolElectives at your fellowship site
Awarded grant money for researchVolunteer/extracurricular experiencesMedical school class ranking/quartile
Lack of gaps in medical educationGrades in medical school
Residency class ranking/quartileFluency in language spoken by your patient population
Gold Humanism Honor Society (GHHS) membershipResidency program size
In‐Training Examination (ITE)Second interview/visit
Having finished another fellowship
NRMP Program Director Survey, Specialties Matching Service, 2016 339
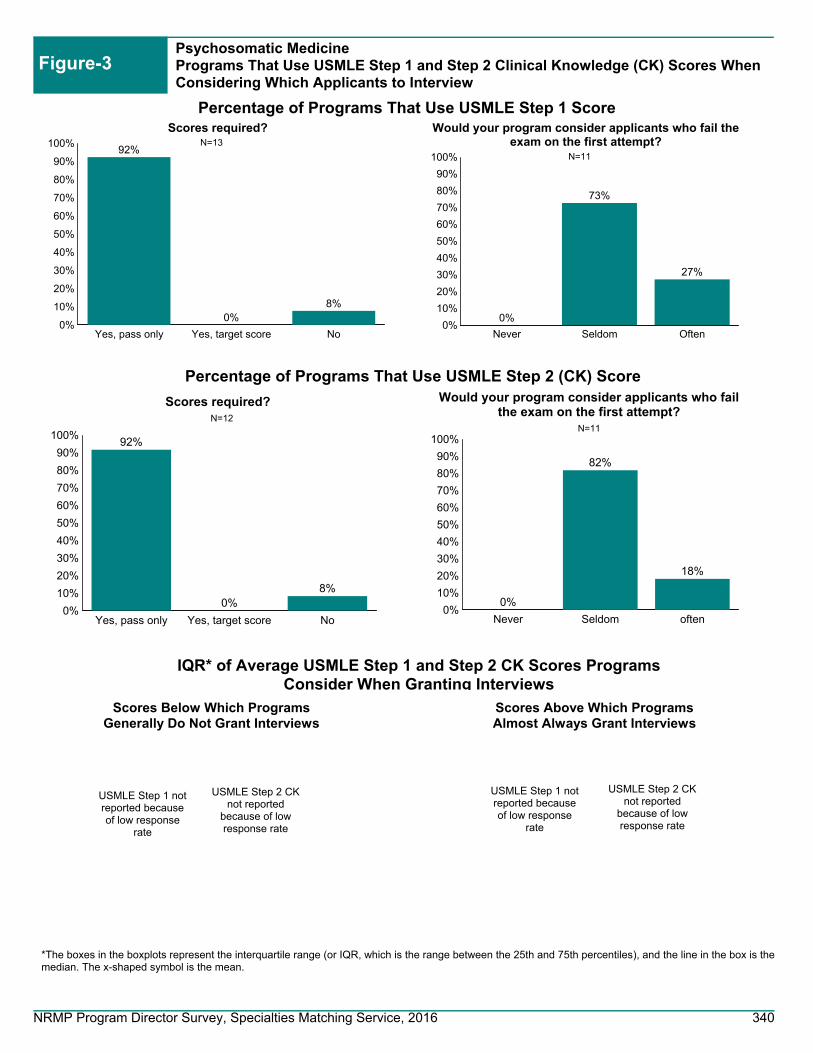
Psychosomatic MedicinePrograms That Use USMLE Step 1 and Step 2 Clinical Knowledge (CK) Scores When Considering Which Applicants to Interview
Figure-3
Percentage of Programs That Use USMLE Step 2 (CK) Score
0%
10%
20%
30%
40%
50%
60%
70%
80%
90%
100%
Never Seldom Often
0%
73%
27%
Would your program consider applicants who fail theexam on the first attempt?
0%
10%
20%
30%
40%
50%
60%
70%
80%
90%
100%
Never Seldom often
0%
82%
18%
Would your program consider applicants who failthe exam on the first attempt?
0%
10%
20%
30%
40%
50%
60%
70%
80%
90%
100%
Yes, pass only Yes, target score No
92%
0%8%
Scores required?
0%
10%
20%
30%
40%
50%
60%
70%
80%
90%
100%
Yes, pass only Yes, target score No
92%
0%8%
Scores required?
N=13
N=11
N=12N=11
IQR* of Average USMLE Step 1 and Step 2 CK Scores Programs Consider When Granting Interviews
Percentage of Programs That Use USMLE Step 1 Score
*The boxes in the boxplots represent the interquartile range (or IQR, which is the range between the 25th and 75th percentiles), and the line in the box is the median. The x-shaped symbol is the mean.
Scores Above Which Programs Almost Always Grant Interviews
Scores Below Which Programs Generally Do Not Grant Interviews
USMLE Step 2 CK not reported
because of low response rate
USMLE Step 1 not reported because of low response
rate
USMLE Step 2 CK not reported
because of low response rate
USMLE Step 1 not reported because of low response
rate
NRMP Program Director Survey, Specialties Matching Service, 2016 340

0%
10%
20%
30%
40%
50%
60%
70%
80%
90%
100%
Yes No
92%
8%
USMLE Step 2 CS
0%
10%
20%
30%
40%
50%
60%
70%
80%
90%
100%
Yes, pass only Yes, target score No
92%
0%
8%
USMLE Step 3
0%
10%
20%
30%
40%
50%
60%
70%
80%
90%
100%
Yes, pass only Yes, target score No
75%
0%
25%
COMLEX-USA Level 1*
Psychosomatic MedicinePercentage of Programs That Use USMLE Step 2 Clinical Skill (CS), Step 3, and COMLEX-USA Scores* When Considering Which Applicants to Interview
Figure-4
0%
10%
20%
30%
40%
50%
60%
70%
80%
90%
100%
Yes, pass only Yes, target score No
75%
0%
25%
COMLEX-USA Level 2-CE*
0%
10%
20%
30%
40%
50%
60%
70%
80%
90%
100%
Yes, pass only Yes, target score No
63%
0%
38%
COMLEX-USA Level 3*
0%
10%
20%
30%
40%
50%
60%
70%
80%
90%
100%
Yes, pass only Yes, target score No
75%
0%
25%
COMLEX-USA Level 2-PE*
N=12 N=12
N=8 N=8
N=8 N=8
* Osteopathic applicants only
Percentage of Programs That Use USMLE Step 2 CS and Step 3 Scores
Percentage of Programs That Use COMLEX-USA Level 1 and Level 2-CE Scores
Percentage of Programs That Use COMLEX-USA Level 2-PE and Level 3 Scores
NRMP Program Director Survey, Specialties Matching Service, 2016 341

0%10%20%30%40%50%60%70%80%90%
100%
Never Seldom Often
40%
20%
40%
Would your program consider applicants who fail theexam on the first attempt?
0%
10%
20%
30%
40%
50%
60%
70%
80%
90%
100%
Yes, pass only Yes, target score No, not required
60%
0%
40%
Scores required?
N=5
N=5
88.2%Optional
11.8%Required
Program Requirement on Dedicated Time forResearch
N=17
0.0
0.4
0.8
1.2
1.6
2.0
2.4
2.8
3.2
Accredited Locally Funded Integrated Other
1
3
Average Number of Months if Research Time isRequired
N=0 N=1 N=0 N=1
0.0
0.4
0.8
1.2
1.6
2.0
2.4
Accredited Positions Funded Positions
2.4
2.1
Average Number of Accredited Positions and Funded Positions
0%
10%
20%
30%
40%
50%
60%
70%
80%
90%
100%
Positions Filled BeforeMatch Day
Positions Offered Outsidethe Match
Positions Filled Outsidethe Match
57%
75%
38%
Average Percentage of Accredited Positions Offered Outside ofthe Match
N=17 N=17 N=5 N=2 N=2
Psychosomatic MedicinePrograms That Use Core Specialty Certifying Examination When Considering Applicants for Interview
Figure-5
Psychosomatic MedicinePrograms Positions Figure-6
Psychosomatic MedicineDedicated Time for Research Figure-7
NRMP Program Director Survey, Specialties Matching Service, 2016 342
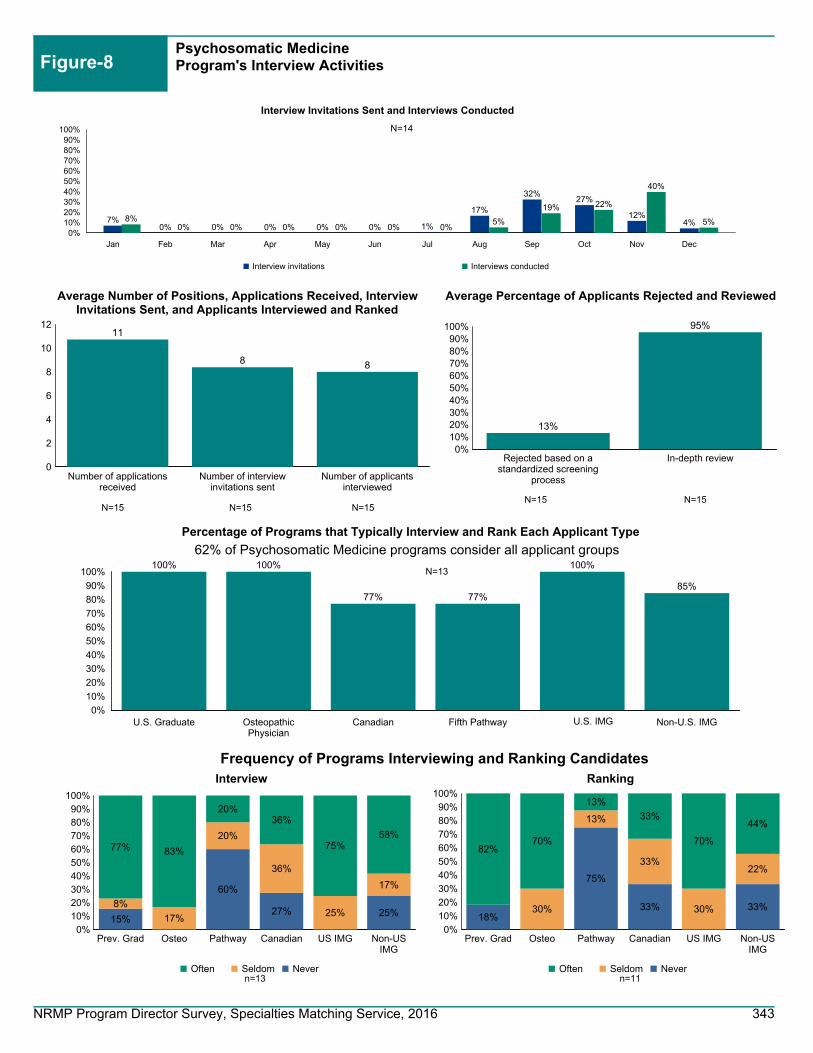
0%
10%
20%
30%
40%
50%
60%
70%
80%
90%
100%100% 100%
77% 77%
100%
85%
U.S. Graduate OsteopathicPhysician
Canadian Fifth Pathway U.S. IMG Non-U.S. IMG
Percentage of Programs that Typically Interview and Rank Each Applicant Type
Figure-8Psychosomatic MedicineProgram's Interview Activities
0%10%20%30%40%50%60%70%80%90%
100%
Rejected based on astandardized screening
process
In-depth review
13%
95%
Average Percentage of Applicants Rejected and Reviewed
0
2
4
6
8
10
12
Number of applicationsreceived
Number of interviewinvitations sent
Number of applicantsinterviewed
11
8 8
Average Number of Positions, Applications Received, InterviewInvitations Sent, and Applicants Interviewed and Ranked
N=15N=15N=15N=15
N=13
62% of Psychosomatic Medicine programs consider all applicant groups
N=15
0%10%20%30%40%50%60%70%80%90%
100%
Prev. Grad Osteo Pathway Canadian US IMG Non-USIMG
15%
60%
27% 25%8%
17%
20%
36%
25%
17%
77% 83%
20%36%
75%58%
Often Seldom Never
Interview
0%10%
20%
30%40%
50%60%
70%80%
90%100%
Prev. Grad Osteo Pathway Canadian US IMG Non-USIMG
18%
75%
33% 33%30%
13%
33%
30%
22%
82%70%
13%
33%
70%
44%
Often Seldom Never
Ranking
n=11
Frequency of Programs Interviewing and Ranking Candidates
n=13
N=14
0%10%20%30%40%50%60%70%80%90%
100%
Jan Feb Mar Apr May Jun Jul Aug Sep Oct Nov Dec
7%0% 0% 0% 0% 0% 1%
17%
32%27%
12%4%
Interview invitations
Interview Invitations Sent and Interviews Conducted
8%0% 0% 0% 0% 0% 0%
5%
19% 22%
40%
5%
Interviews conducted
NRMP Program Director Survey, Specialties Matching Service, 2016 343

Figure-9Psychosomatic MedicinePotential Challenges in Recruiting Applicants to Your Specialty
0% 20% 40% 60% 80% 100%
91%
9%
9%
0%
0%
We consider those applicants on an individual basis
We give those applicants serious consideration if they haveshown improvement
We do not usually consider those applicants
We favor those applicants
Other
0 1 2 3 4 5
Not enough applicants in the specialty
Undesirable income potential as a practicing physician
Undesirable work/life balance as a practicing physician
Long or irregular work hours required by specialty
Fellowship Match scheduled at inconvenient time of year
4.3
2.3
1.6
2.1
1.6
Average rating on a scale of 5 (1=least challenging; 5=most challenging)
n=10
37.5%Less than 3
12.5%3 to 525.0%
6 to10
25.0%More than
15
At Any Fellowship Program
37.5%Less than 3
25.0%3 to
5
18.8%6 to 10
18.8%More than 15
At Current Fellowship Program
n=11
n=16 n=16
Psychosomatic MedicineApplicants Who Applied in the Specialty in the Past But Did Not Match Figure-10
Psychosomatic MedicineYears as Program Director Figure-11
NRMP Program Director Survey, Specialties Matching Service, 2016 344

Pulmonary Disease and Critical Care Medicine
NRMP Program Director Survey, Specialties Matching Service, 2016 345
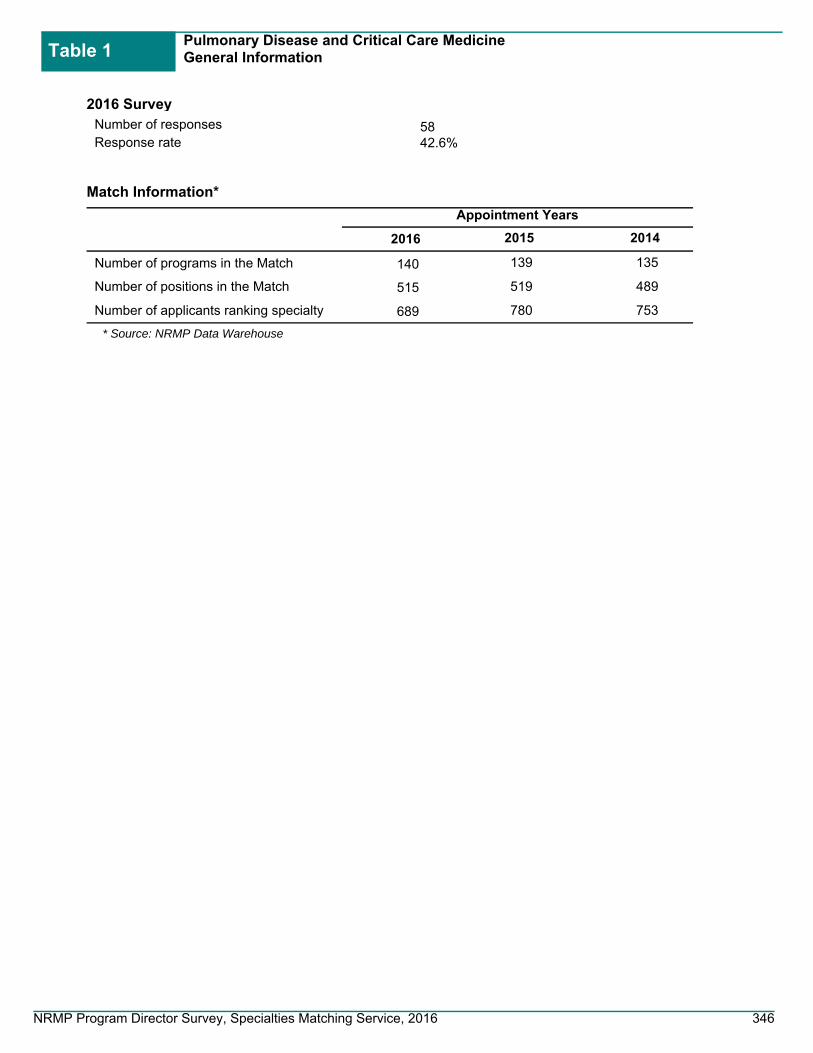
Pulmonary Disease and Critical Care MedicineGeneral Information
Table 1
140
515
689
Number of programs in the Match
Number of positions in the Match
Number of applicants ranking specialty
42.6%Response rate
Appointment Years
Number of responses 58
Match Information*
* Source: NRMP Data Warehouse
2016 Survey
2016 2015 2014
139
519
780
135
489
753
NRMP Program Director Survey, Specialties Matching Service, 2016 346

Figure-1Pulmonary Disease and Critical Care MedicinePercentage of Programs Citing Each Factor and Mean Importance Rating¹ for Each Factor in Selecting Applicants to Interview(N=53)
Average RatingPercent Citing Factor
¹ Ratings on a scale from 1 (not at all important) to 5 (very important).* International Medical Graduates only
1 2 3 4 5
4.44.54.24.14.23.44.04.53.84.13.94.34.34.04.14.14.63.94.44.24.03.43.83.83.53.84.23.83.83.43.83.34.83.54.04.43.83.63.83.6
100% 50% 0%
92%91%96%94%74%60%60%70%85%81%83%77%66%74%72%70%79%72%53%87%70%58%60%51%43%57%51%25%43%30%30%23%42%30%38%30%17%
9%25%13%
Letters of recommendation in fellowship specialty
Residency performance evaluation (Program Director letter)
Reputation of residency program
Demonstrated involvement and perceived interest in research
Perceived commitment to specialty
Personal statement
Perceived interest in program
Evidence of professionalism and ethics
USMLE Step 1/COMLEX Level 1 score
Peer reviewed publications/authored textbook chapters
USMLE Step 2 CK/COMLEX Level 2 CE score
Leadership qualities
Personal prior professional knowledge of the applicant
Oral presentations/poster presentations/speaking engagements
Applicant was a resident in a core program at same institution
Pass USMLE Step 2 CS/COMLEX Level 2 PE
Any failed attempt in USMLE/COMLEX
USMLE Step 3/COMLEX Level 3 score
Interest in academic career
Residency program setting (univ.‐based vs. comm.‐based)
Clinical/laboratory research experience
Awards or special honors in medical school
Alpha Omega Alpha (AOA) membership
Other life experience
Medical Student Performance Evaluation (MSPE/Dean's Letter)
Graduate of highly‐regarded medical school
Visa status*
Volunteer/extracurricular experiences
Awarded grant money for research
Grades in medical school
Lack of gaps in medical education
Medical school class ranking/quartile
Applicant was flagged with Match violation by the NRMP
Electives at your fellowship site
Gold Humanism Honor Society (GHHS) membership
Residency class ranking/quartile
Fluency in language spoken by your patient population
In‐Training Examination (ITE)
Residency program size
Having finished another fellowship
NRMP Program Director Survey, Specialties Matching Service, 2016 347

Pulmonary Disease and Critical Care MedicinePercentage of Programs Citing Each Factor and Mean Importance Rating¹ for Each Factor in Ranking Applicants(N=53)
Figure-2
Average RatingPercent Citing Factor
¹ Ratings on a scale from 1 (not at all important) to 5 (very important).* International Medical Graduates only
1 2 3 4 5
4.84.64.44.74.44.74.34.24.24.54.73.84.44.64.04.54.23.94.04.74.14.14.03.74.34.03.94.13.93.64.54.74.34.53.84.24.04.43.44.33.84.14.34.35.04.7
100% 50% 0%
90%90%75%80%57%86%59%78%82%73%57%33%53%53%65%53%53%51%53%47%43%53%45%41%63%41%35%22%14%27%31%29%33%20%33%18%14%16%14%20%16%25%12%6%4%6%
Interactions with faculty during interview and visitInterpersonal skills
Letters of recommendation in fellowship specialtyInteractions with house staff during interview and visit
Perceived commitment to specialtyFeedback from current residents and fellows
Perceived interest in programDemonstrated involvement and perceived interest in research
Reputation of residency programResidency performance evaluation (Program Director letter)
Evidence of professionalism and ethicsPersonal statement
Personal prior professional knowledge of the applicantLeadership qualities
Peer reviewed publications/authored textbook chaptersInterest in academic career
Applicant was a resident in a core program at same institutionUSMLE Step 1/COMLEX Level 1 score
USMLE Step 2 CK/COMLEX Level 2 CE scoreAny failed attempt in USMLE/COMLEX
Passing USMLE Step 2 CS/COMLEX Level 2 PEClinical/laboratory research experience
USMLE Step 3/COMLEX Level 3 scoreOral presentations/poster presentations/speaking engagements
Residency program setting (univ.‐based vs. comm.‐based)Alpha Omega Alpha (AOA) membership
Other life experienceMedical Student Performance Evaluation (MSPE/Dean's Letter)
Second interview/visitAwards or special honors in medical school
Visa status*Applicant was flagged with Match violation by the NRMP
Graduate of highly‐regarded medical schoolElectives at your fellowship site
Awarded grant money for researchVolunteer/extracurricular experiencesMedical school class ranking/quartile
Lack of gaps in medical educationGrades in medical school
Residency class ranking/quartileFluency in language spoken by your patient population
Gold Humanism Honor Society (GHHS) membershipResidency program size
In‐Training Examination (ITE)Second interview/visit
Having finished another fellowship
NRMP Program Director Survey, Specialties Matching Service, 2016 348
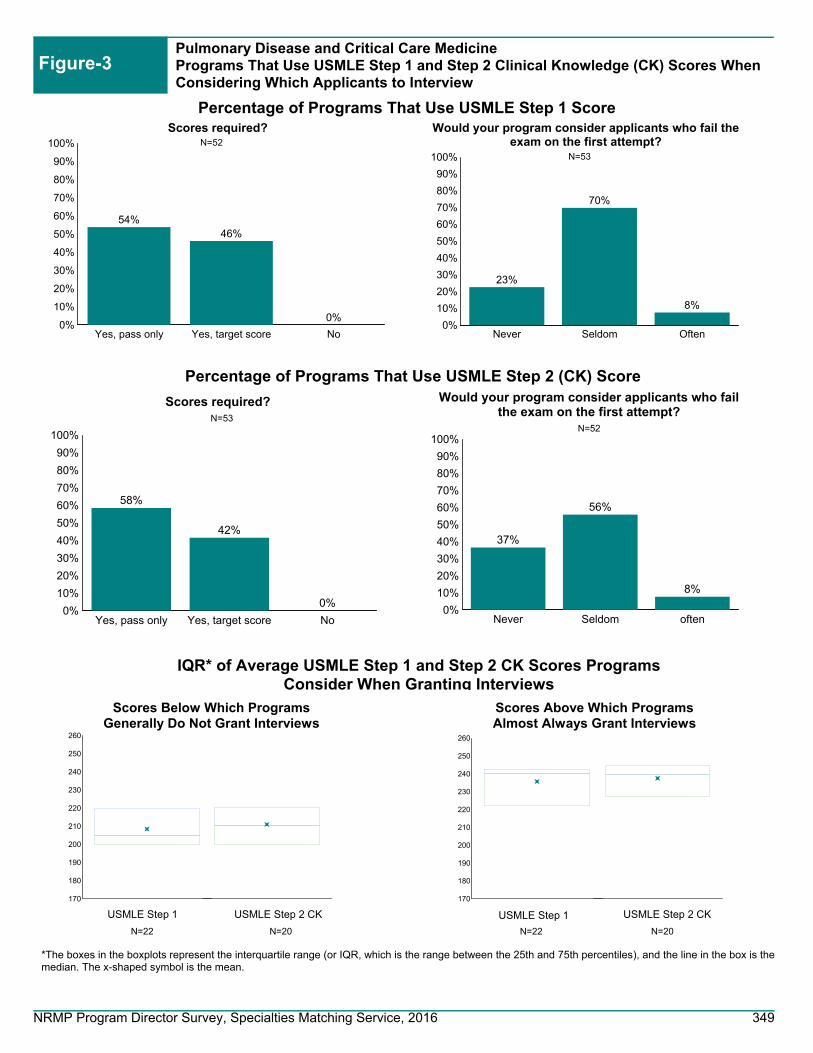
170
180
190
200
210
220
230
240
250
260
Pulmonary Disease and Critical Care MedicinePrograms That Use USMLE Step 1 and Step 2 Clinical Knowledge (CK) Scores When Considering Which Applicants to Interview
Figure-3
Percentage of Programs That Use USMLE Step 2 (CK) Score
0%
10%
20%
30%
40%
50%
60%
70%
80%
90%
100%
Never Seldom Often
23%
70%
8%
Would your program consider applicants who fail theexam on the first attempt?
0%
10%
20%
30%
40%
50%
60%
70%
80%
90%
100%
Never Seldom often
37%
56%
8%
Would your program consider applicants who failthe exam on the first attempt?
0%
10%
20%
30%
40%
50%
60%
70%
80%
90%
100%
Yes, pass only Yes, target score No
54%46%
0%
Scores required?
0%
10%
20%
30%
40%
50%
60%
70%
80%
90%
100%
Yes, pass only Yes, target score No
58%
42%
0%
Scores required?
N=52
N=53
N=53N=52
N=20N=22 N=22 N=20
IQR* of Average USMLE Step 1 and Step 2 CK Scores Programs Consider When Granting Interviews
Percentage of Programs That Use USMLE Step 1 Score
170
180
190
200
210
220
230
240
250
260
USMLE Step 2 CKUSMLE Step 1 USMLE Step 1 USMLE Step 2 CK
*The boxes in the boxplots represent the interquartile range (or IQR, which is the range between the 25th and 75th percentiles), and the line in the box is the median. The x-shaped symbol is the mean.
Scores Above Which Programs Almost Always Grant Interviews
Scores Below Which Programs Generally Do Not Grant Interviews
NRMP Program Director Survey, Specialties Matching Service, 2016 349

0%
10%
20%
30%
40%
50%
60%
70%
80%
90%
100%
Yes No
100%
0%
USMLE Step 2 CS
0%
10%
20%
30%
40%
50%
60%
70%
80%
90%
100%
Yes, pass only Yes, target score No
47%
37%
16%
USMLE Step 3
0%
10%
20%
30%
40%
50%
60%
70%
80%
90%
100%
Yes, pass only Yes, target score No
56%
39%
6%
COMLEX-USA Level 1*
Pulmonary Disease and Critical Care MedicinePercentage of Programs That Use USMLE Step 2 Clinical Skill (CS), Step 3, and COMLEX-USA Scores* When Considering Which Applicants to Interview
Figure-4
0%
10%
20%
30%
40%
50%
60%
70%
80%
90%
100%
Yes, pass only Yes, target score No
57%
35%
8%
COMLEX-USA Level 2-CE*
0%
10%
20%
30%
40%
50%
60%
70%
80%
90%
100%
Yes, pass only Yes, target score No
42%36%
22%
COMLEX-USA Level 3*
0%
10%
20%
30%
40%
50%
60%
70%
80%
90%
100%
Yes, pass only Yes, target score No
75%
17%
8%
COMLEX-USA Level 2-PE*
N=53 N=51
N=36 N=37
N=36 N=36
* Osteopathic applicants only
Percentage of Programs That Use USMLE Step 2 CS and Step 3 Scores
Percentage of Programs That Use COMLEX-USA Level 1 and Level 2-CE Scores
Percentage of Programs That Use COMLEX-USA Level 2-PE and Level 3 Scores
NRMP Program Director Survey, Specialties Matching Service, 2016 350
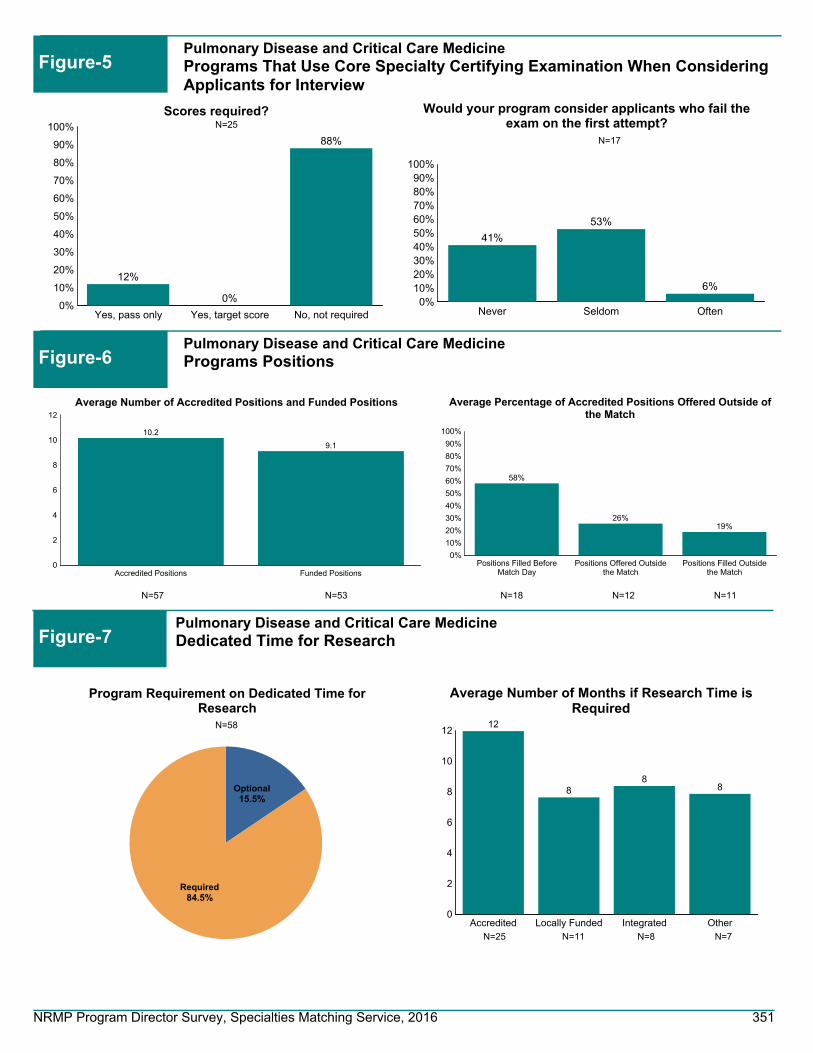
0%10%20%30%40%50%60%70%80%90%
100%
Never Seldom Often
41%
53%
6%
Would your program consider applicants who fail theexam on the first attempt?
0%
10%
20%
30%
40%
50%
60%
70%
80%
90%
100%
Yes, pass only Yes, target score No, not required
12%
0%
88%
Scores required?
N=17
N=25
15.5%Optional
84.5%Required
Program Requirement on Dedicated Time forResearch
N=58
0
2
4
6
8
10
12
Accredited Locally Funded Integrated Other
12
88
8
Average Number of Months if Research Time isRequired
N=25 N=11 N=8 N=7
0
2
4
6
8
10
12
Accredited Positions Funded Positions
10.2
9.1
Average Number of Accredited Positions and Funded Positions
0%
10%
20%
30%
40%
50%
60%
70%
80%
90%
100%
Positions Filled BeforeMatch Day
Positions Offered Outsidethe Match
Positions Filled Outsidethe Match
58%
26%19%
Average Percentage of Accredited Positions Offered Outside ofthe Match
N=57 N=53 N=18 N=12 N=11
Pulmonary Disease and Critical Care MedicinePrograms That Use Core Specialty Certifying Examination When Considering Applicants for Interview
Figure-5
Pulmonary Disease and Critical Care MedicinePrograms Positions Figure-6
Pulmonary Disease and Critical Care MedicineDedicated Time for Research Figure-7
NRMP Program Director Survey, Specialties Matching Service, 2016 351
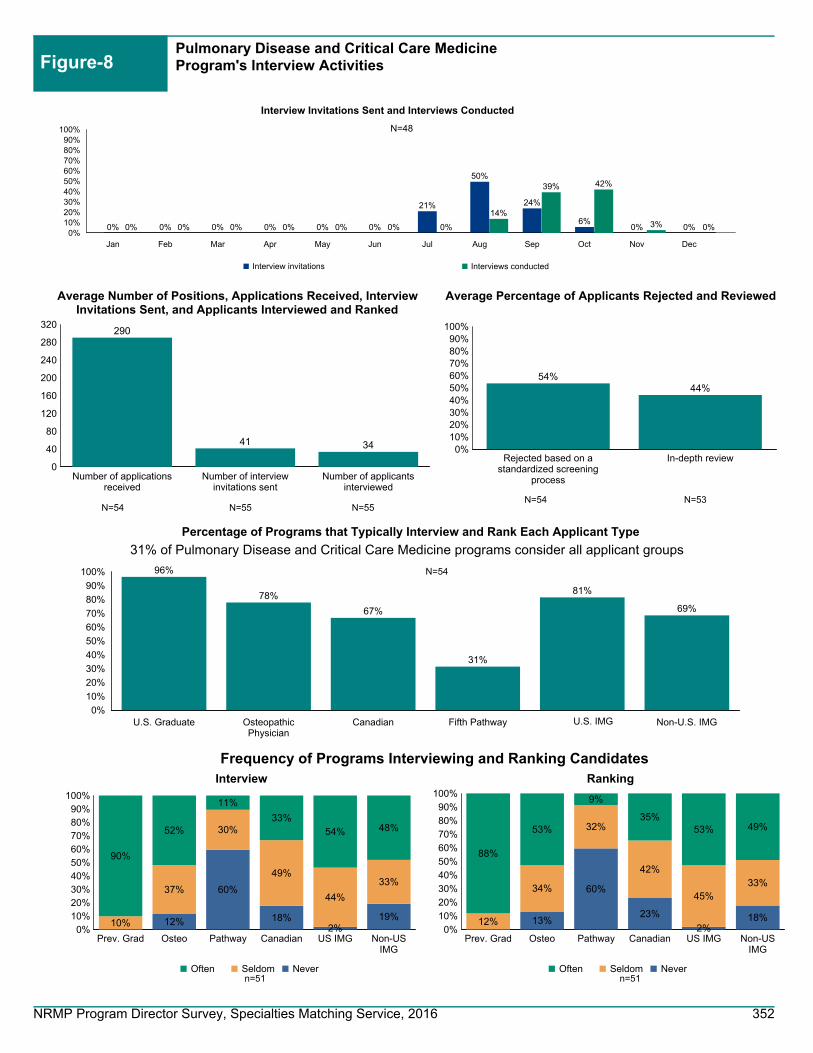
0%
10%
20%
30%
40%
50%
60%
70%
80%
90%
100% 96%
78%
67%
31%
81%
69%
U.S. Graduate OsteopathicPhysician
Canadian Fifth Pathway U.S. IMG Non-U.S. IMG
Percentage of Programs that Typically Interview and Rank Each Applicant Type
Figure-8Pulmonary Disease and Critical Care MedicineProgram's Interview Activities
0%10%20%30%40%50%60%70%80%90%
100%
Rejected based on astandardized screening
process
In-depth review
54%44%
Average Percentage of Applicants Rejected and Reviewed
0
40
80
120
160
200
240
280
320
Number of applicationsreceived
Number of interviewinvitations sent
Number of applicantsinterviewed
290
41 34
Average Number of Positions, Applications Received, InterviewInvitations Sent, and Applicants Interviewed and Ranked
N=53N=54N=55N=54
N=54
31% of Pulmonary Disease and Critical Care Medicine programs consider all applicant groups
N=55
0%10%20%30%40%50%60%70%80%90%
100%
Prev. Grad Osteo Pathway Canadian US IMG Non-USIMG
12%
60%
18%2%
19%10%
37%
30%
49%
44%
33%
90%
52%
11%
33%54% 48%
Often Seldom Never
Interview
0%10%
20%
30%40%
50%60%
70%80%
90%100%
Prev. Grad Osteo Pathway Canadian US IMG Non-USIMG
13%
60%
23%
2%18%12%
34%
32%
42%
45%33%
88%
53%
9%
35%53% 49%
Often Seldom Never
Ranking
n=51
Frequency of Programs Interviewing and Ranking Candidates
n=51
N=48
0%10%20%30%40%50%60%70%80%90%
100%
Jan Feb Mar Apr May Jun Jul Aug Sep Oct Nov Dec
0% 0% 0% 0% 0% 0%
21%
50%
24%
6%0% 0%
Interview invitations
Interview Invitations Sent and Interviews Conducted
0% 0% 0% 0% 0% 0% 0%
14%
39% 42%
3% 0%
Interviews conducted
NRMP Program Director Survey, Specialties Matching Service, 2016 352

Figure-9Pulmonary Disease and Critical Care MedicinePotential Challenges in Recruiting Applicants to Your Specialty
0% 10% 20% 30% 40% 50% 60% 70% 80%
75%
16%
16%
0%
0%
We consider those applicants on an individual basis
We give those applicants serious consideration if they haveshown improvement
We do not usually consider those applicants
We favor those applicants
Other
0 1 2 3 4 5
Not enough applicants in the specialty
Undesirable income potential as a practicing physician
Undesirable work/life balance as a practicing physician
Long or irregular work hours required by specialty
Fellowship Match scheduled at inconvenient time of year
1.6
2.1
3.5
3.4
1.8
Average rating on a scale of 5 (1=least challenging; 5=most challenging)
n=50
24.0%Less than 3
26.0%3 to 5
28.0%6 to 10
14.0%11 to 15
8.0%More than
15
At Any Fellowship Program
26.0%Less than 3
26.0%3 to
5
32.0%6 to 10
10.0%11 to
15
6.0%More than
15
At Current Fellowship Program
n=51
n=50 n=50
Pulmonary Disease and Critical Care MedicineApplicants Who Applied in the Specialty in the Past But Did Not Match Figure-10
Pulmonary Disease and Critical Care MedicineYears as Program Director Figure-11
NRMP Program Director Survey, Specialties Matching Service, 2016 353

Reproductive Endocrinology
NRMP Program Director Survey, Specialties Matching Service, 2016 354

Reproductive EndocrinologyGeneral Information
Table 1
36
42
60
Number of programs in the Match
Number of positions in the Match
Number of applicants ranking specialty
35.3%Response rate
Appointment Years
Number of responses 12
Match Information*
* Source: NRMP Data Warehouse
2016 Survey
2016 2015 2014
37
47
69
38
43
69
NRMP Program Director Survey, Specialties Matching Service, 2016 355

Figure-1Reproductive EndocrinologyPercentage of Programs Citing Each Factor and Mean Importance Rating¹ for Each Factor in Selecting Applicants to Interview(N=7)
Average RatingPercent Citing Factor
¹ Ratings on a scale from 1 (not at all important) to 5 (very important).* International Medical Graduates only
1 2 3 4 5
4.34.63.94.44.44.03.85.03.84.33.84.03.84.54.33.54.74.04.33.74.33.84.03.3
3.74.03.34.34.03.03.55.03.74.54.54.54.3
100% 50% 0%
86%100%100%100%
71%86%86%86%57%86%57%71%71%57%43%29%43%29%57%86%57%71%71%43%
0%43%43%43%43%43%14%29%29%86%57%29%29%57%
0%0%
Letters of recommendation in fellowship specialty
Residency performance evaluation (Program Director letter)
Reputation of residency program
Demonstrated involvement and perceived interest in research
Perceived commitment to specialty
Personal statement
Perceived interest in program
Evidence of professionalism and ethics
USMLE Step 1/COMLEX Level 1 score
Peer reviewed publications/authored textbook chapters
USMLE Step 2 CK/COMLEX Level 2 CE score
Leadership qualities
Personal prior professional knowledge of the applicant
Oral presentations/poster presentations/speaking engagements
Applicant was a resident in a core program at same institution
Pass USMLE Step 2 CS/COMLEX Level 2 PE
Any failed attempt in USMLE/COMLEX
USMLE Step 3/COMLEX Level 3 score
Interest in academic career
Residency program setting (univ.‐based vs. comm.‐based)
Clinical/laboratory research experience
Awards or special honors in medical school
Alpha Omega Alpha (AOA) membership
Other life experience
Medical Student Performance Evaluation (MSPE/Dean's Letter)
Graduate of highly‐regarded medical school
Visa status*
Volunteer/extracurricular experiences
Awarded grant money for research
Grades in medical school
Lack of gaps in medical education
Medical school class ranking/quartile
Applicant was flagged with Match violation by the NRMP
Electives at your fellowship site
Gold Humanism Honor Society (GHHS) membership
Residency class ranking/quartile
Fluency in language spoken by your patient population
In‐Training Examination (ITE)
Residency program size
Having finished another fellowship
NRMP Program Director Survey, Specialties Matching Service, 2016 356

Reproductive EndocrinologyPercentage of Programs Citing Each Factor and Mean Importance Rating¹ for Each Factor in Ranking Applicants(N=7)
Figure-2
Average RatingPercent Citing Factor
¹ Ratings on a scale from 1 (not at all important) to 5 (very important).* International Medical Graduates only
1 2 3 4 5
5.04.84.54.84.25.04.04.23.84.84.84.44.04.04.54.53.54.04.04.54.04.34.03.54.05.04.04.03.03.04.05.04.04.04.03.54.03.04.05.03.05.0
4.5
100% 50% 0%
83%83%67%83%83%83%67%
100%67%67%83%83%67%67%67%33%33%17%17%33%17%67%17%33%33%17%17%50%17%17%33%33%17%50%17%33%17%17%33%17%50%17%0%
33%0%0%
Interactions with faculty during interview and visitInterpersonal skills
Letters of recommendation in fellowship specialtyInteractions with house staff during interview and visit
Perceived commitment to specialtyFeedback from current residents and fellows
Perceived interest in programDemonstrated involvement and perceived interest in research
Reputation of residency programResidency performance evaluation (Program Director letter)
Evidence of professionalism and ethicsPersonal statement
Personal prior professional knowledge of the applicantLeadership qualities
Peer reviewed publications/authored textbook chaptersInterest in academic career
Applicant was a resident in a core program at same institutionUSMLE Step 1/COMLEX Level 1 score
USMLE Step 2 CK/COMLEX Level 2 CE scoreAny failed attempt in USMLE/COMLEX
Passing USMLE Step 2 CS/COMLEX Level 2 PEClinical/laboratory research experience
USMLE Step 3/COMLEX Level 3 scoreOral presentations/poster presentations/speaking engagements
Residency program setting (univ.‐based vs. comm.‐based)Alpha Omega Alpha (AOA) membership
Other life experienceMedical Student Performance Evaluation (MSPE/Dean's Letter)
Second interview/visitAwards or special honors in medical school
Visa status*Applicant was flagged with Match violation by the NRMP
Graduate of highly‐regarded medical schoolElectives at your fellowship site
Awarded grant money for researchVolunteer/extracurricular experiencesMedical school class ranking/quartile
Lack of gaps in medical educationGrades in medical school
Residency class ranking/quartileFluency in language spoken by your patient population
Gold Humanism Honor Society (GHHS) membershipResidency program size
In‐Training Examination (ITE)Second interview/visit
Having finished another fellowship
NRMP Program Director Survey, Specialties Matching Service, 2016 357

Reproductive EndocrinologyPrograms That Use USMLE Step 1 and Step 2 Clinical Knowledge (CK) Scores When Considering Which Applicants to Interview
Figure-3
Percentage of Programs That Use USMLE Step 2 (CK) Score
0%
10%
20%
30%
40%
50%
60%
70%
80%
90%
100%
Never Seldom Often
50%
33%
17%
Would your program consider applicants who fail theexam on the first attempt?
0%
10%
20%
30%
40%
50%
60%
70%
80%
90%
100%
Never Seldom often
50%
33%
17%
Would your program consider applicants who failthe exam on the first attempt?
0%
10%
20%
30%
40%
50%
60%
70%
80%
90%
100%
Yes, pass only Yes, target score No
29% 29%
43%
Scores required?
0%
10%
20%
30%
40%
50%
60%
70%
80%
90%
100%
Yes, pass only Yes, target score No
43%
14%
43%
Scores required?
N=7
N=6
N=7N=6
IQR* of Average USMLE Step 1 and Step 2 CK Scores Programs Consider When Granting Interviews
Percentage of Programs That Use USMLE Step 1 Score
*The boxes in the boxplots represent the interquartile range (or IQR, which is the range between the 25th and 75th percentiles), and the line in the box is the median. The x-shaped symbol is the mean.
Scores Above Which Programs Almost Always Grant Interviews
Scores Below Which Programs Generally Do Not Grant Interviews
USMLE Step 2 CK not reported
because of low response rate
USMLE Step 1 not reported because of low response
rate
USMLE Step 2 CK not reported
because of low response rate
USMLE Step 1 not reported because of low response
rate
NRMP Program Director Survey, Specialties Matching Service, 2016 358

0%
10%
20%
30%
40%
50%
60%
70%
80%
90%
100%
Yes No
57%
43%
USMLE Step 2 CS
0%
10%
20%
30%
40%
50%
60%
70%
80%
90%
100%
Yes, pass only Yes, target score No
17%
33%
50%
USMLE Step 3
0%
10%
20%
30%
40%
50%
60%
70%
80%
90%
100%
Yes, pass only Yes, target score No
0% 0%
100%
COMLEX-USA Level 1*
Reproductive EndocrinologyPercentage of Programs That Use USMLE Step 2 Clinical Skill (CS), Step 3, and COMLEX-USA Scores* When Considering Which Applicants to Interview
Figure-4
0%
10%
20%
30%
40%
50%
60%
70%
80%
90%
100%
Yes, pass only Yes, target score No
0% 0%
100%
COMLEX-USA Level 2-CE*
0%
10%
20%
30%
40%
50%
60%
70%
80%
90%
100%
Yes, pass only Yes, target score No
0% 0%
100%
COMLEX-USA Level 3*
0%
10%
20%
30%
40%
50%
60%
70%
80%
90%
100%
Yes, pass only Yes, target score No
0% 0%
100%
COMLEX-USA Level 2-PE*
N=7 N=6
N=4 N=4
N=4 N=4
* Osteopathic applicants only
Percentage of Programs That Use USMLE Step 2 CS and Step 3 Scores
Percentage of Programs That Use COMLEX-USA Level 1 and Level 2-CE Scores
Percentage of Programs That Use COMLEX-USA Level 2-PE and Level 3 Scores
NRMP Program Director Survey, Specialties Matching Service, 2016 359

0%10%20%30%40%50%60%70%80%90%
100%
Never Seldom Often
100%
0% 0%
Would your program consider applicants who fail theexam on the first attempt?
0%
10%
20%
30%
40%
50%
60%
70%
80%
90%
100%
Yes, pass only Yes, target score No, not required
0%
25%
75%
Scores required?
N=1
N=4
100.0%Required
Program Requirement on Dedicated Time forResearch
N=11
0
4
8
12
16
20
Accredited Locally Funded Integrated Other
18 18 18
15
Average Number of Months if Research Time isRequired
N=7 N=1 N=2 N=2
0.0
0.5
1.0
1.5
2.0
2.5
3.0
3.5
4.0
Accredited Positions Funded Positions
3.2
3.6
Average Number of Accredited Positions and Funded Positions
0%
10%
20%
30%
40%
50%
60%
70%
80%
90%
100%
Positions Filled BeforeMatch Day
Positions Offered Outsidethe Match
Positions Filled Outsidethe Match
78%
Average Percentage of Accredited Positions Offered Outside ofthe Match
N=12 N=10 N=4 N=0 N=0
Reproductive EndocrinologyPrograms That Use Core Specialty Certifying Examination When Considering Applicants for Interview
Figure-5
Reproductive EndocrinologyPrograms Positions Figure-6
Reproductive EndocrinologyDedicated Time for Research Figure-7
NRMP Program Director Survey, Specialties Matching Service, 2016 360

0%
10%
20%
30%
40%
50%
60%
70%
80%
90%
100%100%
43%
71%
14%
43%
14%
U.S. Graduate OsteopathicPhysician
Canadian Fifth Pathway U.S. IMG Non-U.S. IMG
Percentage of Programs that Typically Interview and Rank Each Applicant Type
Figure-8Reproductive EndocrinologyProgram's Interview Activities
0%10%20%30%40%50%60%70%80%90%
100%
Rejected based on astandardized screening
process
In-depth review
44%
65%
Average Percentage of Applicants Rejected and Reviewed
0
10
20
30
40
50
60
70
Number of applicationsreceived
Number of interviewinvitations sent
Number of applicantsinterviewed
68
23 22
Average Number of Positions, Applications Received, InterviewInvitations Sent, and Applicants Interviewed and Ranked
N=8N=8N=8N=9
N=7
14% of Reproductive Endocrinology programs consider all applicant groups
N=8
0%10%20%30%40%50%60%70%80%90%
100%
Prev. Grad Osteo Pathway Canadian US IMG Non-USIMG
40%20% 20%17%
67%
40%
60%
60% 60%83%
33%20%
40%20% 20%
Often Seldom Never
Interview
0%10%
20%
30%40%
50%60%
70%80%
90%100%
Prev. Grad Osteo Pathway Canadian US IMG Non-USIMG
14%
50% 50%
17%14%
57%
33%
83%
33%
67%86%
29%17% 17% 17% 17%
Often Seldom Never
Ranking
n=7
Frequency of Programs Interviewing and Ranking Candidates
n=6
N=7
0%10%20%30%40%50%60%70%80%90%
100%
Jan Feb Mar Apr May Jun Jul Aug Sep Oct Nov Dec
0% 0% 0% 0%
19%
31%
50%
0% 0% 0% 0% 0%
Interview invitations
Interview Invitations Sent and Interviews Conducted
0% 0% 0% 0% 0% 0%
31% 35% 34%
0% 0% 0%
Interviews conducted
NRMP Program Director Survey, Specialties Matching Service, 2016 361

Figure-9Reproductive EndocrinologyPotential Challenges in Recruiting Applicants to Your Specialty
0% 10% 20% 30% 40% 50% 60% 70%
67%
33%
0%
0%
0%
We consider those applicants on an individual basis
We give those applicants serious consideration if they haveshown improvement
We do not usually consider those applicants
We favor those applicants
Other
0 1 2 3 4 5
Not enough applicants in the specialty
Undesirable income potential as a practicing physician
Undesirable work/life balance as a practicing physician
Long or irregular work hours required by specialty
Fellowship Match scheduled at inconvenient time of year
1.2
1.5
1.5
1.3
1.3
Average rating on a scale of 5 (1=least challenging; 5=most challenging)
n=6
55.6%Less than
3
22.2%3 to 5
11.1%6 to10
11.1%11 to 15
At Any Fellowship Program
66.7%Less than
3
33.3%3 to 5
At Current Fellowship Program
n=6
n=9 n=9
Reproductive EndocrinologyApplicants Who Applied in the Specialty in the Past But Did Not Match Figure-10
Reproductive EndocrinologyYears as Program Director Figure-11
NRMP Program Director Survey, Specialties Matching Service, 2016 362

Rheumatology
NRMP Program Director Survey, Specialties Matching Service, 2016 363

RheumatologyGeneral Information
Table 1
108
215
304
Number of programs in the Match
Number of positions in the Match
Number of applicants ranking specialty
48.1%Response rate
Appointment Years
Number of responses 52
Match Information*
* Source: NRMP Data Warehouse
2016 Survey
2016 2015 2014
107
209
245
106
206
230
NRMP Program Director Survey, Specialties Matching Service, 2016 364

Figure-1RheumatologyPercentage of Programs Citing Each Factor and Mean Importance Rating¹ for Each Factor in Selecting Applicants to Interview(N=44)
Average RatingPercent Citing Factor
¹ Ratings on a scale from 1 (not at all important) to 5 (very important).* International Medical Graduates only
1 2 3 4 5
4.44.54.13.94.53.94.24.64.14.14.34.34.13.94.24.14.54.34.13.93.93.53.93.93.64.14.23.83.83.63.93.74.93.93.63.73.93.83.63.0
100% 50% 0%
93%89%86%86%77%75%75%68%77%73%77%52%66%64%68%68%57%68%70%77%66%61%52%39%55%64%52%43%36%50%39%45%41%45%39%36%36%14%14%
9%
Letters of recommendation in fellowship specialty
Residency performance evaluation (Program Director letter)
Reputation of residency program
Demonstrated involvement and perceived interest in research
Perceived commitment to specialty
Personal statement
Perceived interest in program
Evidence of professionalism and ethics
USMLE Step 1/COMLEX Level 1 score
Peer reviewed publications/authored textbook chapters
USMLE Step 2 CK/COMLEX Level 2 CE score
Leadership qualities
Personal prior professional knowledge of the applicant
Oral presentations/poster presentations/speaking engagements
Applicant was a resident in a core program at same institution
Pass USMLE Step 2 CS/COMLEX Level 2 PE
Any failed attempt in USMLE/COMLEX
USMLE Step 3/COMLEX Level 3 score
Interest in academic career
Residency program setting (univ.‐based vs. comm.‐based)
Clinical/laboratory research experience
Awards or special honors in medical school
Alpha Omega Alpha (AOA) membership
Other life experience
Medical Student Performance Evaluation (MSPE/Dean's Letter)
Graduate of highly‐regarded medical school
Visa status*
Volunteer/extracurricular experiences
Awarded grant money for research
Grades in medical school
Lack of gaps in medical education
Medical school class ranking/quartile
Applicant was flagged with Match violation by the NRMP
Electives at your fellowship site
Gold Humanism Honor Society (GHHS) membership
Residency class ranking/quartile
Fluency in language spoken by your patient population
In‐Training Examination (ITE)
Residency program size
Having finished another fellowship
NRMP Program Director Survey, Specialties Matching Service, 2016 365

RheumatologyPercentage of Programs Citing Each Factor and Mean Importance Rating¹ for Each Factor in Ranking Applicants(N=44)
Figure-2
Average RatingPercent Citing Factor
¹ Ratings on a scale from 1 (not at all important) to 5 (very important).* International Medical Graduates only
1 2 3 4 5
4.74.64.54.64.74.74.54.14.24.54.63.84.24.64.04.54.44.04.14.84.14.14.24.14.24.23.73.64.53.74.34.94.14.24.03.73.43.93.54.14.24.35.05.04.33.5
100% 50% 0%
83%85%88%56%80%41%63%80%71%73%66%56%54%39%56%49%56%71%76%41%61%54%63%34%46%27%27%34%15%27%22%37%46%34%29%32%29%24%27%20%24%10%5%2%7%5%
Interactions with faculty during interview and visitInterpersonal skills
Letters of recommendation in fellowship specialtyInteractions with house staff during interview and visit
Perceived commitment to specialtyFeedback from current residents and fellows
Perceived interest in programDemonstrated involvement and perceived interest in research
Reputation of residency programResidency performance evaluation (Program Director letter)
Evidence of professionalism and ethicsPersonal statement
Personal prior professional knowledge of the applicantLeadership qualities
Peer reviewed publications/authored textbook chaptersInterest in academic career
Applicant was a resident in a core program at same institutionUSMLE Step 1/COMLEX Level 1 score
USMLE Step 2 CK/COMLEX Level 2 CE scoreAny failed attempt in USMLE/COMLEX
Passing USMLE Step 2 CS/COMLEX Level 2 PEClinical/laboratory research experience
USMLE Step 3/COMLEX Level 3 scoreOral presentations/poster presentations/speaking engagements
Residency program setting (univ.‐based vs. comm.‐based)Alpha Omega Alpha (AOA) membership
Other life experienceMedical Student Performance Evaluation (MSPE/Dean's Letter)
Second interview/visitAwards or special honors in medical school
Visa status*Applicant was flagged with Match violation by the NRMP
Graduate of highly‐regarded medical schoolElectives at your fellowship site
Awarded grant money for researchVolunteer/extracurricular experiencesMedical school class ranking/quartile
Lack of gaps in medical educationGrades in medical school
Residency class ranking/quartileFluency in language spoken by your patient population
Gold Humanism Honor Society (GHHS) membershipResidency program size
In‐Training Examination (ITE)Second interview/visit
Having finished another fellowship
NRMP Program Director Survey, Specialties Matching Service, 2016 366

170
180
190
200
210
220
230
240
250
260
RheumatologyPrograms That Use USMLE Step 1 and Step 2 Clinical Knowledge (CK) Scores When Considering Which Applicants to Interview
Figure-3
Percentage of Programs That Use USMLE Step 2 (CK) Score
0%
10%
20%
30%
40%
50%
60%
70%
80%
90%
100%
Never Seldom Often
26%
67%
7%
Would your program consider applicants who fail theexam on the first attempt?
0%
10%
20%
30%
40%
50%
60%
70%
80%
90%
100%
Never Seldom often
35%
65%
0%
Would your program consider applicants who failthe exam on the first attempt?
0%
10%
20%
30%
40%
50%
60%
70%
80%
90%
100%
Yes, pass only Yes, target score No
51%47%
2%
Scores required?
0%
10%
20%
30%
40%
50%
60%
70%
80%
90%
100%
Yes, pass only Yes, target score No
49% 49%
2%
Scores required?
N=43
N=43
N=43N=43
N=13N=13 N=10 N=10
IQR* of Average USMLE Step 1 and Step 2 CK Scores Programs Consider When Granting Interviews
Percentage of Programs That Use USMLE Step 1 Score
170
180
190
200
210
220
230
240
250
260
USMLE Step 2 CKUSMLE Step 1 USMLE Step 1 USMLE Step 2 CK
*The boxes in the boxplots represent the interquartile range (or IQR, which is the range between the 25th and 75th percentiles), and the line in the box is the median. The x-shaped symbol is the mean.
Scores Above Which Programs Almost Always Grant Interviews
Scores Below Which Programs Generally Do Not Grant Interviews
NRMP Program Director Survey, Specialties Matching Service, 2016 367
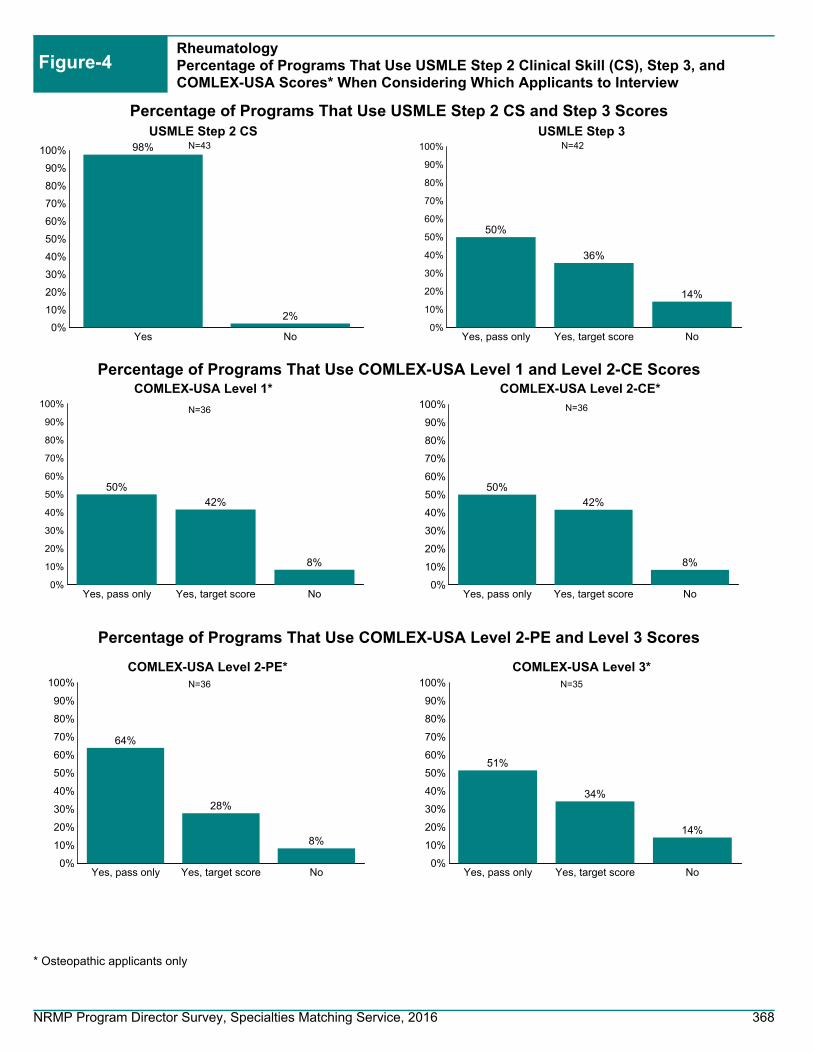
0%
10%
20%
30%
40%
50%
60%
70%
80%
90%
100%
Yes No
98%
2%
USMLE Step 2 CS
0%
10%
20%
30%
40%
50%
60%
70%
80%
90%
100%
Yes, pass only Yes, target score No
50%
36%
14%
USMLE Step 3
0%
10%
20%
30%
40%
50%
60%
70%
80%
90%
100%
Yes, pass only Yes, target score No
50%
42%
8%
COMLEX-USA Level 1*
RheumatologyPercentage of Programs That Use USMLE Step 2 Clinical Skill (CS), Step 3, and COMLEX-USA Scores* When Considering Which Applicants to Interview
Figure-4
0%
10%
20%
30%
40%
50%
60%
70%
80%
90%
100%
Yes, pass only Yes, target score No
50%
42%
8%
COMLEX-USA Level 2-CE*
0%
10%
20%
30%
40%
50%
60%
70%
80%
90%
100%
Yes, pass only Yes, target score No
51%
34%
14%
COMLEX-USA Level 3*
0%
10%
20%
30%
40%
50%
60%
70%
80%
90%
100%
Yes, pass only Yes, target score No
64%
28%
8%
COMLEX-USA Level 2-PE*
N=43 N=42
N=36 N=36
N=36 N=35
* Osteopathic applicants only
Percentage of Programs That Use USMLE Step 2 CS and Step 3 Scores
Percentage of Programs That Use COMLEX-USA Level 1 and Level 2-CE Scores
Percentage of Programs That Use COMLEX-USA Level 2-PE and Level 3 Scores
NRMP Program Director Survey, Specialties Matching Service, 2016 368

0%10%20%30%40%50%60%70%80%90%
100%
Never Seldom Often
47%53%
0%
Would your program consider applicants who fail theexam on the first attempt?
0%
10%
20%
30%
40%
50%
60%
70%
80%
90%
100%
Yes, pass only Yes, target score No, not required
20%
0%
80%
Scores required?
N=15
N=20
36.5%Optional
63.5%Required
Program Requirement on Dedicated Time forResearch
N=52
0
2
4
6
8
10
Accredited Locally Funded Integrated Other
9
7
5
7
Average Number of Months if Research Time isRequired
N=17 N=8 N=8 N=5
0.0
0.5
1.0
1.5
2.0
2.5
3.0
3.5
Accredited Positions Funded Positions
3.23.0
Average Number of Accredited Positions and Funded Positions
0%
10%
20%
30%
40%
50%
60%
70%
80%
90%
100%
Positions Filled BeforeMatch Day
Positions Offered Outsidethe Match
Positions Filled Outsidethe Match
72%
23% 23%
Average Percentage of Accredited Positions Offered Outside ofthe Match
N=51 N=51 N=12 N=2 N=2
RheumatologyPrograms That Use Core Specialty Certifying Examination When Considering Applicants for Interview
Figure-5
RheumatologyPrograms Positions Figure-6
RheumatologyDedicated Time for Research Figure-7
NRMP Program Director Survey, Specialties Matching Service, 2016 369

0%
10%
20%
30%
40%
50%
60%
70%
80%
90%
100%100%
87%
70%
43%
87%
76%
U.S. Graduate OsteopathicPhysician
Canadian Fifth Pathway U.S. IMG Non-U.S. IMG
Percentage of Programs that Typically Interview and Rank Each Applicant Type
Figure-8RheumatologyProgram's Interview Activities
0%10%20%30%40%50%60%70%80%90%
100%
Rejected based on astandardized screening
process
In-depth review
47% 50%
Average Percentage of Applicants Rejected and Reviewed
0
20
40
60
80
100
120
Number of applicationsreceived
Number of interviewinvitations sent
Number of applicantsinterviewed
107
21 18
Average Number of Positions, Applications Received, InterviewInvitations Sent, and Applicants Interviewed and Ranked
N=45N=45N=47N=48
N=46
43% of Rheumatology programs consider all applicant groups
N=47
0%10%20%30%40%50%60%70%80%90%
100%
Prev. Grad Osteo Pathway Canadian US IMG Non-USIMG
5%
41%21%
2%14%
4%
25%
44%
51%
36%
34%
96%
70%
15%28%
62%52%
Often Seldom Never
Interview
0%10%
20%
30%40%
50%60%
70%80%
90%100%
Prev. Grad Osteo Pathway Canadian US IMG Non-USIMG
7%
38%23%
12% 15%5%
26%
46%
44%
26%34%
95%
67%
16%33%
63%51%
Often Seldom Never
Ranking
n=44
Frequency of Programs Interviewing and Ranking Candidates
n=45
N=44
0%10%20%30%40%50%60%70%80%90%
100%
Jan Feb Mar Apr May Jun Jul Aug Sep Oct Nov Dec
0% 0% 0% 0% 0% 0%10%
52%
25%
12%2% 0%
Interview invitations
Interview Invitations Sent and Interviews Conducted
0% 0% 0% 0% 0% 0% 2%6%
39%46%
6%0%
Interviews conducted
NRMP Program Director Survey, Specialties Matching Service, 2016 370

Figure-9RheumatologyPotential Challenges in Recruiting Applicants to Your Specialty
0% 10% 20% 30% 40% 50% 60% 70% 80%
78%
17%
12%
0%
0%
We consider those applicants on an individual basis
We give those applicants serious consideration if they haveshown improvement
We do not usually consider those applicants
We favor those applicants
Other
0 1 2 3 4 5
Not enough applicants in the specialty
Undesirable income potential as a practicing physician
Undesirable work/life balance as a practicing physician
Long or irregular work hours required by specialty
Fellowship Match scheduled at inconvenient time of year
3.0
3.7
1.6
1.2
1.8
Average rating on a scale of 5 (1=least challenging; 5=most challenging)
n=39
9.1%Less than 3
11.4%3 to 5
31.8%6 to 10
22.7%11 to 15
25.0%More than
15
At Any Fellowship Program
11.6%Less than 3
23.3%3 to 5
32.6%6 to 10
23.3%11 to 15
9.3%More than 15
At Current Fellowship Program
n=41
n=44 n=43
RheumatologyApplicants Who Applied in the Specialty in the Past But Did Not Match Figure-10
RheumatologyYears as Program Director Figure-11
NRMP Program Director Survey, Specialties Matching Service, 2016 371

Sleep Medicine
NRMP Program Director Survey, Specialties Matching Service, 2016 372

Sleep MedicineGeneral Information
Table 1
72
142
127
Number of programs in the Match
Number of positions in the Match
Number of applicants ranking specialty
38.8%Response rate
Appointment Years
Number of responses 26
Match Information*
* Source: NRMP Data Warehouse
2016 Survey
2016 2015 2014
70
130
102
69
133
105
NRMP Program Director Survey, Specialties Matching Service, 2016 373

Figure-1Sleep MedicinePercentage of Programs Citing Each Factor and Mean Importance Rating¹ for Each Factor in Selecting Applicants to Interview(N=23)
Average RatingPercent Citing Factor
¹ Ratings on a scale from 1 (not at all important) to 5 (very important).* International Medical Graduates only
1 2 3 4 5
4.24.54.13.64.34.14.24.63.73.83.73.94.53.54.13.74.63.74.13.93.74.13.44.03.53.63.93.33.73.43.33.14.83.63.33.63.02.52.63.2
100% 50% 0%
87%78%65%78%91%83%87%78%74%70%74%61%61%61%74%70%48%57%48%57%43%39%30%43%48%22%43%43%30%39%35%30%35%52%17%22%13%
9%22%43%
Letters of recommendation in fellowship specialty
Residency performance evaluation (Program Director letter)
Reputation of residency program
Demonstrated involvement and perceived interest in research
Perceived commitment to specialty
Personal statement
Perceived interest in program
Evidence of professionalism and ethics
USMLE Step 1/COMLEX Level 1 score
Peer reviewed publications/authored textbook chapters
USMLE Step 2 CK/COMLEX Level 2 CE score
Leadership qualities
Personal prior professional knowledge of the applicant
Oral presentations/poster presentations/speaking engagements
Applicant was a resident in a core program at same institution
Pass USMLE Step 2 CS/COMLEX Level 2 PE
Any failed attempt in USMLE/COMLEX
USMLE Step 3/COMLEX Level 3 score
Interest in academic career
Residency program setting (univ.‐based vs. comm.‐based)
Clinical/laboratory research experience
Awards or special honors in medical school
Alpha Omega Alpha (AOA) membership
Other life experience
Medical Student Performance Evaluation (MSPE/Dean's Letter)
Graduate of highly‐regarded medical school
Visa status*
Volunteer/extracurricular experiences
Awarded grant money for research
Grades in medical school
Lack of gaps in medical education
Medical school class ranking/quartile
Applicant was flagged with Match violation by the NRMP
Electives at your fellowship site
Gold Humanism Honor Society (GHHS) membership
Residency class ranking/quartile
Fluency in language spoken by your patient population
In‐Training Examination (ITE)
Residency program size
Having finished another fellowship
NRMP Program Director Survey, Specialties Matching Service, 2016 374

Sleep MedicinePercentage of Programs Citing Each Factor and Mean Importance Rating¹ for Each Factor in Ranking Applicants(N=23)
Figure-2
Average RatingPercent Citing Factor
¹ Ratings on a scale from 1 (not at all important) to 5 (very important).* International Medical Graduates only
1 2 3 4 5
4.74.74.44.34.44.24.43.83.44.24.84.04.94.43.94.14.33.83.94.13.84.03.83.93.83.23.63.64.03.44.34.73.03.64.03.74.03.73.03.04.03.03.5
4.03.5
100% 50% 0%
86%90%86%81%76%76%76%62%43%76%71%76%52%38%43%43%62%57%52%38%57%24%48%38%29%24%24%48%38%24%24%29%10%33%10%14%10%33%14%10%5%5%
10%0%
14%19%
Interactions with faculty during interview and visitInterpersonal skills
Letters of recommendation in fellowship specialtyInteractions with house staff during interview and visit
Perceived commitment to specialtyFeedback from current residents and fellows
Perceived interest in programDemonstrated involvement and perceived interest in research
Reputation of residency programResidency performance evaluation (Program Director letter)
Evidence of professionalism and ethicsPersonal statement
Personal prior professional knowledge of the applicantLeadership qualities
Peer reviewed publications/authored textbook chaptersInterest in academic career
Applicant was a resident in a core program at same institutionUSMLE Step 1/COMLEX Level 1 score
USMLE Step 2 CK/COMLEX Level 2 CE scoreAny failed attempt in USMLE/COMLEX
Passing USMLE Step 2 CS/COMLEX Level 2 PEClinical/laboratory research experience
USMLE Step 3/COMLEX Level 3 scoreOral presentations/poster presentations/speaking engagements
Residency program setting (univ.‐based vs. comm.‐based)Alpha Omega Alpha (AOA) membership
Other life experienceMedical Student Performance Evaluation (MSPE/Dean's Letter)
Second interview/visitAwards or special honors in medical school
Visa status*Applicant was flagged with Match violation by the NRMP
Graduate of highly‐regarded medical schoolElectives at your fellowship site
Awarded grant money for researchVolunteer/extracurricular experiencesMedical school class ranking/quartile
Lack of gaps in medical educationGrades in medical school
Residency class ranking/quartileFluency in language spoken by your patient population
Gold Humanism Honor Society (GHHS) membershipResidency program size
In‐Training Examination (ITE)Second interview/visit
Having finished another fellowship
NRMP Program Director Survey, Specialties Matching Service, 2016 375

Sleep MedicinePrograms That Use USMLE Step 1 and Step 2 Clinical Knowledge (CK) Scores When Considering Which Applicants to Interview
Figure-3
Percentage of Programs That Use USMLE Step 2 (CK) Score
0%
10%
20%
30%
40%
50%
60%
70%
80%
90%
100%
Never Seldom Often
14%
71%
14%
Would your program consider applicants who fail theexam on the first attempt?
0%
10%
20%
30%
40%
50%
60%
70%
80%
90%
100%
Never Seldom often
19%
71%
10%
Would your program consider applicants who failthe exam on the first attempt?
0%
10%
20%
30%
40%
50%
60%
70%
80%
90%
100%
Yes, pass only Yes, target score No
81%
14%
5%
Scores required?
0%
10%
20%
30%
40%
50%
60%
70%
80%
90%
100%
Yes, pass only Yes, target score No
81%
14%
5%
Scores required?
N=21
N=21
N=21N=21
IQR* of Average USMLE Step 1 and Step 2 CK Scores Programs Consider When Granting Interviews
Percentage of Programs That Use USMLE Step 1 Score
*The boxes in the boxplots represent the interquartile range (or IQR, which is the range between the 25th and 75th percentiles), and the line in the box is the median. The x-shaped symbol is the mean.
Scores Above Which Programs Almost Always Grant Interviews
Scores Below Which Programs Generally Do Not Grant Interviews
USMLE Step 2 CK not reported
because of low response rate
USMLE Step 1 not reported because of low response
rate
USMLE Step 2 CK not reported
because of low response rate
USMLE Step 1 not reported because of low response
rate
NRMP Program Director Survey, Specialties Matching Service, 2016 376

0%
10%
20%
30%
40%
50%
60%
70%
80%
90%
100%
Yes No
95%
5%
USMLE Step 2 CS
0%
10%
20%
30%
40%
50%
60%
70%
80%
90%
100%
Yes, pass only Yes, target score No
86%
9%5%
USMLE Step 3
0%
10%
20%
30%
40%
50%
60%
70%
80%
90%
100%
Yes, pass only Yes, target score No
77%
8%15%
COMLEX-USA Level 1*
Sleep MedicinePercentage of Programs That Use USMLE Step 2 Clinical Skill (CS), Step 3, and COMLEX-USA Scores* When Considering Which Applicants to Interview
Figure-4
0%
10%
20%
30%
40%
50%
60%
70%
80%
90%
100%
Yes, pass only Yes, target score No
77%
8%15%
COMLEX-USA Level 2-CE*
0%
10%
20%
30%
40%
50%
60%
70%
80%
90%
100%
Yes, pass only Yes, target score No
77%
8%15%
COMLEX-USA Level 3*
0%
10%
20%
30%
40%
50%
60%
70%
80%
90%
100%
Yes, pass only Yes, target score No
77%
8%15%
COMLEX-USA Level 2-PE*
N=21 N=22
N=13 N=13
N=13 N=13
* Osteopathic applicants only
Percentage of Programs That Use USMLE Step 2 CS and Step 3 Scores
Percentage of Programs That Use COMLEX-USA Level 1 and Level 2-CE Scores
Percentage of Programs That Use COMLEX-USA Level 2-PE and Level 3 Scores
NRMP Program Director Survey, Specialties Matching Service, 2016 377
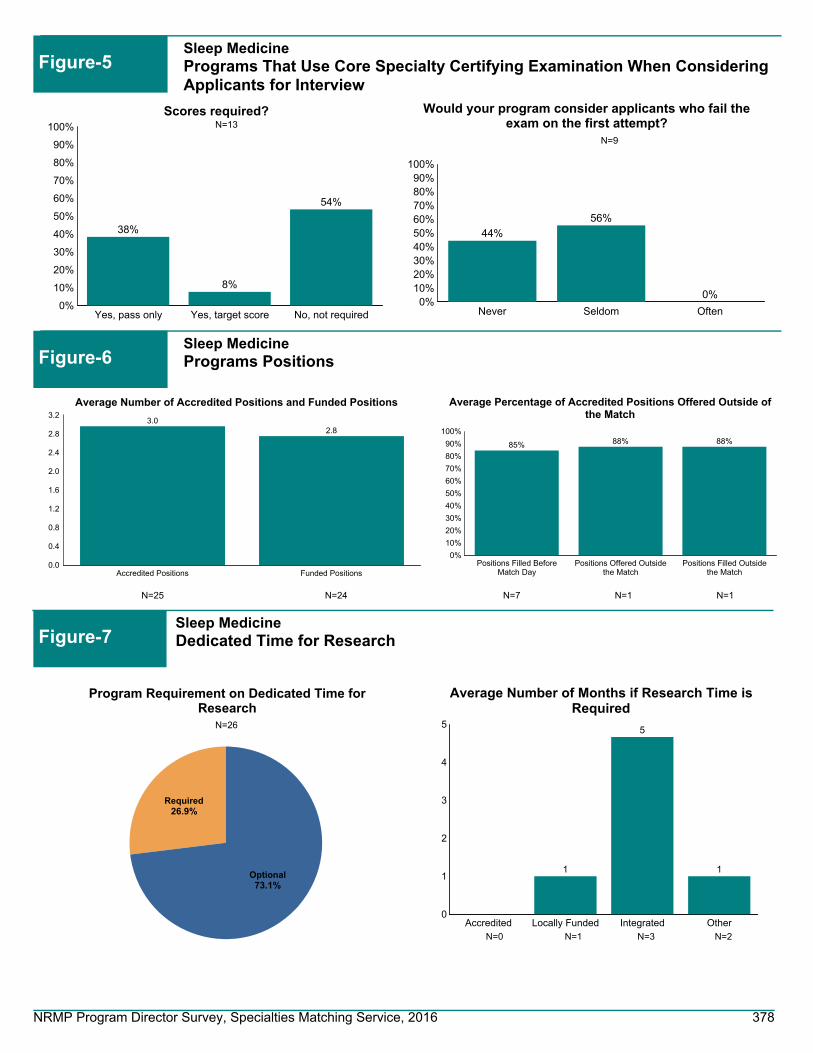
0%10%20%30%40%50%60%70%80%90%
100%
Never Seldom Often
44%
56%
0%
Would your program consider applicants who fail theexam on the first attempt?
0%
10%
20%
30%
40%
50%
60%
70%
80%
90%
100%
Yes, pass only Yes, target score No, not required
38%
8%
54%
Scores required?
N=9
N=13
73.1%Optional
26.9%Required
Program Requirement on Dedicated Time forResearch
N=26
0
1
2
3
4
5
Accredited Locally Funded Integrated Other
1
5
1
Average Number of Months if Research Time isRequired
N=0 N=1 N=3 N=2
0.0
0.4
0.8
1.2
1.6
2.0
2.4
2.8
3.2
Accredited Positions Funded Positions
3.02.8
Average Number of Accredited Positions and Funded Positions
0%
10%
20%
30%
40%
50%
60%
70%
80%
90%
100%
Positions Filled BeforeMatch Day
Positions Offered Outsidethe Match
Positions Filled Outsidethe Match
85% 88% 88%
Average Percentage of Accredited Positions Offered Outside ofthe Match
N=25 N=24 N=7 N=1 N=1
Sleep MedicinePrograms That Use Core Specialty Certifying Examination When Considering Applicants for Interview
Figure-5
Sleep MedicinePrograms Positions Figure-6
Sleep MedicineDedicated Time for Research Figure-7
NRMP Program Director Survey, Specialties Matching Service, 2016 378

0%
10%
20%
30%
40%
50%
60%
70%
80%
90%
100%100%
95%
68%
23%
91%
73%
U.S. Graduate OsteopathicPhysician
Canadian Fifth Pathway U.S. IMG Non-U.S. IMG
Percentage of Programs that Typically Interview and Rank Each Applicant Type
Figure-8Sleep MedicineProgram's Interview Activities
0%10%20%30%40%50%60%70%80%90%
100%
Rejected based on astandardized screening
process
In-depth review
39%
73%
Average Percentage of Applicants Rejected and Reviewed
0
5
10
15
20
25
30
35
Number of applicationsreceived
Number of interviewinvitations sent
Number of applicantsinterviewed
32
1411
Average Number of Positions, Applications Received, InterviewInvitations Sent, and Applicants Interviewed and Ranked
N=22N=20N=22N=22
N=22
23% of Sleep Medicine programs consider all applicant groups
N=22
0%10%20%30%40%50%60%70%80%90%
100%
Prev. Grad Osteo Pathway Canadian US IMG Non-USIMG
63%
15% 14%9%23%
26%
60%
23%
24%
91%77%
11%25%
77%62%
Often Seldom Never
Interview
0%10%
20%
30%40%
50%60%
70%80%
90%100%
Prev. Grad Osteo Pathway Canadian US IMG Non-USIMG
63%
6%16%11%
35%
25%
71%
30%
26%
89%
65%
13%24%
70%58%
Often Seldom Never
Ranking
n=19
Frequency of Programs Interviewing and Ranking Candidates
n=22
N=19
0%10%20%30%40%50%60%70%80%90%
100%
Jan Feb Mar Apr May Jun Jul Aug Sep Oct Nov Dec
0% 0% 1% 3% 1% 0%
21%
57%
15%
3% 0% 0%
Interview invitations
Interview Invitations Sent and Interviews Conducted
0% 0% 1% 2% 1% 0% 3%
23%
47%
12%1% 0%
Interviews conducted
NRMP Program Director Survey, Specialties Matching Service, 2016 379

Figure-9Sleep MedicinePotential Challenges in Recruiting Applicants to Your Specialty
0% 10% 20% 30% 40% 50% 60% 70% 80% 90%
81%
33%
5%
5%
0%
We consider those applicants on an individual basis
We give those applicants serious consideration if they haveshown improvement
We do not usually consider those applicants
We favor those applicants
Other
0 1 2 3 4 5
Not enough applicants in the specialty
Undesirable income potential as a practicing physician
Undesirable work/life balance as a practicing physician
Long or irregular work hours required by specialty
Fellowship Match scheduled at inconvenient time of year
4.3
2.9
1.7
1.4
2.5
Average rating on a scale of 5 (1=least challenging; 5=most challenging)
n=21
21.7%Less than 3
21.7%3 to 5
34.8%6 to 10
17.4%11 to 15
4.3%More than 15
At Any Fellowship Program
27.3%Less than 3
13.6%3 to 5
36.4%6 to 10
18.2%11 to 15
4.5%More than 15
At Current Fellowship Program
n=21
n=23 n=22
Sleep MedicineApplicants Who Applied in the Specialty in the Past But Did Not Match Figure-10
Sleep MedicineYears as Program Director Figure-11
NRMP Program Director Survey, Specialties Matching Service, 2016 380

Sports Medicine
NRMP Program Director Survey, Specialties Matching Service, 2016 381

Sports MedicineGeneral Information
Table 1
158
247
298
Number of programs in the Match
Number of positions in the Match
Number of applicants ranking specialty
43.4%Response rate
Appointment Years
Number of responses 62
Match Information*
* Source: NRMP Data Warehouse
2016 Survey
2016 2015 2014
152
236
325
139
206
286
NRMP Program Director Survey, Specialties Matching Service, 2016 382

Figure-1Sports MedicinePercentage of Programs Citing Each Factor and Mean Importance Rating¹ for Each Factor in Selecting Applicants to Interview(N=58)
Average RatingPercent Citing Factor
¹ Ratings on a scale from 1 (not at all important) to 5 (very important).* International Medical Graduates only
1 2 3 4 5
4.64.23.53.74.74.14.54.53.63.43.84.44.13.63.73.94.14.04.02.93.73.23.53.93.53.34.34.43.33.63.83.44.73.93.33.94.43.83.01.3
100% 50% 0%
97%86%76%62%91%86%86%76%84%66%81%83%88%72%67%79%91%78%38%16%26%59%47%62%52%38%50%86%21%41%50%33%45%69%28%14%
9%17%
2%5%
Letters of recommendation in fellowship specialty
Residency performance evaluation (Program Director letter)
Reputation of residency program
Demonstrated involvement and perceived interest in research
Perceived commitment to specialty
Personal statement
Perceived interest in program
Evidence of professionalism and ethics
USMLE Step 1/COMLEX Level 1 score
Peer reviewed publications/authored textbook chapters
USMLE Step 2 CK/COMLEX Level 2 CE score
Leadership qualities
Personal prior professional knowledge of the applicant
Oral presentations/poster presentations/speaking engagements
Applicant was a resident in a core program at same institution
Pass USMLE Step 2 CS/COMLEX Level 2 PE
Any failed attempt in USMLE/COMLEX
USMLE Step 3/COMLEX Level 3 score
Interest in academic career
Residency program setting (univ.‐based vs. comm.‐based)
Clinical/laboratory research experience
Awards or special honors in medical school
Alpha Omega Alpha (AOA) membership
Other life experience
Medical Student Performance Evaluation (MSPE/Dean's Letter)
Graduate of highly‐regarded medical school
Visa status*
Volunteer/extracurricular experiences
Awarded grant money for research
Grades in medical school
Lack of gaps in medical education
Medical school class ranking/quartile
Applicant was flagged with Match violation by the NRMP
Electives at your fellowship site
Gold Humanism Honor Society (GHHS) membership
Residency class ranking/quartile
Fluency in language spoken by your patient population
In‐Training Examination (ITE)
Residency program size
Having finished another fellowship
NRMP Program Director Survey, Specialties Matching Service, 2016 383

Sports MedicinePercentage of Programs Citing Each Factor and Mean Importance Rating¹ for Each Factor in Ranking Applicants(N=58)
Figure-2
Average RatingPercent Citing Factor
¹ Ratings on a scale from 1 (not at all important) to 5 (very important).* International Medical Graduates only
1 2 3 4 5
4.94.74.54.94.64.84.43.63.64.14.64.14.34.43.73.83.73.63.74.13.73.33.93.73.13.83.73.63.93.64.44.73.64.33.94.43.53.73.63.84.83.8
4.23.93.0
100% 50% 0%
96%96%84%79%86%86%84%46%50%54%68%75%75%77%46%38%54%54%55%79%54%21%59%59%13%23%54%27%50%32%29%38%20%61%13%70%20%27%25%16%7%
11%0%
11%25%5%
Interactions with faculty during interview and visitInterpersonal skills
Letters of recommendation in fellowship specialtyInteractions with house staff during interview and visit
Perceived commitment to specialtyFeedback from current residents and fellows
Perceived interest in programDemonstrated involvement and perceived interest in research
Reputation of residency programResidency performance evaluation (Program Director letter)
Evidence of professionalism and ethicsPersonal statement
Personal prior professional knowledge of the applicantLeadership qualities
Peer reviewed publications/authored textbook chaptersInterest in academic career
Applicant was a resident in a core program at same institutionUSMLE Step 1/COMLEX Level 1 score
USMLE Step 2 CK/COMLEX Level 2 CE scoreAny failed attempt in USMLE/COMLEX
Passing USMLE Step 2 CS/COMLEX Level 2 PEClinical/laboratory research experience
USMLE Step 3/COMLEX Level 3 scoreOral presentations/poster presentations/speaking engagements
Residency program setting (univ.‐based vs. comm.‐based)Alpha Omega Alpha (AOA) membership
Other life experienceMedical Student Performance Evaluation (MSPE/Dean's Letter)
Second interview/visitAwards or special honors in medical school
Visa status*Applicant was flagged with Match violation by the NRMP
Graduate of highly‐regarded medical schoolElectives at your fellowship site
Awarded grant money for researchVolunteer/extracurricular experiencesMedical school class ranking/quartile
Lack of gaps in medical educationGrades in medical school
Residency class ranking/quartileFluency in language spoken by your patient population
Gold Humanism Honor Society (GHHS) membershipResidency program size
In‐Training Examination (ITE)Second interview/visit
Having finished another fellowship
NRMP Program Director Survey, Specialties Matching Service, 2016 384
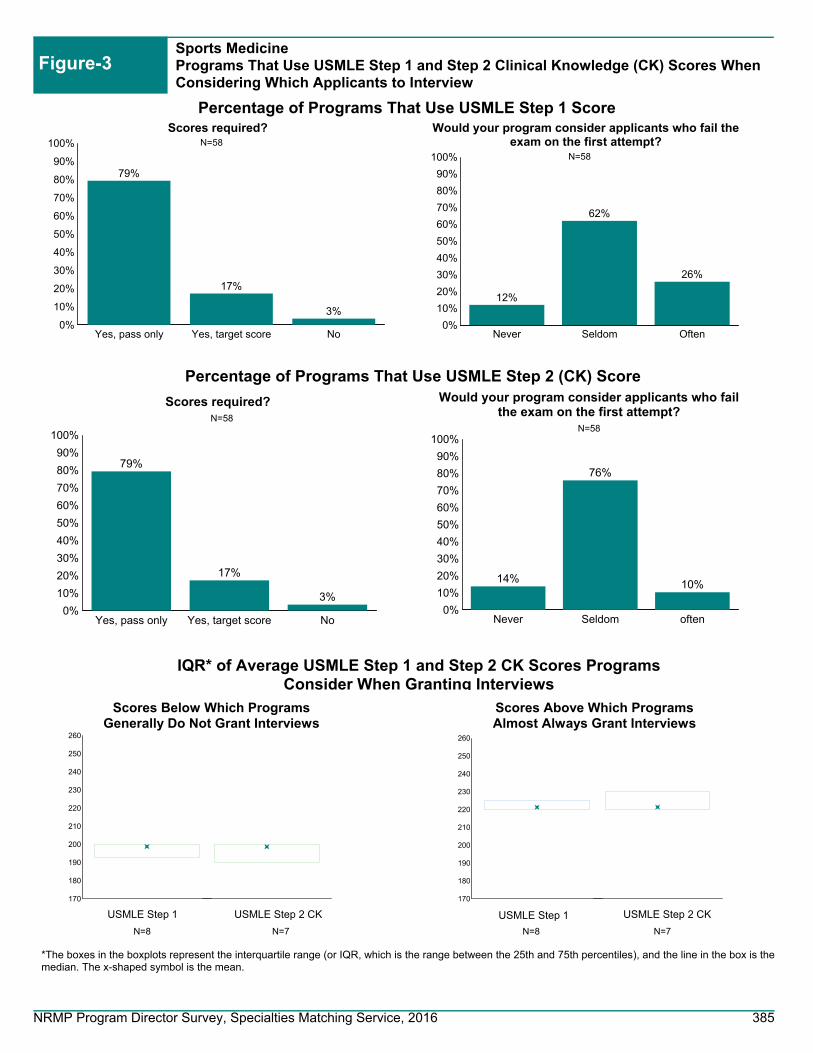
170
180
190
200
210
220
230
240
250
260
Sports MedicinePrograms That Use USMLE Step 1 and Step 2 Clinical Knowledge (CK) Scores When Considering Which Applicants to Interview
Figure-3
Percentage of Programs That Use USMLE Step 2 (CK) Score
0%
10%
20%
30%
40%
50%
60%
70%
80%
90%
100%
Never Seldom Often
12%
62%
26%
Would your program consider applicants who fail theexam on the first attempt?
0%
10%
20%
30%
40%
50%
60%
70%
80%
90%
100%
Never Seldom often
14%
76%
10%
Would your program consider applicants who failthe exam on the first attempt?
0%
10%
20%
30%
40%
50%
60%
70%
80%
90%
100%
Yes, pass only Yes, target score No
79%
17%
3%
Scores required?
0%
10%
20%
30%
40%
50%
60%
70%
80%
90%
100%
Yes, pass only Yes, target score No
79%
17%
3%
Scores required?
N=58
N=58
N=58N=58
N=7N=8 N=8 N=7
IQR* of Average USMLE Step 1 and Step 2 CK Scores Programs Consider When Granting Interviews
Percentage of Programs That Use USMLE Step 1 Score
170
180
190
200
210
220
230
240
250
260
USMLE Step 2 CKUSMLE Step 1 USMLE Step 1 USMLE Step 2 CK
*The boxes in the boxplots represent the interquartile range (or IQR, which is the range between the 25th and 75th percentiles), and the line in the box is the median. The x-shaped symbol is the mean.
Scores Above Which Programs Almost Always Grant Interviews
Scores Below Which Programs Generally Do Not Grant Interviews
NRMP Program Director Survey, Specialties Matching Service, 2016 385

0%
10%
20%
30%
40%
50%
60%
70%
80%
90%
100%
Yes No
97%
3%
USMLE Step 2 CS
0%
10%
20%
30%
40%
50%
60%
70%
80%
90%
100%
Yes, pass only Yes, target score No
75%
20%
5%
USMLE Step 3
0%
10%
20%
30%
40%
50%
60%
70%
80%
90%
100%
Yes, pass only Yes, target score No
71%
15% 15%
COMLEX-USA Level 1*
Sports MedicinePercentage of Programs That Use USMLE Step 2 Clinical Skill (CS), Step 3, and COMLEX-USA Scores* When Considering Which Applicants to Interview
Figure-4
0%
10%
20%
30%
40%
50%
60%
70%
80%
90%
100%
Yes, pass only Yes, target score No
71%
15% 15%
COMLEX-USA Level 2-CE*
0%
10%
20%
30%
40%
50%
60%
70%
80%
90%
100%
Yes, pass only Yes, target score No
69%
17% 15%
COMLEX-USA Level 3*
0%
10%
20%
30%
40%
50%
60%
70%
80%
90%
100%
Yes, pass only Yes, target score No
73%
13% 15%
COMLEX-USA Level 2-PE*
N=58 N=56
N=55 N=55
N=55 N=54
* Osteopathic applicants only
Percentage of Programs That Use USMLE Step 2 CS and Step 3 Scores
Percentage of Programs That Use COMLEX-USA Level 1 and Level 2-CE Scores
Percentage of Programs That Use COMLEX-USA Level 2-PE and Level 3 Scores
NRMP Program Director Survey, Specialties Matching Service, 2016 386

0%10%20%30%40%50%60%70%80%90%
100%
Never Seldom Often
29%
65%
6%
Would your program consider applicants who fail theexam on the first attempt?
0%
10%
20%
30%
40%
50%
60%
70%
80%
90%
100%
Yes, pass only Yes, target score No, not required
38%
3%
59%
Scores required?
N=31
N=37
59.7%Optional
40.3%Required
Program Requirement on Dedicated Time forResearch
N=62
0
2
4
6
8
10
Accredited Locally Funded Integrated Other
5
6
5
10
Average Number of Months if Research Time isRequired
N=6 N=2 N=8 N=5
0.0
0.4
0.8
1.2
1.6
2.0
Accredited Positions Funded Positions
1.91.8
Average Number of Accredited Positions and Funded Positions
0%
10%
20%
30%
40%
50%
60%
70%
80%
90%
100%
Positions Filled BeforeMatch Day
Positions Offered Outsidethe Match
Positions Filled Outsidethe Match
100%
88%83%
Average Percentage of Accredited Positions Offered Outside ofthe Match
N=61 N=57 N=8 N=4 N=3
Sports MedicinePrograms That Use Core Specialty Certifying Examination When Considering Applicants for Interview
Figure-5
Sports MedicinePrograms Positions Figure-6
Sports MedicineDedicated Time for Research Figure-7
NRMP Program Director Survey, Specialties Matching Service, 2016 387

0%
10%
20%
30%
40%
50%
60%
70%
80%
90%
100%100% 98%
51%
19%
80%
27%
U.S. Graduate OsteopathicPhysician
Canadian Fifth Pathway U.S. IMG Non-U.S. IMG
Percentage of Programs that Typically Interview and Rank Each Applicant Type
Figure-8Sports MedicineProgram's Interview Activities
0%10%20%30%40%50%60%70%80%90%
100%
Rejected based on astandardized screening
process
In-depth review
40%
69%
Average Percentage of Applicants Rejected and Reviewed
0
10
20
30
40
50
60
Number of applicationsreceived
Number of interviewinvitations sent
Number of applicantsinterviewed
53
1714
Average Number of Positions, Applications Received, InterviewInvitations Sent, and Applicants Interviewed and Ranked
N=58N=57N=57N=58
N=59
8% of Sports Medicine programs consider all applicant groups
N=58
0%10%20%30%40%50%60%70%80%90%
100%
Prev. Grad Osteo Pathway Canadian US IMG Non-USIMG
75%
32%
5%
39%
5% 7%
23%
54%
49%
56%
95% 93%
2%14%
46%
5%
Often Seldom Never
Interview
0%10%
20%
30%40%
50%60%
70%80%
90%100%
Prev. Grad Osteo Pathway Canadian US IMG Non-USIMG
78%
36%
8%
49%
5% 7%
20%
53%
49%
46%
95% 93%
2%12%
42%
5%
Often Seldom Never
Ranking
n=59
Frequency of Programs Interviewing and Ranking Candidates
n=59
N=57
0%10%20%30%40%50%60%70%80%90%
100%
Jan Feb Mar Apr May Jun Jul Aug Sep Oct Nov Dec
1% 0% 0% 0% 0% 0% 2%
19%
44%
29%
5% 0%
Interview invitations
Interview Invitations Sent and Interviews Conducted
2% 0% 0% 0% 0% 0% 0% 1%9%
44%38%
6%
Interviews conducted
NRMP Program Director Survey, Specialties Matching Service, 2016 388

Figure-9Sports MedicinePotential Challenges in Recruiting Applicants to Your Specialty
0% 20% 40% 60% 80% 100%
93%
36%
4%
0%
0%
We consider those applicants on an individual basis
We give those applicants serious consideration if they haveshown improvement
We do not usually consider those applicants
We favor those applicants
Other
0 1 2 3 4 5
Not enough applicants in the specialty
Undesirable income potential as a practicing physician
Undesirable work/life balance as a practicing physician
Long or irregular work hours required by specialty
Fellowship Match scheduled at inconvenient time of year
2.0
2.1
2.2
1.8
1.9
Average rating on a scale of 5 (1=least challenging; 5=most challenging)
n=53
20.4%Less than
3
26.5%3 to 5
26.5%6 to 10
10.2%11 to 15
16.3%More than 15
At Any Fellowship Program
24.5%Less than 3
32.7%3 to 5
26.5%6 to 10
6.1%11 to 15
10.2%More than 15
At Current Fellowship Program
n=56
n=49 n=49
Sports MedicineApplicants Who Applied in the Specialty in the Past But Did Not Match Figure-10
Sports MedicineYears as Program Director Figure-11
NRMP Program Director Survey, Specialties Matching Service, 2016 389

Surgical Critical Care
NRMP Program Director Survey, Specialties Matching Service, 2016 390

Surgical Critical CareGeneral Information
Table 1
119
241
208
Number of programs in the Match
Number of positions in the Match
Number of applicants ranking specialty
35.6%Response rate
Appointment Years
Number of responses 36
Match Information*
* Source: NRMP Data Warehouse
2016 Survey
2016 2015 2014
108
212
187
95
185
157
NRMP Program Director Survey, Specialties Matching Service, 2016 391

Figure-1Surgical Critical CarePercentage of Programs Citing Each Factor and Mean Importance Rating¹ for Each Factor in Selecting Applicants to Interview(N=28)
Average RatingPercent Citing Factor
¹ Ratings on a scale from 1 (not at all important) to 5 (very important).* International Medical Graduates only
1 2 3 4 5
4.44.33.93.74.53.54.04.53.93.43.84.34.33.64.03.64.63.43.93.93.43.33.53.43.43.24.53.13.63.53.93.64.43.63.93.73.33.74.03.0
100% 50% 0%
93%86%89%82%82%71%75%68%57%68%54%57%64%64%71%43%43%50%46%64%57%36%46%46%25%32%39%32%32%21%39%25%18%29%36%36%11%71%14%14%
Letters of recommendation in fellowship specialty
Residency performance evaluation (Program Director letter)
Reputation of residency program
Demonstrated involvement and perceived interest in research
Perceived commitment to specialty
Personal statement
Perceived interest in program
Evidence of professionalism and ethics
USMLE Step 1/COMLEX Level 1 score
Peer reviewed publications/authored textbook chapters
USMLE Step 2 CK/COMLEX Level 2 CE score
Leadership qualities
Personal prior professional knowledge of the applicant
Oral presentations/poster presentations/speaking engagements
Applicant was a resident in a core program at same institution
Pass USMLE Step 2 CS/COMLEX Level 2 PE
Any failed attempt in USMLE/COMLEX
USMLE Step 3/COMLEX Level 3 score
Interest in academic career
Residency program setting (univ.‐based vs. comm.‐based)
Clinical/laboratory research experience
Awards or special honors in medical school
Alpha Omega Alpha (AOA) membership
Other life experience
Medical Student Performance Evaluation (MSPE/Dean's Letter)
Graduate of highly‐regarded medical school
Visa status*
Volunteer/extracurricular experiences
Awarded grant money for research
Grades in medical school
Lack of gaps in medical education
Medical school class ranking/quartile
Applicant was flagged with Match violation by the NRMP
Electives at your fellowship site
Gold Humanism Honor Society (GHHS) membership
Residency class ranking/quartile
Fluency in language spoken by your patient population
In‐Training Examination (ITE)
Residency program size
Having finished another fellowship
NRMP Program Director Survey, Specialties Matching Service, 2016 392

Surgical Critical CarePercentage of Programs Citing Each Factor and Mean Importance Rating¹ for Each Factor in Ranking Applicants(N=28)
Figure-2
Average RatingPercent Citing Factor
¹ Ratings on a scale from 1 (not at all important) to 5 (very important).* International Medical Graduates only
1 2 3 4 5
4.94.64.44.74.14.64.33.63.84.14.53.64.44.13.74.03.83.73.64.63.83.53.83.43.83.93.73.54.13.24.35.03.34.03.83.03.04.32.73.03.34.03.54.04.03.3
100% 50% 0%
88%96%58%73%69%69%73%73%58%46%50%38%62%58%42%38%42%42%38%27%19%42%23%42%35%31%27%8%
27%19%12%12%15%12%15%8%
15%15%12%12%12%12%8%
46%12%12%
Interactions with faculty during interview and visitInterpersonal skills
Letters of recommendation in fellowship specialtyInteractions with house staff during interview and visit
Perceived commitment to specialtyFeedback from current residents and fellows
Perceived interest in programDemonstrated involvement and perceived interest in research
Reputation of residency programResidency performance evaluation (Program Director letter)
Evidence of professionalism and ethicsPersonal statement
Personal prior professional knowledge of the applicantLeadership qualities
Peer reviewed publications/authored textbook chaptersInterest in academic career
Applicant was a resident in a core program at same institutionUSMLE Step 1/COMLEX Level 1 score
USMLE Step 2 CK/COMLEX Level 2 CE scoreAny failed attempt in USMLE/COMLEX
Passing USMLE Step 2 CS/COMLEX Level 2 PEClinical/laboratory research experience
USMLE Step 3/COMLEX Level 3 scoreOral presentations/poster presentations/speaking engagements
Residency program setting (univ.‐based vs. comm.‐based)Alpha Omega Alpha (AOA) membership
Other life experienceMedical Student Performance Evaluation (MSPE/Dean's Letter)
Second interview/visitAwards or special honors in medical school
Visa status*Applicant was flagged with Match violation by the NRMP
Graduate of highly‐regarded medical schoolElectives at your fellowship site
Awarded grant money for researchVolunteer/extracurricular experiencesMedical school class ranking/quartile
Lack of gaps in medical educationGrades in medical school
Residency class ranking/quartileFluency in language spoken by your patient population
Gold Humanism Honor Society (GHHS) membershipResidency program size
In‐Training Examination (ITE)Second interview/visit
Having finished another fellowship
NRMP Program Director Survey, Specialties Matching Service, 2016 393

170
180
190
200
210
220
230
240
250
260
Surgical Critical CarePrograms That Use USMLE Step 1 and Step 2 Clinical Knowledge (CK) Scores When Considering Which Applicants to Interview
Figure-3
Percentage of Programs That Use USMLE Step 2 (CK) Score
0%
10%
20%
30%
40%
50%
60%
70%
80%
90%
100%
Never Seldom Often
28%
56%
16%
Would your program consider applicants who fail theexam on the first attempt?
0%
10%
20%
30%
40%
50%
60%
70%
80%
90%
100%
Never Seldom often
27%
62%
12%
Would your program consider applicants who failthe exam on the first attempt?
0%
10%
20%
30%
40%
50%
60%
70%
80%
90%
100%
Yes, pass only Yes, target score No
68%
24%
8%
Scores required?
0%
10%
20%
30%
40%
50%
60%
70%
80%
90%
100%
Yes, pass only Yes, target score No
73%
15%12%
Scores required?
N=25
N=25
N=26N=26
N=6 N=5
IQR* of Average USMLE Step 1 and Step 2 CK Scores Programs Consider When Granting Interviews
Percentage of Programs That Use USMLE Step 1 Score
170
180
190
200
210
220
230
240
250
260
USMLE Step 1 USMLE Step 1
*The boxes in the boxplots represent the interquartile range (or IQR, which is the range between the 25th and 75th percentiles), and the line in the box is the median. The x-shaped symbol is the mean.
Scores Above Which Programs Almost Always Grant Interviews
Scores Below Which Programs Generally Do Not Grant Interviews
USMLE Step 2 CK not reported
because of low response rate
USMLE Step 2 CK not reported
because of low response rate
NRMP Program Director Survey, Specialties Matching Service, 2016 394

0%
10%
20%
30%
40%
50%
60%
70%
80%
90%
100%
Yes No
88%
12%
USMLE Step 2 CS
0%
10%
20%
30%
40%
50%
60%
70%
80%
90%
100%
Yes, pass only Yes, target score No
69%
15% 15%
USMLE Step 3
0%
10%
20%
30%
40%
50%
60%
70%
80%
90%
100%
Yes, pass only Yes, target score No
25%
13%
63%
COMLEX-USA Level 1*
Surgical Critical CarePercentage of Programs That Use USMLE Step 2 Clinical Skill (CS), Step 3, and COMLEX-USA Scores* When Considering Which Applicants to Interview
Figure-4
0%
10%
20%
30%
40%
50%
60%
70%
80%
90%
100%
Yes, pass only Yes, target score No
25%
13%
63%
COMLEX-USA Level 2-CE*
0%
10%
20%
30%
40%
50%
60%
70%
80%
90%
100%
Yes, pass only Yes, target score No
25%
13%
63%
COMLEX-USA Level 3*
0%
10%
20%
30%
40%
50%
60%
70%
80%
90%
100%
Yes, pass only Yes, target score No
25%
13%
63%
COMLEX-USA Level 2-PE*
N=25 N=26
N=16 N=16
N=16 N=16
* Osteopathic applicants only
Percentage of Programs That Use USMLE Step 2 CS and Step 3 Scores
Percentage of Programs That Use COMLEX-USA Level 1 and Level 2-CE Scores
Percentage of Programs That Use COMLEX-USA Level 2-PE and Level 3 Scores
NRMP Program Director Survey, Specialties Matching Service, 2016 395

0%10%20%30%40%50%60%70%80%90%
100%
Never Seldom Often
14%
79%
7%
Would your program consider applicants who fail theexam on the first attempt?
0%
10%
20%
30%
40%
50%
60%
70%
80%
90%
100%
Yes, pass only Yes, target score No, not required
28%
6%
67%
Scores required?
N=14
N=18
91.7%Optional
8.3%Required
Program Requirement on Dedicated Time forResearch
N=36
0
2
4
6
8
10
12
Accredited Locally Funded Integrated Other
1
12
Average Number of Months if Research Time isRequired
N=0 N=1 N=0 N=1
0.0
0.5
1.0
1.5
2.0
2.5
3.0
3.5
4.0
Accredited Positions Funded Positions
3.53.3
Average Number of Accredited Positions and Funded Positions
0%
10%
20%
30%
40%
50%
60%
70%
80%
90%
100%
Positions Filled BeforeMatch Day
Positions Offered Outsidethe Match
Positions Filled Outsidethe Match
86%
117%
68%
Average Percentage of Accredited Positions Offered Outside ofthe Match
N=35 N=35 N=14 N=5 N=4
Surgical Critical CarePrograms That Use Core Specialty Certifying Examination When Considering Applicants for Interview
Figure-5
Surgical Critical CarePrograms Positions Figure-6
Surgical Critical CareDedicated Time for Research Figure-7
NRMP Program Director Survey, Specialties Matching Service, 2016 396

0%
10%
20%
30%
40%
50%
60%
70%
80%
90%
100%100%
79%
45%
24%
52%
17%
U.S. Graduate OsteopathicPhysician
Canadian Fifth Pathway U.S. IMG Non-U.S. IMG
Percentage of Programs that Typically Interview and Rank Each Applicant Type
Figure-8Surgical Critical CareProgram's Interview Activities
0%10%20%30%40%50%60%70%80%90%
100%
Rejected based on astandardized screening
process
In-depth review
32%
75%
Average Percentage of Applicants Rejected and Reviewed
0
10
20
30
40
50
60
Number of applicationsreceived
Number of interviewinvitations sent
Number of applicantsinterviewed
60
2219
Average Number of Positions, Applications Received, InterviewInvitations Sent, and Applicants Interviewed and Ranked
N=32N=33N=33N=33
N=29
14% of Surgical Critical Care programs consider all applicant groups
N=33
0%10%20%30%40%50%60%70%80%90%
100%
Prev. Grad Osteo Pathway Canadian US IMG Non-USIMG
10%
74%
44%
11%
59%
10%
59%
26%
48%
86%
37%
90%
31%
7% 4% 4%
Often Seldom Never
Interview
0%10%
20%
30%40%
50%60%
70%80%
90%100%
Prev. Grad Osteo Pathway Canadian US IMG Non-USIMG
10%
78%
56%
14%
73%
14%
69%
22%
41%
82%
23%
86%
21%4% 4% 4%
Often Seldom Never
Ranking
n=29
Frequency of Programs Interviewing and Ranking Candidates
n=29
N=28
0%10%20%30%40%50%60%70%80%90%
100%
Jan Feb Mar Apr May Jun Jul Aug Sep Oct Nov Dec
0% 4% 0% 4%12%
37%
22%
10% 7%1% 0% 4%
Interview invitations
Interview Invitations Sent and Interviews Conducted
0% 0% 3% 0% 1%7%
32% 35%
9%1% 1% 4%
Interviews conducted
NRMP Program Director Survey, Specialties Matching Service, 2016 397

Figure-9Surgical Critical CarePotential Challenges in Recruiting Applicants to Your Specialty
0% 10% 20% 30% 40% 50% 60% 70% 80%
80%
16%
16%
0%
0%
We consider those applicants on an individual basis
We give those applicants serious consideration if they haveshown improvement
We do not usually consider those applicants
We favor those applicants
Other
0 1 2 3 4 5
Not enough applicants in the specialty
Undesirable income potential as a practicing physician
Undesirable work/life balance as a practicing physician
Long or irregular work hours required by specialty
Fellowship Match scheduled at inconvenient time of year
3.1
2.3
3.6
2.8
2.4
Average rating on a scale of 5 (1=least challenging; 5=most challenging)
n=26
24.2%Less than 3
24.2%3 to 5
24.2%6 to 10
15.2%11 to 15
12.1%More than 15
At Any Fellowship Program
34.4%Less than
3
25.0%3 to 5
18.8%6 to 10
18.8%11 to 15
3.1%More than 15
At Current Fellowship Program
n=25
n=33 n=32
Surgical Critical CareApplicants Who Applied in the Specialty in the Past But Did Not Match Figure-10
Surgical Critical CareYears as Program Director Figure-11
NRMP Program Director Survey, Specialties Matching Service, 2016 398

Thoracic Surgery
NRMP Program Director Survey, Specialties Matching Service, 2016 399

Thoracic SurgeryGeneral Information
Table 1
67
90
127
Number of programs in the Match
Number of positions in the Match
Number of applicants ranking specialty
31.0%Response rate
Appointment Years
Number of responses 18
Match Information*
* Source: NRMP Data Warehouse
2016 Survey
2016 2015 2014
67
87
114
71
97
92
NRMP Program Director Survey, Specialties Matching Service, 2016 400

Figure-1Thoracic SurgeryPercentage of Programs Citing Each Factor and Mean Importance Rating¹ for Each Factor in Selecting Applicants to Interview(N=13)
Average RatingPercent Citing Factor
¹ Ratings on a scale from 1 (not at all important) to 5 (very important).* International Medical Graduates only
1 2 3 4 5
4.64.34.03.44.14.04.04.53.93.63.94.44.03.33.74.14.34.04.33.63.43.73.83.83.63.73.63.83.23.64.03.74.53.53.34.0
4.42.71.5
100% 50% 0%
100%92%
100%85%85%
100%69%85%77%92%77%85%69%69%77%62%62%54%69%54%69%77%77%46%62%46%62%31%46%62%31%46%15%31%31%
8%0%
85%23%15%
Letters of recommendation in fellowship specialty
Residency performance evaluation (Program Director letter)
Reputation of residency program
Demonstrated involvement and perceived interest in research
Perceived commitment to specialty
Personal statement
Perceived interest in program
Evidence of professionalism and ethics
USMLE Step 1/COMLEX Level 1 score
Peer reviewed publications/authored textbook chapters
USMLE Step 2 CK/COMLEX Level 2 CE score
Leadership qualities
Personal prior professional knowledge of the applicant
Oral presentations/poster presentations/speaking engagements
Applicant was a resident in a core program at same institution
Pass USMLE Step 2 CS/COMLEX Level 2 PE
Any failed attempt in USMLE/COMLEX
USMLE Step 3/COMLEX Level 3 score
Interest in academic career
Residency program setting (univ.‐based vs. comm.‐based)
Clinical/laboratory research experience
Awards or special honors in medical school
Alpha Omega Alpha (AOA) membership
Other life experience
Medical Student Performance Evaluation (MSPE/Dean's Letter)
Graduate of highly‐regarded medical school
Visa status*
Volunteer/extracurricular experiences
Awarded grant money for research
Grades in medical school
Lack of gaps in medical education
Medical school class ranking/quartile
Applicant was flagged with Match violation by the NRMP
Electives at your fellowship site
Gold Humanism Honor Society (GHHS) membership
Residency class ranking/quartile
Fluency in language spoken by your patient population
In‐Training Examination (ITE)
Residency program size
Having finished another fellowship
NRMP Program Director Survey, Specialties Matching Service, 2016 401

Thoracic SurgeryPercentage of Programs Citing Each Factor and Mean Importance Rating¹ for Each Factor in Ranking Applicants(N=13)
Figure-2
Average RatingPercent Citing Factor
¹ Ratings on a scale from 1 (not at all important) to 5 (very important).* International Medical Graduates only
1 2 3 4 5
4.64.44.34.64.14.84.13.93.94.34.14.04.33.94.03.84.33.63.64.53.53.73.73.93.63.83.63.33.53.33.83.53.33.33.83.32.73.83.03.04.03.02.84.23.53.0
100% 50% 0%
100%92%92%83%67%75%67%83%92%83%67%92%75%83%67%50%67%83%83%58%75%67%58%75%67%67%42%50%33%58%42%17%42%50%50%33%33%33%42%8%8%
17%42%75%25%25%
Interactions with faculty during interview and visitInterpersonal skills
Letters of recommendation in fellowship specialtyInteractions with house staff during interview and visit
Perceived commitment to specialtyFeedback from current residents and fellows
Perceived interest in programDemonstrated involvement and perceived interest in research
Reputation of residency programResidency performance evaluation (Program Director letter)
Evidence of professionalism and ethicsPersonal statement
Personal prior professional knowledge of the applicantLeadership qualities
Peer reviewed publications/authored textbook chaptersInterest in academic career
Applicant was a resident in a core program at same institutionUSMLE Step 1/COMLEX Level 1 score
USMLE Step 2 CK/COMLEX Level 2 CE scoreAny failed attempt in USMLE/COMLEX
Passing USMLE Step 2 CS/COMLEX Level 2 PEClinical/laboratory research experience
USMLE Step 3/COMLEX Level 3 scoreOral presentations/poster presentations/speaking engagements
Residency program setting (univ.‐based vs. comm.‐based)Alpha Omega Alpha (AOA) membership
Other life experienceMedical Student Performance Evaluation (MSPE/Dean's Letter)
Second interview/visitAwards or special honors in medical school
Visa status*Applicant was flagged with Match violation by the NRMP
Graduate of highly‐regarded medical schoolElectives at your fellowship site
Awarded grant money for researchVolunteer/extracurricular experiencesMedical school class ranking/quartile
Lack of gaps in medical educationGrades in medical school
Residency class ranking/quartileFluency in language spoken by your patient population
Gold Humanism Honor Society (GHHS) membershipResidency program size
In‐Training Examination (ITE)Second interview/visit
Having finished another fellowship
NRMP Program Director Survey, Specialties Matching Service, 2016 402

Thoracic SurgeryPrograms That Use USMLE Step 1 and Step 2 Clinical Knowledge (CK) Scores When Considering Which Applicants to Interview
Figure-3
Percentage of Programs That Use USMLE Step 2 (CK) Score
0%
10%
20%
30%
40%
50%
60%
70%
80%
90%
100%
Never Seldom Often
33%
50%
17%
Would your program consider applicants who fail theexam on the first attempt?
0%
10%
20%
30%
40%
50%
60%
70%
80%
90%
100%
Never Seldom often
33%
50%
17%
Would your program consider applicants who failthe exam on the first attempt?
0%
10%
20%
30%
40%
50%
60%
70%
80%
90%
100%
Yes, pass only Yes, target score No
75%
25%
0%
Scores required?
0%
10%
20%
30%
40%
50%
60%
70%
80%
90%
100%
Yes, pass only Yes, target score No
67%
25%
8%
Scores required?
N=12
N=12
N=12N=12
IQR* of Average USMLE Step 1 and Step 2 CK Scores Programs Consider When Granting Interviews
Percentage of Programs That Use USMLE Step 1 Score
*The boxes in the boxplots represent the interquartile range (or IQR, which is the range between the 25th and 75th percentiles), and the line in the box is the median. The x-shaped symbol is the mean.
Scores Above Which Programs Almost Always Grant Interviews
Scores Below Which Programs Generally Do Not Grant Interviews
USMLE Step 2 CK not reported
because of low response rate
USMLE Step 1 not reported because of low response
rate
USMLE Step 2 CK not reported
because of low response rate
USMLE Step 1 not reported because of low response
rate
NRMP Program Director Survey, Specialties Matching Service, 2016 403
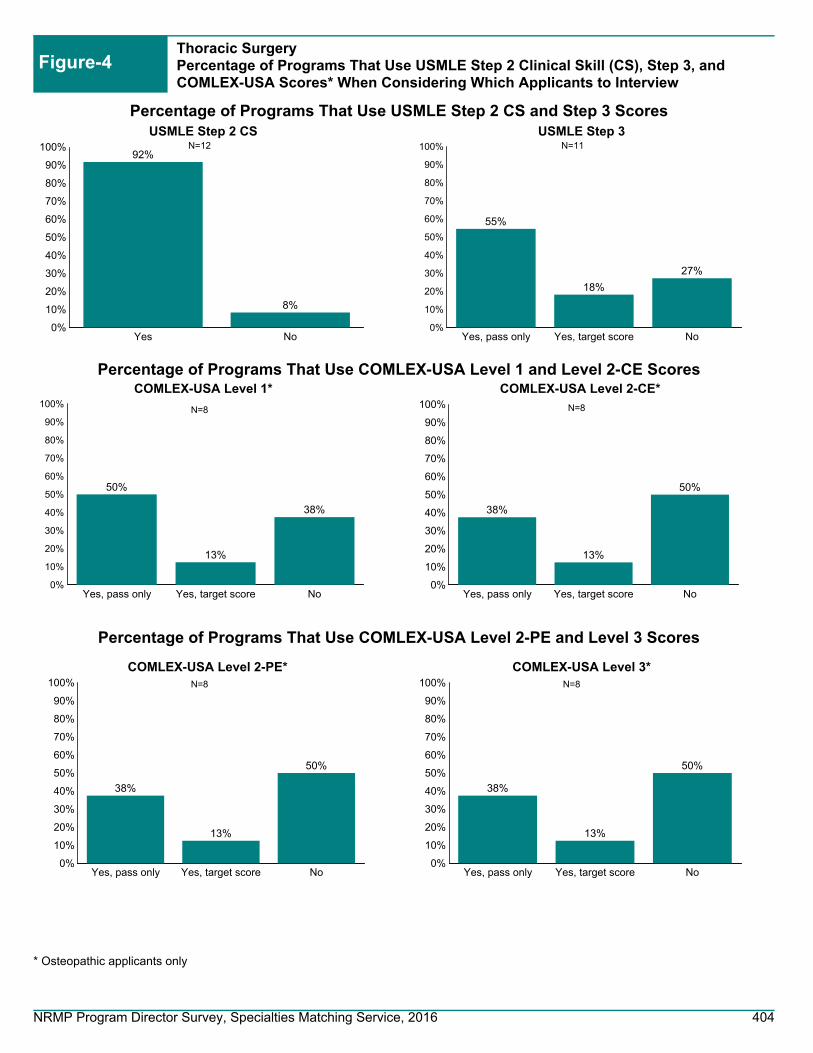
0%
10%
20%
30%
40%
50%
60%
70%
80%
90%
100%
Yes No
92%
8%
USMLE Step 2 CS
0%
10%
20%
30%
40%
50%
60%
70%
80%
90%
100%
Yes, pass only Yes, target score No
55%
18%
27%
USMLE Step 3
0%
10%
20%
30%
40%
50%
60%
70%
80%
90%
100%
Yes, pass only Yes, target score No
50%
13%
38%
COMLEX-USA Level 1*
Thoracic SurgeryPercentage of Programs That Use USMLE Step 2 Clinical Skill (CS), Step 3, and COMLEX-USA Scores* When Considering Which Applicants to Interview
Figure-4
0%
10%
20%
30%
40%
50%
60%
70%
80%
90%
100%
Yes, pass only Yes, target score No
38%
13%
50%
COMLEX-USA Level 2-CE*
0%
10%
20%
30%
40%
50%
60%
70%
80%
90%
100%
Yes, pass only Yes, target score No
38%
13%
50%
COMLEX-USA Level 3*
0%
10%
20%
30%
40%
50%
60%
70%
80%
90%
100%
Yes, pass only Yes, target score No
38%
13%
50%
COMLEX-USA Level 2-PE*
N=12 N=11
N=8 N=8
N=8 N=8
* Osteopathic applicants only
Percentage of Programs That Use USMLE Step 2 CS and Step 3 Scores
Percentage of Programs That Use COMLEX-USA Level 1 and Level 2-CE Scores
Percentage of Programs That Use COMLEX-USA Level 2-PE and Level 3 Scores
NRMP Program Director Survey, Specialties Matching Service, 2016 404

0%10%20%30%40%50%60%70%80%90%
100%
Never Seldom Often
17%
67%
17%
Would your program consider applicants who fail theexam on the first attempt?
0%
10%
20%
30%
40%
50%
60%
70%
80%
90%
100%
Yes, pass only Yes, target score No, not required
38%
13%
50%
Scores required?
N=6
N=8
100.0%Optional
Program Requirement on Dedicated Time forResearch
N=18
-6
-4
-2
0
2
4
6
Accredited Locally Funded Integrated Other
Average Number of Months if Research Time isRequired
N=0 N=0 N=0 N=0
0.0
0.5
1.0
1.5
2.0
2.5
3.0
3.5
4.0
Accredited Positions Funded Positions
4.03.9
Average Number of Accredited Positions and Funded Positions
0%
10%
20%
30%
40%
50%
60%
70%
80%
90%
100%
Positions Filled BeforeMatch Day
Positions Offered Outsidethe Match
Positions Filled Outsidethe Match
61%
Average Percentage of Accredited Positions Offered Outside ofthe Match
N=17 N=16 N=5 N=0 N=0
Thoracic SurgeryPrograms That Use Core Specialty Certifying Examination When Considering Applicants for Interview
Figure-5
Thoracic SurgeryPrograms Positions Figure-6
Thoracic SurgeryDedicated Time for Research Figure-7
NRMP Program Director Survey, Specialties Matching Service, 2016 405

0%
10%
20%
30%
40%
50%
60%
70%
80%
90%
100%100%
93%
67%
40%
60%
47%
U.S. Graduate OsteopathicPhysician
Canadian Fifth Pathway U.S. IMG Non-U.S. IMG
Percentage of Programs that Typically Interview and Rank Each Applicant Type
Figure-8Thoracic SurgeryProgram's Interview Activities
0%10%20%30%40%50%60%70%80%90%
100%
Rejected based on astandardized screening
process
In-depth review
38%
64%
Average Percentage of Applicants Rejected and Reviewed
0
10
20
30
40
50
60
70
Number of applicationsreceived
Number of interviewinvitations sent
Number of applicantsinterviewed
63
2519
Average Number of Positions, Applications Received, InterviewInvitations Sent, and Applicants Interviewed and Ranked
N=17N=17N=17N=17
N=15
27% of Thoracic Surgery programs consider all applicant groups
N=17
0%10%20%30%40%50%60%70%80%90%
100%
Prev. Grad Osteo Pathway Canadian US IMG Non-USIMG
54%
8% 7%21%
50%
31%
46% 43%
43%100%
50%
15%
46% 50%36%
Often Seldom Never
Interview
0%10%
20%
30%40%
50%60%
70%80%
90%100%
Prev. Grad Osteo Pathway Canadian US IMG Non-USIMG
7%
54%
8% 8% 8%
43%
31%
38% 38% 42%
100%
50%
15%
54% 54% 50%
Often Seldom Never
Ranking
n=14
Frequency of Programs Interviewing and Ranking Candidates
n=14
N=13
0%10%20%30%40%50%60%70%80%90%
100%
Jan Feb Mar Apr May Jun Jul Aug Sep Oct Nov Dec
38%45%
4% 4% 0% 0% 0% 0% 0% 0% 0%8%
Interview invitations
Interview Invitations Sent and Interviews Conducted
0%
27% 30%22%
4% 4% 0% 0% 0% 0% 0%7%
Interviews conducted
NRMP Program Director Survey, Specialties Matching Service, 2016 406

Figure-9Thoracic SurgeryPotential Challenges in Recruiting Applicants to Your Specialty
0% 10% 20% 30% 40% 50% 60%
58%
8%
33%
0%
0%
We consider those applicants on an individual basis
We give those applicants serious consideration if they haveshown improvement
We do not usually consider those applicants
We favor those applicants
Other
0 1 2 3 4 5
Not enough applicants in the specialty
Undesirable income potential as a practicing physician
Undesirable work/life balance as a practicing physician
Long or irregular work hours required by specialty
Fellowship Match scheduled at inconvenient time of year
2.7
2.1
3.6
3.5
1.6
Average rating on a scale of 5 (1=least challenging; 5=most challenging)
n=12
13.3%Less than 3
13.3%3 to 5
33.3%6 to 10
13.3%11 to 15
26.7%More than 15
At Any Fellowship Program
23.1%Less than 3
23.1%3 to 5
30.8%6 to 10
23.1%More than 15
At Current Fellowship Program
n=12
n=15 n=13
Thoracic SurgeryApplicants Who Applied in the Specialty in the Past But Did Not Match Figure-10
Thoracic SurgeryYears as Program Director Figure-11
NRMP Program Director Survey, Specialties Matching Service, 2016 407
Vascular Neurology
NRMP Program Director Survey, Specialties Matching Service, 2016 408

Vascular NeurologyGeneral Information
Table 1
74
123
103
Number of programs in the Match
Number of positions in the Match
Number of applicants ranking specialty
36.1%Response rate
Appointment Years
Number of responses 26
Match Information*
* Source: NRMP Data Warehouse
2016 Survey
2016 2015 2014
NRMP Program Director Survey, Specialties Matching Service, 2016 409

Figure-1Vascular NeurologyPercentage of Programs Citing Each Factor and Mean Importance Rating¹ for Each Factor in Selecting Applicants to Interview(N=20)
Average RatingPercent Citing Factor
¹ Ratings on a scale from 1 (not at all important) to 5 (very important).* International Medical Graduates only
1 2 3 4 5
4.44.64.23.64.63.94.24.63.83.93.84.24.43.84.03.94.33.64.13.43.33.53.13.33.93.33.83.34.24.33.83.64.84.23.33.03.53.03.0
100% 50% 0%
85%80%90%80%65%70%60%70%80%80%75%55%40%70%55%70%70%70%50%45%45%40%50%40%35%50%55%35%30%30%30%35%25%25%35%10%25%15%15%
0%
Letters of recommendation in fellowship specialty
Residency performance evaluation (Program Director letter)
Reputation of residency program
Demonstrated involvement and perceived interest in research
Perceived commitment to specialty
Personal statement
Perceived interest in program
Evidence of professionalism and ethics
USMLE Step 1/COMLEX Level 1 score
Peer reviewed publications/authored textbook chapters
USMLE Step 2 CK/COMLEX Level 2 CE score
Leadership qualities
Personal prior professional knowledge of the applicant
Oral presentations/poster presentations/speaking engagements
Applicant was a resident in a core program at same institution
Pass USMLE Step 2 CS/COMLEX Level 2 PE
Any failed attempt in USMLE/COMLEX
USMLE Step 3/COMLEX Level 3 score
Interest in academic career
Residency program setting (univ.‐based vs. comm.‐based)
Clinical/laboratory research experience
Awards or special honors in medical school
Alpha Omega Alpha (AOA) membership
Other life experience
Medical Student Performance Evaluation (MSPE/Dean's Letter)
Graduate of highly‐regarded medical school
Visa status*
Volunteer/extracurricular experiences
Awarded grant money for research
Grades in medical school
Lack of gaps in medical education
Medical school class ranking/quartile
Applicant was flagged with Match violation by the NRMP
Electives at your fellowship site
Gold Humanism Honor Society (GHHS) membership
Residency class ranking/quartile
Fluency in language spoken by your patient population
In‐Training Examination (ITE)
Residency program size
Having finished another fellowship
NRMP Program Director Survey, Specialties Matching Service, 2016 410
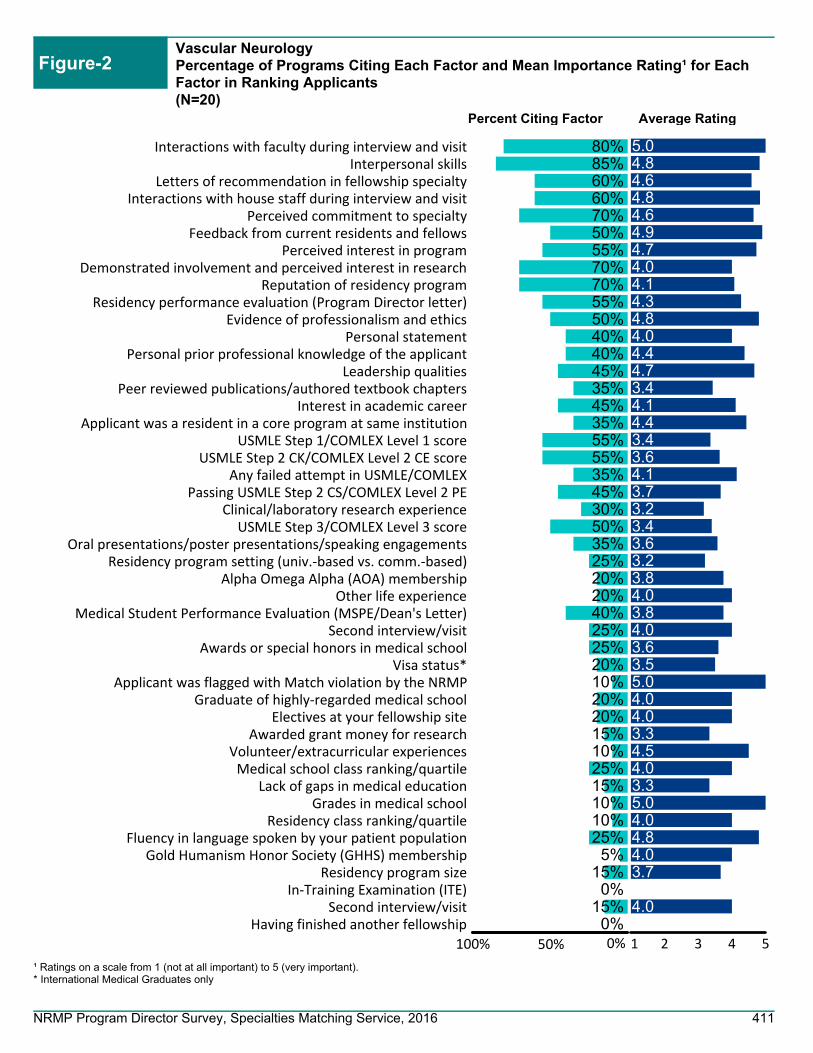
Vascular NeurologyPercentage of Programs Citing Each Factor and Mean Importance Rating¹ for Each Factor in Ranking Applicants(N=20)
Figure-2
Average RatingPercent Citing Factor
¹ Ratings on a scale from 1 (not at all important) to 5 (very important).* International Medical Graduates only
1 2 3 4 5
5.04.84.64.84.64.94.74.04.14.34.84.04.44.73.44.14.43.43.64.13.73.23.43.63.23.84.03.84.03.63.55.04.04.03.34.54.03.35.04.04.84.03.7
4.0
100% 50% 0%
80%85%60%60%70%50%55%70%70%55%50%40%40%45%35%45%35%55%55%35%45%30%50%35%25%20%20%40%25%25%20%10%20%20%15%10%25%15%10%10%25%5%
15%0%
15%0%
Interactions with faculty during interview and visitInterpersonal skills
Letters of recommendation in fellowship specialtyInteractions with house staff during interview and visit
Perceived commitment to specialtyFeedback from current residents and fellows
Perceived interest in programDemonstrated involvement and perceived interest in research
Reputation of residency programResidency performance evaluation (Program Director letter)
Evidence of professionalism and ethicsPersonal statement
Personal prior professional knowledge of the applicantLeadership qualities
Peer reviewed publications/authored textbook chaptersInterest in academic career
Applicant was a resident in a core program at same institutionUSMLE Step 1/COMLEX Level 1 score
USMLE Step 2 CK/COMLEX Level 2 CE scoreAny failed attempt in USMLE/COMLEX
Passing USMLE Step 2 CS/COMLEX Level 2 PEClinical/laboratory research experience
USMLE Step 3/COMLEX Level 3 scoreOral presentations/poster presentations/speaking engagements
Residency program setting (univ.‐based vs. comm.‐based)Alpha Omega Alpha (AOA) membership
Other life experienceMedical Student Performance Evaluation (MSPE/Dean's Letter)
Second interview/visitAwards or special honors in medical school
Visa status*Applicant was flagged with Match violation by the NRMP
Graduate of highly‐regarded medical schoolElectives at your fellowship site
Awarded grant money for researchVolunteer/extracurricular experiencesMedical school class ranking/quartile
Lack of gaps in medical educationGrades in medical school
Residency class ranking/quartileFluency in language spoken by your patient population
Gold Humanism Honor Society (GHHS) membershipResidency program size
In‐Training Examination (ITE)Second interview/visit
Having finished another fellowship
NRMP Program Director Survey, Specialties Matching Service, 2016 411

Vascular NeurologyPrograms That Use USMLE Step 1 and Step 2 Clinical Knowledge (CK) Scores When Considering Which Applicants to Interview
Figure-3
Percentage of Programs That Use USMLE Step 2 (CK) Score
0%
10%
20%
30%
40%
50%
60%
70%
80%
90%
100%
Never Seldom Often
26%
68%
5%
Would your program consider applicants who fail theexam on the first attempt?
0%
10%
20%
30%
40%
50%
60%
70%
80%
90%
100%
Never Seldom often
32%
63%
5%
Would your program consider applicants who failthe exam on the first attempt?
0%
10%
20%
30%
40%
50%
60%
70%
80%
90%
100%
Yes, pass only Yes, target score No
68%
32%
0%
Scores required?
0%
10%
20%
30%
40%
50%
60%
70%
80%
90%
100%
Yes, pass only Yes, target score No
68%
32%
0%
Scores required?
N=19
N=19
N=19N=19
N=5N=5
IQR* of Average USMLE Step 1 and Step 2 CK Scores Programs Consider When Granting Interviews
Percentage of Programs That Use USMLE Step 1 Score
170
180
190
200
210
220
230
240
250
260
USMLE Step 2 CKUSMLE Step 1
*The boxes in the boxplots represent the interquartile range (or IQR, which is the range between the 25th and 75th percentiles), and the line in the box is the median. The x-shaped symbol is the mean.
Scores Above Which Programs Almost Always Grant Interviews
Scores Below Which Programs Generally Do Not Grant Interviews
USMLE Step 1 not reported because of low response
rate
USMLE Step 2 CK not reported
because of low response rate
NRMP Program Director Survey, Specialties Matching Service, 2016 412

0%
10%
20%
30%
40%
50%
60%
70%
80%
90%
100%
Yes No
100%
0%
USMLE Step 2 CS
0%
10%
20%
30%
40%
50%
60%
70%
80%
90%
100%
Yes, pass only Yes, target score No
63%
21%16%
USMLE Step 3
0%
10%
20%
30%
40%
50%
60%
70%
80%
90%
100%
Yes, pass only Yes, target score No
50%
0%
50%
COMLEX-USA Level 1*
Vascular NeurologyPercentage of Programs That Use USMLE Step 2 Clinical Skill (CS), Step 3, and COMLEX-USA Scores* When Considering Which Applicants to Interview
Figure-4
0%
10%
20%
30%
40%
50%
60%
70%
80%
90%
100%
Yes, pass only Yes, target score No
50%
0%
50%
COMLEX-USA Level 2-CE*
0%
10%
20%
30%
40%
50%
60%
70%
80%
90%
100%
Yes, pass only Yes, target score No
50%
0%
50%
COMLEX-USA Level 3*
0%
10%
20%
30%
40%
50%
60%
70%
80%
90%
100%
Yes, pass only Yes, target score No
50%
0%
50%
COMLEX-USA Level 2-PE*
N=19 N=19
N=12 N=12
N=12 N=12
* Osteopathic applicants only
Percentage of Programs That Use USMLE Step 2 CS and Step 3 Scores
Percentage of Programs That Use COMLEX-USA Level 1 and Level 2-CE Scores
Percentage of Programs That Use COMLEX-USA Level 2-PE and Level 3 Scores
NRMP Program Director Survey, Specialties Matching Service, 2016 413
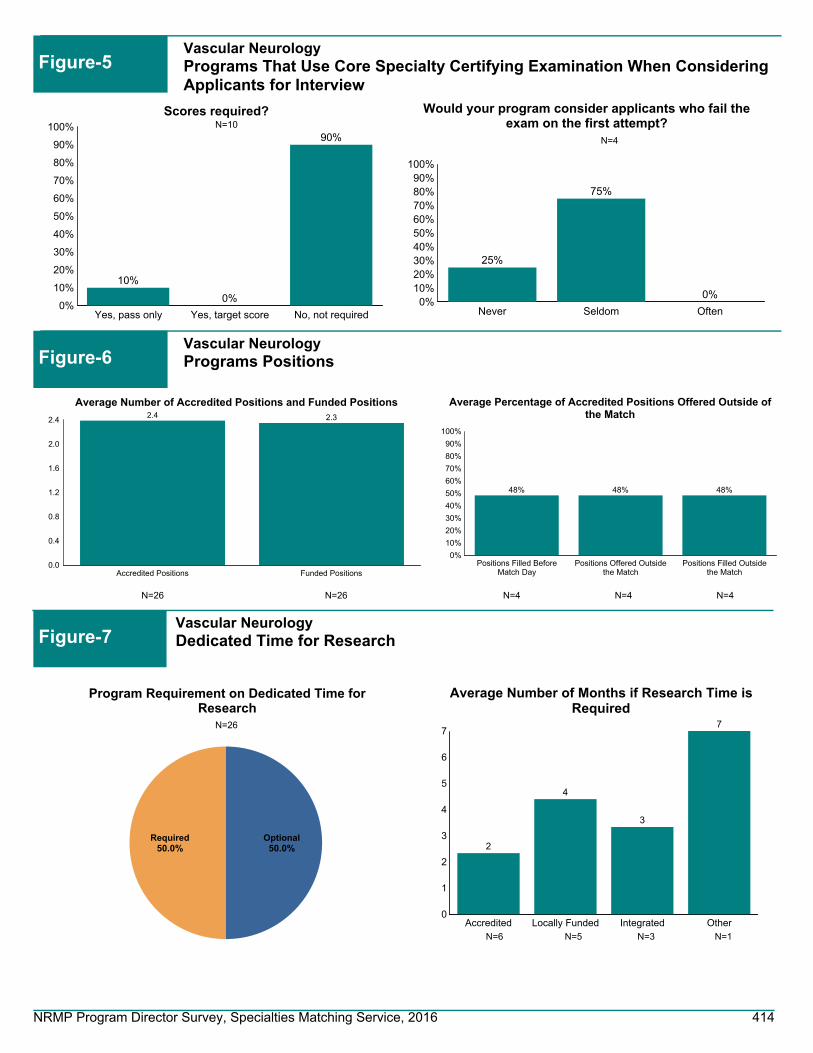
0%10%20%30%40%50%60%70%80%90%
100%
Never Seldom Often
25%
75%
0%
Would your program consider applicants who fail theexam on the first attempt?
0%
10%
20%
30%
40%
50%
60%
70%
80%
90%
100%
Yes, pass only Yes, target score No, not required
10%
0%
90%
Scores required?
N=4
N=10
50.0%Optional
50.0%Required
Program Requirement on Dedicated Time forResearch
N=26
0
1
2
3
4
5
6
7
Accredited Locally Funded Integrated Other
2
4
3
7
Average Number of Months if Research Time isRequired
N=6 N=5 N=3 N=1
0.0
0.4
0.8
1.2
1.6
2.0
2.4
Accredited Positions Funded Positions
2.4 2.3
Average Number of Accredited Positions and Funded Positions
0%
10%
20%
30%
40%
50%
60%
70%
80%
90%
100%
Positions Filled BeforeMatch Day
Positions Offered Outsidethe Match
Positions Filled Outsidethe Match
48% 48% 48%
Average Percentage of Accredited Positions Offered Outside ofthe Match
N=26 N=26 N=4 N=4 N=4
Vascular NeurologyPrograms That Use Core Specialty Certifying Examination When Considering Applicants for Interview
Figure-5
Vascular NeurologyPrograms Positions Figure-6
Vascular NeurologyDedicated Time for Research Figure-7
NRMP Program Director Survey, Specialties Matching Service, 2016 414

0%
10%
20%
30%
40%
50%
60%
70%
80%
90%
100% 95% 95%
75%
55%
85%90%
U.S. Graduate OsteopathicPhysician
Canadian Fifth Pathway U.S. IMG Non-U.S. IMG
Percentage of Programs that Typically Interview and Rank Each Applicant Type
Figure-8Vascular NeurologyProgram's Interview Activities
0%10%20%30%40%50%60%70%80%90%
100%
Rejected based on astandardized screening
process
In-depth review
26%
70%
Average Percentage of Applicants Rejected and Reviewed
0
4
8
12
16
20
24
28
32
Number of applicationsreceived
Number of interviewinvitations sent
Number of applicantsinterviewed
31
15
11
Average Number of Positions, Applications Received, InterviewInvitations Sent, and Applicants Interviewed and Ranked
N=22N=22N=23N=22
N=20
55% of Vascular Neurology programs consider all applicant groups
N=23
0%10%20%30%40%50%60%70%80%90%
100%
Prev. Grad Osteo Pathway Canadian US IMG Non-USIMG
50%
20%10% 5%
25%
55%
40%
60%
40%
25%
75%
45%
10%20%
50%70%
Often Seldom Never
Interview
0%10%
20%
30%40%
50%60%
70%80%
90%100%
Prev. Grad Osteo Pathway Canadian US IMG Non-USIMG
5%
55%
20%10% 5%
20%
45%
35%
60%
40%
25%
80%
50%
10%20%
50%70%
Often Seldom Never
Ranking
n=20
Frequency of Programs Interviewing and Ranking Candidates
n=20
N=18
0%10%20%30%40%50%60%70%80%90%
100%
Jan Feb Mar Apr May Jun Jul Aug Sep Oct Nov Dec
53%
19% 15%
2% 0% 0% 0% 0% 0% 3% 3% 6%
Interview invitations
Interview Invitations Sent and Interviews Conducted
17%21%
31%
6% 5%0% 0% 0% 0% 0% 4% 6%
Interviews conducted
NRMP Program Director Survey, Specialties Matching Service, 2016 415
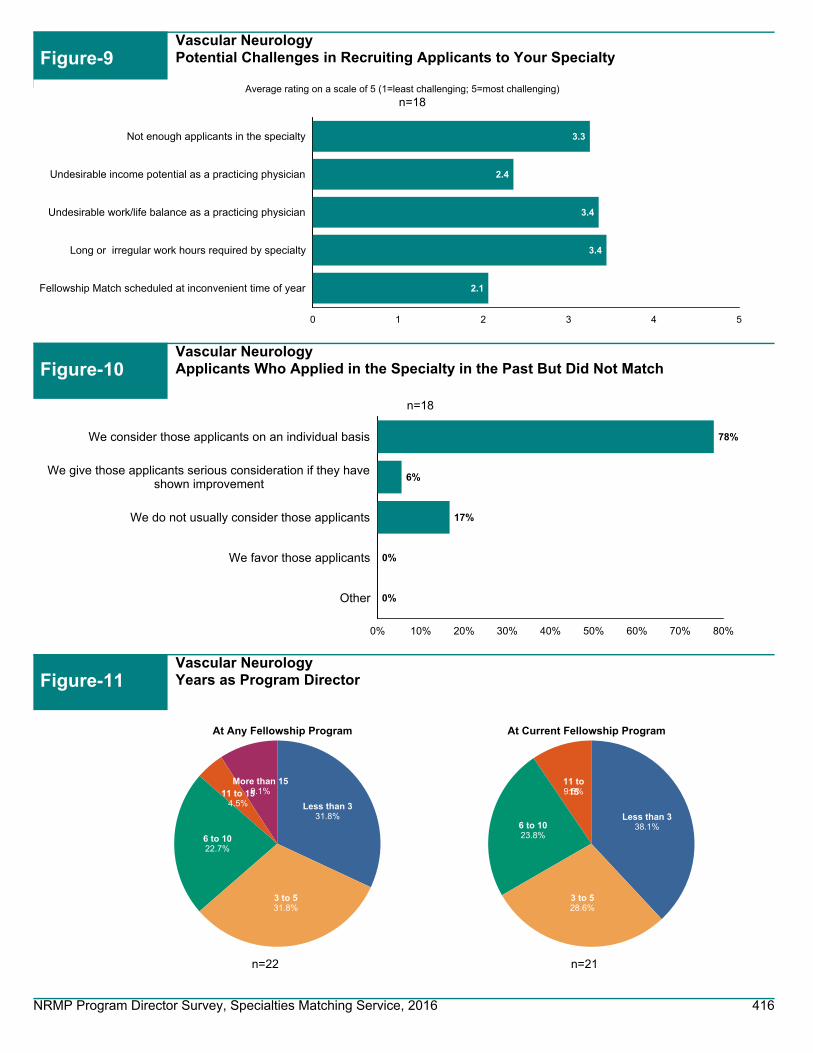
Figure-9Vascular NeurologyPotential Challenges in Recruiting Applicants to Your Specialty
0% 10% 20% 30% 40% 50% 60% 70% 80%
78%
6%
17%
0%
0%
We consider those applicants on an individual basis
We give those applicants serious consideration if they haveshown improvement
We do not usually consider those applicants
We favor those applicants
Other
0 1 2 3 4 5
Not enough applicants in the specialty
Undesirable income potential as a practicing physician
Undesirable work/life balance as a practicing physician
Long or irregular work hours required by specialty
Fellowship Match scheduled at inconvenient time of year
3.3
2.4
3.4
3.4
2.1
Average rating on a scale of 5 (1=least challenging; 5=most challenging)
n=18
31.8%Less than 3
31.8%3 to 5
22.7%6 to 10
4.5%11 to 159.1%
More than 15
At Any Fellowship Program
38.1%Less than 3
28.6%3 to 5
23.8%6 to 10
9.5%11 to
15
At Current Fellowship Program
n=18
n=22 n=21
Vascular NeurologyApplicants Who Applied in the Specialty in the Past But Did Not Match Figure-10
Vascular NeurologyYears as Program Director Figure-11
NRMP Program Director Survey, Specialties Matching Service, 2016 416

Vascular Surgery
NRMP Program Director Survey, Specialties Matching Service, 2016 417

Vascular SurgeryGeneral Information
Table 1
92
121
128
Number of programs in the Match
Number of positions in the Match
Number of applicants ranking specialty
26.1%Response rate
Appointment Years
Number of responses 24
Match Information*
* Source: NRMP Data Warehouse
2016 Survey
2016 2015 2014
90
115
111
86
115
114
NRMP Program Director Survey, Specialties Matching Service, 2016 418

Figure-1Vascular SurgeryPercentage of Programs Citing Each Factor and Mean Importance Rating¹ for Each Factor in Selecting Applicants to Interview(N=20)
Average RatingPercent Citing Factor
¹ Ratings on a scale from 1 (not at all important) to 5 (very important).* International Medical Graduates only
1 2 3 4 5
4.74.24.03.74.23.84.14.23.93.73.94.14.33.83.64.34.93.93.53.43.53.43.73.73.43.84.33.23.43.74.13.35.02.64.03.0
4.12.03.0
100% 50% 0%
95%90%90%90%85%70%75%70%85%95%70%65%80%65%55%55%60%50%70%50%55%55%90%55%45%50%45%30%45%45%50%60%15%35%25%15%
0%85%
5%10%
Letters of recommendation in fellowship specialty
Residency performance evaluation (Program Director letter)
Reputation of residency program
Demonstrated involvement and perceived interest in research
Perceived commitment to specialty
Personal statement
Perceived interest in program
Evidence of professionalism and ethics
USMLE Step 1/COMLEX Level 1 score
Peer reviewed publications/authored textbook chapters
USMLE Step 2 CK/COMLEX Level 2 CE score
Leadership qualities
Personal prior professional knowledge of the applicant
Oral presentations/poster presentations/speaking engagements
Applicant was a resident in a core program at same institution
Pass USMLE Step 2 CS/COMLEX Level 2 PE
Any failed attempt in USMLE/COMLEX
USMLE Step 3/COMLEX Level 3 score
Interest in academic career
Residency program setting (univ.‐based vs. comm.‐based)
Clinical/laboratory research experience
Awards or special honors in medical school
Alpha Omega Alpha (AOA) membership
Other life experience
Medical Student Performance Evaluation (MSPE/Dean's Letter)
Graduate of highly‐regarded medical school
Visa status*
Volunteer/extracurricular experiences
Awarded grant money for research
Grades in medical school
Lack of gaps in medical education
Medical school class ranking/quartile
Applicant was flagged with Match violation by the NRMP
Electives at your fellowship site
Gold Humanism Honor Society (GHHS) membership
Residency class ranking/quartile
Fluency in language spoken by your patient population
In‐Training Examination (ITE)
Residency program size
Having finished another fellowship
NRMP Program Director Survey, Specialties Matching Service, 2016 419

Vascular SurgeryPercentage of Programs Citing Each Factor and Mean Importance Rating¹ for Each Factor in Ranking Applicants(N=20)
Figure-2
Average RatingPercent Citing Factor
¹ Ratings on a scale from 1 (not at all important) to 5 (very important).* International Medical Graduates only
1 2 3 4 5
4.74.64.54.53.94.54.03.53.64.14.33.83.94.23.83.33.33.93.94.84.23.63.83.94.04.04.03.03.83.64.35.03.54.33.45.03.34.03.32.0
4.02.54.32.53.0
100% 50% 0%
83%89%78%83%44%67%61%67%72%56%44%33%56%39%72%44%33%44%44%39%33%33%28%50%33%50%22%17%22%28%50%11%33%22%33%11%17%33%17%6%0%
11%11%72%17%6%
Interactions with faculty during interview and visitInterpersonal skills
Letters of recommendation in fellowship specialtyInteractions with house staff during interview and visit
Perceived commitment to specialtyFeedback from current residents and fellows
Perceived interest in programDemonstrated involvement and perceived interest in research
Reputation of residency programResidency performance evaluation (Program Director letter)
Evidence of professionalism and ethicsPersonal statement
Personal prior professional knowledge of the applicantLeadership qualities
Peer reviewed publications/authored textbook chaptersInterest in academic career
Applicant was a resident in a core program at same institutionUSMLE Step 1/COMLEX Level 1 score
USMLE Step 2 CK/COMLEX Level 2 CE scoreAny failed attempt in USMLE/COMLEX
Passing USMLE Step 2 CS/COMLEX Level 2 PEClinical/laboratory research experience
USMLE Step 3/COMLEX Level 3 scoreOral presentations/poster presentations/speaking engagements
Residency program setting (univ.‐based vs. comm.‐based)Alpha Omega Alpha (AOA) membership
Other life experienceMedical Student Performance Evaluation (MSPE/Dean's Letter)
Second interview/visitAwards or special honors in medical school
Visa status*Applicant was flagged with Match violation by the NRMP
Graduate of highly‐regarded medical schoolElectives at your fellowship site
Awarded grant money for researchVolunteer/extracurricular experiencesMedical school class ranking/quartile
Lack of gaps in medical educationGrades in medical school
Residency class ranking/quartileFluency in language spoken by your patient population
Gold Humanism Honor Society (GHHS) membershipResidency program size
In‐Training Examination (ITE)Second interview/visit
Having finished another fellowship
NRMP Program Director Survey, Specialties Matching Service, 2016 420

170
180
190
200
210
220
230
240
250
260
Vascular SurgeryPrograms That Use USMLE Step 1 and Step 2 Clinical Knowledge (CK) Scores When Considering Which Applicants to Interview
Figure-3
Percentage of Programs That Use USMLE Step 2 (CK) Score
0%
10%
20%
30%
40%
50%
60%
70%
80%
90%
100%
Never Seldom Often
42%
53%
5%
Would your program consider applicants who fail theexam on the first attempt?
0%
10%
20%
30%
40%
50%
60%
70%
80%
90%
100%
Never Seldom often
37%
58%
5%
Would your program consider applicants who failthe exam on the first attempt?
0%
10%
20%
30%
40%
50%
60%
70%
80%
90%
100%
Yes, pass only Yes, target score No
60%
40%
0%
Scores required?
0%
10%
20%
30%
40%
50%
60%
70%
80%
90%
100%
Yes, pass only Yes, target score No
65%
35%
0%
Scores required?
N=20
N=19
N=20N=19
N=7N=8 N=7 N=6
IQR* of Average USMLE Step 1 and Step 2 CK Scores Programs Consider When Granting Interviews
Percentage of Programs That Use USMLE Step 1 Score
170
180
190
200
210
220
230
240
250
260
USMLE Step 2 CKUSMLE Step 1 USMLE Step 1 USMLE Step 2 CK
*The boxes in the boxplots represent the interquartile range (or IQR, which is the range between the 25th and 75th percentiles), and the line in the box is the median. The x-shaped symbol is the mean.
Scores Above Which Programs Almost Always Grant Interviews
Scores Below Which Programs Generally Do Not Grant Interviews
NRMP Program Director Survey, Specialties Matching Service, 2016 421
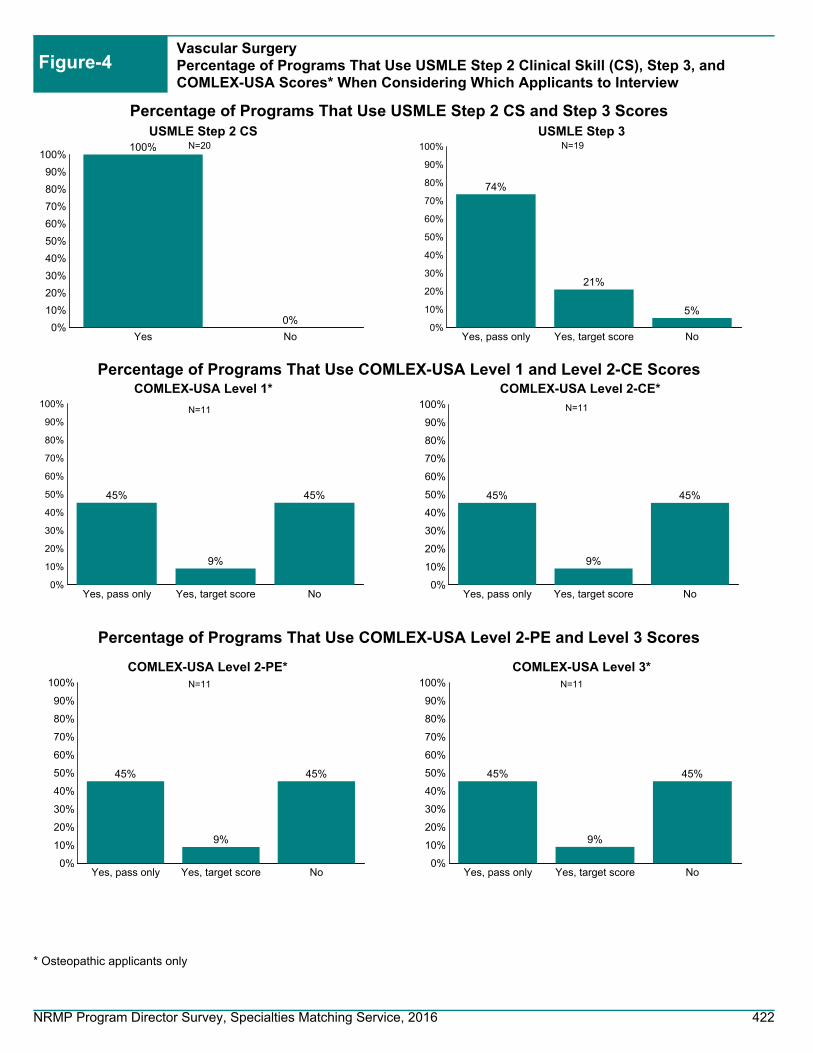
0%
10%
20%
30%
40%
50%
60%
70%
80%
90%
100%
Yes No
100%
0%
USMLE Step 2 CS
0%
10%
20%
30%
40%
50%
60%
70%
80%
90%
100%
Yes, pass only Yes, target score No
74%
21%
5%
USMLE Step 3
0%
10%
20%
30%
40%
50%
60%
70%
80%
90%
100%
Yes, pass only Yes, target score No
45%
9%
45%
COMLEX-USA Level 1*
Vascular SurgeryPercentage of Programs That Use USMLE Step 2 Clinical Skill (CS), Step 3, and COMLEX-USA Scores* When Considering Which Applicants to Interview
Figure-4
0%
10%
20%
30%
40%
50%
60%
70%
80%
90%
100%
Yes, pass only Yes, target score No
45%
9%
45%
COMLEX-USA Level 2-CE*
0%
10%
20%
30%
40%
50%
60%
70%
80%
90%
100%
Yes, pass only Yes, target score No
45%
9%
45%
COMLEX-USA Level 3*
0%
10%
20%
30%
40%
50%
60%
70%
80%
90%
100%
Yes, pass only Yes, target score No
45%
9%
45%
COMLEX-USA Level 2-PE*
N=20 N=19
N=11 N=11
N=11 N=11
* Osteopathic applicants only
Percentage of Programs That Use USMLE Step 2 CS and Step 3 Scores
Percentage of Programs That Use COMLEX-USA Level 1 and Level 2-CE Scores
Percentage of Programs That Use COMLEX-USA Level 2-PE and Level 3 Scores
NRMP Program Director Survey, Specialties Matching Service, 2016 422

0%10%20%30%40%50%60%70%80%90%
100%
Never Seldom Often
67%
33%
0%
Would your program consider applicants who fail theexam on the first attempt?
0%
10%
20%
30%
40%
50%
60%
70%
80%
90%
100%
Yes, pass only Yes, target score No, not required
11%
0%
89%
Scores required?
N=6
N=9
83.3%Optional
16.7%Required
Program Requirement on Dedicated Time forResearch
N=24
0
4
8
12
16
20
24
Accredited Locally Funded Integrated Other
13
24
12
Average Number of Months if Research Time isRequired
N=3 N=1 N=1 N=0
0.0
0.2
0.4
0.6
0.8
1.0
1.2
1.4
1.6
1.8
Accredited Positions Funded Positions
1.8 1.8
Average Number of Accredited Positions and Funded Positions
0%
10%
20%
30%
40%
50%
60%
70%
80%
90%
100%
Positions Filled BeforeMatch Day
Positions Offered Outsidethe Match
Positions Filled Outsidethe Match
83%
42% 42%
Average Percentage of Accredited Positions Offered Outside ofthe Match
N=24 N=24 N=2 N=2 N=2
Vascular SurgeryPrograms That Use Core Specialty Certifying Examination When Considering Applicants for Interview
Figure-5
Vascular SurgeryPrograms Positions Figure-6
Vascular SurgeryDedicated Time for Research Figure-7
NRMP Program Director Survey, Specialties Matching Service, 2016 423

0%
10%
20%
30%
40%
50%
60%
70%
80%
90%
100%100%
75% 75%
25%
80%
70%
U.S. Graduate OsteopathicPhysician
Canadian Fifth Pathway U.S. IMG Non-U.S. IMG
Percentage of Programs that Typically Interview and Rank Each Applicant Type
Figure-8Vascular SurgeryProgram's Interview Activities
0%10%20%30%40%50%60%70%80%90%
100%
Rejected based on astandardized screening
process
In-depth review
29%
70%
Average Percentage of Applicants Rejected and Reviewed
0
10
20
30
40
50
60
Number of applicationsreceived
Number of interviewinvitations sent
Number of applicantsinterviewed
53
2218
Average Number of Positions, Applications Received, InterviewInvitations Sent, and Applicants Interviewed and Ranked
N=23N=23N=23N=23
N=20
20% of Vascular Surgery programs consider all applicant groups
N=23
0%10%20%30%40%50%60%70%80%90%
100%
Prev. Grad Osteo Pathway Canadian US IMG Non-USIMG
5%
76%
11% 6%
79%
18%
72%
63%67%
100%
16%6%
17%37%
28%
Often Seldom Never
Interview
0%10%
20%
30%40%
50%60%
70%80%
90%100%
Prev. Grad Osteo Pathway Canadian US IMG Non-USIMG
5%
78%
18%6%
79%
17%
65%
68% 61%
100%
16%6%
18%32% 33%
Often Seldom Never
Ranking
n=19
Frequency of Programs Interviewing and Ranking Candidates
n=19
N=21
0%10%20%30%40%50%60%70%80%90%
100%
Jan Feb Mar Apr May Jun Jul Aug Sep Oct Nov Dec
73%
10%5% 1% 0% 0% 0% 0%
10%0% 0% 2%
Interview invitations
Interview Invitations Sent and Interviews Conducted
6%
32%
44%
12%
0% 0% 0% 0% 0% 0%5%
0%
Interviews conducted
NRMP Program Director Survey, Specialties Matching Service, 2016 424

Figure-9Vascular SurgeryPotential Challenges in Recruiting Applicants to Your Specialty
0% 10% 20% 30% 40% 50% 60% 70% 80%
76%
12%
18%
0%
0%
We consider those applicants on an individual basis
We give those applicants serious consideration if they haveshown improvement
We do not usually consider those applicants
We favor those applicants
Other
0 1 2 3 4 5
Not enough applicants in the specialty
Undesirable income potential as a practicing physician
Undesirable work/life balance as a practicing physician
Long or irregular work hours required by specialty
Fellowship Match scheduled at inconvenient time of year
2.8
1.9
3.2
3.7
1.9
Average rating on a scale of 5 (1=least challenging; 5=most challenging)
n=17
25.0%Less than 3
12.5%3 to 5
12.5%6 to 1018.8%
11 to 15
31.3%More than 15
At Any Fellowship Program
37.5%Less than 3
12.5%3 to 5
6.3%6 to 10
25.0%11 to 15
18.8%More than 15
At Current Fellowship Program
n=17
n=16 n=16
Vascular SurgeryApplicants Who Applied in the Specialty in the Past But Did Not Match Figure-10
Vascular SurgeryYears as Program Director Figure-11
NRMP Program Director Survey, Specialties Matching Service, 2016 425