results of the 22019 lsi stress test - bundesbank
TRANSCRIPT

Results of the 2019 LSI stress test
Press conference on 23 September 2019
Results of the 2019 LSI stress test 2
Agenda
I. Background
II. Survey
III. 2019 LSI stress test
IV. Real estate financing
V. Credit underwriting standards
Results of the 2019 LSI stress test 3
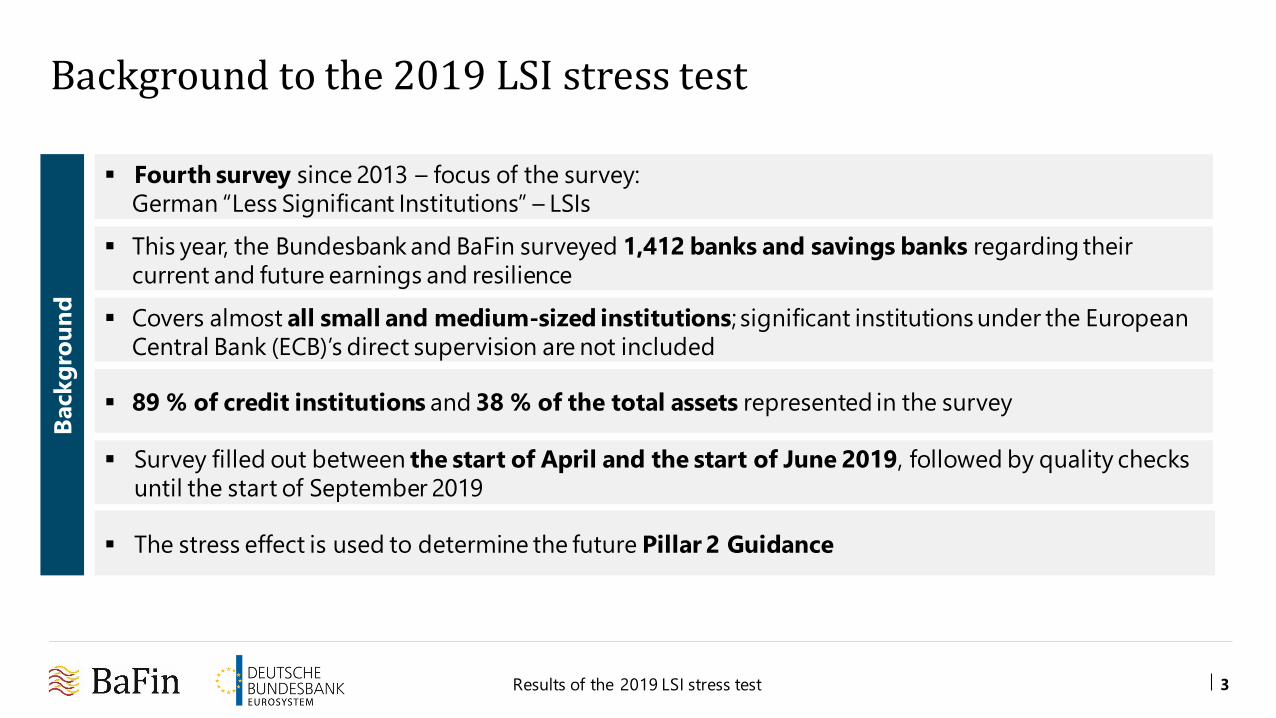
Background to the 2019 LSI stress test
Covers almost all small and medium-sized institutions; significant institutions under the European
Central Bank (ECB)’s direct supervision are not included
Fourth survey since 2013 – focus of the survey:
German “Less Significant Institutions” – LSIs
This year, the Bundesbank and BaFin surveyed 1,412 banks and savings banks regarding their
current and future earnings and resilience
89 % of credit institutions and 38 % of the total assets represented in the survey
The stress effect is used to determine the future Pillar 2 Guidance
Back
gro
un
d
Survey filled out between the start of April and the start of June 2019, followed by quality checks
until the start of September 2019

Results of the 2019 LSI stress test 4
Agenda
I. Background
II. Survey
III. 2019 LSI stress test
IV. Real estate financing
V. Credit underwriting standards

Results of the 2019 LSI stress test 5
Overview of the survey results
Solvency
Rating
CET1 ratios increasing but
with higher risk exposure
Capital ratios good overall in comparison with previous years
Just under 1/3 of the institutions planned for a reduction in Common Equity Tier 1 (CET1) ratios
Planned CET1 ratios increasing from 16.5 % to 16.8 % by 2023
Quality of
planning
Conservative planning
provides buffer for downward revisions
Approximately half of the institutions had expected an upturn
in interest rates and were therefore too optimistic in their plannings
Overall, plans have historically been rather conservative
Profitability
Risk exposure
Institutions planning for increase from 0.42 % to 0.46 %
Figures too optimistic if upturn in interest rates does not occur
Return on assets at
historically low level
Risk-weighted assets (RWA) increasing more quickly than total
assets
Institutions agreeing longer-term fixed interest rates
Consistent trend towards
increased risk exposure can lead to considerable
strain in the future
Institutions’ five-year planning data
Results of the 2019 LSI stress test 6
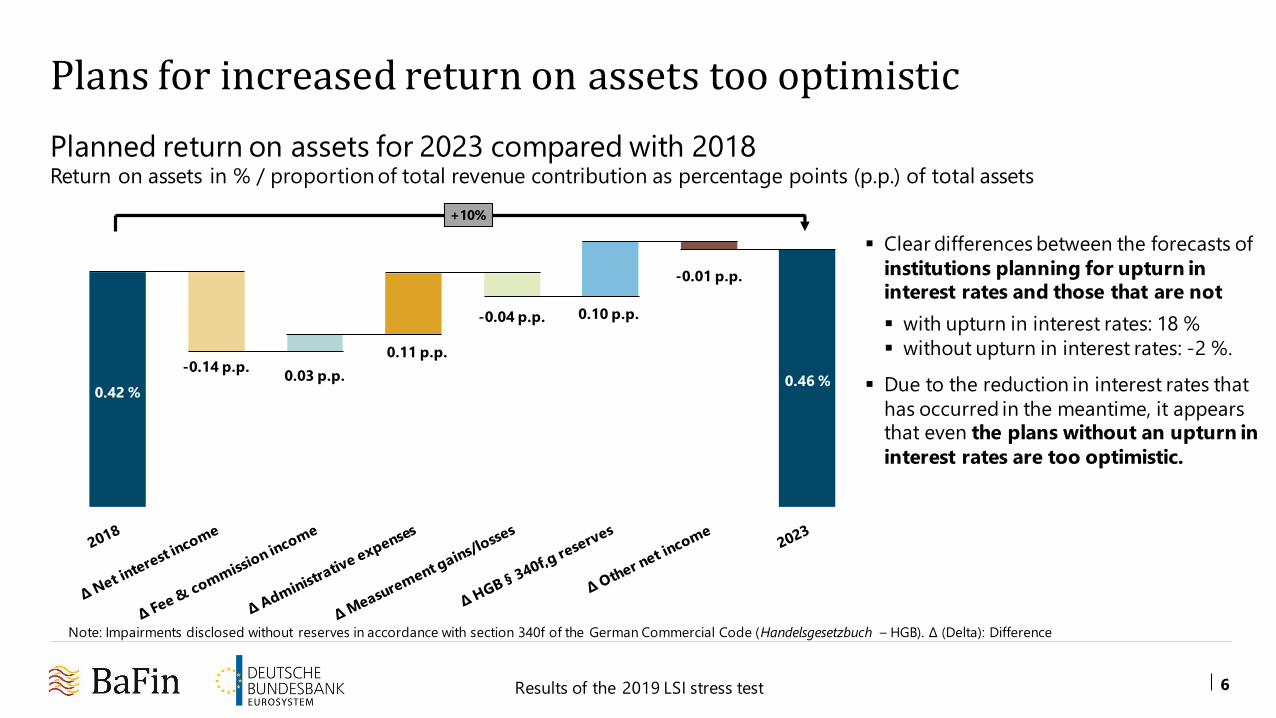
Plans for increased return on assets too optimistic
Planned return on assets for 2023 compared with 2018Return on assets in % / proportion of total revenue contribution as percentage points (p.p.) of total assets
Clear differences between the forecasts of
institutions planning for upturn in interest rates and those that are not
with upturn in interest rates: 18 %
without upturn in interest rates: -2 %.
Due to the reduction in interest rates that
has occurred in the meantime, it appears that even the plans without an upturn in
interest rates are too optimistic.
0.42 %
-0.14 p.p.0.03 p.p.
0.11 p.p.
-0.04 p.p. 0.10 p.p.
-0.01 p.p.
0.46 %
Note: Impairments disclosed without reserves in accordance with section 340f of the German Commercial Code (Handelsgesetzbuch – HGB). Δ (Delta): Difference
+10%
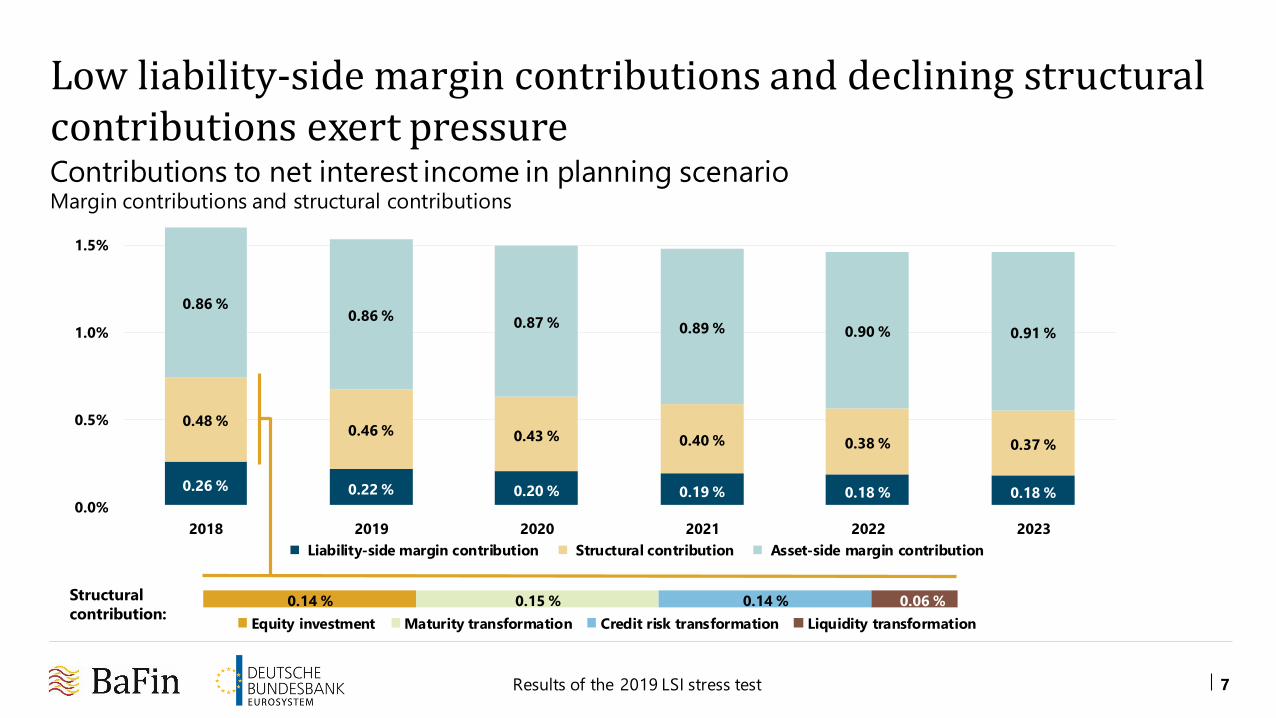
0.26 % 0.22 % 0.20 % 0.19 % 0.18 % 0.18 %
0.48 %0.46 % 0.43 % 0.40 % 0.38 % 0.37 %
0.86 %0.86 % 0.87 % 0.89 % 0.90 % 0.91 %
0.0%
0.5%
1.0%
1.5%
2018 2019 2020 2021 2022 2023
Liability-side margin contribution Structural contribution Asset-side margin contribution
Results of the 2019 LSI stress test 7
Low liability-side margin contributions and declining structural contributions exert pressureContributions to net interest income in planning scenarioMargin contributions and structural contributions
0.14 % 0.15 % 0.14 % 0.06 %
Equity investment Maturity transformation Credit risk transformation Liquidity transformation
Structural
contribution:

+ 10 %
+ 38 %
- 12 %
- 19 %
- 52 %
+ 12 %
0.0%
0.1%
0.2%
0.3%
0.4%
0.5%
0.6%
2018 2019 2020 2021 2022 2023Planning data (dynamic balance sheet) +200 bps (static balance sheet)+/- 0 bps (static balance sheet) Inversion (static balance sheet)-100 bps (static balance sheet) Gradual increase in interest rates (static balance sheet)
Impairments due to ad hoc rise in interest rates
Results of the 2019 LSI stress test 8
Institutions reported on their own planning data and on five interest rate scenarios defined by supervisors
Return on assetsNet profit for the year before tax to total assets
Note: “Static balance sheet” means that existing business that matures is replaced by equivalent new business with current conditions. “Dynamic balance sheet” means that there are no supervisory restrictions with regard to the balance sheet structure. bps: basis points

Results of the 2019 LSI stress test 9
Willingness to pass on negative interest rates has increased
Were negative interest rates on deposits passed on in the respective scenarios?
33 %
9 %
58 %
19 %
49 %
31 %
15 %
8 %
77 %
yes, only incommercial business
yes, in both retail andcommercial business
no
Planning data
-100 bps scenario
Planning data (2017 survey on low interest rateenvironment)

Results of the 2019 LSI stress test 10
9 %
3 %
1 %
33 %
15 %
24 %
1 %
2 %
4 %
8 %
0.3 %
0.1 %
0.4 %
0.1 %
not at all
not at all, but we planto take these risks into
account
to some extent
fairly comprehensively
no answer given
low
moderate
high
What is your assessment of
the risk to your institution with
regard to ecological and
climate-related risks?
Management of climate risks still in early stages
To what extent do you currently take into account ecological and climate-related
risks in your risk management?
(1 %)
(33 %)
not at all, but planning to
take these risks into account
(22 %)
(44 %)
Results of the 2019 LSI stress test 11
Agenda
I. Background
II. Survey
III. 2019 LSI stress test
IV. Real estate financing
V. Credit underwriting standards

Results of the 2019 LSI stress test 12
All material risks considered
Simulation of the full profit and loss statement (P&L) over a three-year stress horizon
The simulation assumes a severe economic downturn
The German institutionsproved to be resilient even under stress
On average, the stress effect was approximately 3.5 percentage points
The stress effect is used to determine the future Pillar 2 Guidance
Meth
od
an
d a
ssu
mp
tio
ns
Resu
lts
Interest rate risk Market risk Counterparty risk Other P&L
Increase of the yield curve by 45 to 173 basis points
Net interest income on the basis of a simplified interest rate gap analysis
Rise in interest rates(analogous to interest rate risk) and increase in credit spread between 71 and 1,446 basis points
Haircuts on other positions of between 5.8 % and 30.7 %
Automatic calculationof the valuation reserves based on the probability of default (PD) and loss given default (LGD)
PD and LGD paths dependent on starting parameters
Forward projection on the basis of historical data, in case of some positions with haircuts
Consideration of one-off effects on an individual basis
Stress testing: Method and results
Results of the 2019 LSI stress test 13
2018 Zinsrisiko Adressrisiko Marktrisiko Sonstiges 2021
Aufteilung der sonstigen GuV-Positionen
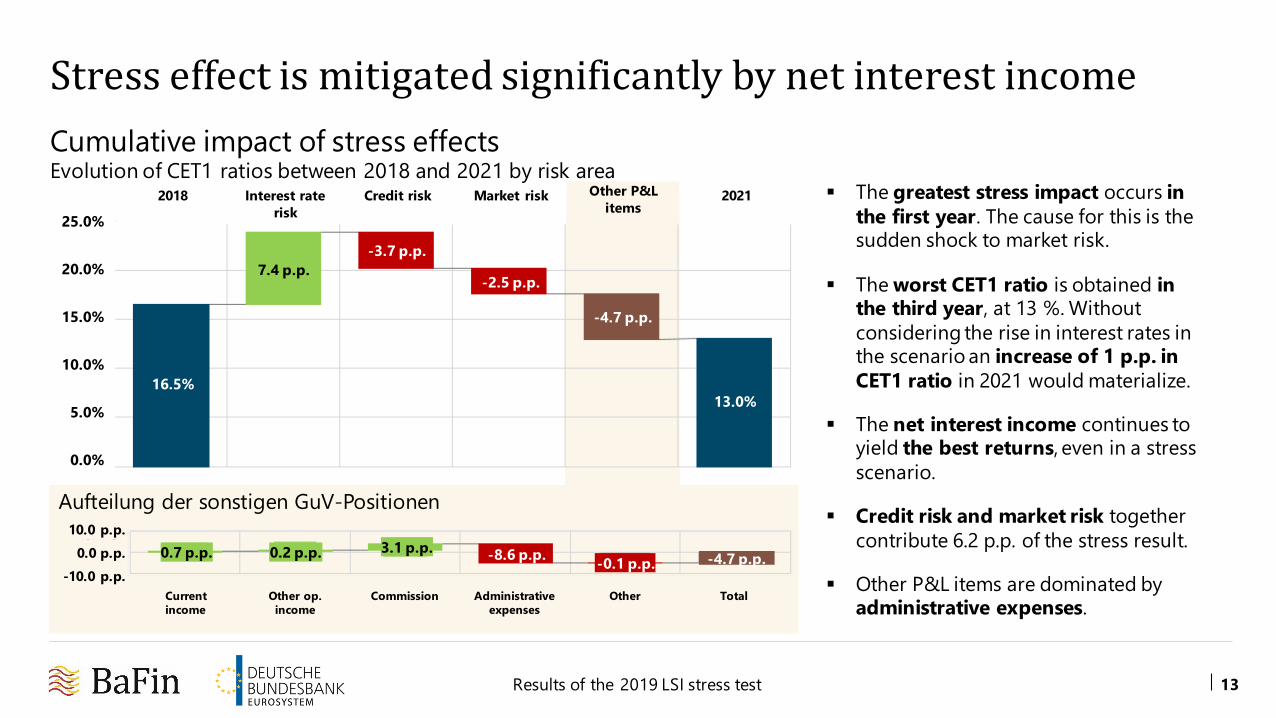
Stress effect is mitigated significantly by net interest income
The greatest stress impact occurs in
the first year. The cause for this is the sudden shock to market risk.
The worst CET1 ratio is obtained in the third year, at 13 %. Without
considering the rise in interest rates in the scenario an increase of 1 p.p. in
CET1 ratio in 2021 would materialize.
The net interest income continues to yield the best returns, even in a stress
scenario.
Credit risk and market risk together
contribute 6.2 p.p. of the stress result.
Other P&L items are dominated by administrative expenses.
Current
income
Other op.
income
Commission Administrative
expenses
Other Total
2018 Interest rate
risk
Credit risk Market risk Other P&L
items2021
Cumulative impact of stress effectsEvolution of CET1 ratios between 2018 and 2021 by risk area
16.5%13.0%
7.4 p.p.
-3.7 p.p.
-2.5 p.p.
-4.7 p.p.
-8.6 p.p.-0.1 p.p.
0.7 p.p. 0.2 p.p. 3.1 p.p.-4.7 p.p.
10.0 p.p.
0.0 p.p.
-10.0 p.p.
25.0%
20.0%
15.0%
10.0%
5.0%
0.0%
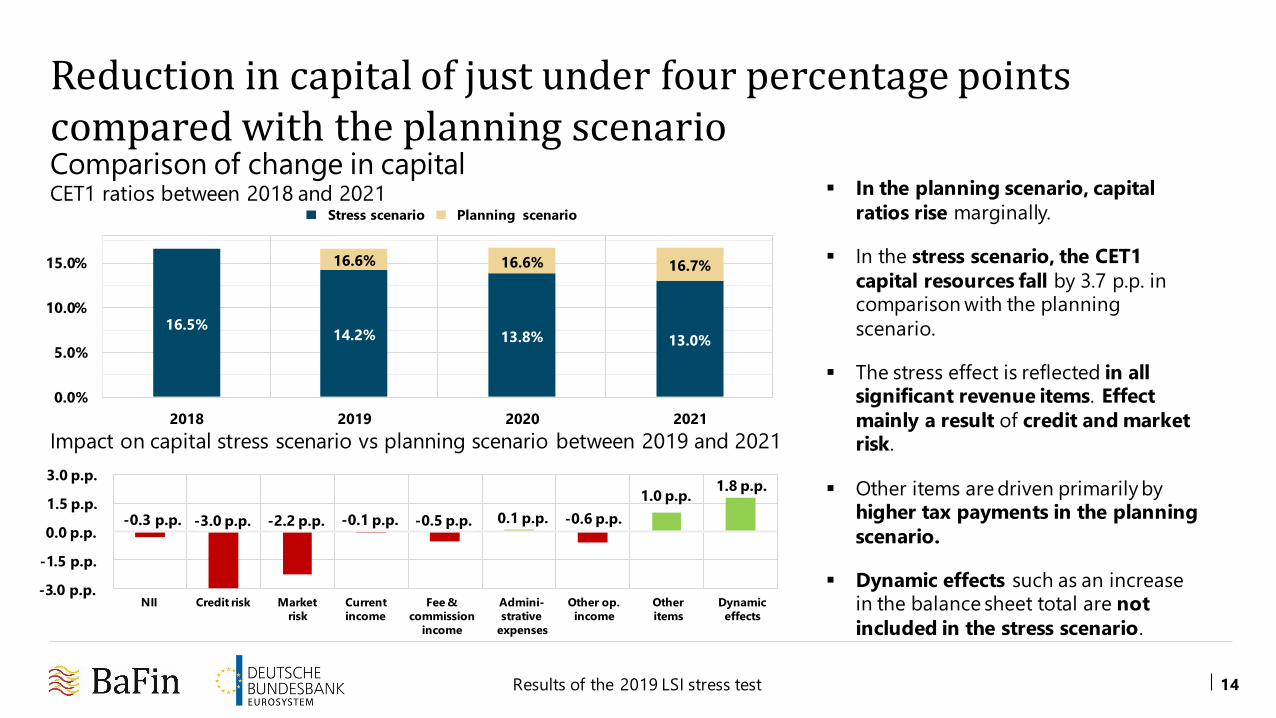
16.5%14.2% 13.8% 13.0%
16.6% 16.6% 16.7%
0.0%
5.0%
10.0%
15.0%
2018 2019 2020 2021
Stressszenario Planszenario
Results of the 2019 LSI stress test 14
-0.3 p.p. -3.0 p.p. -2.2 p.p. -0.1 p.p. -0.5 p.p. 0.1 p.p. -0.6 p.p.
1.0 p.p.1.8 p.p.
-3.0 p.p.
-1.5 p.p.
0.0 p.p.
1.5 p.p.
3.0 p.p.
Zins-
ergebnis
Adress-
risiko
Markt-
risiko
Laufende
Erträge
Provisions-
ergebnis
Verwaltungs-
aufwand
Sonst. Betr.
Ergebnis
Sonstige
Positionen
Dynamische
Effekte
In the planning scenario, capital
ratios rise marginally.
In the stress scenario, the CET1
capital resources fall by 3.7 p.p. in comparison with the planning
scenario.
The stress effect is reflected in all significant revenue items. Effect
mainly a result of credit and market risk.
Other items are driven primarily by higher tax payments in the planning
scenario.
Dynamic effects such as an increase in the balance sheet total are not
included in the stress scenario.
Reduction in capital of just under four percentage points compared with the planning scenario
Stress scenario Planning scenario
Impact on capital stress scenario vs planning scenario between 2019 and 2021
NII Credit risk Market
risk
Current
income
Fee &
commission
income
Admini-
strative
expenses
Other op.
income
Other
items
Dynamic
effects
Comparison of change in capitalCET1 ratios between 2018 and 2021

2.5%
20.3%24.3%
11.4%
25.7%
8.0% 7.3%0.5%
0.0%
20.0%
Ausfälle Mengen-
geschäft
Unter-
nehmen
Gewerbe-
immobilien
besichert
Wohn-
immobilien
besichert
Institute Staaten Sonstige
Results of the 2019 LSI stress test 15
Credit risk driven by exposures in default
3.7 p.p.
Stress effect and share of risk volume by exposure classCumulative CET1 effect over three years
The stress scenario causes the
exposures in default to more than double (increase by just under 150 %).
The main driver for the stress effect in the credit risk is the default class.
The stress effect on the exposure
classes sovereigns and institutions is, as is to be expected, marginal.
The stress effect on the exposure class residential real estate is also
only minimal, despite the high exposure.
Proportion of risk volume in 2021
Defaults Retail
business
Companies Collat.
commercial
real estate
Collat.
residential
real estate
Institutions Sovereigns Other
1.7 p.p.
0.7 p.p.
0.7 p.p.0.3 p.p.
0.2 p.p. 0.1 p.p. 0.0 p.p. 0.0 p.p.4.0 p.p.
3.5 p.p.
3.0 p.p.
2.5 p.p.
2.0 p.p.
1.5 p.p.
1.0 p.p.
0.5 p.p.
0.0 p.p.

Results of the 2019 LSI stress test 16
73.7% 17.1%
22.1%
9.2%
Anteil CET1-Effekt 58.8% 19.1%
Anteil am Portfolio
interest-bearing non interest-bearing
10.0% 8.0% 8.2%4.5% 0.4%
9.8% 10.6% 12.7%
3.3% -6.2%
7.6%6.9% 6.9%
6.2%
1.6%
9.6%
-6%
-1%
4%
9%
14%
19%
24%
29%
34%
AAA AA A BBB BB und
schlechter
über Fonds Aktien Immobilien-
fonds
Sonstige Derivate
25.8%19.4% 18.5%
9.1% 1.7%
17.2%3.0%
4.9%0.6%
-0.1%-6%
-1%
4%
9%
14%
19%
24%
29%
34%Proportion in portfolio (by rating class and risk category)
Interest drivenCredit-spread driven
Interest-bearing items (incl. interest rate
swaps) account for more than 90 % of the portfolio dominating the stress effect in
the market risk.
Non-interest-bearing items (direct
investments and held via funds incl. respective derivatives) have a
disproportionately high contribution to the stress effect, in particular shares and real
estate funds.
The stress effect is shown after offsettingthe hedging-effects and price reserves.
On average, derivatives led to a reductionin the stress effect.
There is no significant change in the risk
taking in comparison with the 2017 survey on the low interest rate environment.
Clear stress effect from interest-bearing items
Proportion in overall portfolio and proportion of stress effect
Direct investment Funds
Proportion in portfolio
Proportion in stress effect
Proportion in CET1 effect (by rating class and risk category)
AAA AA A BBB BB and
lower
Funds Shares Real estate
funds
Other Derivatives

Results of the 2019 LSI stress test 17
Nic
htb
an
ken
: So
nst
ige
Nic
htb
an
ken
: p
rivate
W
oh
nim
mo.
Sch
uld
ver-
sch
reib
un
gen
Ban
ken
So
nst
ige
Akti
va
Nic
htb
an
ken
: So
nst
ige
Ban
ken
Nic
htb
an
ken
: T
äg
lich
fäll
ig
So
nst
ige
Pass
iva in
kl.
Deri
vate
Assets Liabilities
7.4 p.p.
Interest income still has compensating effect in stress test
Effect of interest rates on individual portfoliosCumulative CET1 effect over three years
Despite the assumption of a rise in
interest rates, there is a fall in net interest income in the stress test.
This is caused by the shorter interest rate fixation period on the liabilities
side and assets with higher interest rates maturing.
The majority of the interest income is
earned through business with retail and commercial clients.
Refinancing is primarily through retail deposits.
Credit risk defaults lower interest
income.
No
n-b
an
ks:
oth
er
No
n-b
an
ks:
reta
ilre
sid
en
tial
real
est
ate
Bo
nd
s
Ban
ks
Oth
er
ass
ets
No
n-b
an
ks:
oth
er
Ban
ks
No
n-b
an
ks:
daily
matu
rity
Oth
er
liab
ilit
ies
incl
. d
eri
vati
ves
6.0 p.p.
3.0 p.p.
1.2 p.p.0.3 p.p. 0.1 p.p.
-1.1 p.p.
-1.0 p.p.-0.5 p.p.
-0.6 p.p.
12.0 p.p.
10.0 p.p.
8.0 p.p.
6.0 p.p.
4.0 p.p.
2.0 p.p.
0.0 p.p.
Results of the 2019 LSI stress test 18
Agenda
I. Background
II. Survey
III. 2019 LSI stress test
IV. Real estate financing
V. Credit underwriting standards

Results of the 2019 LSI stress test 19
Banks continuing to expand their real estate business
-8
-4
0
4
8
12
16
20
0
50
100
150
200
2006 2008 2010 2012 2014 2016 2018
Source: Bundesbank calculations based on price data from bulwiengesa AG; banking statistics, data for Monetary Financial
Institutions (MFIs) adjusted for statistical changes.
Price trend
Expansion of credit portfolio
Retail residential real estate financingPrice Expansion of credit portfolio
(left axis, index 2010=100) (right axis, in %)
Portfolio expansion at highest level
since the financial crisis.
The majority of the banks surveyed
plan for further expansion.

Results of the 2019 LSI stress test 20
Credit standards for residential real estate financing less conservative, but not critical
Source: 2019 survey on real estate financing, based on data from 1098 banks and savings banks with large residential mortgage portfolios. p.a. (per annum): per year
New business lending: retail residential real estate financingCredit characteristics (volume-weighted)
3.25%
€ 134,360
2017
€ 7,061
3.48%
1.77%
€ 7,510
1.83%
+6.4%
2018
+10.2%
83.8% 84.8%86.5%
60%
70%
80%
90%
2016 2017 2018
+ 2.7 p.p.
+0.1 p.p.
-0.2 p.p.
Avg. total loan
amount
Avg. annuity
Avg. repayment
rate p.a.
Avg. interest rate
p.a.
€ 148,010
Avg. loan-to-value
(absolute level not fully reliable)

Results of the 2019 LSI stress test 21
Expansion of commercial real estate financing volume; no clear indication of credit standards loosening
Source: Based on data from 383 institutions with large commercial mortgage portfolios.Source: vdpResearch GmbH.
Price trend
80
100
120
140
160
2006 2008 2010 2012 2014 2016 2018
Index für Büro- und Einzelhandelsimmobilien
Index für Einzelhandelsimmobilien
Index für Büroimmobilien
16.0%16.9%
17.8%
3.5% 3.8% 3.9%
0%
10%
20%
2016 2017 2018
Bestandsvolumen Neukreditvolumen
Commercial real estate financingPrice commercial real estate Lending volumes for existing and new business
(Index 2010=100) (average share of total assets among surveyed banks)
Index for office and retail real estate
Index for retail real estate
Index office real estate
Volume of existing business Volume of new business
Results of the 2019 LSI stress test 22
Agenda
I. Background
II. Survey
III. 2019 LSI stress test
IV. Real estate financing
V. Credit underwriting standards

11.9% 13.1%
4.1% 4.8%0%
5%
10%
15%
2015 2018
Kreditbestand Neugeschäft
21.3%
64.1%
1.0% 13.6%0%
20%
40%
60%
80%
stark intensiviert intensiviert abgeschwächt unverändert
Results of the 2019 LSI stress test 23
Indications for loosening of credit underwriting standards
Volume of stock and new business in sampled
portfolios (average share of total assets in %)
Purpose of survey
To investigate the trends in credit underwriting standards in
corporate financing
105 banks were included in the survey
Two portfolios were sampled: borrowers that are corporateswith an annual turnover of between EUR 50 million and
EUR 500 million (portfolio A) and corporates with an annualturnover of over EUR 500 million (portfolio B)
Results of the survey – on the basis of term loan structures
Individual indicators for loosening of credit underwriting
standards
Share of new business with good credit ratings increased;meanwhile margins declined
Approx. 85 % of banks have seen an increase in domestic
competition since 2015
The particularities of contract terms and conditions of theportfolios are often becoming more similar
Assessment of market competition in corporate
financing since 2015
Large increase Increase Reduction Unchanged
New businessStock

Results of the 2019 LSI stress test 24
Increase of unsecured shares and bullet loans
Uncollateralised proportion of new business
Proportion of bullet loans in new business
47.8%72.7%
54.9%
78.5%
0%
50%
100%
2015 2018
Portfolio A
73.4% 77.7%
85.8% 87.8%
0%
50%
100%
2015 2018
Portfolio B
34.6%
55.5%
0%
20%
40%
60%
Portfolio A
49.1% 43.6%
0%
20%
40%
60%
Portfolio B
Uncollateralised share of partly
collateralised loans
Proportion that is 100%
uncollateralised
2015 2018
Collateralisation
The proportion of uncollateralised business has risen inboth portfolios; the proportion that is “100 %
uncollateralised” has expanded; Meanwhile, no changesseen in banks’ internal policies for collateral allocation
Real estate collateral does not play a significant role; key
risk indicator loan-to-value is therefore of little significance.
Repayment schedule
The proportion of bullet loans has increased in portfolio A
(slightly decreased in portfolio B). Meanwhile, the fixedinterest rate periods have remained steady (portfolio A) or
reduced (portfolio B).

77.5% 78.5% 82.4% 89.4%
17.5% 15.4%16.1% 9.7%
0%
50%
100%
Portfolio A 2015 Portfolio A 2018 Portfolio B 2015 Portfolio B 2018
<= 10 Jahren > 10 Jahren und <= 20 Jahren > 20 Jahren
Results of the 2019 LSI stress test 25
Increasing importance of short maturities and good credit ratings
Trends in contract maturity
Distribution of new business by PD in portfolio A
46.6%34.0%
51.7%35.7%
19.4% 12.6%0%
30%
60%
PD <= 0.39% PD > 0.39% und <= 2.03% PD > 2.03%
2015 2018
Contract maturity
Very high proportion of term lengths of less than 10 years;volume of contracts with terms between 10 and 20 years is falling
Reduction in average contract term by around a year in each of
the two portfolios with a slight increase in the average loan size
Credit ratings and margins
Increase in share of new business contracts with good credit
ratings in both portfolios; meanwhile decline of margins
Heterogeneous development of interest rate spreads in
portfolio B caused mainly by one-off effects
Types of contracts
Clear trend towards standard contracts; doubling of share
of new business contracts to 48 % in portfolio A and 25 % inportfolio B
<= 10 years > 10 years and <= 20 years > 20 years
and
Results of the 2019 LSI stress test
Press conference on 23 September 2019