results of tourism activity - datatur3 - inicioen).pdfjanuary-april 7,171.9 7,876.3 9.8% 2016 2017...
TRANSCRIPT

Undersecretariat of Planning and Tourism Policy
Mexico, April 2017
Available in http://www.datatur.sectur.gob.mx/SitePages/versionesRAT.aspx
Results of Tourism Activity

2
DIRECTORy
ENRIQUE DE LA MADRID CORDEROMinister of Tourism
MARÍA TERESA SOLÍS TREJO Undersecretary of Planning and Tourism Policy
DIRECTORATE-GENERAL OF INTEGRATION AND SECTORAL INFORMATION [email protected]
3
INDEX
• International Visitors to Mexico
• Air Transportation by residence
• Domestic Tourism
• Transportation
• Other Indicators
1. Arrival of international visitors1.1. Arrival of international tourists1.2. International travel receipts1.3. International travelers balance1.4.Average Expenditure of Long-Stay tourists, Air transport
2. International visitors to Mexico arriving by Air2.1. American passengers arriving by Air2.2. Canadian passengers arriving by Air2.3. Main airports of arrival
3.1. Occupancy rate3.2. Arrival of tourists to Hotels
4.1. Air Transportation4.2. Maritime Transportation4.3. Main Ports
6.1.Tourism Employment6.2. Results of Tourism Activity, table6.3. Macroeconomic indicators, prospects6.4. Mexico’s key economic indicators6.5. Economic context
• Museums and archeological sites
5.1. Museums and archeological sites
55678
10111112
1414
161819
24252627
21
23

4
International Visitors to Mexico

5
ChangeMillion
passengersJanuary- April
ChangeMillion visitors
January-April
Arrival of international visitors
Note: In the graphs the sum of the data does not coincide with the accumulated period due to the rounding of figures.
Source: Bank of Mexico, Balance of payments.http://www.datatur.sectur.gob.mx/SitePages/VisitantesInternacionales.aspx
Arrival of international tourists
31.732.5 2.3%
11.412.5 8.9%
20162017
20162017
Chart 1. According to Bank of Mexico, during January-April 2017 the number of international visitors arriving to Mexico was 32.5 million, that is 727 thousand higher than January-April 2016 and equal to an increase of 2.3% in comparison to the same period of the previous year
Chart 2. The arrival of international tourists in January-April 2017 was 12.5 million, reaching one million 23 thousand more than January-April 2016, an increase of 8.9% in comparison to the same period of the previous year.
8.1 7.6 8.8 8.0
7.87.7
8.6
7.7 7.6 7.7
7.9
7.4
7.0
7.9
8.0
9.3
5.5
6.0
6.5
7.0
7.5
8.0
8.5
9.0
9.5
10.0
Jan Feb Mar Apr May Jun Jul Aug Sep Oct Nov Dec
Mill
ion
of p
eopl
e
2017 2016
2.9 2.9 3.5 3.2
2.9
2.7
3.2
2.7 2.7
2.9
3.3
2.7
2.3
2.82.9
3.9
1.5
1.9
2.3
2.7
3.1
3.5
3.9
Jan Feb Mar Apr May Jun Jul Aug Sep Oct Nov Dec
Mill
ion
of to
urist
s
2017 2016
6
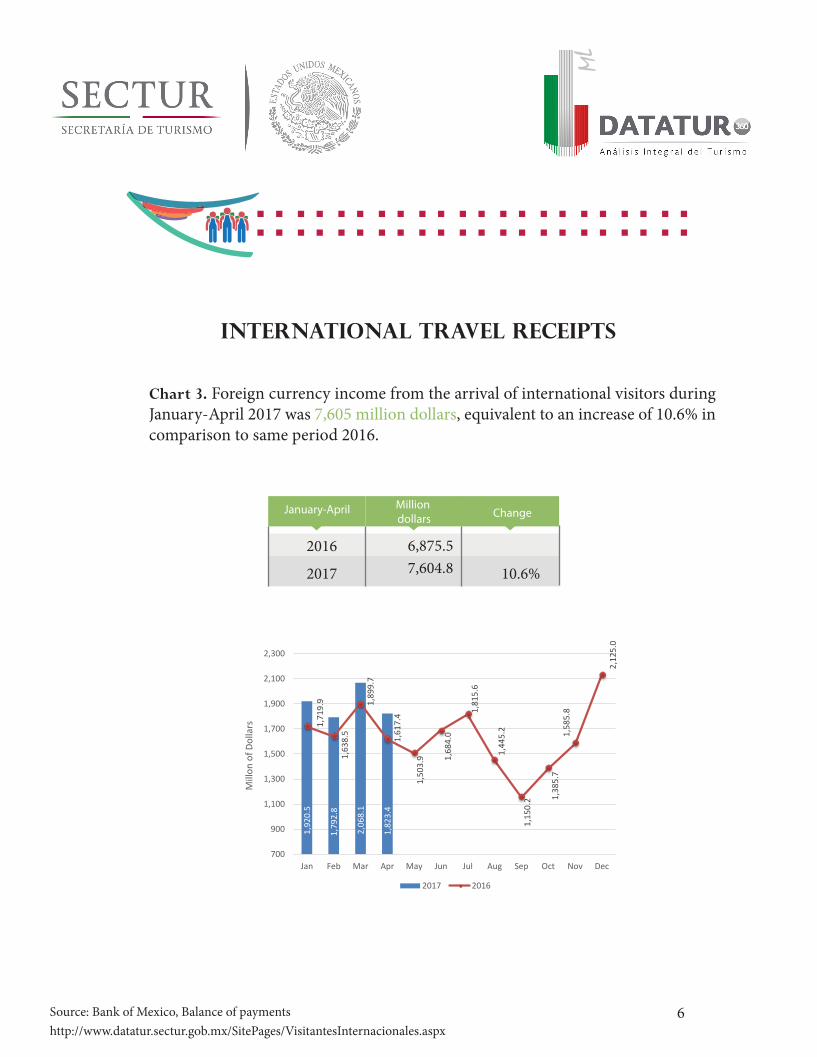
ChangeMillion dollars
January-April
International travel receipts
6,875.57,604.8 10.6%
Source: Bank of Mexico, Balance of paymentshttp://www.datatur.sectur.gob.mx/SitePages/VisitantesInternacionales.aspx
2016
2017
Chart 3. Foreign currency income from the arrival of international visitors during January-April 2017 was 7,605 million dollars, equivalent to an increase of 10.6% in comparison to same period 2016.
1,92
0.5
1,79
2.8
2,06
8.1
1,82
3.4
1,71
9.9
1,63
8.5
1,89
9.7
1,61
7.4
1,50
3.9 1,
684.
0
1,81
5.6
1,44
5.2
1,15
0.2 1,
385.
71,
585.
8
2,12
5.0
700
900
1,100
1,300
1,500
1,700
1,900
2,100
2,300
Jan Feb Mar Apr May Jun Jul Aug Sep Oct Nov Dec
Mill
on o
f Dol
lars
2017 2016
7
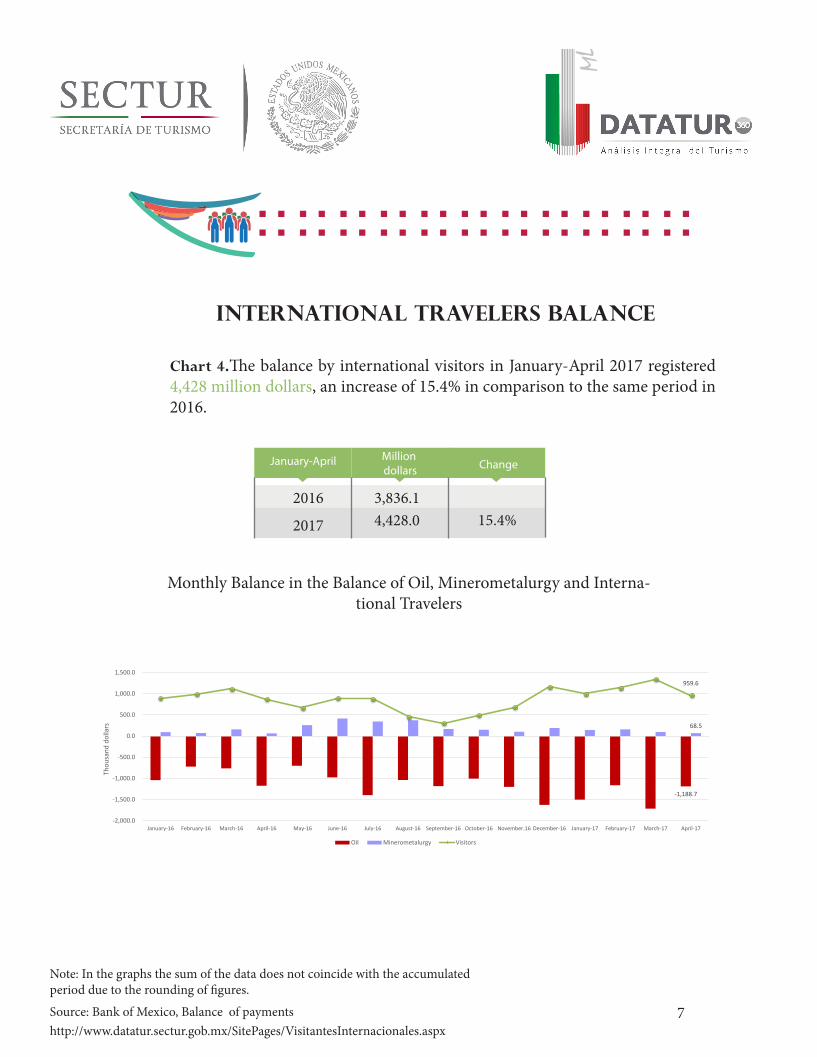
ChangeMillion dollars
January-April
International travelers balance
Source: Bank of Mexico, Balance of paymentshttp://www.datatur.sectur.gob.mx/SitePages/VisitantesInternacionales.aspx
Note: In the graphs the sum of the data does not coincide with the accumulated period due to the rounding of figures.
3,836.14,428.0 15.4%
Monthly Balance in the Balance of Oil, Minerometalurgy and Interna-tional Travelers
2016
2017
Chart 4.The balance by international visitors in January-April 2017 registered 4,428 million dollars, an increase of 15.4% in comparison to the same period in 2016.
-1,188.7
68.5
959.6
-2,000.0
-1,500.0
-1,000.0
-500.0
0.0
500.0
1,000.0
1,500.0
January-16 February-16 March-16 April-16 May-16 June-16 July-16 August-16 September-16 October-16 November.16 December-16 January-17 February-17 March-17 April-17
Thou
sand
dol
lars
Oil Minerometalurgy Visitors

8
Change
DollarsJanuary-April
Average Expenditure of Long-Stay tourists, Air transport
Source: Bank of Mexico, Balance of payments http://www.datatur.sectur.gob.mx/SitePages/Visitantes%20Por%20Nacionalidad.aspx
933.6
941.7 0.9%
20162017
Chart 5. During January-April 2017, the average expenditure of long-stay tourists by air was 941.7 dollars, an increase of 0.9% in comparison to the same period in 2016.
968.
8
950.
8
924.
7
923.
9
945.0
908.5
925.7
957.9
940.9
951.3 958.1
933.9
902.2
901.8
921.2
912.8
840.0
860.0
880.0
900.0
920.0
940.0
960.0
980.0
1,000.0
1,020.0
Jan Feb Mar Apr May Jun Jul Aug Sep Oct Nov Dec
Dolla
rs
2017 2016

9
Air Transportation

10
International visitors to Mexico arriving by Air
Source: Migration Policy Unit, SEGOBhttp://www.datatur.sectur.gob.mx/SitePages/Visitantes%20Por%20Nacionalidad.aspx
Chart 6. In January-April 2017, the arrival of foreign air-coming vis-itors who reside in the United States represents 59.2% of all foreign arrivals by air. From Latin American and the Caribbean region the countries of residence with the highest number of foreign arrivals to Mexico were Argentina and Colombia, with 2.8% and 1.9% of total visitors respectively.
United States59.2%
Canada 16.2%
Argentina2.8%
United Kingdom2.2%
Colombia1.9%
Other17.7%
Note: In the graphs the sum of the data does not coincide with theaccumulated period due to the rounding of figures

11
ChangeCanadian passengers
January-April
ChangeAmerican
passengers January-April
American passengers per airport
Canadian passengers per airport
Source: Migration Policy Unit, SEGOBhttp://www.datatur.sectur.gob.mx/SitePages/Visitantes%20Por%20Residencia.aspx
3,360,234
3,725,709 10.9%
933,202
1,019.549 9.3%
20162017
20162017
Chart 7. The American residents who arrived to Mexico by air increased 10.9% in January-April 2017 compared to the same period of 2016, registered three million 726 thousands passengers who arrived firstly at the Cancun Airport, followed by Los Cabos Airport.
Chart 8. The number of Canadian residents who arrived to Mexico by air was 9.3% higher during January-April 2017 in comparison to the same period of last year. They firstly arrived at the Cancun Airport, followed by Puerto Vallarta Airport.
1,437,491 453,559 442,225 402,688 233,919 390,352
1,53
8,19
2
547,
090
509,
687
443,
982
268,
378
418,
380
0
200,000
400,000
600,000
800,000
1,000,000
1,200,000
1,400,000
1,600,000
1,800,000
Cancún, Q. Roo Los Cabos,B.C.S.
Mexico City(AICM)
Puerto Vallarta,Jal.
Guadalajara,Jal.
Others
Pass
enge
rs
2016 2017
955,318
325,342136,821 123,290 44,183
149,636
517,
300
219,
158
73,0
98
67,3
88
34,0
02
108,
603
0
200,000
400,000
600,000
800,000
1,000,000
1,200,000
Cancun,Quintana Roo
Puerto Vallarta,Jal.
Mexico City(AICM)
Los Cabos,B.C.S.
Huatulco, Oax. Others
Pass
enge
rs
2016 2017
12
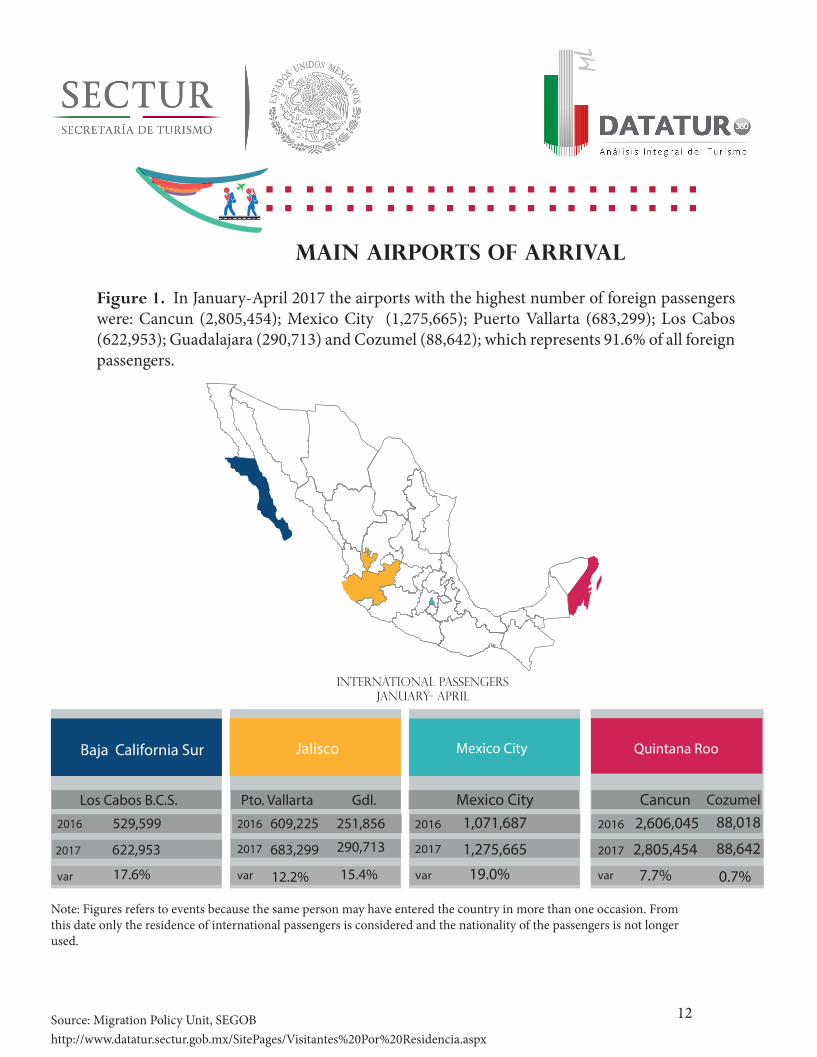
Main airports of arrival
Figure 1. In January-April 2017 the airports with the highest number of foreign passengers were: Cancun (2,805,454); Mexico City (1,275,665); Puerto Vallarta (683,299); Los Cabos (622,953); Guadalajara (290,713) and Cozumel (88,642); which represents 91.6% of all foreign passengers.
Source: Migration Policy Unit, SEGOB http://www.datatur.sectur.gob.mx/SitePages/Visitantes%20Por%20Residencia.aspx
international passengers january- April
Note: Figures refers to events because the same person may have entered the country in more than one occasion. From this date only the residence of international passengers is considered and the nationality of the passengers is not longer used.
2016
2017 2017
2016
2017
2016
2017
Los Cabos B.C.S.
529,599
622,953
var 17.6%
2016
var
Pto. Vallarta Gdl.
609,225
683,299
251,856
290,713
12.2% 15.4%
Mexico City1,071,687
1,275,665
19.0%
Cancun2,606,045
2,805,454
7.7%var var
Cozumel
88,018
88,642
0.7%
13
Domestic Tourism
14
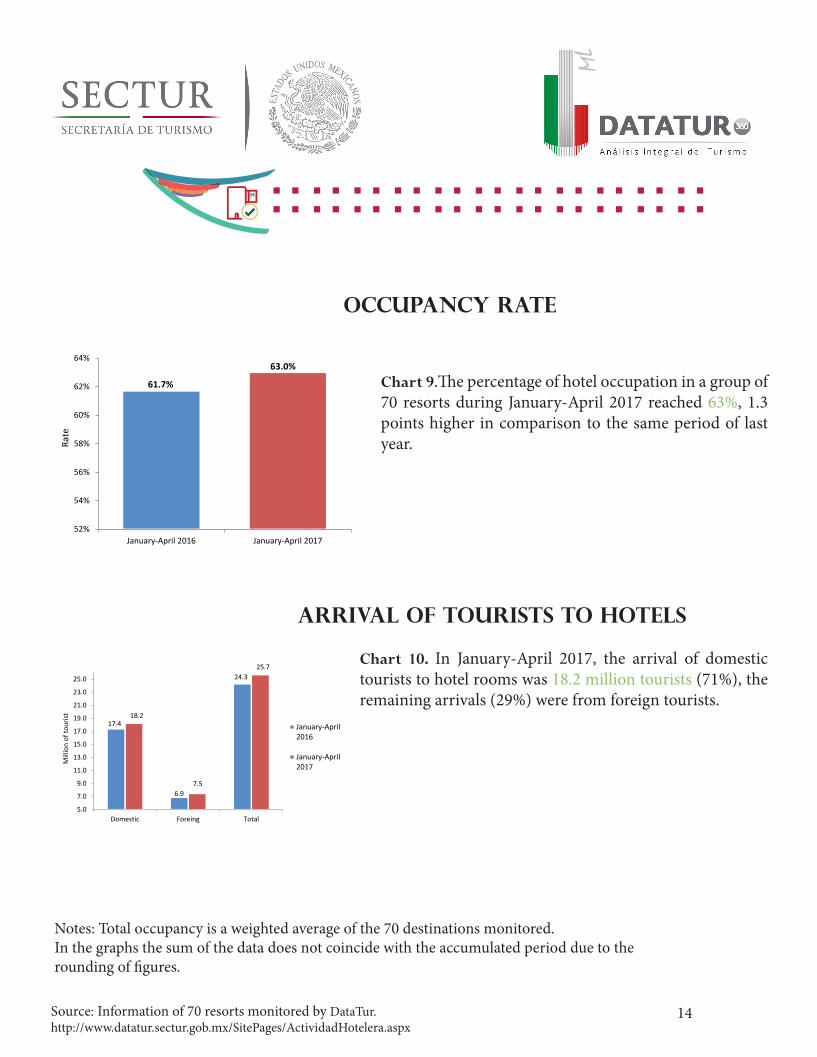
Occupancy rate
Source: Information of 70 resorts monitored by DataTur.http://www.datatur.sectur.gob.mx/SitePages/ActividadHotelera.aspx
Notes: Total occupancy is a weighted average of the 70 destinations monitored. In the graphs the sum of the data does not coincide with the accumulated period due to the rounding of figures.
Arrival of tourists to Hotels
Chart 9.The percentage of hotel occupation in a group of 70 resorts during January-April 2017 reached 63%, 1.3 points higher in comparison to the same period of last year.
Chart 10. In January-April 2017, the arrival of domestic tourists to hotel rooms was 18.2 million tourists (71%), the remaining arrivals (29%) were from foreign tourists.
61.7%
63.0%
52%
54%
56%
58%
60%
62%
64%
January-April 2016 January-April 2017
Rate
17.4
6.9
24.3
18.2
7.5
25.7
5.0
7.0
9.0
11.0
13.0
15.0
17.0
19.0
21.0
23.0
25.0
Domestic Foreing Total
Mill
ion
of to
urist
January-April2016
January-April2017

15
Transportation

16
ChangeThousand passengers
January-April
ChangeThousand passengers
January-April
Preliminary figures / Source: Airports and Auxiliary Services (SCT)http://www.datatur.sectur.gob.mx/SitePages/TrasnAerea.aspx
19,570.4
21,894.2 11.9%
12,398.514,017.8 13.1%
Air Transportation
2016
2017
2016
2017
Chart 11.The number of passengers arriving by air increased 11.9% in January-April 2017 in comparison to the same period last year, reaching 21.9 million passengers, equivalent to an increase of two million 324 thousand passengers.
Chart 12.The number of passengers arriving by air on domestic flights in January-April 2017 was 14.0 million passengers, representing one million 619 thousand of additional passengers (13.1%), in comparison to the same period last year.
5,61
6
4,91
8
5,66
7
5,69
3
4,927
4,473
5,309
4,861
5,0595,221
6,092
5,572
4,663
5,1225,387
6,152
3,000
3,500
4,000
4,500
5,000
5,500
6,000
6,500
Jan Feb Mar Apr May Jun Jul Aug Sep Oct Nov Dec
Thou
sand
s of p
eopl
e
2017 2016
3,56
9
3,10
7
3,59
0
3,75
1
3,052
2,774
3,365
3,208
3,456
3,463
4,147
3,887
3,338
3,570
3,658
3,949
1,500
2,000
2,500
3,000
3,500
4,000
4,500
Jan Feb Mar Apr May Jun Jul Aug Sep Oct Nov Dec
Thou
sand
s of p
eopl
e
2017 2016
17
ChangeThousand passengers
January-April
7,171.9
7,876.3 9.8%20162017
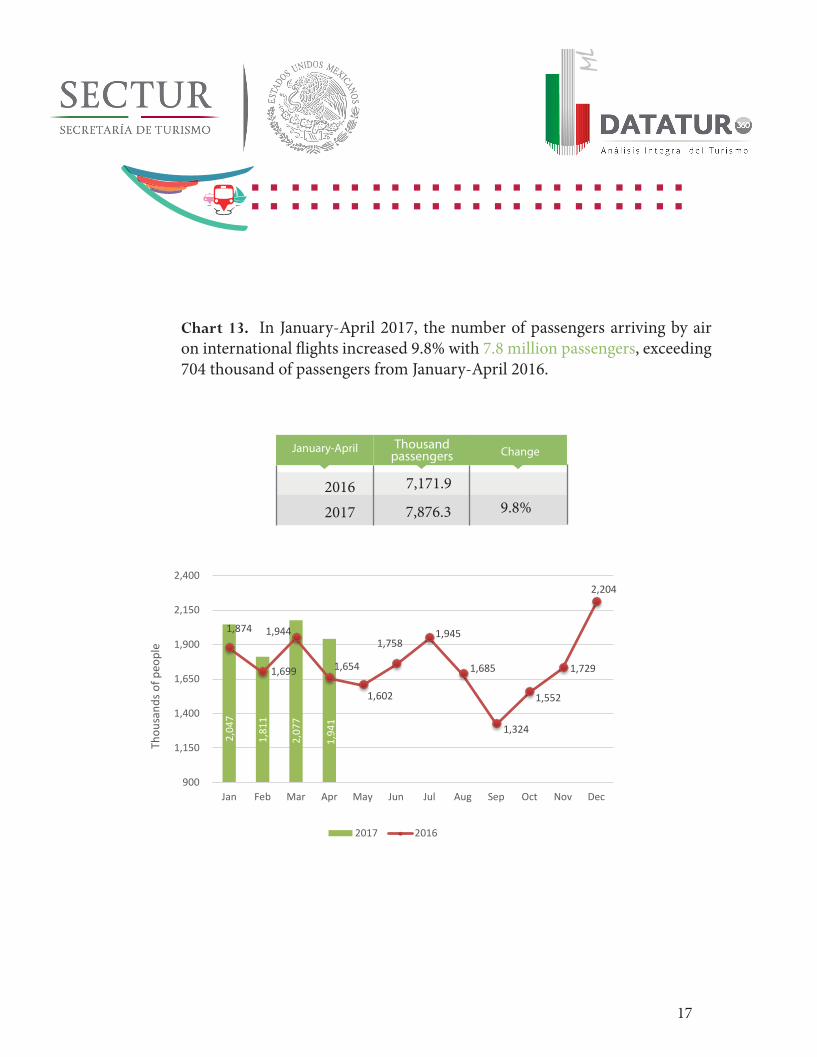
Chart 13. In January-April 2017, the number of passengers arriving by air on international flights increased 9.8% with 7.8 million passengers, exceeding 704 thousand of passengers from January-April 2016.
2,04
7
1,81
1
2,07
7
1,94
1
1,874
1,699
1,944
1,654
1,602
1,7581,945
1,685
1,324
1,552
1,729
2,204
900
1,150
1,400
1,650
1,900
2,150
2,400
Jan Feb Mar Apr May Jun Jul Aug Sep Oct Nov Dec
Thou
sand
s of p
eopl
e
2017 2016

18
ChangeArrivalsJanuary-April
ChangeThousand passengers
January-April
Maritime Transportation
Source: General Coordination of Ports and Merchant Navy, Ministry of Communications and Transportation (SCT) http://www.datatur.sectur.gob.mx/SitePages/Actividades%20En%20Crucero.aspx
2,504.52,901.0 15.8%
9571,083 13.2%
2016
2017
2016
2017
Chart 14. During January-April 2017, the number of cruise passengers reached two million 901 thousand, representing an increase of 396 thousand passengers (15.8%) in comparison to the same period 2016.
Chart 15. The number of cruise arrivals in January-April 2017 increased in 99, reaching one thousand and 83 cruises, an increase of 13.2% in comparison to the same period last year.
776.
65
663.
16
806.
31
654.
90
613 608
720
564
404 389 364 357 380
501
704
814
-
100.00
200.00
300.00
400.00
500.00
600.00
700.00
800.00
900.00
Jan Feb Mar Apr May Jun Jul Aug Sep Oct Nov Dec
Thou
sand
s of
peo
ple
2017 2016
313
261
275
234
242 242 266
207
133 110 102 102
125
180
248
305
-
50
100
150
200
250
300
350
Jan Feb Mar Apr May Jun Jul Aug Sep Oct Nov Dec
Arriv
als
2017 2016

19
Figure 2. In January-April 2017 the ports that received the highest number of passengers were the following: Cozumel, Majahual and Ensenada; representing 77.2% of total arrivals in the month.
Main Ports
Source: General Coordination of Ports and Merchant Navy, Ministry of Communications and Transportation (SCT)http://www.datatur.sectur.gob.mx/SitePages/Actividades%20En%20Crucero.aspx
January-April
Ensenada Cabo San Lucas Puerto Vallarta CozumelMajahual
2016
2017
passengers
232,392
216,869
arrivals
90
88
passengersarrivals
2016
2017
162,809
174,016
69
80
passengersarrivals
2016
2017
142,107
150,252
58
63
arrivals
2016
2017
1,444,397
1,631,597
478
523
passengers
233,441
392,506
97
140
2016
2017
passengersarrivals
change -2.2% -6.7% change -6.7%15.9% change 5.7%8.6% 44.3% 68.1% change 9.4% 13.0%change

20
Museums and archeological sites

21
During January-April of 2017, the National Institute of Anthropology and History reported 9.8 million visitors, 9.3% higher than the number reported in the same period of 2016. Of the total number of visitors, 78.7% corresponded to national visitors and 21.3% to foreigners.
ChangeMillion visitors
January-April
20162017
9.0
9.8 9.3%
Visitors to museums and archeological sites
7.0
1.9
9.0
7.7
2.1
9.8
0.0
2.0
4.0
6.0
8.0
10.0
12.0
Domestic Foreing Total
Mill
ions
of v
isito
rs
January-April 2016 January-April 2017
Source: National Institute of Anthropology and History (INAH)

22
Other Indicators

23
In the first quarter of 2017 around 3.9 million people were employed in the Mexican tourism sector, which accounted for 8.5% of the national employment. This represented a rise of 3.7% in comparison to the same quarter of the previous year.
3,987
2,500
2,700
2,900
3,100
3,300
3,500
3,700
3,900
4,100
I II III IV I II III IV I II III IV I II III IV I II III IV I II III IV I II III IV I II III IV I II III IV I II III IV I II III IV I
2006 2007 2008 2009 2010 2011 2012 2013 2014 2015 2016 2017
MIL
ES D
E PE
RSO
NAS
EM
PLEA
DAS
Thou
sand
s of p
eopl
e em
ploy
ed
TOURIMS EMPLOYMENT
Million ofpeople employed Change
First Quarter
20162017
3.8
3.9
5.2%
3.7%
Source: SECTUR Note: Indirect or induced work is not included

24
Results of Tourism Activity, tableChange % Change %
2013 2014 2015 2016 16/15 2016 2017 16/15
Inbound traveler expenditures Million dollars 13,949.0 16,208.4 17,733.7 19,570.8 10.4% 6,875.5 7,604.8 10.6% Outbound traveler expenditures Million dollars 9,122.4 9,605.8 10,098.1 10,226.9 1.3% 3,039.3 3,176.8 4.5%International travelers balance Million dollars 4,826.6 6,602.6 7,635.6 9,343.9 22.4% 3,836.1 4,428.0 15.4%
International visitors Thousand 78,100.2 81,042.1 87,128.6 94,621.0 8.6% 31,761.1 32,488.2 2.3% International tourists Thousand 24,150.5 29,345.6 32,093.3 34,960.8 8.9% 11,444.8 12,468.3 8.9% Long-stay tourists Thousand 14,561.9 15,999.9 18,307.2 20,424.3 11.6% 6,902.1 7,579.5 9.8% Border tourists Thousand 9,588.6 13,345.7 13,786.1 14,536.6 5.4% 4,542.7 4,888.8 7.6% Same-day travelers Thousand 53,949.7 51,696.5 55,035.3 59,660.2 8.4% 20,316.3 20,019.9 -1.5% In border area travelers Thousand 49,394.2 45,911.2 48,920.5 52,965.6 8.3% 17,676.2 16,830.8 -4.8% In cruises travelers Thousand 4,555.4 5,785.2 6,114.8 6,694.6 9.5% 2,640.1 3,189.1 20.8%
International visitors Million dollars 13,949.0 16,208.4 17,733.7 19,570.8 10.4% 6,875.5 7,604.8 10.6% International tourists Million dollars 11,853.8 14,320.0 15,825.7 17,621.9 11.4% 6,199.7 6,897.1 11.2% Long-stay tourists Million dollars 11,311.5 13,579.9 15,035.0 16,852.6 12.1% 5,954.4 6,625.4 11.3% Border tourists Million dollars 542.2 740.1 790.7 769.3 -2.7% 245.3 271.7 10.8% Same-day travelers Million dollars 2,095.2 1,888.4 1,908.0 1,948.9 2.1% 675.8 707.7 4.7% In border area travelers Million dollars 1,737.1 1,469.6 1,508.9 1,548.1 2.6% 516.9 516.6 -0.1% In cruises travelers Million dollars 358.1 418.8 399.2 400.8 0.4% 158.9 191.1 20.3%
International visitors Dollars 178.6 200.0 203.5 206.8 1.6% 216.5 234.1 8.1% International tourists Dollars 490.8 488.0 493.1 504.0 2.2% 541.7 553.2 2.1% Long-stay tourists Dollars 776.8 848.8 821.3 825.1 0.5% 862.7 874.1 1.3% Border tourists Dollars 56.5 55.5 57.4 52.9 -7.7% 54.0 55.6 2.9% Same-day travelers Dollars 38.8 36.5 34.7 32.7 -5.8% 33.3 35.3 6.3% In border area travelers Dollars 35.2 32.0 30.8 29.2 -5.2% 29.2 30.7 5.0% In cruises travelers Dollars 78.6 72.4 65.3 59.9 -8.3% 60.2 59.9 -0.4%
Total Passengers arriving by air Thousands 46,122.1 49,955.8 56,367.6 62,838.2 11.5% 19,570.4 21,894.2 11.9% International flights Thousands 15,703.3 17,125.6 19,279.3 20,971.7 8.8% 7,171.9 7,876.4 9.8% Domestic flights Thousands 30,418.8 32,830.2 37,088.3 41,866.6 12.9% 12,398.5 14,017.8 13.1%
United States of America Thousands 6,630.3 7,348.5 8,604.6 9,643.9 12.1% 3,360 3,726 10.9%Canada Thousands 1,574.3 1,646.2 1,707.8 1,734.6 1.6% 933 1,020 9.3%United Kingdom Thousands 391.8 432.3 477.3 513.8 7.6% 142 142 0.0%Argentina Thousands 233.4 218.4 309.6 375.2 21.2% 138 176 28.2%Colombia Thousands 230.1 292.4 363.2 390.2 7.5% 96 122 27.0%
Passenger in cruices Thousands 4,348.9 5,563.1 5,929.2 6,417.4 8.2% 2,504.5 2,901.0 15.8%Cruise's arrivals Number 1,622.0 2,091.0 2,180.0 2,262.0 3.8% 957.0 1,083.0 13.2%
Percentaje of hotel accupation Percentage 55.6 57.1 59.6 60.3 0.70 61.7 63.0 1.3 Arrival of tourists to hotel rooms Thousands 62,394.0 65,000.0 69,827.3 74,316.0 6.4% 24,304.3 25,698.0 5.7%
Tourism employment Thousands 3,628.2 3,641.0 3,803.4 3,951.9 3.9% 3,845.1 3,987.4 3.7%
Tourism GDP Annual percentages 0.8 2.1 5.0 2.4 2.4 NA NA NA Goods Annual percentages -4.3 -6.2 3.1 4.3 4.3 NA NA NA Services Annual percentages 2.2 3.7 5.4 3.2 3.2 NA NA NAInternal tourism consumption Annual percentages 1.4 0.9 6.1 4.8 4.8 NA NA NADomestic tourism consumption Annual percentages 0.8 -1.8 3.2 1.2 1.2 NA NA NAInbound tourism consumption Annual percentages 6.9 21.8 25.2 24.3 24.3 NA NA NA* A report from the Hotel Occupancy monitored weekly in 70 centers. Changes in percentage points in the case of hotel occupancy. 15/06/2017** Quarterly figures, excluding induced employment.*** For annual percentage change data for the last quarter of the current year compared to the last quarter of the previous year.
NA Not applySources: Bank of Mexico. ASA e INEGI, UPM, SCT, SECTUR.
RESULTS OF TOURISM ACTIVITY
Movements cruise (SCT, Dirección General de Puertos)
Subject Unit of measurement January-April
Number of travelers (Thousand)
Inbound travelers expenditure (Million dollars)
Year (January-December)
Average expenditure (dollars)
Hotel business* (SECTUR)
Number of tourist jobs** (SECTUR based on ENOE)

25
Mexico’s key economic indicators
En�ty2017 2018 2017 2018
International Monetary Fund 1.60 1.96 4.61 3.09 OECD 1.94 1.97 5.34 3.79 Banco de México Survey 1.97 2.18 5.90 3.88 Ministry of the Treasury and Public Credit 1.3 a 2.3 2.0 a 3.0 4.90 3.00 Source: IMF, World Economic Outlook Database (april2017); OECD, Economic Outlook (2016/10); Bank of Mexico, Expectations Survey Economic Specialist PrivateSector (01/06/17); Ministry of Finance and Public Credit, General Criteria for Economic Policy 2018 (April, 2017).
Gross Domes�c Product Infla�onConstant prices (percent change) (% dec/dec)
26
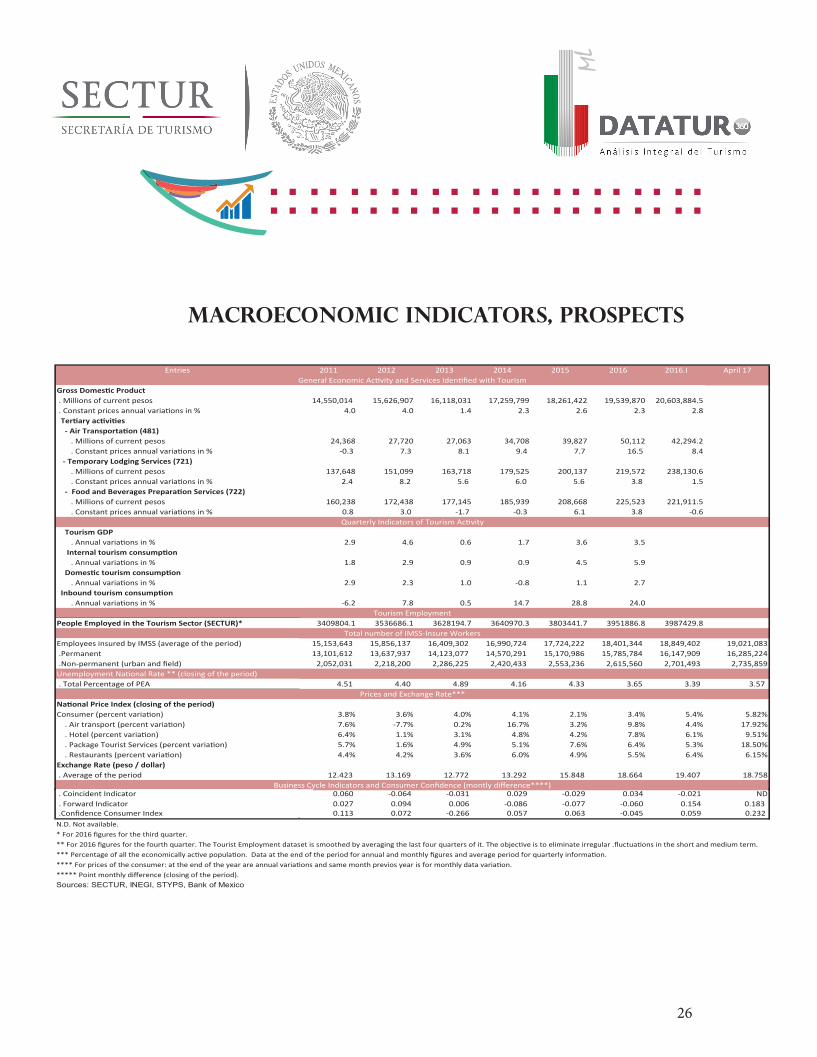
Macroeconomic indicators, prospects
2011 2012 2013 2014 2015 2016 2016.I April 17
. Millions of current pesos 14,550,014 15,626,907 16,118,031 17,259,799 18,261,422 19,539,870 20,603,884.54.0 4.0 1.4 2.3 2.6 2.3 2.8
. Millions of current pesos 24,368 27,720 27,063 34,708 39,827 50,112 42,294.2-0.3 7.3 8.1 9.4 7.7 16.5 8.4
. Millions of current pesos 137,648 151,099 163,718 179,525 200,137 219,572 238,130.62.4 8.2 5.6 6.0 5.6 3.8 1.5
. Millions of current pesos 160,238 172,438 177,145 185,939 208,668 225,523 221,911.50.8 3.0 -1.7 -0.3 6.1 3.8 -0.6
Tourism GDP2.9 4.6 0.6 1.7 3.6 3.5
1.8 2.9 0.9 0.9 4.5 5.9
2.9 2.3 1.0 -0.8 1.1 2.7
-6.2 7.8 0.5 14.7 28.8 24.0
People Employed in the Tourism Sector (SECTUR)* 3409804.1 3536686.1 3628194.7 3640970.3 3803441.7 3951886.8 3987429.8
15,153,643 15,856,137 16,409,302 16,990,724 17,724,222 18,401,344 18,849,402 19,021,08313,101,612 13,637,937 14,123,077 14,570,291 15,170,986 15,785,784 16,147,909 16,285,224
2,052,031 2,218,200 2,286,225 2,420,433 2,553,236 2,615,560 2,701,493 2,735,859
4.51 4.40 4.89 4.16 4.33 3.65 3.39 3.57
3.8% 3.6% 4.0% 4.1% 2.1% 3.4% 5.4% 5.82%7.6% -7.7% 0.2% 16.7% 3.2% 9.8% 4.4% 17.92%6.4% 1.1% 3.1% 4.8% 4.2% 7.8% 6.1% 9.51%5.7% 1.6% 4.9% 5.1% 7.6% 6.4% 5.3% 18.50%4.4% 4.2% 3.6% 6.0% 4.9% 5.5% 6.4% 6.15%
Exchange Rate (peso / dollar)12.423 13.169 12.772 13.292 15.848 18.664 19.407 18.758
Tourism Employment
Total number of IMSS-Insure WorkersEmployees insured by IMSS (average of the period)
Entries
- Temporary Lodging Services (721)
.Permanent
. Total Percentage of PEA
. Average of the period
Prices and Exchange Rate***
0.060 -0.064 -0.031 0.029 -0.029 0.034 -0.021 ND0.027 0.094 0.006 -0.086 -0.077 -0.060 0.154 0.183 0.113 0.072 -0.266 0.057 0.063 -0.045 0.059 0.232
N.D. Not available.
Sources: SECTUR, INEGI, STYPS, Bank of Mexico
. Forward Indicator . Coincident Indicator

27Source: http://www.oecd.org/eco/outlook/mexico-economic-forecast-summary.htm
Economic context
International
Stronger business and consumer confidence, rising industrial production and recovering employment and trade flows will all contribute to an improvement in global GDP growth from 3.0% in 2016 to 3.6% in 2018, according to the Outlook.
Among the major advanced economies, the recovery will continue in the United States, which is projected to grow by 2.1% in 2017 and 2.4% in 2018. The euro area will see steady growth at 1.8% in 2017 and 2018. In Japan, growth is projected at 1.4% in 2017 and 1% in 2018. The 35-country OECD area is projected to grow by 2.1% in both 2017 and 2018, according to the Outlook.
The Outlook suggests that an integrated approach is needed to make globalisation work for all. This must include domestic policies to encourage opportunity, innovation and the creation of new firms, so as to yield economic growth that is both stronger than in the recent past and also more inclusive.
At the same time, more effective targeted policies are needed to support people and regions that risk getting left behind. Last but not least, countries must work together to fill gaps in the governance of the international economy. This will ensure a more level playing field, as well as more robust and implementable international standards across a range of areas including labour markets, the environment, corporate responsibility, governance and taxation.
National
After decelerating in late 2016, the pace of economic activity is projected to pick up somewhat, mainly reflecting stronger exports. Improved business confidence will support the upturn in investment. Consumer spending, the engine of growth in the past two years, will grow at a slower pace, as rising inflation damps consumers’ purchasing power and credit conditions tighten.
At 6.75%, the monetary policy interest rate is at its highest level in eight years, and is projected to remain so to contain the transitory surge in inflationary pressures. Going forward, monetary policy should continue to consider all the determinants of inflation and its expectations, particularly the pass-through to other prices from exchange rate depreciation and gasoline price adjustment, as well as the relative monetary policy stance with the US and the output gap. To slow the rapid rise in public debt, fiscal consolidation is projected to continue.
The Mexican economy has benefitted from open borders, foreign direct investment inflows and integration in global value chains. Remaining barriers to foreign investment and services trade should be lifted to move up in global value chains, increase the diversification of exports and strengthen geographical linkages. However, certain locations and categories of workers have benefitted less from open borders than others. Improving education outcomes and reducing informality would help to spread the benefits of globalisation more widely.