results on three dimensional rendering of phase ii p/s ... · may 3, 2007 results on three...
TRANSCRIPT

May 3, 2007
Results on Three Dimensional Rendering of Phase II P/S Landfill Seismic Refraction Survey
Casmalia Superfund Site, Casmalia, California
Clark Scott, Idaho National Laboratory Attn: Russell Mechem, EPA, Project Manager Mark Wuttig, CH2M HILL Bill Hudson, CH2M HILL Introduction This report presents the three dimensional rendering of seismic refraction results from the Phase II geophysical survey conducted at the Pesticides/Solvents (P/S) Landfill, Casmalia Superfund Site (site). The Casmalia Steering Committee (CSC), under EPA oversight, performed this seismic geophysical survey and data acquisition as part of the remediation activities being performed at the Site. The U.S. Environmental Protection Agency (EPA) requested the Idaho National Laboratory (INL) to: (1) Assist in oversight and planning of the geophysical field surveys conducted by the CSC (2) Conduct an independent geophysical evaluation of the geophysical data acquired by the CSC (3) Help select several target locations for the installation of piezometers for a follow-up investigation to
identify potential Dense Nonaqueous Phase Liquid (DNAPL) within the P/S Landfill. The work for the seismic survey and follow-up piezometers is described in the Remedial Investigation/Feasibility Study (RI/FS) Work Plan prepared by the CSC (June 2004). As described in the RI/FS Work Plan and further discussed in this report, the follow-up piezometer locations are dependent upon the results of the seismic production survey. At EPA’s request, the Idaho National Laboratory (INL) performed independent processing of the geophysical data acquired by the CSC. This was in part due to significant issues that INL identified in CSC reports. Under the original work plan for the geophysical work, the CSC developed tomographic models and reports that interpreted geophysical data acquired during (1) an initial Phase I pilot study conducted in 2004 and (2) the follow-up Phase II production survey conducted in 2005. As further explained in the Background section below, the earlier Phase I pilot study and initial Phase II production survey results presented by the CSC were inadequate to properly image the subtle subsurface waste fill/bedrock interface that was the target for this survey. INL’s independent processing and three dimensional (3-D) rendering results provide EPA with quality assurance information to (1) benchmark the CSC results for their seismic production survey and (2) significantly improve upon the CSC’s results. INL’s 3-D rendering will allow EPA to select optimal target locations for piezometers to help assess potential DNAPL accumulation in the P/S landfill.
Page 1 of 29
This report supersedes a previous INL letter report, dated January 30, 2007. During ongoing quality assurance/quality control (QA/QC) efforts following that initial report, INL discovered serious problems with the ground surface elevation control data supplied by the CSC. The Final Phase II Geophysical Survey Plan (September 15, 2005) specified that the shot point locations and elevations be surveyed to 0.1-foot accuracy by a licensed land survey after seismic data acquisition. However, after comparing elevations where geophysical lines intersected for the Phase II production surveys, it appeared that these original elevations were apparently produced from site topographic maps and lacked the accuracy necessary for this work (i.e., to 0.1-foot accuracy). After EPA communicated this issue to the CSC in February 2007, the CSC performed and completed the licensed land survey of the shot points as stated in the original work plan using a survey grade GPS on March 6, 2007. INL then reprocessed and imaged the seismic refraction data using the new ground surface elevation values for this report. This report briefly covers relevant issues in the processing and inversion of the seismic refraction data and in the imaging process, including kriging parameters and visualization such as the inclusion of physical landfill features. Results from the INL independent processing effort presented in this report include the velocity iso-surface of the target velocity (agreed by both parties as representing the desired waste fill/bedrock geologic contact) as well as corresponding velocity cross sections through relevant features. The contoured velocity surface maps from INL’s independent processing and inversion results clearly demonstrate the presence of several robust low areas, indicated by closed depressions in the target velocity surface. These low areas could serve as traps where DNAPL could potentially accumulate and are located within the historical Canonie contours that showed a similar “low area”. This work provides valuable conclusions regarding the (1) subsurface structure of the bottom of the P/S Landfill and (2) the selection of locations of follow-up piezometers that would be appropriate to assess the potential presence of DNAPL within the landfill. Background The CSC is performing a RI/FS at the Casmalia Superfund Site under oversight by the EPA. One of the key issues under investigation is determining the configuration of the bottom of the P/S Landfill where DNAPL could potentially accumulate. DNAPL has accumulated on top of the less-permeable native claystone underlying fill materials at the toe of the P/S Landfill as measured in the Gallery Well. The Gallery Well is located at the southern perimeter of the P/S Landfill. DNAPL is extracted from the Gallery Well at a rate of several thousand gallons per year by the CSC as part of the Site’s cleanup activities. EPA and INL have hypothesized the existence of one or more potential “low area(s)” that could serve as separate accumulation points for DNAPL north of the Gallery Well. Depending on the configuration of the “contact” between the fill and underlying native claystone in the P/S Landfill, significant accumulations of additional “free phase” DNAPL could be present in potential “low areas” of the contact north of the Gallery Well. If present, these separate DNAPL accumulations may potentially not flow to the Gallery Well for extraction, depending on the configuration of the bottom of the landfill. The RI/FS Work Plan, prepared by the CSC (June 2004), provides a task for the CSC to (1) perform surface geophysical surveys of the P/S Landfill to identify the presence of potential
Page 2 of 29

“low area(s)” and, (2) if present, select locations and installing piezometers using direct push technology (DPT) to assess whether “free phase” DNAPL exists in the potential “low area(s)”. As provided in the RI/FS Work Plan and subsequent, more detailed investigation plans approved by EPA, the CSC performed two phases of geophysical surveys for the P/S Landfill with the following objectives: • Phase I – A pilot test of three geophysical methods (gravity, seismic refraction, and seismic
reflection) performed in 2004 to assess whether any of the three methods were capable of identifying the contact surface between the fill and underlying native claystone. The seismic refraction pilot test consisted of two intersecting east-west/north-south geophysical lines (PS-1, PS-2) and demonstrated that seismic refraction was capable of meeting the objective of identifying a velocity contrast between the lower-velocity fill and higher-velocity underlying native claystone.
• Phase II – A seismic refraction production survey subsequently performed in 2005 to map the
velocity anomaly consistent with the base of fill/top of native claystone contact. This production survey consisted of 14 intersecting east-west/north-south geophysical lines (P2SL-1 – P2SL-14) and provided data capable of mapping the velocity anomaly consistent with this contact.
EPA and INL provided field oversight of the CSC’s Phase I and Phase II surveys. EPA and INL reviewed the following information provided by the CSC for the Phase II survey: 1) Raw Data and Field Notes – Recorded during the Phase II field survey, October 2005 2) Report – Preliminary Tomographic Models, Phase II Seismic Refraction Survey, October 2005
(MACTEC, March 3, 2006).
3) Reprocessed tomographic models (MACTEC, May 31, 2005) based on informal verbal comments on the Phase II Report provided directly from INL to MACTEC.
EPA provided extensive comments in a November 21, 2006 letter to the CSC’s on the Phase II Seismic Refraction Survey report and reprocessed models. EPA’s comments requested additional information and further analysis to fill in data gaps, support assertions, document convergence, address QA/QC issues with respect to positioning of shot points, and selection of first break picks. CSC provided a revised tomographic data package (MACTEC, December 28, 2006) in response to EPA’s comments. In order minimize further delays, EPA does not plan to provide comments on this revised data package. Instead, EPA asked INL to undertake independent data analysis, imaging, and interpretation in order to evaluate the possible presence of DNAPL accumulating “low area(s)” in the P/S Landfill. EPA will then work with INL to select several target sites for installation of piezometers by the CSC. The piezometers will ostensibly provide additional information to assist in the identification of potential DNAPL accumulation traps. The CSC’s initial Phase II Seismic Refraction Survey Report (MACTEC, March 3, 2006) and revised tomographic data package (MACTEC, December 28, 2006) each provided cross sectional tomographic velocity models for each of the 14 Phase II seismic lines. However, map-view contour maps of the velocity anomaly consistent with the base of fill/top of native claystone contact were not provided. It is
Page 3 of 29

these maps that are necessary to address the key issues of (1) assessing the configuration of the bottom of the P/S Landfill to identify the presence of potential “low area(s)” where DNAPL could accumulate, and (2) if present, selecting locations and installing piezometers using DPT to assess whether “free phase” DNAPL exists in the potential “low area(s)”. As described above, the independent processing and three dimensional rendering results, presented in this report, incorporate the additional land survey work performed by the CSC’s contractor, Gannon Associates. Gannon Associates used a survey grade GPS to survey the shot point locations and elevations to 0.1-foot accuracy by a licensed land survey after seismic data acquisition, as specified in the Final Phase II Geophysical Survey Plan. This survey was performed on March 6, 2007 and the data were provided in an April 5, 2007 letter from Gannon Associates. There is still some minor uncertainty associated with the topographic survey since some of the original survey markers from the December 2005 geophysical fieldwork had been removed or misplaced from the time the original geophysical survey was performed in 2005 and the land survey that was conducted on March 6, 2007. Processing/Inversion of Seismic Refraction Data INL’s independent processing and inversion of the CSC’s seismic refraction data consisted of several steps, including: (1) standard pre-processing and seismic data and geometry QA/QC checking, (2) tomographic inversion of time picked data to produce an earth model, and (3) an INL-developed post inversion analysis to define the optimal earth model. INL conducted a QA/QC check of the CSC-supplied data as part of the pre-processing work. The QA/QC check included a verification of the shot and geophone geometry between the data and field notes, and a visual check of the raw data to confirm correct shot positioning based on where the earliest arrivals occurred. INL discovered several discrepancies in the geometry at this point, and INL communicated these discrepancies to the CSC for their reprocessing effort. Processing continued with first-break (initial energy arrival) picking using a standard vendor supplied program, Pickwin95 ®. This step identifies the arrival of the initial energy, from the shot, at each sensor (geophone) for later use in the inversion process. INL then checked these first-break arrivals for noise level and intra-shot consistency using another standard vendor supplied program, called Plotrefa ®. In several cases, INL then re-opened the data in the Pickwin95 program, evaluated the first arrivals, and then re-picked some of the arrivals to improve the quality of the time distance curve. As stated in the CSC’s initial Phase II Seismic Refraction Survey Report (MACTEC, March 3, 2006)), there were several areas with shallow layering and anomalously high velocity. INL’s method of selecting first breaks in these areas as well as varying the gain during the picking process to find the best pick, essentially matched the CSC’s description of their first-break picking effort. Following the pre-processing and first-break time picking, INL loaded the files containing the first break picks (time-distance files) into the Plotrefa ® program and assigned two distinct velocity layers to the time difference curves. Two layers were chosen because (1) most of the time-distance curves indicated a two-layer or three-layer system was appropriate, and (2) earlier studies performed on the pilot study data indicated little difference in the final tomographic model produced by two and thee layer initial models as long as sufficient iterations were performed. These two layers corresponded to the lower-velocity waste fill within the P/S Landfill and the higher-velocity native claystone underlying the landfill. The layer picks and time distance curves were then used in a simpler time-term inversion scheme to create a two-layer earth model corresponding to the two distinct velocity trends. This two-layer model was used
Page 4 of 29

as the input in the creation of the initial tomographic model. Essentially, this involved superimposing the tomographic grid over the two-layer model and assigning initial velocities to the cells of the tomographic grid based on where the cells occur within the two distinct model velocities. Finally, the tomographic inversion parameters were selected and the inversion performed. The post-inversion analysis consisted of creating an animation, or “movie” of the inversion iterations (1-50) and a visual analysis of the movie to determine when convergence was achieved. For INL’s analysis, convergence was defined both by the behavior of the root mean square (RMS) convergence curve (e.g. when did it flatten out) as well as observing changes in the developing model. The point of convergence was selected where the RMS was low, changing little and decreasing (i.e. no diverging solution), and where the developing earth model stabilized (velocity profiles and layers stopped changing). This was generally between iteration 35 and 50 depending on the line. Examples of the inversion parameters and a screen shot of the post analysis are shown in Figures 1 and 2. Map-View Imaging of Velocity Anomaly Following the processing and inversion of the seismic refraction data to develop the best fit earth model for each individual line, the chosen inversion iteration from each line was grouped and input files created for imaging in the Environmental Visualization System (EVS) ® program. EVS is a standard visualization program that is commonly used in developing visual renderings of geologic data. This imaging effort is aimed at producing 3-D surfaces of velocity layers from the grid of 2-D profiles. The process required several files: (1) a geology file consisting of the tomographic grid (layer geometry) for all lines, (2) a velocity file consisting of the velocity matrix formed from all lines, and (3) a variety of ASCII and AutoCAD DXF files to plot line and geophone positions as well as physical features over the results. The geology and velocity files were created by an in-house MatLab code written at INL and the survey position file created in an Excel spreadsheet from positioning data supplied by the CSC. In the EVS flow, the geology and velocity data were kriged and the output saved as an EVS field. Kriging is a statistical regression technique used to interpolate data, in this case seismic velocity results from the processing/inversion process. The technique takes into account spatial dependence (weighting) between data points. The resulting EVS field was then read into the imaging flow, plotted and the figure saved to a BMP image file. To help indicate relative position of features in the iso-surfaces, the Gallery Well, piezometer PZ-LA-01, P/S Landfill bench roads and bounding features as well as several Canonie contours were draped on the velocity surface. The resulting images are plotted top down in perspective and the seismic lines placed as close to the surface as possible to limit parallax issues. The EVS flow and kriging parameters are shown in Figures 3 and 4.
Page 5 of 29

Results The results in this report are derived from the imaging of the majority of lines from the Phase II refraction survey (P2SL-1 – P2SL-14) as well the two lines from the initial pilot study (PS-1 and PS-2). Though the pilot study lines had slightly different geophone spacing, the subsurface interpretation results matched well when the shot point positioning results from the licensed land survey were delivered with shot point locations and elevations surveyed to 0.1-foot accuracy after seismic data acquisition. INL performed the following QA/QC procedures to help assure that discrepant data do not adversely affect the quality of the geophysical interpretation:
• Phase II line 6 and line 8 were not included due to large tie point mismatches in the subsurface velocity iso-surfaces with the other lines. The reason for this difference in lines 6 and 8 is not clear but a cursory investigation showed that a difference is present in the raw data for these lines. Therefore, the mismatch is not an issue in the processing or inversion but a basic difference in the original response.
• A sensitivity study was performed to explore the robustness of a “low area” identified
immediately north of former piezometer LA-01 by including, and then not including, the results from line 14. This is an east-west line over the “high-point” immediately to the south of the “low area” north of the bench road. As further described below, this sensitivity study indicated the low area was not solely due to line 14.
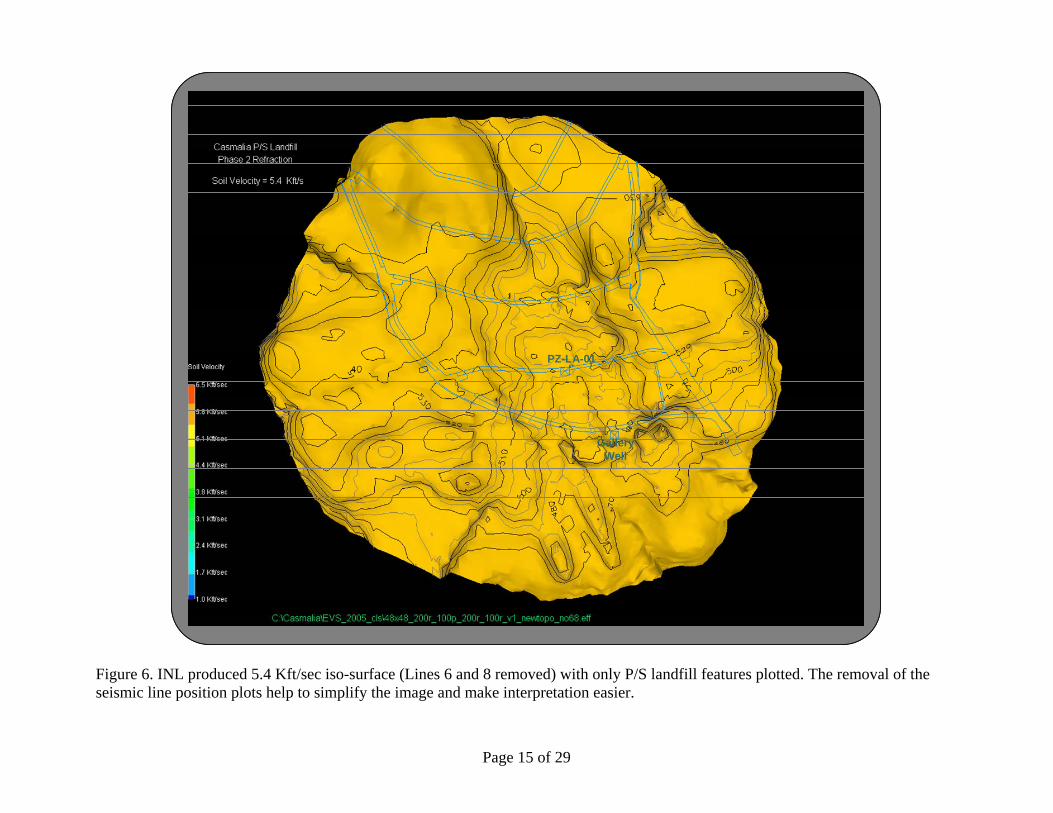
The results from INL’s independent processing, inversion, and imaging work indicate that the velocity range from 5.2 Kft/sec to 5.6 Kft/sec likely represents the transition between the weathered and waste bearing layers to the unweathered claystone (bedrock). This is the same velocity range picked by the CSC (5.4 Kft/sec). Therefore, the iso-surfaces for 5.4 Kft/sec are presented in this report as described below, along with cross sections that show the 5.2, 5.4 and 5.6 Kft/sec contours. Figures 5 through 7 show the 5.4 Kft/sec iso-surface results of the INL processing effort with the removal of lines 6 and 8. The iso-surfaces reveal a relatively smooth surface that along with the tie points indicate a good agreement between results for the separate lines. Figure 5 shows the iso-surface with the seismic lines used in the rendering and some landfill features plotted to aid spatial reference. Figure 6 shows the results with landfill features and Figure 7 with landfill features and select historical Canonie contours. Note that the rendering program closed the Canonie 500 and 510 contour at the bottom edge (southern end). In reality, the 500 and 510-foot Canonie contours are open at the southern ends. The surface shows a closed depression in the bottom of the landfill, just north of Bench Road 1, which is consistent and robust for different imaging parameters (e.g. kriging reach and max point number). Figures 8 through 10 show the iso-surface results of the INL processing effort with the removal of line 14, in addition to lines 6 and 8. This is presented to show the topographic rise that produced the closed surface to the north of Bench Road 1 is not completely an artifact of line 14. These figures correspond to Figures 5 through 7 with respect to plotted physical features. As with the earlier figures, Figures 8-10
Page 6 of 29

reveal the presence of a closed depression immediately to the north of Bench Road 1 and a topographic rise under or just south of Bench Road 1. Figure 11 shows the surface with the positions of the following four cross sections indicated:
• GWEW – roughly east-west cross sections through the Gallery Well at the toe of the landfill • LAE – roughly east-west cross section through the piezometer PZ-LA-01 on Bench 1 • LOWE – roughly east-west cross section through low area to north of Bench 1 • LOWN – roughly north-south cross section through the low area to the north of Bench Road 1.
Figures 12-15 show these cross sections for the results with lines 6 and 8 removed. These cross sections show the following, together with the 5.4 Kft/sec iso-surface shown in Figures 5 through 7: 1. Broad Low Area Between Gallery Well Road and Bench 1 Road. A broad low, trough-like
feature occurs between Gallery Well Road and Bench Road 1, but significantly to the left of the actual Gallery Well itself. The cross section through the Gallery Well (Figure 12, GWEW) indicates, along with the iso-surface plots, that the low through this section may not occur under the Gallery Well but in an area to the west (left in this E-W cross section).
2. Low Area to North of Bench 1 Road. A distinct low area occurs immediately to the north of
Bench 1 Road. The cross section through former piezometer PZ-LA-01 (Figure 13, LAE) indicates, along with the iso-surface plots, that this particular piezometer may be placed on an east-west local high point. Figure 14 (LOWN) and 15 (LOWE) are cross sections through the center of the low indicated by the seismic results and show the nature of the low immediately north of Bench 1.
3. Low Area to North of Bench 2 Road. A distinct low area occurs north of Bench 2 Road.
However, this low area is north of the area of intersecting geophysical lines so the feature is less robust.
Figures 16-19 shows the cross sections for the results where line 14 has been removed, in addition to lines 6 and 8. The interpretation from these cross sections is similar to that of Figures 12-15. The main difference is that the east-west section through piezometer PZ-LA-01 (Figure 17, LAE) shows the piezometer in the lowest point of the cross section. However, the north-south section through the low area (Figure 18), which also passes through the piezometer location, continues to show the piezometer position on a high with the low area immediately to the north. Conclusions The results of the INL’s processing and imaging effort indicate the existence of topographic “low areas” in the velocity zone consistent with the base of fill/top of native claystone contact that roughly correlates with the contours indicated by the historical Canonie topographic map. The interpretation of the potential low areas is robust in the sense that: (1) the lows are present in the individual seismic profile results, (2) are not artifacts of the imaging as they occur for a variety of imaging parameters, and (3) are in an area where independent information indicates they may occur. Given the robustness of these results, they provide clear and defensible scientific information for use in planning and sighting investigatory piezometers.
Page 7 of 29

Recommendations INL’s recommendations for the installation of additional piezometers in the P/S Landfill are provided below, in accordance with the RI/FS Work Plan. The RI/FS Work Plan (page 4-40) provides for the following piezometers to identify potential low area(s) in the P/S Landfill where DNAPL could potentially accumulate, which is known to be present at the Gallery Well: • If the proposed geophysical surveys identify the location of a low area in the toe of the P/S Landfill,
the CSC will push a DNAPL evaluation piezometer at the appropriate location after discussing that location with USEPA. The location will attempt to maximize the probability that the piezometer is at the deepest point of the low area given the practical constraints of installing a well at that location.
• The CSC notes that USEPA, and the other agencies, have expressed concerns about the number of
piezometers the CSC has proposed to find a low area in the P/S Landfill. USEPA has commented that the Work Plan should plan for an “appropriate number” of piezometers which may be more than the one proposed (particularly if the geophysical work does not provide useful data). The CSC is proposing to complete the geophysical investigations proposed in the RI/FS Work Plan, evaluate those results, and then continue discussions with USEPA regarding the number of piezometers that should be installed at that time.
The installation and development procedures for piezometers located within landfill footprints are described in SOP 3-1 of the RI/FS Work Plan. According to this SOP, these piezometers will be installed using a cone penetrometer test (CPT) rig to reduce potential exposures to high concentrations of chemical contaminants during advancement of the borehole and casing. SOP 3-1 calls for two pushes at each location. The first push is performed with an instrumented CPT probe to collect subsurface data to design the well. The second push is to install the actual piezometer. As noted above in the Results and Conclusions sections, the 5.4 Kft/sec velocity iso-surface and related cross sections, prepared from INL’s independent processing/inversion effort, provide strong indications that several low areas exist within the area defined by the Canonie contours. Based on these results, the following recommendations are made in accordance with the provisions of the RI/FS Work Plan. The recommended piezometers are shown in Figure 20. Ideally, piezometers would be located over the center of the deepest point of a low area. However, the locations recommended below are limited to current landfill access roads to account for practical constraints.
Page 8 of 29

Page 9 of 29
1. Broad Low Area Between Gallery Well Road and Bench 1 Road. As described above, a broad
low, trough-like feature occurs between Gallery Well Road and Bench Road 1, but significantly to the left of the actual Gallery Well itself. Several thousand gallons per year of DNAPL are currently extracted from the Gallery Well, and additional DNAPL may occur to the west, in the trough-like feature, that is not being extracted by the Gallery Well. INL recommends the following work to the west of the Gallery Well to better define and locate the lowest area in the drainage of the P/S Landfill
A. Although not provided for in the RI/FS Work Plan (June 2004), a series of CPT pushes is
recommended along Gallery Well Road to assess the presence and nature of the low area of the trough (i.e., subsurface “physical characteristics”) in order to optimally locate a piezometer in the center of this trough
B. As provide in the RI/FS Work Plan (June 2004), install a piezometer in the center of the trough
in accordance with procedures in SOP 3-1 of the RI/FS Work Plan (June 2004). A tentative location along Gallery Well road to the West of the Gallery Well is shown in Figure 20.
2. Low Area to North of Bench 1 Road. As described above, a distinct low area occurs immediately
to the north of Bench 1 Road. INL recommends the same work as Item 1 above, which would include a series of CPT pushes to assess the lowest area along Bench 1 Road and then to install a piezometer based on the results of the CPT pushes. A tentative location along Bench 1 Road is shown next to former piezometer PZ-LA-01 in Figure 20. INL acknowledges that several CPT pushes were performed as part of the former “Low Area Investigation.” However, some of these CPT pushes had uncertainty whether they encountered the actual contact between waste fill and native claystone.
3. Low Area to North of Bench 2 Road. As described above, distinct low area occurs north of Bench
2 Road. However, this low area is north of the area of intersecting geophysical lines so the feature is less robust. Although the feature is less robust, it is prominent enough to warrant the same work as Items 1 and 2 above, which would include a series of CPT pushes to assess the lowest area along Bench 2 Road and then to install a piezometer based on the results of the CPT pushes. A tentative location is shown in Figure 20 on Bench 2 Road centered where a line through the existing Gallery Well and PZ-LA-01 intersects Bench 2 Road.
Sincerely,
Clark L Scott Geophysicist Idaho National Laboratory

Initial Model Line 1a
Iteration # 50 Line 1a
Initial Model Parameters
Inversion Parameters
Initial Model Line 1a
Iteration # 50 Line 1a
Initial Model Parameters
Inversion Parameters
Figure 1. Examples of initial and final tomographic earth models and the inversion parameters used to produce these models. This set is from Seismic Line 1a. While the inversion parameter screen (lower left) was the same for every line, the initial model elevation parameters (upper left) were specific to each line.
Page 10 of 29

Figure 2. Screen shot of Post-inversion animation (of the initial inversion effort) used to assess quality of inversion process and pick convergent iteration. This is from the animation of Seismic Line 1a and shows the convergence iteration (#40) picked for that line. A detail description of this process will be included in a final report.
Page 11 of 29

Figure 3. Screen shot of EVS flow used to produce surfaces and cross sections. The main flow group starts in the center top and flows down to the X section and iso-layer plot members. To the upper left is the kriging flow that produces the EVS field used in potting. The group in the upper right an animation flow not used for this report.
Page 12 of 29

Geology (layer) Kriging
Velocity Kriging
Geology (layer) Kriging
Velocity Kriging
Figure 4. Screen shots of the kriging parameters used to blend the data and produce the images in this report. The values shown such as Reach (radial distance to include) and Points (maximum number of points to include) were found, through trial and error, to be the optimum kriging parameters for adequately smoothing the data while remaining faithful to the features in the original 2-D results.
Page 13 of 29

PZ-LA-01
GalleryWell
PZ-LA-01
GalleryWell
Figure 5. INL produced 5.4 Kft/sec iso-surface with Phase I and Phase II seismic line positions and P/S landfill features plotted (Lines 6 and 8 removed). The closed contours centrally located under the seismic grid indicate closed depressions in this contact. This is the velocity chosen by the CSC and indicated by INL processing as representing the transition boundary from the overlying layers into the un-weathered clay stone (bedrock).
Page 14 of 29
PZ-LA-01
GalleryWell
PZ-LA-01
GalleryWell
Figure 6. INL produced 5.4 Kft/sec iso-surface (Lines 6 and 8 removed) with only P/S landfill features plotted. The removal of the seismic line position plots help to simplify the image and make interpretation easier.
Page 15 of 29

PZ-LA-01
GalleryWell
490
500
510
PZ-LA-01
GalleryWell
PZ-LA-01
GalleryWell
490
500
510
Figure 7. INL produced 5.4 Kft/sec iso-surface (Lines 6 and 8 removed) with P/S landfill features and Canonie contours plotted. This shows the correlation between the lows found by seismic refraction and Canonie original Canonie contours. Note that the rendering program closed the Canonie 500 and 510 contour at the bottom edge (southern end). In reality, the 500 and 510-foot Canonie contours are open and the southern ends.
Page 16 of 29

PZ-LA-01
GalleryWell
PZ-LA-01
GalleryWell
Figure 8. INL produced 5.4 Kft/sec iso-surface with Phase I and Phase II seismic line positions and P/S landfill features plotted (Line 6, Line 8 and Line 14 removed). In comparison with Figure 5, this rendering shows the low area and southern saddle are not completely dependent on the line 14 results and the interpretation is essentially the same.
Page 17 of 29

PZ-LA-01
GalleryWell
PZ-LA-01
GalleryWell
Figure 9. INL produced 5.4 Kft/sec iso-surface (Line 6, Line 8 and Line 14 removed) with only P/S landfill features plotted. The removal of the line positions help to simplify the image and make interpretation easier. The effect of removing Line 14 can be seen by comparing with Figure 6.
Page 18 of 29

PZ-LA-01
GalleryWell
490
500
510
PZ-LA-01
GalleryWell
PZ-LA-01
GalleryWell
490
500
510
Figure 10. INL produced 5.4 Kft/sec iso-surface (Line 6, Line 8 and Line 14 removed) with P/S landfill features and Canonie contours plotted. For Comparison with Figure 7. Note that the rendering program closed the Canonie 500 and 510 contour at the bottom edge (southern end). In reality the 500 and 510-foot Canonie contours are open and the southern ends.
Page 19 of 29

GWEW
LAE
LOWN
LOWEPZ-LA-01
GalleryWell
GWEW
LAE
LOWN
LOWE
LAE
LOWN
LOWEPZ-LA-01
GalleryWell
GWEW
Figure 11. INL produced 5.4 Kft/sec iso-surface (Lines 6 and 8 removed) with P/S landfill features plotted and position of cross sections indicated. The following figures (cross sections) were created along these profiles.
Page 20 of 29

newtopo_section_GWEW_Mark_no68.bmp
127 13PS2
10 9GW
LA1
newtopo_section_GWEW_Mark_no68.bmp
127 13PS2
10 9GW
LA1
Figure 12. East-West cross section through Gallery Well area (Lines 6 and 8 removed). This result indicates the current position of the Gallery Well is to the east (right) of the actual drainage low.
Page 21 of 29

newtopo_section_LAE_no68.bmp
127 13PS210 9
GWLA1
newtopo_section_LAE_no68.bmp
127 13PS210 9
GWLA1
newtopo_section_LAE_no68.bmp
127 13PS210 9
GWLA1
newtopo_section_LAE_no68.bmp
127 13PS210 9
GWLA1
Figure 13. East-West cross section through PZ-LA-01 area (Lines 6 and 8 removed). This result indicates the current position of the piezometer may be on a local high point.
Page 22 of 29

newtopo_section_lown_no68.bmp
511
3 14 PS1 12
4
GWLA1
newtopo_section_lown_no68.bmp
511
3 14 PS1 12
4
GWLA1
newtopo_section_lown_no68.bmp
511
3 14 PS1 12
4
GWLA1
newtopo_section_lown_no68.bmp
511
3 14 PS1 12
4
GWLA1
Figure 14. North-South cross section through the low area indicated by the 5.4 Kft/s iso-surface (Figures 5-7, Lines 6 and 8 removed). This result also indicates the current position of the piezometer may be on a local high point.
Page 23 of 29

newtopo_section_lowe_no68.bmp
127 13PS210 9
GWLA1
newtopo_section_lowe_no68.bmp
127 13PS210 9
GWLA1
newtopo_section_lowe_no68.bmp
127 13PS210 9
GWLA1
newtopo_section_lowe_no68.bmp
127 13PS210 9
GWLA1
Figure 15. East-West cross section through the low area indicated by the 5.4 Kft/s iso-surface (Figures 5-7, Lines 6 and 8 removed). This result also indicates the current position of the piezometer may be on a local high point.
Page 24 of 29

newtopo_section_GWEW_Mark_no6814.bmp
127 13PS210 9GW
LA1
newtopo_section_GWEW_Mark_no6814.bmp
127 13PS210 9GW
LA1
Figure 16. East-West cross section through Gallery Well area (Line 6, Line 8 and Line 14 removed). As with the result in Figure 12, this result indicates the current position of the Gallery Well is to the east (right) of the actual drainage low.
Page 25 of 29

newtopo_section_LAE_no6814.bmp
127 13PS210 9GW
LA1
newtopo_section_LAE_no6814.bmp
127 13PS210 9GW
LA1
newtopo_section_LAE_no6814.bmp
127 13PS210 9GW
LA1
newtopo_section_LAE_no6814.bmp
127 13PS210 9GW
LA1
Figure 17. East-West cross section through PZ-LA-01 area (Line 6, Line 8 and Line 14 removed). This result contradicts that from Figure 13 and indicates the current position of the piezometer is not on a local high.
Page 26 of 29

newtopo_section_lown_no6814.bmp
511
3 PS11
2
4
GWLA1
newtopo_section_lown_no6814.bmp
511
3 PS11
2
4
GWLA1
newtopo_section_lown_no6814.bmp
511
3 PS11
2
4
GWLA1
newtopo_section_lown_no6814.bmp
511
3 PS11
2
4
GWLA1
Figure 18. North-South cross section through the low area indicated by the 5.4 Kft/s iso-surface (Line 6, Line 8 and Line 14 removed). As with Figure 14, this result indicates that in this orientation the current position of the piezometer may be on a local high point.
Page 27 of 29

newtopo_section_lowe_no6814.bmp
127 13PS210 9
GWLA1
newtopo_section_lowe_no6814.bmp
127 13PS210 9
GWLA1
newtopo_section_lowe_no6814.bmp
127 13PS210 9
GWLA1
newtopo_section_lowe_no6814.bmp
127 13PS210 9
GWLA1
Figure 19. East-West cross section through the low area indicated by the 5.4 Kft/s iso-surface (Line 6, Line 8 and Line 14 removed).
Page 28 of 29

PZ-X
X
Gallery Well Road
Bench 1 Road
Bench 4 RoadBench 3 Ro
Bench 2 RoadX
LA-01
GalleryWell
x
x
ad
Recommended Piezometer Locations (X)
490
500
510
P LA-01
GalleryWell
Z-P LA-01
GalleryWell
x
x
ad
Z-X
X
Gallery Well Road
Bench 1 Road
Bench 4 RoadBench 3 Ro
Bench 2 RoadX
Recommended Piezometer Locations (X)
490
500
510
Figure 20. Recommended piezometer locations placed on the INL produced 5.4 Kft/sec iso-surface (Lines 6 and 8 removed). These locations are described in the recommendation section of this report. Note that the rendering program closed the Canonie 500 and 510 contour at the bottom edge (southern end). In reality, the 500 and 510-foot Canonie contours are open and the southern ends.
Page 29 of 29