results presentation - merafe · pdf fileresults presentation. ... trade and other receivables...
TRANSCRIPT

Results PresentationFor the six months ended 30 June 2015
Presented by Zanele Matlala (CEO) and Kajal Bissessor (FD)

Merafe Resources Ltd | Results presentation for the six months ended 30 June 2015
Legal notice/disclaimer
This presentation is published solely for informational purposes and does not constitute investment, legal, tax or other advice nor is it to be relied upon in making an investment decision. Information contained herein has been taken from sources considered by MerafeResources to be reliable but no warranty is given that such information is accurate or complete and it should not be relied upon as such. Views and opinions expressed in this presentation reflect the judgment of Merafe Resources as of the date of this presentation and are subject to change. Merafe Resources will not be responsible for any liability for loss or damage of any kind which arises, directly or indirectly, and is caused by the use of any of the information provided. The entire presentation is subject to copyright with all rights reserved. The information contained herein shall not be published, rewritten for broadcast or publication or redistributed in any medium without prior written consent from Merafe Resources. Prospective investors should take appropriate investment advice and inform themselves as to applicable legal requirements, exchange control regulations and tax considerations in the countries of their citizenship, residence or domicile. The distribution of the information contained in this presentation in certain countries may be restricted by law and persons who access it are required to inform themselves and to comply with any such restrictions. This information does not constitute an offer or solicitation in any jurisdiction in which such an offer or solicitation is not authorised or to any person to whom it is unlawful to make such an offer or solicitation. Past performance is not a guarantee of future performance. The price of shares can go down as well as up and may be affected by change in exchange rates, market conditions and risks associated with a mining venture.
2

Merafe Resources Ltd | Results presentation for the six months ended 30 June 2015
Key agenda
01. Key features
02. Operational review
03. Market review
04. Financial review
05. Outlook
Annexures
3

Key features
4
01

Merafe Resources Ltd | Results presentation for the six months ended 30 June 2015
Key features
5
Power and ore consumption efficiencies*OPERATIONAL• TRIFR of 4.40• Ferrochrome production of 195kt• Above inflation increases in cost of
goods sold per tonne of ferrochrome
MARKET• 2.0% decrease in global stainless steel
production• 0.8% decrease in global ferrochrome demand • 2.4% decrease in global ferrochrome
production• 2.3% reduction in chrome ore imports into
China
PROJECTS• Project Lion II ramped up to full capacity
FINANCIAL• Revenue up by 12%• HEPS down by 44%• Cash from operating activities of R251m• Interim cash dividend declared of R25m

Operational review
6
02

Merafe Resources Ltd | Results presentation for the six months ended 30 June 2015
Operational review
7
– Increase of 16% in ferrochrome production• Project Lion II• No strikes in H1 2015
– TRIFR of 4.40
– Wage negotiations • Western mines – agreement reached in 2014• Rest of operations – not concluded yet

Merafe Resources Ltd | Results presentation for the six months ended 30 June 2015
Operational review (continued)
8
– Community unrest at Eastern Mines (post balance sheet)• Impact negligible
– Electricity• Supply• Pricing
– Above inflation increases in cost of goods sold per tonne of ferrochrome

Market review
9
03

Merafe Resources Ltd | Results presentation for the six months ended 30 June 2015
Global market review (H1 2015 / H1 2014)
10
GLOBAL STAINLESS STEEL PRODUCTION
2.0% decrease to 21.0mt
10% NAFTA
11% Japan
0.8% China
2.6% India
6.3% EU
GLOBAL FERROCHROME DEMAND
0.8% decrease to 5.8mt
2.1% NAFTA
4.2% EU
2.5% China
39.2% India
12.4% Japan
GLOBAL FERROCHROME PRODUCTION
2.4% decrease to 5.6mt
0.5% South Africa
2.0% EU
12.4% China
12.1% Kazakhstan
11.6% India
Source: Heinz Pariser / July 2015

Merafe Resources Ltd | Results presentation for the six months ended 30 June 2015
Ferrochrome market review
11
2014 Usc/lb 2015 Usc/lb Change
Q1 118 108 (8%)
Q2 122 108 (11%)
Q3 119 108 (9%)
Average 119.7 108.0 (10%)Concerns about
Chinese growth –net prices down
European benchmark ferrochrome prices
2014 H1 2015 H1 Change
10.7 11.9 +11%
Average Rand/Dollar exchange rate

Merafe Resources Ltd | Results presentation for the six months ended 30 June 2015
Chrome ore imports into China
12
2013 2014 Change 2014 (1-6) 2015 (1-6) Change
in ‘000 t in % in ‘000 t in %
South Africa 6,736 5,748 -14.7 3,068 3,540 15.4
Turkey 1,988 1,280 -35.6 733 432 -41.1
Oman 687 489 -28.8 264 231 -12.7
Iran 428 494 15.6 276 238 -13.6
Albania 677 555 -18.1 286 203 -29.0
Pakistan 482 339 -29.7 167 163 -2.6
Madagascar 118 113 -4.0 44 85 94.6
Philippines 126 67 -47.3 37 23 -37.1
Sudan 17 40 133.3 9 25 187.3
India 168 63 -62.8 51 n.a.
Australia 407 44 -89.3 44 n.a.
Brazil 12 n.a. n.a.
Kazakhstan 167 77 -54.2 35 n.a.
Others 90 63 -30.6 48 3 -93.0
TOTAL 12,094 9,384 -22.4 5,062 4,943 -2.3
Source: Heinz Pariser, Alloy Metals & Steel Market Research
Financial review
13
04

Merafe Resources Ltd | Results presentation for the six months ended 30 June 2015
Key financial features
14
12% 22% 44%
REVENUE EBITDA HEPS
206
263
210
431
336
2011 H1 2012 H1 2013 H1 2014 H1 2015 H1
EBITDA in R'm

Merafe Resources Ltd | Results presentation for the six months ended 30 June 2015
Revenue up by 12%
15
12% 10% 11% 11% 21%
Ferrochromesales tonnes
Average European
benchmark ferrochrome
price
AverageRand/US$
exchange rate
Ferrochromerevenue
Chrome ore revenue
2015 H1: 191kt2014 H1: 171kt
2015 H1: 108USc/lb2014 H1: 120USc/lb
2015 H1: 11.92014 H1: 10.7
2015 H1: R1 976m2014 H1: R1 787m
2015 H1: R247m2014 H1: R204m
1 319 1 230 1 469
1 991 2 223
-
500
1 000
1 500
2 000
2 500
2011 H1 2012 H1 2013 H1 2014 H1 2015 H1
Revenue in R'm

Merafe Resources Ltd | Results presentation for the six months ended 30 June 2015
Cost of goods sold increases above inflation (per tonne of ferrochrome)
16
Lion II start up costs
Electricity increases
Labour increases

Merafe Resources Ltd | Results presentation for the six months ended 30 June 2015
EBITDA reconciliation to profit
17
355
124
(37)
(16)
(19)
(121)
(38)
0
50
100
150
200
250
300
350
400
Merafe's 20.5% ofEBITDA from the
Venture
Corporate costs Depreciation Net financing costs Current tax expense Deferred tax expense Profit
R’m

Merafe Resources Ltd | Results presentation for the six months ended 30 June 2015
2015 H1 / 2014 H1 variance
18
Variance %
Ferrochrome sales volumes 12
Chrome ore sales volumes 13
Net ferrochrome price (11)
Chrome ore prices (3)
Exchange rate 11
Revenue 12
Ferrochrome 11
Chrome ore 21
EBITDA (22)
Merafe head-office costs 48
Depreciation and impairment (42)
Net financing costs (39)
HEPS (44)
Lion II depreciation
Lion II borrowing costs ceased
capitalisation in 2014
2014 included restructuring costs / reduced headcount post restructuring
Increase in sales volumes and
weakening of the Rand was partially offset by lower net
prices

Merafe Resources Ltd | Results presentation for the six months ended 30 June 2015
Balance sheet
19
As at 30 June 2015
As at31 December 2014
Reviewed R’000 Audited R’000
Total non-current assets 3 248 125 3 252 680
Property, plant and equipment 3 232 708 3 239 162
Deferred tax assets 15 417 13 518
Total current assets 2 110 745 2 148 467
Inventories 1 352 618 1 435 799
Trade and other receivables 655 863 652 642
Current tax asset - 15 485
Cash and cash equivalents 102 264 44 541
Total assets 5 358 870 5 401 147

Merafe Resources Ltd | Results presentation for the six months ended 30 June 2015
Balance sheet (continued)
20
As at30 June 2015
As at31 December 2014
Reviewed R’000 Audited R’000
Total non-current liabilities 1 369 900 1 366 153
Loans and borrowings 521 958 549 909
Provision for close down and restoration costs 137 716 129 029
Share based payment liability 5 441 -
Deferred tax 704 785 687 215
Total current liabilities 777 813 911 492
Loans and borrowings 100 788 80 778
Trade and other payables 471 010 615 773
Provision for close down and restoration costs 8 407 7 932
Share based payment liability 11 600 -
Current tax liability 13 891 -
Bank overdraft 172 117 207 009
Total liabilities 2 147 713 2 277 645
Merafe Resources Ltd | Results presentation for the six months ended 30 June 2015
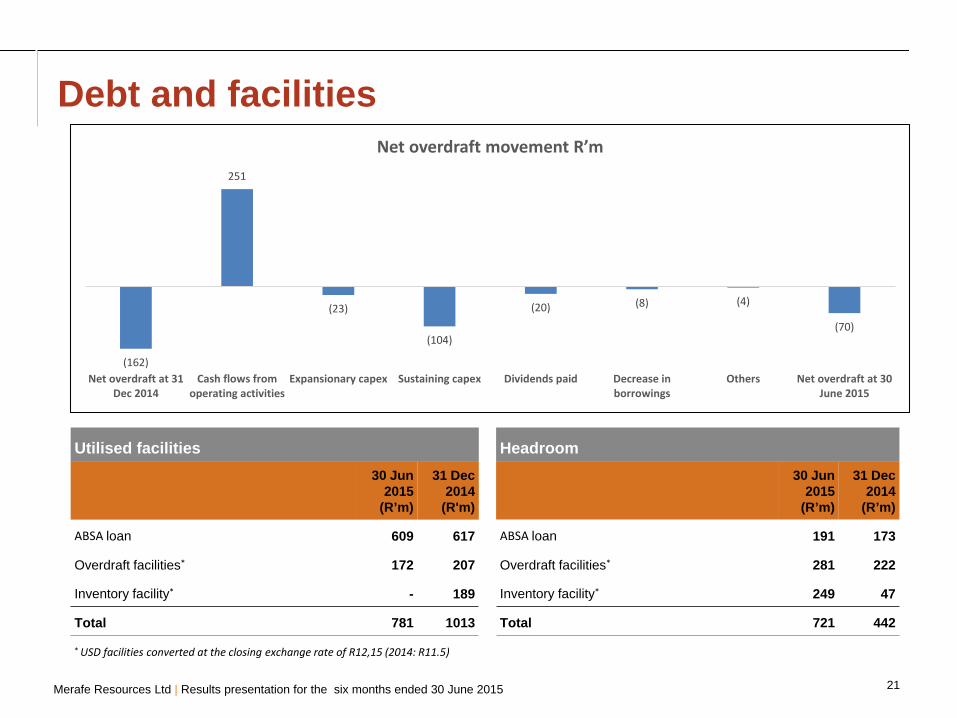
Debt and facilities
21
Utilised facilities30 Jun
2015 (R’m)
31 Dec2014
(R'm)
ABSA loan 609 617
Overdraft facilities* 172 207
Inventory facility* - 189
Total 781 1013
* USD facilities converted at the closing exchange rate of R12,15 (2014: R11.5)
Headroom30 Jun
2015 (R’m)
31 Dec2014
(R’m)
ABSA loan 191 173
Overdraft facilities* 281 222
Inventory facility* 249 47
Total 721 442
(162)
251
(23)
(104)
(20) (8) (4)
(70)
Net overdraft at 31Dec 2014
Cash flows fromoperating activities
Expansionary capex Sustaining capex Dividends paid Decrease inborrowings
Others Net overdraft at 30June 2015
Net overdraft movement R’m

Outlook
22
05

Merafe Resources Ltd | Results presentation for the six months ended 30 June 2015
Conclusion
23
• Remain profitable despite challenging times
• Continue to reap benefits of capital investments made
• No significant expansionary capex going forward
o Reduce debt and increase dividends in short to medium term

Merafe Resources Ltd | Results presentation for the six months ended 30 June 2015
Questions
24

Annexures
25

Merafe Resources Ltd | Results presentation for the six months ended 30 June 2015
Ferrochrome prices
26
0.50
0.60
0.70
0.80
0.90
1.00
1.10
1.20
1.30
1.40
1.50
0.50
0.60
0.70
0.80
0.90
1.00
1.10
1.20
1.30
1.40
1.50
2011 2012 2013 2014 2015
Charge C
r Price (quarterly) in US$ / lbHC S
pot P
rices
& C
hina
Tend
er P
rice
(mon
thly
) in
US $
/ Ib
Charge CrBenchmark (EU)
China Tender50% Cr (excl. 17% VAT)
Europe6-8%C, 60%Cr
Source: China Ferroalloy Industry Association, Metal Bulletin, Heinz H. Pariser
USA6-8%C, 60-65% Cr
China Spot50%Cr (excl. 17% VAT)
© Heinz H. Pariser

Merafe Resources Ltd | Results presentation for the six months ended 30 June 2015
Ferrochrome Producer Ranking 2015
27
0
200
400
600
800
1,000
1,200
1,400
1,600
1,800G
lenc
ore
/ M
eraf
eSa
man
cor C
rKa
zchr
ome
Out
okum
puHe
rnic
angl
ian
EHUI
Met
allu
rgy
Min
tal G
roup
ASA
Met
als
Tiany
i Met
allu
rgy
IMFA
IFM
LFe
rbas
aZi
mas
coHe
ngsh
an H
oldi
ngTa
ta St
eel K
ZNJi
ndal
Stai
nles
sFa
cor G
roup
Rohi
t Fer
ro-T
ech
ETIK
ROM
Sero
vBa
laso
re A
lloys
Varg
oen
Tata
Stee
l (in
cl. c
onv.
)Tik
hvin
Alb
ania
n C
hrom
eM
ogal
e A
lloy
Ace
sita
Fary
ab M
inin
gC
hely
abin
sk
Prod
uctio
n, in
000
t
South Africa CIS China
Europe India Others
© Heinz H. Pariser
35%
23%
>200 kt
8%
>100 kt6%
<100 kt
Total SelectedMarket Share: 72%

Merafe Resources Ltd | Results presentation for the six months ended 30 June 2015
Ferrochrome Currencies’ Exchange Rate Fluctuation
28
60
80
100
120
140
160
180
200
220
240
2010 2011 2012 2013 2014 2015 Y-t-D
Exch
ange
Rat
e In
dex,
200
8 =
100
(loca
l Cur
ency
per
U
EUR
Depr
ecia
tion
App
reci
atio
n
BRR
RMB
INRZAR
SEK
KZT
© Heinz H. Pariser
TRL
RUR
ALL

THANK YOU