results presentation q2 fy 2018 - peninsula land limited · results presentation q2 fy 2018 . 5,...
TRANSCRIPT
Results Presentation Q2 FY 2018
5, 87, 162
123,143,201
179,188,223
153,51,102
192,192,192
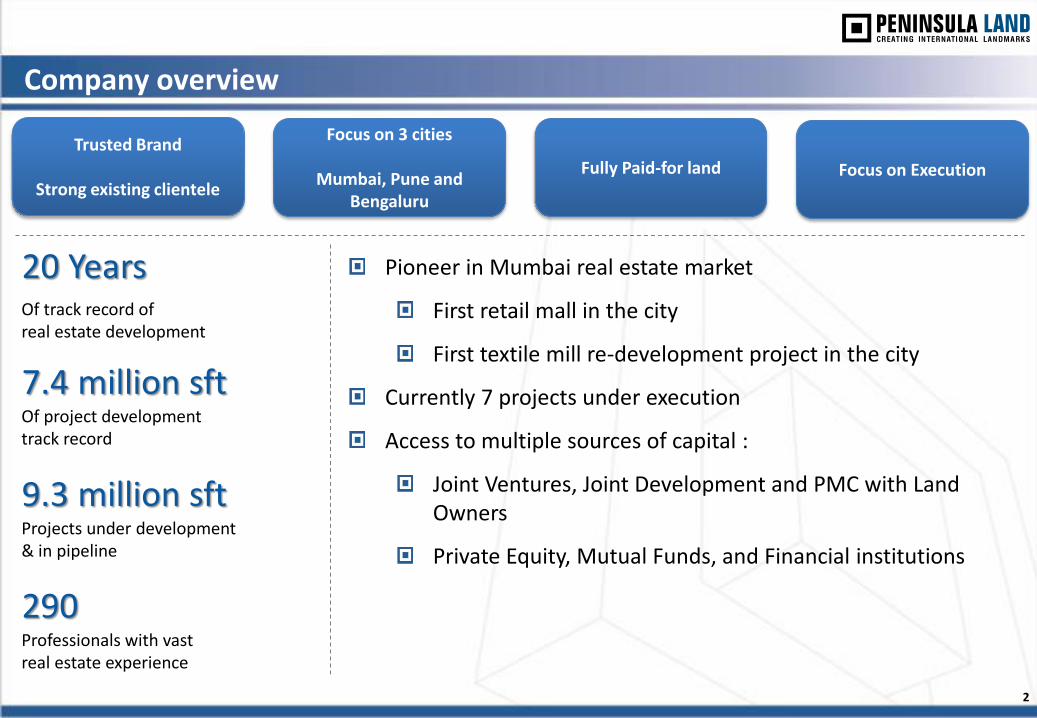
Company overview
Trusted Brand
Strong existing clientele
Focus on 3 cities
Mumbai, Pune and Bengaluru
Fully Paid-for land Focus on Execution
Pioneer in Mumbai real estate market
First retail mall in the city
First textile mill re-development project in the city
Currently 7 projects under execution
Access to multiple sources of capital :
Joint Ventures, Joint Development and PMC with Land Owners
Private Equity, Mutual Funds, and Financial institutions
Of track record of real estate development
20 Years
Of project development track record
7.4 million sft
Projects under development & in pipeline
9.3 million sft
Professionals with vast real estate experience
290
2
5, 87, 162
123,143,201
179,188,223
153,51,102
192,192,192
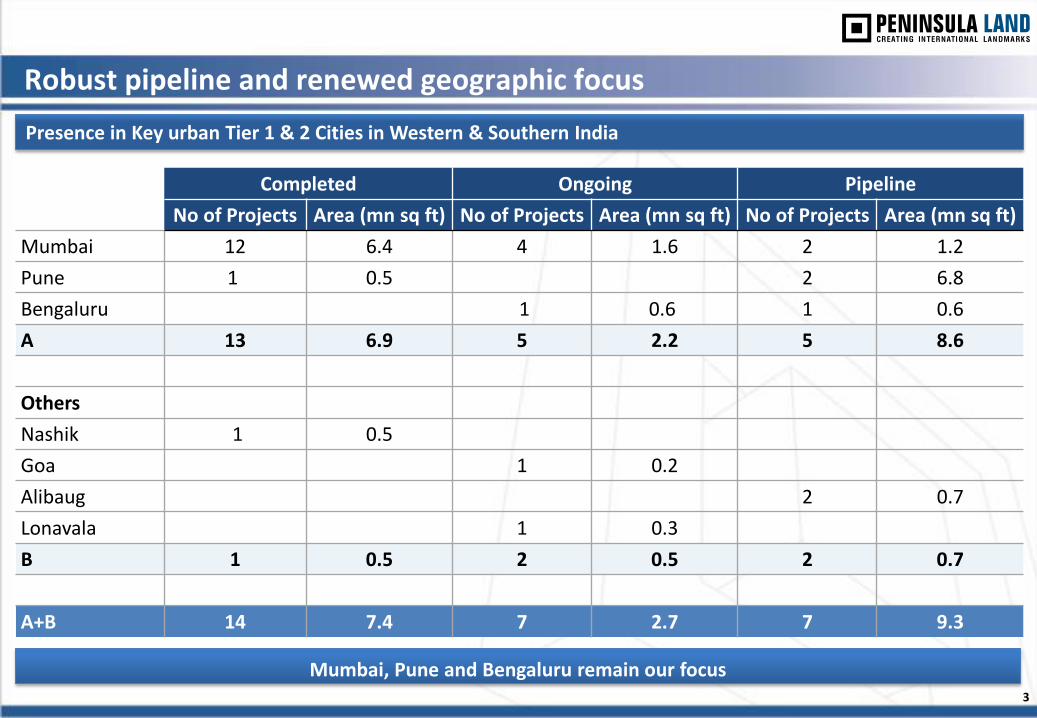
Mumbai, Pune and Bengaluru remain our focus
Presence in Key urban Tier 1 & 2 Cities in Western & Southern India
Completed Ongoing Pipeline
No of Projects Area (mn sq ft) No of Projects Area (mn sq ft) No of Projects Area (mn sq ft)
Mumbai 12 6.4 4 1.6 2 1.2
Pune 1 0.5 2 6.8
Bengaluru 1 0.6 1 0.6
A 13 6.9 5 2.2 5 8.6
Others
Nashik 1 0.5
Goa 1 0.2
Alibaug 2 0.7
Lonavala 1 0.3
B 1 0.5 2 0.5 2 0.7
A+B 14 7.4 7 2.7 7 9.3
Robust pipeline and renewed geographic focus
3
5, 87, 162
123,143,201
179,188,223
153,51,102
192,192,192
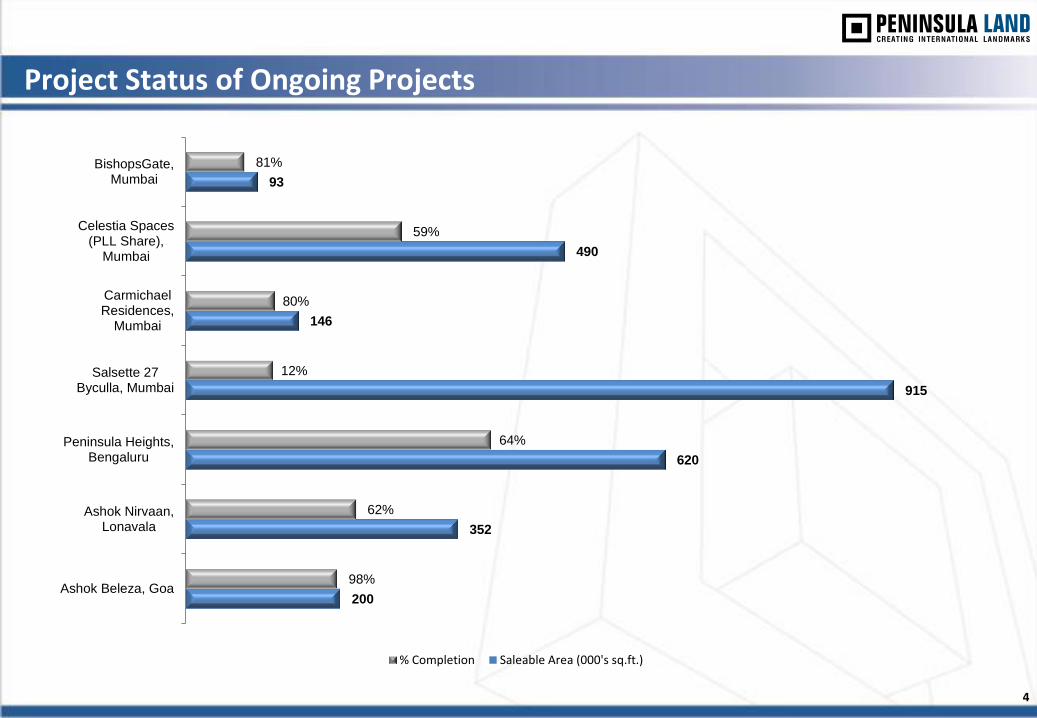
Project Status of Ongoing Projects
4
200
352
620
915
146
490
93
98%
62%
64%
12%
80%
59%
81%
Ashok Beleza, Goa
Ashok Nirvaan,Lonavala
Peninsula Heights,Bengaluru
Salsette 27Byculla, Mumbai
CarmichaelResidences,
Mumbai
Celestia Spaces(PLL Share),
Mumbai
BishopsGate,Mumbai
% Completion Saleable Area (000's sq.ft.)

5, 87, 162
123,143,201
179,188,223
153,51,102
192,192,192
Business Updates
5, 87, 162
123,143,201
179,188,223
153,51,102
192,192,192
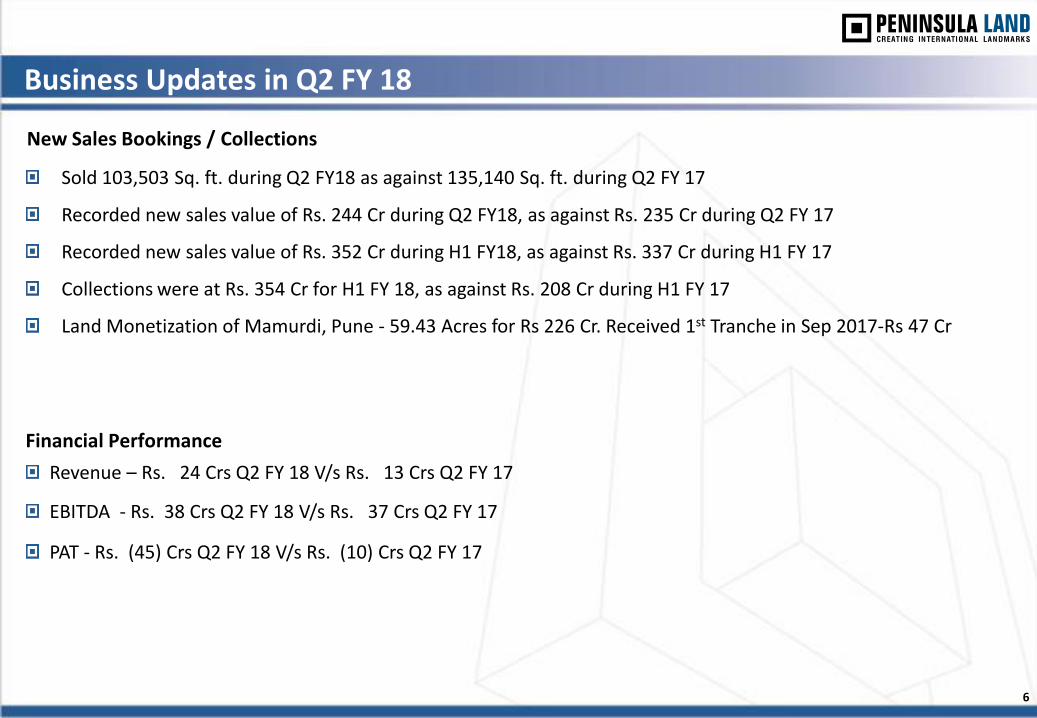
Business Updates in Q2 FY 18
New Sales Bookings / Collections
Sold 103,503 Sq. ft. during Q2 FY18 as against 135,140 Sq. ft. during Q2 FY 17
Recorded new sales value of Rs. 244 Cr during Q2 FY18, as against Rs. 235 Cr during Q2 FY 17
Recorded new sales value of Rs. 352 Cr during H1 FY18, as against Rs. 337 Cr during H1 FY 17
Collections were at Rs. 354 Cr for H1 FY 18, as against Rs. 208 Cr during H1 FY 17
Land Monetization of Mamurdi, Pune - 59.43 Acres for Rs 226 Cr. Received 1st Tranche in Sep 2017-Rs 47 Cr
Financial Performance
Revenue – Rs. 24 Crs Q2 FY 18 V/s Rs. 13 Crs Q2 FY 17
EBITDA - Rs. 38 Crs Q2 FY 18 V/s Rs. 37 Crs Q2 FY 17
PAT - Rs. (45) Crs Q2 FY 18 V/s Rs. (10) Crs Q2 FY 17
6
5, 87, 162
123,143,201
179,188,223
153,51,102
192,192,192
Financials Overview
5, 87, 162
123,143,201
179,188,223
153,51,102
192,192,192
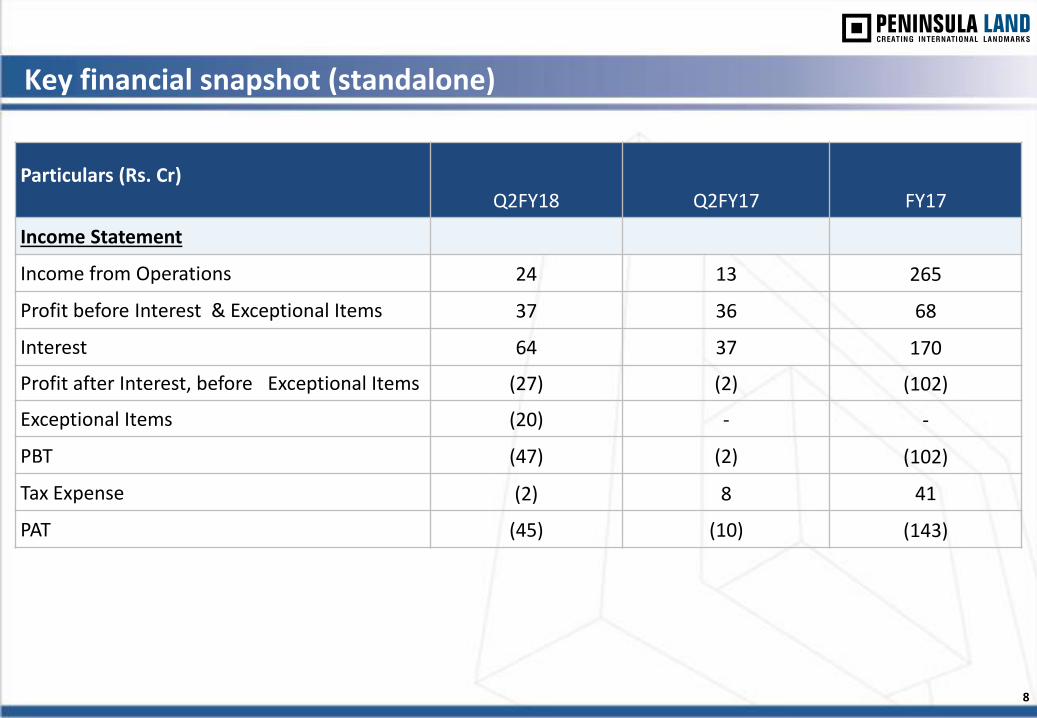
Key financial snapshot (standalone)
8
Particulars (Rs. Cr) Q2FY18 Q2FY17 FY17
Income Statement
Income from Operations 24 13 265
Profit before Interest & Exceptional Items 37 36 68
Interest 64 37 170
Profit after Interest, before Exceptional Items (27) (2) (102)
Exceptional Items (20) - -
PBT (47) (2) (102)
Tax Expense (2) 8 41
PAT (45) (10) (143)
5, 87, 162
123,143,201
179,188,223
153,51,102
192,192,192
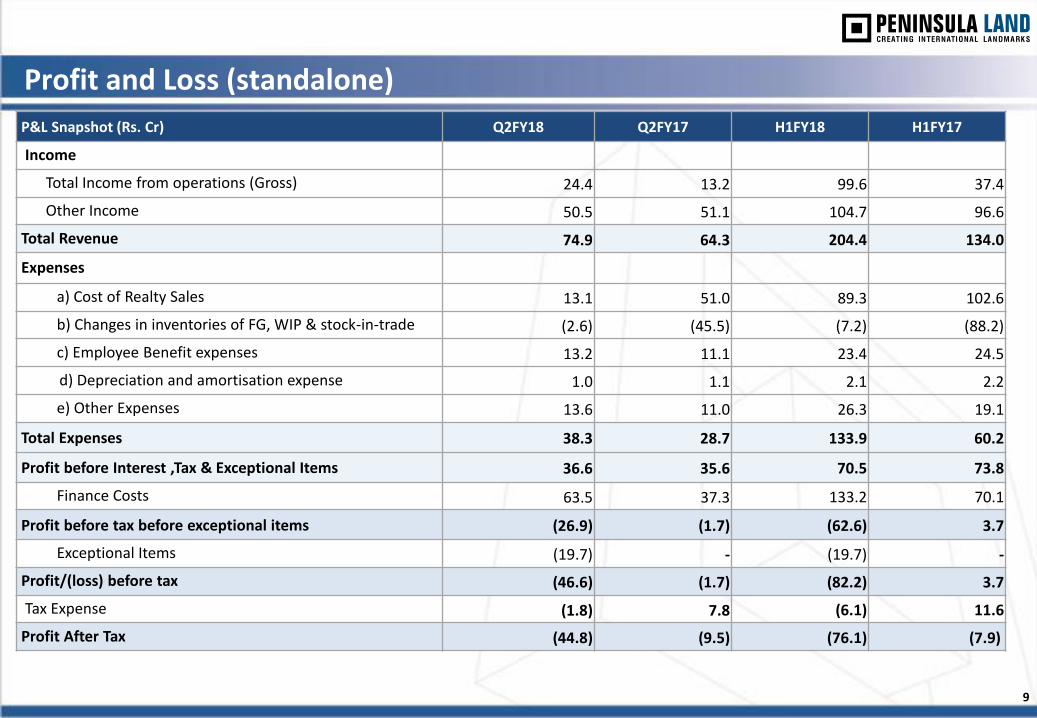
Profit and Loss (standalone)
9
P&L Snapshot (Rs. Cr) Q2FY18 Q2FY17 H1FY18 H1FY17
Income
Total Income from operations (Gross) 24.4 13.2 99.6 37.4
Other Income 50.5 51.1 104.7 96.6
Total Revenue 74.9 64.3 204.4 134.0
Expenses
a) Cost of Realty Sales 13.1 51.0 89.3 102.6
b) Changes in inventories of FG, WIP & stock-in-trade (2.6) (45.5) (7.2) (88.2)
c) Employee Benefit expenses 13.2 11.1 23.4 24.5
d) Depreciation and amortisation expense 1.0 1.1 2.1 2.2
e) Other Expenses 13.6 11.0 26.3 19.1
Total Expenses 38.3 28.7 133.9 60.2
Profit before Interest ,Tax & Exceptional Items 36.6 35.6 70.5 73.8
Finance Costs 63.5 37.3 133.2 70.1
Profit before tax before exceptional items (26.9) (1.7) (62.6) 3.7
Exceptional Items (19.7) - (19.7) -
Profit/(loss) before tax (46.6) (1.7) (82.2) 3.7
Tax Expense (1.8) 7.8 (6.1) 11.6
Profit After Tax (44.8) (9.5) (76.1) (7.9)
5, 87, 162
123,143,201
179,188,223
153,51,102
192,192,192
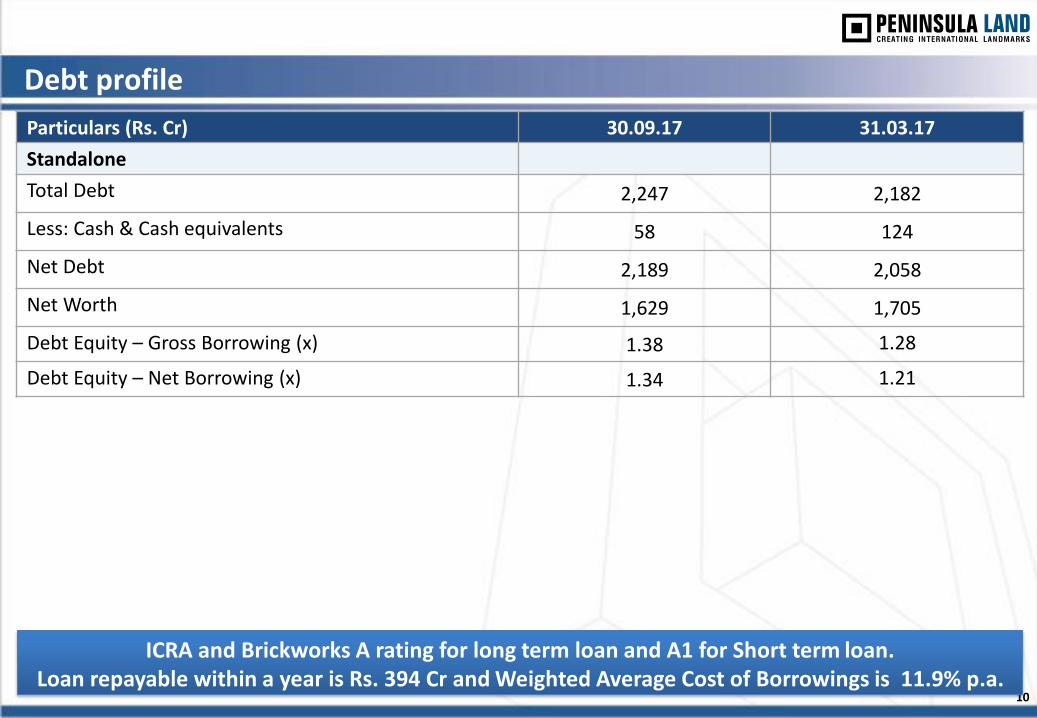
Debt profile
10
Particulars (Rs. Cr) 30.09.17 31.03.17
Standalone
Total Debt 2,247 2,182
Less: Cash & Cash equivalents 58 124
Net Debt 2,189 2,058
Net Worth 1,629 1,705
Debt Equity – Gross Borrowing (x) 1.38 1.28
Debt Equity – Net Borrowing (x) 1.34 1.21
ICRA and Brickworks A rating for long term loan and A1 for Short term loan. Loan repayable within a year is Rs. 394 Cr and Weighted Average Cost of Borrowings is 11.9% p.a.
5, 87, 162
123,143,201
179,188,223
153,51,102
192,192,192
Projects Overview
5, 87, 162
123,143,201
179,188,223
153,51,102
192,192,192
Details of Ongoing Projects - Q2 FY 2018
12
Projects PLL
Share (%)
Up to last Quarter Q2 Total Collecti
on (Rs. Crs)
in H1
No of
Units sold
Area Sold (sft )
Sales Value (Rs.Cr)
Avg. Reali- zation
(Rs./sft)
No of
Units sold
Area Sold (sft )
Sales Value (Rs.Cr)
Avg. Reali- zation
(Rs./sft)
No of
Units sold
Area Sold (sft )
Sales Value (Rs.Cr)
Avg. Reali- zation
(Rs./sft)
Bishopsgate 50% 1 7,750 55 70,968 - - - - 1 7,750 55 70,968 67
Salsette 27 57% 7 9,100 31 33,738 4 5,800 16 28,363 11 14,900 47 31,646 35
Peninsula Heights, JP Nagar 80% 7 32,190 33 10,251 7 32,510 33 10,025 14 64,700 66 10,138 56
Ashok Astoria (Phase 1) * 100%
12 30,551 11 3,540 2 (3123) (1) - 14 27,428 9 3,645 15
Ashok Astoria(Amenities) * 1 368 0.2 5,150 1 263 0.1 5,100 2 631 0.3 5,129
Ashok Meadows (Phase 1)* 55% 11 15,943 8 4,928 5 6,906 3 4,636 16 22,849 11 4,816 24
Celestia Spaces (PLL Share) 100% (8) (13,534) (31) - 6 12,054 28 22,903 (2) (1,480) (3) - 77
Carmichael Residences 40% - - - - 4 20,856 160 76,716 4 20,856 160 76,716 53
Ashok Nirvaan 25% - - - - - - - - - - - - 5
Ashok Beleza 58% - - (1) - - - - - - - (1) - 6
Ashok Beleza (Plot A) 58% 2 9,164 2 1,969 5 28,237 5 1,922 7 37,402 7 1,934 15
Total 33 91,532 108 34 103,503 244 67 195,036 352 354
* Completed project
5, 87, 162
123,143,201
179,188,223
153,51,102
192,192,192
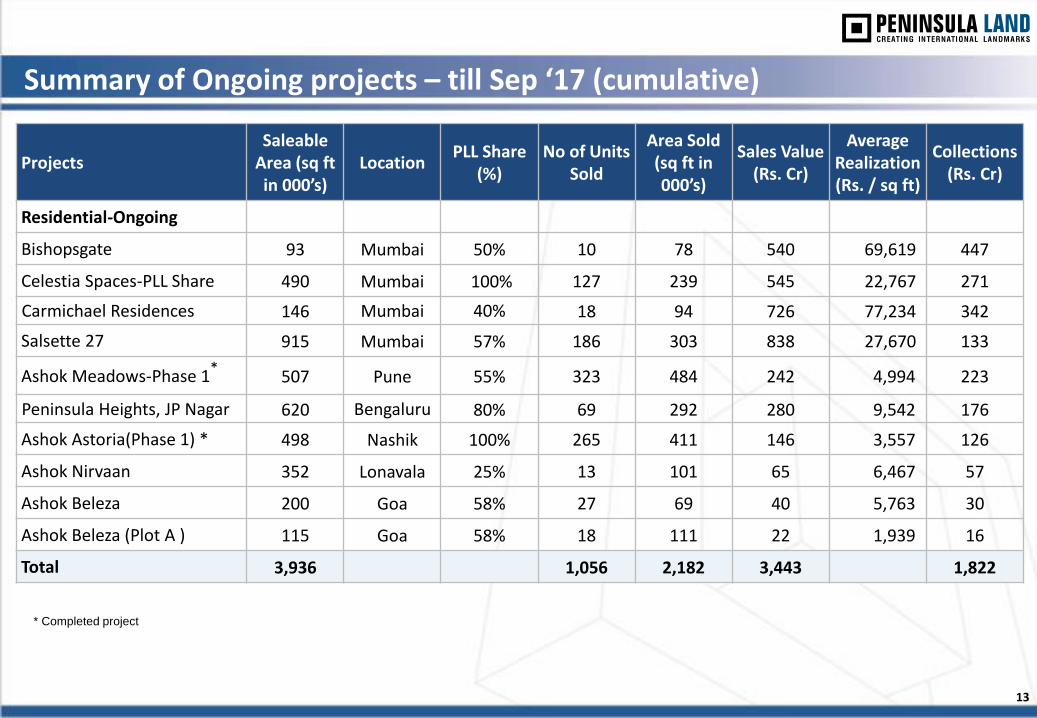
Summary of Ongoing projects – till Sep ‘17 (cumulative)
13
Projects Saleable
Area (sq ft in 000’s)
Location PLL Share
(%) No of Units
Sold
Area Sold (sq ft in 000’s)
Sales Value (Rs. Cr)
Average Realization (Rs. / sq ft)
Collections (Rs. Cr)
Residential-Ongoing
Bishopsgate 93 Mumbai 50% 10 78 540 69,619 447
Celestia Spaces-PLL Share 490 Mumbai 100% 127 239 545 22,767 271
Carmichael Residences 146 Mumbai 40% 18 94 726 77,234 342
Salsette 27 915 Mumbai 57% 186 303 838 27,670 133
Ashok Meadows-Phase 1* 507 Pune 55% 323 484 242 4,994 223
Peninsula Heights, JP Nagar 620 Bengaluru 80% 69 292 280 9,542 176
Ashok Astoria(Phase 1) * 498 Nashik 100% 265 411 146 3,557 126
Ashok Nirvaan 352 Lonavala 25% 13 101 65 6,467 57
Ashok Beleza 200 Goa 58% 27 69 40 5,763 30
Ashok Beleza (Plot A ) 115 Goa 58% 18 111 22 1,939 16
Total 3,936 1,056 2,182 3,443 1,822
* Completed project
5, 87, 162
123,143,201
179,188,223
153,51,102
192,192,192
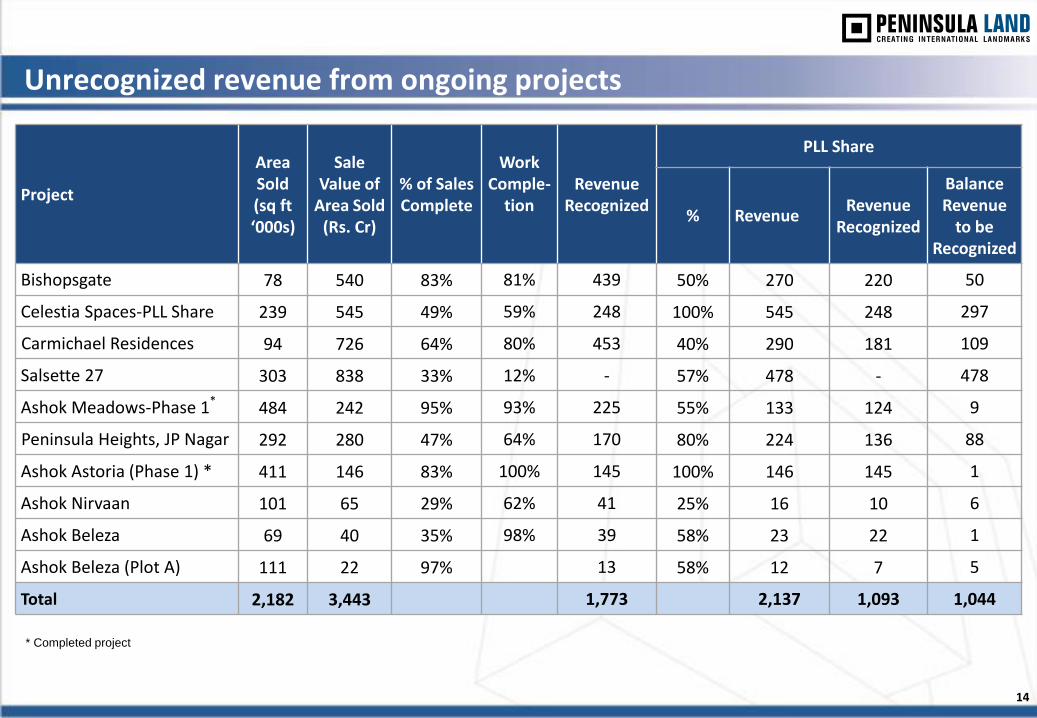
Unrecognized revenue from ongoing projects
14
Project
Area Sold (sq ft ‘000s)
Sale Value of
Area Sold (Rs. Cr)
% of Sales Complete
Work Comple-
tion
Revenue Recognized
PLL Share
% Revenue Revenue
Recognized
Balance Revenue
to be Recognized
Bishopsgate 78 540 83% 81% 439 50% 270 220 50
Celestia Spaces-PLL Share 239 545 49% 59% 248 100% 545 248 297
Carmichael Residences 94 726 64% 80% 453 40% 290 181 109
Salsette 27 303 838 33% 12% - 57% 478 - 478
Ashok Meadows-Phase 1* 484 242 95% 93% 225 55% 133 124 9
Peninsula Heights, JP Nagar 292 280 47% 64% 170 80% 224 136 88
Ashok Astoria (Phase 1) * 411 146 83% 100% 145 100% 146 145 1
Ashok Nirvaan 101 65 29% 62% 41 25% 16 10 6
Ashok Beleza 69 40 35% 98% 39 58% 23 22 1
Ashok Beleza (Plot A) 111 22 97% 13 58% 12 7 5
Total 2,182 3,443 1,773 2,137 1,093 1,044
* Completed project
5, 87, 162
123,143,201
179,188,223
153,51,102
192,192,192
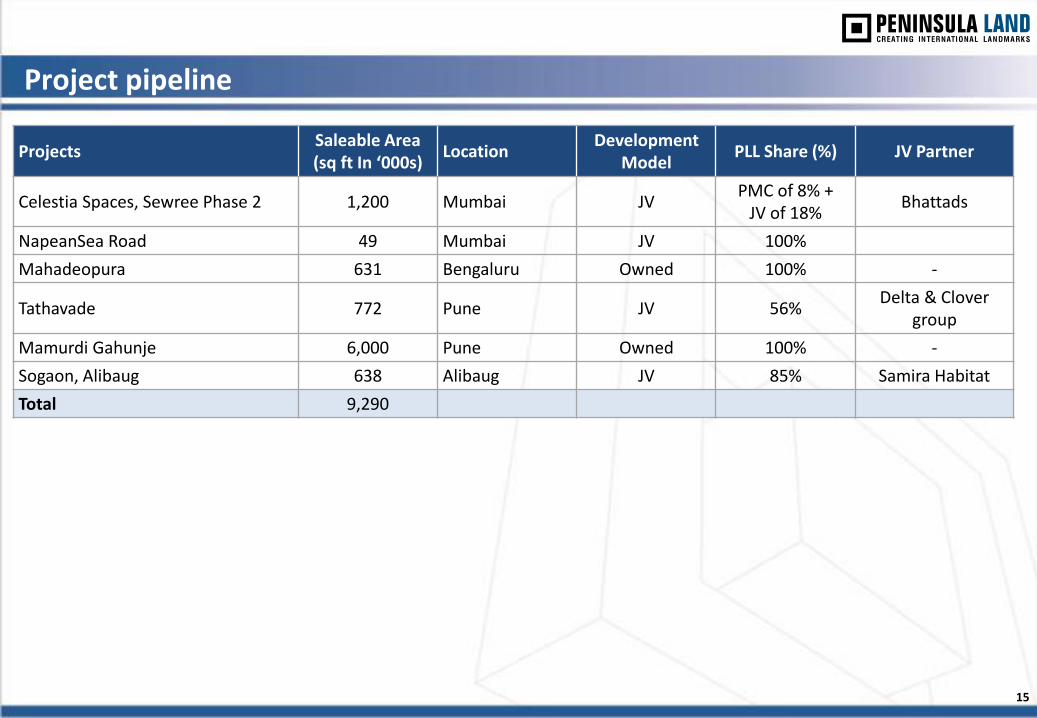
Project pipeline
Projects Saleable Area (sq ft In ‘000s)
Location Development
Model PLL Share (%) JV Partner
Celestia Spaces, Sewree Phase 2 1,200 Mumbai JV PMC of 8% +
JV of 18% Bhattads
NapeanSea Road 49 Mumbai JV 100%
Mahadeopura 631 Bengaluru Owned 100% -
Tathavade 772 Pune JV 56% Delta & Clover
group
Mamurdi Gahunje 6,000 Pune Owned 100% -
Sogaon, Alibaug 638 Alibaug JV 85% Samira Habitat
Total 9,290
15
5, 87, 162
123,143,201
179,188,223
153,51,102
192,192,192
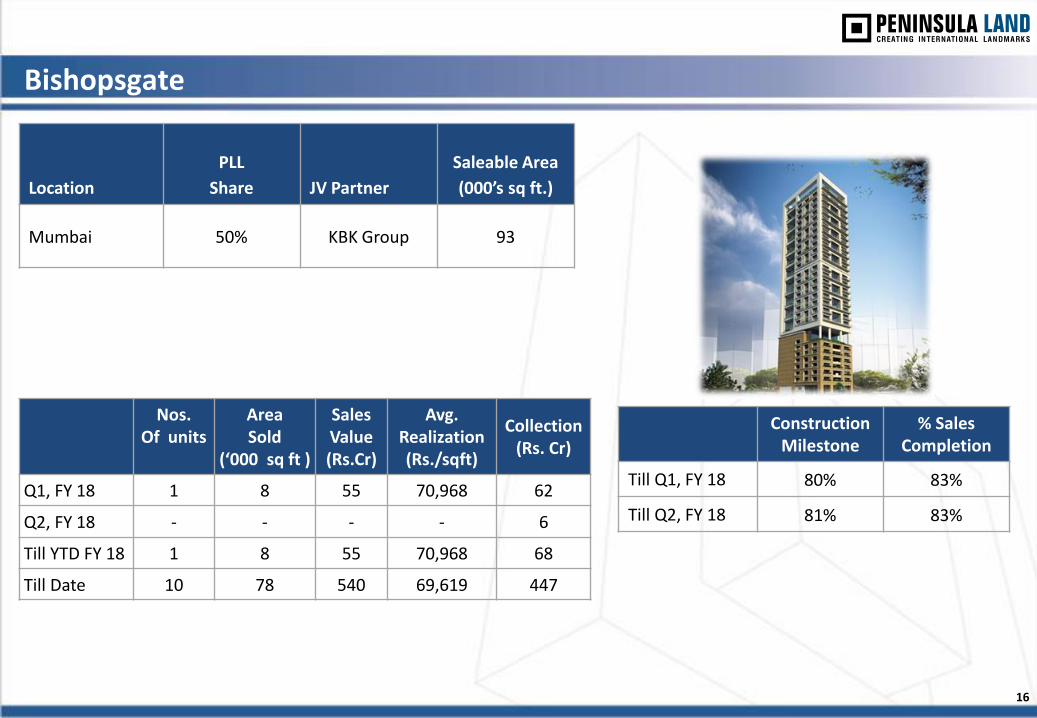
Bishopsgate
Location
PLL
Share JV Partner
Saleable Area
(000’s sq ft.)
Mumbai 50% KBK Group 93
Nos. Of units
Area Sold
(‘000 sq ft )
Sales Value (Rs.Cr)
Avg. Realization (Rs./sqft)
Collection (Rs. Cr)
Q1, FY 18 1 8 55 70,968 62
Q2, FY 18 - - - - 6
Till YTD FY 18 1 8 55 70,968 68
Till Date 10 78 540 69,619 447
Construction Milestone
% Sales Completion
Till Q1, FY 18 80% 83%
Till Q2, FY 18 81% 83%
16
5, 87, 162
123,143,201
179,188,223
153,51,102
192,192,192
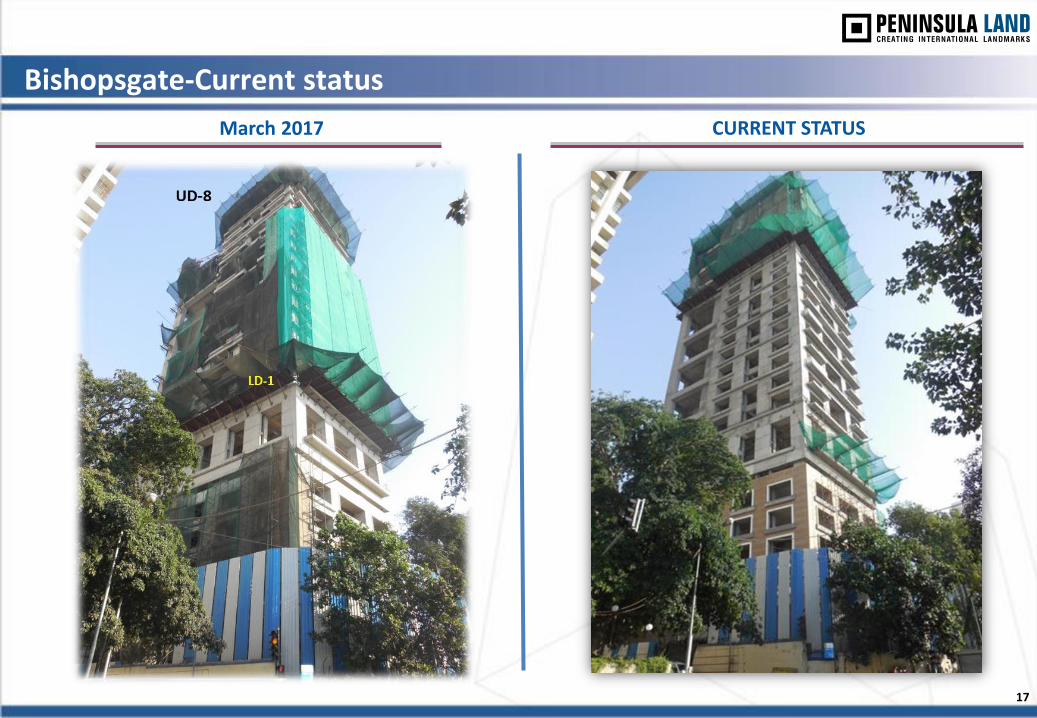
March 2017
Bishopsgate-Current status
CURRENT STATUS
17
5, 87, 162
123,143,201
179,188,223
153,51,102
192,192,192
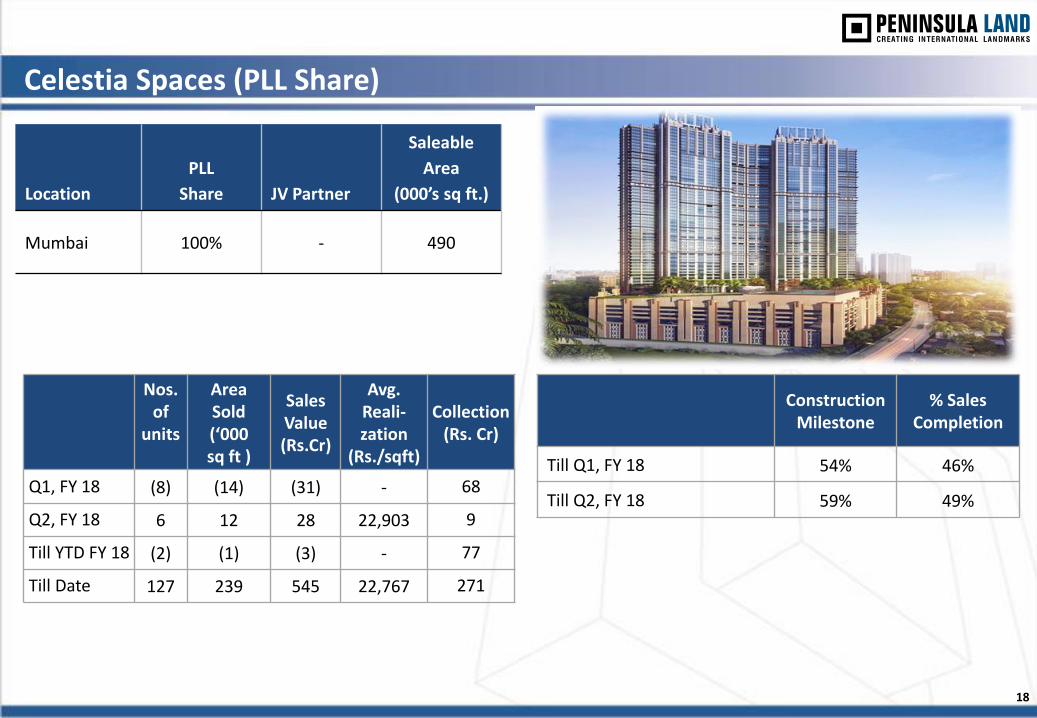
Celestia Spaces (PLL Share)
Location
PLL
Share JV Partner
Saleable
Area
(000’s sq ft.)
Mumbai 100% - 490
Nos. of
units
Area Sold (‘000 sq ft )
Sales Value (Rs.Cr)
Avg. Reali- zation
(Rs./sqft)
Collection (Rs. Cr)
Q1, FY 18 (8) (14) (31) - 68
Q2, FY 18 6 12 28 22,903 9
Till YTD FY 18 (2) (1) (3) - 77
Till Date 127 239 545 22,767 271
Construction Milestone
% Sales Completion
Till Q1, FY 18 54% 46%
Till Q2, FY 18 59% 49%
18
5, 87, 162
123,143,201
179,188,223
153,51,102
192,192,192
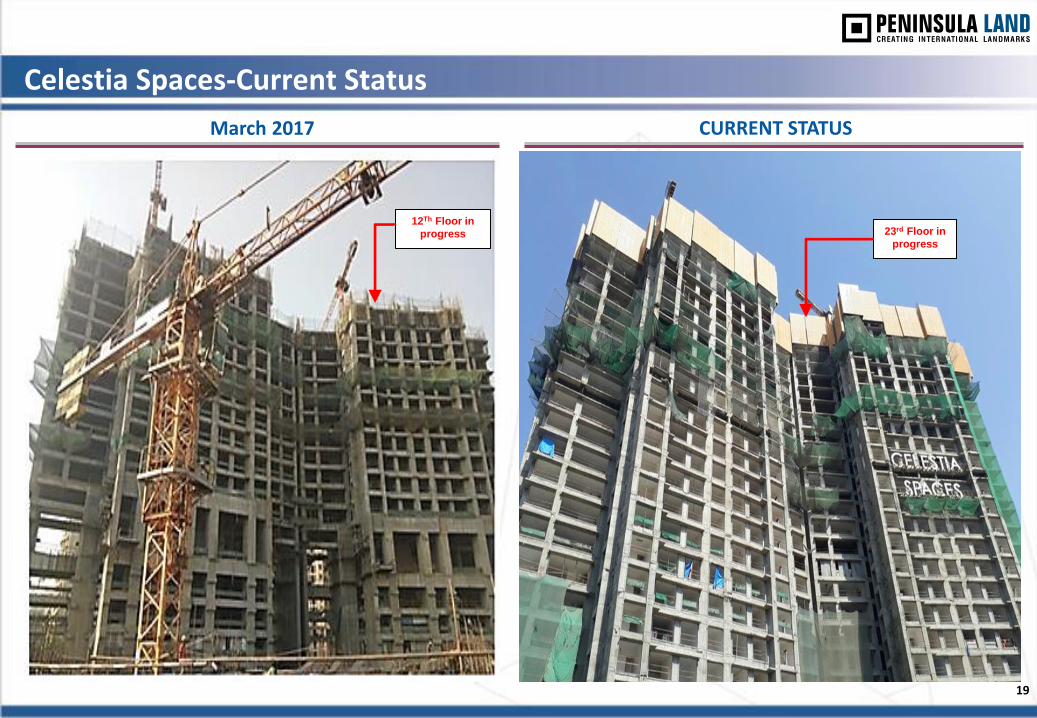
Celestia Spaces-Current Status
March 2017 CURRENT STATUS
19
23rd Floor in
progress
12Th Floor in
progress
5, 87, 162
123,143,201
179,188,223
153,51,102
192,192,192
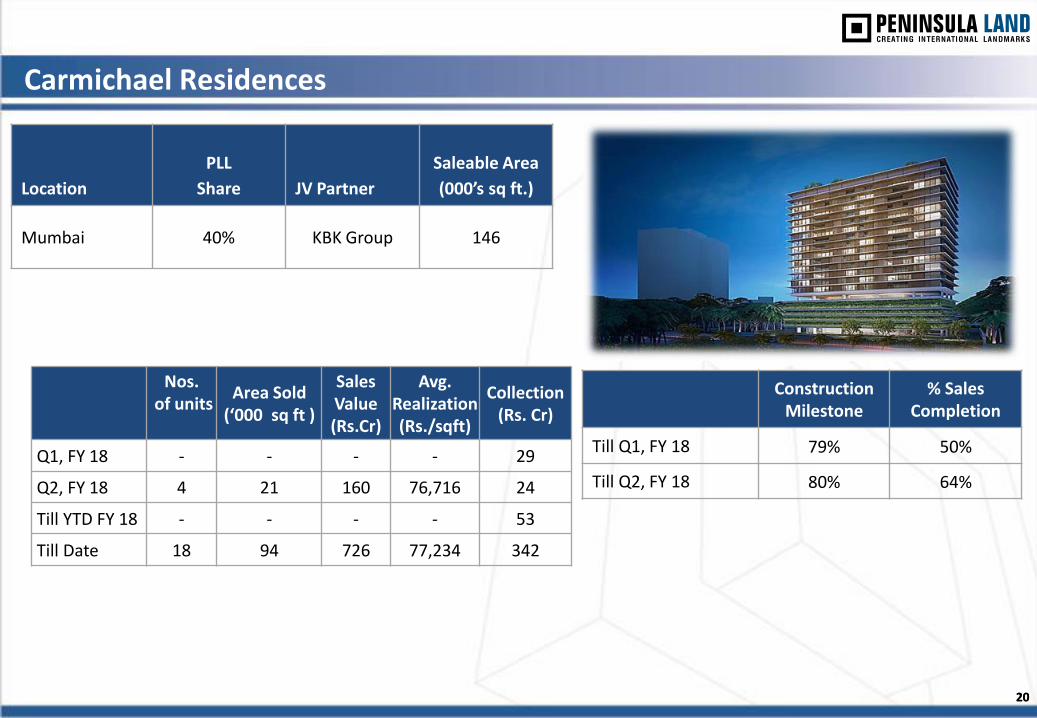
Location
PLL
Share JV Partner
Saleable Area
(000’s sq ft.)
Mumbai 40% KBK Group 146
Construction Milestone
% Sales Completion
Till Q1, FY 18 79% 50%
Till Q2, FY 18 80% 64%
20
Carmichael Residences
Nos. of units
Area Sold (‘000 sq ft )
Sales Value (Rs.Cr)
Avg. Realization (Rs./sqft)
Collection (Rs. Cr)
Q1, FY 18 - - - - 29
Q2, FY 18 4 21 160 76,716 24
Till YTD FY 18 - - - - 53
Till Date 18 94 726 77,234 342
20
5, 87, 162
123,143,201
179,188,223
153,51,102
192,192,192
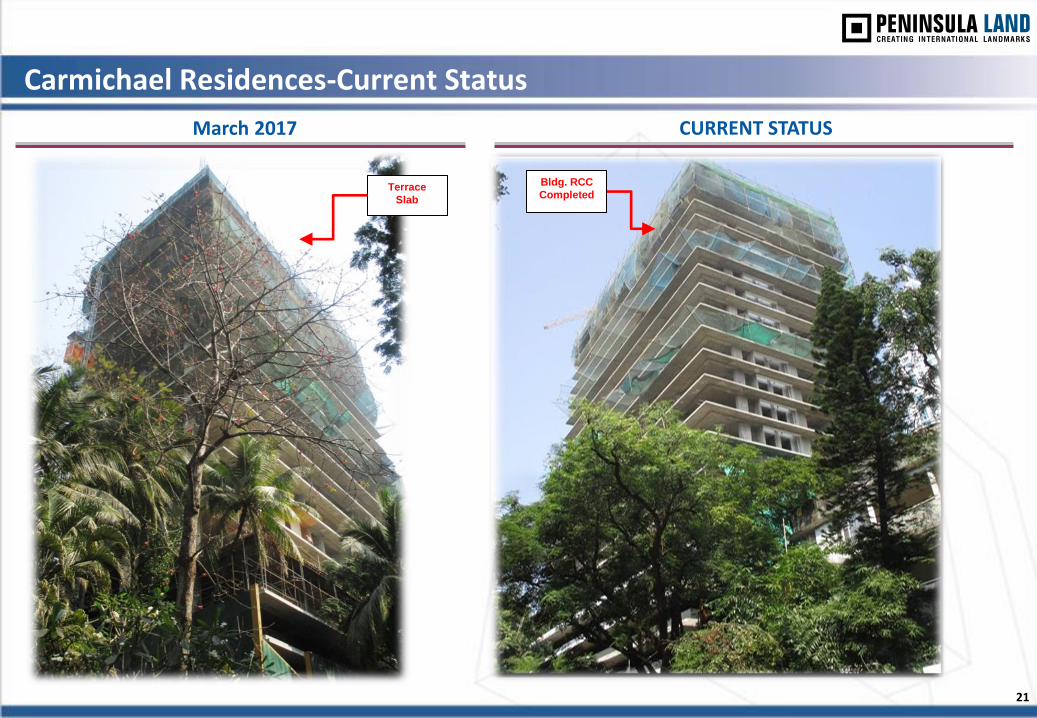
Carmichael Residences-Current Status
March 2017 CURRENT STATUS
21
P2 Slab in Progress
P2 Slab in Progress
2nd Residential Floor in Progress
Terrace
Slab
Bldg. RCC
Completed

5, 87, 162
123,143,201
179,188,223
153,51,102
192,192,192
Salsette 27
Location
PLL
Share JV Partner
Saleable Area
(000’s sq ft.)
Byculla,
Mumbai 57% PREI Fund 915
Construction Milestone
% Sales Completion
Till Q1, FY 18 10% 32%
Till Q2, FY 18 12% 33%
Nos. of units
Area Sold (‘000 sq ft )
Sales Value (Rs.Cr)
Avg. Realization (Rs./sqft)
Collection (Rs. Cr)
Q1, FY 18 7 9 31 33,738 32
Q2, FY 18 4 6 16 28,363 3
Till YTD FY 18 11 15 47 31,646 35
Till Date 186 303 838 27,670 133
22
5, 87, 162
123,143,201
179,188,223
153,51,102
192,192,192
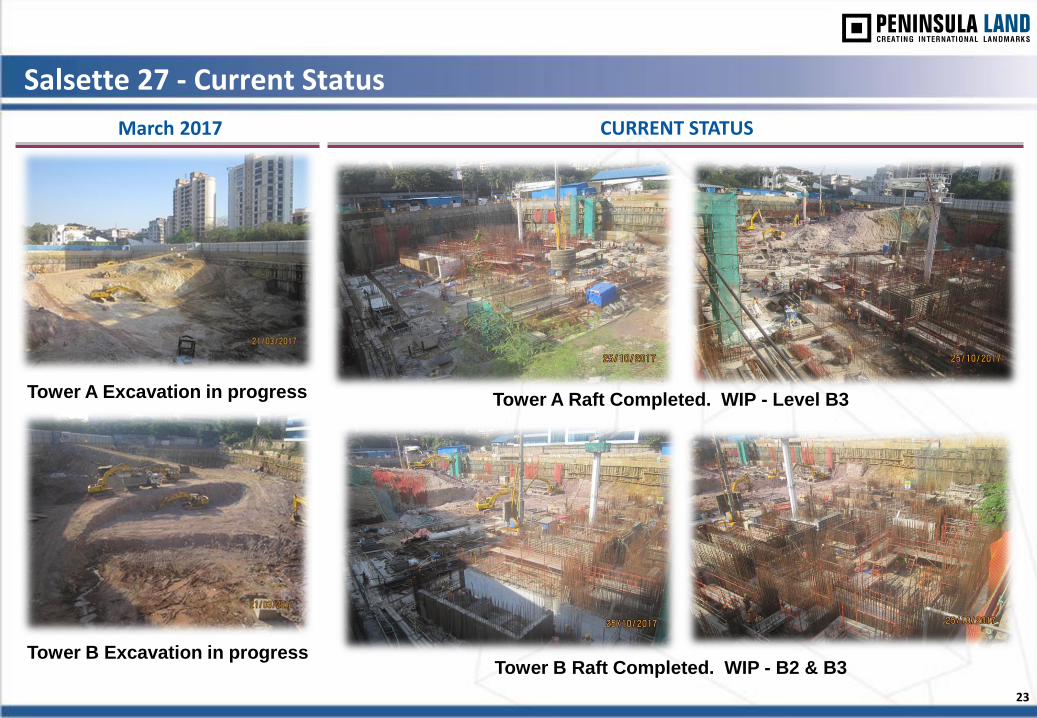
Salsette 27 - Current Status
23
March 2017 CURRENT STATUS
Demolition Completed
Nearby South-East Corner
On East Side On North Side
Tower A Raft Completed. WIP - Level B3
Tower B Raft Completed. WIP - B2 & B3
Tower A Excavation in progress Tower A Excavation in progress
Tower B Excavation in progress
5, 87, 162
123,143,201
179,188,223
153,51,102
192,192,192
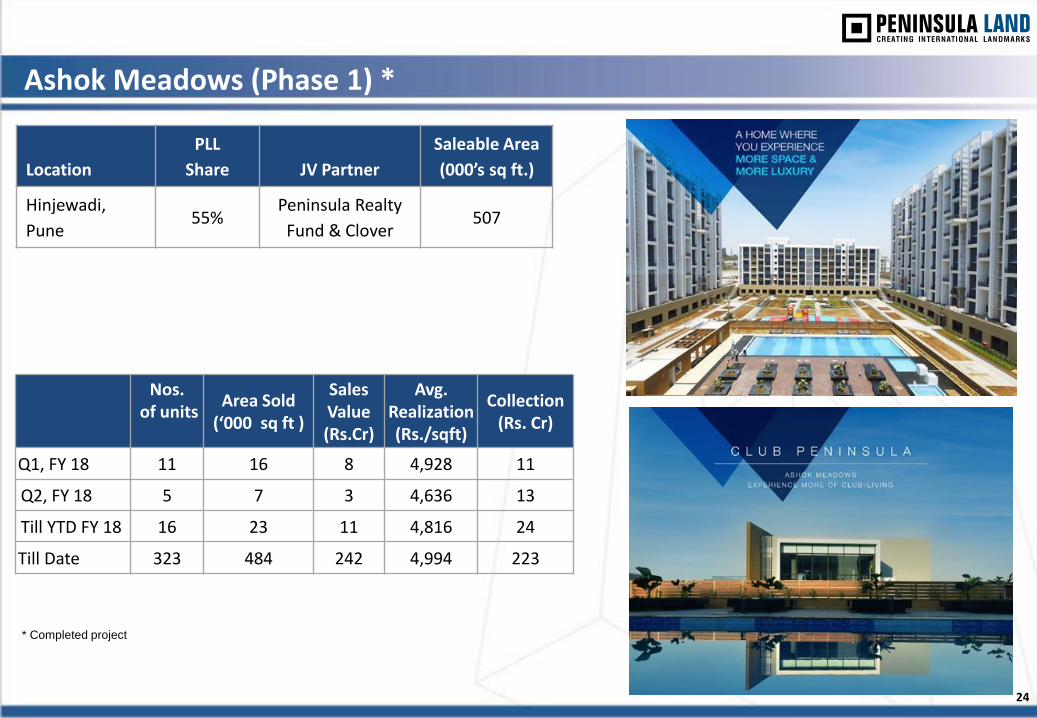
Ashok Meadows (Phase 1) *
Nos. of units
Area Sold (‘000 sq ft )
Sales Value (Rs.Cr)
Avg. Realization (Rs./sqft)
Collection (Rs. Cr)
Q1, FY 18 11 16 8 4,928 11
Q2, FY 18 5 7 3 4,636 13
Till YTD FY 18 16 23 11 4,816 24
Till Date 323 484 242 4,994 223
Location
PLL
Share JV Partner
Saleable Area
(000’s sq ft.)
Hinjewadi,
Pune 55%
Peninsula Realty
Fund & Clover 507
24
* Completed project
5, 87, 162
123,143,201
179,188,223
153,51,102
192,192,192
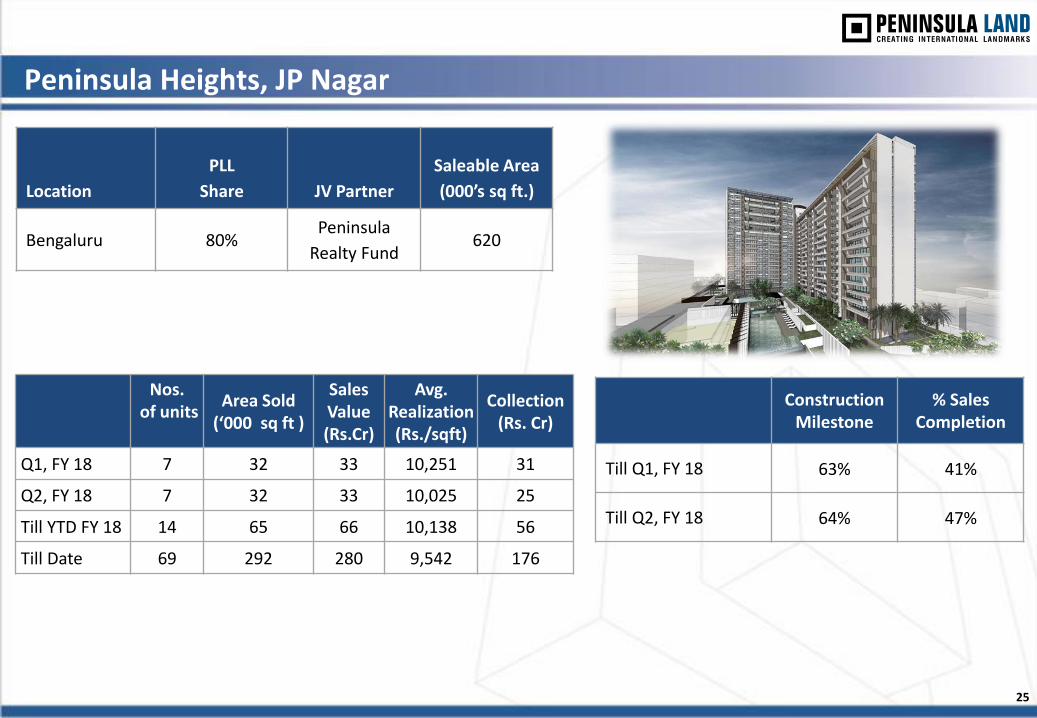
Peninsula Heights, JP Nagar
Location
PLL
Share JV Partner
Saleable Area
(000’s sq ft.)
Bengaluru 80% Peninsula
Realty Fund 620
Construction Milestone
% Sales Completion
Till Q1, FY 18 63% 41%
Till Q2, FY 18 64% 47%
Nos. of units
Area Sold (‘000 sq ft )
Sales Value (Rs.Cr)
Avg. Realization (Rs./sqft)
Collection (Rs. Cr)
Q1, FY 18 7 32 33 10,251 31
Q2, FY 18 7 32 33 10,025 25
Till YTD FY 18 14 65 66 10,138 56
Till Date 69 292 280 9,542 176
25
5, 87, 162
123,143,201
179,188,223
153,51,102
192,192,192
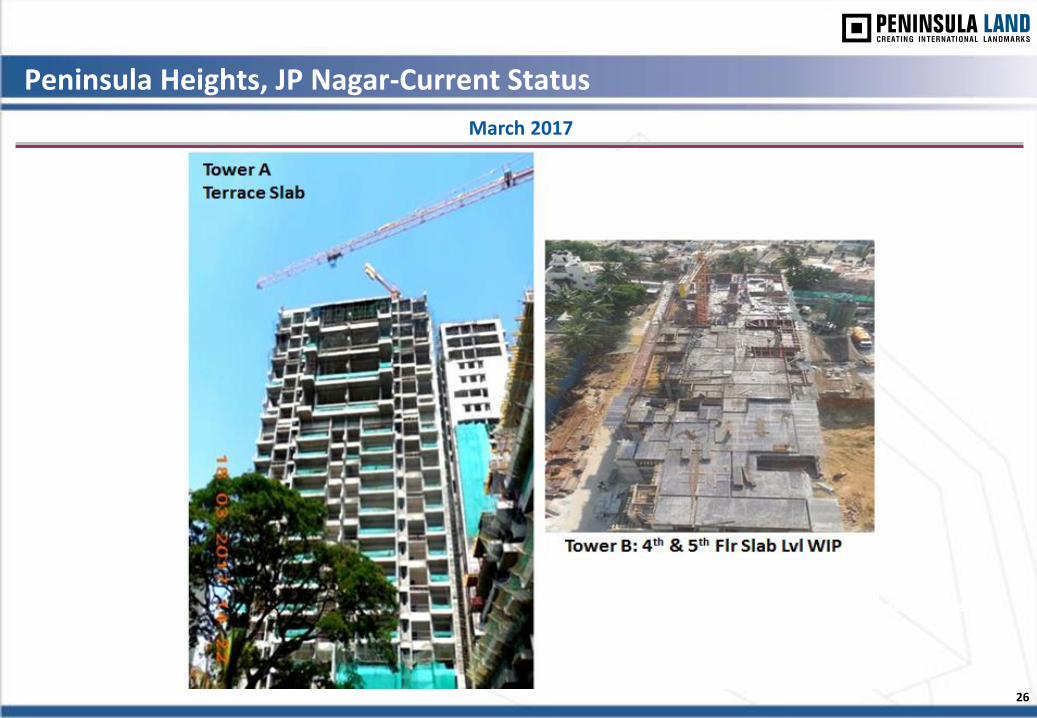
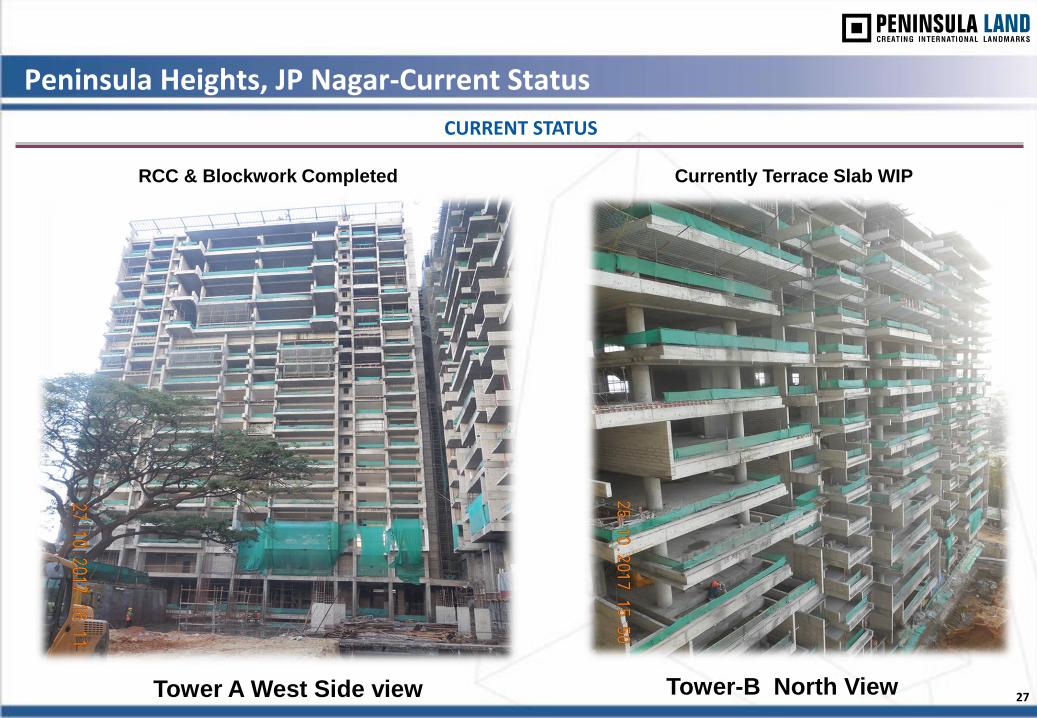
Peninsula Heights, JP Nagar-Current Status
March 2017
26
Tower B – 1st floor level slab under progress
5, 87, 162
123,143,201
179,188,223
153,51,102
192,192,192
Peninsula Heights, JP Nagar-Current Status
CURRENT STATUS
27
Tower B – 1st floor level slab under progress
Tower-B North View Tower A West Side view
RCC & Blockwork Completed Currently Terrace Slab WIP
5, 87, 162
123,143,201
179,188,223
153,51,102
192,192,192
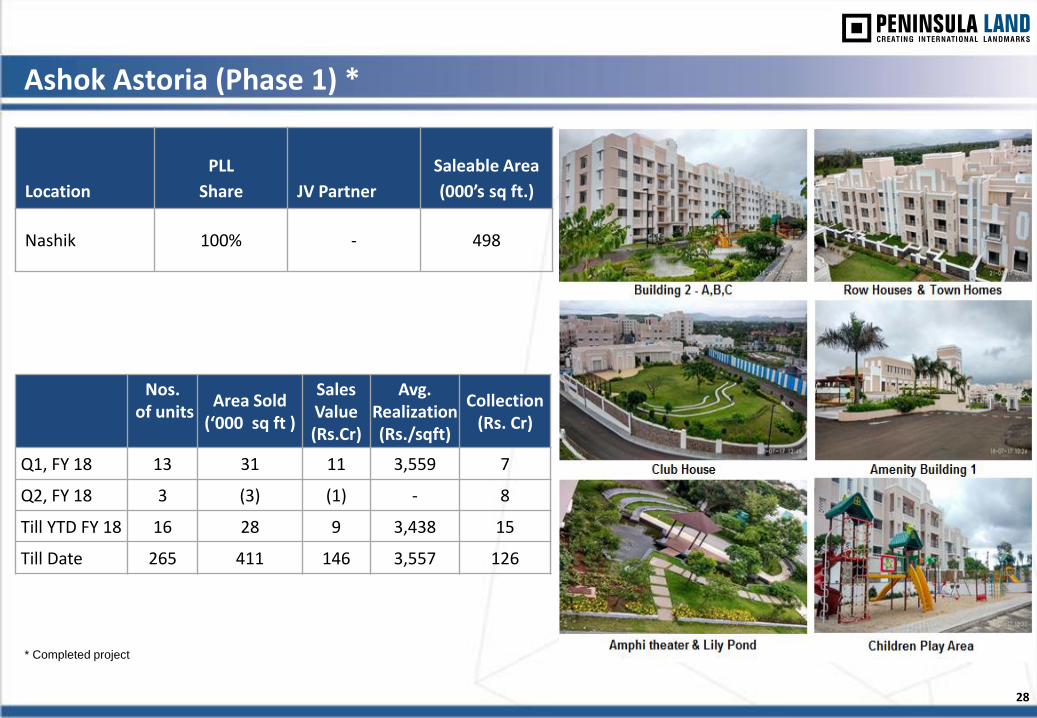
Ashok Astoria (Phase 1) *
Location
PLL
Share JV Partner
Saleable Area
(000’s sq ft.)
Nashik 100% - 498
Nos. of units
Area Sold (‘000 sq ft )
Sales Value (Rs.Cr)
Avg. Realization (Rs./sqft)
Collection (Rs. Cr)
Q1, FY 18 13 31 11 3,559 7
Q2, FY 18 3 (3) (1) - 8
Till YTD FY 18 16 28 9 3,438 15
Till Date 265 411 146 3,557 126
28
* Completed project
5, 87, 162
123,143,201
179,188,223
153,51,102
192,192,192
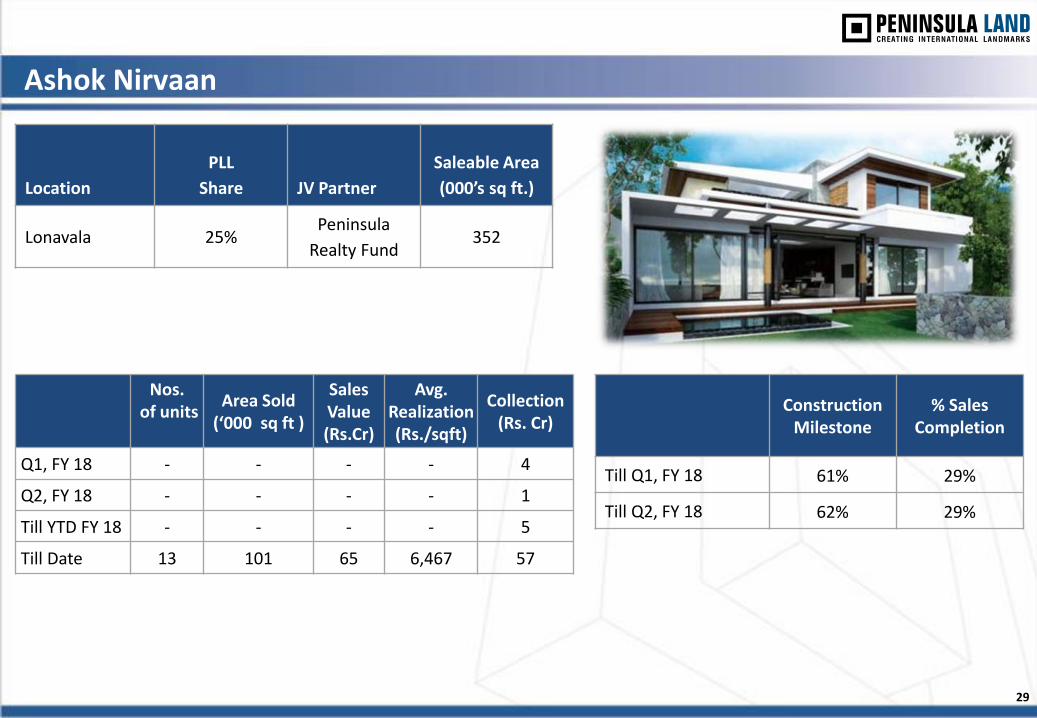
Ashok Nirvaan
Location
PLL
Share JV Partner
Saleable Area
(000’s sq ft.)
Lonavala 25% Peninsula
Realty Fund 352
Construction Milestone
% Sales Completion
Till Q1, FY 18 61% 29%
Till Q2, FY 18 62% 29%
Nos. of units
Area Sold (‘000 sq ft )
Sales Value (Rs.Cr)
Avg. Realization (Rs./sqft)
Collection (Rs. Cr)
Q1, FY 18 - - - - 4
Q2, FY 18 - - - - 1
Till YTD FY 18 - - - - 5
Till Date 13 101 65 6,467 57
29
5, 87, 162
123,143,201
179,188,223
153,51,102
192,192,192
Ashok Beleza
Location
PLL
Share JV Partner
Saleable Area
(000’s sq ft.)
Goa (Plot B&C) 58% Peninsula Realty
Fund 200
Goa (Plot A) 58% Peninsula Realty
Fund 115
Construction Milestone
% Sales Completion
Till Q1, FY 18 97% 35%
Till Q2, FY 18 98% 35%
Plot B &C Nos. of units
Area Sold (‘000 sq ft )
Sales Value (Rs.Cr)
Avg. Realization (Rs./sqft)
Collection (Rs. Cr)
Q1, FY 18 - - (1) - 6
Q2, FY 18 - - - - -
Till YTD FY
18 - - (1) -
6
Till Date 27 69 40 5,763 30
30
Plot A Nos. of units
Area Sold (‘000 sq ft )
Sales Value (Rs.Cr)
Avg. Realization (Rs./sqft)
Collection (Rs. Cr)
Q1, FY 18 2 9 2 1,969 3
Q2, FY 18 5 28 5 1,922 12
Till YTD FY 18 7 37 7 1,934 15
Till Date 18 111 22 1,939 16
Plot A Sales
Till Q1, FY 18 NA 72%
Till Q2, FY 18 97%
5, 87, 162
123,143,201
179,188,223
153,51,102
192,192,192
By attending the meeting where this presentation is made, or by reading the presentation slides, you agree to be bound by the following limitations:
• This document has been prepared for information purposes only and is not an offer or invitation or recommendation to buy or sell any securities of Peninsula Land Limited (the “Company”), nor shall part, or all, of this document form the basis of, or be relied on in connection with, any contract or investment decision in relation to any securities of the Company
• This document is strictly confidential and may not be copied, published, distributed or transmitted to any person, in whole or in part, by any medium or in any form for any purpose. The information in this document is being provided by the Company and is subject to change without notice. The Company relies on information obtained from sources believed to be reliable but does not guarantee its accuracy or completeness
• This document contains statements about future events and expectations that are forward-looking statements. These statements typically contain words such as "expects" and "anticipates" and words of similar import. Any statement in this document that is not a statement of historical fact is a forward-looking statement that involves known and unknown risks, uncertainties and other factors which may cause our actual results, performance or achievements to be materially different from any future results, performance or achievements expressed or implied by such forward-looking statements. None of the future projections, expectations, estimates or prospects in this document should be taken as forecasts or promises nor should they be taken as implying any indication, assurance or guarantee that the assumptions on which such future projections, expectations, estimates or prospects have been prepared are correct or exhaustive or, in the case of the assumptions, fully stated in the document. The Company assumes no obligations to update the forward-looking statements contained herein to reflect actual results, changes in assumptions or changes in factors affecting these statements
• You acknowledge that you will be solely responsible for your own assessment of the market and the market position of the Company and that you will conduct your own analysis and be solely responsible for forming your own view of the potential future performance of the business of the Company
• This document speaks as of November 02, 2017. Neither the delivery of this document nor further discussions of the Company with any of the recipients shall, under any circumstances, create any implication that there has been no change in the affairs of the Company since that date
Disclaimer
31
5, 87, 162
123,143,201
179,188,223
153,51,102
192,192,192
Thank You