results review 3qfy18 14 feb 2018 sobha - 3qfy18 - hdfc sec... · results review . 3qfy18 14 feb...
TRANSCRIPT

RESULTS REVIEW 3QFY18 14 FEB 2018
Sobha BUY
HDFC securities Institutional Research is also available on Bloomberg HSLB <GO>& Thomson Reuters
Cautious optimism Adjusted for MAT credit of Rs 39mn, Sobha Developers’ (SDL) 3QFY18 net profit came in at Rs 495mn vs our estimate of Rs 493mn. SDL recorded 0.93mn sqft of pre-sales for 3QFY18. Pre-sales value stood at Rs 7.51bn (SDL share – Rs 6.11bn), which is +92% YoY against the demonit affected 3QFY17. Cost of funds reduced to 9.74% vs 9.88% QoQ.
Net D/E increased from 0.84x to 0.86x QoQ. Net debt stood at Rs 23.3bn (vs 22.8 in 2QFY18). Customer collections improved to Rs 6.7bn for 3QFY18 vs 3QFY17 – Rs 6.2bn.
SDL is sitting on 15.2mn sq ft of unsold inventory and pre-sales acceleration along with pace of the planned launches in Bengaluru, Chennai, Mysore and Chennai are keys for further re-rating. With recent price correction we Upgrade SDL to BUY from NEU with NAV of Rs 632/share.
Key highlights Strong performance: SDL’s revenue grew 27.5% YoY,
owing to strong growth in the Real Estate development business (+50.8% YoY), but was partly negated by a decline in the Contracting segment (-10.2% YoY). EBIDTA margin expanded 164bps YoY to 19.9% on account of higher contribution to the top-line from the high-margin realty segment (72.3% vs 60.9% YoY).
Net D/E at 0.86x, capex key headwind: SDL incurred Rs 71mn capex on commercial assets during 3QFY18 (9MFY18 – Rs 202mn vs Rs 128mn during 9MFY17). Going forward, SDL may step up APMC capex (from FY19E). 3QFY18 land payments were Rs 241mn.
Near-term outlook: With steady pre-sales in Bengaluru, new launches in Chennai, Mysore and Kochi should drive pre-sales. Improving collections, focus on affordable housing and 5-7 launches in the near future are key trigger for further re-rating. We remain constructive.
Financial Summary* (Rs mn) 3QFY18 3QFY17 YoY (%) 2QFY18 QoQ (%) FY17 FY18E FY19E FY20E Net Sales 6,919 5,425 27.5 6,466 7.0 22,462 25,713 27,407 31,624 EBITDA 1,375 989 39.0 1,248 10.2 4,199 4,928 5,331 6,009 APAT 534 394 35.5 503 6.2 1,667 1,886 2,136 2,569 Diluted EPS (Rs) 5.6 4.2 35.5 5.3 6.2 17.6 19.9 22.5 27.1 P/E (x) 31.9 28.2 24.9 20.7 EV / EBITDA (x) 17.6 15.4 14.2 12.6 RoE (%) 5.2 6.4 6.9 7.9 Source: Company, HDFC sec Inst Research, * Consolidated
INDUSTRY REAL ESTATE
CMP (as on 12 Feb 2018) Rs 561
Target Price Rs 632 Nifty 10,540
Sensex 34,300
KEY STOCK DATA Bloomberg SOBHA IN
No. of Shares (mn) 95
MCap (Rs bn) / ($ mn) 53/829
6m avg traded value (Rs mn) 320
STOCK PERFORMANCE (%)
52 Week high / low Rs 695/279
3M 6M 12M
Absolute (%) 9.3 51.6 100.5
Relative (%) 6.3 41.7 79.4
SHAREHOLDING PATTERN (%)
Promoters 55.94
FIs & Local MFs 10.72
FPIs 29.23
Public & Others 4.11 Source : BSE
Parikshit Kandpal [email protected] +91-22-6171-7317 Kunal Bhandari [email protected] +91-22-6639-3035
SOBHA: RESULTS REVIEW 3QFY18
Page | 2
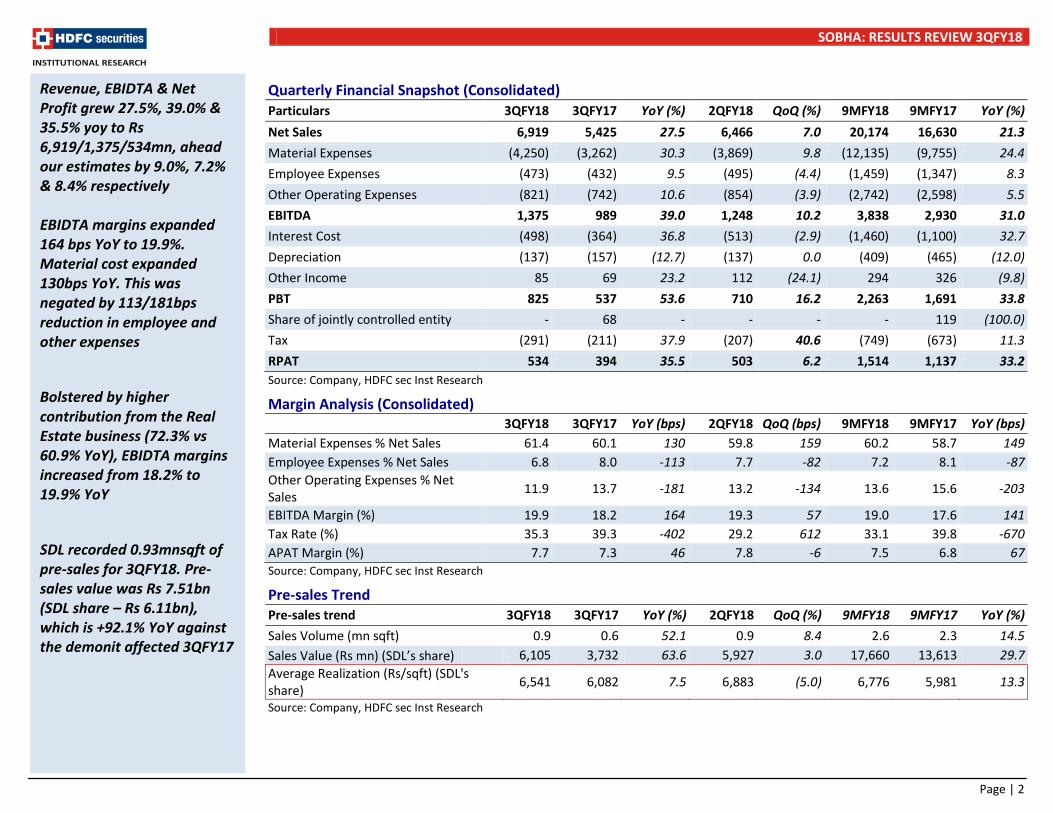
Quarterly Financial Snapshot (Consolidated) Particulars 3QFY18 3QFY17 YoY (%) 2QFY18 QoQ (%) 9MFY18 9MFY17 YoY (%) Net Sales 6,919 5,425 27.5 6,466 7.0 20,174 16,630 21.3 Material Expenses (4,250) (3,262) 30.3 (3,869) 9.8 (12,135) (9,755) 24.4 Employee Expenses (473) (432) 9.5 (495) (4.4) (1,459) (1,347) 8.3 Other Operating Expenses (821) (742) 10.6 (854) (3.9) (2,742) (2,598) 5.5 EBITDA 1,375 989 39.0 1,248 10.2 3,838 2,930 31.0 Interest Cost (498) (364) 36.8 (513) (2.9) (1,460) (1,100) 32.7 Depreciation (137) (157) (12.7) (137) 0.0 (409) (465) (12.0) Other Income 85 69 23.2 112 (24.1) 294 326 (9.8) PBT 825 537 53.6 710 16.2 2,263 1,691 33.8 Share of jointly controlled entity - 68 - - - - 119 (100.0) Tax (291) (211) 37.9 (207) 40.6 (749) (673) 11.3 RPAT 534 394 35.5 503 6.2 1,514 1,137 33.2 Source: Company, HDFC sec Inst Research
Margin Analysis (Consolidated)
3QFY18 3QFY17 YoY (bps) 2QFY18 QoQ (bps) 9MFY18 9MFY17 YoY (bps) Material Expenses % Net Sales 61.4 60.1 130 59.8 159 60.2 58.7 149 Employee Expenses % Net Sales 6.8 8.0 -113 7.7 -82 7.2 8.1 -87 Other Operating Expenses % Net Sales 11.9 13.7 -181 13.2 -134 13.6 15.6 -203
EBITDA Margin (%) 19.9 18.2 164 19.3 57 19.0 17.6 141 Tax Rate (%) 35.3 39.3 -402 29.2 612 33.1 39.8 -670 APAT Margin (%) 7.7 7.3 46 7.8 -6 7.5 6.8 67 Source: Company, HDFC sec Inst Research
Pre-sales Trend Pre-sales trend 3QFY18 3QFY17 YoY (%) 2QFY18 QoQ (%) 9MFY18 9MFY17 YoY (%) Sales Volume (mn sqft) 0.9 0.6 52.1 0.9 8.4 2.6 2.3 14.5 Sales Value (Rs mn) (SDL’s share)
6,105 3,732 63.6 5,927 3.0 17,660 13,613 29.7 Average Realization (Rs/sqft) (SDL's share) 6,541 6,082 7.5 6,883 (5.0) 6,776 5,981 13.3
Source: Company, HDFC sec Inst Research
Revenue, EBIDTA & Net Profit grew 27.5%, 39.0% & 35.5% yoy to Rs 6,919/1,375/534mn, ahead our estimates by 9.0%, 7.2% & 8.4% respectively EBIDTA margins expanded 164 bps YoY to 19.9%. Material cost expanded 130bps YoY. This was negated by 113/181bps reduction in employee and other expenses Bolstered by higher contribution from the Real Estate business (72.3% vs 60.9% YoY), EBIDTA margins increased from 18.2% to 19.9% YoY SDL recorded 0.93mnsqft of pre-sales for 3QFY18. Pre-sales value was Rs 7.51bn (SDL share – Rs 6.11bn), which is +92.1% YoY against the demonit affected 3QFY17

SOBHA: RESULTS REVIEW 3QFY18
Page | 3
Worst-case scenario: Consolidated net D/E peaks at 0.84x Net D/E increased marginally from 0.84x to 0.86x QoQ.
Net debt stood at Rs 23.3bn (+Rs 0.5bn QoQ). This was in line with investment in new opportunities. Customer collections improved to Rs 6.7bn for 3QFY18 vs 3QFY17 – Rs 6.2bn.
With an outlay of Rs 10bn expected for the APMC commercial project, net debt may increase further. In-line with SDL’s lean Capex guidance, it incurred Rs 71mn capex on commercial assets during 3QFY18 (9MFY18 – Rs 202mn vs Rs 128mn during 9MFY17).
Going forward, SDL may step up APMC capex (from FY19E).
While we remain cautious on rising debt levels, we expect SDL to monetize the non-core land bank to fund the Capex of the APMC project. SDL may not have near-term liquidity concerns, as cash flows from real estate/contractual business continue to be robust.
We expect consolidated gross debt to stabilize at the current level of Rs 24.3bn by FY20E. Net D/E will peak at 0.9x in a worst-case scenario.
Debt/Equity Ratio Trend (X) (Consolidated) (Rs mn) 1QFY16 2QFY16 3QFY16 4QFY16 1QFY17 2QFY17 3QFY17 4QFY17 1QFY18 2QFY18 3QFY18 Net debt (Rs mn) 20,300 20,968 20,666 20,604 20,250 20,602 20,838 20,736 20,247 22,832 23,276 Net D/E (x) 0.82 0.83 0.81 0.8 0.78 0.81 0.80 0.78 0.75 0.84 0.86 Cost of Debt % 12.5 12.14 11.98 11.83 11.58 11.26 10.99 10.42 10.06 9.88 9.74 Source: Company, HDFC sec Inst Research Real Estate collections improve
SDL’s customer collections from Real Estate development have increased in 3QFY18, and stand at Rs 4.90bn. The contractual segment witnessed a significant decrease in collections to ~Rs 1.9bn.
Collection demand will be higher for mid-cycle projects. This will alleviate pressure on the balance sheet and induce deleveraging.
Further, new launches during 4QFY18E in Bengaluru (0.8 mn sqft) and Thrissur (0.18 mn sqft) along with 5-7 launches planned in upcoming quarters will also support acceleration in customer collections, albeit at a slower pace. Demand for customer advances is ~15-20%, within three months of a new project launch.
Customer Collections (Rs mn) 1QFY16 2QFY16 3QFY16 4QFY16 1QFY17 2QFY17 3QFY17 4QFY17 1QFY18 2QFY18 3QFY18 Real Estate 3,238 4,134 4,021 3,964 4,131 4,907 4,331 4,860 5,740 4,330 4,870 Contractual 1,671 1,987 1,691 1,833 1,677 1,705 1,849 2,090 1,560 2,600 1,870 Total 4,909 6,121 5,712 5,797 5,808 6,612 6,180 6,950 7,300 6,930 6,740 Source: Company, HDFC sec Inst Research
Net D/E increased from 0.84x to 0.86x QoQ. Net debt stood at Rs 23.3bn (+Rs 0.5 bn QoQ). Customer collections improved to Rs 6.7bnfor 3QFY18 vs 3QFY17 – Rs 6.2bn Cost of debt has been consistently reducing for SDL (cumulative reduction of 276bps over the last 10 quarters), and stands at 9.74% as of end-2QFY18, a reduction of 14bps YoY SDL’s customer collections from real estate development have increased in 3QFY18, and stand at Rs 4.9bn. The contractual segment witnessed a dip in collections to ~Rs 1.9bn.

SOBHA: RESULTS REVIEW 3QFY18
Page | 4
Key Assumptions And Estimates Summary Of Key Assumptions And Estimates
Estimates Growth (%) Comments
FY18E FY19E FY20E FY18E FY19E FY20E Volume assumptions
Residential (mn sqft) 3.4 3.6 4.0 14.7 5.4 9.6
Expect marginal volume uptick on (1) Delay in Kochi & Chennai launches (2) Longish sales cycle in existing high-value unsold inventory of ~15.2mn sqft and (3) Slower demand are key contributing factors.
Total 3.4 3.6 4.0 14.7 5.4 9.6 Realisation Residential (Rs/sqft) 7,565 7,893 7,786 25.4 4.3 (1.4) Absolute realisation to remain flattish. Sharp jump on
account of change in product mix. Pre-sales Rs mn 26,046 28,629 30,949 43.8 9.9 8.1 Pre-sales to see gradual pickup Earnings forecast
Sales (Rs mn) 18,415 19,744 24,327 23.7 7.2 23.2
Slower pre-sales velocity and unrecognised revenue of Rs 98bn (3yrs time for completion) to result in back-ended revenue growth. Pre-sales acceleration is necessary to deliver growth
Contractual 7,298 7,663 7,297 (3.7) 5.0 (4.8) Flattish growth in contracting business as Infosys business decreasing.
Total 25,713 27,407 31,624 14.5 6.6 15.4 FY18-20E revenue CAGR at 10.9%.
EBIDTA Real Estate (Rs mn) 3,833 4,182 4,914 25.2 9.1 17.5 13.2% FY18-20E EBIDTA CAGR
EBIDTA Contract (Rs mn) 1,095 1,150 1,095 (3.7) 5.0 (4.8) De-growth in contracting EBIDTA, as non-Infosys business has about 200bps lower EBIDTA margins.
Total EBIDTA (Rs mn) 4,928 5,331 6,009 17.4 8.2 12.7 10.4% FY18-20E EBIDTA CAGR. EBIDTA margin Real Estate(%) 20.8 21.2 20.2 24.2 36.5 (97.8) EBIDTA margin Contract(%) 15.0 15.0 15.0 - - - EBIDTA Margin (%) 19.2 19.5 19.0 47.1 28.8 (45.1) Change in mix to drive EBIDTA margins.
Expect marginal volume growth owing to (1) Delay in Kochi and Chennai launches (2) Longish sales cycle in existing high-value unsold inventory of ~15.2mn sqft and (3) Slower demand Absolute realisation to remain flattish. Product mix is the key driver of YoY growth Slower pre-sales velocity and Unrecognized revenue of Rs 98bn (3yrs time to completion) to result in back ended revenue growth. Pre-sale acceleration necessary to deliver growth SDL to report blended EBIDTA margins of 19-20%

SOBHA: RESULTS REVIEW 3QFY18
Page | 5
Estimates Growth (%) Comments FY18E FY19E FY20E FY18E FY19E FY20E
Net interest expense* 2,034 2,099 2,127 35.9 3.2 1.3 Interest to increase, as debt may inch up on account of APMC capex and payment for Kochi land to Puravankara.
Avg. interest rate (%) 8.7 8.7 8.9 194.0 0.0 11.5 Average interest cost lower, as we build in 30% interest cost capitalisation
PAT (Rs mn) 1,886 2,136 2,569 13.1 13.3 20.3 16.7% FY18-20E PAT CAGR PAT Margin (%) 7.3 7.8 8.1 (8.6) 46.1 32.9 Change in PAT margins in-line with overall estimates. EPS (Rs) 19.6 22.2 26.7 13.1 13.3 20.3 Source: Company, HDFC sec Inst Research Cash Flow Forecast
Rs mn Estimates Comments
FY18E FY19E FY20E Cash flows forecast CFO ( a) 372 5,076 5,861 CFI – (b) (392) (1,880) (3,427) Capex of Rs 10bn to be incurred on the
APMC project over 3-4 years FCF (a+b) (19) 3,195 2,434 Strong cash flow recovery during FY18-20E
CFF (c) 66 (3,251) (2,152) Interest outflow to impact cash flow negatively
Total change in cash (a+b+c) 47 (56) 282 The net change in cash doesn’t impact the debt position materially
Source: Company, HDFC sec Inst Research
16.7% FY18-20E PAT CAGR Strong cash flows from operations to be spent on land acquisition, Rs 10bn capex on APMC project and interest payment Cash flow shortfall to be made up with higher borrowings. We expect net D/E to reduce to 0.7x during FY20E
SOBHA: RESULTS REVIEW 3QFY18
Page | 6
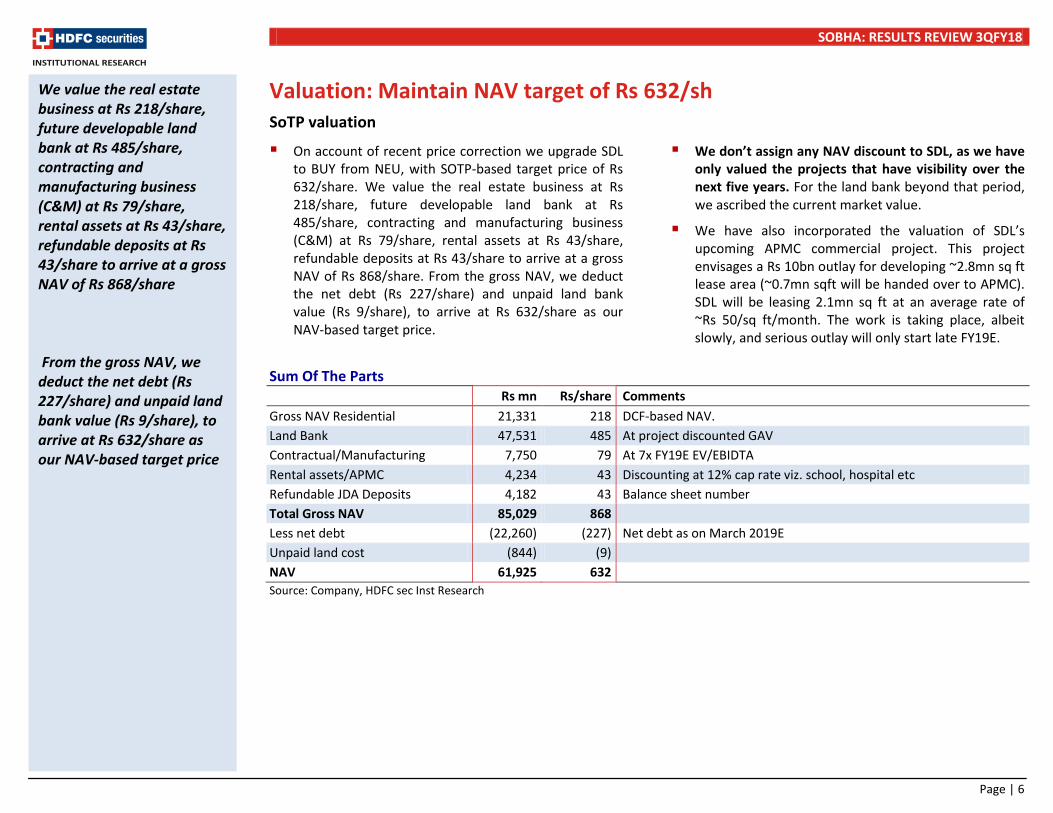
Valuation: Maintain NAV target of Rs 632/sh SoTP valuation
On account of recent price correction we upgrade SDL to BUY from NEU, with SOTP-based target price of Rs 632/share. We value the real estate business at Rs 218/share, future developable land bank at Rs 485/share, contracting and manufacturing business (C&M) at Rs 79/share, rental assets at Rs 43/share, refundable deposits at Rs 43/share to arrive at a gross NAV of Rs 868/share. From the gross NAV, we deduct the net debt (Rs 227/share) and unpaid land bank value (Rs 9/share), to arrive at Rs 632/share as our NAV-based target price.
We don’t assign any NAV discount to SDL, as we have only valued the projects that have visibility over the next five years. For the land bank beyond that period, we ascribed the current market value.
We have also incorporated the valuation of SDL’s upcoming APMC commercial project. This project envisages a Rs 10bn outlay for developing ~2.8mn sq ft lease area (~0.7mn sqft will be handed over to APMC). SDL will be leasing 2.1mn sq ft at an average rate of ~Rs 50/sq ft/month. The work is taking place, albeit slowly, and serious outlay will only start late FY19E.
Sum Of The Parts Rs mn Rs/share Comments Gross NAV Residential 21,331 218 DCF-based NAV. Land Bank 47,531 485 At project discounted GAV Contractual/Manufacturing 7,750 79 At 7x FY19E EV/EBIDTA Rental assets/APMC 4,234 43 Discounting at 12% cap rate viz. school, hospital etc Refundable JDA Deposits 4,182 43 Balance sheet number Total Gross NAV 85,029 868 Less net debt (22,260) (227) Net debt as on March 2019E Unpaid land cost (844) (9) NAV 61,925 632 Source: Company, HDFC sec Inst Research
We value the real estate business at Rs 218/share, future developable land bank at Rs 485/share, contracting and manufacturing business (C&M) at Rs 79/share, rental assets at Rs 43/share, refundable deposits at Rs 43/share to arrive at a gross NAV of Rs 868/share From the gross NAV, we deduct the net debt (Rs 227/share) and unpaid land bank value (Rs 9/share), to arrive at Rs 632/share as our NAV-based target price

SOBHA: RESULTS REVIEW 3QFY18
Page | 7
Real estate development: NAV calculation methodology
We have divided SDL’s entire land bank into current and future developments (based on information from the company).
We have arrived at the sales price/sq ft and the anticipated sales volumes for each project, based on our discussions with industry experts.
We have deducted the cost of construction, based on our assumed cost estimates, which have been arrived at after discussions with industry experts.
We have further deducted marketing and other costs, which have been assumed at 5% of the sales’ revenue.
We have then deducted income tax, based on the tax applicable for the project.
The resultant cash inflows at the project level have been discounted based on WACC of 13.5% (cost of equity 17.2% based on beta of 1.5, cost of debt 13% and debt/equity ratio of 0.85x). All the project-level NAVs have been summed up to arrive at the NAV of the company.
In case of a future land bank, we have valued at 20% discount to current prices, and not taken into account construction margins.
For annuity income-generating assets, we have valued cash flows at a cap rate of 12%.
From the NAV, we have deducted the net debt as of FY19E, to arrive at the final valuation of the company.
Key valuation assumptions
In the exhibit below, we highlight our sales and cost inflation forecasts. We expect property prices to appreciate in-line with WPI inflation, i.e. 5%, and the cost of construction to grow at 6%. We forecast other costs including marketing, SGA and employee cost at 5% of sales.
Base Case Assumptions (%) Discount rate 16.1 Annual rate of inflation-sales price 5 Annual rate of inflation-cost of construction 6 Other costs – marketing, SGA, employee cost (as % of sales) 5
Tax rate (%) 33 Source: Company, HDFC sec Inst Research
In the exhibit below, we highlight our sales price and construction cost forecasts. Our pricing assumptions are at 10-20% discount to the currently prevailing prices.
Base Price And Construction Cost Assumptions
Location Prices
Rs/sq ft Cost
Rs/sq ft Bengaluru 5,500 2,400 Mysore 3,700 1,800 Pune 4,800 2,200 Chennai 4,900 2,200 Kochi 6,500 3,000 Hosur 4,500 1,800 Thrissur 4,500 2,200 Coimbatore 4,400 2,200 Gurgaon 7,500 3,425 Calicut 4,500 1,800 Source: Company, HDFC sec Inst Research
Our base property price assumption is at a 10-20% discount to current prices in SDL’s key macro markets

SOBHA: RESULTS REVIEW 3QFY18
Page | 8
NAV sensitivity analysis Sensitivity to our assumption of property prices
Our model is sensitive to changes in the assumptions regarding property prices. For every 1% change in the base property prices, the NAV will change by approximately 2.5%.
NAV Sensitivity To Change In Average Sale Price % change in sale price (10) (5) 0 5 10
NAV/share (Rs) 465 551 632 713 799 Change in NAV (%) (26.4) (12.9) - 12.8 26.5 Source: Company, HDFC sec Inst Research
Sensitivity of NAV to changes in sales inflation
In our base case, we have assumed an annual sales price inflation of 5%. For every 100bps increase in the annual sale price inflation, the NAV will increase by approximately 20.4%.
NAV Sensitivity To Change In Sales Inflation Sales inflation rates (%) 3 4 5 6 7
NAV/share (Rs) 398 513 632 761 904 Change in NAV (%) (37.0) (18.8) - 20.4 43.0 Source: Company, HDFC sec Inst Research
Sensitivity of NAV to changes in cost inflation
In our base case, we have assumed cost inflation to be 6%. For every 100bps increase in construction cost inflation, the NAV will change by approximately 12.1%.
NAV Sensitivity To Change In Cost Inflation Cost inflation rates (%) 4 5 6 7 8 NAV/share (Rs) 763 703 632 555 478 Change in NAV (%) 20.8 11.3 - (12.1) (24.4) Source: Company, HDFC sec Inst Research
The combined impact of a 100bps increase in sales price inflation and cost inflation will be an increase in NAV of 8.3%.
Sensitivity of NAV to changes in discount rate
In our base case, we have assumed a discount rate of 15%. For every 100bps increase in the discount rate, NAV will fall by 4.7%.
NAV Sensitivity To Change In WACC WACC rates (%) 12 13 14 15 16 NAV/share (Rs) 695 663 632 603 577 Change in NAV (%) 10.0 4.9 - (4.7) (8.8) Source: Company, HDFC sec Inst Research
1% increase in average base sales price impacts our NAV positively by 2.5% Every 100bps increase in sales price inflation impacts our NAV positively by 20.4% 100bps increase in cost inputs decreases our NAV by 12.1% 100bps increase in discounting rate impacts our NAV negatively by 4.7%

SOBHA: RESULTS REVIEW 3QFY18
Page | 9
Income Statement (Consolidated) Year ending March (Rs mn) FY16 FY17 FY18E FY19E FY20E Net Sales 19,566 22,462 25,713 27,407 31,624 Growth (%) (19.8) 14.8 14.5 6.6 15.4 Material Expenses 10,243 13,190 15,257 16,594 19,751 Employee Expenses 1,762 1,779 2,186 2,330 2,694 Other Operating Expenses 3,131 3,294 3,343 3,152 3,170 EBIDTA 4,429 4,199 4,928 5,331 6,009 EBIDTA (%) 22.6 18.7 19.2 19.5 19.0 EBIDTA Growth (%) (28.2) (5.2) 17.4 8.2 12.7 Other Income 343 386 405 416 408 Depreciation 597 638 540 504 486 EBIT 4,175 3,947 4,793 5,243 5,931 Interest 1,637 1,497 2,034 2,099 2,127 PBT 2,539 2,450 2,759 3,143 3,804 Tax 1,188 970 938 1,069 1,293 PAT 1,350 1,480 1,821 2,075 2,511 Share of profits 30 129 65 61 58 EO items (net of tax) 89 58 - - - APAT 1,469 1,667 1,886 2,136 2,569 APAT Growth (%) (38.3) 13.4 13.1 13.3 20.3 EPS 15.0 17.3 19.6 22.2 26.7 EPS Growth (%) (38.3) 15.5 13.1 13.3 20.3 Source: Company, HDFC sec Inst Research
Balance Sheet (Consolidated) As at March (Rs mn) FY16 FY17 FY18E FY19E FY20E SOURCES OF FUNDS Share Capital 981 963 963 963 963 Reserves 24,667 25,482 27,367 28,952 30,896 Total Shareholders’ Funds 25,648 26,445 28,330 29,915 31,859 Minority Interest - - - - - Long Term Debt 20,586 22,219 24,319 23,719 24,319 Short Term Debt 1,216 - - - - Total Debt 21,803 22,219 24,319 23,719 24,319 Deferred Taxes 2,361 2,684 2,684 2,684 2,684 Long Term Provisions & Others 249 163 163 163 163 TOTAL SOURCES OF FUNDS 50,062 51,511 55,497 56,482 59,026 APPLICATION OF FUNDS Net Block 3,729 3,173 3,131 3,127 3,141 CWIP 454 799 799 2,299 5,299 Goodwill - - - - - Investments, LT Loans & Advances 293.9 0.2 0.2 0.2 0.2
Investment Property 1,997.0 1,979.5 2,276 2,572 2,907 Other Non Current Assets 4,888.3 4,860.0 5,103 5,333 5,455 Inventories 42,649 50,960 52,250 53,647 54,112 Debtors 2,522 2,267 2,818 3,004 3,474 Cash & Equivalents 1,185 1,468 1,515 1,460 1,742 ST Loans & Advances, Others 22,906 23,423 25,373 27,023 27,973 Total Current Assets 69,262 78,118 81,957 85,134 87,300 Creditors 3,182 7,693 8,078 8,320 8,820 Other Current Liabilities & Provns 27,380 29,726 29,692 33,663 36,258 Total Current Liabilities 30,563 37,419 37,770 41,984 45,077 Net Current Assets 38,699 40,699 44,187 43,150 42,223 Misc Expenses & Others - - - - - TOTAL APPLICATION OF FUNDS 50,062 51,511 55,497 56,482 59,026 Source: Company, HDFC sec Inst Research
SOBHA: RESULTS REVIEW 3QFY18
Page | 10
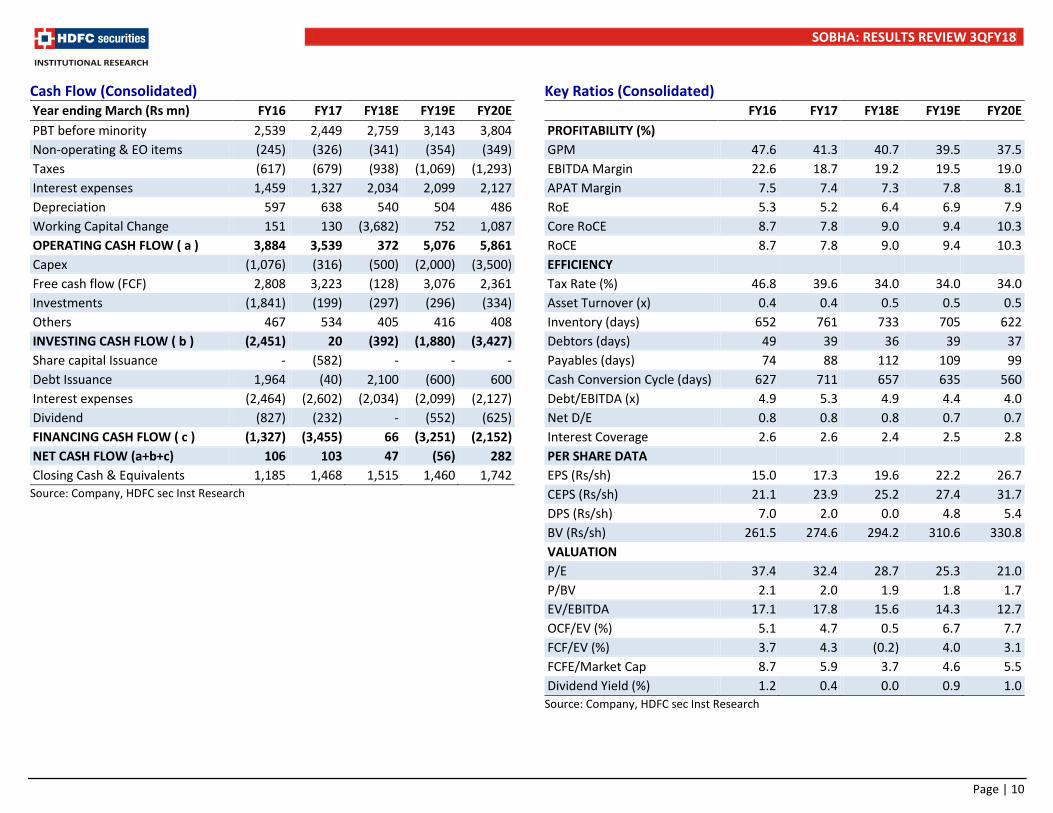
Cash Flow (Consolidated) Year ending March (Rs mn) FY16 FY17 FY18E FY19E FY20E PBT before minority 2,539 2,449 2,759 3,143 3,804 Non-operating & EO items (245) (326) (341) (354) (349) Taxes (617) (679) (938) (1,069) (1,293) Interest expenses 1,459 1,327 2,034 2,099 2,127 Depreciation 597 638 540 504 486 Working Capital Change 151 130 (3,682) 752 1,087 OPERATING CASH FLOW ( a ) 3,884 3,539 372 5,076 5,861 Capex (1,076) (316) (500) (2,000) (3,500) Free cash flow (FCF) 2,808 3,223 (128) 3,076 2,361 Investments (1,841) (199) (297) (296) (334) Others 467 534 405 416 408 INVESTING CASH FLOW ( b ) (2,451) 20 (392) (1,880) (3,427) Share capital Issuance - (582) - - - Debt Issuance 1,964 (40) 2,100 (600) 600 Interest expenses (2,464) (2,602) (2,034) (2,099) (2,127) Dividend (827) (232) - (552) (625) FINANCING CASH FLOW ( c ) (1,327) (3,455) 66 (3,251) (2,152) NET CASH FLOW (a+b+c) 106 103 47 (56) 282 Closing Cash & Equivalents 1,185 1,468 1,515 1,460 1,742 Source: Company, HDFC sec Inst Research
Key Ratios (Consolidated)
FY16 FY17 FY18E FY19E FY20E PROFITABILITY (%) GPM 47.6 41.3 40.7 39.5 37.5 EBITDA Margin 22.6 18.7 19.2 19.5 19.0 APAT Margin 7.5 7.4 7.3 7.8 8.1 RoE 5.3 5.2 6.4 6.9 7.9 Core RoCE 8.7 7.8 9.0 9.4 10.3 RoCE 8.7 7.8 9.0 9.4 10.3 EFFICIENCY Tax Rate (%) 46.8 39.6 34.0 34.0 34.0 Asset Turnover (x) 0.4 0.4 0.5 0.5 0.5 Inventory (days) 652 761 733 705 622 Debtors (days) 49 39 36 39 37 Payables (days) 74 88 112 109 99 Cash Conversion Cycle (days) 627 711 657 635 560 Debt/EBITDA (x) 4.9 5.3 4.9 4.4 4.0 Net D/E 0.8 0.8 0.8 0.7 0.7 Interest Coverage 2.6 2.6 2.4 2.5 2.8 PER SHARE DATA EPS (Rs/sh) 15.0 17.3 19.6 22.2 26.7 CEPS (Rs/sh) 21.1 23.9 25.2 27.4 31.7 DPS (Rs/sh) 7.0 2.0 0.0 4.8 5.4 BV (Rs/sh) 261.5 274.6 294.2 310.6 330.8 VALUATION P/E 37.4 32.4 28.7 25.3 21.0 P/BV 2.1 2.0 1.9 1.8 1.7 EV/EBITDA 17.1 17.8 15.6 14.3 12.7 OCF/EV (%) 5.1 4.7 0.5 6.7 7.7 FCF/EV (%) 3.7 4.3 (0.2) 4.0 3.1 FCFE/Market Cap 8.7 5.9 3.7 4.6 5.5 Dividend Yield (%) 1.2 0.4 0.0 0.9 1.0
Source: Company, HDFC sec Inst Research

SOBHA: RESULTS REVIEW 3QFY18
Page | 11
Rating Definitions
BUY : Where the stock is expected to deliver more than 10% returns over the next 12 month period NEUTRAL : Where the stock is expected to deliver (-)10% to 10% returns over the next 12 month period SELL : Where the stock is expected to deliver less than (-)10% returns over the next 12 month period
Date CMP Reco Target 10-Feb-17 281 BUY 381 13-Apr-17 378 NEU 381 17-May-17 421 BUY 500 8-Aug-17 384 BUY 500 11-Oct-17 421 BUY 500 13-Nov-17 500 BUY 572 12-Jan-18 592 NEU 632 13-Feb-18 561 BUY 632
150
250
350
450
550
650
750
Feb-
17
Mar
-17
Apr-
17
May
-17
Jun-
17
Jul-1
7
Aug-
17
Sep -
17
Oct
-17
Nov-
17
Dec -
17
Jan-
18
Feb-
18
Sobha TP
RECOMMENDATION HISTORY

SOBHA: RESULTS REVIEW 3QFY18
Page | 12
Disclosure: We, Parikshit Kandpal, MBA, and Kunal Bhandari, CA, authors and the names subscribed to this report, hereby certify that all of the views expressed in this research report accurately reflect our views about the subject issuer(s) or securities. HSL has no material adverse disciplinary history as on the date of publication of this report. We also certify that no part of our compensation was, is, or will be directly or indirectly related to the specific recommendation(s) or view(s) in this report. Research Analyst or his/her relative or HDFC Securities Ltd. does not have any financial interest in the subject company. Also Research Analyst or his relative or HDFC Securities Ltd. or its Associate may have beneficial ownership of 1% or more in the subject company at the end of the month immediately preceding the date of publication of the Research Report. Further Research Analyst or his relative or HDFC Securities Ltd. or its associate does not have any material conflict of interest. Any holding in stock –No HDFC Securities Limited (HSL) is a SEBI Registered Research Analyst having registration no. INH000002475. Disclaimer: This report has been prepared by HDFC Securities Ltd and is meant for sole use by the recipient and not for circulation. The information and opinions contained herein have been compiled or arrived at, based upon information obtained in good faith from sources believed to be reliable. Such information has not been independently verified and no guaranty, representation of warranty, express or implied, is made as to its accuracy, completeness or correctness. All such information and opinions are subject to change without notice. This document is for information purposes only. Descriptions of any company or companies or their securities mentioned herein are not intended to be complete and this document is not, and should not be construed as an offer or solicitation of an offer, to buy or sell any securities or other financial instruments. This report is not directed to, or intended for display, downloading, printing, reproducing or for distribution to or use by, any person or entity who is a citizen or resident or located in any locality, state, country or other jurisdiction where such distribution, publication, reproduction, availability or use would be contrary to law or regulation or what would subject HSL or its affiliates to any registration or licensing requirement within such jurisdiction. If this report is inadvertently send or has reached any individual in such country, especially, USA, the same may be ignored and brought to the attention of the sender. This document may not be reproduced, distributed or published for any purposes without prior written approval of HSL. Foreign currencies denominated securities, wherever mentioned, are subject to exchange rate fluctuations, which could have an adverse effect on their value or price, or the income derived from them. In addition, investors in securities such as ADRs, the values of which are influenced by foreign currencies effectively assume currency risk. It should not be considered to be taken as an offer to sell or a solicitation to buy any security. HSL may from time to time solicit from, or perform broking, or other services for, any company mentioned in this mail and/or its attachments. HSL and its affiliated company(ies), their directors and employees may; (a) from time to time, have a long or short position in, and buy or sell the securities of the company(ies) mentioned herein or (b) be engaged in any other transaction involving such securities and earn brokerage or other compensation or act as a market maker in the financial instruments of the company(ies) discussed herein or act as an advisor or lender/borrower to such company(ies) or may have any other potential conflict of interests with respect to any recommendation and other related information and opinions. HSL, its directors, analysts or employees do not take any responsibility, financial or otherwise, of the losses or the damages sustained due to the investments made or any action taken on basis of this report, including but not restricted to, fluctuation in the prices of shares and bonds, changes in the currency rates, diminution in the NAVs, reduction in the dividend or income, etc. HSL and other group companies, its directors, associates, employees may have various positions in any of the stocks, securities and financial instruments dealt in the report, or may make sell or purchase or other deals in these securities from time to time or may deal in other securities of the companies / organizations described in this report. HSL or its associates might have managed or co-managed public offering of securities for the subject company or might have been mandated by the subject company for any other assignment in the past twelve months. HSL or its associates might have received any compensation from the companies mentioned in the report during the period preceding twelve months from t date of this report for services in respect of managing or co-managing public offerings, corporate finance, investment banking or merchant banking, brokerage services or other advisory service in a merger or specific transaction in the normal course of business. HSL or its analysts did not receive any compensation or other benefits from the companies mentioned in the report or third party in connection with preparation of the research report. Accordingly, neither HSL nor Research Analysts have any material conflict of interest at the time of publication of this report. Compensation of our Research Analysts is not based on any specific merchant banking, investment banking or brokerage service transactions. HSL may have issued other reports that are inconsistent with and reach different conclusion from the information presented in this report. Research entity has not been engaged in market making activity for the subject company. Research analyst has not served as an officer, director or employee of the subject company. We have not received any compensation/benefits from the subject company or third party in connection with the Research Report. HDFC securities Limited, I Think Techno Campus, Building - B, "Alpha", Office Floor 8, Near Kanjurmarg Station, Opp. Crompton Greaves, Kanjurmarg (East), Mumbai 400 042 Phone: (022) 3075 3400 Fax: (022) 2496 5066 Compliance Officer: Binkle R. Oza Email: [email protected] Phone: (022) 3045 3600 HDFC Securities Limited, SEBI Reg. No.: NSE-INB/F/E 231109431, BSE-INB/F 011109437, AMFI Reg. No. ARN: 13549, PFRDA Reg. No. POP: 04102015, IRDA Corporate Agent License No.: HDF 2806925/HDF C000222657, SEBI Research Analyst Reg. No.: INH000002475, CIN - U67120MH2000PLC152193 Mutual Funds Investments are subject to market risk. Please read the offer and scheme related documents carefully before investing.
SOBHA: RESULTS REVIEW 3QFY18
Page | 13
HDFC securities Institutional Equities Unit No. 1602, 16th Floor, Tower A, Peninsula Business Park, Senapati Bapat Marg, Lower Parel,Mumbai - 400 013 Board : +91-22-6171 7330www.hdfcsec.com