retail market demand analysis for 2031 …...retail market demand analysis for 2031 bolton ,ontario...
TRANSCRIPT
RETAIL MARKET DEMAND ANALYSIS FOR 2031
BOLTON ,ONTARIO May 30, 2014
PREPARED FOR: The Town of Caledon Ontario
KIRCHER Research Associates Ltd.
Land Use & Retail Economists
KIRCHER Research Associates Ltd.
1 Alderdale Court Toronto, Ontario Canada M3B 2H8
Telephone (416) 867-3141 E-mail [email protected]
L a n d U s e & R e t a i l E c o n o m i s t s
Toronto, May 30th, 2014 Mr. Haiqing Xu Manager Policy & Sustainability Development Approval & Planning Policy Town of Caledon 6311 Old Church Road Caledon, ON L7C 1J6 . Dear Mr. Xu Re: Determination of Retail Space Warranted in Bolton Residential Expansion Areas We have conducted market research pertaining to the future retail space requirements in Bolton, in order to determine the type and size of retail and related service space that should be included in the Residential Expansion Areas of Bolton. They are referred to as Option 1, comprising a land area of 151 ha and Option 3, with a land area of 165 ha, plus 3 ROA’s. This letter summarizes our findings and recommendations. Our research included an inventory of all retail and related service space located in Bolton. We have also conducted a License Plate Survey at the main retail areas in Bolton, in order to determine local capture rates and inflow of retail volume from beyond the Bolton urban area. It is our finding that approximately 50% of the retail sales made in Bolton are derived from customers residing outside the Bolton urban area, reflecting the strong regional customer attraction of the large plate retailers such as the Wal-Mart Supercentre, Canadian Tire, Home Depot and Zehrs. We have completed a market analysis that resulted in the determination of warranted retail space by 2031. The population of Bolton, at the most recent Census in 2011, stood at 27,900 persons. Based on current plans, it is expected to increase to approximately 39,900 persons by 2031, an increase of about 12,000 persons. Most of this increase in population is expected to occur between 2021 and 2031. Two distinct geographic areas have been identified as alternative locations to accommodate the expected population growth, either Option 1 or Option 3 as described in this study. The amount of retail space warranted at either Option area depends largely on the total retail demand available in future years in all of Bolton. Therefore, we have determined the amount of retail and associated service space in Bolton, by 2031, the target year for this study. The Town of Caledon has determined the increase in population that is expected to locate in Bolton by 2031. However, since most of the new population for either Option Area 1 or 3 will establish themselves after 2021, the recommended space should not be built before 2021. In fact a substantial portion of the expected population in either Option area will have to be in place before a major retail development is economically feasible.
Mr. Haiqing Xu May 30th, 2014 Page 2
As determined in the market analysis contained in the body of this study, the total additional retail and related service space warranted in Bolton, by 2031, consists of: Supermarket & Grocery Stores 72,000 square feet Non-Department Store GAFO Retailers (see Table E-6) 217,000 square feet Pharmacy & Personal Care Stores 39,000 square feet Beer, Wine & Liquor Stores 15,000 square feet Building & Outdoor Home Supply Stores 75,000 square feet Services 238,000 square feet TOTAL 656,000 square feet Shopping through the internet is having a major impact on the demand for traditional store space resulting in some store closures. Furthermore, many retailers are downsizing their store sizes but at the same time adding electronic terminals to their stores to offer the whole range of merchandise they sell. With few exceptions, most retail categories and related services are experiencing a volume transfer from ‘Bricks & Mortar’ space to the internet. Typical retail service levels i.e. the amount of retail/service space per capita, range between 30 and 50 square feet in Canadian urban areas. In the case of Bolton, it is currently about 60 square feet per capita (Inventory 1,677,700 square feet – Population 28,000). However, as demonstrated by the license plate survey, a large proportion of the sales achieved by Bolton stores are derived from outside Bolton. We estimate the current replacement of traditional retail space by the internet to range between 1 and 2 square feet per capita. It is growing very rapidly and is expected to account for at least 10% of the average urban service ratio, or about 4 square feet, by 2031. As a minimum, we expect that the traditional demand for retail and related service space in Bolton will be reduced by some 80,000 square feet by 2031 due to the effect of internet shopping. This must be considered as a very conservative estimate. It would reduce the amount of warranted retail and related service space determined in the analysis from 656,000 square feet to 576,000 square feet. Bolton is currently well served by large scale retailers such as a Wal-Mart Supercentre, Canadian Tire Store and a Home Depot, all of which operate state-of-the-art, modern stores in Bolton. By the end of the study period, Bolton will not be large enough to warrant an additional store for these retailers. Loblaw’s is also well represented in Bolton with a large Zehrs Supermarket that is up to date. Loblaw owns a large property next to Wal-Mart that is zoned for a supermarket. This zoning has been in place for several years. Loblaw’s current plans are unknown. The existing large scale stores in Bolton represent the full range of such stores for markets of similar size. In order to develop a retail complex exceeding about 300,000 square feet, it is necessary to attract at least one major tenant with a size of 80,000-100,000 square feet. In our opinion, there is currently no retailer not already represented in Bolton, which would fit that profile. There are additional large plate retailers operating in Ontario such as IKEA, Costco, The Bay, Sears, and Target but the Bolton market is too small for such retailers. The lack of a large anchor store limits the amount of space that can be built under either development Options.
Mr. Haiqing Xu May 30th, 2014 Page 3
The amount of retail space recommended in either of the two Option areas is estimated at about 350,000 square feet. The balance of the warranted space is expected to locate within the existing commercial corridor where there is available land, some of which is already commercially zoned. Some retailers, not yet established in Bolton, or new retailers entering the market between 2013 and 2031, will likely prefer to be near the existing major commercial draws in Bolton rather than at more suburban locations such as the identified Option areas. Furthermore, the retail vacancy level in Bolton is above normal and some of the future demand could locate into currently vacant premises. The amount of recommended space for the Option areas should consist of a single major centre comprising between 250,000 and 300,000 square feet, with the balance being distributed to convenience locations. The major centre should include a supermarket and specialty food store space, pharmacy and personal care store space, including a drug store, family clothing stores, other GAFO retailers, a hardware store as well as a liquor or beer store, and a large range of retail related services. The principal commercial facilities under Option 3 could be located at or near the future transit station. Under Option 1, the principal retail facilities should have access and exposure to Highway 50. Because of the good regional accessibility of a retail centre under Option 1, it may be possible to increase the retail space in that area, particularly if an additional mid-size retailer, such as a furniture warehouse or major sporting goods store can be attracted. In that case, the retail and related service commercial space under Option 1 could be increased to about 400,000 square feet. Any retail development of significant size will not only serve the population locating in either Option area but also existing population in nearby residential areas. Every significant retail development entering the Bolton market will initially impact existing retail centres and the Downtown area. Due to the location of the Option areas and their likely retail development size and type, we do not expect a measurable impact on the existing major retail facilities in the southern part of Bolton. Any impact on retail and service space located Downtown Bolton will be minor, i.e. a small reduction of sales, and of short duration, because of the expected new population in the Option areas. Due to proximity, the impact of a commercial development under Option 1, on the Downtown, would be slightly larger than that caused by such a development on Option 3 lands. However, it is worth noting that Bolton added some 500,000 square feet of modern retail space between 2002 and 2014, while the retail space in the Downtown area remained relatively stable. We appreciate the opportunity to prepare this market overview as an input into your overall plan for Option 1 or 3 lands and are looking forward to discussing our recommendations with you.
TABLE OF CONTENTS
SECTION 1 Introduction........................................................................................................1
SECTION 2 Site and Access ..................................................................................................3
SECTION 3 Study Area .........................................................................................................6
SECTION 4 Study Area Population .......................................................................................8
SECTION 5 Study Area Income ..........................................................................................11
SECTION 6 Study Area Food Store Expenditure Potential .................................................14
SECTION 7 Supermarket and Grocery Store Residual Demand Analysis ..........................18
SECTION 8 Study Area GAFO Store Expenditure Potential ..............................................23
SECTION 9 Non-Department Store GAFO Residual Demand Analysis.............................27
SECTION 10 Pharmacy and Personal Care Store Residual Demand Analysis .....................33
SECTION 11 Beer, Wine and Liquor Store Residual Demand Analysis...............................38
SECTION 12 Building and Outdoor Home Supply Store Residual Demand Analysis .........42
SECTION 13 Services ............................................................................................................47
APPENDIX A Review of Competitive Retail Facilities ..........................................................49
APPENDIX B Licence Plate Surveys ......................................................................................53
APPENDIX C Historic Real Growth in Retail Expenditures ..................................................56
APPENDIX D Elasticity of Retail Expenditures to Income ....................................................63
APPENDIX E Basic Assumptions and Definition of Terms ...................................................71

SECTION 1
INTRODUCTION
Bolton Market Study
Kircher Research Associates Ltd. Page 1
SECTION 1
INTRODUCTION
This Retail Market Study of Bolton has been prepared for the Town of Caledon, Ontario and is
dated May 30th, 2014. It consists of a market potential analysis of warranted retail and related
service space in Bolton in total and in the identified Residential Expansion Areas, by the year
2031.
Bolton is undertaking a Residential Expansion Study and has identified two suburban areas, as
alternative locations. These may be potentially suitable to accommodate the expected increase in
population to 2031, totalling about 12,000 persons. They are referred to as Option 1, comprised
of a land area consisting of 151 ha located along Queen Street in the northern part of Bolton; and
Option 3, which includes a land area of 165 ha, located along King Street in the western part of
Bolton, as well as 3 ROA’s.
The primary task of this retail study is to determine the size and type of retail facilities warranted
at either expansion area location. Since the total population increase is essentially identical
between the two options, access, proximity to nearby existing population areas, impact on the
Downtown and the location of other existing and proposed retail facilities will have to be taken
into consideration.
Study Approach
The method used to evaluate the market demand for future retail facilities in Bolton is similar to
that used by Kircher Research Associates Ltd. in other studies completed throughout Canada.
The research approach employed in this study has proven to be an appropriate means of
evaluating future retail demand, employing both quantitative and qualitative considerations. The
major components of the study include the following:
A detailed inventory of existing competitive retail facilities located in Bolton was
prepared in May 2014.
May 1-3, 2014, License Plate Surveys were conducted at the major retail facilities
in Bolton.

Bolton Market Study
Kircher Research Associates Ltd. Page 2
Historic, current and forecast population levels in the Bolton were determined for
selected time intervals between 2006 and 2031.
The current average per capita income levels of Bolton residents were calculated
and were used to estimate their current per capita expenditure levels for various
retail categories. Estimated real growth rates in retail expenditures were then used
to develop future retail expenditure levels.
The total retail expenditures of Study Area residents for the various retail categories
were calculated by multiplying the current and forecast population levels in the
Study Area by the corresponding current and future retail expenditure levels.
Based on the total demand for retail and related service space in Bolton, by 2031,
we have then determined the warranted space at either Option 1 or Option 3
locations.
In any study requiring estimates of future conditions, it is necessary to make certain specific
assumptions. These have been stated where appropriate in this study. In addition, there are a
number of basic and underlying assumptions which have been stated. These assumptions and
definitions, phrases and concepts used in this study should be fully understood in order to avoid
any misunderstanding. They have been summarized in Appendix E.
SECTION 2
SITE AND ACCESS
Bolton Market Study
Kircher Research Associates Ltd. Page 3
SECTION 2
SITE AND ACCESS
In a standard retail market study, it is necessary to review site characteristics and access patterns
of the development site under study, in order to evaluate the future retail market potential. In this
case, the total 2031 retail market demand for Bolton has been determined and employed to
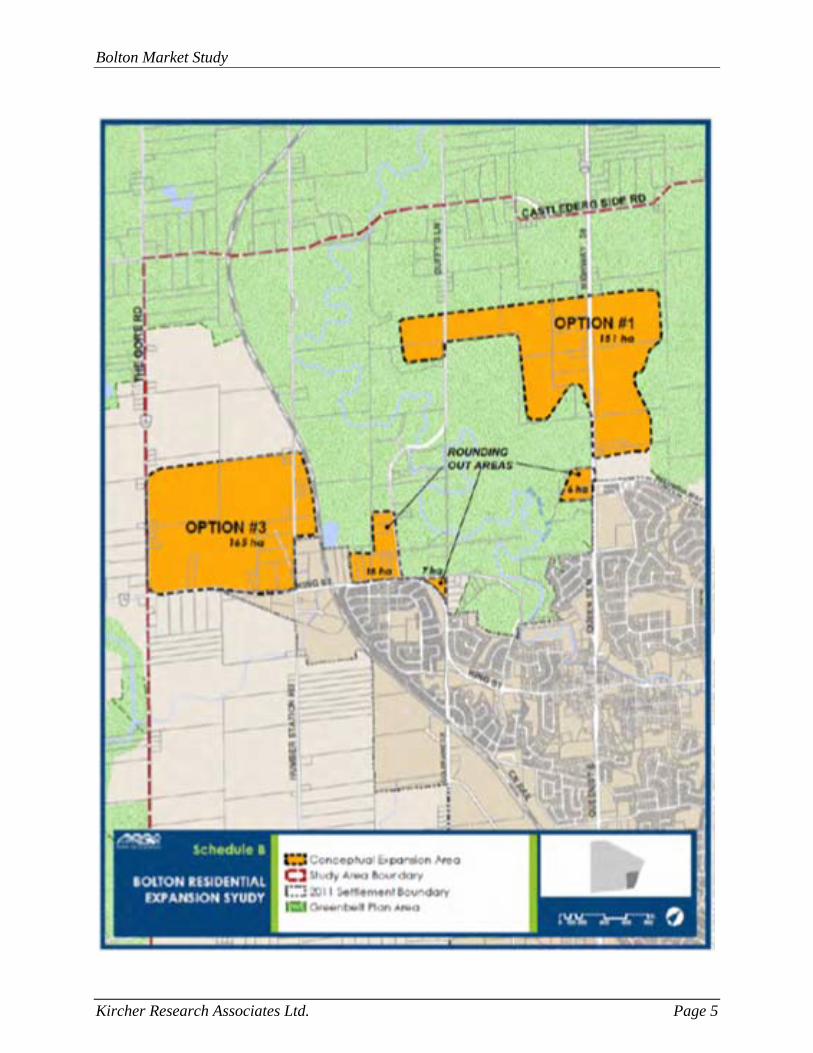
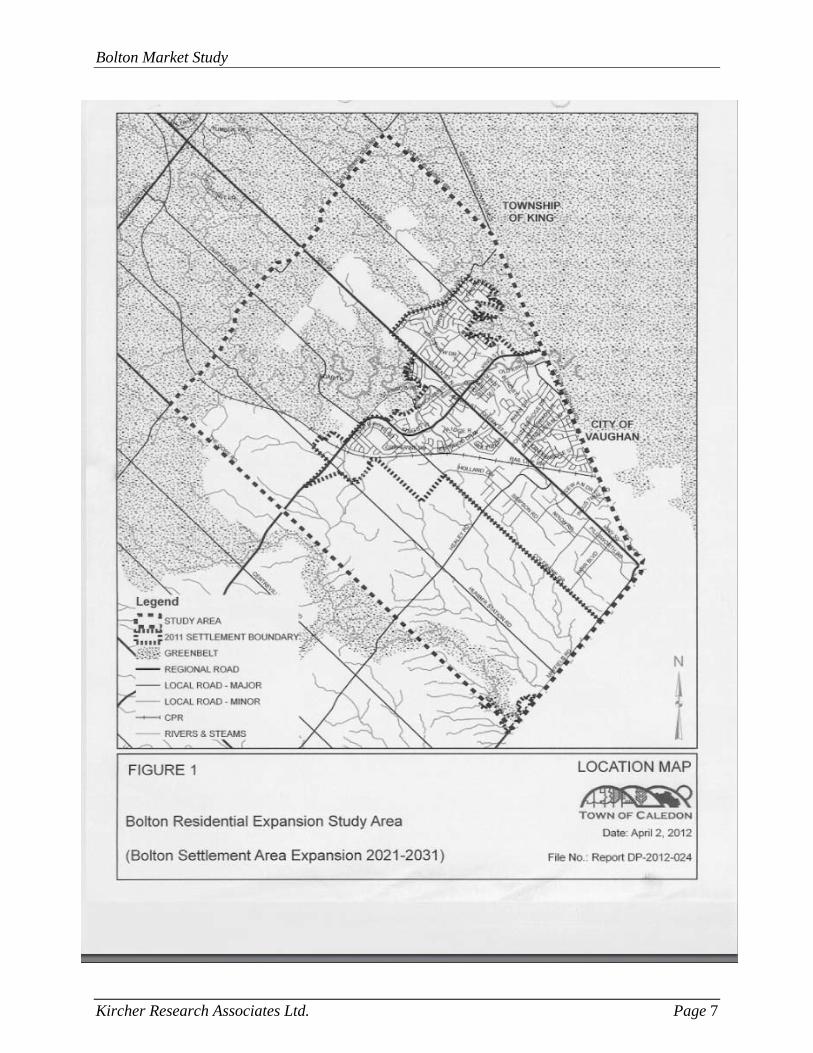
evaluate the warranted space for either Option. A map identifying the Option 1 & 3 areas is
included in this Section of the study. A map of the Bolton Settlement Area Expansion 2021-2031
is included in the next section, and
Site Characteristics and Surrounding Land Uses
The specific site features at either Option location are being described in the Planning Study. For
the purposes of the retail study, we observe that Option 1, consisting of 151 ha is located on
vacant land, just north of Columbia Way in the Bolton urban area. South of Columbia Way is an
existing residential community.
Option 3, comprised of a land area of 165 ha is also vacant. It is situated in the western part of
Bolton, north of King Street and west of Humber Station Road. There is a nearby existing
residential area south of King Street and west of Coleraine Drive.
Access Characteristics
Access is an integral part of site location for commercial developments. Good accessibility and
visibility are necessary features for successful retail facilities, making potential customers aware
of the site and allowing them to travel to and from the site with ease.
The Option 1 lands are located along Queen Street (Highway 50), the main regional north-south
route serving Bolton and its surrounding area. Queen Street leads to Downtown Bolton and to the
major retail commercial areas in the south of Bolton. Option 1 has very good regional access.
The Option 3 lands are located along King Street, the main east-west street in Bolton. King
Street also leads to Downtown Bolton. Option 3 has good regional access.
Bolton Market Study
Kircher Research Associates Ltd. Page 4
A recent Metrolinx study included a Bolton Commuter Rail Feasibility Study. The study
concluded that there would be insufficient traffic to justify the investment in the short term, i.e.
1-15 year plan, but that the Bolton Commuter Rail line should be included in the long term, 16-
25 year plan. Commuter rail service to Bolton remains in Metrolinx long-term plans. We were
informed that a Go-Train Station is being considered for lands immediately adjacent to the
Option 3 lands.
Bolton Market Study
Kircher Research Associates Ltd. Page 5
SECTION 3
STUDY AREA
Bolton Market Study
Kircher Research Associates Ltd. Page 6
SECTION 3
STUDY AREA
In order to evaluate the retail market potential for Bolton and the potential at either of the two
Option areas, it is necessary to analyze the expenditure patterns of the potential customer base.
The market influence attributable to any retail development usually extends beyond the
immediate nearby area. In order to make reliable estimates of market support, a well defined
Study Area must be delineated.
The geographic area of influence from which a commercial development could typically expect
to derive between 70.0% and 95.0% of its total sales volume is defined as its Study or Trade.
The extent of a market area depends on numerous factors, including:
the size, type and character of the planned retail development;
accessibility and visibility ;
natural or man-made barriers, such as rivers or railway lines, which may inhibit or
restrict the movement of customers;
distance and driving times; and,
the strength and location of existing and proposed competitive retail facilities.
The remaining sales volume is derived from visitors, tourists and local employees living outside
the market area. This sales support is referred to as inflow and has been recognized in this study.
Although this study is primarily concerned with the amount of retail and related service space in
either of the residential expansion areas, it is necessary to study the total Bolton market demand
initially, in order to understand the scale of the total demand. We have, therefore, focused on the
future retail space demand of Bolton. Based on a license plate survey, described in the appendix,
Bolton retail establishments derive about 50% of their current sales from local residents and 50%
from Inflow.
By focusing the market analysis on a well-defined market area, specific population, income and
expenditure trends can be identified and measured. Furthermore, the most important competitive
influences can be identified. From these assessments, the actual market demand available to
future retail developments can be determined.
The study area is the 2011 Bolton Settlement Boundary Area as illustrated below.
Bolton Market Study
Kircher Research Associates Ltd. Page 7
SECTION 4
STUDY AREA POPULATION
Bolton Market Study
Kircher Research Associates Ltd. Page 8
SECTION 4
STUDY AREA POPULATION
The current and future population residing in the Study Area is one of the most important factors
in determining the sales potential available to existing and future retail facilities in the area under
study. Forecast population levels for the market area are usually based on a number of factors,
including: the future economic development potential within the market area; the availability of suitable lands and necessary services to accommodate new residential
development; historic and forecast trends in population growth and family formation, which will affect the
demand for housing; and, municipal planning targets. In the following discussion we review the historic population growth in the study area since 2006
and examine projections of future population levels to 2031.
Historic, Current and Projected Study Area Population
Table 1 present the historic, current and projected population levels for the Study Area. The
population figures for 2006 through and 2011 are based on revised intercensal population
estimates.
The revised intercensal population estimates include an adjustment to the Census population in
order to make them conform to the revised definition of population employed by the Census.
This revised definition includes several groups that previously had been excluded from the
Census, notably non-permanent residents like refugee claimants and persons holding student or
employment authorizations or Minister’s permits.
Adjustments have been made to the Census population in order to correct for what Statistics
Canada has termed the net “undercoverage” or “undercount”. In this case the Census population
has been increased by 4.2%.
Bolton Market Study
Kircher Research Associates Ltd. Page 9
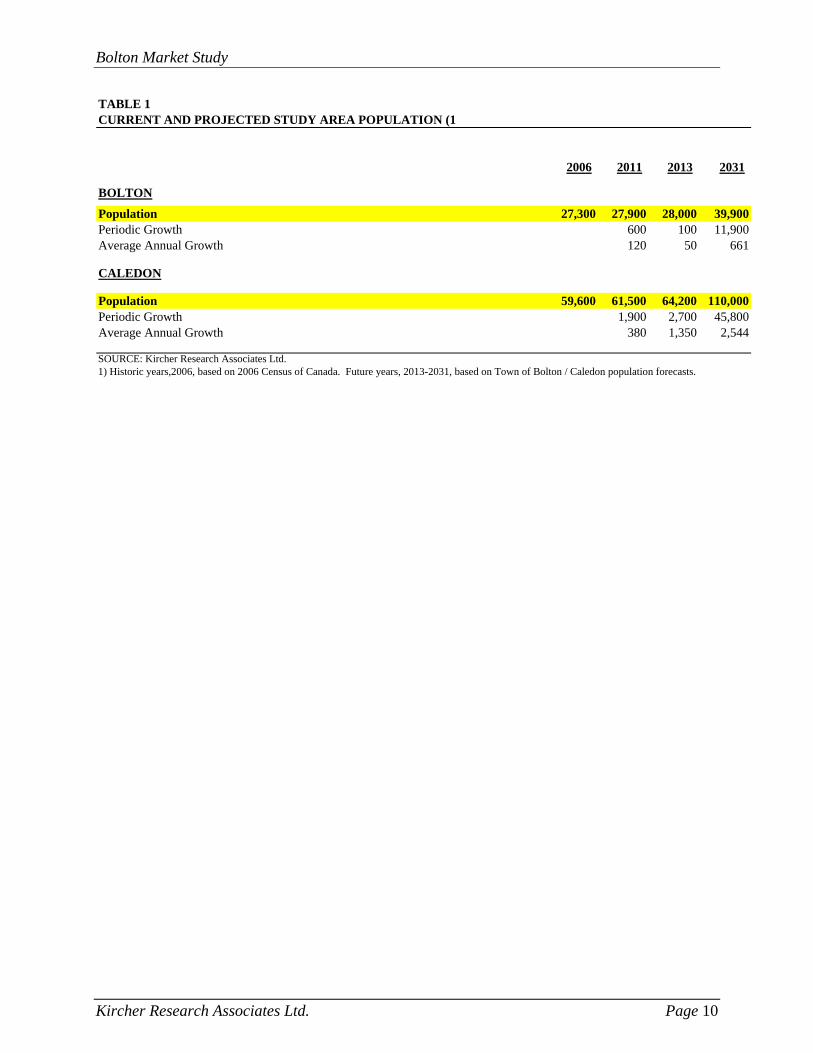
As noted on Table 1, the population of Bolton totalled 27,300 persons in 2006 and 27,900 in
2011. The year 2013 is the Base Year for our study. We estimate the 2013 population for Bolton
at 28,000 persons. The Town of Caledon population forecast for Bolton is 39,900 persons by
2031. The population levels for the Town of Caledon have also been shown for the same years
on Table 1.
Bolton Market Study
Kircher Research Associates Ltd. Page 10
TABLE 1CURRENT AND PROJECTED STUDY AREA POPULATION (1
2006 2011 2013 2031
BOLTON
Population 27,300 27,900 28,000 39,900Periodic Growth 600 100 11,900Average Annual Growth 120 50 661
CALEDON
Population 59,600 61,500 64,200 110,000Periodic Growth 1,900 2,700 45,800Average Annual Growth 380 1,350 2,544
SOURCE: Kircher Research Associates Ltd.1) Historic years,2006, based on 2006 Census of Canada. Future years, 2013-2031, based on Town of Bolton / Caledon population forecasts.

SECTION 5
STUDY AREA INCOME
Bolton Market Study
Kircher Research Associates Ltd. Page 11
SECTION 5
STUDY AREA INCOME
In addition to the future study area population, residents’ income levels are also important in
determining the future sales potential available to the existing and any additional retail facilities
in the market area. This section of the study contains a discussion of the income levels of study
area residents.
It has been our experience, based on previous market research, that average per capita income
levels provide a reasonable guide to the expenditure habits of the population living within a
defined market area. Although there are several intervening variables influencing consumer
habits and shopping preferences, population groupings with similar income characteristics tend
to exhibit similar expenditure habits for broad merchandise categories.
Study Area Per Capita and Average Household Income
The average personal per capita income for Canada and Ontario has been indicated in the upper
portion of Table 2 for each year between 1991 and 2013. The relationship between the per capita
income levels for Canada and Ontario has also been summarized in this table. These income
levels reflect the revised intercensal population estimates.
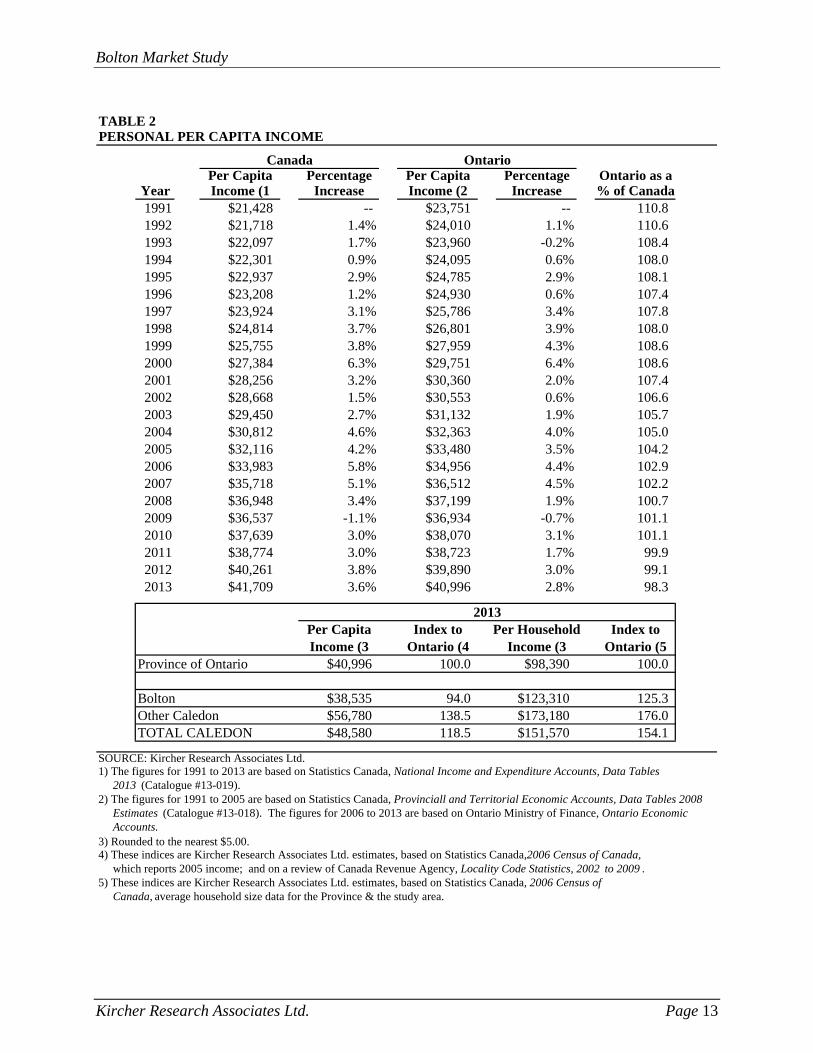
The upper portion of Table 2 indicates that the average per capita income for Canada, in nominal
dollar values, has increased from $21,428 in 1991 to an estimated $41,709 in 2013. Similarly,
the average per capita income for Ontario has increased from $23,751 in 1991 to an estimated
$40,996 in 2013. These figures represent total personal income before tax from all sources,
based on the definitions used in Statistics Canada, National Income and Expenditure Accounts
(Catalogue #13-001).
Between 1991 and 2013, Ontario’s average income level generally grew at a slower rate than
Canada’s. Ontario’s average income level has fallen below the national average since 2011.
Ontario’s average personal per capita income level is currently estimated at 1.7 % below the
national average.
Bolton Market Study
Kircher Research Associates Ltd. Page 12
The lower portion of Table 2 indicates the average personal per capita income levels for Ontario
and the Study Area in 2013. This information was calculated from data published in the 2011
Census of Canada and more recent Canada Revenue Agency taxation statistics. The per capita
income levels are used in the expenditure calculations presented in subsequent sections of this
study.
The 2013 average per capita income level for Study Area residents is estimated at $38,535 or
about 6.0% below the corresponding provincial average. However, the per capita household
income of study area residents, at $ 123,310 is 25.3 % above the provincial average. Similar
information is provided for the Town of Caledon on Table 2.
Bolton Market Study
Kircher Research Associates Ltd. Page 13
TABLE 2PERSONAL PER CAPITA INCOME
Canada OntarioPer Capita Percentage Per Capita Percentage Ontario as a
Year Income (1 Increase Income (2 Increase % of Canada1991 $21,428 -- $23,751 -- 110.81992 $21,718 1.4% $24,010 1.1% 110.61993 $22,097 1.7% $23,960 -0.2% 108.41994 $22,301 0.9% $24,095 0.6% 108.01995 $22,937 2.9% $24,785 2.9% 108.11996 $23,208 1.2% $24,930 0.6% 107.41997 $23,924 3.1% $25,786 3.4% 107.81998 $24,814 3.7% $26,801 3.9% 108.01999 $25,755 3.8% $27,959 4.3% 108.62000 $27,384 6.3% $29,751 6.4% 108.62001 $28,256 3.2% $30,360 2.0% 107.42002 $28,668 1.5% $30,553 0.6% 106.62003 $29,450 2.7% $31,132 1.9% 105.72004 $30,812 4.6% $32,363 4.0% 105.02005 $32,116 4.2% $33,480 3.5% 104.22006 $33,983 5.8% $34,956 4.4% 102.92007 $35,718 5.1% $36,512 4.5% 102.22008 $36,948 3.4% $37,199 1.9% 100.72009 $36,537 -1.1% $36,934 -0.7% 101.12010 $37,639 3.0% $38,070 3.1% 101.12011 $38,774 3.0% $38,723 1.7% 99.92012 $40,261 3.8% $39,890 3.0% 99.12013 $41,709 3.6% $40,996 2.8% 98.3
Per Capita Index to Per Household Index toIncome (3 Ontario (4 Income (3 Ontario (5
Province of Ontario $40,996 100.0 $98,390 100.0
Bolton $38,535 94.0 $123,310 125.3Other Caledon $56,780 138.5 $173,180 176.0TOTAL CALEDON $48,580 118.5 $151,570 154.1
SOURCE: Kircher Research Associates Ltd.1) The figures for 1991 to 2013 are based on Statistics Canada, National Income and Expenditure Accounts, Data Tables 2013 (Catalogue #13-019).2) The figures for 1991 to 2005 are based on Statistics Canada, Provinciall and Territorial Economic Accounts, Data Tables 2008 Estimates (Catalogue #13-018). The figures for 2006 to 2013 are based on Ontario Ministry of Finance, Ontario Economic Accounts.3) Rounded to the nearest $5.00.4) These indices are Kircher Research Associates Ltd. estimates, based on Statistics Canada,2006 Census of Canada, which reports 2005 income; and on a review of Canada Revenue Agency, Locality Code Statistics, 2002 to 2009 .5) These indices are Kircher Research Associates Ltd. estimates, based on Statistics Canada, 2006 Census of Canada, average household size data for the Province & the study area.
2013
SECTION 6
STUDY AREA FOOD STORE EXPENDITURE POTENTIAL
Bolton Market Study
Kircher Research Associates Ltd. Page 14
SECTION 6
STUDY AREA FOOD STORE EXPENDITURE POTENTIAL
The food store category can be divided into two major components: supermarkets and grocery
stores; and convenience and specialty food stores. We define supermarkets and grocery stores as
food stores that sell a wide selection of produce and grocery items, dairy products and fresh
meat, as well as household cleaning supplies, and have a central check-out area. Convenience
and specialty food stores include jug milk stores, bakeries, delicatessens, meat and fish markets,
produce markets and other similar stores.
We have analyzed retail sales as reported by Statistics Canada under the North American
Industry Classification System (NAICS). However, we have recognized the grocery components
of Wal-Mart Supercentres and Costco in the study.
The food store category as defined in this market study does not include food service facilities
such as restaurants or fast food outlets, wholesale food distributors, or the food and grocery
components of warehouse membership clubs, general merchandise stores, general stores, variety
stores and drug stores. The method used to calculate per capita food store expenditures from
Statistics Canada data is presented in Table E-1 of Appendix E. A comprehensive list of all
stores in the food store category is shown in Table E-6. This section of the study shows the
calculation of the food store expenditure potential in the Study Area.
Bolton Market Study
Kircher Research Associates Ltd. Page 15
TABLE 3PER CAPITA FOOD STORE EXPENDITURE POTENTIAL
1991 1996 2001 2006 2011 2013
Province of Ontario
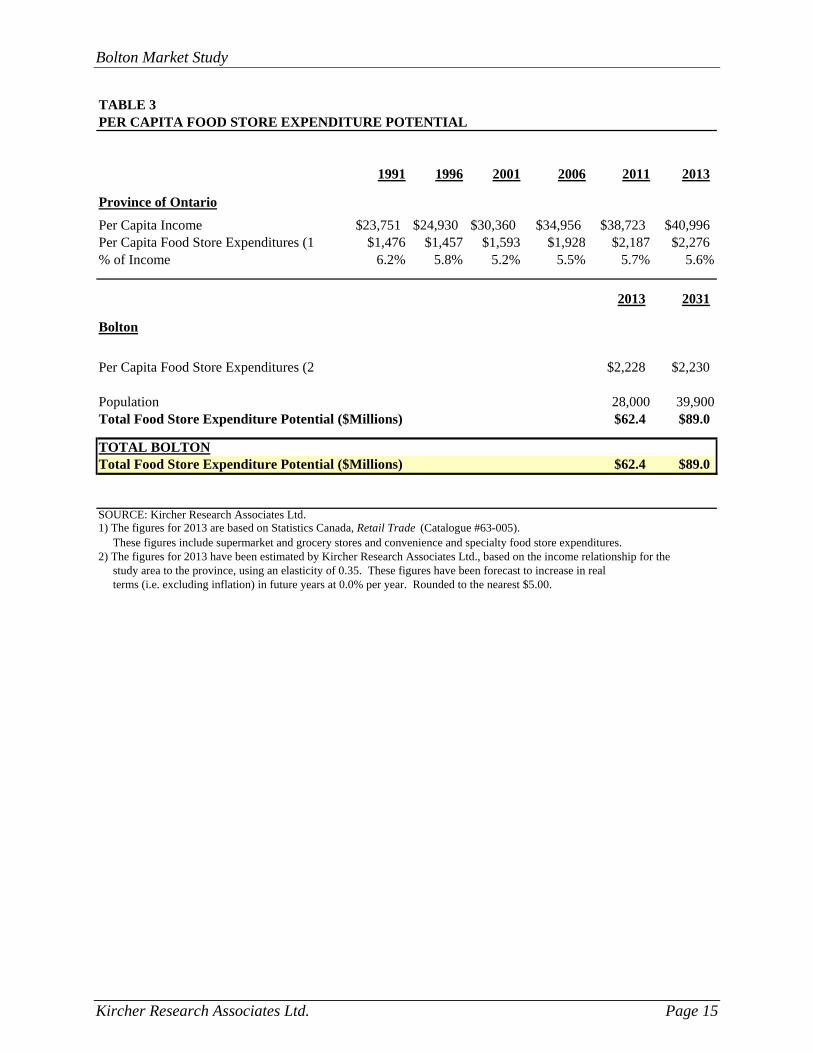
Per Capita Income $23,751 $24,930 $30,360 $34,956 $38,723 $40,996Per Capita Food Store Expenditures (1 $1,476 $1,457 $1,593 $1,928 $2,187 $2,276% of Income 6.2% 5.8% 5.2% 5.5% 5.7% 5.6%
2013 2031
Bolton
Per Capita Food Store Expenditures (2 $2,228 $2,230
Population 28,000 39,900Total Food Store Expenditure Potential ($Millions) $62.4 $89.0
TOTAL BOLTONTotal Food Store Expenditure Potential ($Millions) $62.4 $89.0
SOURCE: Kircher Research Associates Ltd.1) The figures for 2013 are based on Statistics Canada, Retail Trade (Catalogue #63-005). These figures include supermarket and grocery stores and convenience and specialty food store expenditures.2) The figures for 2013 have been estimated by Kircher Research Associates Ltd., based on the income relationship for the study area to the province, using an elasticity of 0.35. These figures have been forecast to increase in real terms (i.e. excluding inflation) in future years at 0.0% per year. Rounded to the nearest $5.00.
Bolton Market Study
Kircher Research Associates Ltd. Page 16
Calculation of Food Store Expenditure Potential
The relationship between per capita income and per capita food store expenditures has been
summarized in Table 3 for the Province of Ontario and the Study Area. The upper portion of this
table shows the relationship between per capita income and per capita food store expenditures in
Ontario for selected years between 1991 and 2013. The per capita food store expenditures
shown in Table 3 reflect the revised intercensal population estimates discussed previously and
are consistent with the per capita income levels derived from Table 2.
Between 1991 and 2013, per capita income growth in Ontario has been accompanied by
increased per capita food store expenditures. However, the share of income represented by food
store expenditures has generally declined since 1991. In 1991, Ontario residents spent an
average of $1,476 per person in food stores, or about 6.2% of their per capita income of $23,751.
By 2013, per capita food store expenditures in Ontario had increased to $2,276, but as a share of
the per capita income of $ 40,996, they had declined to 5.6 %.
The 2013 per capita food store expenditures of the Study Area have been indicated in the lower
portion of Table 3. These estimates have been calculated based on the income relationship
between the province and the Study Area, using an income elasticity factor of 0.35. This means
that an income differential of 10% results in an expenditure differential of 3.5%. The derivation
of this income elasticity factor has been explained in Appendix D.
Recognizing the difference in income levels between the Study Area and the province, the
current per capita food store expenditures are estimated at $2,228. These per capita expenditures
have been forecast to remain constant. As expressed in the assumptions underlying this study,
future changes in expenditure patterns that are solely due to inflation have not been recognized in
our analysis. Future expenditure levels, therefore, reflect the 2013 value of the Canadian dollar.
A detailed analysis of historic real growth in food store expenditures is presented in Appendix C.
The total food store expenditure potential has then been calculated for the Study Area by
multiplying the per capita food store expenditure level by the population. Based on these
calculations, the total food store expenditure potential for the Study Area is estimated at $ 62.4
million in 2113. It is expected to increase to $ 89.0 million by 2031.
Bolton Market Study
Kircher Research Associates Ltd. Page 17
Inflow and Outflow
The total food store expenditure potential calculated in Table 3 represents expenditures made by
market area residents at all food stores located inside and outside the market area. Additional
sales support for stores in the market area will also be derived from persons whose residence is
located outside the market area. These additional sales are termed inflow. Inflow expenditures
are made by visitors, tourists and local employees living beyond the defined market area
boundary. Inflow has been recognized in the supermarket and grocery store residual demand
analysis. Recognizing the current availability of grocery stores in Bolton, it is assumed that the
outflow will remain constant. The inflow was determined by the license plate survey.

SECTION 7
SUPERMARKET AND GROCERY STORE RESIDUAL DEMAND ANALYSIS
Bolton Market Study
Kircher Research Associates Ltd. Page 18
SECTION 7
SUPERMARKET AND GROCERY STORE RESIDUAL DEMAND ANALYSIS
This section of the study presents our analysis of the expenditure potential available for
additional supermarkets and grocery stores in Bolton
The inventory of competitive retail space identified the food stores located in the Study Area in
Appendix A. It included a total of 69,200 square feet of supermarket and grocery store space, as
well as 35,400 square feet of convenience and specialty food store space. As noted earlier, the
Wal-Mart Supercentre includes a large grocery component. Its effect is recognized in the
department store category.
Distribution of Total Food Store Expenditures
Supermarket and grocery store expenditures account for the majority of total food store
expenditures, with the balance attributable to convenience and specialty food stores. The portion
of total food store expenditures made at supermarkets and grocery stores is termed the
supermarket and grocery store share of total food store expenditures. The portion made at
convenience and specialty food stores is termed the convenience and specialty food store share.
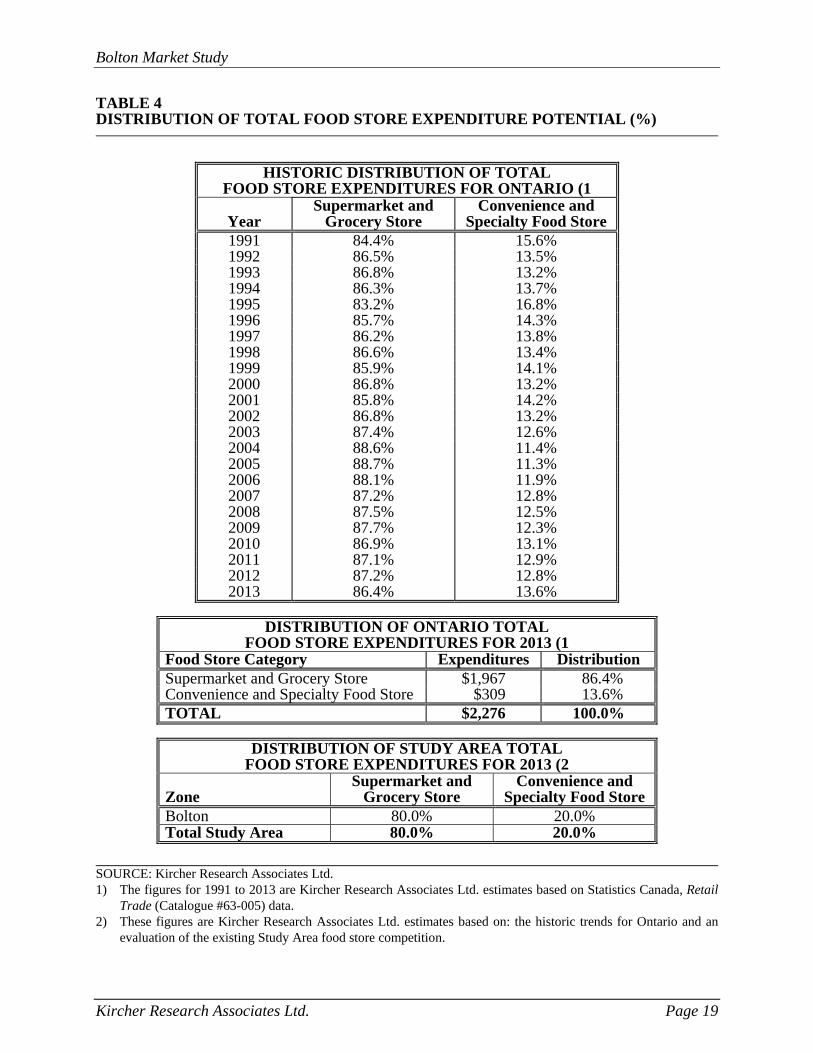
The top part of Table 4 presents the percentage distribution of total food store expenditures
between supermarkets and grocery stores and convenience and specialty food stores in Ontario
for 1991 to 2013. As indicated, the supermarket and grocery store share in Ontario increased
from 84.4% in 1991 to 86.4% in 2013, while the convenience and specialty food store share
declined from 15.6% to 13.6% in 2013 during this period. The middle part of Table 4 presents a
detailed calculation of the 2013 distribution for Ontario.
Based on the historic trends for Ontario and the inventory of existing food store space in the
market area, we have estimated the current distribution applicable to the Study area. These
figures are presented in Table 4. The supermarket and grocery store share for the Study Area is
estimated at 80.0% for 2013, while the convenience and specialty food store share is estimated at
20.0%.
Bolton Market Study
Kircher Research Associates Ltd. Page 19
TABLE 4 DISTRIBUTION OF TOTAL FOOD STORE EXPENDITURE POTENTIAL (%)
HISTORIC DISTRIBUTION OF TOTAL FOOD STORE EXPENDITURES FOR ONTARIO (1
Year
Supermarket and Grocery Store
Convenience and Specialty Food Store
1991 84.4% 15.6% 1992 86.5% 13.5% 1993 86.8% 13.2% 1994 86.3% 13.7% 1995 83.2% 16.8% 1996 85.7% 14.3% 1997 86.2% 13.8% 1998 86.6% 13.4% 1999 85.9% 14.1% 2000 86.8% 13.2% 2001 85.8% 14.2% 2002 86.8% 13.2% 2003 87.4% 12.6% 2004 88.6% 11.4% 2005 88.7% 11.3% 2006 88.1% 11.9% 2007 87.2% 12.8% 2008 87.5% 12.5% 2009 87.7% 12.3% 2010 86.9% 13.1% 2011 87.1% 12.9% 2012 87.2% 12.8% 2013 86.4% 13.6%
DISTRIBUTION OF ONTARIO TOTAL
FOOD STORE EXPENDITURES FOR 2013 (1 Food Store Category Expenditures Distribution Supermarket and Grocery Store $1,967 86.4% Convenience and Specialty Food Store $309 13.6% TOTAL $2,276 100.0%
DISTRIBUTION OF STUDY AREA TOTAL
FOOD STORE EXPENDITURES FOR 2013 (2 Zone
Supermarket and Grocery Store
Convenience and Specialty Food Store
Bolton 80.0% 20.0% Total Study Area 80.0% 20.0%
SOURCE: Kircher Research Associates Ltd. 1) The figures for 1991 to 2013 are Kircher Research Associates Ltd. estimates based on Statistics Canada, Retail
Trade (Catalogue #63-005) data. 2) These figures are Kircher Research Associates Ltd. estimates based on: the historic trends for Ontario and an
evaluation of the existing Study Area food store competition.
Bolton Market Study
Kircher Research Associates Ltd. Page 20
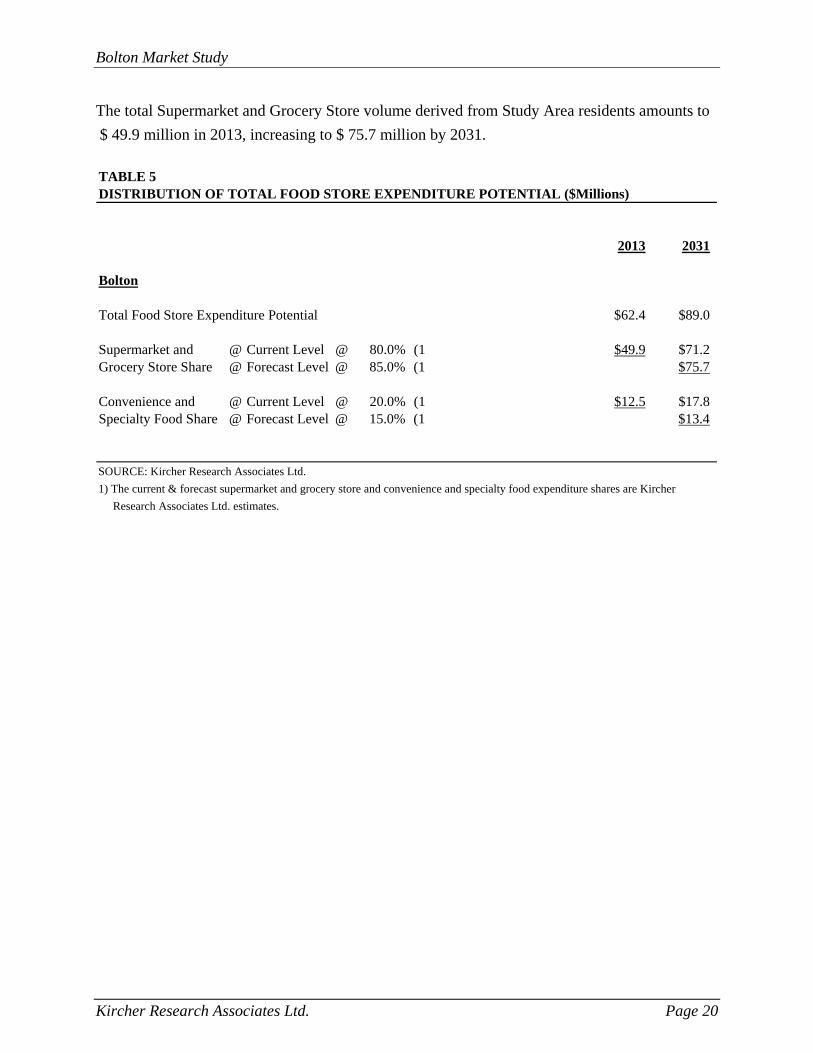
The total Supermarket and Grocery Store volume derived from Study Area residents amounts to
$ 49.9 million in 2013, increasing to $ 75.7 million by 2031.
TABLE 5DISTRIBUTION OF TOTAL FOOD STORE EXPENDITURE POTENTIAL ($Millions)
2013 2031
Bolton
Total Food Store Expenditure Potential $62.4 $89.0
Supermarket and @ Current Level @ 80.0% (1 $49.9 $71.2Grocery Store Share @ Forecast Level @ 85.0% (1 $75.7
Convenience and @ Current Level @ 20.0% (1 $12.5 $17.8Specialty Food Share @ Forecast Level @ 15.0% (1 $13.4
SOURCE: Kircher Research Associates Ltd.
1) The current & forecast supermarket and grocery store and convenience and specialty food expenditure shares are Kircher
Research Associates Ltd. estimates.
Bolton Market Study
Kircher Research Associates Ltd. Page 21
Supermarket and Grocery Store Residual Demand Analysis
On Table 5 we have summarized the residual demand for additional supermarket space. It should
be emphasized that a residual analysis assumes the continued operation of all existing stores in
the Study Area. In a competitive market economy, new stores also typically transfer volumes
from existing stores, referred to as ‘impact’. In this case, because of the distance of the Option
areas from the existing major competition, we consider the impact of any new supermarket on
existing stores to be minimal.
The difference between the 2013 supermarket potential and that in 2031 is called the residual
volume. It represents market growth from Study Area residents only. The residual volume
potential totals $ 25.8 million. Based on the results of the license plate survey and earlier
research conducted by our firm in Bolton, we estimate the supermarket inflow at about 45 %.
This means that 45 % of the total volume achieved by supermarkets in Bolton is derived from
outside the Bolton urban area. The total additional supermarket volume in Bolton, by 2031 is
estimated at about $ 46.9 million
The available volume has been divided by a typical range of expected sales per square foot levels
applicable to new supermarkets in this market area, ranging between $625 and $675 per square
foot per annum. This calculation indicates warranted additional supermarket space of about
72,000 square feet by 2031.
Bolton Market Study
Kircher Research Associates Ltd. Page 22
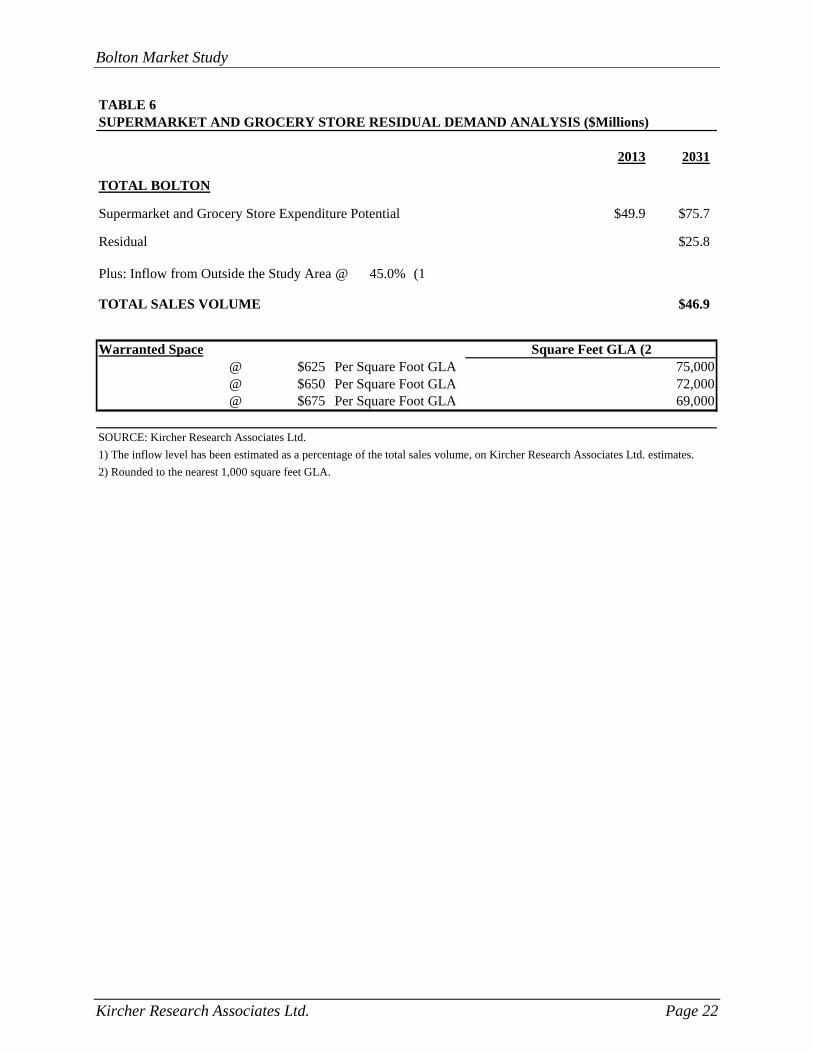
TABLE 6SUPERMARKET AND GROCERY STORE RESIDUAL DEMAND ANALYSIS ($Millions)
2013 2031
TOTAL BOLTON
Supermarket and Grocery Store Expenditure Potential $49.9 $75.7
Residual $25.8
Plus: Inflow from Outside the Study Area @ 45.0% (1 $46.9
TOTAL SALES VOLUME $46.9
Warranted Space@ $625 Per Square Foot GLA 75,000@ $650 Per Square Foot GLA 72,000@ $675 Per Square Foot GLA 69,000
SOURCE: Kircher Research Associates Ltd.
1) The inflow level has been estimated as a percentage of the total sales volume, on Kircher Research Associates Ltd. estimates.
2) Rounded to the nearest 1,000 square feet GLA.
Square Feet GLA (2

SECTION 8
STUDY AREA GAFO STORE EXPENDITURE POTENTIAL
Bolton Market Study
Kircher Research Associates Ltd. Page 23
SECTION 8
STUDY AREA GAFO STORE EXPENDITURE POTENTIAL
GAFO (General Merchandise, Apparel, Furniture and Other Retailers) stores represent a broad
selection of retailers such as general merchandise stores; apparel and accessories stores;
furniture, home furnishings and electronics stores; and other specialty non-food retailers. For
analytical purposes, we differentiate between department stores and other types of general
merchandise stores, thus resulting in the following six major GAFO store categories: Traditional Department Stores; Discount Department Stores; Other General Merchandise Stores; Apparel and Accessories Stores; Furniture, Home Furnishings and Electronics Stores; and, Other Retailers.
It should be noted that the Other General Merchandise stores category includes Costco
warehouse membership clubs and home and auto supply stores such as Canadian Tire. A
comprehensive list of all stores in each of these major store categories is shown in Table E-6 of
Appendix E. GAFO stores exclude food stores; pharmacies and personal care stores; beer, wine
and liquor stores; and building and outdoor home supply stores. Furthermore, financial
institutions, food services, personal and laundry services, as well as all other services are also
excluded from the GAFO store category. The calculation of per capita GAFO store expenditures
from Statistics Canada data is presented in Table E-2.
GAFO facilities occupy about 485,900 square feet in the Study area as indicated on Table A-1.
Due to the overall size of the Study Area and the fact that a Wal-Mart department store is located
in Bolton, we do not expect that sufficient market potential arises by 2031 to warrant a second
department store. Therefore, our GAFO analysis will focus on the demand for Non-Department
Store GAFO space.
Bolton Market Study
Kircher Research Associates Ltd. Page 24
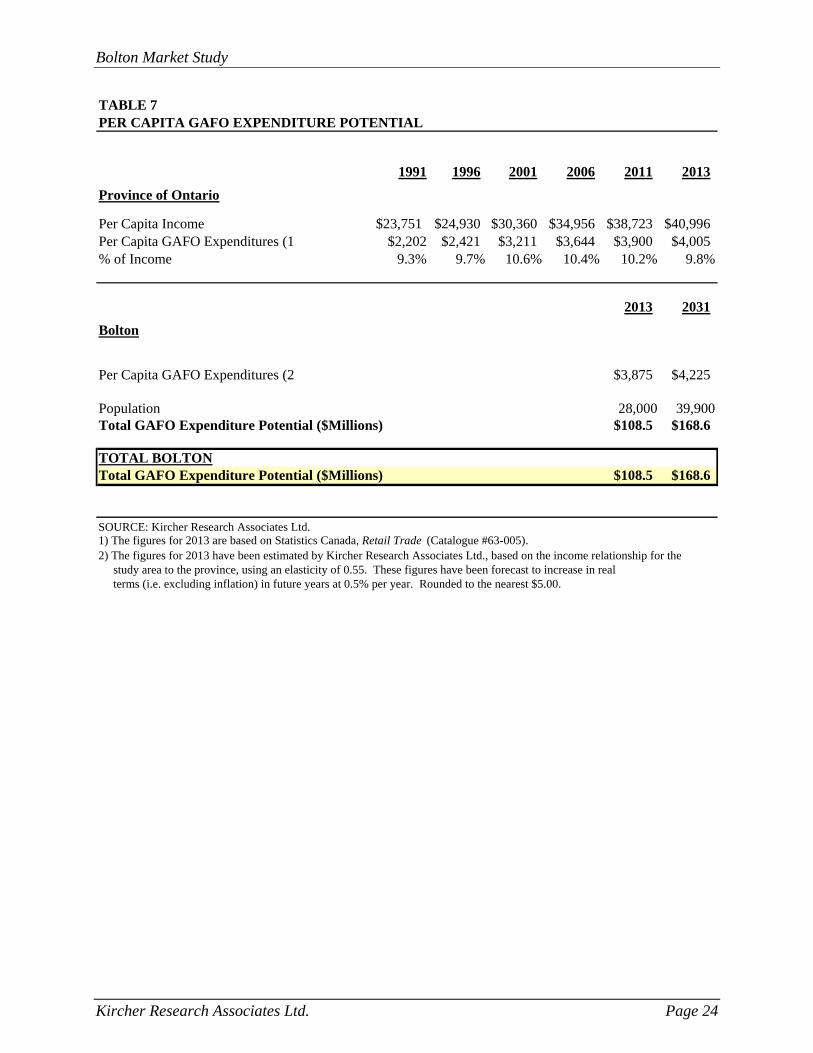
TABLE 7PER CAPITA GAFO EXPENDITURE POTENTIAL
1991 1996 2001 2006 2011 2013
Province of Ontario
Per Capita Income $23,751 $24,930 $30,360 $34,956 $38,723 $40,996Per Capita GAFO Expenditures (1 $2,202 $2,421 $3,211 $3,644 $3,900 $4,005% of Income 9.3% 9.7% 10.6% 10.4% 10.2% 9.8%
2013 2031
Bolton
Per Capita GAFO Expenditures (2 $3,875 $4,225
Population 28,000 39,900Total GAFO Expenditure Potential ($Millions) $108.5 $168.6
TOTAL BOLTONTotal GAFO Expenditure Potential ($Millions) $108.5 $168.6
SOURCE: Kircher Research Associates Ltd.1) The figures for 2013 are based on Statistics Canada, Retail Trade (Catalogue #63-005). 2) The figures for 2013 have been estimated by Kircher Research Associates Ltd., based on the income relationship for the study area to the province, using an elasticity of 0.55. These figures have been forecast to increase in real terms (i.e. excluding inflation) in future years at 0.5% per year. Rounded to the nearest $5.00.
Bolton Market Study
Kircher Research Associates Ltd. Page 25
Calculation of GAFO Store Expenditure Potential
The relationship between per capita income and per capita GAFO store expenditures has been
summarized in Table 7 for the Province of Ontario and the Study Area. The upper portion of this
table shows the relationship between per capita income and per capita GAFO store expenditures
in Ontario for selected years between 1991 and 2013. The per capita GAFO store expenditures
shown in Table 7 reflect the revised intercensal population estimates discussed earlier in this
study.
Between 1991 and 2013, per capita income growth in Ontario has been accompanied by
increased per capita GAFO store expenditures. The share of income represented by GAFO store
expenditures has generally increased since 1991. In 1991, Ontario residents spent an average of
$2,202 per person in GAFO stores, or about 9.3% of their per capita income of $23,751. By
2013, per capita GAFO store expenditures in Ontario had increased to $4,005, which represents
9.8 % of the per capita income of $ 40,996.
The 2013 per capita GAFO store expenditures for the Study Area are shown in the lower portion
of Table 7. These estimates have been calculated based on the income relationship between the
province and the Study Area, using an income elasticity factor of 0.55. This means that an
income differential of 10% results in an expenditure differential of 5.5%. The derivation of this
income elasticity factor has been explained in Appendix D.
Recognizing the difference in income levels between the Study Area and the province, current
per capita GAFO store expenditures are estimated at $3,875. These expenditures have been
forecast to increase in real terms (i.e. excluding inflation) at 0.5% per year after 2013. Annual
growth might be slightly below this estimate in the next year or two, but is expected to average
out over the total study period. A detailed analysis of historic real growth in GAFO store
expenditures is presented in Appendix C.
The total GAFO store expenditure volume potential has then been calculated for the Study Area.
It totals $ 108.5 million in 2013 and is estimated to increase to $ 168.6 million by 2031.
Bolton Market Study
Kircher Research Associates Ltd. Page 26
Inflow and Outflow
The total GAFO store volume potential indicated in Table 7 represents expenditures made by
market area residents at all such stores located inside and outside the delineated market area.
Additional sales support will also be derived from persons whose residence is located outside the
Study Area. These additional sales are termed inflow. Inflow expenditures are made by visitors,
tourists and local employees living beyond the defined market area boundary. Inflow has been
recognized in the GAFO store residual demand analysis following.
Study Area residents also make a portion of their retail purchases at GAFO stores located outside
the market area. Due to the presence of a large assortment of GAFO stores in Bolton, and the
relatively moderate population growth, we expect the outflow to remain relatively constant. The
inflow was determined in the license plate survey.
SECTION 9
NON-DEPARTMENT STORE GAFO RESIDUAL DEMAND ANALYSIS
Bolton Market Study
Kircher Research Associates Ltd. Page 27
SECTION 9
NON-DEPARTMENT STORE GAFO RESIDUAL DEMAND ANALYSIS
This section of the study presents our analysis of the additional expenditure potential available to
GAFO stores in Bolton. We have recognized the GAFO volume served by department stores but
no additional department store is warranted in Bolton by 2031. We have considered the demand
for non-department store GAFO retailers, which include other general merchandise stores;
apparel and accessories stores; furniture, home furnishings and electronics stores; and other
retailers.
Distribution of Total GAFO Store Expenditures
As noted earlier, GAFO facilities are comprised of department stores and non-department store
GAFO retailers. Department stores are usually large-space retailers offering a broad selection of
merchandise. Statistics Canada generally defines a department store as a retail outlet that sells
the following broad lines of merchandise: family clothing and apparel; furniture, appliances and
home furnishings; and miscellaneous other goods. Non-department store GAFO facilities are
specialty stores that are normally, but not always, much smaller than department stores and
usually specialize in narrow lines of merchandise, such as women’s apparel or jewellery.
The portion of total GAFO store expenditures that are made in department stores is referred to as
the department store share of GAFO store expenditures. This includes all expenditures made at
discount and traditional department stores. The portion of total GAFO store expenditures that
are not made in department stores is termed the non-department store GAFO share.
The top portion of Table 8 presents the historic department store and non-department store
GAFO shares in the Province of Ontario for 1991 to 2013. These figures indicate that the
department store share has generally been declining throughout this period. Conversely, the
non-department store GAFO share has been increasing.

Bolton Market Study
Kircher Research Associates Ltd. Page 28
TABLE 8 DISTRIBUTION OF TOTAL GAFO STORE EXPENDITURE POTENTIAL (%)
HISTORIC DISTRIBUTION OF TOTAL GAFO STORE EXPENDITURES FOR ONTARIO (1
Year
Department Store
Non-Department Store GAFO
1991 21.7% 78.3% 1992 21.8% 78.2% 1993 21.4% 78.6% 1994 20.8% 79.2% 1995 21.1% 78.9% 1996 21.6% 78.4% 1997 22.0% 78.0% 1998 21.6% 78.4% 1999 21.5% 78.5% 2000 20.7% 79.3% 2001 21.3% 78.7% 2002 21.3% 78.7% 2003 20.9% 79.1% 2004 20.8% 79.2% 2005 21.0% 79.0% 2006 20.5% 79.5% 2007 20.0% 80.0% 2008 20.0% 80.0% 2009 20.0% 80.0% 2010 - - 2011 17.4% 82.6% 2012 17.1% 82.9% 2013 17.1% 82.9%
DISTRIBUTION OF STUDY AREA TOTAL GAFO STORE EXPENDITURES FOR 2013 (2
Zone
Department Store
Non-DepartmentStore GAFO
Bolton 28.0% 72.0% Total Study Area 28.0% 72.0%
SOURCE: Kircher Research Associates Ltd. 1) The figures for 1991 to 2013 are Kircher Research Associates Ltd. estimates, based on Statistics Canada, Retail
Trade (Catalogue #63-005) data. 2) These figures are Kircher Research Associates Ltd. estimates, based on: the historic trends for Ontario and an
evaluation of the existing Study Area GAFO store competition.
Bolton Market Study
Kircher Research Associates Ltd. Page 29
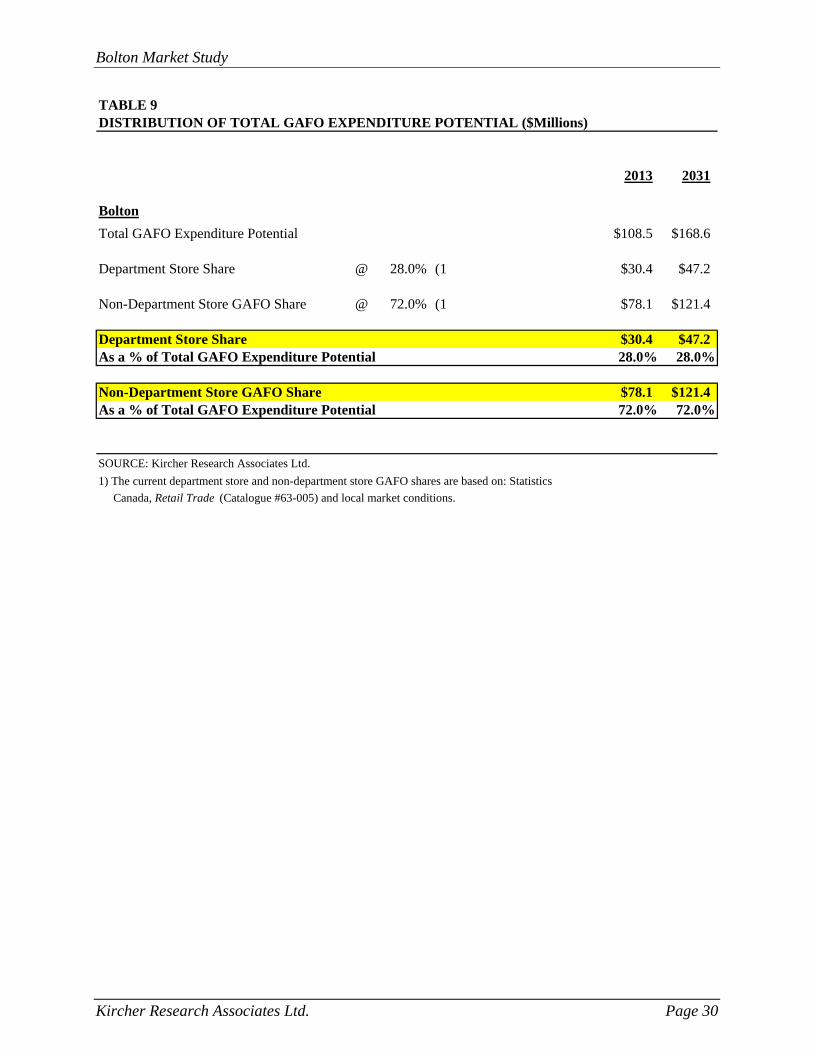
Based on the historic trends for Ontario, as well as our previous market experience, we have
estimated the department store and non-department store GAFO shares applicable to the total
market area. These estimates are presented in the bottom portion of Table 8. The department
store share of GAFO is estimated at 28 % for Bolton. This indicates a department store volume
generated by Study Area residents of $30.4 million in 2013, increasing to 47.2 million by 2031.
Conversely, the non-department store GAFO volume totals $78.1 million in 2013 and is
estimated to increase to $ 121.4 million by 2031.
Bolton Market Study
Kircher Research Associates Ltd. Page 30
TABLE 9DISTRIBUTION OF TOTAL GAFO EXPENDITURE POTENTIAL ($Millions)
2013 2031
Bolton
Total GAFO Expenditure Potential $108.5 $168.6
Department Store Share @ 28.0% (1 $30.4 $47.2
Non-Department Store GAFO Share @ 72.0% (1 $78.1 $121.4
Department Store Share $30.4 $47.2As a % of Total GAFO Expenditure Potential 28.0% 28.0%
Non-Department Store GAFO Share $78.1 $121.4As a % of Total GAFO Expenditure Potential 72.0% 72.0%
SOURCE: Kircher Research Associates Ltd.
1) The current department store and non-department store GAFO shares are based on: Statistics
Canada, Retail Trade (Catalogue #63-005) and local market conditions.
Bolton Market Study
Kircher Research Associates Ltd. Page 31
Non-Department Store GAFO Residual Demand Analysis
The non-department store GAFO expenditures estimated in Table 9 for the Study Area have been
transferred to Table 10. The analytical methodology applied for this category to establish
warranted space is identical to that explained in the supermarket section. The residual retail
volume in this category is estimated at $ 43.3 million by 2013. We have estimated the inflow in
this category at 50% reflecting the results of the license plat survey. This results in a total
residual volume of $ 86.6 million by 2031. At the mid point of a range of applicable sales per
square foot levels, demand for some 217,000 square feet of additional non-department store
GAFO space is indicated.

Bolton Market Study
Kircher Research Associates Ltd. Page 32
TABLE 10NON-DEPARTMENT STORE GAFO RESIDUAL DEMAND ANALYSIS ($Millions)
2013 2031
BOLTON
Non-Department Store GAFO Expenditure Potential $78.1 $121.4
Residual $43.3
Plus: Inflow from Outside the Trade Area @ 50.0% (1 $86.6
TOTAL SALES VOLUME $86.6
Warranted Space@ $350 Per Square Foot GLA 247,000@ $400 Per Square Foot GLA 217,000@ $450 Per Square Foot GLA 192,000
SOURCE: Kircher Research Associates Ltd.
1) The inflow level has been estimated as a percentage of the total sales volume, on Kircher Research Associates Ltd. estimates.
2) Rounded to the nearest 1,000 square feet GLA.
Square Feet GLA (2
SECTION 10
PHARMACY AND PERSONAL CARE STORE RESIDUAL DEMAND ANALYSIS
Bolton Market Study
Kircher Research Associates Ltd. Page 33
SECTION 10
PHARMACY AND PERSONAL CARE STORE RESIDUAL DEMAND ANALYSIS
This section of the study examines the expenditure potential that would be available for the
Pharmacy and Personal Care Store category. In 2013, there are 50,200 square feet of this type of
retail space in Bolton.
Calculation of Pharmacy and Personal Care Store Expenditure Potential
The pharmacy and personal care store category includes expenditures at drug stores, cosmetics
stores, opticians; health supplements retailers and medical aid and equipment stores. The
method used to calculate per capita pharmacy and personal care store expenditures from
Statistics Canada data is presented in Table E-3. The analytical approach used to examine the
pharmacy and personal care store category is similar to the approach used for the food and
GAFO store categories in preceding sections of this study.
The relationship between per capita income and per capita pharmacy and personal care store
expenditures has been summarized in Table 11 for the Province of Ontario and the Study Area.
The upper portion of the table shows the relationship between per capita income and per capita
pharmacy and personal care store expenditures in Ontario for selected years between 1991 and
2013. As with the food and GAFO store categories analyzed in previous sections of this study,
the per capita pharmacy and personal care store expenditures shown in Table 11 reflect the
revised intercensal population estimates discussed in Section 4 of this study and are consistent
with the per capita income levels derived from Table 2.
Between 1991 and 2013, per capita income growth in Ontario has been accompanied by higher
per capita pharmacy and personal care store expenditures. The share of income represented by
pharmacy and personal care store expenditures has increased substantially during this period. In
1991, Ontario residents spent an average of $434 per person on pharmacy and personal care store
expenditures, or about 1.8% of their per capita income of $23,751. By 20013, per capita
pharmacy and personal care store expenditures in Ontario had increased to $ 950, which as a
share of the per capita income of $ 40,996 had grown to about 2.3 %.
Bolton Market Study
Kircher Research Associates Ltd. Page 34
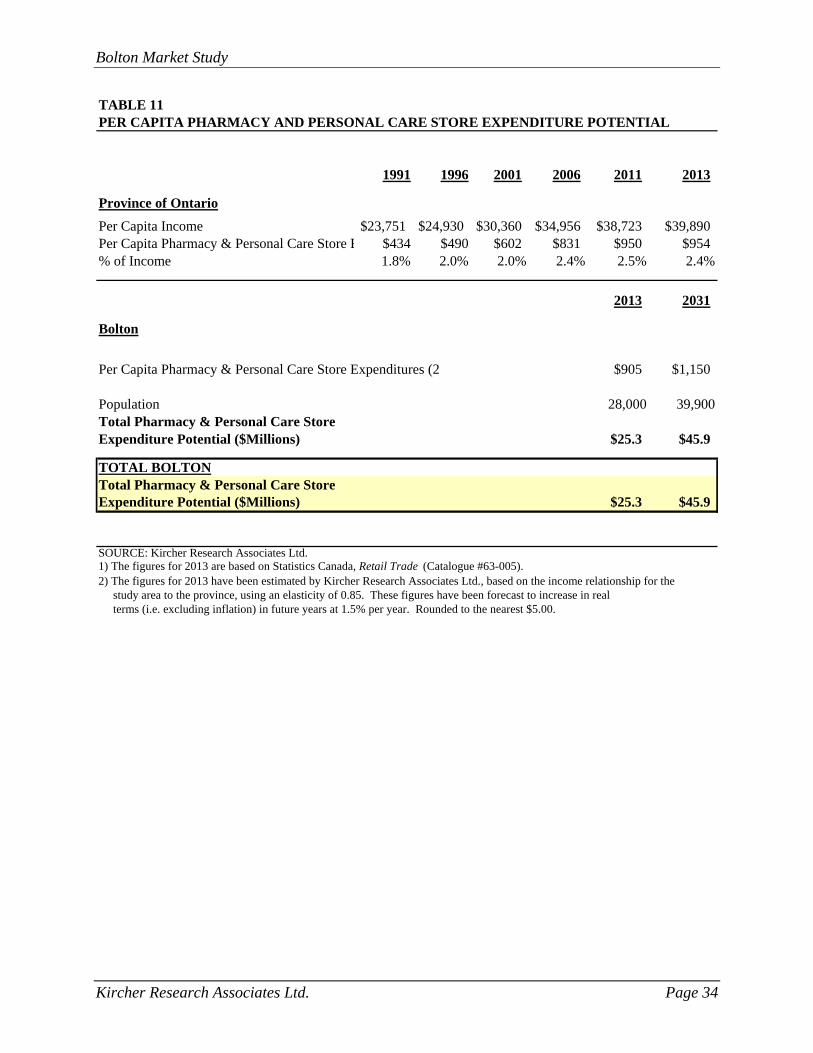
TABLE 11PER CAPITA PHARMACY AND PERSONAL CARE STORE EXPENDITURE POTENTIAL
1991 1996 2001 2006 2011 2013
Province of Ontario
Per Capita Income $23,751 $24,930 $30,360 $34,956 $38,723 $39,890Per Capita Pharmacy & Personal Care Store E $434 $490 $602 $831 $950 $954% of Income 1.8% 2.0% 2.0% 2.4% 2.5% 2.4%
2013 2031
Bolton
Per Capita Pharmacy & Personal Care Store Expenditures (2 $905 $1,150
Population 28,000 39,900Total Pharmacy & Personal Care StoreExpenditure Potential ($Millions) $25.3 $45.9
TOTAL BOLTONTotal Pharmacy & Personal Care StoreExpenditure Potential ($Millions) $25.3 $45.9
SOURCE: Kircher Research Associates Ltd.1) The figures for 2013 are based on Statistics Canada, Retail Trade (Catalogue #63-005). 2) The figures for 2013 have been estimated by Kircher Research Associates Ltd., based on the income relationship for the study area to the province, using an elasticity of 0.85. These figures have been forecast to increase in real terms (i.e. excluding inflation) in future years at 1.5% per year. Rounded to the nearest $5.00.
Bolton Market Study
Kircher Research Associates Ltd. Page 35
The 2013 per capita pharmacy and personal care store expenditures for the Study Area have been
indicated in the lower portion of Table 11. This estimate has been calculated based on the
income relationship between the province and the Study Area, using an income elasticity factor
of 0.85. This means that an income differential of 10% results in an expenditure differential of
8.5 %. The derivation of this income elasticity factor has been explained in Appendix D.
Recognizing the difference in income levels between the Study Area and the province, current
per capita pharmacy and personal care store expenditures in Bolton are estimated at $ 954. These
expenditures are forecast to increase in real terms (i.e. excluding inflation) at 1.5 % per year after
2013.
The total pharmacy and personal care store expenditure potential has then been calculated for the
Study Area. It amounts to $ 25.3 million in 2013 and increases to $ 45.9 million by 2013.
Bolton Market Study
Kircher Research Associates Ltd. Page 36
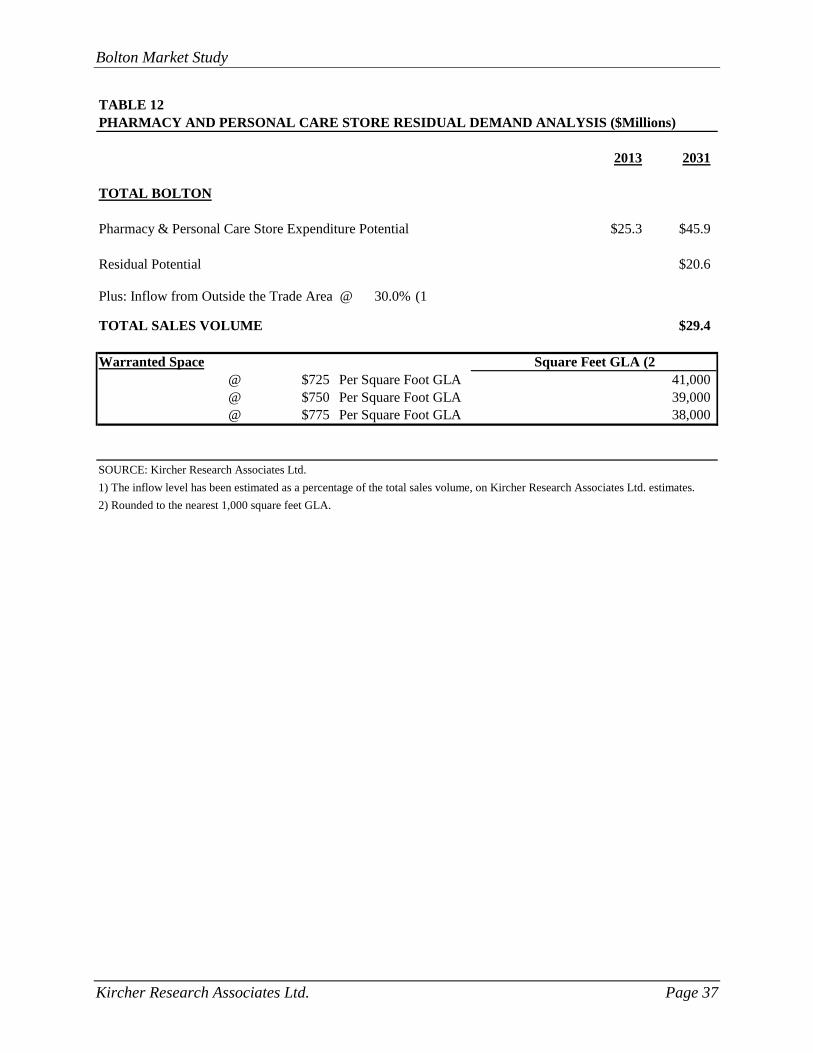
Pharmacy and Personal Care Store Residual Demand Analysis
Table 12 following presents the residual demand analysis for the pharmacy and personal care
store category. It is based on a similar approach as that previously used for the various food and
GAFO store categories. The pharmacy and personal care store expenditure potentials that were
calculated in Table 11 for the Study Area, for each year of the study period, have been
transferred to this table.
The residual volume potential in this category totals $ 20.6 million. The applicable inflow,
recognizing the convenience nature of shopping for such merchandise, is estimated at 30 %.
Thus, the total volume potential amounts to $ 29.4 million by 2013. At the mid point of the range
of applicable sales per square foot, the warranted space in 2013 is 31,000 square feet.
Bolton Market Study
Kircher Research Associates Ltd. Page 37
TABLE 12PHARMACY AND PERSONAL CARE STORE RESIDUAL DEMAND ANALYSIS ($Millions)
2013 2031
TOTAL BOLTON
Pharmacy & Personal Care Store Expenditure Potential $25.3 $45.9
Residual Potential $20.6
Plus: Inflow from Outside the Trade Area @ 30.0% (1 $29.4
TOTAL SALES VOLUME $29.4
Warranted Space@ $725 Per Square Foot GLA 41,000@ $750 Per Square Foot GLA 39,000@ $775 Per Square Foot GLA 38,000
SOURCE: Kircher Research Associates Ltd.
1) The inflow level has been estimated as a percentage of the total sales volume, on Kircher Research Associates Ltd. estimates.
2) Rounded to the nearest 1,000 square feet GLA.
Square Feet GLA (2
SECTION 11
BEER, WINE AND LIQUOR STORE RESIDUAL DEMAND ANALYSIS
Bolton Market Study
Kircher Research Associates Ltd. Page 38
SECTION 11
BEER, WINE AND LIQUOR STORE RESIDUAL DEMAND ANALYSIS
This section of the study considers the future market potential that would be available to Beer,
Wine and Liquor Stores in Bolton. The current inventory totals 13,500 square feet.
Calculation of Beer, Wine and Liquor Store Expenditure Potential
The method used to calculate per capita beer, wine and liquor store expenditures from Statistics
Canada data is presented in Table E-4. The analytical approach used to examine the beer, wine
and liquor store category is similar to the approach used for other retail categories in the
preceding sections of this study.
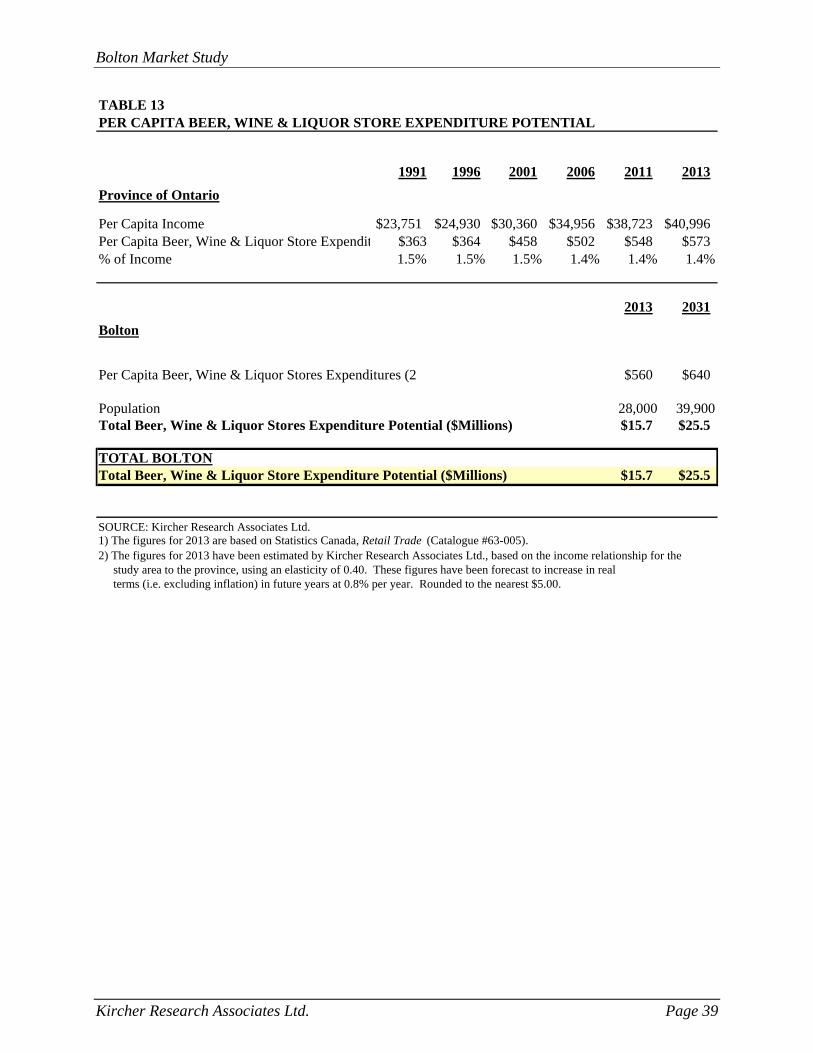
The relationship between per capita income and per capita beer, wine and liquor store
expenditures has been summarized in Table 13 for the Province of Ontario and the Study Area.
The upper portion of this table shows the relationship between per capita income and per capita
beer, wine and liquor store expenditures in Ontario for selected years between 1991 and 2013.
As with the other retail categories analyzed in previous sections of this study, the per capita beer,
wine and liquor store expenditures shown in Table 13 reflect the revised intercensal population
estimates discussed in Section 4 of this study and are consistent with the per capita income levels
derived from Table 2.
Between 1991 and 2013, per capita income growth in Ontario has been accompanied by higher
per capita beer, wine and liquor store expenditures. In 1991, Ontario residents spent an average
of $363 per person at beer, wine and liquor stores, or about 1.5% of their per capita income of
$23,751. By 2013, per capita beer, wine and liquor store expenditures in Ontario had increased
to $ 573 but as a share of the per capita income of $ 40,996 had declined to about 1.4%.
Recognizing the income difference between the Study Area and the Province, we have calculated
the 2013 per capita expenditures in this category at $ 560 based on an elasticity factor of 0.40.
Per capita expenditures are estimated to increase at about 0.8 % per year. The total available
volume in this category is estimated at $ 15.7 million in 2013, increasing to $ 25.5 million by
2031.
Bolton Market Study
Kircher Research Associates Ltd. Page 39
TABLE 13PER CAPITA BEER, WINE & LIQUOR STORE EXPENDITURE POTENTIAL
1991 1996 2001 2006 2011 2013
Province of Ontario
Per Capita Income $23,751 $24,930 $30,360 $34,956 $38,723 $40,996Per Capita Beer, Wine & Liquor Store Expendit $363 $364 $458 $502 $548 $573% of Income 1.5% 1.5% 1.5% 1.4% 1.4% 1.4%
2013 2031
Bolton
Per Capita Beer, Wine & Liquor Stores Expenditures (2 $560 $640
Population 28,000 39,900Total Beer, Wine & Liquor Stores Expenditure Potential ($Millions) $15.7 $25.5
TOTAL BOLTONTotal Beer, Wine & Liquor Store Expenditure Potential ($Millions) $15.7 $25.5
SOURCE: Kircher Research Associates Ltd.1) The figures for 2013 are based on Statistics Canada, Retail Trade (Catalogue #63-005). 2) The figures for 2013 have been estimated by Kircher Research Associates Ltd., based on the income relationship for the study area to the province, using an elasticity of 0.40. These figures have been forecast to increase in real terms (i.e. excluding inflation) in future years at 0.8% per year. Rounded to the nearest $5.00.
Bolton Market Study
Kircher Research Associates Ltd. Page 40
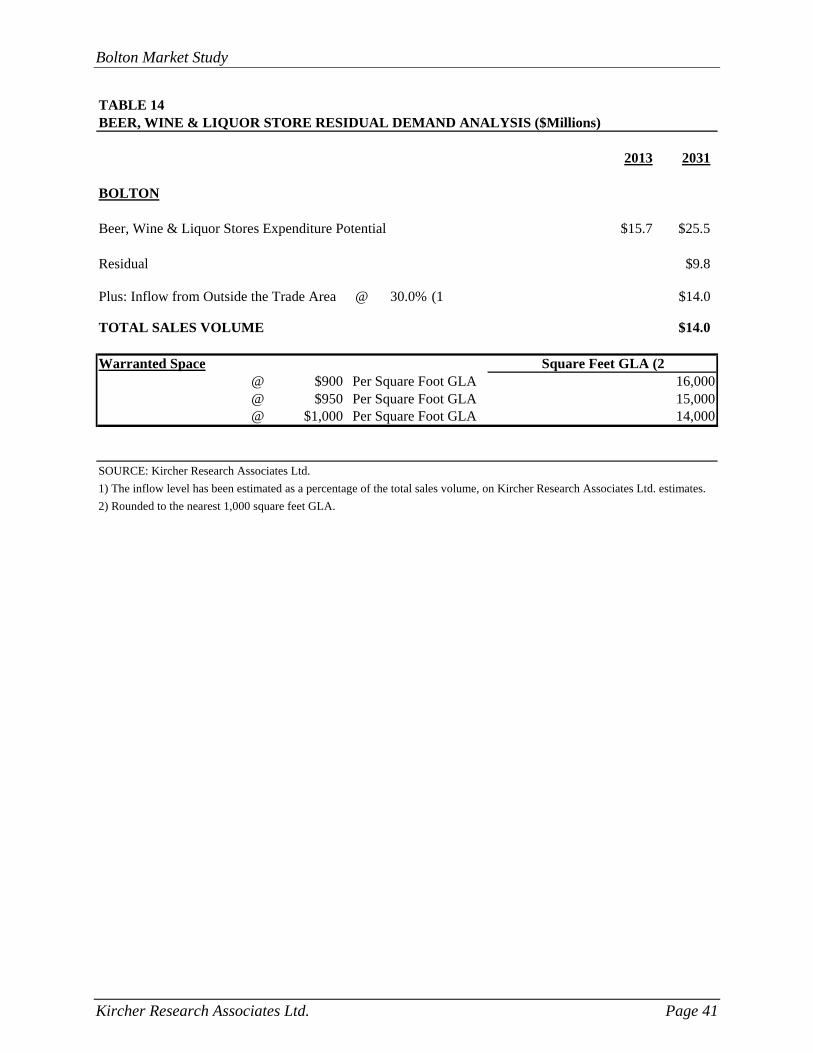
Beer, Wine and Liquor Store Residual Demand Analysis
On Table 14 we have indicated the residual volume available by 2013 totalling $ 9.8 million.
Recognizing an inflow of 30 %, the total available volume at the end of the study period is $ 14.0
million. At the mid point of the range of applicable sales per square foot warranted additional
space of about 15,000 square feet is indicated by 2031.
Bolton Market Study
Kircher Research Associates Ltd. Page 41
TABLE 14BEER, WINE & LIQUOR STORE RESIDUAL DEMAND ANALYSIS ($Millions)
2013 2031
BOLTON
Beer, Wine & Liquor Stores Expenditure Potential $15.7 $25.5
Residual $9.8
Plus: Inflow from Outside the Trade Area @ 30.0% (1 $14.0
TOTAL SALES VOLUME $14.0
Warranted Space@ $900 Per Square Foot GLA 16,000@ $950 Per Square Foot GLA 15,000@ $1,000 Per Square Foot GLA 14,000
SOURCE: Kircher Research Associates Ltd.
1) The inflow level has been estimated as a percentage of the total sales volume, on Kircher Research Associates Ltd. estimates.
2) Rounded to the nearest 1,000 square feet GLA.
Square Feet GLA (2
SECTION 12
BUILDING AND OUTDOOR HOME SUPPLY STORE RESIDUAL DEMAND ANALYSIS
Bolton Market Study
Kircher Research Associates Ltd. Page 42
SECTION 12
BUILDING AND OUTDOOR HOME SUPPLY STORE
RESIDUAL DEMAND ANALYSIS
This section of the study presents our analysis of the expenditure potential that would be
available to such a facility at this site. In 2013, the inventory in this category totals 175,200
square feet.
Calculation of Building and Outdoor Home Supply Store Expenditure Potential
The building and outdoor home supply store category includes expenditures at home
improvement centres, hardware stores, specialized building materials outlets and garden centres.
The method used to calculate per capita building and outdoor home supply store expenditures
from Statistics Canada data is presented in Table E-5. The analytical approach used to examine
the building and outdoor home supply store category is similar to the approach used for other
retail categories in the preceding sections of this study.
The relationship between per capita income and per capita building and outdoor home supply
store expenditures has been summarized in Table 15 for the Province of Ontario and the Study
Area. The upper portion of this table shows the relationship between per capita income and per
capita building and outdoor home supply store expenditures in Ontario for selected years
between 1991 and 2013. As with the other retail categories analyzed in previous sections of this
study, the per capita building and outdoor home supply store expenditures shown in Table 15
reflect the revised intercensal population estimates discussed in Section 4 of this study and are
consistent with the per capita income levels derived from Table 2.
Between 1991 and 2013, per capita income growth in Ontario has been accompanied by higher
per capita building and outdoor home supply store expenditures. The share of income
represented by building and outdoor home supply store expenditures has increased substantially
during this period. In 1991, Ontario residents spent an average of $289 per person on building
and outdoor home supply store expenditures, or about 1.2% of their per capita income of
$23,751. By 2013, per capita building and outdoor home supply store expenditures in Ontario
had increased to $733, or about 1.8 % of their per capita income of $ 40,996.
Bolton Market Study
Kircher Research Associates Ltd. Page 43
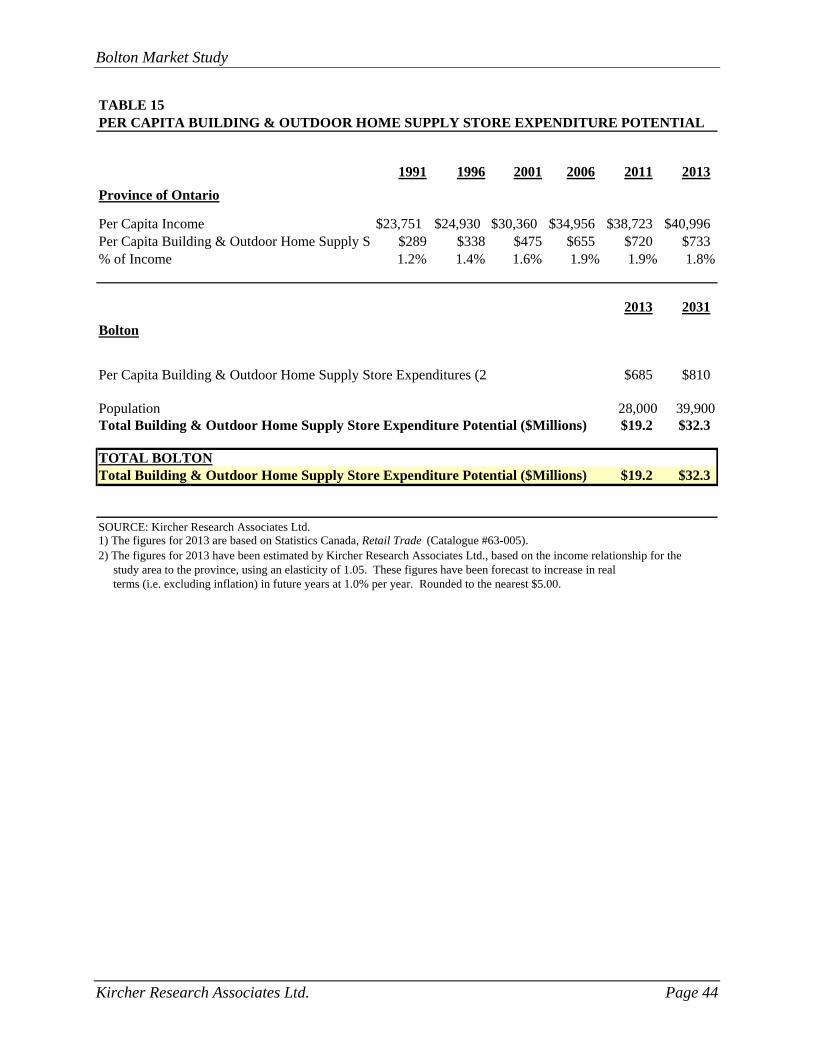
The 2013 per capita building and outdoor home supply store expenditures for the Study Area
have been indicated in the lower portion of Table 15. This estimate has been calculated based on
the income relationship between the province and the Study Area, using an income elasticity
factor of 1.05. The derivation of this income elasticity factor has been explained in Appendix D.
Future per capita expenditures are estimated to increase at 1.0% per year.
Bolton Market Study
Kircher Research Associates Ltd. Page 44
TABLE 15PER CAPITA BUILDING & OUTDOOR HOME SUPPLY STORE EXPENDITURE POTENTIAL
1991 1996 2001 2006 2011 2013
Province of Ontario
Per Capita Income $23,751 $24,930 $30,360 $34,956 $38,723 $40,996Per Capita Building & Outdoor Home Supply S $289 $338 $475 $655 $720 $733% of Income 1.2% 1.4% 1.6% 1.9% 1.9% 1.8%
2013 2031
Bolton
Per Capita Building & Outdoor Home Supply Store Expenditures (2 $685 $810
Population 28,000 39,900Total Building & Outdoor Home Supply Store Expenditure Potential ($Millions) $19.2 $32.3
TOTAL BOLTONTotal Building & Outdoor Home Supply Store Expenditure Potential ($Millions) $19.2 $32.3
SOURCE: Kircher Research Associates Ltd.1) The figures for 2013 are based on Statistics Canada, Retail Trade (Catalogue #63-005). 2) The figures for 2013 have been estimated by Kircher Research Associates Ltd., based on the income relationship for the study area to the province, using an elasticity of 1.05. These figures have been forecast to increase in real terms (i.e. excluding inflation) in future years at 1.0% per year. Rounded to the nearest $5.00.
Bolton Market Study
Kircher Research Associates Ltd. Page 45
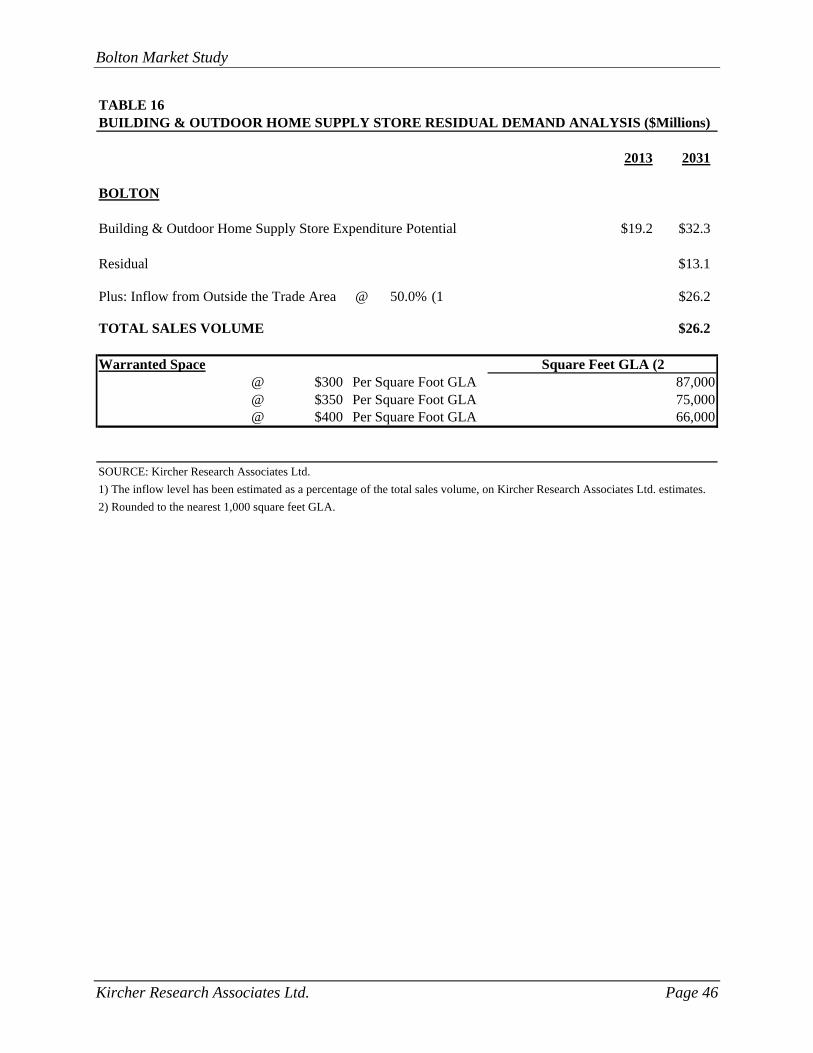
Building and Outdoor Home Supply Store Residual Demand Analysis
The total expenditure potential for Building and Outdoor Home Supply Stores in Bolton is
estimated at $ 19.2 million increasing to $ 32.3 million by 2031. On Table 16 we have shown the
residual potential totalling $ 13.1 million by 2031. Based on an estimated inflow of 50 % for this
category, total additional volume potential amounts to $ 26.2 million. At the mid point of the
range of applicable sales per square foot, this would indicate some 75,000 square feet of
additional warranted space by 2031.
Bolton Market Study
Kircher Research Associates Ltd. Page 46
TABLE 16BUILDING & OUTDOOR HOME SUPPLY STORE RESIDUAL DEMAND ANALYSIS ($Millions)
2013 2031
BOLTON
Building & Outdoor Home Supply Store Expenditure Potential $19.2 $32.3
Residual $13.1
Plus: Inflow from Outside the Trade Area @ 50.0% (1 $26.2
TOTAL SALES VOLUME $26.2
Warranted Space@ $300 Per Square Foot GLA 87,000@ $350 Per Square Foot GLA 75,000@ $400 Per Square Foot GLA 66,000
SOURCE: Kircher Research Associates Ltd.
1) The inflow level has been estimated as a percentage of the total sales volume, on Kircher Research Associates Ltd. estimates.
2) Rounded to the nearest 1,000 square feet GLA.
Square Feet GLA (2
SECTION 13
SERVICE SPACE DEMAND ANALYSIS
Bolton Market Study
Kircher Research Associates Ltd. Page 47
SECTION 13
SERVICE SPACE DEMAND ANALYSIS
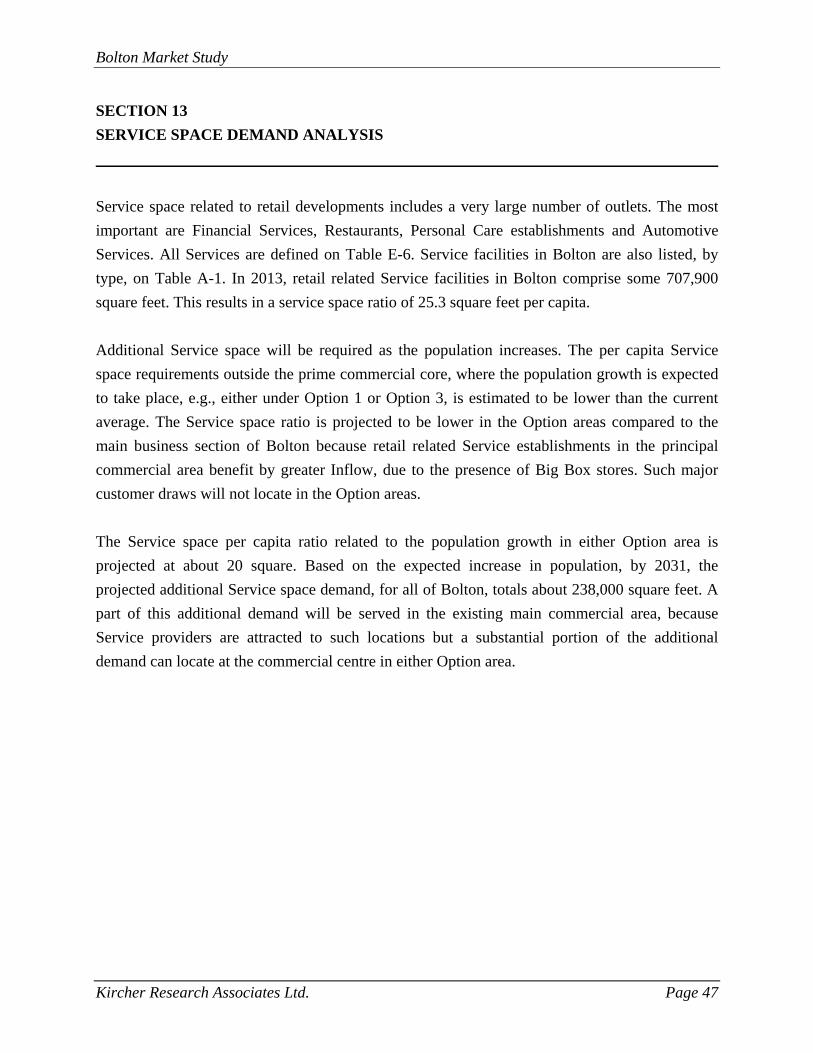
Service space related to retail developments includes a very large number of outlets. The most
important are Financial Services, Restaurants, Personal Care establishments and Automotive
Services. All Services are defined on Table E-6. Service facilities in Bolton are also listed, by
type, on Table A-1. In 2013, retail related Service facilities in Bolton comprise some 707,900
square feet. This results in a service space ratio of 25.3 square feet per capita.
Additional Service space will be required as the population increases. The per capita Service
space requirements outside the prime commercial core, where the population growth is expected
to take place, e.g., either under Option 1 or Option 3, is estimated to be lower than the current
average. The Service space ratio is projected to be lower in the Option areas compared to the
main business section of Bolton because retail related Service establishments in the principal
commercial area benefit by greater Inflow, due to the presence of Big Box stores. Such major
customer draws will not locate in the Option areas.
The Service space per capita ratio related to the population growth in either Option area is
projected at about 20 square. Based on the expected increase in population, by 2031, the
projected additional Service space demand, for all of Bolton, totals about 238,000 square feet. A
part of this additional demand will be served in the existing main commercial area, because
Service providers are attracted to such locations but a substantial portion of the additional
demand can locate at the commercial centre in either Option area.
Bolton Market Study
Kircher Research Associates Ltd. Page 48
TABLE 17SERVICE SPACE (SQ. FT.)
2013 2031
25 20
Population 28,000 39,900Residual Population 25.282 11900
Service Space / Capita 20.0
Additional Service Space 238,000
SOURCE: Kircher Research Associates Ltd.
NOTE: Existing service level is 25.3 sq. ft. / capita (708,000 sq. ft. / 28,000 persons)
APPENDIX A
REVIEW OF COMPETITIVE RETAIL FACILITIES
Bolton Market Study
Kircher Research Associates Ltd. Page 49
APPENDIX A
REVIEW OF COMPETITIVE RETAIL FACILITIES
An inventory of competitive retail, service and vacant space was conducted in Bolton in May
2014. Bolton is the defined Study Area for this study. It is recognized that the Bolton Trade Area
extends about 25 km to the north and more than 5 km to the south, including East Caledon,
Tottenham, Nobleton and other areas. However, for this market analysis, the Study Area to be
analysed was limited to Bolton only. The inventory was used to measure and categorize the
amount of competitive retail space existing in the market area. The inventory was summarized
by retail cluster which have been identified on the following map. We have conducted a similar
inventory in 2002 and will be comparing the results in the following discussion.
Table A-1 includes an inventory of competitive retail space located in the Study Area. All retail
and related service space has been inventoried in Bolton. It totals 1,677,700 square feet. We have
grouped the inventory into three clusters, Downtown Bolton, Queen Street South, and Other
South Bolton.
Cluster 1 comprised the historic Bolton Downtown. It consists of numerous small specialty
stores and a large selection of services. The current vacancy level of about 17,300 square feet or
10.2% is somewhat above normal, which typically ranges between 5.0% and 7.5%. The total
inventory of the Downtown area includes 170,100 square feet. That compares to 199,200 square
feet in 2002, when we undertook an inventory of this area. However, at that time it was
necessary to inventory office space as well which is not included in this inventory. Excluding the
2002 office space for comparison purposes would show an inventory of 176,800 square feet in
2002. Thus, the decline in retail/service space in Downtown between 2002 and 2014 was about
6,700 square feet. Since the total commercial inventory in Bolton has experienced a very large
increase since 2002, the Downtown area total retail and related service space has been relatively
constant during that time.
Cluster 2 includes the Queen Street South Strip. It totals 440,700 square feet of retail and related
service space. The largest retailer in this area is Zehrs. There is approximately 53,000 square feet
of vacant space in cluster 2, indicating a CRU vacancy of 14.3% which is significantly greater
than the Downtown vacancy and well above normal. In 2002, this area contained 360,400 square
feet. Thus, it experienced a net increase of about 80,600 square feet by 2014.
Bolton Market Study
Kircher Research Associates Ltd. Page 50
Cluster 3, Other South Bolton, includes 1,066,900 square feet of retail and related service space.
This cluster includes the largest ‘Big Box’ stores in Bolton, e.g. Wal-Mart Supercentre, Canadian
Tire and Home Depot. The Cluster’s vacancy stands at 66,600 square feet which lies in the
normal range. In 2002, our inventory for that area showed 255,500 square feet. However, it must
be stressed that there are some significant technical differences between these two inventories. In
2014, we included the retail and related service space in the Industrial Area which was not
included in 2002. This industrial retail/service space comprises now approximately 350,000
square feet. Furthermore, in 2014 (for simplicity) we included the Caledon Centre for Recreation
and Wellness in this third cluster, even though it is located in North Bolton. It is estimated to
comprise about 68,000 square feet. The comparable inventory therefore is 648,900 square feet.
Our inventory for cluster 3, in 2002, excluding office space is, 211,500 square feet. By
recognizing these differences, we can determine the comparable difference in inventories
between 2002 and 2014, for Cluster 3. It totalled some 437,400 square feet (648,900-211,500).
The total retail and related service space in Bolton in 2014 comprises 1,677,700 square feet. As
indicated on Table A-1, the inventory has been distributed between the various retail and service
categories. The total current vacancy level in Bolton is 136,900 square feet or 9.1%, which is
above a normal vacancy level. The inventory differences between 2002 and 2014 were explained
above. In summary, the retail and related services pace in Bolton increased by slightly more than
500,000 square feet between 2002 and 2014. During that time period the greater Bolton Study
Area, which extends well beyond the Bolton urban area, had reached the threshold where Box
stores could enter the market. Between 2002 and 2014, the population in itself Bolton increased
by about 8,000 persons.
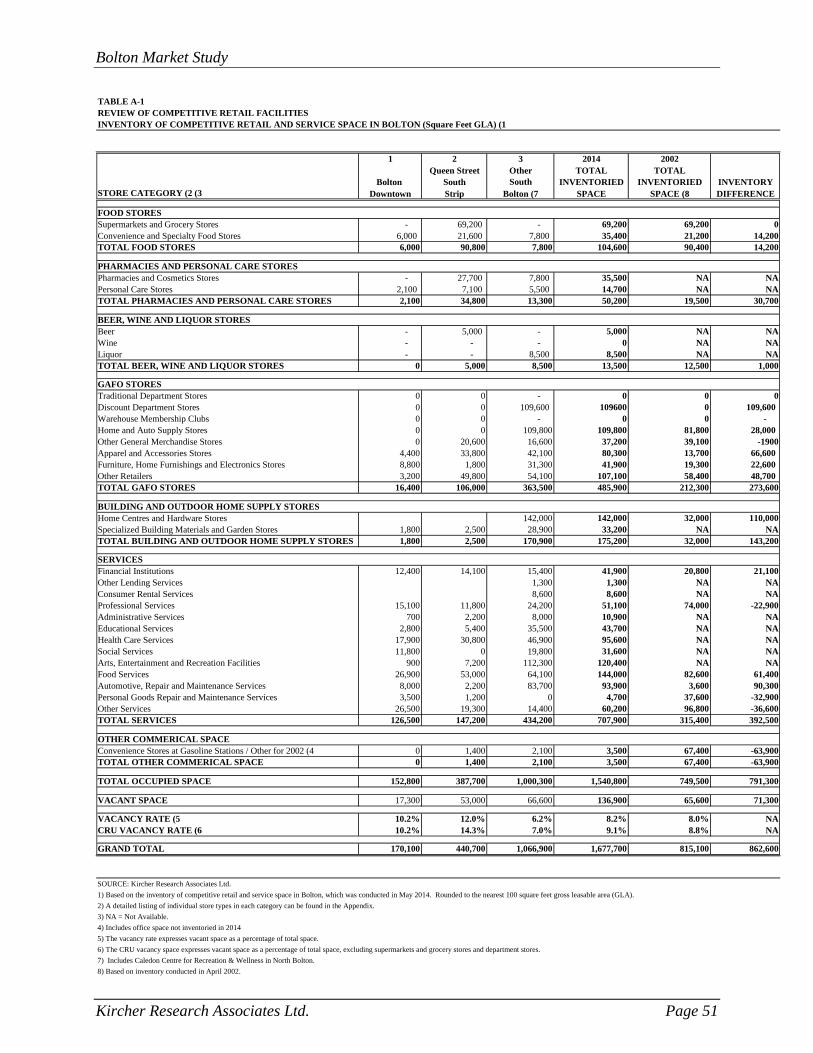
Bolton Market Study
Kircher Research Associates Ltd. Page 51
TABLE A-1REVIEW OF COMPETITIVE RETAIL FACILITIESINVENTORY OF COMPETITIVE RETAIL AND SERVICE SPACE IN BOLTON (Square Feet GLA) (1
1 2 3 2014 2002Queen Street Other TOTAL TOTAL
Bolton South South INVENTORIED INVENTORIED INVENTORYSTORE CATEGORY (2 (3 Downtown Strip Bolton (7 SPACE SPACE (8 DIFFERENCE
FOOD STORESSupermarkets and Grocery Stores - 69,200 - 69,200 69,200 0Convenience and Specialty Food Stores 6,000 21,600 7,800 35,400 21,200 14,200TOTAL FOOD STORES 6,000 90,800 7,800 104,600 90,400 14,200
PHARMACIES AND PERSONAL CARE STORESPharmacies and Cosmetics Stores - 27,700 7,800 35,500 NA NAPersonal Care Stores 2,100 7,100 5,500 14,700 NA NATOTAL PHARMACIES AND PERSONAL CARE STORES 2,100 34,800 13,300 50,200 19,500 30,700
BEER, WINE AND LIQUOR STORESBeer - 5,000 - 5,000 NA NAWine - - - 0 NA NALiquor - - 8,500 8,500 NA NATOTAL BEER, WINE AND LIQUOR STORES 0 5,000 8,500 13,500 12,500 1,000
GAFO STORESTraditional Department Stores 0 0 - 0 0 0Discount Department Stores 0 0 109,600 109600 0 109,600 Warehouse Membership Clubs 0 0 - 0 0 - Home and Auto Supply Stores 0 0 109,800 109,800 81,800 28,000 Other General Merchandise Stores 0 20,600 16,600 37,200 39,100 -1900Apparel and Accessories Stores 4,400 33,800 42,100 80,300 13,700 66,600 Furniture, Home Furnishings and Electronics Stores 8,800 1,800 31,300 41,900 19,300 22,600 Other Retailers 3,200 49,800 54,100 107,100 58,400 48,700 TOTAL GAFO STORES 16,400 106,000 363,500 485,900 212,300 273,600
BUILDING AND OUTDOOR HOME SUPPLY STORESHome Centres and Hardware Stores 142,000 142,000 32,000 110,000Specialized Building Materials and Garden Stores 1,800 2,500 28,900 33,200 NA NATOTAL BUILDING AND OUTDOOR HOME SUPPLY STORES 1,800 2,500 170,900 175,200 32,000 143,200
SERVICES Financial Institutions 12,400 14,100 15,400 41,900 20,800 21,100Other Lending Services 1,300 1,300 NA NAConsumer Rental Services 8,600 8,600 NA NAProfessional Services 15,100 11,800 24,200 51,100 74,000 -22,900Administrative Services 700 2,200 8,000 10,900 NA NAEducational Services 2,800 5,400 35,500 43,700 NA NAHealth Care Services 17,900 30,800 46,900 95,600 NA NASocial Services 11,800 0 19,800 31,600 NA NAArts, Entertainment and Recreation Facilities 900 7,200 112,300 120,400 NA NAFood Services 26,900 53,000 64,100 144,000 82,600 61,400Automotive, Repair and Maintenance Services 8,000 2,200 83,700 93,900 3,600 90,300Personal Goods Repair and Maintenance Services 3,500 1,200 0 4,700 37,600 -32,900Other Services 26,500 19,300 14,400 60,200 96,800 -36,600TOTAL SERVICES 126,500 147,200 434,200 707,900 315,400 392,500
OTHER COMMERICAL SPACE Convenience Stores at Gasoline Stations / Other for 2002 (4 0 1,400 2,100 3,500 67,400 -63,900TOTAL OTHER COMMERICAL SPACE 0 1,400 2,100 3,500 67,400 -63,900
TOTAL OCCUPIED SPACE 152,800 387,700 1,000,300 1,540,800 749,500 791,300
VACANT SPACE 17,300 53,000 66,600 136,900 65,600 71,300
VACANCY RATE (5 10.2% 12.0% 6.2% 8.2% 8.0% NACRU VACANCY RATE (6 10.2% 14.3% 7.0% 9.1% 8.8% NA
GRAND TOTAL 170,100 440,700 1,066,900 1,677,700 815,100 862,600
SOURCE: Kircher Research Associates Ltd.
1) Based on the inventory of competitive retail and service space in Bolton, which was conducted in May 2014. Rounded to the nearest 100 square feet gross leasable area (GLA).
2) A detailed listing of individual store types in each category can be found in the Appendix.
3) NA = Not Available.
4) Includes office space not inventoried in 2014
5) The vacancy rate expresses vacant space as a percentage of total space.
6) The CRU vacancy space expresses vacant space as a percentage of total space, excluding supermarkets and grocery stores and department stores.
7) Includes Caledon Centre for Recreation & Wellness in North Bolton.
8) Based on inventory conducted in April 2002.
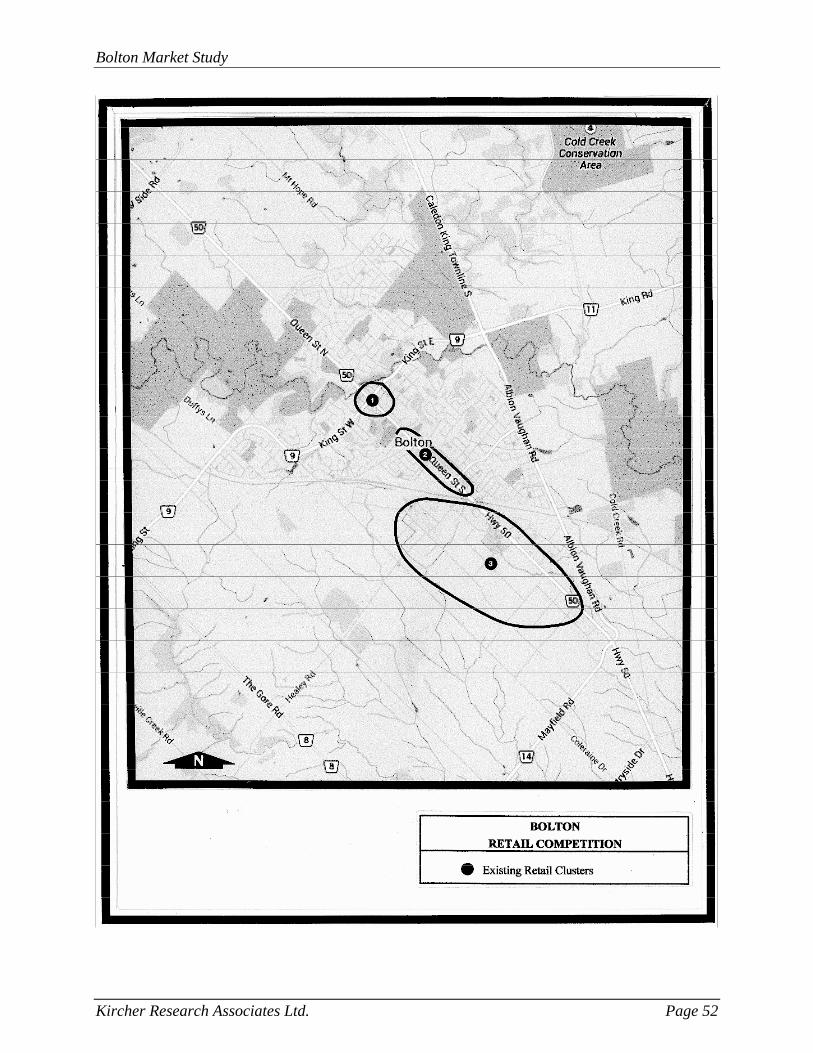
Bolton Market Study
Kircher Research Associates Ltd. Page 52

APPENDIX B
LICENSE PLATE SURVEYS
Bolton Market Study
Kircher Research Associates Ltd. Page 53
APPENDIX B
LICENCE PLATE SURVEYS
Some 525 Licence plate surveys were conducted at the major retail areas in south Bolton, on
Thursday, Friday and Saturday, May 1-3, 2014, covering different opening hour segments of the
retail stores. The licence plate numbers were submitted to the Ontario Ministry of
Transportation, which provided the dissemination area (DA) corresponding to the address of the
registered owner of each surveyed vehicle. The location of each DA has been plotted on the map
contained in this appendix.
Licence plate numbers provide information about the locations of the registered owners of
vehicles. As such, a survey of this type needs to be treated with caution, since the registered
vehicle owner and the shopper may not be the same person. Furthermore, such surveys do not
provide information about expenditures. Based on our experience, licence plate surveys and
customer interviews at the same location can provide different results. In fact, we know from
prior experience in Bolton, that licence plate surveys may overstate the inflow to some extend,
particularly for food retailers. For example a license plate survey conducted in 2005 by the
Town’s consultant at the Zehrs store, indicated a local capture of about 45% which indicates an
inflow of 55%. At that time, we conducted an in-store customer survey at the same store which
indicated a local capture of about 60% and an inflow of about 40%. Nevertheless, when in-store
surveys are not possible, as a general indication of customer draw, licence plate surveys are
preferred to pure estimates.
As indicated on Table B-1, about 50.3% of all license plates had a Bolton address. Due to the
large box stores located in Bolton, many of their customers come from other residential areas
surrounding Bolton. We refer to this as the ‘Other Area of Influence’, which could be equated to
a Secondary Zone, if a comprehensive overall market study was undertaken. Some 25 % of
vehicles came from this area. The remaining 24.7 % of customers came from more distant areas.
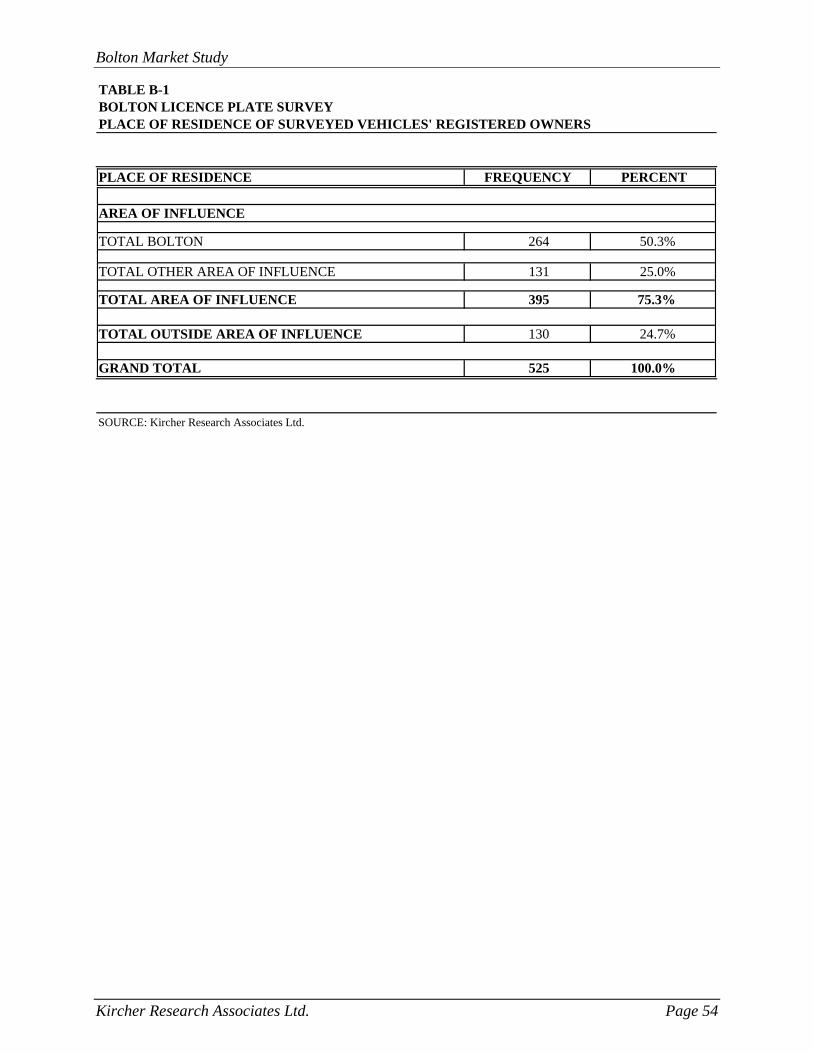
Bolton Market Study
Kircher Research Associates Ltd. Page 54
TABLE B-1BOLTON LICENCE PLATE SURVEYPLACE OF RESIDENCE OF SURVEYED VEHICLES' REGISTERED OWNERS
AREA OF INFLUENCE
TOTAL BOLTON 264 50.3%
TOTAL OTHER AREA OF INFLUENCE 131 25.0%
TOTAL AREA OF INFLUENCE 395 75.3%
TOTAL OUTSIDE AREA OF INFLUENCE 130 24.7%
GRAND TOTAL 525 100.0%
SOURCE: Kircher Research Associates Ltd.
PLACE OF RESIDENCE FREQUENCY PERCENT
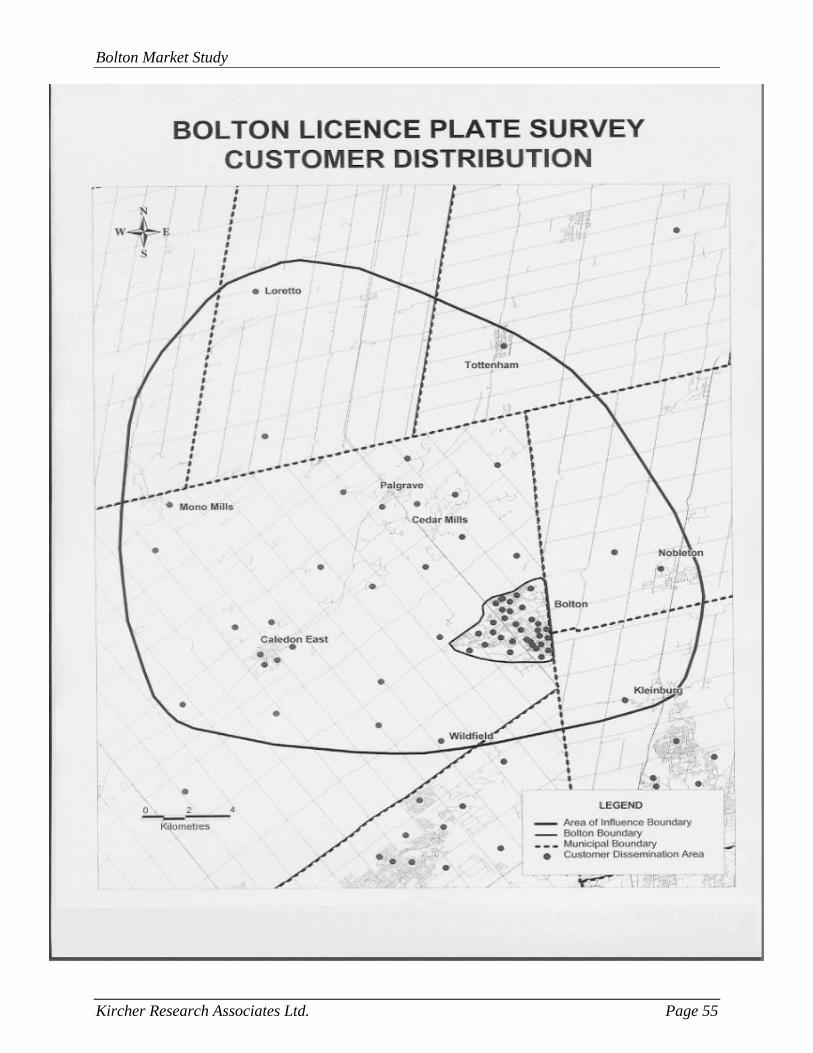
Bolton Market Study
Kircher Research Associates Ltd. Page 55
APPENDIX C
HISTORIC REAL GROWTH IN RETAIL EXPENDITURES
Bolton Market Study
Kircher Research Associates Ltd. Page 56
APPENDIX C
HISTORIC REAL GROWTH IN RETAIL EXPENDITURES
In order to estimate future retail expenditure levels, we have reviewed the historic changes in
consumer spending for the food, GAFO, Pharmacy, Beer/Wine & Liquor store, and Building and
Outdoor Home Supply stores categories. These categories are expected to comprise the largest
portion of the retail space at any future retail commercial development in Bolton.
Consumer Price Index (CPI) data published by Statistics Canada have been used in this analysis
to remove the effect of inflation on retail expenditures, thereby providing expenditure levels that
can be compared between different years. CPI data reflect changes in the cost of goods to
consumers, including all sales taxes. The per capita retail expenditure estimates presented in this
appendix and throughout this study reflect the revised intercensal population estimates discussed
earlier in this study.
Historic Real Growth in Food Store Expenditures in Ontario
Table C-1 summarizes the real changes in per capita food store expenditures for the Province of
Ontario between 1991 and 2013. The calculation of per capita food store expenditures in Ontario
for 2013 has been illustrated in Table E-1 of Appendix E.
The current dollar per capita food store expenditure estimates for each year are shown in the
second column of Table C-1. The yearly inflation estimates for Ontario for food purchased from
stores, using 1991 and 2002 as the base years, have been indicated in the third and fourth
columns of Table C-1. Constant 1991-dollar estimates of per capita food store expenditures have
been calculated by removing inflation from the current dollar expenditure levels for each year
indicated. These constant 1991-dollar estimates are shown in the fifth column of the table. The
final column in the table presents the year-to-year percentage change between the constant
1991-dollar expenditure figures. This represents the real growth or decline in per capita food
store expenditures.
Between 1991 and 2013, real per capita food store expenditures in Ontario experienced a net
decrease of about 1.6 %, resulting in average annual real decline of 0.1 % during this period.
However, between 2004 and 2013, there was an average annual real decline of 0.8%, reflecting
Bolton Market Study
Kircher Research Associates Ltd. Page 57
the effects of the recent recession and the increasing food sales in non-standard food stores such
as Wal-Mart Supercentres, Target, Costco and Shoppers Drug Mart. Grocery sales in such stores
are not included in the Food Store Category as defined by Statscan. For future years, we have
held per capita Food Store expenditures constant, which may be optimistic.
Historic Real Growth in GAFO Store Expenditures in Ontario
Table C-2 presents the real changes in per capita GAFO store expenditures for the Province of
Ontario between 1991 and 2013. The calculation of per capita GAFO store expenditures in
Ontario for 2013 has been illustrated in Table E-2 of Appendix E.
Between 1991 and 2013, real per capita GAFO store expenditures in Ontario increased by a total
of 27.8 %, or an average of about 1.3% per year. More recently, between 2004 and 2013, the
increase averaged only 0.3% per year, reflecting the recent recession. For the future study
period, we expect an average growth rate of 0.5% per year.
Historic Real Growth in other Retail Store Expenditures in Ontario
Similar calculations are shown on Tables C-3 through C-5 for the other categories. The growth in
Pharmacy and Personal Care stores between 1991 and 20013 averaged 2.5% per year ( 1.5%
between 2004 and 2013). In this study we are projecting 1.5% for future years. In the Beer/Wine
& Liquor category the 1991-2013 growth averaged 0.5% per year ( 0.8 % between 2004 and
2013). We are projecting growth of 0.8% per year for future years. Finally, in the Building and
Outdoor Home Supply Store category the average growth in expenditures between 1991 and
2013 was 3.6 % per year (0.9 % between 2004 and 2013). We are projecting this category
expenditure to grow at 1.0% per year during the study period.

Bolton Market Study
Kircher Research Associates Ltd. Page 58
TABLE C-1HISTORIC REAL GROWTHIN FOOD STORE EXPENDITURES IN ONTARIO
Per Capita Consumer Per CapitaFood Store Price Index (2 Food Store Annual
Expenditures (1 1991 2002 Expenditures RealYear (Current $) Base Base (Constant 1991 $) Growth
1991 $1,476 100.0 85.3 $1,4760.6%
1992 $1,442 97.1 82.8 $1,485-1.6%
1993 $1,471 100.7 85.9 $1,4613.8%
1994 $1,512 99.7 85.1 $1,517-0.5%
1995 $1,560 103.3 88.1 $1,510-7.0%
1996 $1,457 103.8 88.5 $1,4044.2%
1997 $1,519 103.8 88.5 $1,4631.9%
1998 $1,567 105.1 89.6 $1,491-2.1%
1999 $1,561 106.9 91.2 $1,4600.9%
2000 $1,594 108.2 92.3 $1,473-4.1%
2001 $1,607 113.7 97.0 $1,4131.0%
2002 $1,673 117.2 100.0 $1,4274.0%
2003 $1,763 118.8 101.3 $1,4845.1%
2004 $1,885 120.8 103.0 $1,560-0.3%
2005 $1,937 124.5 106.2 $1,556-1.6%
2006 $1,943 126.9 108.2 $1,5310.4%
2007 $1,994 129.7 110.6 $1,5371.6%
2008 $2,113 135.3 115.4 $1,562-1.3%
2009 $2,194 142.3 121.4 $1,542-3.3%
2010 $2,152 144.3 123.1 $1,491-3.1%
2011 $2,187 151.3 129.1 $1,445-0.4%
2012 $2,226 154.7 132.0 $1,4391.0%
2013 $2,276 156.6 133.6 $1,453
Net Real Growth, 1991 to 2013 -1.6%Average Annual Real Growth, 1991 to 2013 -0.1%Average Annual Real Growth, 2004 to 2013 -0.8%
SOURCE: Kircher Research Associates Ltd.1) Represents expenditures made in food stores, which include supermarkets, grocery stores, convenience stores and specialty food stores. See Appendix for a complete list of these stores.2) Represents the Consumer Price Index (CPI) for Ontario for Food Purchased from Stores, based on Statistics Canada, Consumer Prices and Price Indices (Catalogue #62-010) and The Consumer Price Index (Catalogue #62-001).
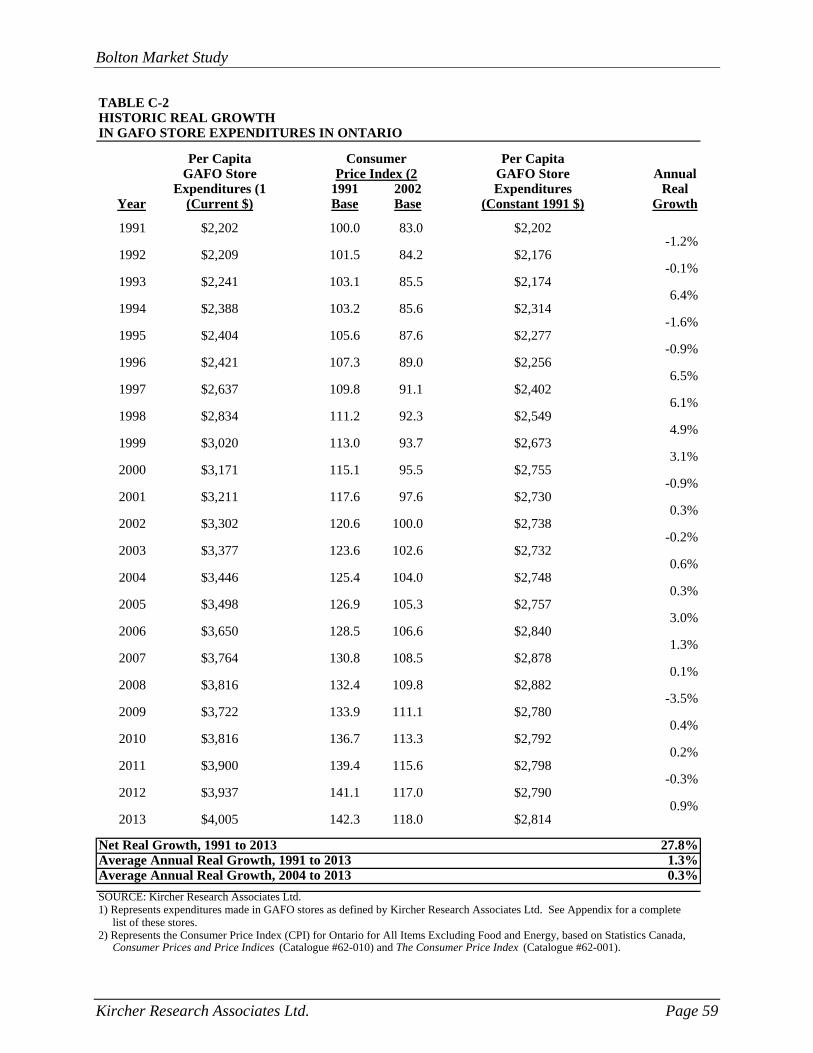
Bolton Market Study
Kircher Research Associates Ltd. Page 59
TABLE C-2HISTORIC REAL GROWTHIN GAFO STORE EXPENDITURES IN ONTARIO
Per Capita Consumer Per CapitaGAFO Store Price Index (2 GAFO Store Annual
Expenditures (1 1991 2002 Expenditures RealYear (Current $) Base Base (Constant 1991 $) Growth
1991 $2,202 100.0 83.0 $2,202-1.2%
1992 $2,209 101.5 84.2 $2,176-0.1%
1993 $2,241 103.1 85.5 $2,1746.4%
1994 $2,388 103.2 85.6 $2,314-1.6%
1995 $2,404 105.6 87.6 $2,277-0.9%
1996 $2,421 107.3 89.0 $2,2566.5%
1997 $2,637 109.8 91.1 $2,4026.1%
1998 $2,834 111.2 92.3 $2,5494.9%
1999 $3,020 113.0 93.7 $2,6733.1%
2000 $3,171 115.1 95.5 $2,755-0.9%
2001 $3,211 117.6 97.6 $2,7300.3%
2002 $3,302 120.6 100.0 $2,738-0.2%
2003 $3,377 123.6 102.6 $2,7320.6%
2004 $3,446 125.4 104.0 $2,7480.3%
2005 $3,498 126.9 105.3 $2,7573.0%
2006 $3,650 128.5 106.6 $2,8401.3%
2007 $3,764 130.8 108.5 $2,8780.1%
2008 $3,816 132.4 109.8 $2,882-3.5%
2009 $3,722 133.9 111.1 $2,7800.4%
2010 $3,816 136.7 113.3 $2,7920.2%
2011 $3,900 139.4 115.6 $2,798-0.3%
2012 $3,937 141.1 117.0 $2,7900.9%
2013 $4,005 142.3 118.0 $2,814
Net Real Growth, 1991 to 2013 27.8%Average Annual Real Growth, 1991 to 2013 1.3%Average Annual Real Growth, 2004 to 2013 0.3%
SOURCE: Kircher Research Associates Ltd.1) Represents expenditures made in GAFO stores as defined by Kircher Research Associates Ltd. See Appendix for a complete list of these stores.2) Represents the Consumer Price Index (CPI) for Ontario for All Items Excluding Food and Energy, based on Statistics Canada, Consumer Prices and Price Indices (Catalogue #62-010) and The Consumer Price Index (Catalogue #62-001).
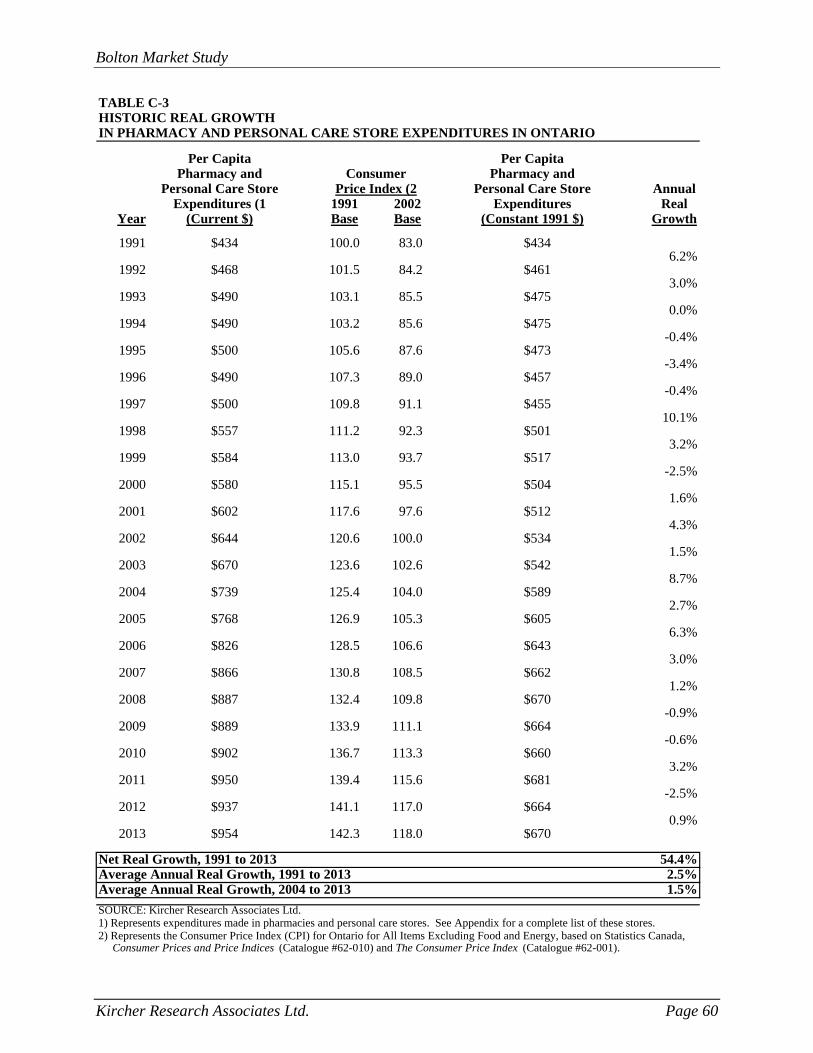
Bolton Market Study
Kircher Research Associates Ltd. Page 60
TABLE C-3HISTORIC REAL GROWTHIN PHARMACY AND PERSONAL CARE STORE EXPENDITURES IN ONTARIO
Per Capita Per CapitaPharmacy and Consumer Pharmacy and
Personal Care Store Price Index (2 Personal Care Store AnnualExpenditures (1 1991 2002 Expenditures Real
Year (Current $) Base Base (Constant 1991 $) Growth
1991 $434 100.0 83.0 $4346.2%
1992 $468 101.5 84.2 $4613.0%
1993 $490 103.1 85.5 $4750.0%
1994 $490 103.2 85.6 $475-0.4%
1995 $500 105.6 87.6 $473-3.4%
1996 $490 107.3 89.0 $457-0.4%
1997 $500 109.8 91.1 $45510.1%
1998 $557 111.2 92.3 $5013.2%
1999 $584 113.0 93.7 $517-2.5%
2000 $580 115.1 95.5 $5041.6%
2001 $602 117.6 97.6 $5124.3%
2002 $644 120.6 100.0 $5341.5%
2003 $670 123.6 102.6 $5428.7%
2004 $739 125.4 104.0 $5892.7%
2005 $768 126.9 105.3 $6056.3%
2006 $826 128.5 106.6 $6433.0%
2007 $866 130.8 108.5 $6621.2%
2008 $887 132.4 109.8 $670-0.9%
2009 $889 133.9 111.1 $664-0.6%
2010 $902 136.7 113.3 $6603.2%
2011 $950 139.4 115.6 $681-2.5%
2012 $937 141.1 117.0 $6640.9%
2013 $954 142.3 118.0 $670
Net Real Growth, 1991 to 2013 54.4%Average Annual Real Growth, 1991 to 2013 2.5%Average Annual Real Growth, 2004 to 2013 1.5%
SOURCE: Kircher Research Associates Ltd.1) Represents expenditures made in pharmacies and personal care stores. See Appendix for a complete list of these stores.2) Represents the Consumer Price Index (CPI) for Ontario for All Items Excluding Food and Energy, based on Statistics Canada, Consumer Prices and Price Indices (Catalogue #62-010) and The Consumer Price Index (Catalogue #62-001).
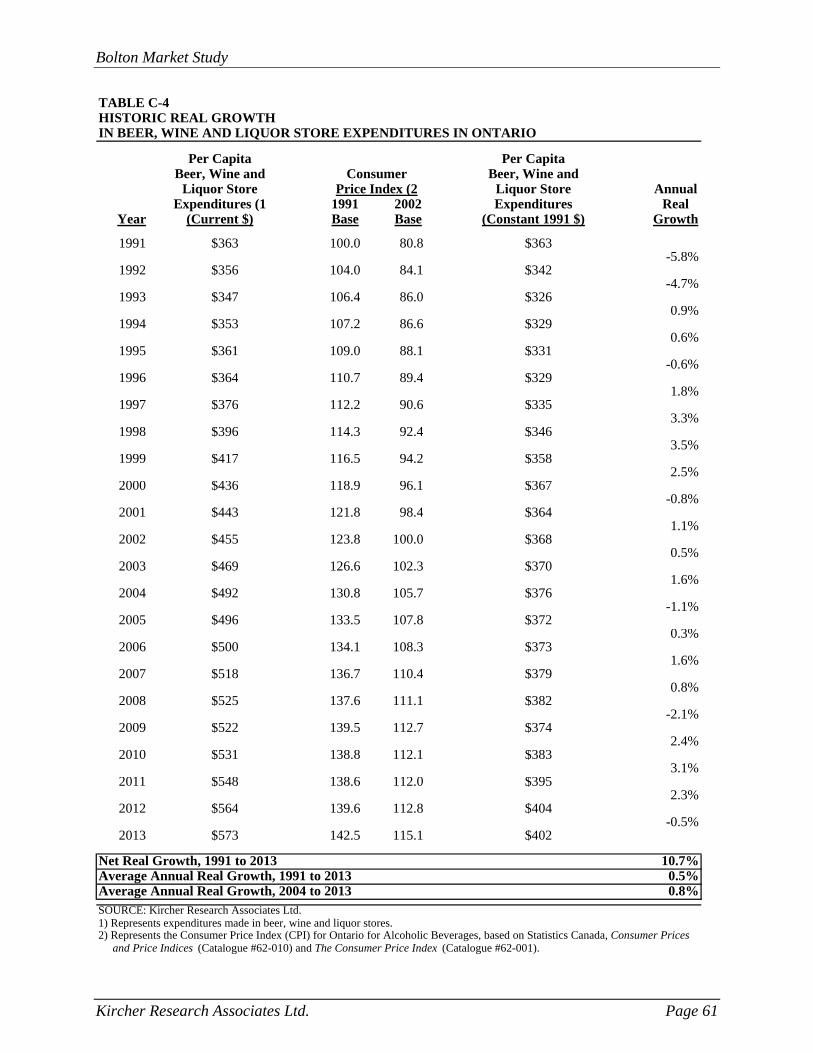
Bolton Market Study
Kircher Research Associates Ltd. Page 61
TABLE C-4HISTORIC REAL GROWTHIN BEER, WINE AND LIQUOR STORE EXPENDITURES IN ONTARIO
Per Capita Per CapitaBeer, Wine and Consumer Beer, Wine and
Liquor Store Price Index (2 Liquor Store AnnualExpenditures (1 1991 2002 Expenditures Real
Year (Current $) Base Base (Constant 1991 $) Growth
1991 $363 100.0 80.8 $363-5.8%
1992 $356 104.0 84.1 $342-4.7%
1993 $347 106.4 86.0 $3260.9%
1994 $353 107.2 86.6 $3290.6%
1995 $361 109.0 88.1 $331-0.6%
1996 $364 110.7 89.4 $3291.8%
1997 $376 112.2 90.6 $3353.3%
1998 $396 114.3 92.4 $3463.5%
1999 $417 116.5 94.2 $3582.5%
2000 $436 118.9 96.1 $367-0.8%
2001 $443 121.8 98.4 $3641.1%
2002 $455 123.8 100.0 $3680.5%
2003 $469 126.6 102.3 $3701.6%
2004 $492 130.8 105.7 $376-1.1%
2005 $496 133.5 107.8 $3720.3%
2006 $500 134.1 108.3 $3731.6%
2007 $518 136.7 110.4 $3790.8%
2008 $525 137.6 111.1 $382-2.1%
2009 $522 139.5 112.7 $3742.4%
2010 $531 138.8 112.1 $3833.1%
2011 $548 138.6 112.0 $3952.3%
2012 $564 139.6 112.8 $404-0.5%
2013 $573 142.5 115.1 $402
Net Real Growth, 1991 to 2013 10.7%Average Annual Real Growth, 1991 to 2013 0.5%Average Annual Real Growth, 2004 to 2013 0.8%SOURCE: Kircher Research Associates Ltd.1) Represents expenditures made in beer, wine and liquor stores.2) Represents the Consumer Price Index (CPI) for Ontario for Alcoholic Beverages, based on Statistics Canada, Consumer Prices and Price Indices (Catalogue #62-010) and The Consumer Price Index (Catalogue #62-001).
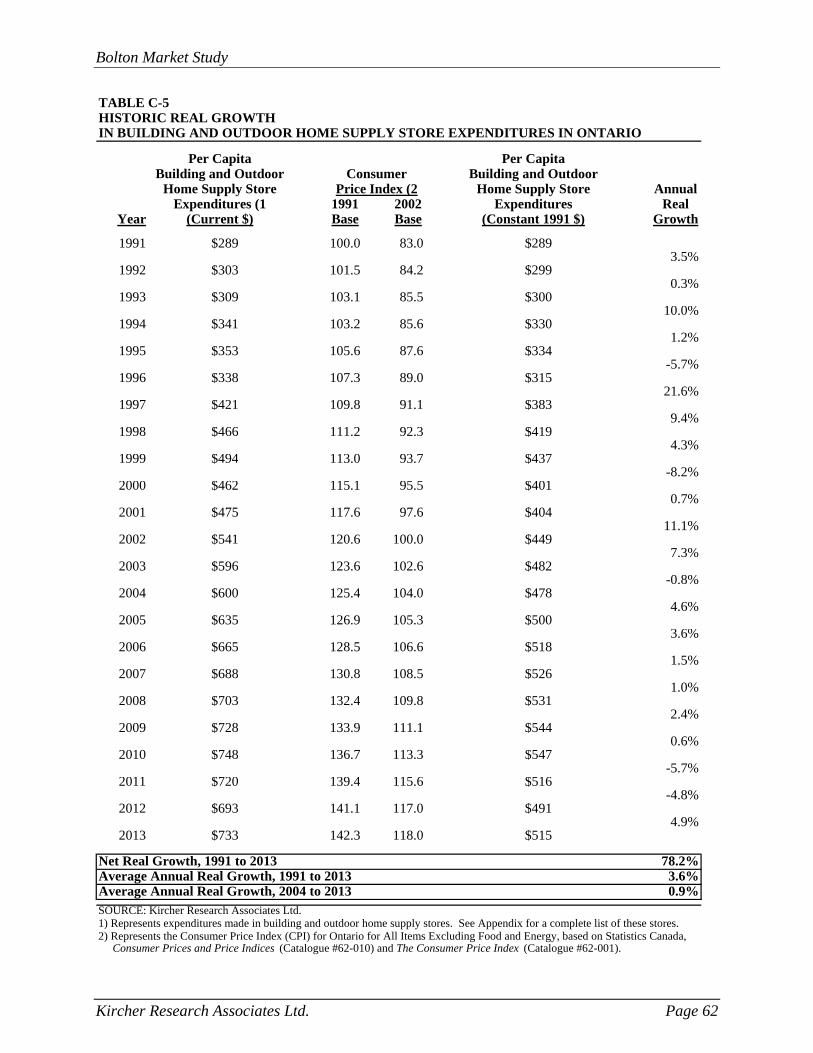
Bolton Market Study
Kircher Research Associates Ltd. Page 62
TABLE C-5HISTORIC REAL GROWTHIN BUILDING AND OUTDOOR HOME SUPPLY STORE EXPENDITURES IN ONTARIO
Per Capita Per CapitaBuilding and Outdoor Consumer Building and Outdoor
Home Supply Store Price Index (2 Home Supply Store AnnualExpenditures (1 1991 2002 Expenditures Real
Year (Current $) Base Base (Constant 1991 $) Growth
1991 $289 100.0 83.0 $2893.5%
1992 $303 101.5 84.2 $2990.3%
1993 $309 103.1 85.5 $30010.0%
1994 $341 103.2 85.6 $3301.2%
1995 $353 105.6 87.6 $334-5.7%
1996 $338 107.3 89.0 $31521.6%
1997 $421 109.8 91.1 $3839.4%
1998 $466 111.2 92.3 $4194.3%
1999 $494 113.0 93.7 $437-8.2%
2000 $462 115.1 95.5 $4010.7%
2001 $475 117.6 97.6 $40411.1%
2002 $541 120.6 100.0 $4497.3%
2003 $596 123.6 102.6 $482-0.8%
2004 $600 125.4 104.0 $4784.6%
2005 $635 126.9 105.3 $5003.6%
2006 $665 128.5 106.6 $5181.5%
2007 $688 130.8 108.5 $5261.0%
2008 $703 132.4 109.8 $5312.4%
2009 $728 133.9 111.1 $5440.6%
2010 $748 136.7 113.3 $547-5.7%
2011 $720 139.4 115.6 $516-4.8%
2012 $693 141.1 117.0 $4914.9%
2013 $733 142.3 118.0 $515
Net Real Growth, 1991 to 2013 78.2%Average Annual Real Growth, 1991 to 2013 3.6%Average Annual Real Growth, 2004 to 2013 0.9%SOURCE: Kircher Research Associates Ltd.1) Represents expenditures made in building and outdoor home supply stores. See Appendix for a complete list of these stores.2) Represents the Consumer Price Index (CPI) for Ontario for All Items Excluding Food and Energy, based on Statistics Canada, Consumer Prices and Price Indices (Catalogue #62-010) and The Consumer Price Index (Catalogue #62-001).
APPENDIX D
ELASTICITY OF RETAIL EXPENDITURES TO INCOME
Bolton Market Study
Kircher Research Associates Ltd. Page 63
APPENDIX D
ELASTICITY OF RETAIL EXPENDITURES TO INCOME
Statistics Canada regularly publishes Retail Trade statistics on a provincial basis, which permits
us to calculate the average retail expenditures of the population residing in each province.
Tables D-1 through D-5 in Appendix D illustrates these expenditure calculations for the Ontario
retail store categories under study.
In order to conduct a market study for a particular Study Area, it is necessary to calculate the
average per capita retail expenditures of the population residing in that Study Area. However,
statistics comparable to the provincial data produced by Statistics Canada are not readily
available for lower levels of geography. It is necessary, therefore, to derive estimates of local
average per capita retail expenditures through some other means.
Since there is a clear correlation between income and expenditures, we can use the relationship
between the income levels of a particular Study Area and the province to estimate the average
per capita retail expenditures in that Study Area from the expenditure levels in the province.
This allows us to benefit from the general availability of income statistics at lower levels of
geography. For example, provincial and local per capita income levels can be calculated from
Census of Canada data published for all levels of geography by Statistics Canada every five
years, as well as from the Canada Revenue Agency’s Taxation Statistics data, which provide
income statistics for municipalities on an annual basis.
The relationship between income levels and retail expenditures is not a direct one. It is instead
influenced by what is referred to as the income elasticity factor, which is defined as the degree to
which a change in retail expenditures results from a change in income. This appendix examines
the income elasticity factors for the retail store categories under study for Ontario between 1991
and 2013.
It is important to recognize that retail sales in market analyses deal with sales by store types
rather than by product categories. Food store sales are those made in a specifically defined
group of stores, but do not include grocery merchandise sales made in stores not defined as food
stores by Statistics Canada. Similarly, GAFO store sales are those made in a separate and
distinct group of stores.

Bolton Market Study
Kircher Research Associates Ltd. Page 64
Calculation of Elasticity to Income for Food Store Expenditures in Ontario
Table D-1 illustrates the calculation of the elasticity of retail expenditures to income for the food
store category in Ontario between 1991 and 2013. The current dollar per capita income
estimates for each year are shown in the second column of the table, while the third column
presents the year-to-year percentage change in the income levels. Similarly, the fourth and fifth
columns of the table show the per capita food store expenditures for each year, as well as the
annual changes in these expenditures. By comparing the annual change in income to the annual
change in expenditures, we can calculate the income elasticity factor for each year. The results
of these calculations are presented in the sixth and final column of the table.
For example, Table D-1 shows that between 1996 and 1997 average per capita income in Ontario
increased by 3.4% while average per capita food store expenditures increased by 4.3%. This
indicates that food store expenditures during this period increased faster on a percentage basis
than income, thereby resulting in an elasticity factor of 1.3. During other periods, incomes
increased faster than expenditures, resulting in an elasticity factor of less than 1.0. For example,
between 1997 and 1998, income increased by 3.9% while food store expenditures increased by
3.2%, resulting in an elasticity factor of about 0.8.
Between 1991 and 2013, incomes increased by a total of 72.6 %, or by 2.5 % on an average
annual basis. This compares to a food store expenditure increase totalling 54.2 % over this time
period, or about 2.0% per year. This results in an average income elasticity factor for the food
store category in Ontario over this time period of about 0.7.
Calculation of Elasticity to Income for GAFO Store Expenditures in Ontario
Table D-2 presents the calculation of the elasticity of retail expenditures to income for the GAFO
store category in Ontario between 1991 and 2013. It follows the same methodology as explained
for the food store category. As indicated, per capita GAFO store expenditures in Ontario
increased by 81.9 % between 1991 and 2013, or an average of 2.8 % per year, while per capita
income increased by an average of 2.5% per year. Therefore, the average income elasticity
factor for this category in Ontario over this time period is calculated at 1.1.
Bolton Market Study
Kircher Research Associates Ltd. Page 65
Calculation of Elasticity to Income for Other Retail Categories in Ontario
Based on the same methodology as explained above, the 1991-2013 average elasticity for
Pharmacy and Personal Care Stores (Table D-3) was 1.7. For Beer/Wine & Liquor (Table D-4),
it was 0.8; and for Building and Outdoor Home Supply stores (Table D-5), it was 2.1.
Conclusions
There are some limitations to the income elasticity approach outlined above, which can be
summarized as follows: a) Both income and expenditures are expressed in nominal dollar values. If inflation in
general varies between total income and expenditures, fluctuations could arise based on
that factor. b) The elasticity factors calculated above are based on different time periods, i.e. 1991 as
compared to 1992. The application of an elasticity factor in a market study is usually
confined to the same time period. c) The average annual method employed cannot recognize expenditure variations between
income groups during the same time interval. d) These calculations cannot recognize changes in expenditures resulting from credit
purchases, or food store purchases in retail establishments not officially classified as food
stores. e) Income as defined in this analysis does not recognize the monetary value that consumers
may obtain from the sale of assets (i.e. capital gains), by leveraging the equity generated
by rapidly rising housing values or from inherited funds. Part of these additional funds
may be spent on retail expenditures. To the extent that this occurs, average income levels
are likely underestimated.
For these reasons, and based on our long term experience that retail expenditures in general tend
to grow at a lesser rate than income, we have selected elasticity rates in this market study that are
about one half of the figures calculated in Tables D-1 through D-5. This tends to moderate the
differences in income and expenditures between different geographic areas, where incomes may
vary from the provincial level.

Bolton Market Study
Kircher Research Associates Ltd. Page 66
TABLE D-1CALCULATION OF ELASTICITY OF RETAIL EXPENDITURES TO INCOMEFOR FOOD STORE EXPENDITURES IN ONTARIO
Elasticity ofPer Capita Food Store
Per Capita Percentage Food Store Percentage ExpendituresYear Income (1 Increase Expenditures (2 Increase to Income (31991 $23,751 -- $1,476 -- --1992 $24,010 1.1% $1,442 -2.3% NA 1993 $23,960 -0.2% $1,471 2.0% NA 1994 $24,095 0.6% $1,512 2.8% 4.71995 $24,785 2.9% $1,560 3.2% 1.11996 $24,930 0.6% $1,457 -6.6% NA 1997 $25,786 3.4% $1,519 4.3% 1.31998 $26,801 3.9% $1,567 3.2% 0.81999 $27,959 4.3% $1,561 -0.4% NA 2000 $29,751 6.4% $1,594 2.1% 0.32001 $30,360 2.0% $1,607 0.8% NA 2002 $30,553 0.6% $1,673 4.1% 6.82003 $31,132 1.9% $1,763 5.4% 2.82004 $32,363 4.0% $1,885 6.9% 1.72005 $33,480 3.5% $1,937 2.8% 0.82006 $34,956 4.4% $1,943 0.3% 0.12007 $36,430 4.2% $1,994 2.6% 0.62008 $37,050 1.7% $2,113 6.0% 3.52009 $36,722 -0.9% $2,194 3.8% NA 2010 $37,803 2.9% $2,176 -0.8% NA 2011 $38,405 1.6% $2,187 0.5% 0.32012 $39,900 3.9% $2,226 1.8% 0.52013 $41,000 2.8% $2,276 2.2% 0.8
For 1991 to 2013:Total Growth 72.6% 54.2%Average Annual Compound Growth 2.5% 2.0%Expenditure Elasticity 0.7
SOURCE: Kircher Research Associates Ltd.1) The figures for 1991 to 2005 are based on Statistics Canada, Provincial and Territorial Economic Accounts: Data Tables, 2008 Estimates (Catalogue #13-018). The figures for 2006 to 2011 are based on Ontario Ministry of Finance, Ontario Economic Accounts, Third Quarter of 2011. Estimated 2012. Figures for 2012-2013 are based on CANSIM - Table 380-0063, Gross Domest Product, Income Based (seasonally adjusted).2) The figures for 1991 to 2013 are based on Statistics Canada, Retail Trade (Catalogue #63-005). 3) These figures have been calculated by dividing the percentage increase in per capita food store expenditures by the corresponding percentage increase in per capita income.
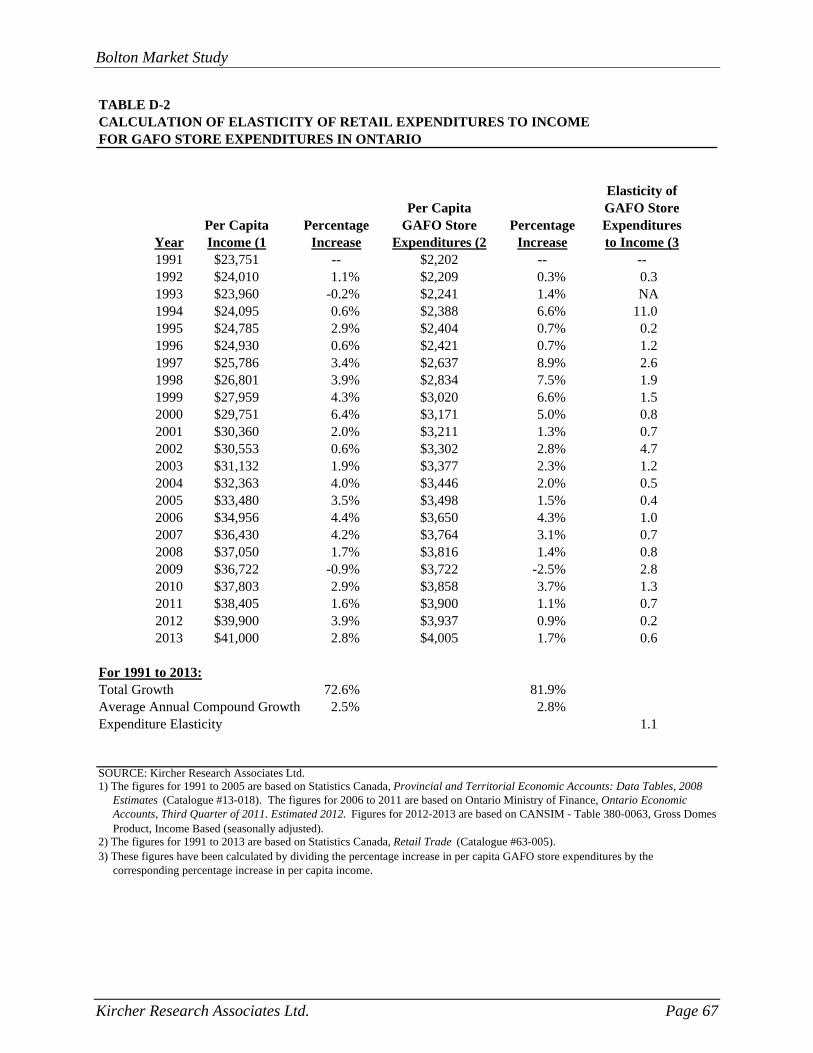
Bolton Market Study
Kircher Research Associates Ltd. Page 67
TABLE D-2CALCULATION OF ELASTICITY OF RETAIL EXPENDITURES TO INCOMEFOR GAFO STORE EXPENDITURES IN ONTARIO
Elasticity ofPer Capita GAFO Store
Per Capita Percentage GAFO Store Percentage ExpendituresYear Income (1 Increase Expenditures (2 Increase to Income (31991 $23,751 -- $2,202 -- --1992 $24,010 1.1% $2,209 0.3% 0.31993 $23,960 -0.2% $2,241 1.4% NA 1994 $24,095 0.6% $2,388 6.6% 11.01995 $24,785 2.9% $2,404 0.7% 0.21996 $24,930 0.6% $2,421 0.7% 1.21997 $25,786 3.4% $2,637 8.9% 2.61998 $26,801 3.9% $2,834 7.5% 1.91999 $27,959 4.3% $3,020 6.6% 1.52000 $29,751 6.4% $3,171 5.0% 0.82001 $30,360 2.0% $3,211 1.3% 0.72002 $30,553 0.6% $3,302 2.8% 4.72003 $31,132 1.9% $3,377 2.3% 1.22004 $32,363 4.0% $3,446 2.0% 0.52005 $33,480 3.5% $3,498 1.5% 0.42006 $34,956 4.4% $3,650 4.3% 1.02007 $36,430 4.2% $3,764 3.1% 0.72008 $37,050 1.7% $3,816 1.4% 0.82009 $36,722 -0.9% $3,722 -2.5% 2.82010 $37,803 2.9% $3,858 3.7% 1.32011 $38,405 1.6% $3,900 1.1% 0.72012 $39,900 3.9% $3,937 0.9% 0.22013 $41,000 2.8% $4,005 1.7% 0.6
For 1991 to 2013:Total Growth 72.6% 81.9%Average Annual Compound Growth 2.5% 2.8%Expenditure Elasticity 1.1
SOURCE: Kircher Research Associates Ltd.1) The figures for 1991 to 2005 are based on Statistics Canada, Provincial and Territorial Economic Accounts: Data Tables, 2008 Estimates (Catalogue #13-018). The figures for 2006 to 2011 are based on Ontario Ministry of Finance, Ontario Economic Accounts, Third Quarter of 2011. Estimated 2012. Figures for 2012-2013 are based on CANSIM - Table 380-0063, Gross Domest Product, Income Based (seasonally adjusted).2) The figures for 1991 to 2013 are based on Statistics Canada, Retail Trade (Catalogue #63-005). 3) These figures have been calculated by dividing the percentage increase in per capita GAFO store expenditures by the corresponding percentage increase in per capita income.
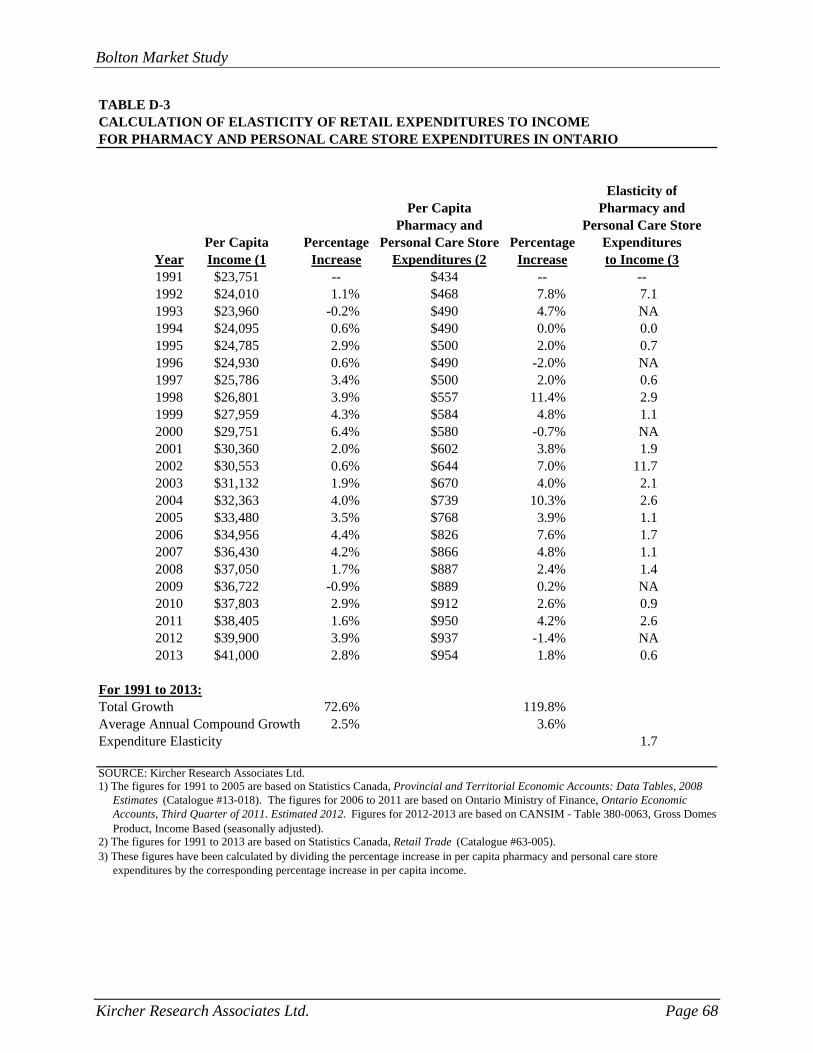
Bolton Market Study
Kircher Research Associates Ltd. Page 68
TABLE D-3CALCULATION OF ELASTICITY OF RETAIL EXPENDITURES TO INCOMEFOR PHARMACY AND PERSONAL CARE STORE EXPENDITURES IN ONTARIO
Elasticity ofPer Capita Pharmacy and
Pharmacy and Personal Care StorePer Capita Percentage Personal Care Store Percentage Expenditures
Year Income (1 Increase Expenditures (2 Increase to Income (31991 $23,751 -- $434 -- --1992 $24,010 1.1% $468 7.8% 7.11993 $23,960 -0.2% $490 4.7% NA 1994 $24,095 0.6% $490 0.0% 0.01995 $24,785 2.9% $500 2.0% 0.71996 $24,930 0.6% $490 -2.0% NA 1997 $25,786 3.4% $500 2.0% 0.61998 $26,801 3.9% $557 11.4% 2.91999 $27,959 4.3% $584 4.8% 1.12000 $29,751 6.4% $580 -0.7% NA 2001 $30,360 2.0% $602 3.8% 1.92002 $30,553 0.6% $644 7.0% 11.72003 $31,132 1.9% $670 4.0% 2.12004 $32,363 4.0% $739 10.3% 2.62005 $33,480 3.5% $768 3.9% 1.12006 $34,956 4.4% $826 7.6% 1.72007 $36,430 4.2% $866 4.8% 1.12008 $37,050 1.7% $887 2.4% 1.42009 $36,722 -0.9% $889 0.2% NA 2010 $37,803 2.9% $912 2.6% 0.92011 $38,405 1.6% $950 4.2% 2.62012 $39,900 3.9% $937 -1.4% NA 2013 $41,000 2.8% $954 1.8% 0.6
For 1991 to 2013:Total Growth 72.6% 119.8%Average Annual Compound Growth 2.5% 3.6%Expenditure Elasticity 1.7
SOURCE: Kircher Research Associates Ltd.1) The figures for 1991 to 2005 are based on Statistics Canada, Provincial and Territorial Economic Accounts: Data Tables, 2008 Estimates (Catalogue #13-018). The figures for 2006 to 2011 are based on Ontario Ministry of Finance, Ontario Economic Accounts, Third Quarter of 2011. Estimated 2012. Figures for 2012-2013 are based on CANSIM - Table 380-0063, Gross Domest Product, Income Based (seasonally adjusted).2) The figures for 1991 to 2013 are based on Statistics Canada, Retail Trade (Catalogue #63-005). 3) These figures have been calculated by dividing the percentage increase in per capita pharmacy and personal care store expenditures by the corresponding percentage increase in per capita income.
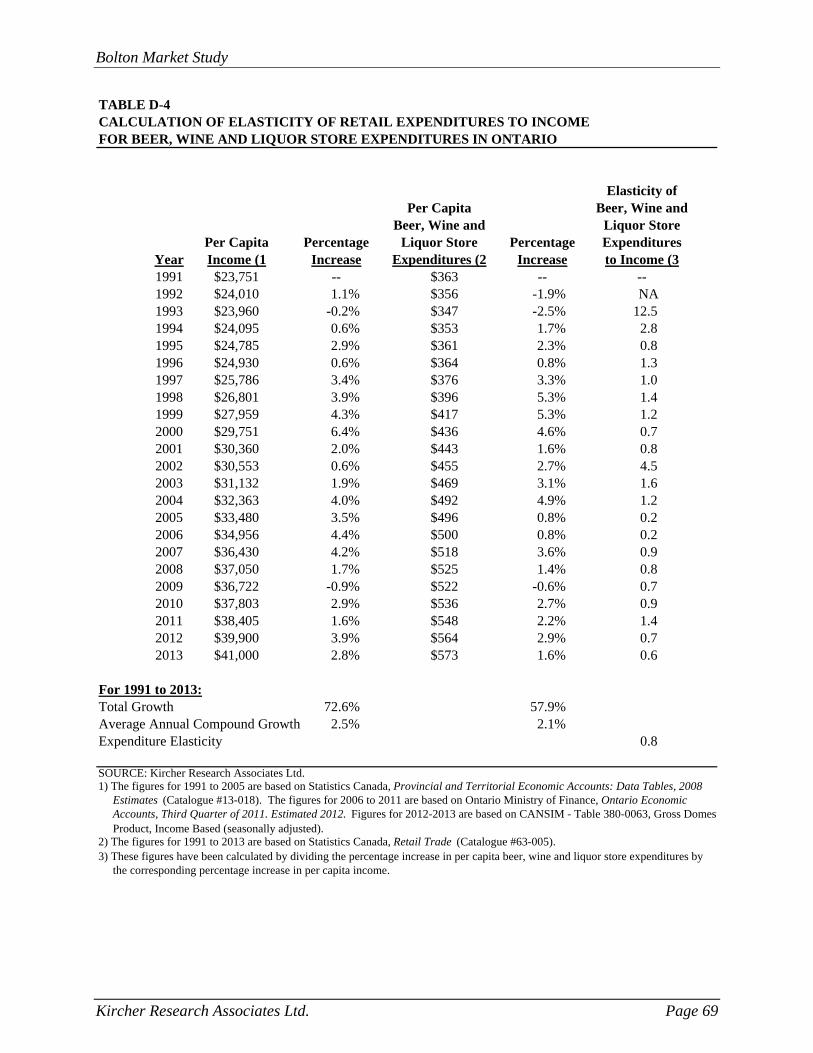
Bolton Market Study
Kircher Research Associates Ltd. Page 69
TABLE D-4CALCULATION OF ELASTICITY OF RETAIL EXPENDITURES TO INCOMEFOR BEER, WINE AND LIQUOR STORE EXPENDITURES IN ONTARIO
Elasticity ofPer Capita Beer, Wine and
Beer, Wine and Liquor StorePer Capita Percentage Liquor Store Percentage Expenditures
Year Income (1 Increase Expenditures (2 Increase to Income (31991 $23,751 -- $363 -- --1992 $24,010 1.1% $356 -1.9% NA 1993 $23,960 -0.2% $347 -2.5% 12.51994 $24,095 0.6% $353 1.7% 2.81995 $24,785 2.9% $361 2.3% 0.81996 $24,930 0.6% $364 0.8% 1.31997 $25,786 3.4% $376 3.3% 1.01998 $26,801 3.9% $396 5.3% 1.41999 $27,959 4.3% $417 5.3% 1.22000 $29,751 6.4% $436 4.6% 0.72001 $30,360 2.0% $443 1.6% 0.82002 $30,553 0.6% $455 2.7% 4.52003 $31,132 1.9% $469 3.1% 1.62004 $32,363 4.0% $492 4.9% 1.22005 $33,480 3.5% $496 0.8% 0.22006 $34,956 4.4% $500 0.8% 0.22007 $36,430 4.2% $518 3.6% 0.92008 $37,050 1.7% $525 1.4% 0.82009 $36,722 -0.9% $522 -0.6% 0.72010 $37,803 2.9% $536 2.7% 0.92011 $38,405 1.6% $548 2.2% 1.42012 $39,900 3.9% $564 2.9% 0.72013 $41,000 2.8% $573 1.6% 0.6
For 1991 to 2013:Total Growth 72.6% 57.9%Average Annual Compound Growth 2.5% 2.1%Expenditure Elasticity 0.8
SOURCE: Kircher Research Associates Ltd.1) The figures for 1991 to 2005 are based on Statistics Canada, Provincial and Territorial Economic Accounts: Data Tables, 2008 Estimates (Catalogue #13-018). The figures for 2006 to 2011 are based on Ontario Ministry of Finance, Ontario Economic Accounts, Third Quarter of 2011. Estimated 2012. Figures for 2012-2013 are based on CANSIM - Table 380-0063, Gross Domest Product, Income Based (seasonally adjusted).2) The figures for 1991 to 2013 are based on Statistics Canada, Retail Trade (Catalogue #63-005). 3) These figures have been calculated by dividing the percentage increase in per capita beer, wine and liquor store expenditures by the corresponding percentage increase in per capita income.
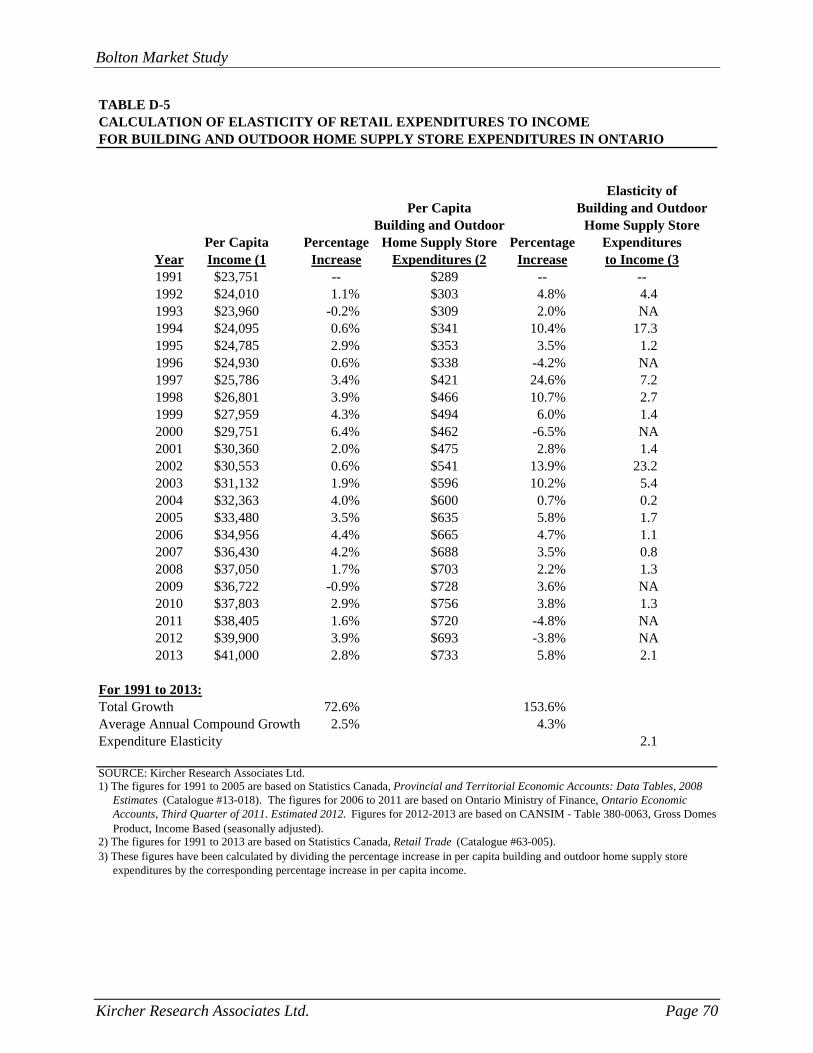
Bolton Market Study
Kircher Research Associates Ltd. Page 70
TABLE D-5CALCULATION OF ELASTICITY OF RETAIL EXPENDITURES TO INCOMEFOR BUILDING AND OUTDOOR HOME SUPPLY STORE EXPENDITURES IN ONTARIO
Elasticity ofPer Capita Building and Outdoor
Building and Outdoor Home Supply StorePer Capita Percentage Home Supply Store Percentage Expenditures
Year Income (1 Increase Expenditures (2 Increase to Income (31991 $23,751 -- $289 -- --1992 $24,010 1.1% $303 4.8% 4.41993 $23,960 -0.2% $309 2.0% NA 1994 $24,095 0.6% $341 10.4% 17.31995 $24,785 2.9% $353 3.5% 1.21996 $24,930 0.6% $338 -4.2% NA 1997 $25,786 3.4% $421 24.6% 7.21998 $26,801 3.9% $466 10.7% 2.71999 $27,959 4.3% $494 6.0% 1.42000 $29,751 6.4% $462 -6.5% NA 2001 $30,360 2.0% $475 2.8% 1.42002 $30,553 0.6% $541 13.9% 23.22003 $31,132 1.9% $596 10.2% 5.42004 $32,363 4.0% $600 0.7% 0.22005 $33,480 3.5% $635 5.8% 1.72006 $34,956 4.4% $665 4.7% 1.12007 $36,430 4.2% $688 3.5% 0.82008 $37,050 1.7% $703 2.2% 1.32009 $36,722 -0.9% $728 3.6% NA 2010 $37,803 2.9% $756 3.8% 1.32011 $38,405 1.6% $720 -4.8% NA 2012 $39,900 3.9% $693 -3.8% NA 2013 $41,000 2.8% $733 5.8% 2.1
For 1991 to 2013:Total Growth 72.6% 153.6%Average Annual Compound Growth 2.5% 4.3%Expenditure Elasticity 2.1
SOURCE: Kircher Research Associates Ltd.1) The figures for 1991 to 2005 are based on Statistics Canada, Provincial and Territorial Economic Accounts: Data Tables, 2008 Estimates (Catalogue #13-018). The figures for 2006 to 2011 are based on Ontario Ministry of Finance, Ontario Economic Accounts, Third Quarter of 2011. Estimated 2012. Figures for 2012-2013 are based on CANSIM - Table 380-0063, Gross Domest Product, Income Based (seasonally adjusted).2) The figures for 1991 to 2013 are based on Statistics Canada, Retail Trade (Catalogue #63-005). 3) These figures have been calculated by dividing the percentage increase in per capita building and outdoor home supply store expenditures by the corresponding percentage increase in per capita income.
APPENDIX E
BASIC ASSUMPTIONS AND DEFINITION OF TERMS
Bolton Market Study
Kircher Research Associates Ltd. Page 71
APPENDIX E
BASIC ASSUMPTIONS AND DEFINITION OF TERMS
In this appendix we have itemized the key assumptions on which we have based our analysis. In
addition, we have provided a glossary of terms to facilitate understanding of this study.
Basic Assumptions
There are a number of underlying basic assumptions upon which the validity of the findings and
recommendations presented in this study depend. We recognize and appreciate the problems
associated with making broad and generalized assumptions about future conditions.
Undoubtedly, deviations from historic and current trends will take place in future years.
However, basic assumptions are required regarding the possible extent of such deviations in
order to prepare any estimates of future conditions. These basic assumptions are:
1) During the forecast period covered by this study, a reasonable degree of economic stability
will prevail in the Province of Ontario and the market area. We recognize that the
Canadian economy experiences intermittent periods of economic slowdown and recession
during which unemployment levels rise, average personal income levels are restrained and
retail expenditures decline. Such periods of economic downturn are consistent with longer-
term cyclical fluctuations in the economy. They have been experienced many times in the
past and have occurred recently. However, over the long term, such periods of economic
slowdown tend to be offset by periods of growth. Therefore, for the purposes of this study,
we have assumed that, on average, relative economic stability and moderate growth in
retail expenditures will prevail throughout the future study period.
2) References to the Canadian dollar dealing with both the present and future period reflect its
2013 value. Since this analysis deals with future retail space additions, inflation has been
eliminated. It has no influence on the physical space used by retail facilities. We
recognize that fluctuations in the absolute value and purchasing power of the dollar will
likely occur in the future. It is assumed, however, that the relationship between per capita
income and expenditure levels, the value of the dollar and store operating levels will
remain more or less constant during the period analyzed.
Bolton Market Study
Kircher Research Associates Ltd. Page 72
3) Historic population estimates used in this study are based on revised intercensal population
estimates published by Statistics Canada. Estimates of future population contained in this
study are based on information provided by the Town of Caledon.
4) If major changes should occur that influence the basic assumptions stated above, then the
conclusions and recommendations contained in this study should be reviewed in light of such
changed conditions and revised if necessary.
Bolton Market Study
Kircher Research Associates Ltd. Page 73
Definition of Terms
The following definitions have been prepared in order to acquaint the reader with the intended
meaning of various terms, phrases or concepts as used in this study. They have been included in
order to avoid misunderstandings of the various items or methodology discussed in the analysis.
1) Study Area
The geographic area of influence from which a retail development could normally expect to
derive between 70.0% and 95.0% of its total sales volume is normally defined as its trade or
market area. However, because Bolton has a large Secondary Zone, which was not analysed in
this study, the total retail volume proportion derived from the defined Study Area is less, as
indicated in the analysis. The extent of a market area depends on numerous factors, including:
the size, type and character of the retail development;
the accessibility and visibility of the site provided by the existing and proposed regional
and local road network;
natural or man-made barriers, such as rivers or railway lines, which may inhibit or restrict
the movement of customers;
distance and driving times; and,
the strength and location of existing and proposed competitive retail facilities. The remaining market support, referred to as inflow, is derived from visitors, tourists and local
employees living outside the market area, and in this case, in the Secondary Zone of the Bolton
Study Area.
Bolton Market Study
Kircher Research Associates Ltd. Page 74
2) Per Capita Income
Per capita income represents average total personal income before tax, as defined by
Statistics Canada. It has been calculated from Statistics Canada, National Income and
Expenditure Accounts (Catalogue #13-001) data, as well as Ontario Ministry of Finance,
Ontario Economic Accounts statistics.
Income indices for the Study Area are based on the results of the 2011 Census of Canada.
Recent changes in these indices, as reflected by Revenue Canada / Canada Revenue Agency,
Taxation Statistics, Tax Statistics on Individuals and Income Statistics data, have been
consulted to update these indices to 2013 levels.
3) Calculation of Per Capita Retail Expenditures
Tables E-1 through E-5, which are presented on the following pages, illustrate the
methodology used to calculate the average per capita retail store expenditures for the
categories under study, as applicable in the Province of Ontario in 2013, the last year for
which complete data are available. These tables have been derived from current Statistics
Canada Retail Trade (Catalogue #63-005) data and reflect the store definitions described in
Statistics Canada’s North American Industry Classification System 2002 (Catalogue #12-
501). Based on this information, per capita food store expenditures in Ontario averaged
$2,276 in 2013, while per capita GAFO store expenditures averaged $4,005, Pharmacy and
Personal Care Stores $ 954; Beer/Wine & Liquor Stores, $ 573; and Building and Outdoor
Home Supply Stores $ 733.

Bolton Market Study
Kircher Research Associates Ltd. Page 75
TABLE E-1CALCULATION OF PER CAPITAFOOD STORE EXPENDITURES IN ONTARIO, 2013 (1
2013Total Sales
NAICS Category ($Thousands)
44511 - Supermarkets and Other Grocery (except Convenience) Stores $26,616,400
44512 - Convenience Stores $1,952,200
4452 - Specialty Food Stores $2,245,000
Total Food Stores $30,813,600
Population (2 13,537,994
2013 PER CAPITA FOOD STORE EXPENDITURES $2,276
SOURCE: Kircher Research Associates Ltd.1) Based on Statistics Canada, Retail Trade (Catalogue #63-005).2) Based on Statistics Canada, Annual Demographic Estimates: Canada, Provinces and Territories 2013 (Catalogue #91-215).
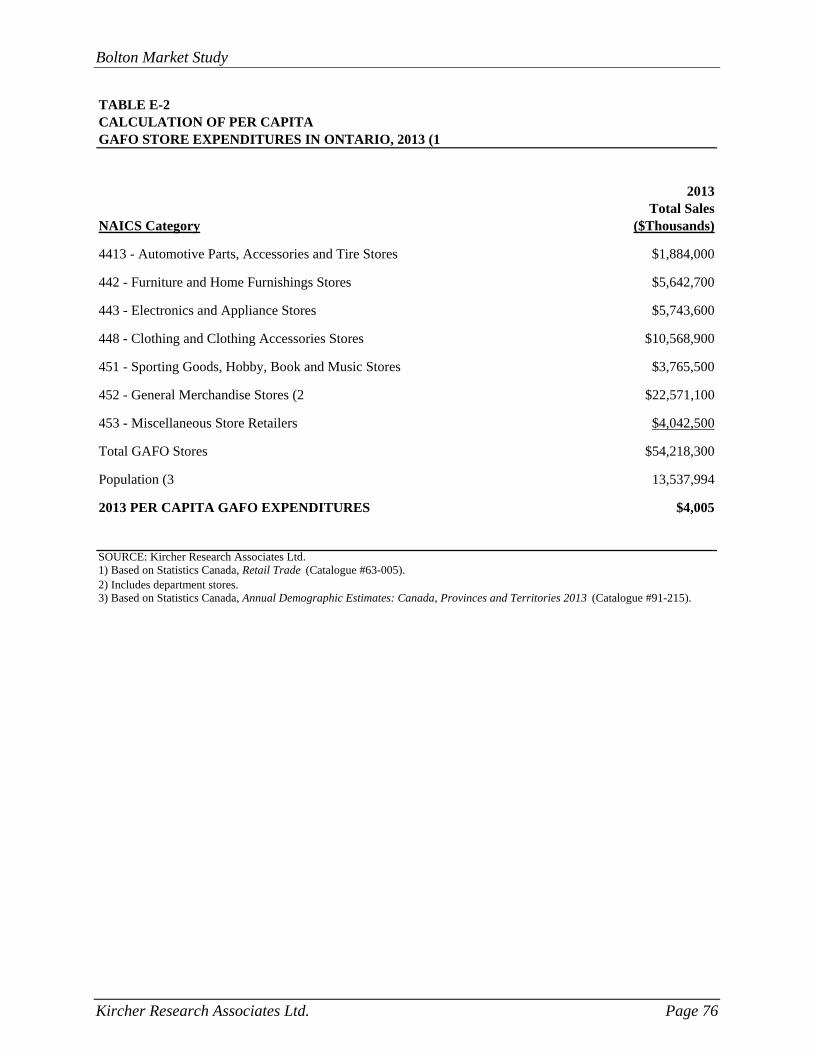
Bolton Market Study
Kircher Research Associates Ltd. Page 76
TABLE E-2CALCULATION OF PER CAPITAGAFO STORE EXPENDITURES IN ONTARIO, 2013 (1
2013Total Sales
NAICS Category ($Thousands)
4413 - Automotive Parts, Accessories and Tire Stores $1,884,000
442 - Furniture and Home Furnishings Stores $5,642,700
443 - Electronics and Appliance Stores $5,743,600
448 - Clothing and Clothing Accessories Stores $10,568,900
451 - Sporting Goods, Hobby, Book and Music Stores $3,765,500
452 - General Merchandise Stores (2 $22,571,100
453 - Miscellaneous Store Retailers $4,042,500
Total GAFO Stores $54,218,300
Population (3 13,537,994
2013 PER CAPITA GAFO EXPENDITURES $4,005
SOURCE: Kircher Research Associates Ltd.1) Based on Statistics Canada, Retail Trade (Catalogue #63-005).2) Includes department stores.3) Based on Statistics Canada, Annual Demographic Estimates: Canada, Provinces and Territories 2013 (Catalogue #91-215).
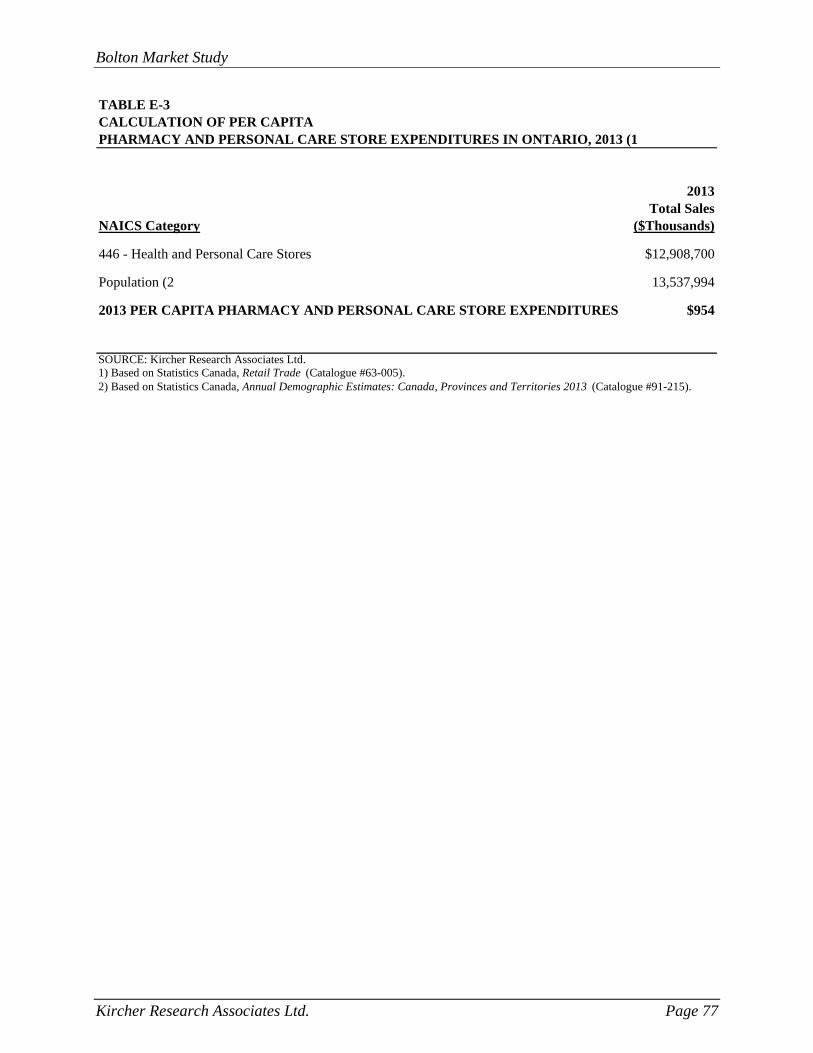
Bolton Market Study
Kircher Research Associates Ltd. Page 77
TABLE E-3CALCULATION OF PER CAPITAPHARMACY AND PERSONAL CARE STORE EXPENDITURES IN ONTARIO, 2013 (1
2013Total Sales
NAICS Category ($Thousands)
446 - Health and Personal Care Stores $12,908,700
Population (2 13,537,994
2013 PER CAPITA PHARMACY AND PERSONAL CARE STORE EXPENDITURES $954
SOURCE: Kircher Research Associates Ltd.1) Based on Statistics Canada, Retail Trade (Catalogue #63-005).2) Based on Statistics Canada, Annual Demographic Estimates: Canada, Provinces and Territories 2013 (Catalogue #91-215).
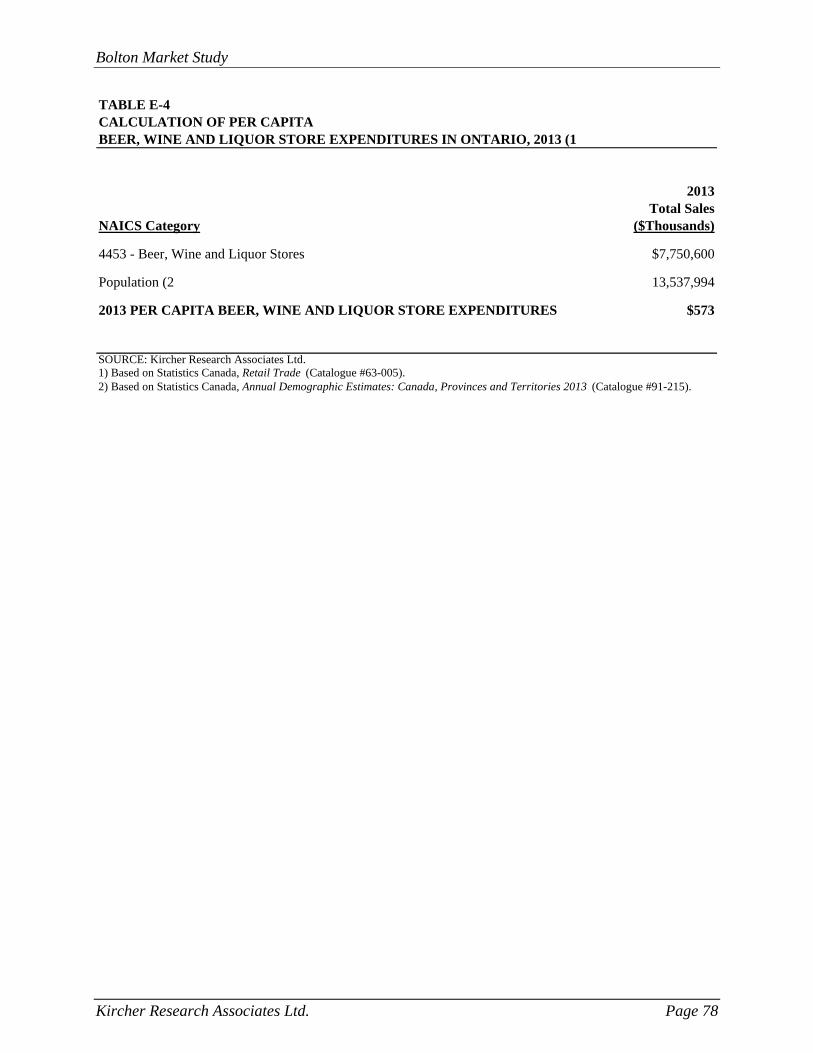
Bolton Market Study
Kircher Research Associates Ltd. Page 78
TABLE E-4CALCULATION OF PER CAPITABEER, WINE AND LIQUOR STORE EXPENDITURES IN ONTARIO, 2013 (1
2013Total Sales
NAICS Category ($Thousands)
4453 - Beer, Wine and Liquor Stores $7,750,600
Population (2 13,537,994
2013 PER CAPITA BEER, WINE AND LIQUOR STORE EXPENDITURES $573
SOURCE: Kircher Research Associates Ltd.1) Based on Statistics Canada, Retail Trade (Catalogue #63-005).2) Based on Statistics Canada, Annual Demographic Estimates: Canada, Provinces and Territories 2013 (Catalogue #91-215).
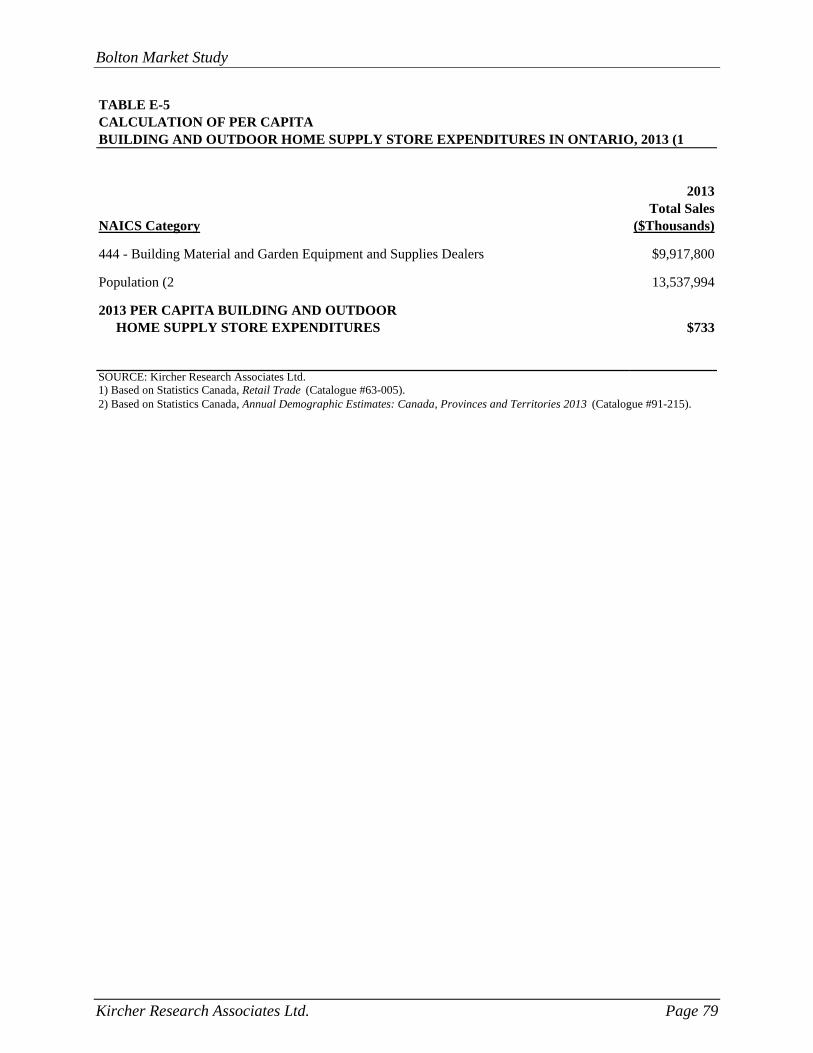
Bolton Market Study
Kircher Research Associates Ltd. Page 79
TABLE E-5CALCULATION OF PER CAPITABUILDING AND OUTDOOR HOME SUPPLY STORE EXPENDITURES IN ONTARIO, 2013 (1
2013Total Sales
NAICS Category ($Thousands)
444 - Building Material and Garden Equipment and Supplies Dealers $9,917,800
Population (2 13,537,994
2013 PER CAPITA BUILDING AND OUTDOOR HOME SUPPLY STORE EXPENDITURES $733
SOURCE: Kircher Research Associates Ltd.1) Based on Statistics Canada, Retail Trade (Catalogue #63-005).2) Based on Statistics Canada, Annual Demographic Estimates: Canada, Provinces and Territories 2013 (Catalogue #91-215).
Bolton Market Study
Kircher Research Associates Ltd. Page 80
4) Retail Expenditure Potential
Retail expenditure potential represents the total annual retail expenditures made by Study
Area residents at stores in a specific retail category. It includes purchases made both inside
and outside the Study Area. It is calculated by multiplying the average per capita
expenditure in the Study Area by the total population for that area.
5) Residual Potential and the Residual Method of Study
Residual potential represents the difference between existing and forecast local shares. It is
that portion of the future local share that is in excess of that presently being attracted by
existing local stores. Thus, the residual method of study recognizes the existing and
continued effectiveness of stores currently operating in Bolton.
The residual approach does not necessarily maximize the opportunity for a specific retailer.
Other factors must be considered in the overall market strategy of a specific tenant.
.
6) Gross Leasable Area (GLA)
Gross leasable area (GLA) is the total retail floor area designed for tenant occupancy and
exclusive use, including basements, upper floors and mezzanines. It is expressed in square
feet and is measured from the centre line of joint partitions and from outside wall faces.
GLA is the area on which tenants pay rent and is the area that produces income for a tenant.
Since it lends itself readily to measurement and comparison, GLA has been adopted by the
shopping centre industry as its standard for statistical comparison.
7) Competitive Retail Inventory
The competitive retail inventory is a detailed classification of competitive retail space by
store type and location. The results of the inventory are illustrated in Table A-1 of
Appendix A.

Bolton Market Study
Kircher Research Associates Ltd. Page 81
8) Retail Store and Service Classification by Type
Table E-6 presents our listing of retail stores and services by category and by individual type.
It is based on the store definitions described in Statistics Canada’s North American Industry
Classification System 2002 (Catalogue #12-501).
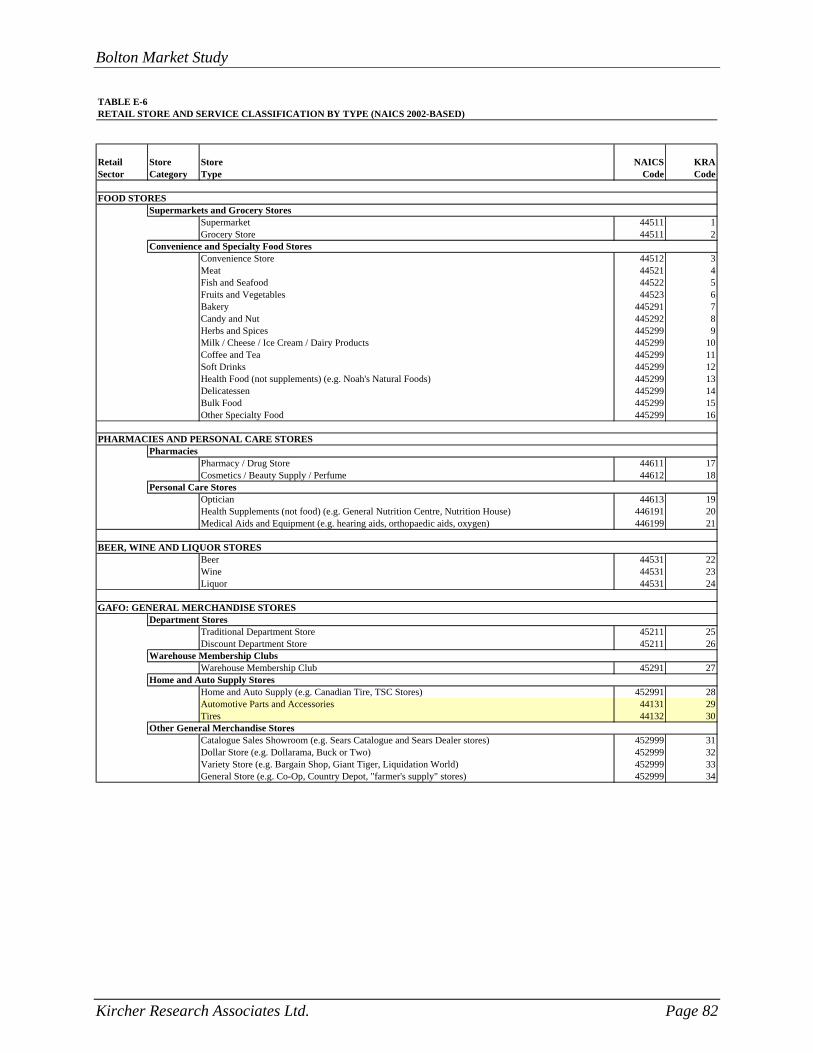
Bolton Market Study
Kircher Research Associates Ltd. Page 82
TABLE E-6RETAIL STORE AND SERVICE CLASSIFICATION BY TYPE (NAICS 2002-BASED)
Retail Store Store NAICS KRASector Category Type Code Code
FOOD STORESSupermarkets and Grocery Stores
Supermarket 44511 1Grocery Store 44511 2
Convenience and Specialty Food StoresConvenience Store 44512 3Meat 44521 4Fish and Seafood 44522 5Fruits and Vegetables 44523 6Bakery 445291 7Candy and Nut 445292 8Herbs and Spices 445299 9Milk / Cheese / Ice Cream / Dairy Products 445299 10Coffee and Tea 445299 11Soft Drinks 445299 12Health Food (not supplements) (e.g. Noah's Natural Foods) 445299 13Delicatessen 445299 14Bulk Food 445299 15Other Specialty Food 445299 16
PHARMACIES AND PERSONAL CARE STORESPharmacies
Pharmacy / Drug Store 44611 17Cosmetics / Beauty Supply / Perfume 44612 18
Personal Care StoresOptician 44613 19Health Supplements (not food) (e.g. General Nutrition Centre, Nutrition House) 446191 20Medical Aids and Equipment (e.g. hearing aids, orthopaedic aids, oxygen) 446199 21
BEER, WINE AND LIQUOR STORESBeer 44531 22Wine 44531 23Liquor 44531 24
GAFO: GENERAL MERCHANDISE STORESDepartment Stores
Traditional Department Store 45211 25Discount Department Store 45211 26
Warehouse Membership ClubsWarehouse Membership Club 45291 27
Home and Auto Supply StoresHome and Auto Supply (e.g. Canadian Tire, TSC Stores) 452991 28Automotive Parts and Accessories 44131 29Tires 44132 30
Other General Merchandise StoresCatalogue Sales Showroom (e.g. Sears Catalogue and Sears Dealer stores) 452999 31Dollar Store (e.g. Dollarama, Buck or Two) 452999 32Variety Store (e.g. Bargain Shop, Giant Tiger, Liquidation World) 452999 33General Store (e.g. Co-Op, Country Depot, "farmer's supply" stores) 452999 34
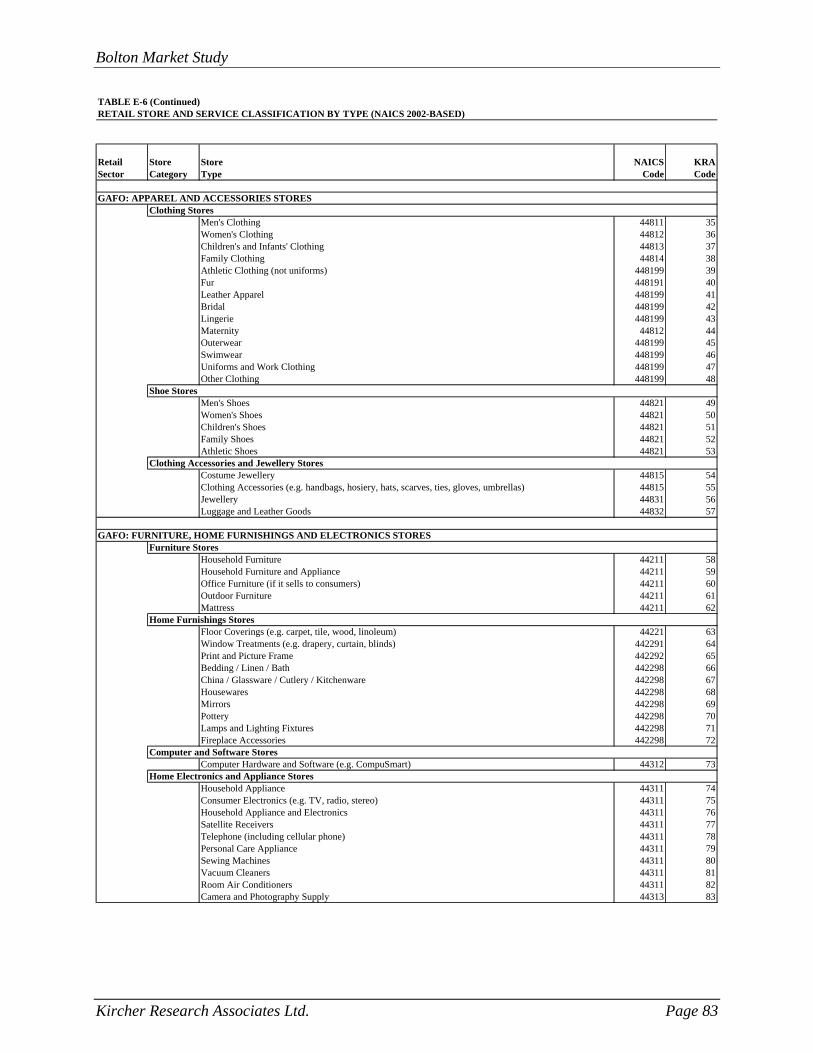
Bolton Market Study
Kircher Research Associates Ltd. Page 83
TABLE E-6 (Continued)RETAIL STORE AND SERVICE CLASSIFICATION BY TYPE (NAICS 2002-BASED)
Retail Store Store NAICS KRASector Category Type Code Code
GAFO: APPAREL AND ACCESSORIES STORESClothing Stores
Men's Clothing 44811 35Women's Clothing 44812 36Children's and Infants' Clothing 44813 37Family Clothing 44814 38Athletic Clothing (not uniforms) 448199 39Fur 448191 40Leather Apparel 448199 41Bridal 448199 42Lingerie 448199 43Maternity 44812 44Outerwear 448199 45Swimwear 448199 46Uniforms and Work Clothing 448199 47Other Clothing 448199 48
Shoe StoresMen's Shoes 44821 49Women's Shoes 44821 50Children's Shoes 44821 51Family Shoes 44821 52Athletic Shoes 44821 53
Clothing Accessories and Jewellery StoresCostume Jewellery 44815 54Clothing Accessories (e.g. handbags, hosiery, hats, scarves, ties, gloves, umbrellas) 44815 55Jewellery 44831 56Luggage and Leather Goods 44832 57
GAFO: FURNITURE, HOME FURNISHINGS AND ELECTRONICS STORESFurniture Stores
Household Furniture 44211 58Household Furniture and Appliance 44211 59Office Furniture (if it sells to consumers) 44211 60Outdoor Furniture 44211 61Mattress 44211 62
Home Furnishings StoresFloor Coverings (e.g. carpet, tile, wood, linoleum) 44221 63Window Treatments (e.g. drapery, curtain, blinds) 442291 64Print and Picture Frame 442292 65Bedding / Linen / Bath 442298 66China / Glassware / Cutlery / Kitchenware 442298 67Housewares 442298 68Mirrors 442298 69Pottery 442298 70Lamps and Lighting Fixtures 442298 71Fireplace Accessories 442298 72
Computer and Software StoresComputer Hardware and Software (e.g. CompuSmart) 44312 73
Home Electronics and Appliance StoresHousehold Appliance 44311 74Consumer Electronics (e.g. TV, radio, stereo) 44311 75Household Appliance and Electronics 44311 76Satellite Receivers 44311 77Telephone (including cellular phone) 44311 78Personal Care Appliance 44311 79Sewing Machines 44311 80Vacuum Cleaners 44311 81Room Air Conditioners 44311 82Camera and Photography Supply 44313 83

Bolton Market Study
Kircher Research Associates Ltd. Page 84
TABLE E-6 (Continued)RETAIL STORE AND SERVICE CLASSIFICATION BY TYPE (NAICS 2002-BASED)
Retail Store Store NAICS KRASector Category Type Code Code
GAFO: OTHER RETAILERSSporting Goods, Hobby, Music and Book Stores
Bicycles 45111 84Fitness Equipment 45111 85Bait and Tackle / Firearms 45111 86Other Sporting Goods (including uniforms) 45111 87Hobby, Toy and Game (including arts and crafts, console game stores) (e.g. EB Games, MicroPlay) 45112 88Sewing, Needlework and Piece Goods (including yarn and fabric) 45113 89Musical Instruments and Supplies 45114 90Books and News 45121 91Pre-Recorded Tapes, Compact Discs and Records 45122 92
Miscellaneous Store RetailersFlorist 45311 93Office Supply and Stationery (including office furniture if not selling to consumers) 45321 94Gift, Novelty and Souvenir 45322 95Greeting Cards 45322 96Used Clothing 45331 97Used Furniture / Antiques 45331 98Used Appliances 45331 99Used Books 45331 100Other Used Merchandise (not pawnshops) 45331 101Pet and Pet Supply 45391 102Art Dealer 45392 103Beer and Wine-Making Supply 453992 104Art Supply 453999 105Auctioneering 453999 106Hot Tubs / Whirlpools / Swimming Pools 453999 107Coins and Stamps 453999 108Autographs, Cards and Collectibles 453999 109Party Supply 453999 110Tobacco 453999 111Tombstones 453999 112Other Miscellaneous Retailer (including water systems) 453999 113
BUILDING AND OUTDOOR HOME SUPPLIES STORESHome Centres and Hardware Stores
Home Improvement Centre 44411 114Hardware Store 44413 115
Specialized Building Materials and Garden StoresPaint and Wallpaper 44412 116Kitchen Cabinets / Doors and Windows 44419 117Electrical Supply 44419 118Plumbing 44419 119Lumber 44419 120Other Building Materials (e.g. brick and tile, fencing, glass, roofing) 44419 121Outdoor Power Equipment (e.g. lawnmowers) 44421 122Nursery / Garden Centre (including lawn ornaments) 44422 123
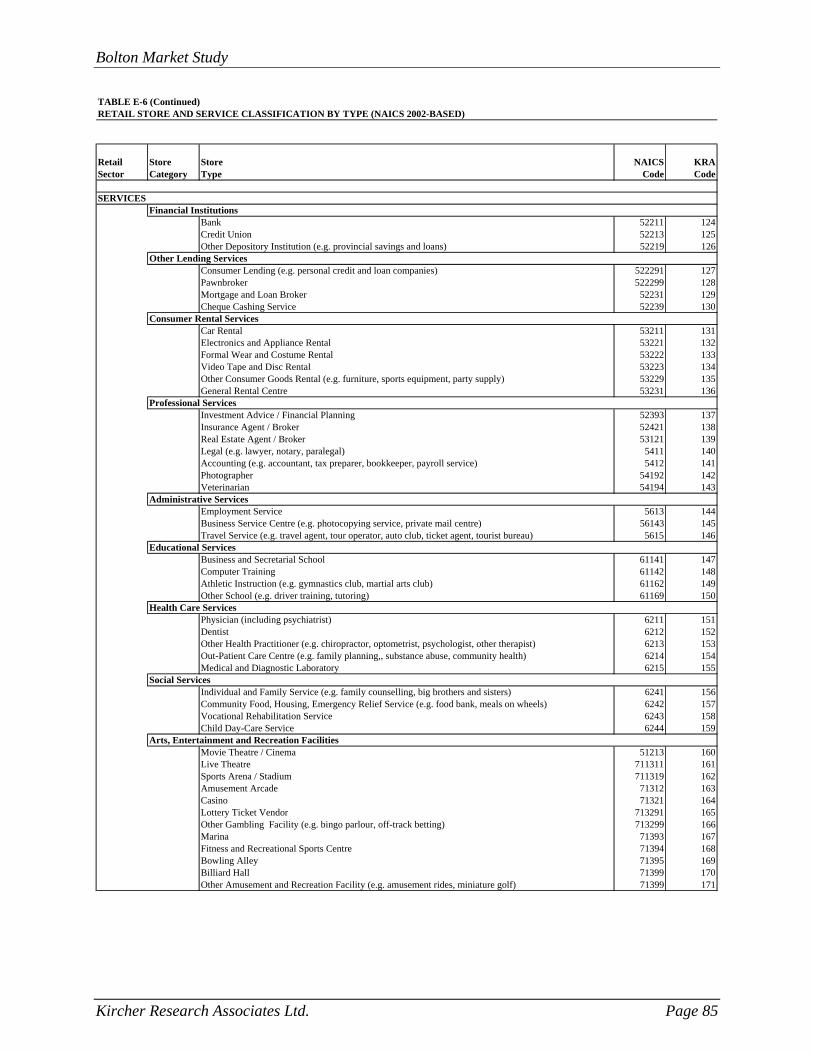
Bolton Market Study
Kircher Research Associates Ltd. Page 85
TABLE E-6 (Continued)RETAIL STORE AND SERVICE CLASSIFICATION BY TYPE (NAICS 2002-BASED)
Retail Store Store NAICS KRASector Category Type Code Code
SERVICESFinancial Institutions
Bank 52211 124Credit Union 52213 125Other Depository Institution (e.g. provincial savings and loans) 52219 126
Other Lending ServicesConsumer Lending (e.g. personal credit and loan companies) 522291 127Pawnbroker 522299 128Mortgage and Loan Broker 52231 129Cheque Cashing Service 52239 130
Consumer Rental ServicesCar Rental 53211 131Electronics and Appliance Rental 53221 132Formal Wear and Costume Rental 53222 133Video Tape and Disc Rental 53223 134Other Consumer Goods Rental (e.g. furniture, sports equipment, party supply) 53229 135General Rental Centre 53231 136
Professional ServicesInvestment Advice / Financial Planning 52393 137Insurance Agent / Broker 52421 138Real Estate Agent / Broker 53121 139Legal (e.g. lawyer, notary, paralegal) 5411 140Accounting (e.g. accountant, tax preparer, bookkeeper, payroll service) 5412 141Photographer 54192 142Veterinarian 54194 143
Administrative ServicesEmployment Service 5613 144Business Service Centre (e.g. photocopying service, private mail centre) 56143 145Travel Service (e.g. travel agent, tour operator, auto club, ticket agent, tourist bureau) 5615 146
Educational ServicesBusiness and Secretarial School 61141 147Computer Training 61142 148Athletic Instruction (e.g. gymnastics club, martial arts club) 61162 149Other School (e.g. driver training, tutoring) 61169 150
Health Care ServicesPhysician (including psychiatrist) 6211 151Dentist 6212 152Other Health Practitioner (e.g. chiropractor, optometrist, psychologist, other therapist) 6213 153Out-Patient Care Centre (e.g. family planning,, substance abuse, community health) 6214 154Medical and Diagnostic Laboratory 6215 155
Social ServicesIndividual and Family Service (e.g. family counselling, big brothers and sisters) 6241 156Community Food, Housing, Emergency Relief Service (e.g. food bank, meals on wheels) 6242 157Vocational Rehabilitation Service 6243 158Child Day-Care Service 6244 159
Arts, Entertainment and Recreation FacilitiesMovie Theatre / Cinema 51213 160Live Theatre 711311 161Sports Arena / Stadium 711319 162Amusement Arcade 71312 163Casino 71321 164Lottery Ticket Vendor 713291 165Other Gambling Facility (e.g. bingo parlour, off-track betting) 713299 166Marina 71393 167Fitness and Recreational Sports Centre 71394 168Bowling Alley 71395 169Billiard Hall 71399 170Other Amusement and Recreation Facility (e.g. amusement rides, miniature golf) 71399 171
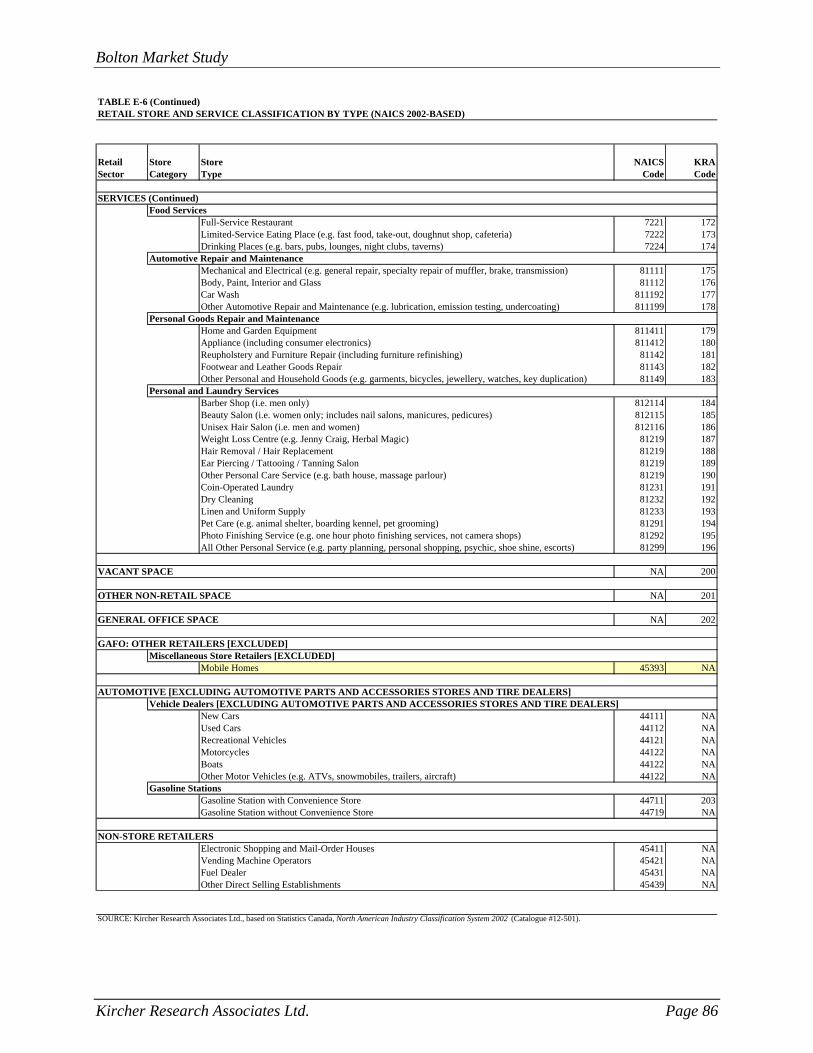
Bolton Market Study
Kircher Research Associates Ltd. Page 86
TABLE E-6 (Continued)RETAIL STORE AND SERVICE CLASSIFICATION BY TYPE (NAICS 2002-BASED)
Retail Store Store NAICS KRASector Category Type Code Code
SERVICES (Continued)Food Services
Full-Service Restaurant 7221 172Limited-Service Eating Place (e.g. fast food, take-out, doughnut shop, cafeteria) 7222 173Drinking Places (e.g. bars, pubs, lounges, night clubs, taverns) 7224 174
Automotive Repair and MaintenanceMechanical and Electrical (e.g. general repair, specialty repair of muffler, brake, transmission) 81111 175Body, Paint, Interior and Glass 81112 176Car Wash 811192 177Other Automotive Repair and Maintenance (e.g. lubrication, emission testing, undercoating) 811199 178
Personal Goods Repair and MaintenanceHome and Garden Equipment 811411 179Appliance (including consumer electronics) 811412 180Reupholstery and Furniture Repair (including furniture refinishing) 81142 181Footwear and Leather Goods Repair 81143 182Other Personal and Household Goods (e.g. garments, bicycles, jewellery, watches, key duplication) 81149 183
Personal and Laundry Services Barber Shop (i.e. men only) 812114 184Beauty Salon (i.e. women only; includes nail salons, manicures, pedicures) 812115 185Unisex Hair Salon (i.e. men and women) 812116 186Weight Loss Centre (e.g. Jenny Craig, Herbal Magic) 81219 187Hair Removal / Hair Replacement 81219 188Ear Piercing / Tattooing / Tanning Salon 81219 189Other Personal Care Service (e.g. bath house, massage parlour) 81219 190Coin-Operated Laundry 81231 191Dry Cleaning 81232 192Linen and Uniform Supply 81233 193Pet Care (e.g. animal shelter, boarding kennel, pet grooming) 81291 194Photo Finishing Service (e.g. one hour photo finishing services, not camera shops) 81292 195All Other Personal Service (e.g. party planning, personal shopping, psychic, shoe shine, escorts) 81299 196
VACANT SPACE NA 200
OTHER NON-RETAIL SPACE NA 201
GENERAL OFFICE SPACE NA 202
GAFO: OTHER RETAILERS [EXCLUDED]Miscellaneous Store Retailers [EXCLUDED]
Mobile Homes 45393 NA
AUTOMOTIVE [EXCLUDING AUTOMOTIVE PARTS AND ACCESSORIES STORES AND TIRE DEALERS]Vehicle Dealers [EXCLUDING AUTOMOTIVE PARTS AND ACCESSORIES STORES AND TIRE DEALERS]
New Cars 44111 NAUsed Cars 44112 NARecreational Vehicles 44121 NAMotorcycles 44122 NABoats 44122 NAOther Motor Vehicles (e.g. ATVs, snowmobiles, trailers, aircraft) 44122 NA
Gasoline StationsGasoline Station with Convenience Store 44711 203Gasoline Station without Convenience Store 44719 NA
NON-STORE RETAILERSElectronic Shopping and Mail-Order Houses 45411 NAVending Machine Operators 45421 NAFuel Dealer 45431 NAOther Direct Selling Establishments 45439 NA
SOURCE: Kircher Research Associates Ltd., based on Statistics Canada, North American Industry Classification System 2002 (Catalogue #12-501).