retail payments: working paper series · pdf fileworking paper series no 1135 / december 2009...
TRANSCRIPT

Work ing PaPer Ser i e Sno 1135 / december 2009
return to retail banking and PaymentS
Heiko Schmiedel and Liang Song
RETAIL PAYMENTS:INTEGRATION AND INNOVATION
by Iftekhar Hasan,

WORKING PAPER SER IESNO 1135 / DECEMBER 2009
This paper can be downloaded without charge fromhttp://www.ecb.europa.eu or from the Social Science Research Network
electronic library at http://ssrn.com/abstract_id=1521498.
In 2009 all ECB publications
feature a motif taken from the
€200 banknote.
RETURN TO RETAIL BANKING
AND PAYMENTS 1
by Iftekhar Hasan 2, Heiko Schmiedel 3 and Liang Song 4
1 The views expressed in this paper do not necessarily reflect those of the Bank of Finland or the European Central Bank.
2 Corresponding author: The Lally School of Management and Technology of Rensselaer Polytechnic Institute
and Bank of Finland, 110 8th Street - Pittsburgh Building, Troy, NY12180, U.S.A.; e-mail: [email protected]
3 European Central Bank, Payments and Market Infrastructure, Kaiserstrasse 29, 60311
Frankfurt am Main, Germany; e-mail: [email protected]
4 Rensselaer Polytechnic Institute and Bank of Finland, 110 8th Street - Pittsburgh Building,
RETAIL PAYMENTS:
INTEGRATION AND INNOVATION
Troy, NY 12180, U.S.A.; e-mail: [email protected]

© European Central Bank, 2009
Address Kaiserstrasse 29 60311 Frankfurt am Main, Germany
Postal address Postfach 16 03 19 60066 Frankfurt am Main, Germany
Telephone +49 69 1344 0
Website http://www.ecb.europa.eu
Fax +49 69 1344 6000
All rights reserved.
Any reproduction, publication and reprint in the form of a different publication, whether printed or produced electronically, in whole or in part, is permitted only with the explicit written authorisation of the ECB or the author(s).
The views expressed in this paper do not necessarily refl ect those of the European Central Bank.
The statement of purpose for the ECB Working Paper Series is available from the ECB website, http://www.ecb.europa.eu/pub/scientific/wps/date/html/index.en.html
ISSN 1725-2806 (online)
Retail payments: integration and innovation
“Retail payments: integration and innovation” was the title of the joint conference organised by the European Central Bank (ECB) and De Nederlandsche Bank (DNB) in Frankfurt am Main on 25 and 26 May 2009. Around 200 high-level policy-makers, academics, experts and central bankers from more than 30 countries of all five continents attended the conference, reflecting the high level of interest in retail payments.
The aim of the conference was to better understand current developments in retail payment markets and to identify possible future trends, by bringing together policy conduct, research activities and market practice. The conference was organised around two major topics: first, the economic and regulatory implications of a more integrated retail payments market and, second, the strands of innovation and modernisation in the retail payments business. To make innovations successful, expectations and requirements of retail payment users have to be taken seriously. The conference has shown that these expectations and requirements are strongly influenced by the growing demand for alternative banking solutions, the increasing international mobility of individuals and companies, a loss of trust in the banking industry and major social trends such as the ageing population in developed countries. There are signs that customers see a need for more innovative payment solutions. Overall, the conference led to valuable findings which will further stimulate our efforts to foster the economic underpinnings of innovation and integration in retail banking and payments.
We would like to take this opportunity to thank all participants in the conference. In particular, we would like to acknowledge the valuable contributions of all presenters, discussants, session chairs and panellists, whose names can be found in the enclosed conference programme. Their main statements are summarised in the ECB-DNB official conference summary. Twelve papers related to the conference have been accepted for publication in this special series of the ECB Working Papers Series.
Behind the scenes, a number of colleagues from the ECB and DNB contributed to both the organisation of the conference and the preparation of this conference report. In alphabetical order, many thanks to Alexander Al-Haschimi, Wilko Bolt, Hans Brits, Maria Foskolou, Susan Germain de Urday, Philipp Hartmann, Päivi Heikkinen, Monika Hempel, Cornelia Holthausen, Nicole Jonker, Anneke Kosse, Thomas Lammer, Johannes Lindner, Tobias Linzert, Daniela Russo, Wiebe Ruttenberg, Heiko Schmiedel, Francisco Tur Hartmann, Liisa Väisänen, and Pirjo Väkeväinen.
Gertrude Tumpel-Gugerell Lex Hoogduin Member of the Executive Board Member of the Executive Board European Central Bank De Nederlandsche Bank

3ECB
Working Paper Series No 1135December 2009
Abstract 4
1 Introduction 5
2 Retail payments: new research questions 8
3 Methodology and data 11
3.1 Empirical model 11
3.2 Effi ciency estimates 14
4 Results 17
4.1 Trends in retail payment systems 17
4.2 The impact of retail payments on bank performance 18
4.3 Commercial bank and non-commercial bank sub-samples 20
4.4 Interest income and non-interest income 21
4.5 The impact of retail payments on bank stability 22
4.6 Robustness tests 23
5 Conclusion 24
References 25
Appendix 29
European Central Bank Working Paper Series 44
CONTENTS

4ECBWorking Paper Series No 1135December 2009
Abstract
The European banking industry joined forces to achieve a fully integrated market for retail payment services in the euro area: the Single Euro Payments Area (SEPA). Against this background, the present paper examines the fundamental relationship between retail payment business and overall bank performance. Using data from across 27 European markets over the period 2000-07, we analyse whether the provisions of retail payment services are reflected in improved bank performance, using accounting ratios and efficiency measures. The results confirm that the performance of banks in countries with more developed retail payment service markets is better. This relationship is stronger in countries with a relatively high adoption of retail payment transaction technologies. Retail payment transaction technology itself can also improve bank performance, and evidence shows that heterogeneity in retail payment instruments is associated with enhanced bank performance. Similarly, a higher usage of electronic retail payment instruments seems to stimulate banking business. We also show that retail payment services have a more significant impact on savings and cooperative bank performance although they have a positive influence on the performance of commercial banks. Additionally, findings reveal that impact of retail services on bank performance is dominated by fee income. Finally, an effective payment service market is found to be associated with higher bank stability. Our findings are robust to different regression specifications. The results may also be informative for the industry when reconsidering its business models in the light of current financial market developments.
Keywords: retail payment, bank performance, cost and profit efficiency
JEL classification: G21, G28.

5ECB
Working Paper Series No 1135December 2009
1. Introduction
It is widely recognised that safe and efficient retail payment systems enhance the
effectiveness of the financial system, boost consumer confidence and facilitate the functioning of
commerce (BIS, 2003). Conceptionally, payment systems are coined as being two-sided markets
(Rochet and Tirole, 2006). Virtually every economic transaction involves the use of a payment
instrument, such as cheques, electronic funds transfers, etc. (Berger et al., 1996). Over the past
decades, the payments business has witnessed important ongoing challenges and opportunities,
comprising regulatory changes, increased consolidation and competition and technological
advances. As a result, today’s banking and payments business differs substantially from that in
the past. At present, these developments are being intensified by the current financial market
turmoil, which may trigger fundamental changes in the business model for retail banking and
payments.
In Europe, the European banking industry joined forces to achieve a fully integrated
market for retail payment services in the euro area: the Single Euro Payments Area (SEPA). The
realisation of SEPA is important for two reasons. First, it contributes to creating a competitive
and integrated European retail payment market, thereby fostering innovation and growth in the
retail banking sector. Second, SEPA will also contribute to a smooth and safe underlying
payment infrastructure, providing the basis for stable transactions at the retail banking level, and
thereby contributing to the safeguarding of financial stability.3,4
The importance of retail banking and payments is also likely to revive against the
background of the current ongoing financial market turmoil. In particular, at a time when other
sources of income for banks are more volatile, payment services will contribute to banks’
business as banks can count on the reliable and regular revenues generated by payment services.
3 With SEPA, there is no difference in the euro area between national and cross-border retail payments. SEPA further aims to turn the fragmented national markets for euro payments into a single domestic one. Thus, SEPA will enable customers to make and receive cashless euro payments throughout the area from and to a single bank account, using a single set of payment instruments. 4 The SEPA initiative also involves the development of common financial instruments, standards, procedures and infrastructure to enable economies of scale. This should in turn reduce the overall cost to the European economy of making payments. These costs can be quite substantial. See Section 2 for a review of the estimates of such costs.
6ECBWorking Paper Series No 1135December 2009
Moreover, although it is understandable that banks are currently allocating resources to fighting
the current crisis, it should not be forgotten that banks ought to prepare for carrying out their core
tasks when “normal times” have returned. In this respect, the turmoil may cause banks to
reconsider their business models and concentrate on their public role: namely to provide
innovative and efficient pan-European payment services, as well as offering current accounts and
business and personal loans.
The literature on the topic to date is sparse. The pioneering work in this field concludes
separate perspectives on retail banking and payments. Capgemini and European Commission
(2008), Kemppainen (2003, 2008), and Schmiedel (2007) have stressed the benefits and potential
of SEPA. At the micro level, Campbell et al. (2009), Lusardi and Tufano (2009) and Scholnick
(2009) focus on the role of payment innovations and services for consumer finance and
consumer’s spending patterns.5 Kahn et al. (2005) show the impact of bank consolidation on
consumer loan interest rates. Hirtle and Stiroh (2007) document a “return to retail” for US
commercial banks, with managers and analysts emphasizing the relative stability of consumer-
based business lines. Most recently, Puri et al. (2009) stress the global nature of commercial
banking and find that banking lending patters have changed in response to the financial crisis.
Other contributions (DeYoung, 2005; DeYoung and Rice, 2004) emphasize the importance of
internet-based business and non-interest income on banks financial performance. None of these
studies however are directly linked to retail payment technology, instruments, and practices by
financial institutions and their impact on bank performance. As recognised by Kahn and Roberts
(2009) empirical work on payments is still in its infancy, while a number of studies has led to
interesting theoretical insights and potential policy prescriptions. This is the first systematic
attempt to fill this gap in the literature by providing a combined and integrated view of the
importance and significance of retail payment services for banks and banking industry.
5 For a comprehensive review of earlier literature refer to Hancock, D. and D. Humphrey (1998). In addition, see Saunders and Scholnick (2006) and Kahn and Roberts (2009) for an overview of new frontiers and topics relevant to payment and settlement systems.

7ECB
Working Paper Series No 1135December 2009
Specifically, it examines the linkage between the provisions of retail payment services and
performance for EU banks from 2000 to 2007.
Based on the country-level retail payment service data from across 27 EU markets,
evidence confirms that banks perform better in countries with more developed retail payment
services, as measured by accounting ratios and profit and cost efficiency scores. 6 This
relationship is stronger in countries with more retail payment transaction equipment, like ATMs
and POS terminals. Retail payment transaction technology itself can also improve bank
performance and heterogeneity among retail payment instruments is associated with enhanced
bank performance. Likewise, a higher usage of electronic retail payment instruments seems to
stimulate banking business. We also show that retail payment services have a more significant
impact on savings and cooperative bank performance although they have a positive influence on
the performance of commercial banks. Additionally, findings reveal that impact of retail services
on bank performance is dominated by fee income. Finally, an effective payment service market
is found to be associated with higher bank stability.
The paper proceeds as follows. Section 2 outlines the importance of retail payment
services and describes how it may impact bank performance and consequently develops a set of
research questions to be tested in the paper. Section 3 describes the empirical methodology and
summarises the data. Section 4 reports the empirical results. The final section contains a
summary and conclusion.
6 The EU provides a very good testing ground for the link between retail payments and bank performance because the current retail payment infrastructure in the European Union is still fragmented and largely based on traditional national payment habits and characteristics (Kemppainen, 2003 and 2008).
8ECBWorking Paper Series No 1135December 2009
Payment services are an important part of the banking industry, accounting for a
significant part of its revenues and operational costs. It is also considered as the backbone of
banking activities as it is significantly associated with increased market share of other bank
business, e.g. the provision of credit and the evaluation of associated risks [Boston Consulting
Group (BCG), 2009]. BCG also reports that payments business accounts for 30-50 percent of
bank revenues, and is actually considered the most attractive element of banking business, in
terms of income generation, growth rates, and relatively low capital needs. Hirtle and Stiroh
lower return.
We argue that effective payment services are important in helping banks to establish
long-term relationships with their customers, both private individuals and corporate clients.
These services are strongly linked to other banking services, e.g., deposits, as customers prefer to
deposit money into a system in which they can obtain a good payment service (Kemppainen,
2003, 2008). Against this background, we hypothesize that banks perform better in countries
with a more developed retail payments business.
From an economic perspective, efficient and safe payment systems are important insofar
as they facilitate real and financial transactions in advanced economies. Their production is
subject to economies of scale due to the significant investment in infrastructure needed to start
the operation (large fixed costs) and the relatively small marginal cost of services provided using
the existing infrastructure. Bolt and Humphrey (2007) provide evidence that standardisation of
retail payment instruments across the euro area is likely to result in economies of scale in
payment services in Europe. Similar economies of scale effects are to be gained in the European
payment processing industry (Beijnen and Bolt, 2009).
Berger and DeYoung (2006) show that technological progress has facilitated the
geographic expansion of the banking industry. Specifically, ATMs, POS terminals and similar
shares and extent of branching network) and bank stability although such focus also resulted
2. Retail payments: New research questions
(2007) find a significant link between retail focus by the U.S. banks (retail loan and deposit

9ECB
Working Paper Series No 1135December 2009
technologies can potentially reduce the costs of asset convertibility for households over time
(Berger et al., 1996). Carlton and Frankel (1995) reported higher volumes and lower costs after
the merger of competing ATM systems. Analysing customer switching effects, Massoud et al.
(2006) find that higher ATM surcharges result in a greater market share of deposits of larger
banks and a lower market share for smaller banks. The distribution network of payment services
plays a crucial role as it attracts customers to the bank and generates more revenue in retail
banking and other related business lines. At the same time, these retail payment transaction
technologies reduce the labour cost for banks and have the potential to reduce the costs of
handling cash. Columba (2009) shows that transaction-technology innovation, i.e. the diffusion
of ATM and POS technologies, has a negative effect on the demand for currency in circulation,
while the overall effect on M1 is positive. In other words, transaction technologies and
sophistication, e.g. ATM and POS networks, help banks to improve their overall performance.
Amromin and Charkravorti (2009) show that demand for small-denomination currency decreases
with greater debit card usage and with greater retail market consolidation.
Besides the direct impact on bank performance, we also predict that retail payment
transaction technologies have an intensifying effect on the relationship between retail payment
services and bank performance. Advanced retail payment transaction technologies will foster
innovation and growth in the retail banking sector. This will further create more value associated
with retail payment services for banks. On the other hand, if more retail payment transactions
have been done through ATMs or POS instead of retail payments offices, banks can be more cost
efficient and obtain more profit. We believe that retail payment services have a larger impact on
bank performance in countries with a relatively high adoption of retail payment transaction
technologies.
There are several varieties of retail payment instruments, like credit transfers, direct
debits, card payments, e-money purchases, cheques, etc. Competition in retail payment markets

10ECBWorking Paper Series No 1135December 2009
has commonly been seen as an important contributor to efficiency (BIS, 2003).7 In a very
competitive retail payment market, consumers have more choices to complete retail payment
transactions and to make transactions more quickly and efficiently. Competition among retail
payment instruments may also encourage retail payment providers to improve their service.
Additionally, a greater variety of retail payment instruments may result in more retail banking
innovations. Therefore, we hypothesise that heterogeneity among retail payment instruments
helps banks to improve their performance.
The European payments industry has undergone considerable change as electronic
payment has increasingly gained popularity. New payment technologies, particularly newer
electronic methods for consumer payments that may replace older paper-based methods, can
potentially speed up settlement and reduce the financial costs of making payments for bank
customers (Berger et al., 1996; Humphrey et al., 2006; Humphrey and Vale, 2004). Intuitively,
the total cost of making payments for society might be expected to be high. In an early study, the
costs have been estimated to amount to as much as three percent of GDP (Humphrey et al.,
2003). A number of recent central bank studies provide more detailed estimates, especially
where European countries are concerned. Depending on the chosen approach and methodology,
the estimated total costs in connection with the production of payment services are in between
0.49 and 0.74 percent of GDP in 2002 (Brits and Winder, 2005; Banque Nationale de Belgique,
2005; Gresvik and Owre, 2003). These figures clearly show that costs related to payment
activities are not negligible. Moreover, in general, there is a positive relationship between the use
of electronic payment methods and the efficiency of the payment system.
Significant potential benefits from adopting technological innovations can be expected,
but typically there are extraordinary costs associated with the introduction of new payment
methods. Humphrey et al. (1996) find that payment instrument choices strongly depend on bank
customers’ learning costs. In this paper, we examine whether the physical distribution of
7 Scholnick et al. (2007) provides a survey of the literature on credit cards, debit cards and ATMs.
11ECB
Working Paper Series No 1135December 2009
payment services becomes increasingly less important from a payments perspective with the
emergence of electronic payment methods and channels. Specifically, we investigate the possible
significant association between the promotion and growth of electronic payment products and
services and bank performance.
3. Methodology and data
3.1 Empirical model
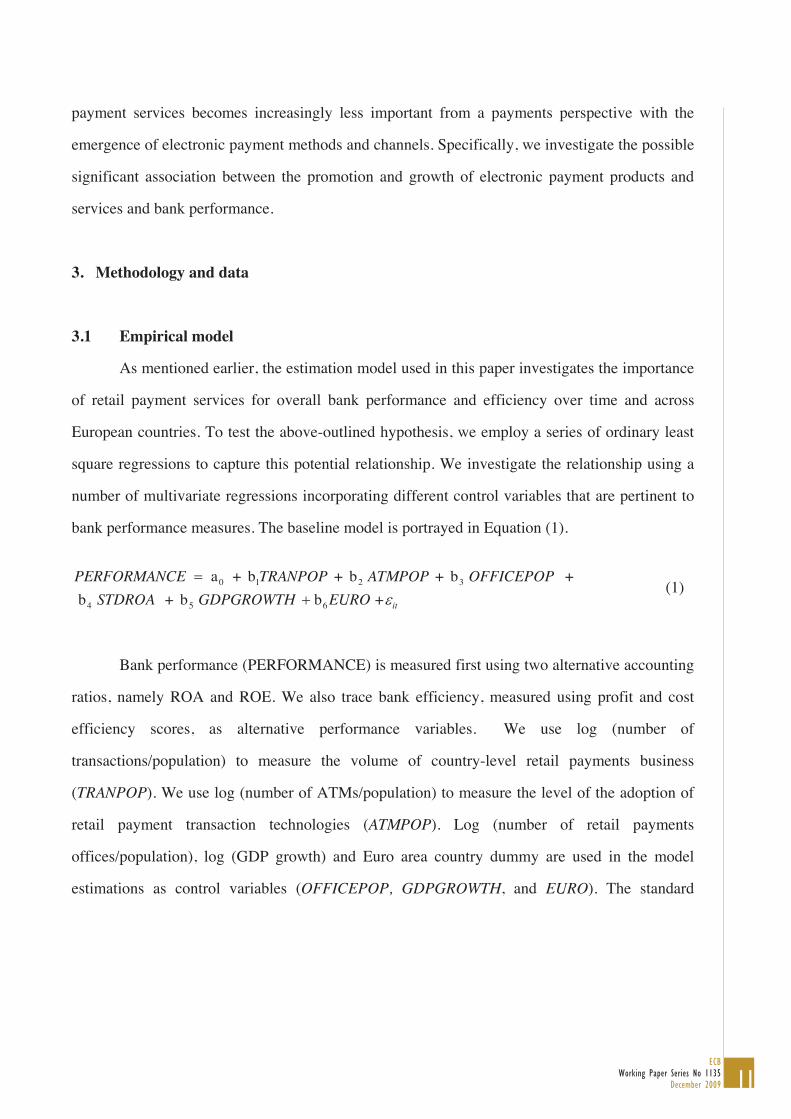
As mentioned earlier, the estimation model used in this paper investigates the importance
of retail payment services for overall bank performance and efficiency over time and across
European countries. To test the above-outlined hypothesis, we employ a series of ordinary least
square regressions to capture this potential relationship. We investigate the relationship using a
number of multivariate regressions incorporating different control variables that are pertinent to
bank performance measures. The baseline model is portrayed in Equation (1).
PERFORMANCE a0 + b1TRANPOP + b2 ATMPOP + b3 OFFICEPOP + b4 STDROA + b5 GDPGROWTH b6EURO + it
(1)
Bank performance (PERFORMANCE) is measured first using two alternative accounting
ratios, namely ROA and ROE. We also trace bank efficiency, measured using profit and cost
efficiency scores, as alternative performance variables. We use log (number of
transactions/population) to measure the volume of country-level retail payments business
(TRANPOP). We use log (number of ATMs/population) to measure the level of the adoption of
retail payment transaction technologies (ATMPOP). Log (number of retail payments
offices/population), log (GDP growth) and Euro area country dummy are used in the model
estimations as control variables (OFFICEPOP, GDPGROWTH, and EURO). The standard

12ECBWorking Paper Series No 1135December 2009
deviation of ROA8 over the sample period is also used as a control variable (STDROA) to
measure bank risk and stability. The regression models include dummy variables to account for
fixed country-specific and year effects.9
To test the moderation effect of retail payment transaction technologies on the
relationship between retail payment services and bank performance, we add an interaction term
between log (number of transactions/ population) and log (number of ATMs / population)
(TRANATMPOP) to the equation (1). The estimated equation is:
PERFORMANCE a0 + b1TRANPOP + b2 ATMPOP + b3 OFFICEPOP + b4 STDROA + b5 GDPGROWTH b6EURO b7TRANATMPOP + it
(2)
To consider the impact on performance of the heterogeneity of retail payment
instruments, we add the Herfindahl index of payment instruments as another control variable
(HERFINDAHLINSTRU) to equation (2). The estimated equation is:
PERFORMANCE a0 + b1TRANPOP + b2 ATMPOP + b3 OFFICEPOP +b4 STDROA+ b5 GDPGROWTH b6EURO b7TRANATMPOP +b8HERFINDAHLINSTRU it
(3)
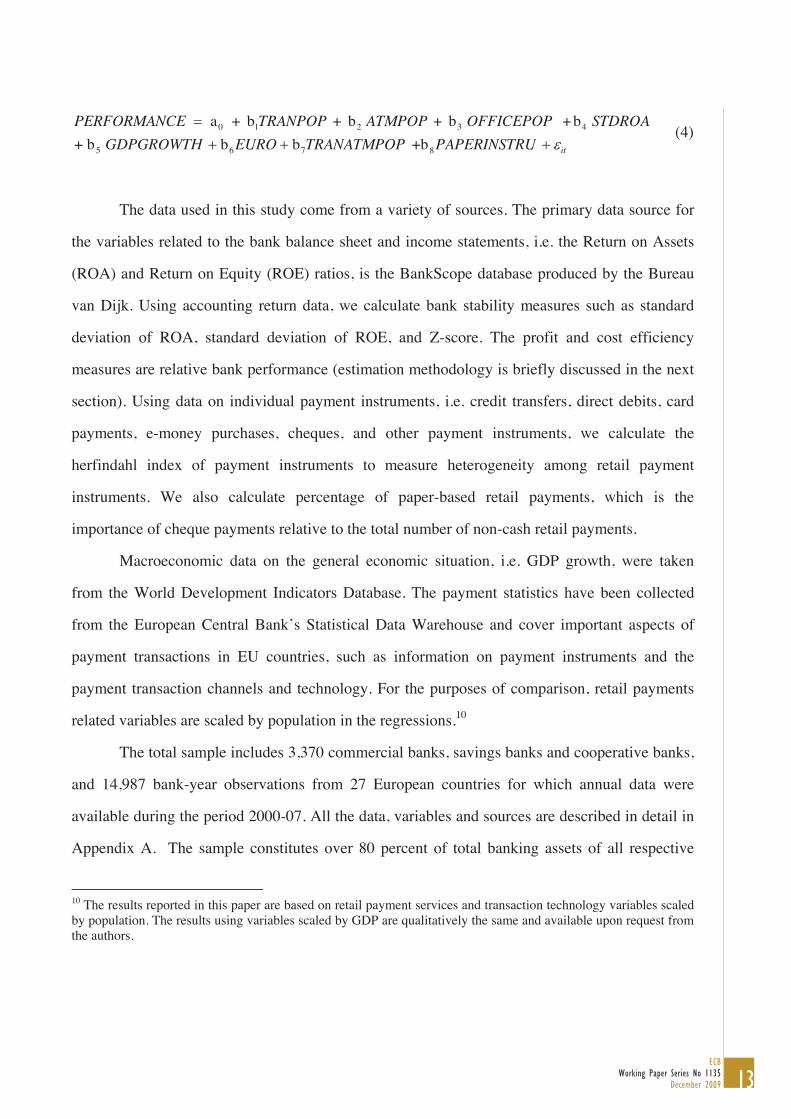
To consider the impact on performance of the percentage of electronic retail payment
instruments, we add percentage of paper-based retail payment instruments as another control
variable (PAPERINSTRU) to equation (2). Because higher percentage of paper-based retail
payment instruments means more adoption of cheques and is positively correlated with
herfindahl index of payment instruments, we do not control for herfindahl index of payment
instruments in the estimation to avoid potential multicoliniarity problems. The estimated
equation is:
8 We report only the results where ROA standard deviations are used as a proxy for risk. Results are similar equally robust if the variable is replaced by the standard deviation of ROE. 9 Second-stage bank efficiency regressions, when we avoid country and year effects, which have been adjusted for in the first-stage efficiency estimates, produce qualitatively similar results.
13ECB
Working Paper Series No 1135December 2009
PERFORMANCE a0 + b1TRANPOP + b2 ATMPOP + b3 OFFICEPOP +b4 STDROA+ b5 GDPGROWTH b6EURO b7TRANATMPOP +b8PAPERINSTRU it
(4)
The data used in this study come from a variety of sources. The primary data source for
the variables related to the bank balance sheet and income statements, i.e. the Return on Assets
(ROA) and Return on Equity (ROE) ratios, is the BankScope database produced by the Bureau
van Dijk. Using accounting return data, we calculate bank stability measures such as standard
deviation of ROA, standard deviation of ROE, and Z-score. The profit and cost efficiency
measures are relative bank performance (estimation methodology is briefly discussed in the next
section). Using data on individual payment instruments, i.e. credit transfers, direct debits, card
payments, e-money purchases, cheques, and other payment instruments, we calculate the
herfindahl index of payment instruments to measure heterogeneity among retail payment
instruments. We also calculate percentage of paper-based retail payments, which is the
importance of cheque payments relative to the total number of non-cash retail payments.
Macroeconomic data on the general economic situation, i.e. GDP growth, were taken
from the World Development Indicators Database. The payment statistics have been collected
from the European Central Bank’s Statistical Data Warehouse and cover important aspects of
payment transactions in EU countries, such as information on payment instruments and the
payment transaction channels and technology. For the purposes of comparison, retail payments
related variables are scaled by population in the regressions.10
The total sample includes 3,370 commercial banks, savings banks and cooperative banks,
and 14,987 bank-year observations from 27 European countries for which annual data were
available during the period 2000-07. All the data, variables and sources are described in detail in
Appendix A. The sample constitutes over 80 percent of total banking assets of all respective
10 The results reported in this paper are based on retail payment services and transaction technology variables scaled by population. The results using variables scaled by GDP are qualitatively the same and available upon request from the authors.

14ECBWorking Paper Series No 1135December 2009
European countries and incorporate all major and important financial institutions. In the initial
estimations, we incorporate all types of financial institutions where commercial banks
constituted 23% followed by savings banks 24% and cooperative banks 53%. German banks
dominate the sample with 55 percent of the sample observations and therefore we attempt
additional robustness tests of our estimations excluding German banks.
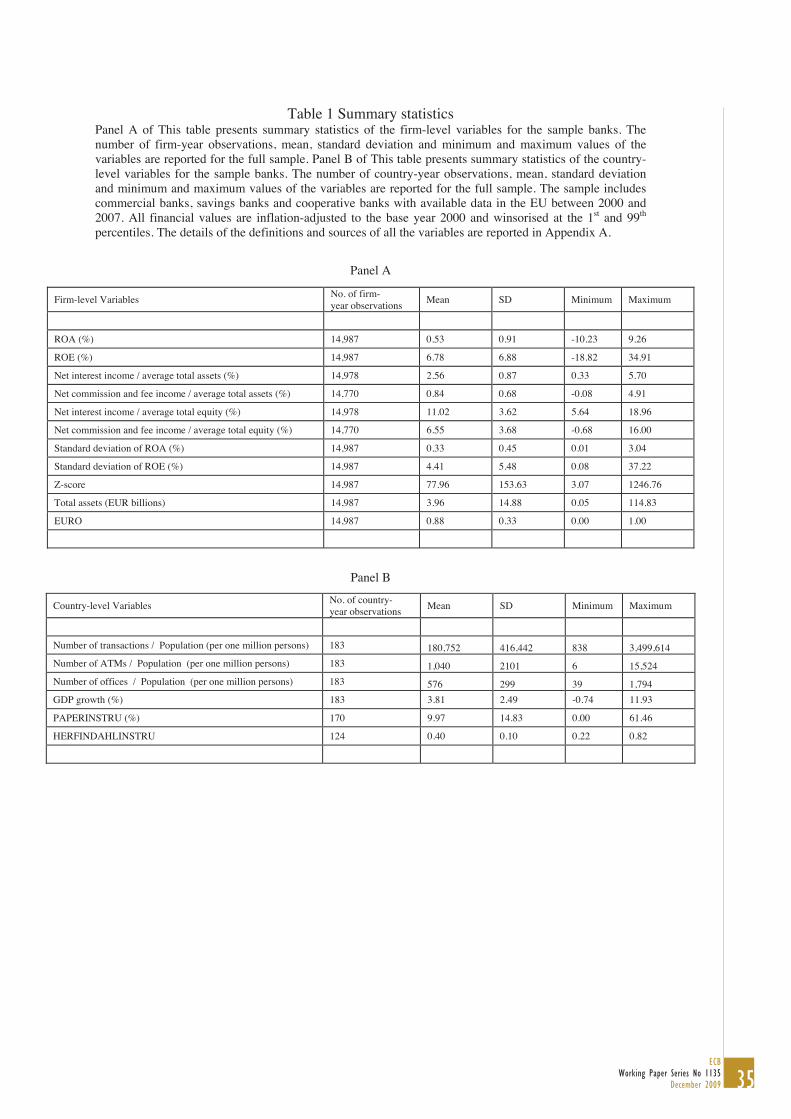
Table 1 reports the descriptive statistics of the sample. As shown in Panel A, eighty eight
percent of the bank-year observations are from the euro area. The bank performance and stability
measures are consistent with those reported in other studies. Moreover, the European payment
landscape can be characterised by substantial variation in the use of retail payment services, as
illustrated in Panel B, for example, by the relatively high standard deviation of the total number
of retail payment transactions scaled by the population, of about 416,442 per one million
persons. Similarly, the adoption of retail payment transaction technologies shows relatively
strong asymmetries across Europe, as demonstrated by relatively high standard deviations for the
numbers of ATMs scaled by the population. The mean value of the relative importance of paper-
based payments is about 9.97%, suggesting that electronic retail payment instruments are
increasingly used and widely adopted non-cash payment instruments. The mean value of the
herfindahl index for the different payment instruments is 0.40. This implies that consumers have
a wide range of options as to how to make their retail payments.
3.2 Efficiency estimates
Although the accounting measures are informative and well-established measures of bank
performance, we also use relative efficiency measures – profit and cost efficiency using
stochastic frontier analysis (SFA) – as alternative performance variables. SFA is considered as
the most robust estimates of relative performance compared to other similar statistical methods
such as Data Envelope Analysis (Berger and Mester, 1997, Kumbhakar and Lovell, 2000). In
this study, efficiency measures are likely to better reflect and capture the effects of retail
payment services, such as customer service, product variety, etc. Once estimated, these

15ECB
Working Paper Series No 1135December 2009
efficiency scores are then used as dependent variables to investigate further on the impact of
retail payment services on bank performance.
Because the frontier specifications used in this paper are similar to those in the existing
literature, we provide only a brief summary of the prominent features as follows.11
The empirical model to estimate the efficiency scores is the following:
itititititit NYXfCOSTPROFIT ),,()( (5)
where PROFIT (COST) represents total profits (total costs), which are a function of
several outputs X, input prices Y and fixed effects for years and countries N. The error term it is
a random disturbance term that allows the profit (cost) function to vary stochastically. The
random disturbance term has two components, vit, which represents the random uncontrollable
factors that affect total profits (costs), and uit, which represents the controllable factors, such as
the firm’s technical and allocative efficiency, that are under the control of the firm’s
management. Decomposing the error term yields:
)(),()( , ititititititititit uvuvNYXfCOSTPROFIT (6)
We use a similar specification for the profit and cost function, except that under the
frontier approach managerial or controllable inefficiencies increase (decrease) costs (profit)
above (below) frontier or best practice levels. Therefore, the positive (negative in a profit
function) inefficiency term, uit, causes the costs (profit) of each firm to be above (below) the
frontier. The vit terms are assumed to be identically and normally distributed, with zero mean and
variance equal to 2v . The technical inefficiency uit terms are non-negative random variables that
are distributed normally but truncated below zero. We include both country effects and year
11 For a review of the use of stochastic frontier analysis to estimate bank efficiency, see, for example, Berger et al. (2000), Hasan et al. (2003).

16ECBWorking Paper Series No 1135December 2009
effects in the estimation of the efficiency frontier, because banking efficiency may be influenced
by differences in structural conditions in the banking sector and in general macroeconomic
conditions across countries and over time. Following the existing efficiency literature, we
employ a translog specification for the profit and cost function and make standard symmetry and
homogeneity assumptions.
The primary source of data on bank balance sheets and income statements is the
BankScope database. We measure total profit as the net profit earned by the bank. To avoid
having a negative net profit for any bank observation, we add a constant amount to profit in all
cases. Total costs are measured as the sum of interest and non-interest costs. While there
continues to be debate about how to define the inputs and outputs used in the function, we follow
the traditional intermediation approach of Sealey and Lindley (1977). The output variables, X,
are total loans, total deposits, liquid assets and other earning assets. The input variables, Y, are
interest expenses divided by total deposits and non-interest expenses divided by fixed assets. To
make sure that our estimates are not biased by outliers, all the variables are winsorised at the 1st
and 99th percentiles. The descriptive statistics for the basic variables used in the profit and cost
efficiency estimations are reported in Panel A of Table 2.
Following Berger and Mester (1997), cost, profit and input prices are normalised by non-
interest expenses divided by fixed assets to impose homogeneity. Cost, profit and output
quantities are normalised by total earning assets, because the variance of the inefficiency term
might otherwise be strongly influenced by bank size. Normalisation also facilitates interpretation
of the economic model.
The summary statistics for the stochastic frontier efficiency estimates are given in Panel
B of Table 2.12 These statistics include the ratio of the standard deviation of the inefficiency
component of the disturbance to that of the random component ( u / v ), the standard deviation
of the composite disturbance ( ), and the proportion of the variance in the overall disturbance
12 The estimates of the cost and profit function coefficients are available upon request from the authors.
17ECB
Working Paper Series No 1135December 2009
that is due to inefficiency, 22 /u . Panel B of Table 2 indicates that most of the variation in
the disturbance of best practice is due to technical inefficiency rather than random error. The
mean cost efficiency of 0.74 suggests that about 26% of costs are wasted on average relative to a
best-practice firm. The mean profit efficiency of 0.68 implies that about 32% of the potential
profits that could be earned by a best-practice firm are lost to inefficiency. These figures are well
within the observed range from other efficiency studies. The standard deviation of the profit
efficiencies is about 11.5 percentage points, suggesting that efficiencies are quite dispersed. The
cost efficiencies are distributed with a standard deviation of 11.4 percentage points. In Panel C
of Table 2, When we see the cost efficiency score and profit efficiency score by euro area and
non euro area, we find that banks in euro area on average are more cost and profit efficient than
those in non euro area. We also find that efficiencies of banks in non euro area are more
dispersed than those in euro area.
4. Results
In this section, we first outline recent trends in retail payment systems in the EU. Then
we report the results for the impact of retail payment services on bank performance.
4.1 Trends in retail payment systems
Over the past decade, a number of important trends have affected retail payment systems
in the EU. One such trend is the rapid consolidation of banks providing retail payment services.
Figure 1 shows that the number of retail payments institutions and the number of offices declined
during the sample period, from 2000 to 2007. This suggests that retail payments providers are
consolidating as they seek economies of scale. Given a relatively high pair-wise correlation
between the numbers of retail payments institutions and offices, we only control for the number
of offices in our regression. The results do not qualitatively change when the number of retail
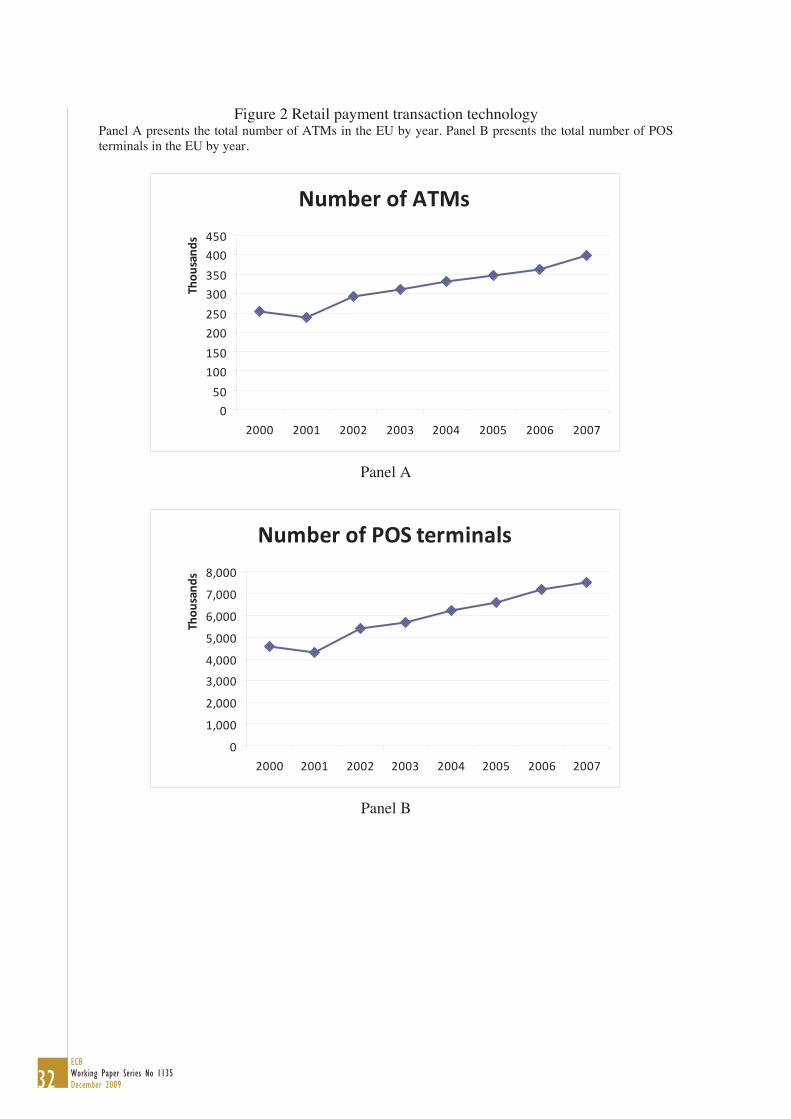
payments institutions is used instead. Moreover, as seen in Figure 2, the total numbers of
different retail payment equipments, like ATMs and POS terminals, are increasing over time
18ECBWorking Paper Series No 1135December 2009
with a similar trend.13 This implies that in the EU, a higher degree of adoption of retail payment
technology is being used to replace traditional retail branches.
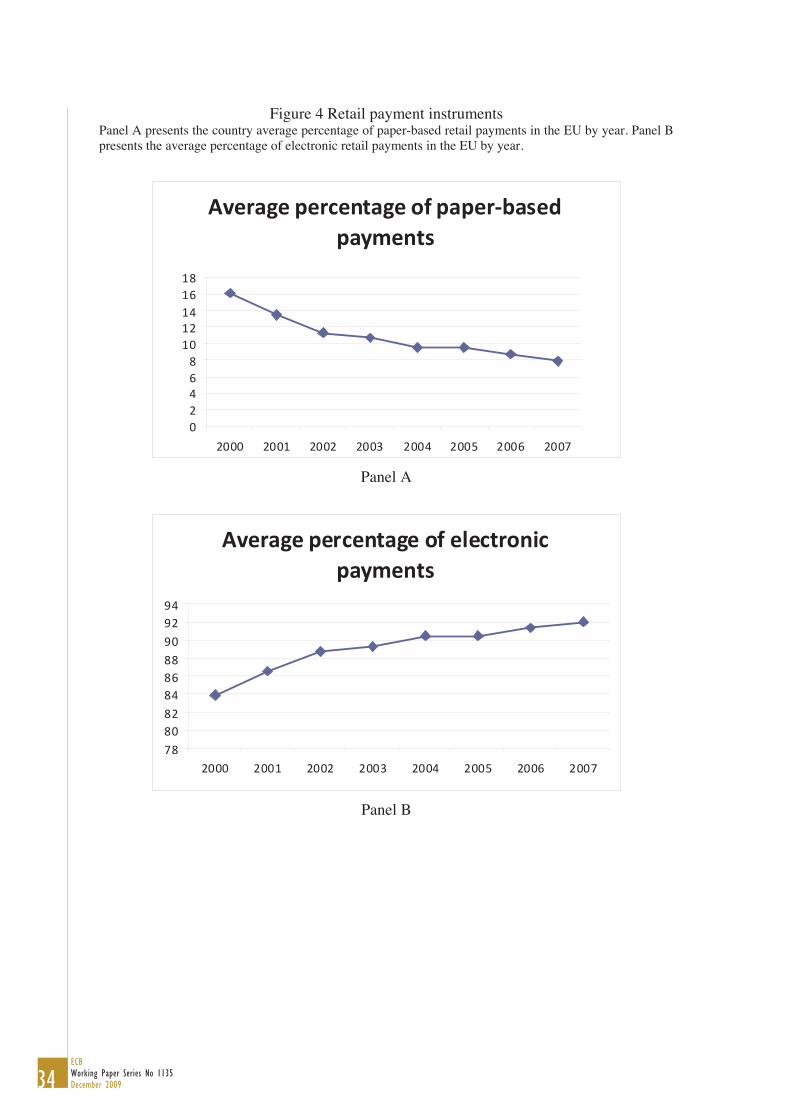
As seen in Figure 3, the total value and total number of retail payment transactions
increased constantly, with an average annual growth rate of about 6% over the entire sample
period.14 This suggests that retail payment services have substantial growth opportunities and
business potential. Another important trend is the shift from paper to electronic payment. As seen
in Figure 4, consumers’ use of electronic payments has grown significantly in recent years, while
paper-based retail payments, i.e. cheque payments, have declined sharply as a proportion of total
non-cash payment volumes.
4.2 The impact of retail payments on bank performance
In the empirical estimations, we use the ROA and ROE ratios as dependent variables to
examine the importance of retail payment services on bank performance. The estimation
parameters are shown in columns 1 and 2 of Tables 3, 4, 5 and 6. To investigate the effect of
retail payment systems on bank efficiency, we take the cost and profit efficiency scores for each
bank observation as the dependent variables in regressions. The TRANPOP, as measured by Log
(number of transactions/population), enters the estimations as an explanatory variable. The
regression coefficients are reported in columns 3 and 4 of Tables 3, 4, 5 and 6. All regression
models include dummy variables to account for fixed country-specific and year effects.15 For
simplicity in the reporting, the coefficients of these variables are suppressed. Standard errors are
clustered at the country-level to capture the potential correlation of bank performance within the
same country.
As an overall result, we observe a positive relationship between total number of
transactions to population and bank performance, as reported in Table 3. This finding is
13 We only control, in our regression, for the number of ATMs. There is no qualitative change in the results when the number of POS terminals is used instead. The latter results are available upon request. 14 The total value of retail payment transactions is inflation-adjusted to the base year 2000. 15 Second-stage bank efficiency regressions, when we avoid country and year effects, which have been adjusted for in the first-stage efficiency estimates, produce qualitatively similar results.

19ECB
Working Paper Series No 1135December 2009
consistent for alternative model specifications considering both accounting and efficiency
measures. The magnitude of the TRANPOP coefficient suggests that changes in total number of
retail payments transactions have a significant effect on bank performance. For instance, a 10%
increase in the number of retail payments transactions to population implies a 1.08% increase in
ROA, a 0.56% increase in ROE, a 0.06% increase in cost efficiency and a 0.45% increase in
profit efficiency. Retail payments technology, as measured by Log (number of
ATMs/Population), has a positive effect on bank performance. The magnitude of the ATMPOP
coefficient implies that the impact of changes in total number of ATMs to population on bank
performance is economically significant. For instance, a 10% increase in the number of ATMs to
population implies a 1.29% increase in ROA, a 0.38% increase in ROE, a 0.53% increase in cost
efficiency and a 0.08% increase in profit efficiency. There is no clear relationship between
number of retail payments offices to population and bank performance. Bank risk, as measured
by standard deviation of ROA, is positively associated with accounting measures of bank
performance and efficiency measures. Another interesting result is that banks based in the euro
area appear to perform better.
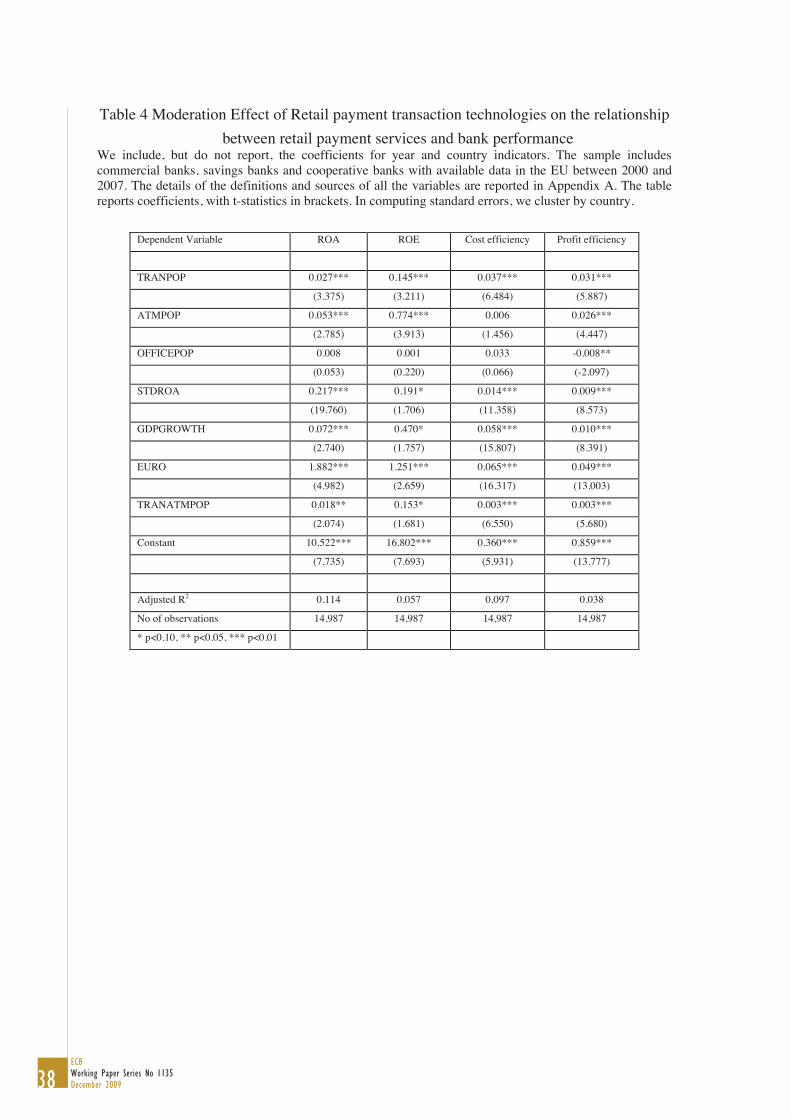
To examine whether the relationship between retail payment services and bank
performance is stronger in countries that have widely adopted retail payments technologies, we
incorporate in the estimation model a term (TRANATMPOP) for interaction between TRANPOP
and ATMPOP. As seen in Table 4, the coefficient of the interaction term TRANATMPOP is
significantly positive for all different bank performance measures. This suggests that retail
payment technologies can facilitate retail banking innovations and add more value to retail
payment services.
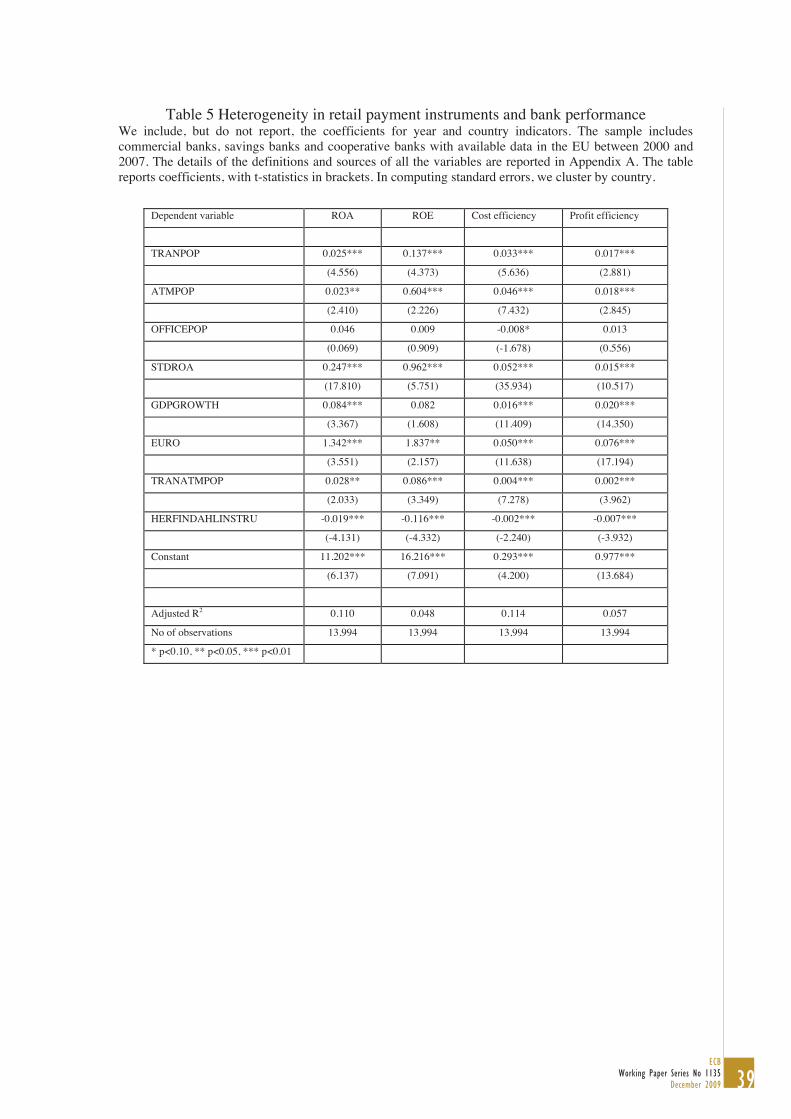
To investigate whether competition and an improved choice of retail payment
instruments translates into improved bank performance, we incorporate the
HERFINDAHLINSTRU, as measured by log (Herfindahl index of payment instruments), in the
regression. The results, as seen in Table 5, confirm this relationship, since the coefficient of the
HERFINDAHLINSTRU is significantly negative across the four different bank performance
20ECBWorking Paper Series No 1135December 2009
measures. The magnitude of the HERFINDAHLINSTRU coefficient suggests that changes in
heterogeneity in retail payments instruments have a significant effect on bank performance. For
instance, a 10% increase in Herfindahl index for payment instruments implies a 0.34% decline in
ROA, a 0.16% decline in ROE, a 0.03% decline in cost efficiency and a 0.10% decline in profit
efficiency. Chakravorti and Roson (2006) study competition among payment networks providing
different payment instruments and find similar results.
Moreover, the significant negative coefficient of the PAPERINSTRU, reported in Table 6,
suggests that greater use of electronic payment instruments can improve bank performance. The
magnitude of the PAPERINSTRU coefficient implies that the impact of changes in percentage of
electronic payment instruments is economically significant. For instance, a 10% decline in the
percentage of paper-based retail payments implies a 5.66% increase in ROA, a 2.06% increase in
ROE, a 1.35% increase in cost efficiency and a 1.47% increase in profit efficiency.16
4.3 Commercial bank and non-commercial bank sub-samples
Commercial banks are relatively large and are able to conduct the full range of banking
activities. However, they tend to specialise in investment banking, asset management and trust
business. Savings and cooperative banks tend to be concentrated in their home area, where they
compete with commercial banks. They focus more on retail banking and their market share of
retail business is higher. In this section, we examine whether our previous results are influenced
by the difference between commercial and non-commercial banks.
We split our sample into a commercial bank sub-sample and a non-commercial bank sub-
sample. As seen in Table 7, both commercial and non-commercial bank performance is higher in
countries with a more developed retail payment business. However, the coefficient of TRANPOP
16 This finding is also supported by earlier studies. For example, Bolt et al. (2008) provide evidence that given the large resource cost of a country’s payments system, shifting from paper to electronic payments can entail substantial cost savings and social benefits. Similarly, Humphrey et al (2006) and Humphrey and Vale (2004) report that banks’ average cost has been affected by the on-going shift from expensive paper-based payment instruments (checks, paper giro transactions) to lower cost electronic payment substitutes (debit cards, electronic giro payments).
21ECB
Working Paper Series No 1135December 2009
in the regressions for savings and cooperative banks is about twice as that in the regressions for
commercial banks. These results imply that retail payment services have a more significant
impact on savings and cooperative bank performance, which have a stronger focus on retail
banking business.
4.4 Interest income and non-interest income
In this section, we examine through which specific channel payment services contribute
to bank performance. Banks’ income arises mainly from two sources: lending and non-interest
activities. Retail payment services have a direct impact on banks’ non-interest income, such as
fee income arising from payment services and bank account management. Non-interest income
has a very important impact on bank performance. In Europe, non-interest income increased
from 26% to 41% of total income between 1989 and 1998 (ECB, 2000). Retail payment services
also have some impact on banks’ lending business by attracting more deposits. Banks can earn
interest income on debit and credit balances arising in relation to services and products for
making payments. When borrowers obtain financing from banks they also worry about how to
repay it. A convenient retail payment service can facilitate repayment and attract more customers
to borrow money from banks. In addition, interest income may be correlated with non-interest
income because of possible cross-selling of different products to the same customer (Stiroh,
2004; Stiroh and Rumble, 2006).
As seen in Table 8, we re-run our baseline regression using net interest income scaled by
average total assets (average total equity) and net commission and fee income also scaled by
average total assets as dependent variables. The evidence shows that the relationships between
retail payment services and net interest income and between retail payment services and net
commission and fee income are both significantly positive. However, the coefficient of
TRANPOP in the regressions with net commission and fee income as dependent variables is
about one hundred percent larger than that in the regressions with net interest income as

22ECBWorking Paper Series No 1135December 2009
dependent variables. These results suggest that retail payment services have a more significant
impact on net commission and fee income.
4.5 The impact of retail payments on bank stability
The conventional wisdom argues that retail payments business is less volatile than other
forms of banking activities like trading or underwriting. Usually, high-risk activities will demand
a premium in the form of higher returns, although the link between risk and return has not been
as tight as theory predicts in practice (Fama and French, 2004). In this section, we want to
examine the impact of retail payments business on bank stability. The estimated model is as
below:
itEUROTHAVEGDPGROWSETAVETOTALASOPAVEOFFICEPAVEATMPOPAVETRANPOPRISK
+bb+b+b+b+b+a
654
3210 (7)
Three standard measures of risks, based on accounting data and determined for each bank
throughout the period, are used as dependent variables in the regression: Standard deviation of
ROA, standard deviation of ROE, and Z-score, which represents the probability of failure of a
given bank and higher values of Z-scores imply lower probabilities of failure (See Boyd and
Graham, 1986 for details)17. We obtain average values of number of transactions / population,
number of ATMs / population, number of offices / population, and GDP growth for each country
throughout of the period. The logarithms of these average values are used as independent
variables (AVETRANPOP, AVEATMPOP, AVEOFFICEPOP, and AVEGDPGROWTH). We also
calculate mean values of total assets for each bank throughout of the period. The logarithm of
this mean value is used as another control variable (AVETOTALASSET). Euro zone country
dummy (EURO) is included in the regression. The regression models include dummy variables
17 Z-score= (100+ average ROE)/ Standard deviation of ROE where ROE and Standard deviation of ROE are expressed in percentage.

23ECB
Working Paper Series No 1135December 2009
to account for fixed country-specific effects. The results in Table 9 show that banks in the
countries with more developed retail payments business present a lower level of risk. More
adoptions of ATMs have a positive impact on banks’ stability. So is the higher number of retail
payments offices per capita. These results suggest that retail payments business offers a more
attractive risk/return combination and create more stable revenue than other bank business lines.
4.6 Robustness tests
We also run a set of robustness checks on the effects of retail payment business on bank
performance, which are not shown for the sake of brevity. Specifically, we run bank performance
regressions on the sample without German banks to ensure that our results are not biased by the
large number of German cooperative and saving banks in our sample. The results are similar to
the reported results, i.e., we observe a significant positive relationship between retail payment
services and bank performance.
We also use an efficiency ranking based on an ordering of the banks’ efficiency levels for
each of the sample years (Berger et al. 2004). The ranks are converted to a uniform scale of 0-1
using the formula (orderit-1)/(nt-1), where orderit is the place in ascending order of the ith bank in
the tth year in terms of its efficiency level and nt is the number of banks in year t. Although
efficiency levels are more accurate than rankings, efficiency rankings are more comparable
across time because the rankings for each year follow the same distribution, whereas the
distributions of efficiency levels might vary over time. Our estimates show that our main results
still hold, i.e. banks are more efficient in countries with a more developed retail payments
business. Further, we re-estimate all the profit and cost efficiencies using non-interest expenses
disaggregated into separate prices for labour and capital and find that our results are not
significantly changed. These robustness checks are available upon request from the authors.

24ECBWorking Paper Series No 1135December 2009
5. Conclusion
The EU is undergoing a dramatic change in its retail payment system with the creation of
a unified payment zone. This study is the first, to our knowledge, to provide a combined and
integrated view of the importance and significance of retail payments for bank performance,
which can help to better understand the drivers and the impact of the Single Euro Payments
Area.
Using country-level retail payment service data across 27 EU markets, we conclude that,
in countries with more developed retail payment services, banks perform better, in terms of both
their accounting ratios and their profit and cost efficiency. This relationship is stronger in
countries with higher levels of retail payment transaction equipment, like ATMs and POS
terminals. Retail payment transaction technology itself can also improve bank performance. In
addition, we find that competition in retail payment instruments is associated with better bank
performance, as is greater use of electronic retail payment instruments. We also show that retail
payment services have a more significant impact on savings and cooperative bank performance
and banks’ non-interest income although they have a positive influence on the performance of
commercial banks and banks’ interest income. Finally, the evidence shows that retail payment
services generate a stable revue for banks and decrease their risk.
Our paper also has policy implications. Our results can be regarded as providing strong
support for the Single Euro Payments Area (SEPA) initiative. Our paper also suggests that EU
regulators and supervisors should not only endeavour to enlarge the scale of payment systems,
but also to develop various retail payment instruments simultaneously, especially electronic
payment instruments.
25ECB
Working Paper Series No 1135December 2009
References
Amromin, G. and S. Chakravorti (2009) "Whither Loose Change? The Diminishing Demand
for Small-Denomination Currency," Journal of Money, Credit and Banking, 41(2-3), 315-
335.
Banque Nationale de Belgique (2005). “Coûts, Avantages et Inconvénients des Différents
Moyens de Paiement”.
Beijnen, C. and W. Bolt (2009). "Size Matters: Economies of scale in the European payments
market", Journal of Banking and Finance 33, 203-210.
Berger, A. N. and R. DeYoung (2006) “Technological Progress and the Geographic
Expansion of Commercial Banks”, Journal of Money, Credit, and Banking 38, No. 6,
1483-1513.
Berger, A. N., D. Hancock and J. C. Marquardt (1996). “A Framework for Analyzing
Efficiency, Risks, Costs, and Innovations in the Payments System”, Journal of Money,
Credit and Banking 28 (Part 2), 696-732.
Berger, A.N. and Humphrey, D.B. (1997). “Efficiency of Financial Institutions: International
Survey and Directions for Future Research”, European Journal of Operational Research
98,175-212.
Berger, A. N. and L. J. Mester (1997). “Inside the Black Box: What Explains Differences in
the Efficiencies of Financial Institutions”, Journal of Banking and Finance 21, 895-947.
Berger, A. N., I. Hasan, and L. Klapper (2004). “Further Evidence on the Link between
Finance and Growth: An International Analysis of Community Banking and Economic
Performance”, Journal of Financial Services Research 25, 169-202.
BIS (2003). “Policy Issues for Central Banks in Retail Payments”, Report of the Working
Group on Retail Payment Systems, Committee on Payment and Settlement Systems,
Bank for International Settlements, Basel.
Bolt, W. and D. Humphrey (2007). "Payment Network Scale Economies, SEPA, and Cash
Replacement", Federal Reserve Bank of Philadelphia, July 2007.
Bolt, W., Humphrey, D. and R. Uittenbogaard (2008) “Transaction Pricing and the Adoption
of Electronic Payments: A Cross-Country Comparison”, International Journal of Central
Banking, Vol. 4, No. 1, 89-123.
26ECBWorking Paper Series No 1135December 2009
Boyd, J. and S. Graham (1986). “Risk, Regulation, and Bank Holding Company Expansion”,
Federal Reserve Bank of Mineapolis, Quarterly Review (spring).
Boston Consulting Group (2009). “Global Payments 2009: Weathering the Strom”, Boston
Consulting Group Report. March 2009.
Brits, H. and C. Winder (2005) “Payments are No Free Lunch”, DNB Occasional Studies,
Vol. 3, No. 2, De Nederlandsche Bank.
Carlton, D. and Frankel, A. (1995). “Antitrust and Payment Technologies.” Federal Reserve
Bank of St. Louis Review, 41–54.
Campbell, D., Jerez, F. A. M. and P. Tufano (2008). “Bouncing Out of the Banking System:
An Empirical Analysis of Involuntary Bank Account Closures”. Working paper.
Capgemini and European Commission (2008). “SEPA: Potential Benefits at Stake –
Researching the impact of SEPA on the Payments Market and its Stakeholders”,
Capgemini Consulting.
Chakravorti, S. and R. Roson (2006) “Platform Competition in Two-Sided Markets: The Case
of Payment Networks”, Review of Network Economics, 5 (1), 118-142.
Columba, F. (2009). “Narrow Money and Transaction Technology: New Disaggregated
Evidence”, Journal of Economics and Business, forthcoming.
DeYoung, R. (2005) “The Performance of Internet-based Business Models: Evidence from
the Banking Industry”, Journal of Business 78, 3, 893-947.
DeYoung, R. and T. Rice (2004) “Noninterest Income and Financial Performance at U.S.
Commercial Banks”, Financial Review 39, 1, 101-127.
European Central Bank (2000). “EU Banks’ Income Structure.” Banking Supervision
Committee, April.
Fama, E. F., K. R. French 2004. The Capital Asset Pricing Model: Theory and evidence.
Journal of Economic Perspectives 18 (3), 25–46.
Gresvik, O. and G. Owre (2003). “Costs and Income in the Norwegian Payment System 2001.
An Application of the Activity Based Costing Framework”, Working Paper, Norges Bank
Financial Infrastructure and Payment Systems Department.
Hancock, D. and D. Humphrey (1998) “ Payment Transactions, Instruments, and Systems: A
Survey”, Journal of Banking and Finance, 21, 1573-1624.

27ECB
Working Paper Series No 1135December 2009
Hasan, I., Malkamäki, M. and H. Schmiedel (2003), Technology, Automation, and
Productivity of Stock Exchanges: International Evidence, Journal of Banking and
Finance, 27, 1743-1773.
Hirtle, B. J. and K. J. Stiroh (2007). “The Return to Retail and the Performance of U.S.
Banks”, Journal of Banking and Finance, 31, 1101-1133.
Humphrey, D., Willesson, M., Bergendahl, G., and T. Lindblom “Benefits from a Changing
Payment Technology in European Banking”
Humphrey, D., Pulley L. B., and J. M. Vesala (1996). "Cash, Paper, and Electronic Payments:
A Cross-Country Analysis." Journal of Money, Credit, and Banking 28 (Part 2), 914-39.
Kahn, C., G. Pennacchi and B. Sopranzetti (2005) “Bank Consolidation and the Dynamics of
Consumer Loan Interest Rates”, Journal of Business, 1, 99-133.
Kahn, C. and W. Roberds (2009) “Why Pay? An Introduction to Payments Economics”,
Journal of Financial Intermediation, 18, 1-23.
Kemppainen, K. (2003). “Competition and Regulation in European Retail Payment Systems”
Bank of Finland Discussion Papers.
Kemppainen, K. (2008). “Integrating European Retail Payment Systems: Some Economics of
SEPA” Bank of Finland Discussion Papers.
Kumbhakar, S.C., Lovell, C.A.K., 2000. Stochastic Frontier Analysis. Cambridge University
Press.
Lusardi, A. and P. Tufano (2009). “Debt Literacy, Financial Experiences, and
Overindebtedness.” National Bureau of Economic Research, Working Paper 14808.
Massoud, N., A. Saunders, and B. Scholnick (2006) “The Impact of ATM Surcharges on
Large versus Small Banks: Is there a Switching Effect?”, Journal of Business, Vol. 79,
No. 4, 2099-2126.
Puri, M., Rocholl, J., and S. Steffen (2009) “The Impact of the U.S. Financial Crisis on
Global Retail Lending.” Working Paper Series.
Rochet, J. C. and J. Tirole (2006) “Two Sided Markets: A Progress Report”, Rand Journal of
Economics, 37 (3), 645-667.
Saunders, A. and B. Scholnick (2006) “Frontiers in Payment and Settlement Systems:
Introduction”, Journal of Banking and Finance, 30, 1605-1612.

28ECBWorking Paper Series No 1135December 2009
Schmiedel, H. (2007). “The Economic Impact of the Single Euro Payments Area”, European
Central Bank Occasional Paper Series, No. 71, 2007.
Scholnick, B. (2009). “Credit Card Use after the Final Mortgage Payment: Does the
Magnitude of Income Shocks Matter?” Mimeo.
Scholnick, B., N. Massoud, A. Saunders, S. Carbo-Valverde, and F. Rodríguez-Fernández,
(2007). “The Economics of Credit Cards, Debit Cards and ATMs: A Survey and Some
New Evidence.” Journal of Banking and Finance 32(8), 1468-1483.
Stiroh, K. (2004). “Diversification In Banking: Is Non-interest Income the Answer?” Journal
of Money, Credit and Banking 36 (5), 853-882.
Stiroh, K. and A. Rumble (2006). “The Dark Side of Diversification: The Case of US
Financial Holding Companies.” Journal of Banking and Finance 30 (8), 2131-2161.
29ECB
Working Paper Series No 1135December 2009
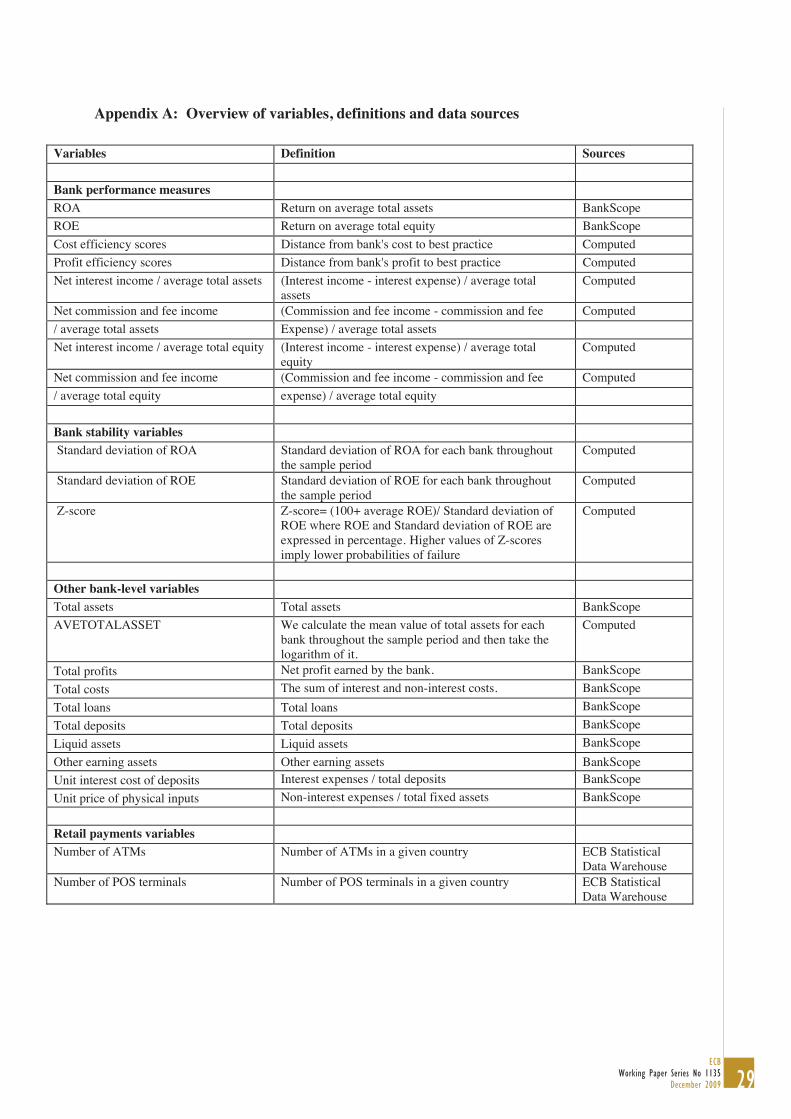
Appendix A: Overview of variables, definitions and data sources
Variables Definition Sources Bank performance measures ROA Return on average total assets BankScope ROE Return on average total equity BankScope Cost efficiency scores Distance from bank's cost to best practice Computed Profit efficiency scores Distance from bank's profit to best practice Computed Net interest income / average total assets (Interest income - interest expense) / average total
assetsComputed
Net commission and fee income (Commission and fee income - commission and fee Computed / average total assets Expense) / average total assets Net interest income / average total equity (Interest income - interest expense) / average total
equity Computed
Net commission and fee income (Commission and fee income - commission and fee Computed / average total equity expense) / average total equity Bank stability variables Standard deviation of ROA Standard deviation of ROA for each bank throughout
the sample period Computed
Standard deviation of ROE Standard deviation of ROE for each bank throughout the sample period
Computed
Z-score Z-score= (100+ average ROE)/ Standard deviation of ROE where ROE and Standard deviation of ROE are expressed in percentage. Higher values of Z-scores imply lower probabilities of failure
Computed
Other bank-level variablesTotal assets Total assets BankScope AVETOTALASSET We calculate the mean value of total assets for each
bank throughout the sample period and then take the logarithm of it.
Computed
Total profits Net profit earned by the bank. BankScope Total costs The sum of interest and non-interest costs. BankScope Total loans Total loans BankScope Total deposits Total deposits BankScope Liquid assets Liquid assets BankScope Other earning assets Other earning assets BankScope Unit interest cost of deposits Interest expenses / total deposits BankScope Unit price of physical inputs Non-interest expenses / total fixed assets BankScope Retail payments variables Number of ATMs Number of ATMs in a given country ECB Statistical
Data Warehouse Number of POS terminals Number of POS terminals in a given country ECB Statistical
Data Warehouse

30ECBWorking Paper Series No 1135December 2009
Number of offices Number of retail payments offices in a given country ECB Statistical Data Warehouse
Number of institutions Number of retail payments institutions in a given country
ECB Statistical Data Warehouse
Value of transactions Total value of retail payment transactions in a given country
ECB Statistical Data Warehouse
Number of transactions Total number of retail payment transactions in a given country
ECB Statistical Data Warehouse
PAPERINSTRU Total value of cheque-based transactions / total value of retail payment transactions in a given country
ECB Statistical Data Warehouse
HERFINDAHLINSTRU Logarithm of concentration ratio of different payment instruments
Computed
TRANPOP Logarithm of number of transactions scaled by population
Computed
ATMPOP Logarithm of number of ATMs scaled by population Computed OFFICEPOP Logarithm of number of offices scaled by population Computed TRANATMPOP The interaction term between ATMPOP and
OFFICEPOP Computed
AVETRANPOP We calculate the mean value of number of transactions scaled by population for each country throughout the sample period and then take the logarithm of it.
Computed
AVEATMPOP We calculate the mean value of number of ATMs scaled by population for each country throughout the sample period and then take the logarithm of it.
Computed
AVEOFFICEPOP We calculate the mean value of number of offices scaled by population for each country throughout the sample period and then take the logarithm of it.
Computed
Other variables GDPGROWTH Logarithm of GDP growth WDI EURO Dummy variable takes the value of “1” if bank is
located in euro area, “0” otherwise. ECB website
AVEGDPGROWTH We calculate the mean value of GDP growth for each country throughout the sample period and then take the logarithm of it.
Computed
Population Total population in a given country WDI

31ECB
Working Paper Series No 1135December 2009
Figure 1 Retail payments providers Panel A presents total number of retail payments institutions in the EU by year. Panel B presents total number of retail payments offices in the EU by year.
Number of retail paymentsinstitutions
7.5
8.0
8.5
9.0
9.5
10.0
10.5
2000 2001 2002 2003 2004 2005 2006 2007
Thou
sand
s
Panel A
Number of retail payments offices
260
265
270
275
280
285
290
295
300
2000 2001 2002 2003 2004 2005 2006 2007
Thou
sand
s
Panel B
32ECBWorking Paper Series No 1135December 2009
Figure 2 Retail payment transaction technology Panel A presents the total number of ATMs in the EU by year. Panel B presents the total number of POS terminals in the EU by year.
Number of ATMs
0
50
100
150
200
250
300
350
400
450
2000 2001 2002 2003 2004 2005 2006 2007
Thou
sand
s
Panel A
Number of POS terminals
0
1,000
2,000
3,000
4,000
5,000
6,000
7,000
8,000
2000 2001 2002 2003 2004 2005 2006 2007
Thou
sand
s
Panel B

33ECB
Working Paper Series No 1135December 2009
Figure 3 Retail payment business Panel A presents the total value of retail payment transactions in the EU by year. Panel B presents the total number of retail payment transactions in the EU by year. The value of retail payment transactions is inflation-adjusted to the base year 2000.
Value of retail paymentstransactions
0
50,000
100,000
150,000
200,000
250,000
300,000
350,000
2000 2001 2002 2003 2004 2005 2006 2007
EURBillion
s
Panel A
Number of retail paymentstransactions
01020
30405060
7080
2000 2001 2002 2003 2004 2005 2006 2007
Billion
s
Panel B
34ECBWorking Paper Series No 1135December 2009
Figure 4 Retail payment instruments Panel A presents the country average percentage of paper-based retail payments in the EU by year. Panel B presents the average percentage of electronic retail payments in the EU by year.
Average percentage of paper basedpayments
02468
1012141618
2000 2001 2002 2003 2004 2005 2006 2007
Panel A
Average percentage of electronicpayments
788082848688909294
2000 2001 2002 2003 2004 2005 2006 2007
Panel B
35ECB
Working Paper Series No 1135December 2009
Table 1 Summary statistics Panel A of This table presents summary statistics of the firm-level variables for the sample banks. The number of firm-year observations, mean, standard deviation and minimum and maximum values of the variables are reported for the full sample. Panel B of This table presents summary statistics of the country-level variables for the sample banks. The number of country-year observations, mean, standard deviation and minimum and maximum values of the variables are reported for the full sample. The sample includes commercial banks, savings banks and cooperative banks with available data in the EU between 2000 and 2007. All financial values are inflation-adjusted to the base year 2000 and winsorised at the 1st and 99th
percentiles. The details of the definitions and sources of all the variables are reported in Appendix A.
Firm-level Variables No. of firm- year observations Mean SD Minimum Maximum
ROA (%) 14,987 0.53 0.91 -10.23 9.26
ROE (%) 14,987 6.78 6.88 -18.82 34.91
Net interest income / average total assets (%) 14,978 2.56 0.87 0.33 5.70
Net commission and fee income / average total assets (%) 14,770 0.84 0.68 -0.08 4.91
Net interest income / average total equity (%) 14,978 11.02 3.62 5.64 18.96
Net commission and fee income / average total equity (%) 14,770 6.55 3.68 -0.68 16.00
Standard deviation of ROA (%) 14,987 0.33 0.45 0.01 3.04
Standard deviation of ROE (%) 14,987 4.41 5.48 0.08 37.22
Z-score 14,987 77.96 153.63 3.07 1246.76
Total assets (EUR billions) 14,987 3.96 14.88 0.05 114.83
EURO 14,987 0.88 0.33 0.00 1.00
Panel A
Country-level Variables No. of country- year observations Mean SD Minimum Maximum
Number of transactions / Population (per one million persons) 183 180,752 416,442 838 3,499,614 Number of ATMs / Population (per one million persons) 183 1,040 2101 6 15,524 Number of offices / Population (per one million persons) 183 576 299 39 1,794 GDP growth (%) 183 3.81 2.49 -0.74 11.93
PAPERINSTRU (%) 170 9.97 14.83 0.00 61.46
HERFINDAHLINSTRU 124 0.40 0.10 0.22 0.82
Panel B

36ECBWorking Paper Series No 1135December 2009
Table 2 Summary of stochastic efficiency estimates Panel A shows the descriptive statistics for the basic variables used in the profit and cost efficiency estimations. In our
translog-based estimations of profit (cost) efficiency levels, the output variables considered are total loans, total
deposits, liquid assets and other earning assets, and the input variables are interest expenses divided by total deposits
and non-interest expenses divided by total fixed assets. The outputs are normalised by total earning assets. All financial
values are inflation-adjusted to the base year 2000 and winsorised at the 1st and 99th percentiles. The details of the
definitions and sources of all the variables are reported in Appendix A. Panel B presents summary statistics for the
stochastic efficiency estimates. Frontiers were estimated with 14,987 bank observations containing all the data needed for the estimation. u and v are the standard deviations of the composite of the inefficiency and random
components of the disturbance, respectively. is the standard deviation of the overall disturbance. is the
proportion of the variance in the overall disturbance that is due to inefficiency. Panel C presents summary statistics of
cost and profit efficiency by Euro and Non-Euro areas.
Panel A
Key Variables Mean SD Minimum Maximum
Profit (cost) (EUR billions)
Total profits 0.029 0.118 -0.009 0.929
Total costs 0.185 0.679 0.003 5.390
Output quantities (EUR billions)
Total loans 2.102 7.995 0.017 63.897
Total deposits 2.859 10.737 0.035 86.877
Liquid assets 0.918 4.087 0.005 33.794
Other earning assets 1.407 5.813 0.010 48.362
Input Prices
Unit interest cost of deposits 0.031 0.012 0.010 0.092
Unit price of physical inputs 1.252 2.045 0.200 15.000
Panel B
Cost efficiency Profit efficiency
Log likelihood -17,245.43 -22,071.18
u / v 3.83 2.38
1.32 0.58
0.93 0.85
Mean efficiency 0.74 0.68
Standard deviation 0.114 0.115
Panel C
Area Variable Mean Std. Dev. Min Max
Non euro area Cost efficiency 0.70 0.17 0.03 0.94
Profit efficiency 0.63 0.19 0.01 0.94
Euro area Cost efficiency 0.75 0.10 0.02 0.94
Profit efficiency 0.69 0.10 0.01 0.93

37ECB
Working Paper Series No 1135December 2009
Table 3 Retail payment services (technologies) and bank performance We include, but do not report, the coefficients for year and country indicators. The sample includes commercial banks, savings banks and cooperative banks with available data in the EU between 2000 and 2007. The details of the definitions and sources of all the variables are reported in Appendix A. The table reports coefficients, with t-statistics in brackets. In computing standard errors, we cluster by country.
Dependent Variable ROA ROE Cost efficiency Profit efficiency
TRANPOP 0.060*** 0.403* 0.005*** 0.032***
(2.867) (1.894) (3.437) (5.548)
ATMPOP 0.072*** 0.273*** 0.041*** 0.006***
(2.927) (3.092) (6.687) (3.629)
OFFICEPOP 0.023 0.023 -0.005 -0.009**
(0.062) (0.311) (-1.254) (-2.270)
STDROA 0.217*** 0.191* 0.033*** 0.009***
(19.756) (1.704) (32.295) (8.681)
GDPGROWTH 0.076*** 0.508* 0.012*** 0.009***
(2.928) (1.907) (10.138) (7.300)
EURO 1.935*** 1.695*** 0.052*** 0.055***
(5.135) (2.781) (14.538) (15.174)
Constant 8.885*** 15.262*** 0.709*** 0.549***
(8.018) (8.247) (24.094) (18.194)
Adjusted R2 0.114 0.057 0.094 0.035
No of observations 14,987 14,987 14,987 14,987
* p<0.10, ** p<0.05, *** p<0.01
38ECBWorking Paper Series No 1135December 2009
Table 4 Moderation Effect of Retail payment transaction technologies on the relationship between retail payment services and bank performance
We include, but do not report, the coefficients for year and country indicators. The sample includes commercial banks, savings banks and cooperative banks with available data in the EU between 2000 and 2007. The details of the definitions and sources of all the variables are reported in Appendix A. The table reports coefficients, with t-statistics in brackets. In computing standard errors, we cluster by country.
Dependent Variable ROA ROE Cost efficiency Profit efficiency
TRANPOP 0.027*** 0.145*** 0.037*** 0.031***
(3.375) (3.211) (6.484) (5.887)
ATMPOP 0.053*** 0.774*** 0.006 0.026***
(2.785) (3.913) (1.456) (4.447)
OFFICEPOP 0.008 0.001 0.033 -0.008**
(0.053) (0.220) (0.066) (-2.097)
STDROA 0.217*** 0.191* 0.014*** 0.009***
(19.760) (1.706) (11.358) (8.573)
GDPGROWTH 0.072*** 0.470* 0.058*** 0.010***
(2.740) (1.757) (15.807) (8.391)
EURO 1.882*** 1.251*** 0.065*** 0.049***
(4.982) (2.659) (16.317) (13.003)
TRANATMPOP 0.018** 0.153* 0.003*** 0.003***
(2.074) (1.681) (6.550) (5.680)
Constant 10.522*** 16.802*** 0.360*** 0.859***
(7.735) (7.693) (5.931) (13.777)
Adjusted R2 0.114 0.057 0.097 0.038
No of observations 14,987 14,987 14,987 14,987
* p<0.10, ** p<0.05, *** p<0.01
39ECB
Working Paper Series No 1135December 2009
Table 5 Heterogeneity in retail payment instruments and bank performance We include, but do not report, the coefficients for year and country indicators. The sample includes commercial banks, savings banks and cooperative banks with available data in the EU between 2000 and 2007. The details of the definitions and sources of all the variables are reported in Appendix A. The table reports coefficients, with t-statistics in brackets. In computing standard errors, we cluster by country.
Dependent variable ROA ROE Cost efficiency Profit efficiency
TRANPOP 0.025*** 0.137*** 0.033*** 0.017***
(4.556) (4.373) (5.636) (2.881)
ATMPOP 0.023** 0.604*** 0.046*** 0.018***
(2.410) (2.226) (7.432) (2.845)
OFFICEPOP 0.046 0.009 -0.008* 0.013
(0.069) (0.909) (-1.678) (0.556)
STDROA 0.247*** 0.962*** 0.052*** 0.015***
(17.810) (5.751) (35.934) (10.517)
GDPGROWTH 0.084*** 0.082 0.016*** 0.020***
(3.367) (1.608) (11.409) (14.350)
EURO 1.342*** 1.837** 0.050*** 0.076***
(3.551) (2.157) (11.638) (17.194)
TRANATMPOP 0.028** 0.086*** 0.004*** 0.002***
(2.033) (3.349) (7.278) (3.962)
HERFINDAHLINSTRU -0.019*** -0.116*** -0.002*** -0.007***
(-4.131) (-4.332) (-2.240) (-3.932)
Constant 11.202*** 16.216*** 0.293*** 0.977***
(6.137) (7.091) (4.200) (13.684)
Adjusted R2 0.110 0.048 0.114 0.057
No of observations 13,994 13,994 13,994 13,994
* p<0.10, ** p<0.05, *** p<0.01

40ECBWorking Paper Series No 1135December 2009
Table 6 Type of retail payment instruments and bank performance We include, but do not report, coefficients for year and country indicators. The sample includes commercial banks, savings banks and cooperative banks with available data in the EU between 2000 and 2007. The details of the definitions and sources of all the variables are reported in Appendix A. The table reports coefficients, with t-statistics in brackets. In computing standard errors, we cluster by country.
Dependent variable ROA ROE Cost efficiency Profit efficiency
TRANPOP 0.019*** 0.733*** 0.029*** 0.031***
(2.230) (3.763) (5.429) (5.709)
ATMPOP 0.066*** 1.124*** 0.036*** 0.030***
(3.837) (4.192) (6.149) (4.900)
OFFICEPOP 0.031 0.001 0.004 -0.003
(0.049) (0.385) (0.965) (-0.584)
STDROA 0.247*** 1.241*** 0.052*** 0.017***
(19.371) (8.190) (37.571) (11.516)
GDPGROWTH 0.072*** 0.488* 0.013*** 0.011***
(3.211) (1.822) (10.837) (8.857)
EURO 2.728*** 1.428*** 0.048*** 0.044***
(8.559) 8.030) (12.641) (11.146)
TRANATMPOP 0.020** 0.098*** 0.003*** 0.003***
(2.056) (3.059) (5.954) (6.132)
PAPERINSTRU -0.003*** -0.014*** -0.001*** -0.001***
(-5.271) (-4.467) (-2.944) (-3.432)
Constant 9.434*** 17.012*** 0.436*** 0.912***
(6.583) (7.454) (6.674) (13.445)
Adjusted R2 0.134 0.060 0.119 0.043
No of observations 14,909 14,909 14,909 14,909
* p<0.10, ** p<0.05, *** p<0.01

41ECB
Working Paper Series No 1135December 2009
Tabl
e 7
Ret
ail p
aym
ent s
ervi
ces a
nd b
ank
perf
orm
ance
in th
e co
mm
erci
al a
nd n
on-c
omm
erci
al b
ank
sub-
sam
ples
W
e in
clud
e, b
ut d
o no
t rep
ort,
coef
ficie
nts
for y
ear a
nd c
ount
ry in
dica
tors
. The
sam
ple
incl
udes
com
mer
cial
ban
ks, s
avin
gs b
anks
and
coo
pera
tive
bank
s w
ith a
vaila
ble
data
in
the
EU b
etw
een
2000
and
200
7. T
he d
etai
ls of
the
defin
ition
s and
sour
ces o
f all
the
varia
bles
are
repo
rted
in A
ppen
dix
A. T
he ta
ble
repo
rts c
oeff
icie
nts,
with
t-st
atis
tics i
n br
acke
ts. I
n co
mpu
ting
stan
dard
erro
rs, w
e cl
uste
r by
coun
try.
Com
mer
cial
Ban
ks
Savi
ngs a
nd c
oope
rativ
e ba
nks
Dep
ende
nt v
aria
ble
RO
A
RO
E C
ost e
ffic
ienc
y Pr
ofit
effic
ienc
y
RO
A
RO
E C
ost e
ffic
ienc
y Pr
ofit
effic
ienc
y
TRA
NPO
P 0.
020*
**
0.23
8***
0.
003*
**
0.01
0***
0.06
9***
0.
449*
**
0.00
7***
0.
041*
**
(3.3
08)
(4.4
80)
(5.4
17)
(2.6
67)
(4
.554
) (5
.580
) (4
.432
) (7
.202
)
ATM
POP
0.07
0***
0.
135*
**
0.00
2*
0.01
6***
0.
040*
* 0.
422*
**
0.00
7***
0.
026*
**
(4.0
67)
(3.2
71)
(1.7
66)
(4.2
44)
(2
.347
) (6
.313
) (4
.110
) (8
.943
)
OFF
ICEP
OP
0.92
8 10
.143
-0
.002
0.
008
0.
441
21.0
44
-0.0
19
0.01
9
(0.0
85)
(0.0
93)
(-0.
272)
(1
.001
)
(0.0
08)
(0.1
73)
(-0.
003)
(0
.049
)
STD
RO
A
0.24
5***
0.
004*
**
0.02
9***
0.
004*
0.
119*
**
1.19
9***
0.
019*
**
0.00
2***
(10.
234)
(6
.023
) (1
4.78
4)
(1.8
93)
(9
.063
) (4
.879
) (1
0.85
2)
(6.9
11)
GD
PGR
OW
TH
0.04
3 0.
191
0.02
6***
0.
007*
0.
128*
**
0.92
9***
0.
011*
**
0.00
9***
(0
.493
) (0
.290
) (6
.607
) (1
.820
) (8
.298
) (3
.231
) (1
1.68
8)
(9.2
67)
EUR
O
2.42
6***
24
.529
***
0.01
7*
0.01
8**
2.12
7***
54
.180
***
0.02
2***
0.
074*
**
(2
.835
) (3
.745
) (1
.933
) (2
.134
) (6
.508
) (8
.884
) (5
.789
) (1
7.80
6)
Con
stan
t10
.415
***
13.5
55**
* 0.
655*
**
0.73
2***
5.30
0***
24
.660
***
0.93
1***
0.
471*
**
(3.0
47)
(4.3
41)
(10.
293)
(1
1.67
8)
(4
.554
) (9
.422
) (2
8.24
8)
(12.
956)
Adj
uste
d R
2 0.
096
0.07
5 0.
080
0.00
9
0.22
3 0.
055
0.04
6 0.
049
No
of o
bser
vatio
ns
3,16
1 3,
161
3,16
1 3,
161
11
,826
11
,826
11
,826
11
,826
* p<
0.10
, **
p<0.
05, *
** p
<0.0
1

42ECBWorking Paper Series No 1135December 2009
Tabl
e 8
Ret
ail p
aym
ent s
ervi
ces a
nd b
ank
inte
rest
and
non
-inte
rest
inco
me
We
incl
ude,
but
do
not r
epor
t, co
effic
ient
s fo
r yea
r and
cou
ntry
indi
cato
rs. T
he s
ampl
e in
clud
es c
omm
erci
al b
anks
, sav
ings
ban
ks a
nd c
oope
rativ
e ba
nks
with
ava
ilabl
e da
ta
in th
e EU
bet
wee
n 20
00 a
nd 2
007.
The
det
ails
of th
e de
finiti
ons a
nd so
urce
s of a
ll th
e va
riabl
es a
re re
porte
d in
App
endi
x A
. The
tabl
e re
ports
coe
ffic
ient
s, w
ith t-
stat
istic
s in
brac
kets
. In
com
putin
g st
anda
rd e
rrors
, we
clus
ter b
y co
untry
.
Dep
ende
nt V
aria
ble
Net
com
mis
sion
and
fee
inco
me
Net
com
mis
sion
and
fee
inco
me
Net
inte
rest
inco
me
Net
inte
rest
inco
me
/ ave
rage
tota
l ass
ets
/ ave
rage
tota
l equ
ity
/ ave
rage
tota
l ass
ets
/ ave
rage
tota
l equ
ity
TRA
NPO
P 0.
062*
**
0.34
9***
0.
038*
**
0.21
3***
(4
.623
)(8
.540
) (3
.311
) (7
.409
)
ATM
POP
0.06
0***
0.
229*
**
0.03
5***
0.
149*
**
(3
.873
)(6
.486
) (2
.587
) (5
.403
)
OFF
ICEP
OP
-0.0
97
8.38
1 -0
.105
-0
.028
(-
1.04
1)(0
.003
) (-
1.26
8)
(-0.
025)
STD
RO
A
0.00
7***
1.
816*
**
0.23
6***
1.
482*
**
(5
.036
)(1
5.08
4)
(34.
040)
(1
6.22
1)
GD
PGR
OW
TH
0.08
8***
0.
029
0.03
0**
0.15
0
(5
.302
)(0
.102
) (2
.136
) (0
.801
)
EUR
O
0.91
2***
19
.212
***
0.39
0*
9.02
3***
(4
.158
)(5
.139
) (1
.717
) (3
.011
)
Con
stan
t 2.
385*
**
13.0
86**
* -0
.398
5.
173
(2
.737
)(8
.291
) (-
0.62
7)
(0.6
19)
Adj
uste
d R
2 0.
250
0.36
8 0.
118
0.10
0
No
of o
bser
vatio
ns
14,9
78
14,9
78
14,7
70
14,7
70
* p<
0.10
, **
p<0.
05, *
** p
<0.0
1

43ECB
Working Paper Series No 1135December 2009
Table 9 Retail payment services and bank stability The sample includes commercial banks, savings banks and cooperative banks with available data in the EU between 2000 and 2007. The details of the definitions and sources of all the variables are reported in Appendix A. All independent variables except Euro zone country dummy are average values throughout the period. The table reports coefficients, with t-statistics in brackets. In computing standard errors, we cluster by country.
Dependent Variable Standard Deviation Standard Deviation Z-score
of ROA of ROE AVETRANPOP -0.012*** -0.111*** 16.806***
(-4.514) (-5.379) (4.587)
AVEATMPOP -0.101*** -0.134*** 18.096*
(-4.213) (-4.456) (1.709)
AVEOFFICEPOP -0.073* -0.803* 44.876**
(-1.835) (-1.652) (2.560)
AVETOTALASSET -0.022*** 0.034 10.070***
(-4.536) (0.569) (4.630)
AVEGDPGROWTH -0.020 -1.361*** 36.614***
(-0.728) (-3.974) (2.966)
EURO -0.301*** -0.199 29.473*
(-8.470) (-0.457) (1.875)
Constant 1.069*** -0.730 163.175
(3.194) (-0.177) (1.100)
Adjusted R2 0.046 0.012 0.016
N. of observations 3370 3370 3370
* p<0.10, ** p<0.05, *** p<0.01

44ECBWorking Paper Series No 1135December 2009
European Central Bank Working Paper Series
For a complete list of Working Papers published by the ECB, please visit the ECB’s website (http://www.ecb.europa.eu).
1086 “Euro area money demand: empirical evidence on the role of equity and labour markets” by G. J. de Bondt,
September 2009.
1087 “Modelling global trade flows: results from a GVAR model” by M. Bussière, A. Chudik and G. Sestieri,
September 2009.
1088 “Inflation perceptions and expectations in the euro area: the role of news” by C. Badarinza and M. Buchmann,
September 2009.
1089 “The effects of monetary policy on unemployment dynamics under model uncertainty: evidence from the US
and the euro area” by C. Altavilla and M. Ciccarelli, September 2009.
1090 “New Keynesian versus old Keynesian government spending multipliers” by J. F. Cogan, T. Cwik, J. B. Taylor
and V. Wieland, September 2009.
1091 “Money talks” by M. Hoerova, C. Monnet and T. Temzelides, September 2009.
1092 “Inflation and output volatility under asymmetric incomplete information” by G. Carboni and M. Ellison,
September 2009.
1093 “Determinants of government bond spreads in new EU countries” by I. Alexopoulou, I. Bunda and A. Ferrando,
September 2009.
1094 “Signals from housing and lending booms” by I. Bunda and M. Ca’Zorzi, September 2009.
1095 “Memories of high inflation” by M. Ehrmann and P. Tzamourani, September 2009.
1096 “The determinants of bank capital structure” by R. Gropp and F. Heider, September 2009.
1097 “Monetary and fiscal policy aspects of indirect tax changes in a monetary union” by A. Lipińska and L. von Thadden,
October 2009.
1098 “Gauging the effectiveness of quantitative forward guidance: evidence from three inflation targeters”
by M. Andersson and B. Hofmann, October 2009.
1099 “Public and private sector wages interactions in a general equilibrium model” by G. Fernàndez de Córdoba,
J.J. Pérez and J. L. Torres, October 2009.
1100 “Weak and strong cross section dependence and estimation of large panels” by A. Chudik, M. Hashem Pesaran
and E. Tosetti, October 2009.
1101 “Fiscal variables and bond spreads – evidence from eastern European countries and Turkey” by C. Nickel,
P. C. Rother and J. C. Rülke, October 2009.
1102 “Wage-setting behaviour in France: additional evidence from an ad-hoc survey” by J. Montornés and
J.-B. Sauner-Leroy, October 2009.
1103 “Inter-industry wage differentials: how much does rent sharing matter?” by P. Du Caju, F. Rycx and I. Tojerow,
October 2009.
1104 “Pass-through of external shocks along the pricing chain: a panel estimation approach for the euro area”
by B. Landau and F. Skudelny, November 2009.

45ECB
Working Paper Series No 1135December 2009
1105 “Downward nominal and real wage rigidity: survey evidence from European firms” by J. Babecký, P. Du Caju,
T. Kosma, M. Lawless, J. Messina and T. Rõõm, November 2009.
1106 “The margins of labour cost adjustment: survey evidence from European firms” by J. Babecký, P. Du Caju,
T. Kosma, M. Lawless, J. Messina and T. Rõõm, November 2009.
1107 “Interbank lending, credit risk premia and collateral” by F. Heider and M. Hoerova, November 2009.
1108 “The role of financial variables in predicting economic activity” by R. Espinoza, F. Fornari and M. J. Lombardi,
November 2009.
1109 “What triggers prolonged inflation regimes? A historical analysis.” by I. Vansteenkiste, November 2009.
1110 “Putting the New Keynesian DSGE model to the real-time forecasting test” by M. Kolasa, M. Rubaszek and
P. Skrzypczyński, November 2009.
1111 “A stable model for euro area money demand: revisiting the role of wealth” by A. Beyer, November 2009.
1112 “Risk spillover among hedge funds: the role of redemptions and fund failures” by B. Klaus and B. Rzepkowski,
November 2009.
1113 “Volatility spillovers and contagion from mature to emerging stock markets” by J. Beirne, G. M. Caporale,
M. Schulze-Ghattas and N. Spagnolo, November 2009.
1114 “Explaining government revenue windfalls and shortfalls: an analysis for selected EU countries” by R. Morris,
C. Rodrigues Braz, F. de Castro, S. Jonk, J. Kremer, S. Linehan, M. Rosaria Marino, C. Schalck and O. Tkacevs.
1115 “Estimation and forecasting in large datasets with conditionally heteroskedastic dynamic common factors”
by L. Alessi, M. Barigozzi and M. Capasso, November 2009.
1116 “Sectorial border effects in the European single market: an explanation through industrial concentration”
by G. Cafiso, November 2009.
1117 “What drives personal consumption? The role of housing and financial wealth” by J. Slacalek, November 2009.
1118 “Discretionary fiscal policies over the cycle: new evidence based on the ESCB disaggregated approach”
by L. Agnello and J. Cimadomo, November 2009.
1119 “Nonparametric hybrid Phillips curves based on subjective expectations: estimates for the euro area”
by M. Buchmann, December 2009.
1120 “Exchange rate pass-through in central and eastern European member states” by J. Beirne and M. Bijsterbosch,
December 2009.
1121 “Does finance bolster superstar companies? Banks, Venture Capital and firm size in local U.S. markets”
by A. Popov, December 2009.
1122 “Monetary policy shocks and portfolio choice” by M. Fratzscher, C. Saborowski and R. Straub, December 2009.
1123 “Monetary policy and the financing of firms” by F. De Fiore, P. Teles and O. Tristani, December 2009.
1124 “Balance sheet interlinkages and macro-financial risk analysis in the euro area” by O. Castrén and I. K. Kavonius,
December 2009.
1125 “Leading indicators in a globalised world” by F. Fichtner, R. Rüffer and B. Schnatz, December 2009.

46ECBWorking Paper Series No 1135December 2009
1126 “Liquidity hoarding and interbank market spreads: the role of counterparty risk” by F. Heider, M. Hoerova
and C. Holthausen, December 2009.
1127 “The Janus-headed salvation: sovereign and bank credit risk premia during 2008-09” by J. W. Ejsing
and W. Lemke, December 2009.
1128 “EMU and the adjustment to asymmetric shocks: the case of Italy” by G. Amisano, N. Giammarioli
and L. Stracca, December 2009.
1129 “Determinants of inflation and price level differentials across the euro area countries” by M. Andersson,
K. Masuch and M. Schiffbauer, December 2009.
1130 “Monetary policy and potential output uncertainty: a quantitative assessment” by S. Delle Chiaie,
December 2009.
1131 “What explains the surge in euro area sovereign spreads during the financial crisis of 2007-09?”
by M.-G. Attinasi, C. Checherita and C. Nickel, December 2009.
1132 “A quarterly fiscal database for the euro area based on intra-annual fiscal information” by J. Paredes,
D. J. Pedregal and J. J. Pérez, December 2009.
1133 “Fiscal policy shocks in the euro area and the US: an empirical assessment” by P. Burriel, F. de Castro,
D. Garrote, E. Gordo, J. Paredes and J. J. Pérez, December 2009.
1134 “Would the Bundesbank have prevented the great inflation in the United States?” by L. Benati, December 2009.
1135 “Return to retail banking and payments” by I. Hasan, H. Schmiedel and L. Song, December 2009.

Work ing PaPer Ser i e Sno 1118 / november 2009
DiScretionary FiScal PolicieS over the cycle
neW eviDence baSeD on the eScb DiSaggregateD aPProach
by Luca Agnello and Jacopo Cimadomo