retail technology sector update - houlihan lokey
TRANSCRIPT

H O U L I H AN L O K E Y T E C H N O L O G Y, M E D I A & T E L E C O M ( T M T ) G R O U P
Q 4 2 0 2 0 U P D A T E
Retail Technology Sector Update
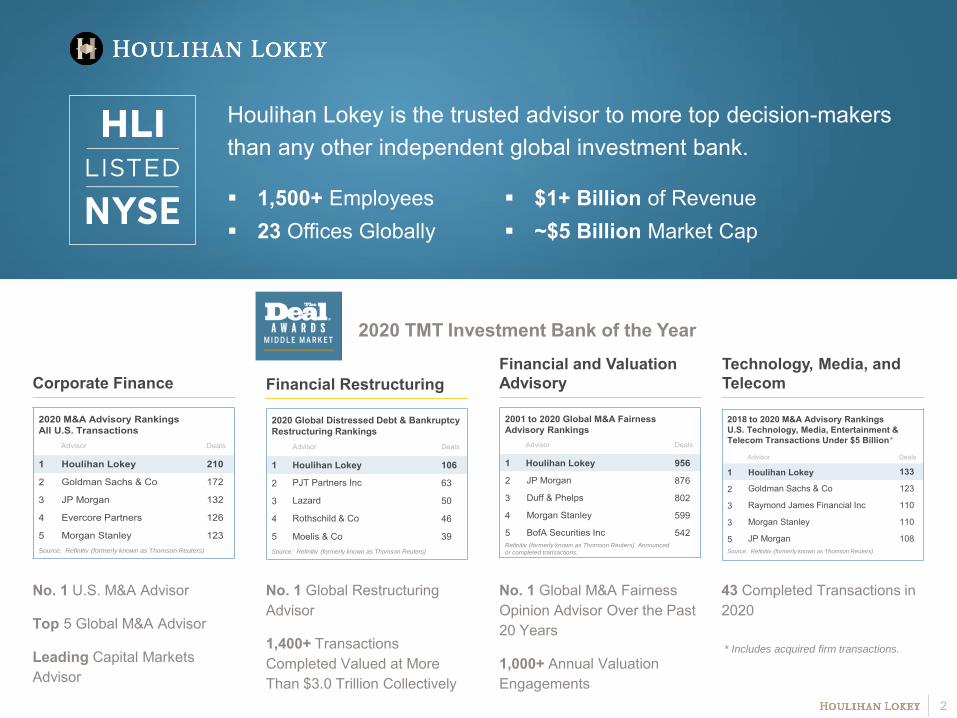
Houlihan Lokey is the trusted advisor to more top decision-makers than any other independent global investment bank.
1,500+ Employees 23 Offices Globally
$1+ Billion of Revenue ~$5 Billion Market Cap
Corporate Finance Financial RestructuringFinancial and Valuation Advisory
No. 1 U.S. M&A Advisor
Top 5 Global M&A Advisor
Leading Capital Markets Advisor
No. 1 Global M&A Fairness Opinion Advisor Over the Past 20 Years
1,000+ Annual Valuation Engagements
No. 1 Global Restructuring Advisor
1,400+ Transactions Completed Valued at More Than $3.0 Trillion Collectively
Technology, Media, and Telecom
43 Completed Transactions in 2020
2020 TMT Investment Bank of the Year
2018 to 2020 M&A Advisory Rankings U.S. Technology, Media, Entertainment & Telecom Transactions Under $5 Billion
Advisor Deals
1 Houlihan Lokey 133
2 Goldman Sachs & Co 123
3 Raymond James Financial Inc 110
3 Morgan Stanley 110
5 JP Morgan 108Source: Refinitiv (formerly known as Thomson Reuters)
2
2020 Global Distressed Debt & BankruptcyRestructuring Rankings
Advisor Deals
1 Houlihan Lokey 106
2 PJT Partners Inc 63
3 Lazard 50
4 Rothschild & Co 46
5 Moelis & Co 39Source: Refinitiv (formerly known as Thomson Reuters)
* Includes acquired firm transactions.
*
2001 to 2020 Global M&A Fairness Advisory Rankings
Advisor Deals
1 Houlihan Lokey 956
2 JP Morgan 876
3 Duff & Phelps 802
4 Morgan Stanley 599
5 BofA Securities Inc 542Refinitiv (formerly known as Thomson Reuters). Announced
or completed transactions.
2020 M&A Advisory Rankings All U.S. Transactions
Advisor Deals
1 Houlihan Lokey 210
2 Goldman Sachs & Co 172
3 JP Morgan 132
4 Evercore Partners 126
5 Morgan Stanley 123Source: Refinitiv (formerly known as Thomson Reuters)

Dedicated Team for All Aspects of Commerce Technology
Business Intelligence and Analytics Fulfilment Solutions
Commerce Platform Online Management/Marketplaces
Inventory Management Order Management Systems
Customer Experience
Personalization/Recommendation
Marketing Software
Content Management and Development
End-to-End Sector Coverage
Point-of-Sale Solutions
Product Information Management Product Lifecycle Management
Master Data Management
In-Store/Retail Technologies
Logistics/Supply Chain ManagementCustomer Engagement
100+ Years and $350+ Billion of Combined TMT Industry Knowledge and Transaction Experience
Rob LouvGlobal Co-Head,
Managing Director, TMTMiami
Bobby WolfeDirector, TMT
Miami
3
Erin DuffySenior Vice President,
TMTSan Francisco
Dan DresnerVice President, TMT
Boston
Mark BradtDirector, TMTSan Francisco

Relevant Transaction Experience and Domain Expertise
4
Sellside Advisor
has been acquired by
has been acquired by
Sellside Advisor
Series E Convertible Preferred Stock
Led by:
With participation from existing investors:
Apex Venture Partners, SSM Partners, Origin Ventures, River Cities Capital Funds, and I2A Fund
$30,000,000Placement Agent
has been acquired by
Sellside Advisor
has been acquired by
Sellside Advisor
has been acquired by
Sellside Advisor
$33,000,000Series E Preferred Stock and Term Loan
Led by:
With participation from:
Placement Agent
has received an equity investment from
Financial Advisor
has received an equity investment from
a portfolio company of
Financial Advisor
has been acquired by
Sellside Advisor
has completed a financing consisting of
$24,000,000Series D Convertible Preferred Stock
Placement Agent
has been acquired by
Sellside Advisor
has been acquired by
Sellside Advisor
has acquired
Senior Secured Credit Facility
Acquisition Financing
Exclusive Placement Agent
has received a significant growth investment from
Financial Advisor
has completed a financing consisting of
$24,000,000Series D Convertible Preferred Stock
Placement Agent
has confirmed a “pre-packaged” Chapter 11 Plan of Reorganization
First Lien SteeringCommittee Advisor
a portfolio company of
has been acquired by
Financial Advisor
a portfolio company of
has been acquired by
a portfolio of companies owned by
Sellside Advisor
has been acquired by
Sellside Advisor
has been acquired by
Williams-Sonoma, Inc.
Sellside Advisor
First Lien Term LoanSecond Lien Term Loan
Refinancing
$75,000,000
Tombstones included herein represent transactions closed from 2014 forward.
4.5x
7.7x 8.3x
20.5x
4.6x
11.9x
15.6x
26.8x
<40% >40% <40% >40%
Retail Tech SaaS
(40%)
(20%)
0%
20%
40%
60%
80%
Jan-20 Mar-20 Jun-20 Sep-20 Dec-20
S&P 500 S&P 500 Retailing NASDAQ Retail Tech
0.0x
2.0x
4.0x
6.0x
Jan-20 Mar-20 Jun-20 Sep-20 Dec-20
S&P 500 S&P 500 Retailing NASDAQ Retail Tech
4.1x 6.2x
10.5x
3.6x
8.7x
18.2x
5.0x
9.8x 10.6x
4.4x
13.7x
23.9x
0-10% 10-20% >20% 0-10% 10-20% >20%
Retail Tech SaaS
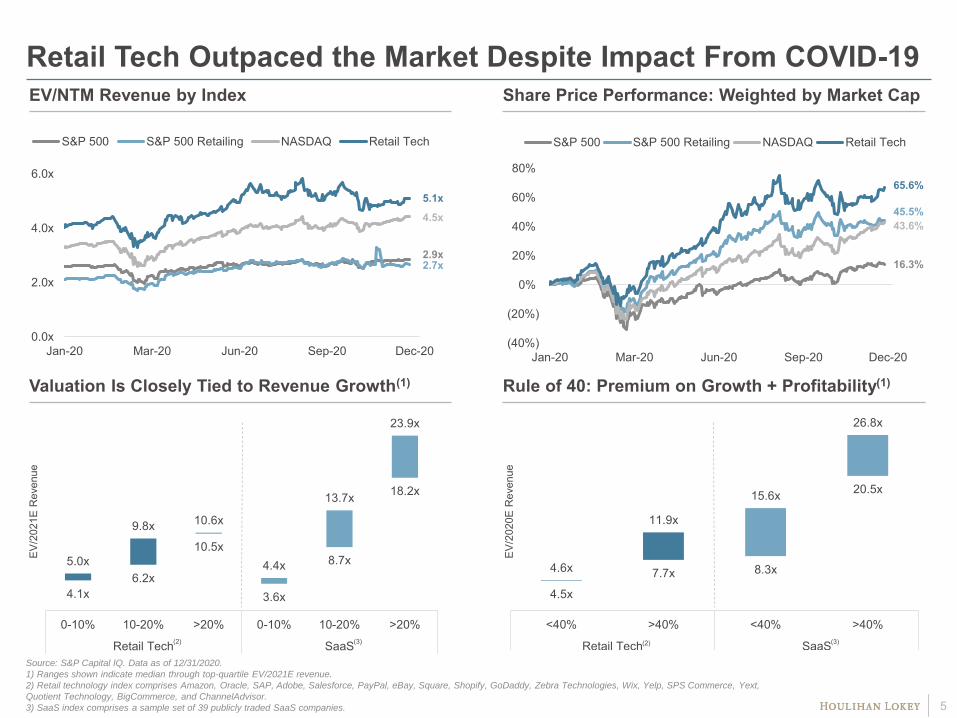
Retail Tech Outpaced the Market Despite Impact From COVID-19
Valuation Is Closely Tied to Revenue Growth(1)
EV/NTM Revenue by Index Share Price Performance: Weighted by Market Cap
Rule of 40: Premium on Growth + Profitability(1)
Source: S&P Capital IQ. Data as of 12/31/2020.
1) Ranges shown indicate median through top-quartile EV/2021E revenue.
2) Retail technology index comprises Amazon, Oracle, SAP, Adobe, Salesforce, PayPal, eBay, Square, Shopify, GoDaddy, Zebra Technologies, Wix, Yelp, SPS Commerce, Yext,
Quotient Technology, BigCommerce, and ChannelAdvisor.
3) SaaS index comprises a sample set of 39 publicly traded SaaS companies.
2.7x2.9x
4.5x 45.5%
16.3%
43.6%
EV/2
021E
Rev
enue
EV/2
020E
Rev
enue
(2) (2)(3) (3)
5
5.1x65.6%
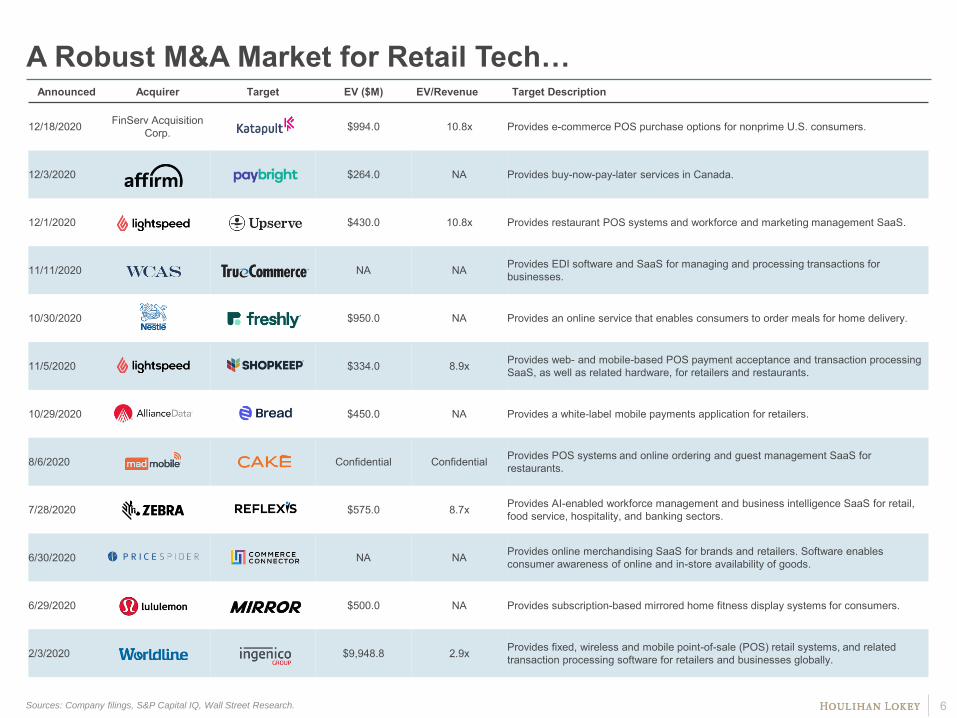
Announced Acquirer Target EV ($M) EV/Revenue Target Description
12/18/2020 FinServ Acquisition Corp. $994.0 10.8x Provides e-commerce POS purchase options for nonprime U.S. consumers.
12/3/2020 $264.0 NA Provides buy-now-pay-later services in Canada.
12/1/2020 $430.0 10.8x Provides restaurant POS systems and workforce and marketing management SaaS.
11/11/2020 NA NA Provides EDI software and SaaS for managing and processing transactions for businesses.
10/30/2020 $950.0 NA Provides an online service that enables consumers to order meals for home delivery.
11/5/2020 $334.0 8.9x Provides web- and mobile-based POS payment acceptance and transaction processing SaaS, as well as related hardware, for retailers and restaurants.
10/29/2020 $450.0 NA Provides a white-label mobile payments application for retailers.
8/6/2020 Confidential Confidential Provides POS systems and online ordering and guest management SaaS for restaurants.
7/28/2020 $575.0 8.7x Provides AI-enabled workforce management and business intelligence SaaS for retail, food service, hospitality, and banking sectors.
6/30/2020 NA NA Provides online merchandising SaaS for brands and retailers. Software enables consumer awareness of online and in-store availability of goods.
6/29/2020 $500.0 NA Provides subscription-based mirrored home fitness display systems for consumers.
2/3/2020 $9,948.8 2.9x Provides fixed, wireless and mobile point-of-sale (POS) retail systems, and related transaction processing software for retailers and businesses globally.
A Robust M&A Market for Retail Tech…
Sources: Company filings, S&P Capital IQ, Wall Street Research. 6

Date Lead Investor Target Target Description Raise ($M)
12/21/2020 Developer of a checkout experience platform designed to drive revenue for e-commerce businesses. $75.0
12/7/2020 Developer of a cloud-based logistics software designed to make shipping simple. 22.0
11/19/2020 Develops an automated fraud detection platform for e-commerce. 125.0
10/27/2020 Developer of an online ordering management platform designed to help restaurants manage online orders and other management operations. 120.0
10/22/2020 Provider of marketing services intended to transform the customer buying experience by bringing marketing to e-commerce through the transaction moment. 80.0
10/21/2020 Developer of a visual search technology designed to transform the way people search and shop for fashion online. 40.0
10/19/2020 Operator of an AI technology company automating the world’s stores for retailers and brands. 15.0
9/28/2020 Tech-enabled 3PL that fulfills e-commerce orders for direct-to-consumer brands. 68.0
9/24/2020 Provides a mobile messaging platform for brands and organizations. 230.0
9/23/2020 Develops a commerce experience management platform. 155.0
9/22/2020 Developer of a marketplace platform designed to plug directly into an e-commerce tech ecosystem. 300.0
9/9/2020 Developer of an instant quoting platform intended to offer a marketplace for custom manufacturing. 75.0
8/4/2020 Provider of an e-commerce platform service designed to enable the transition from a brick-and-mortar business model to e-commerce. 83.0
7/16/2020 Developer of retail customer experience platform with a focus on perfecting checkout. 50.0
5/26/2020 Developer of enterprise-focused augmented reality and mobile computer vision applications. 80.0
4/21/2020 Developer of enterprise e-commerce SaaS analytics platform. 20.0
2/25/2020 Provider of end-to-end cloud-commerce, payments, and marketing solutions. 50.0
1/28/2020 Provides a mobile messaging platform for brands and organizations. 70.0
…As Well As Significant Investment Activity
Sources: Company filings, S&P Capital IQ, Wall Street Research. 7

Commerce Technologies Are in DemandCommerce technology companies continue to outperform the rest of the market, while M&A activity accelerated in 2H 2020 as players looked to expand product offerings and capture market share.
Customer Experience Management vs. Retail Tech vs. S&P Index
Source: S&P Capital IQ.
Note: Customer experience management (CEM) includes 8x8, Adobe, Five9, LivePerson, NICE, Pegasystems, Zendesk, Microsoft, SAP, Oracle, Salesforce, OpenText, Twilio, Medallia,
eGain, Verint Systems, and SurveyMonkey; Retail Tech includes Amazon, Adobe, Salesforce, PayPal, Oracle, SAP, Shopify, Square, eBay, Zebra, GoDaddy, Wix, BigCommerce, SPS
Commerce, Yext, Yelp, Quotient, and Channel Advisor.
Recent M&A Transactions
(40%)
(20%)
0%
20%
40%
60%
80%
S&P 500 CEM Retail TechDate
Announced Acquirer Target
12/18/2020
11/11/2020
11/5/2020
11/5/2020
10/29/2020
10/28/2020
10/21/2020
10/12/2020
10/8/2020
10/6/2020
10/6/2020
9/15/2020
9/15/2020
9/10/2020
9/3/2020
8/5/2020
8/5/2020
7/29/2020
7/28/2020
5/26/2020
8

PriceSpiderClient Profile
Founded in 2004 and based in Irvine, California, PriceSpider is a leading retail analytics platform that serves hundreds of brands across a broad base of consumer verticals such as electronics and appliances, computers and office products, health and beauty, home furnishings, food, games, toys, sporting goods, and others. The company’s SaaS platform gives brand manufacturers a unified view of consumer purchasing behavior throughout the online retail journey. PriceSpider’s real-time data connects the dots between brands, retailers, and shoppers providing brand manufacturers visibility into their distribution channels and rich consumer conversion intelligence. With actionable insights and practical recommendations, the company helps brands optimize the consumer’s path to purchase to increase sales.
Our Role
Houlihan Lokey served as the exclusive financial advisor to PriceSpider and assisted in initiating, structuring, and negotiating the transaction on its behalf.
Transaction Snapshot
Houlihan Lokey worked closely with the PriceSpider management team to optimally position the company, manage deal execution, and maximize the speed and surety of closing a successful transaction. Over the course of the process, the Houlihan Lokey team maximized value by generating significant interest in the company, engaging in targeted negotiations, and streamlining diligence so that the management team and staff remained focused on operating and growing the business. Given the robust process led by Houlihan Lokey as well as PriceSpider’s momentum, superior product suite, and experienced management team, the transaction yielded a highly successful outcome for the company and its shareholders.
9
has received a significant growth investment from
Financial Advisor

Appendix

Trading MetricsRetail Technology
Source: S&P Capital IQ.
Notes: Stock price last updated 12/31/2020. NM if EV/EBITDA multiple is greater than 50 or EBITDA is negative or EBITDA margin is negative. 11
Marketing Automation
($ in millions) EV/Revenue EV/EBITDA
Company Stock Price52-Week
High% of 52-Week
HighCash and ST
InvEquity
Mkt CapEnterprise
Value CY 2020A CY 2021E CY 2022E CY 2020A CY 2021E CY 2022EAmazon $3,256.93 $3,552.25 91.7% $84,396 $1,634,168 $1,662,580 4.4x 3.7x 3.1x 30.2x 24.0x 18.8xPayPal 234.20 244.25 95.9% 13,083 274,410 269,960 12.6 10.6 8.9 43.9 37.0 30.3Adobe 500.12 536.88 93.2% 5,992 239,917 238,633 18.6 15.7 13.7 38.6 31.7 28.0Oracle 64.69 66.20 97.7% 38,610 190,450 223,458 5.7 5.5 5.4 11.5 11.0 10.8Salesforce 222.53 284.50 78.2% 9,492 203,714 200,445 9.5 7.9 6.7 31.6 28.3 23.8SAP 131.60 175.22 75.1% 8,497 156,184 163,964 4.9 4.9 4.7 14.0 14.1 13.6Shopify 1,131.95 1,285.19 88.1% 6,397 138,858 133,639 46.8 35.3 25.9 NM NM NM Square 217.64 243.38 89.4% 3,853 98,142 97,929 10.5 7.5 6.2 NM NM NM eBay 50.25 61.06 82.3% 3,826 34,639 39,117 3.9 3.6 3.3 10.4 9.9 8.9Zebra 384.33 388.92 98.8% 168 20,491 22,179 5.0 4.6 4.3 25.2 21.2 19.5GoDaddy 82.95 91.81 90.3% 767 13,928 16,795 5.1 4.6 4.1 19.1 17.0 14.9Wix 249.96 319.34 78.3% 1,036 13,908 13,282 13.6 10.5 8.4 NM NM NM BigCommerce 64.15 162.50 39.5% 219 4,436 4,296 29.1 24.5 20.1 NM NM NM SPS Commerce 108.59 111.63 97.3% 187 3,834 3,594 11.6 10.1 9.1 42.1 37.0 31.0Yelp 32.67 37.49 87.1% 607 2,417 2,036 2.3 2.1 1.9 16.6 11.4 9.7Yext 15.72 20.90 75.2% 209 1,922 1,843 5.2 4.5 3.7 NM NM NM Quotient 9.42 10.99 85.7% 223 857 842 2.0 1.7 1.6 20.0 12.2 11.7ChannelAdvisor 15.98 22.32 71.6% 72 463 409 2.9 2.7 2.6 12.0 11.3 10.0
Top Quartile $7,972 $181,883 $191,325 12.3x 10.4x 8.8x 31.6x 28.3x 23.8xMean 9,869 168,485 171,945 10.8 8.9 7.4 24.2 20.5 17.8Median 2,431 27,565 30,648 5.5 5.2 5.1 20.0 17.0 14.9
($ in millions) EV/Revenue EV/EBITDA
Company Stock Price 52-Week High% of 52-Week
High InvEquity
Mkt CapEnterprise
Value CY 2020A CY 2021E CY 2022E CY 2020A CY 2021E CY 2022EAdobe $500.12 $536.88 93.2% $5,992 $239,917 $238,633 18.6x 15.7x 13.7x 38.6x 31.7x 28.0xOracle 64.69 66.20 97.7% 38,610 190,450 223,458 5.7 5.5 5.4 11.5 11.0 10.8Salesforce.com 222.53 284.50 78.2% 9,492 203,714 200,445 9.5 7.9 6.7 31.6 28.3 23.8IBM 125.88 158.75 79.3% 13,812 112,166 167,084 2.3 2.2 2.2 11.0 8.8 8.9HubSpot 396.44 420.61 94.3% 1,251 18,192 17,795 20.5 16.8 13.7 NM NM NM Yext 15.72 20.90 75.2% 209 1,922 1,843 5.2 4.5 3.7 NM NM NM Brightcove 18.40 19.36 95.0% 37 732 720 3.7 3.4 3.1 39.7 33.3 28.8SharpSpring 16.28 18.43 88.3% 28 205 204 7.0 5.9 5.2 NM NM NM
Top Quartile $10,572 $193,766 $206,198 11.8x 9.8x 8.4x 38.6x 31.7x 28.0xMean 8,679 95,912 106,273 9.1 7.7 6.7 26.5 22.6 20.1Median 3,622 65,179 92,440 6.3 5.7 5.3 31.6 28.3 23.8
Cash and ST

Trading Metrics (cont.)CEEM
Source: S&P Capital IQ.
Notes: Stock price last updated 12/31/2020. NM if EV/EBITDA multiple is greater than 50 or EBITDA is negative or EBITDA margin is negative. 12
($ in millions) EV/Revenue EV/EBITDA
Company Stock Price 52-Week High% of 52-Week
HighCash and ST
InvEquity
Mkt CapEnterprise
Value CY 2020A CY 2021E CY 2022E CY 2020A CY 2021E CY 2022EMicrosoft $222.42 $232.86 95.5% $131,989 $1,681,606 $1,626,873 10.8x 9.8x 8.9x 23.5x 21.6x 18.6xAdobe 500.12 536.88 93.2% 5,992 239,917 238,633 18.6 15.7 13.7 38.6 31.7 28.0Oracle 64.69 66.20 97.7% 38,610 190,450 223,458 5.7 5.5 5.4 11.5 11.0 10.8Salesforce.com 222.53 284.50 78.2% 9,492 203,714 200,445 9.5 7.9 6.7 31.6 28.3 23.8SAP 131.16 175.31 74.8% 8,399 156,184 163,964 4.9 4.9 4.7 14.0 14.1 13.6Twilio 338.50 374.49 90.4% 3,040 51,117 48,481 29.1 22.0 17.1 NM NM NM NICE 279.96 284.65 98.3% 1,464 17,562 17,022 10.3 9.4 8.5 30.9 28.3 24.9Zendesk 143.12 144.59 99.0% 971 16,699 16,507 16.1 13.0 10.4 NM NM NM OpenText 45.46 47.85 95.0% 1,501 12,319 14,936 4.6 4.6 NA 12.0 11.9 NA Nuance 44.09 44.93 98.1% 374 12,561 13,861 9.9 10.0 9.2 38.6 39.7 29.9Five9 174.40 187.99 92.8% 604 11,507 11,383 27.0 22.8 19.3 NM NM NM Pegasystems 133.26 140.89 94.6% 465 10,754 10,868 10.5 9.0 7.5 NM NM NM Verint Systems 67.18 67.59 99.4% 631 4,416 4,889 3.8 3.6 3.4 14.7 14.1 12.5Medallia 33.22 40.20 82.6% 654 4,998 4,807 10.1 8.7 7.3 NM NM NM LivePerson 62.23 68.55 90.8% 654 4,162 4,166 11.5 9.3 7.5 NM NM NM 8x8 34.47 35.72 96.5% 149 3,665 3,908 7.7 6.7 5.7 NM NM NM SurveyMonkey 25.55 26.24 97.4% 224 3,634 3,726 9.9 8.3 6.8 NM NM 46.7eGain 11.81 20.88 56.6% 54 365 315 4.2 3.9 3.3 34.6 NM NA
Top Quartile $5,254 $129,917 $135,093 11.3x 10.0x 9.2x 33.9x 28.3x 28.0xMean 11,404 145,868 144,902 11.3 9.7 8.6 25.0 22.3 23.2Median 813 12,440 14,398 10.0 8.8 7.5 27.2 21.6 23.8
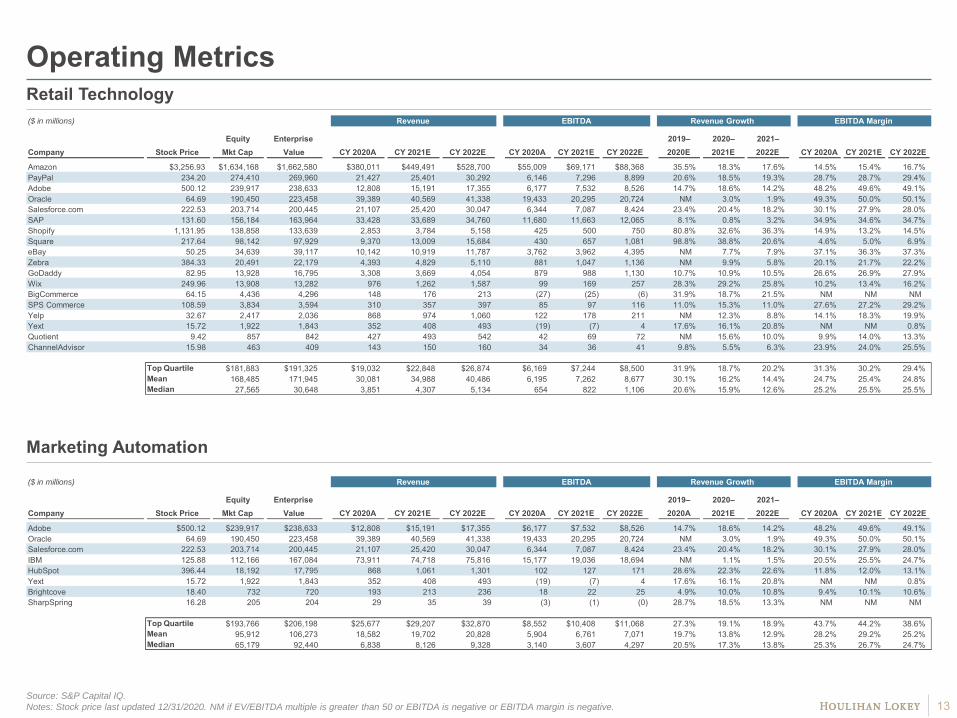
Operating Metrics Retail Technology
Source: S&P Capital IQ.
Notes: Stock price last updated 12/31/2020. NM if EV/EBITDA multiple is greater than 50 or EBITDA is negative or EBITDA margin is negative. 13
Marketing Automation
($ in millions) Revenue EBITDA Revenue Growth EBITDA Margin
Company Stock PriceEquity
Mkt CapEnterprise
Value CY 2020A CY 2021E CY 2022E CY 2020A CY 2021E CY 2022E2019–2020E
2020–2021E
2021–2022E CY 2020A CY 2021E CY 2022E
Amazon $3,256.93 $1,634,168 $1,662,580 $380,011 $449,491 $528,700 $55,009 $69,171 $88,368 35.5% 18.3% 17.6% 14.5% 15.4% 16.7%PayPal 234.20 274,410 269,960 21,427 25,401 30,292 6,146 7,296 8,899 20.6% 18.5% 19.3% 28.7% 28.7% 29.4%Adobe 500.12 239,917 238,633 12,808 15,191 17,355 6,177 7,532 8,526 14.7% 18.6% 14.2% 48.2% 49.6% 49.1%Oracle 64.69 190,450 223,458 39,389 40,569 41,338 19,433 20,295 20,724 NM 3.0% 1.9% 49.3% 50.0% 50.1%Salesforce.com 222.53 203,714 200,445 21,107 25,420 30,047 6,344 7,087 8,424 23.4% 20.4% 18.2% 30.1% 27.9% 28.0%SAP 131.60 156,184 163,964 33,428 33,689 34,760 11,680 11,663 12,065 8.1% 0.8% 3.2% 34.9% 34.6% 34.7%Shopify 1,131.95 138,858 133,639 2,853 3,784 5,158 425 500 750 80.8% 32.6% 36.3% 14.9% 13.2% 14.5%Square 217.64 98,142 97,929 9,370 13,009 15,684 430 657 1,081 98.8% 38.8% 20.6% 4.6% 5.0% 6.9%eBay 50.25 34,639 39,117 10,142 10,919 11,787 3,762 3,962 4,395 NM 7.7% 7.9% 37.1% 36.3% 37.3%Zebra 384.33 20,491 22,179 4,393 4,829 5,110 881 1,047 1,136 NM 9.9% 5.8% 20.1% 21.7% 22.2%GoDaddy 82.95 13,928 16,795 3,308 3,669 4,054 879 988 1,130 10.7% 10.9% 10.5% 26.6% 26.9% 27.9%Wix 249.96 13,908 13,282 976 1,262 1,587 99 169 257 28.3% 29.2% 25.8% 10.2% 13.4% 16.2%BigCommerce 64.15 4,436 4,296 148 176 213 (27) (25) (6) 31.9% 18.7% 21.5% NM NM NM SPS Commerce 108.59 3,834 3,594 310 357 397 85 97 116 11.0% 15.3% 11.0% 27.6% 27.2% 29.2%Yelp 32.67 2,417 2,036 868 974 1,060 122 178 211 NM 12.3% 8.8% 14.1% 18.3% 19.9%Yext 15.72 1,922 1,843 352 408 493 (19) (7) 4 17.6% 16.1% 20.8% NM NM 0.8%Quotient 9.42 857 842 427 493 542 42 69 72 NM 15.6% 10.0% 9.9% 14.0% 13.3%ChannelAdvisor 15.98 463 409 143 150 160 34 36 41 9.8% 5.5% 6.3% 23.9% 24.0% 25.5%
Top Quartile $181,883 $191,325 $19,032 $22,848 $26,874 $6,169 $7,244 $8,500 31.9% 18.7% 20.2% 31.3% 30.2% 29.4%Mean 168,485 171,945 30,081 34,988 40,486 6,195 7,262 8,677 30.1% 16.2% 14.4% 24.7% 25.4% 24.8%Median 27,565 30,648 3,851 4,307 5,134 654 822 1,106 20.6% 15.9% 12.6% 25.2% 25.5% 25.5%
($ in millions) Revenue EBITDA Revenue Growth EBITDA Margin
Company Stock PriceEquity
Mkt CapEnterprise
Value CY 2020A CY 2021E CY 2022E CY 2020A CY 2021E CY 2022E2019–2020A
2020–2021E
2021–2022E CY 2020A CY 2021E CY 2022E
Adobe $500.12 $239,917 $238,633 $12,808 $15,191 $17,355 $6,177 $7,532 $8,526 14.7% 18.6% 14.2% 48.2% 49.6% 49.1%Oracle 64.69 190,450 223,458 39,389 40,569 41,338 19,433 20,295 20,724 NM 3.0% 1.9% 49.3% 50.0% 50.1%Salesforce.com 222.53 203,714 200,445 21,107 25,420 30,047 6,344 7,087 8,424 23.4% 20.4% 18.2% 30.1% 27.9% 28.0%IBM 125.88 112,166 167,084 73,911 74,718 75,816 15,177 19,036 18,694 NM 1.1% 1.5% 20.5% 25.5% 24.7%HubSpot 396.44 18,192 17,795 868 1,061 1,301 102 127 171 28.6% 22.3% 22.6% 11.8% 12.0% 13.1%Yext 15.72 1,922 1,843 352 408 493 (19) (7) 4 17.6% 16.1% 20.8% NM NM 0.8%Brightcove 18.40 732 720 193 213 236 18 22 25 4.9% 10.0% 10.8% 9.4% 10.1% 10.6%SharpSpring 16.28 205 204 29 35 39 (3) (1) (0) 28.7% 18.5% 13.3% NM NM NM
Top Quartile $193,766 $206,198 $25,677 $29,207 $32,870 $8,552 $10,408 $11,068 27.3% 19.1% 18.9% 43.7% 44.2% 38.6%Mean 95,912 106,273 18,582 19,702 20,828 5,904 6,761 7,071 19.7% 13.8% 12.9% 28.2% 29.2% 25.2%Median 65,179 92,440 6,838 8,126 9,328 3,140 3,607 4,297 20.5% 17.3% 13.8% 25.3% 26.7% 24.7%
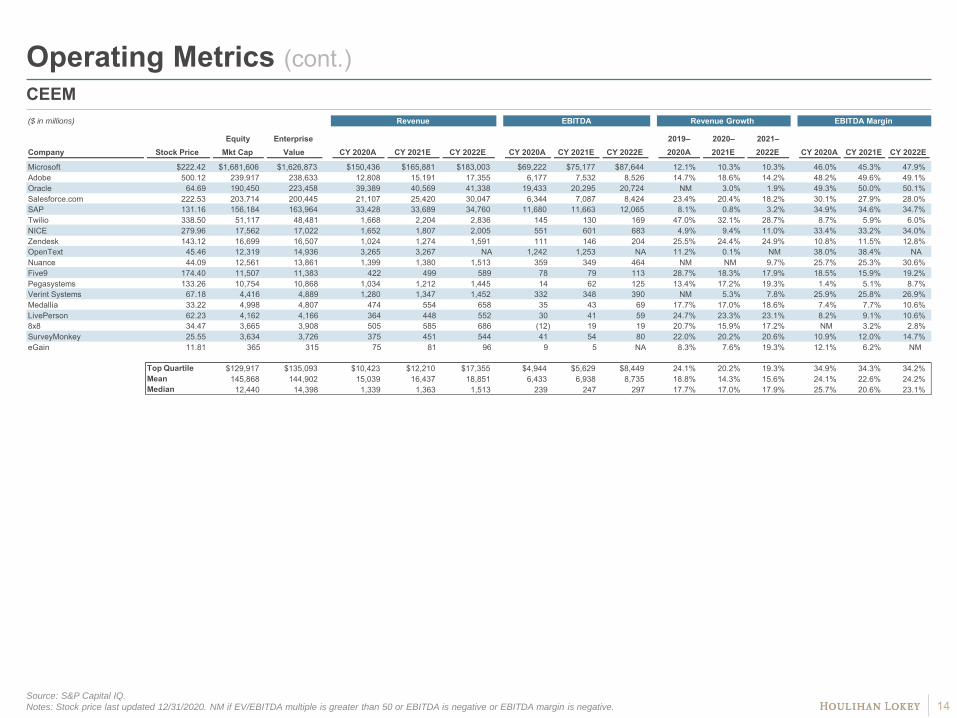
Operating Metrics (cont.)CEEM
Source: S&P Capital IQ.
Notes: Stock price last updated 12/31/2020. NM if EV/EBITDA multiple is greater than 50 or EBITDA is negative or EBITDA margin is negative. 14
($ in millions) Revenue EBITDA Revenue Growth EBITDA Margin
Company Stock PriceEquity
Mkt CapEnterprise
Value CY 2020A CY 2021E CY 2022E CY 2020A CY 2021E CY 2022E2019–2020A
2020–2021E
2021–2022E CY 2020A CY 2021E CY 2022E
Microsoft $222.42 $1,681,606 $1,626,873 $150,436 $165,881 $183,003 $69,222 $75,177 $87,644 12.1% 10.3% 10.3% 46.0% 45.3% 47.9%Adobe 500.12 239,917 238,633 12,808 15,191 17,355 6,177 7,532 8,526 14.7% 18.6% 14.2% 48.2% 49.6% 49.1%Oracle 64.69 190,450 223,458 39,389 40,569 41,338 19,433 20,295 20,724 NM 3.0% 1.9% 49.3% 50.0% 50.1%Salesforce.com 222.53 203,714 200,445 21,107 25,420 30,047 6,344 7,087 8,424 23.4% 20.4% 18.2% 30.1% 27.9% 28.0%SAP 131.16 156,184 163,964 33,428 33,689 34,760 11,680 11,663 12,065 8.1% 0.8% 3.2% 34.9% 34.6% 34.7%Twilio 338.50 51,117 48,481 1,668 2,204 2,836 145 130 169 47.0% 32.1% 28.7% 8.7% 5.9% 6.0%NICE 279.96 17,562 17,022 1,652 1,807 2,005 551 601 683 4.9% 9.4% 11.0% 33.4% 33.2% 34.0%Zendesk 143.12 16,699 16,507 1,024 1,274 1,591 111 146 204 25.5% 24.4% 24.9% 10.8% 11.5% 12.8%OpenText 45.46 12,319 14,936 3,265 3,267 NA 1,242 1,253 NA 11.2% 0.1% NM 38.0% 38.4% NA Nuance 44.09 12,561 13,861 1,399 1,380 1,513 359 349 464 NM NM 9.7% 25.7% 25.3% 30.6%Five9 174.40 11,507 11,383 422 499 589 78 79 113 28.7% 18.3% 17.9% 18.5% 15.9% 19.2%Pegasystems 133.26 10,754 10,868 1,034 1,212 1,445 14 62 125 13.4% 17.2% 19.3% 1.4% 5.1% 8.7%Verint Systems 67.18 4,416 4,889 1,280 1,347 1,452 332 348 390 NM 5.3% 7.8% 25.9% 25.8% 26.9%Medallia 33.22 4,998 4,807 474 554 658 35 43 69 17.7% 17.0% 18.6% 7.4% 7.7% 10.6%LivePerson 62.23 4,162 4,166 364 448 552 30 41 59 24.7% 23.3% 23.1% 8.2% 9.1% 10.6%8x8 34.47 3,665 3,908 505 585 686 (12) 19 19 20.7% 15.9% 17.2% NM 3.2% 2.8%SurveyMonkey 25.55 3,634 3,726 375 451 544 41 54 80 22.0% 20.2% 20.6% 10.9% 12.0% 14.7%eGain 11.81 365 315 75 81 96 9 5 NA 8.3% 7.6% 19.3% 12.1% 6.2% NM
Top Quartile $129,917 $135,093 $10,423 $12,210 $17,355 $4,944 $5,629 $8,449 24.1% 20.2% 19.3% 34.9% 34.3% 34.2%Mean 145,868 144,902 15,039 16,437 18,851 6,433 6,938 8,735 18.8% 14.3% 15.6% 24.1% 22.6% 24.2%Median 12,440 14,398 1,339 1,363 1,513 239 247 297 17.7% 17.0% 17.9% 25.7% 20.6% 23.1%

© 2021 Houlihan Lokey. All rights reserved. This material may not be reproduced in any format by any means or redistributed without the prior written consent of Houlihan Lokey.
Houlihan Lokey is a trade name for Houlihan Lokey, Inc., and its subsidiaries and affiliates, which include those in (i) the United States: Houlihan Lokey Capital, Inc., an SEC-registered broker-dealer and member of FINRA (www.finra.org) and SIPC (www.sipc.org) (investment banking services); Houlihan Lokey Financial Advisors, Inc. (financial advisory services); HL Finance, LLC (syndicated leveraged finance platform); and Houlihan Lokey Real Estate Group, Inc. (real estate advisory services); (ii) Europe: Houlihan Lokey EMEA, LLP, and Houlihan Lokey (Corporate Finance) Limited, authorized and regulated by the U.K. Financial Conduct Authority; Houlihan Lokey (Europe) GmbH, authorized and regulated by the German Federal Financial Supervisory Authority (Bundesanstalt für Finanzdienstleistungsaufsicht); Houlihan Lokey GmbH; Houlihan Lokey S.p.A.; Houlihan Lokey (Netherlands) B.V.; Houlihan Lokey (España), S.A.; and Houlihan Lokey (Corporate Finance), S.A.; (iii) the United Arab Emirates, Dubai International Financial Centre (Dubai): Houlihan Lokey (MEA Financial Advisory) Limited, regulated by the Dubai Financial Services Authority for the provision of advising on financial products, arranging deals in investments, and arranging credit and advising on credit to professional clients only; (iv) Singapore: Houlihan Lokey (Singapore) Private Limited, an “exempt corporate finance adviser” able to provide exempt corporate finance advisory services to accredited investors only; (v) Hong Kong SAR: Houlihan Lokey (China) Limited, licensed in Hong Kong by the Securities and Futures Commission to conduct Type 1, 4, and 6 regulated activities to professional investors only; (vi) China: Houlihan Lokey Howard & Zukin Investment Consulting (Beijing) Co., Limited (financial advisory services); (vii) Japan: Houlihan Lokey K.K. (financial advisory services); and (viii) Australia: Houlihan Lokey (Australia) Pty Limited (ABN 74 601 825 227), a company incorporated in Australia and licensed by the Australian Securities and Investments Commission (AFSL number 474953) in respect of financial services provided to wholesale clients only. In the European Economic Area (EEA), Dubai, Singapore, Hong Kong, and Australia, this communication is directed to intended recipients, including actual or potential professional clients (EEA and Dubai), accredited investors (Singapore), professional investors (Hong Kong), and wholesale clients (Australia), respectively. Other persons, such as retail clients, are NOT the intended recipients of our communications or services and should not act upon this communication.
Houlihan Lokey gathers its data from sources it considers reliable; however, it does not guarantee the accuracy or completeness of the information provided within this presentation. The material presented reflects information known to the authors at the time this presentation was written, and this information is subject to change. Houlihan Lokey makes no representations or warranties, expressed or implied, regarding the accuracy of this material. The views expressed in this material accurately reflect the personal views of the authors regarding the subject securities and issuers and do not necessarily coincide with those of Houlihan Lokey. Officers, directors, and partners in the Houlihan Lokey group of companies may have positions in the securities of the companies discussed. This presentation does not constitute advice or a recommendation, offer, or solicitation with respect to the securities of any company discussed herein, is not intended to provide information upon which to base an investment decision, and should not be construed as such. Houlihan Lokey or its affiliates may from time to time provide investment banking or related services to these companies. Like all Houlihan Lokey employees, the authors of this presentation receive compensation that is affected by overall firm profitability.
15
Disclaimer

16
CORPORATE FINANCE
FINANCIAL RESTRUCTURING
FINANCIAL AND VALUATION ADVISORY
HL.com