retaining quality t a - institute of social and economic ... teacher s-d 12_18.pdf · snapshot of...
TRANSCRIPT

RETAINING QUALITY TEACHERS FOR ALASKA
Prepared by G. Williamson McDiarmid
Boeing Professor of Teacher Education University of Washington
and Eric Larson
Alexandra Hill Institute of Social and Economic Research
University of Alaska Anchorage
Prepared for University of Alaska
and Alaska Department of Education and Early Development
December 2002

ACKNOWLEDGEMENTS
The authors thank Mark Hamilton, President of the University of Alaska, and Shirley Holloway, Alaska Commissioner of Education, for funding this study. We also thank staff members at ISER who helped design the survey questionnaires, conduct the surveys, do follow-ups, and enter and analyze data. We especially thank Patricia DeRoche, interviewer supervisor; Stephanie Martin, research associate; Darla Siver, database manager; and Virgene Hanna, survey research director.
Jerry Covey, a former commissioner of education, provided data on numbers of education graduates from Alaska’s colleges and universities. Melissa Hill, former director of the Alaska Teacher Placement Office at the University of Alaska Fairbanks, and Karen Lipson, a research analyst with the Alaska Department of Education and Early Development, provided a wide range of information on Alaska’s teachers and students—including teacher turnover, new hires, and other teacher and student characteristics. Claudia Dybdahl, director of UAA’s Teacher Education Program, provided information on graduates certified to teach special education.
We also thank those who provided valuable comments on earlier drafts: Gary Baldwin, Lower Kuskokwim School District; Lee Gorsuch, UAA; Rich Kronberg, NEA-Alaska; and Paul Ongtooguk, ISER.

CONTENTS: RETAINING QUALITY TEACHERS FOR ALASKA I. The National and Regional Picture...............................................................................1
Nationwide Enrollment................................................................................................... 1 National Teacher Retirement and Turnover ................................................................... 2 Is the U.S. Facing an Inadequate Supply of Teachers?................................................... 4 If Inadequate Supply Isn’t the Problem, What Is?.......................................................... 5 Which Schools and Districts are Experiencing Shortages and in Which Fields?........... 5 National and Regional Context: Conclusion................................................................... 6 The Relationship Between Teacher Turnover and Student Achievement ...................... 6
II. The Alaskan Context ................................................................................................... 8 Population and Enrollment Growth ................................................................................ 8 Alaska’s Competitiveness............................................................................................... 8 Snapshot of Alaska Teacher Mobility............................................................................. 9 Alaska Teacher Turnover.............................................................................................. 10 Demand for Teachers In Alaska ................................................................................... 15
III. Survey Findings: Why Alaskan Teachers Leave Their Jobs ............................... 20 Research Methods......................................................................................................... 20 Characteristics of Exiting Teachers .............................................................................. 22 Why Alaskan Teachers Left the Profession.................................................................. 23 Why Alaskan Teachers Moved to New Districts.......................................................... 25 Why Alaskan Teachers Retired .................................................................................... 28 Job Satisfaction and Working Conditions..................................................................... 29
IV. Teacher Supply: Producing Teachers in Alaska .................................................. 36 Research Methods......................................................................................................... 36 Elementary Education Graduates.................................................................................. 36 Secondary Education Graduates ................................................................................... 39 Special Education Graduates ........................................................................................ 40 Summary: Producing Teachers in Alaska..................................................................... 41 How Many Teachers Who Graduate in Alaska are Likely to Go Into Classrooms? .... 41
V. Survey of Alaska Instructional Aides....................................................................... 42 Overview....................................................................................................................... 42 Survey Methods ............................................................................................................ 43 Results of Instructional Aide Survey ............................................................................ 44
VI. Conclusions and Recommendations ....................................................................... 53 Teacher Supply: Declining Numbers of Alaska Graduates ......................................... 54
Policy Implications: How Can We Produce More Alaska Teachers? .................. 55 Alaska’s Declining Competitiveness ............................................................................ 56
Policy Implications: How Can We Improve Alaska’s Competitiveness? ............ 57 High Turnover Rates and Difficulty Recruiting in Some Rural Districts..................... 57
Policy Implications: How Can We Reduce Turnover and Increase Recruitment?58 VII. References................................................................................................................ 60

CHARTS, TABLES, MAP Chart 1. U.S. Western Region, K-12 Enrollment Projections, 2000-2010........................ 1 Chart 2. Nationwide Teacher Experience and Age Trends ............................................... 2 Chart 3. Total Turnover in the U.S.: Movers, Leavers, and Retirees,
1987-88 to 1993-94.............................................................................................. 3 Chart 4. Total Hires in U.S. Schools: New Entrants and Movers, 1987-88 to 1993-94.... 4 Chart 5. Snapshot of Alaksa Teacher Mobility ............................................................... 10 Chart 6. Number of Teachers Hired in Alaska, 1996-2000............................................. 16 Chart 7. New Hires (Full-Time Equivalent), In Urban and Rural School Districts
(Annual Average, 1994-95 through 1999-2000) ............................................... 17 Chart 8. New Elementary Teacher Hires (FTE) in Urban and Rural Districts,
1994-95 to 1999-2000.......................................................................................... 8 Chart 9. New Math Teacher Hires (FTE) in Urban and Rural Districts
1994-95 to 1999-2000........................................................................................ 18 Chart 10. New Science Teacher Hires (FTE) in Urban and Rural Districts
1994-95 to 1999-2000........................................................................................ 18 Chart 11. New Special Education Teacher Hires in Urban and Rural Districts
1994-95 to 1999-2000........................................................................................ 19 Chart 12. New English Teacher Hires (FTE) in Urban and Rural Districts, 1994-95
to 1999-2000 ...................................................................................................... 19 Chart 13. Elementary Education Graduates (Type A), University of Alaska,
by Campus, 1997-2001 ...................................................................................... 37 Chart 14. Elementary Education Graduates (Type A) From Other
Alaska Institutions of Higher Learning, 1997-2001 .......................................... 38 Chart 15. Elementary Education Graduates (Type A), from All Alaska Institutions
of Higher Education and from the University of Alaska, 1997-2001................ 39 Chart 16. Secondary Education Graduates, University of Alaska,
by Campus, 1997-2000 ...................................................................................... 40 Chart 17. Graduates with Special Education Certification,
University of Alaska Anchorage, 1996-2000 .................................................... 41 Table 1. Average Salary, Cost-of-Living Adjusted Salary, and Relative
National Ranking for Alaska Teachers, 1989-90 to 1999-2000 .......................... 8 Table 2. District, Community, and Teacher Characteristics,
by Teacher Turnover Group............................................................................... 13 Table 3. Population and Sample Size for Teacher Exit Survey, 2001-02........................ 21 Table 4. Demographics of Exiting Teachers.................................................................... 22 Table 5. Main Activity for the Coming Year Among Teachers Who Left Their Jobs,
2000-2001 (Percentage Citing Activity) ............................................................ 23 Table 6. Reasons Alaska Teachers Cited For Leaving Teaching, 2000-01
(Percentages Citing Reason as Important) ......................................................... 24 Table 7. Description of Alaskan Teachers Moving to Others Districts, 2000-01............ 25 Table 8. Reasons for Moving from One District to Another, 2000-01
(Percentages of Teachers Citing Reason as Important) ..................................... 26

Table 9. Reasons Teachers Retired, 2000-01 (Percentages of Retiring Teachers Citing Reason As Important) ...................... 28
Table 10. Exiting Teachers' Satisfaction with Their Jobs and Teaching Profession (Percent Who Agreed with Statement about Teaching Conditions).................. 30
Table 11. Exiting Teachers' Evaluation of Effectiveness of School Leadership (Percentages Who Rated Leader as Effective)................................................... 35
Table 12. Population and Sample Size for Instructional Aide Survey, 2000-01 ............. 43 Table 13. Characteristics of Alaska Instructional Aides, 2000-01................................... 44 Table 14. Grade Levels Where Alaska Instructional Aides Worked, 2000-01
(Percentages of Aides That Spent Any Time Working with Various Grade Levels ...................................................................................................... 45
Table 15. Programs Where Alaska Instructional Aides Worked, 2000-01 (Percentage of Aides That Spent Any Time Working in Various Programs).... 45
Table 16. Education Levels Among Alaska Instructional aides, 2000-2001 ................... 46 Table 17. Sources of Post-Secondary Education Among Instructional Aides
(Percentage of Aides Who Have Taken Courses from Specific Institutions).... 46 Table 18. Experience of Alaska Instructional Aides With Distance Education............... 47 Table 19. Impediments To Alaska Instructional Aides Obtaining Degrees
(Percentages Citing Specific Impediments)....................................................... 48 Table 20. Longest Period Aides Could Be Away From Home Each Year ...................... 50 Table 21. Longest Period Aides Could be Away From Home Each Year, If a Program
Provided a Scholarship for Travel, Tuition and Living Expenses ..................... 50 Table 22. Longest Period Aides Could be Away Each Year, If a Program Paid Travel,
Tuition and Living Expenses and Provided Some Support for Child Care ....... 51 Table 23. How Comfortable Do Aides Feel with Using Computers to Take Classes
and Communicate With Instructors? ................................................................. 51 Table 24. Percentage of Instructional Aides with Computer and Internet Connections at
School and at Home........................................................................................... 52 Map 1. Alaska School Districts, By Average Annual Teacher Turnover Rate,
1996-2000 ......................................................................................................... 12

Retaining Quality Teachers for Alaska
1
Retaining Quality Teachers for Alaska I. THE NATIONAL AND REGIONAL PICTURE
Historically, Alaska has depended heavily on teachers educated outside the state. Over time, Alaska has imported roughly 70 percent of its teachers. As a consequence, national trends—in certification of new teachers, teacher shortages, retirements, and salaries—are of immediate relevance to teacher supply and demand in Alaska.
Before we delve into data on Alaska educators, therefore, we will look at the wider national picture. Specifically, projections of student enrollment, teacher retirement, turnover, and new entrants to the teaching field seem critical to the issue.
Nationwide Enrollment Nationwide, student enrollment is beginning to level off, after increasing for a
number of years. Projected enrollments for the year 2010 are almost identical to those for 2000. Secondary enrollment grew slightly between 1999 and 2000, while elementary enrollment decreased slightly from the previous year (NCES, 2002).
The bigger issue is which states are experiencing growth. Six states are witnessing a surge in enrollment: California, Nevada, Arizona, North Carolina, Massachusetts, and Rhode Island. The three Western states experiencing enrollment growth compete with Alaska for teachers. Student enrollment in the Western region, projected to grow about 6 percent between 2000 and 2010 (Chart 1), will outstrip the national growth rate in the period 2000-2010.
Although this growth is not dramatic—roughly half a percent annually—it nonetheless suggests a slow, steady increase in demand for teachers. And when growing enrollment is coupled with policy initiatives such as class-size reduction in California, the demand for teachers increases dramatically—as we have seen in Los Angeles.
Chart 1. U.S. Western Region, K-12 Enrollment Projections, 2000-2010
10,800
10,900
11,000
11,100
11,200
11,300
11,400
11,500
11,600
11,700
11,800
11,900
In T
ho
usa
nd
s
2000 2001 2002 2003 2004 2005 2006 2007 2008 2009 2010Year
Source: National Center for Education Statistics, 2001

Retaining Quality Teachers for Alaska
2
National Teacher Retirement and Turnover What has received the most public attention nationwide is the rise in the number
of teachers reaching retirement age. From 1986 to 1996, the median age of teachers increased from 41 to 44 (NCES, 1998). As Chart 2 indicates, the proportion of teachers over 50 has been increasing since 1976. However, after increasing 5 percent a decade from 1976 to 1996, the share of teachers over 50 is projected to level off, like student enrollments.
Chart 2. Nationwide Teacher Experience and Age Trends
Source: American Federation of Teachers, Survey and Analysis of Teacher Salary Trends 1998, p. 37
Some analysts have concluded that retirements are strongly influencing the demand for teachers. One analysis, based on 1999 surveys of teacher preparation institutions nationally, identified early retirement—intended to save districts money—as the primary factor determining demand, followed by routine retirement (American Association for Employment in Education, 2001).
Yet, retirements account for only small—although growing—proportions both of teachers who leave their positions and those who leave the profession. Of the more than 400,000 teachers who left their jobs in 1993-94—to teach elsewhere, to quit teaching, or to retire—only about 50,242 retired (Ingersoll, 2001). Those retirements accounted for only about 12 percent of teacher turnover that school year. As Chart 3 indicates, these data are consistent over time, rising slightly in the 1990s.
Over Age 50 22.3% 15.5% 19.4% 21.2% 22.9% 25.8%
Over 20 Years of Experience 18.3% 14.1% 21.9% 27.7% 34.7% 38.1%
1971 1976 1981 1986 1991 1996

Retaining Quality Teachers for Alaska
3
Chart 3. Total Turnover in the U.S.: Movers, Leavers, and Retirees, 1987-88 to 1993-94
010
0,00
020
0,00
030
0,00
040
0,00
050
0,00
0
Nu
mb
er o
f T
each
ers
1987-88 1990-91 1993-94Year
Retirees
Leavers
Movers
Source: National Center for Educational Statistics, School Staffing Survey, 1994, cited in Ingersoll, 2001
As Ingersoll (2001) has argued, it is those who leave the profession (“leavers”),
even if temporarily, and those who move from one teaching position to another position elsewhere (“movers”), that constitute the bulk of what is called teacher turnover.
As Chart 4 shows, movers also make up almost half of the new hires each year. In 1993-94—the most recent year for which we have NCES statistics—49 percent of new hires were actually movers, while only 51 percent were new entrants to the profession. This illustrates what Ingersoll calls the “revolving door” of teaching.

Retaining Quality Teachers for Alaska
4
Chart 4. Total Hires in U.S. Schools: New Entrants And Movers, 1987-88 to 1993-94
0
50,000
100,000
150,000
200,000
250,000
300,000
350,000
400,000
Nu
mb
er o
f T
each
ers
1987-88 School Year 1990-91 School Year 1993-94 School Year
Movers
New Entrants
Source: National Center for Education Statistics, School Staffing Survey, 1994, cited in Ingersoll, 2001
Is the U.S. Facing an Inadequate Supply of Teachers? Another common assumption is that the U.S. supply of teachers is inadequate and
that teacher preparation programs need to produce more teachers. Although that may be true for certain specialties—for instance, math, science, and special education—it may not be generally true. Enrollment in teacher education programs increased 49 percent in the 15 years between 1983 and 1998 (Feistritzer, 1999). Over the past decade, 67 new teacher education programs have come on line. Recent federal policy initiatives such as the Transition to Teaching program—designed to foster alternate ways for teachers to become licensed and shorten the preparation time—will further increase the labor pool.
Depending on which estimate you choose, the nation has a surplus supply of several million teachers who are certified but not teaching. Census data from 1993 indicated that six million people held at least a bachelor’s degree in education in the U.S. (Feistritzer, 1998), while fewer than four million were teaching that year (NCES, 2001). We know relatively little about these potential teachers—for instance, we do not know what incentives would draw some of them into teaching.
Thus, while the demand for teachers has increased nationwide, so has the supply—and it continues to increase.

Retaining Quality Teachers for Alaska
5
If Inadequate Supply Isn’t the Problem, What Is? The data we just discussed suggest that a significant number of people do not
teach after earning their certificates—perhaps as many as 40 percent of the graduates of teacher education programs nationwide. And the attrition rate for teachers in the first five years of teaching is also high—between 30 and 50 percent, depending on location (Darling-Hammond, 2000; NCES, 1997). Consequently, a graduating class of 100 teachers might yield, five years later, between 30 and 42 teachers in the classroom.
In addition to high attrition rates, the supply of teachers is uneven. For some specialties—such as elementary, English, and social studies—surpluses exist in some areas of the country (NCREL, 2000; Oregon University System, 1999). Yet for other specialties—such as special education, math, and science—shortages are rampant in many districts.
Consequently, to speak of a generic teacher “shortage” is misleading. Rather, we are experiencing shortages that are localized and specific to specialties. As we noted above, much of teacher turnover—roughly 50 percent—is actually teachers moving from one district to another (Chart 3). Among all teachers in the U.S., 14 to 15 percent actually leave the profession annually.
Which Schools and Districts are Experiencing Shortages and in Which Fields? Shortages are localized to a small number of schools. Unfortunately but
predictably, high-need schools in rural and urban districts are much more likely than suburban schools to experience shortages (Darling-Hammond, 2000). Students in these high-need schools are also less likely to be taught by teachers with majors or minors in the subjects they are teaching (Education Trust, 2002). Among high-poverty districts, 65 percent hire non-certified or long-term subs (Darling-Hammond, 2000). A student in a high-need math classroom has less than a 50-50 chance of being taught by a teacher with a major or minor in mathematics (Oakes, 1990).
The problem is exemplified by data on shortages by specialty. Most of the areas of shortage are well known—math, science, special education, English as a second language, bilingual education. However, some schools actually experience shortages in specialties for which a surplus of licensed teachers exists. In 1993-94, for instance, 16 percent of schools reported difficulty staffing math positions and 15 percent had trouble filling special education positions—but 9 percent also reported difficulty finding qualified English teachers, despite evidence that teacher preparation programs are producing a surplus of English teachers. This indicates that hard-to-staff schools—which too often are also the schools where students have the greatest educational needs—may have difficulty attracting teachers even in specialties with a surplus of qualified teachers.
This supply problem suggests a parallel to the world food situation. Although sufficient food is produced worldwide to feed everyone, the food often fails to reach the people in greatest need. Thus the issue is less one of production and more one of distribution. Teachers—especially accomplished teachers who teach in specialties that are experiencing shortages—can usually decide for themselves where they will teach. Many teachers avoid high-turnover districts precisely because they tend to be in impoverished neighborhoods and to enroll students who lack many of the resources that lead to success in school.

Retaining Quality Teachers for Alaska
6
This is not to deny that critical supply problems do exist in some specialties. For instance, the Washington Education Association sent current and former special education teachers a survey asking what they would be doing in five years (Washington Education Association, 2002). About two-thirds of those who received surveys responded. Among the respondents, only 36 percent reported they planned to continue working in the field. Another 22 percent were unsure, 13 percent planned to retire, 9 percent planned to leave education altogether, and 20 percent planned to remain in education but not in special education. Even if all those who didn’t respond to the survey plan to stay in special education—which seems unlikely, given the answers of those who did respond—at least one in three special education teachers plan on leaving the field within five years. This survey indicates the depth of the problem in special education. Washington is one of the states with which Alaska competes for teachers.
National and Regional Context: Conclusion The national and regional picture suggests that the primary problem is getting
teachers to the schools where they are needed. Most schools in the country and in the Western region are not facing shortages. But schools where students have traditionally been underserved—rural and urban schools in communities with high poverty—are suffering severe shortages. These schools have little choice but to turn to unlicensed and under-prepared people who, facing the greatest instructional challenges, are often overwhelmed and consequently abandon the classroom in short order. As we will see later, one factor associated with students’ failure to learn is high teacher-turnover.
Increasing the supply of teachers, especially in high-need areas such as math, science, and special education, may help. Newly minted teachers may find their way to the schools that most need them. History, however, suggests otherwise.
Consequently, we need incentives that will attract well-qualified teachers to the schools where they are most needed.
The Relationship Between Teacher Turnover and Student Achievement A primary reason to be concerned about high rates of turnover among teachers is
the relationship that has been established between teacher turnover and student achievement. David Grissmer and his colleagues at RAND analyzed math and reading scores from over 2,500 fourth and eighth graders in 44 states on the 1990-1996 National Assessment of Educational Progress (Grissmer et al., 2000). The researchers were particularly interested in the relationship between certain school and teacher characteristics and student achievement. They used both U.S. census data and parent self-reported data from the National Educational Longitudinal Study to ensure that they were comparing students from similar socio-economic backgrounds. Among the variables that correlated with higher-than-average student scores over time was low teacher turnover.
The findings of Grissmer and his colleagues are particularly important because they (1) used a national sample of students and their families; (2) examined NAEP results over time, rather than just a “snapshot” of scores; and (3) controlled for the effects socio-economic factors have on student achievement. Still, these results only allow us to say that low teacher turnover is associated with higher student achievement, not that low turnover causes higher student achievement. Nonetheless, the results are suggestive and make the point that turnover is not merely disruptive and a headache for administrators but that it may also affect student achievement. This finding is particularly relevant to
Retaining Quality Teachers for Alaska
7
Alaska at this time, because students will soon be required to pass a High School Graduation Qualifying Examination before they can receive diplomas and because both the federal and state governments have established school accountability systems.
The recent federal No Child Left Behind (NCLB) legislation underlines the importance of addressing the turnover issue. NCLB requires accountability “to ensure that all children have a fair, equal, and significant opportunity to obtain a high-quality education and reach, at a minimum, proficiency on challenging state academic achievement standards and state academic assessments.” If a state fails to improve achievement among disadvantaged students, the U.S. Department of Education could reduce the amount the state may use for administration of ESEA programs. Persistent low performance on the state assessment among students at a given Alaska school is not merely a problem for the community and district in which the school is located—it is a challenge for Alaska as a whole. Addressing chronically high turnover rates—arguably a major factor in persistent low performance—is thus a key to overall state success in meeting the NCLB performance objectives.

Retaining Quality Teachers for Alaska
8
II. THE ALASKAN CONTEXT
Population and Enrollment Growth Alaska’s population is expected to grow at a rate of about 1.5 percent annually
over the next 25 years (Goldsmith, 2001). This aggregate figure hides unevenness in growth among different groups and in different regions. In 2000, for instance, 39 percent of Alaska Natives were under the age of 18, compared with 30 percent of all Alaskans; Alaska Natives made up 20 percent of school-age children, but just 16 percent of the total population (U.S. Census, 2000). Some areas of the state also grew faster than others in recent years—particularly the Mat-Su Borough, but also the Kenai Peninsula, the North Slope, and the Yukon-Kuskokwim Delta. These data suggest that the demand for teachers is likely to increase more in specific areas and in school districts with large numbers of Alaska Native students.
Alaska’s Competitiveness As noted above, Alaska has relied on teachers from outside the state since the
establishment of formal schools in the nineteenth century. In recent years, roughly 70 percent of the teachers in Alaska’s schools have been educated outside the state.
The demand for teachers in Alaska increased dramatically during the mid-1970s, when construction of the trans-Alaska oil pipeline attracted new residents, and in the late 1970s and early 1980s, as the state government built and staffed village high schools. At that time, North Slope oil production was generating very high revenues for the state government, and the state was able to offer the highest teacher salaries in the country. As a consequence, most Alaska school districts received far more applications than they had positions and could pick and choose whom they wanted.
However, as the 1980s unfolded, oil revenues began to decline and so did Alaska teachers’ salaries, when adjusted for Alaska’s higher cost-of-living (COL). The American Federation of Teachers reports that during the 1990s, average COL-adjusted salaries in Alaska plummeted from 8th to 40th among the states (Table 1).
Table 1. Average Salary, Cost-of-Living Adjusted Salary, and Relative National Ranking for Alaska Teachers, 1989-90 to 1999-2000 Year Average Salary COL Adj. Salary National Ranking
1989-90 $43,097 $35,152 8 1992-93 $46,799 $35,214 18 1995-96 $47,349 $36,422 24 1997-98 $48,275 $38,620 23 1999-00 $46,481 $37,185 40
Source: American Federation of Teachers, 2001
To adjust average teachers’ salaries to reflect cost-of-living differentials across
states, the federation uses the cost-of-living index published by the American Chamber of Commerce Researchers Association (ACCRA; see www.coli.org/). ACCRA uses the COL-adjustment for Anchorage to reflect the cost-of-living differential for the entire state. ACCRA’s adjustment for Anchorage is about 23 to 25 percent above the U.S. average, according to Goldsmith (2002). Goldsmith, based on his own research into cost-

Retaining Quality Teachers for Alaska
9
of-living differences between Alaska and other states, argues that ACCRA overestimates the cost-of-living difference between Anchorage and the U.S. average but may underestimate the difference for rural areas, where costs can be significantly higher.
Potential sources of error include methods of data collection; the contents of the ACCRA “market basket” used to measure living costs; and the exclusion of sales taxes from the cost of items. Also, the Permanent Fund dividend the state pays Alaska residents effectively reduces the cost-of-living differential—by increasing buying power of Alaskans—but the ACCRA index doesn’t account for that.
Goldsmith estimates that the Alaska differential is about 20 percent above the U.S. average (Goldsmith, 2002). This represents the average cost of living across the state, based on weights for particular places using the number of state and local employees in each place. This state average tends to overestimate the differential for Anchorage and underestimate the differential for rural Alaska.
Overall, Goldsmith estimates that the ACCRA index is likely inaccurate for Anchorage and for the state as a whole—and may actually underestimate the cost-of-living differential for rural Alaska. As we will discuss below, of greatest concern in Alaska is the high turnover rate in hard-to-staff schools. These schools are almost exclusively in the remote rural areas of the state, where the cost-of-living differential is the highest. Thus, while the rankings in Table 1 may place Alaska lower than real living costs statewide would justify, they may—by underestimating rural costs—overstate the competitive position of remote rural Alaska districts.
Snapshot of Alaska Teacher Mobility To put our descriptions of teacher turnover and demand in perspective, we first
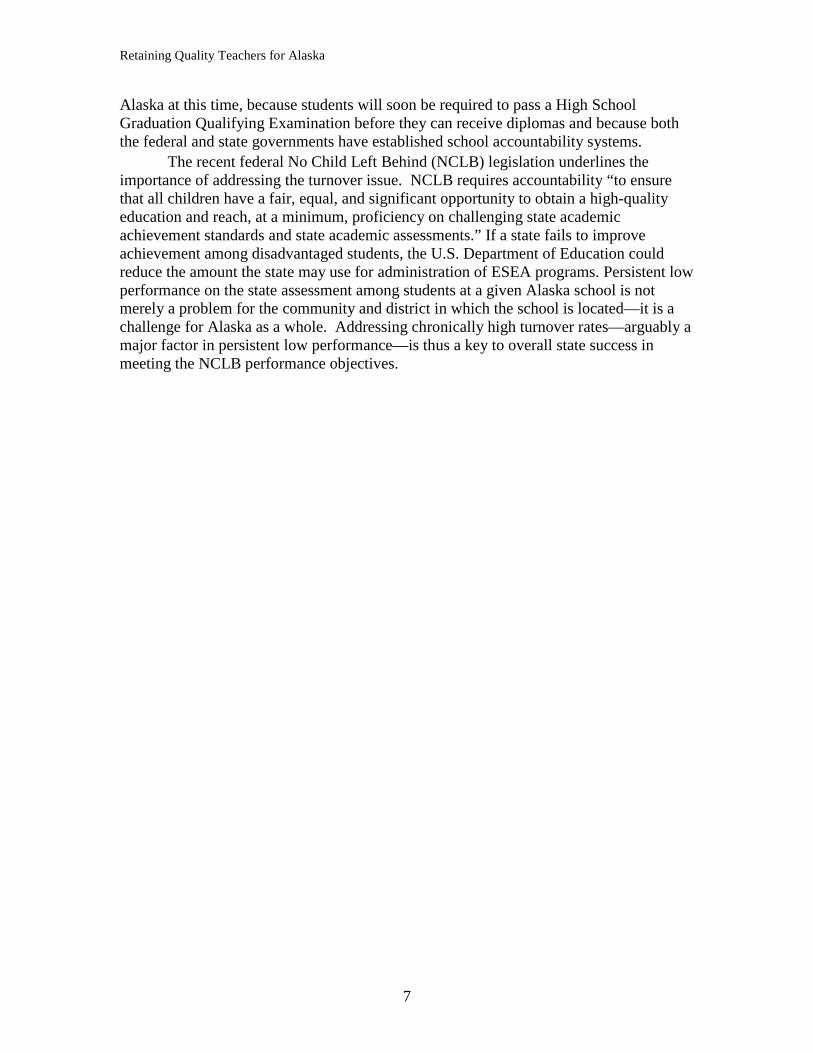
present a snapshot of mobility among Alaska’s teachers at the end of the 1999-2000 year. Chart 5 shows that about three quarters of teachers stayed at the same schools to teach the following year. Another 9 percent changed schools but stayed in the same districts. Two percent moved to other Alaska school districts. The final 13 percent decided, for various reasons, to leave their jobs in Alaska’s public schools. This turnover— defined as “movers” plus “leavers”—of 15 percent was similar to the national turnover rate of 13.7 percent in 1995 (NCES, 1997).
Within that broad pattern among all teachers, there were substantial differences in movements of urban and rural teachers, as the bottom half of Chart 5 shows. While more than 90 percent of teachers in urban schools stayed in the same districts (either in the same school or a new school) to teach the following year, only 76 percent of rural teachers stayed in the same districts. Among the teachers who left the public schools, nearly 60 percent left rural schools, as compared with 40 percent leaving urban schools.
Of special interest in Alaska is the question of whether significant numbers of rural teachers move to urban districts. Anecdotal evidence suggests that some of the teachers who move to the state initially take jobs in remote districts until they can find openings in districts on the road system. Rural educators point out that if this is true, rural districts shoulder a disproportionate burden of inducting and training new teachers who then move on to urban schools. Because such induction and training may cost $8,000 or more per teacher, this would represent a subsidy rural schools pay urban schools (Texas Center for Educational Research, 2000).
Retaining Quality Teachers for Alaska
10
Chart 5 shows that of the small number of teachers who moved from one Alaska district to another in 2000, most were in fact rural teachers. But they moved mostly to other rural districts. Of the roughly 150 teachers who moved from one Alaska school district to another after the 1999-00 school year, about two-thirds moved from rural districts to other rural districts. Another 20 percent—36 teachers—moved from rural to urban schools. A handful moved from urban to rural schools, and a few moved from one urban district to another. Thus, the number of teachers who move from rural to urban districts appears small—yet the acute teacher shortages that rural districts experience suggest that even these relatively small numbers are significant.
Chart 5. Snapshot of Alaska Teacher Mobility, 1999-2000
Source: ISER calculations from Alaska Department of Education and Early Development data
Alaska Teacher Turnover Now we describe teacher turnover among Alaska’s 53 public school districts in
recent years. As Map 1 shows, the average annual turnover rate from 1996 through 2000 differed sharply across school districts, from a low of 3 percent to a high of 50 percent. We calculated a five-year average, to compensate for year-to-year fluctuations. Some of the smaller, remote rural districts have experienced rates near 100 percent in some years. The state’s urban districts—Anchorage, Fairbanks, Juneau, Mat-Su—have historic annual turnover rates between 6 and 14 percent—comparable to the national average. All the districts with annual turnover rates of 30 percent or more are rural districts far from the main road system. But at the same time, some remote districts —notably Klawock (3 percent), Hoonah (7 percent), and Bristol Bay Borough (9 percent)—have annual turnover rates comparable to those of their more accessible counterparts. These districts deserve closer study, so we can learn more about how they manage to retain their teachers.

Retaining Quality Teachers for Alaska
11
District and Community Characteristics and Teacher Turnover Rates Table 2 compares district, community, and teacher characteristics in urban
districts—which have low turnover—and several categories of rural districts: those with turnover rates below 15 percent, between 16 and 29 percent, and above 30 percent.

Ret
aini
ng Q
uali
ty T
each
ers
for
Ala
ska
12

Ret
aini
ng Q
uali
ty T
each
ers
for
Ala
ska
13
Tab
le 2
. Dis
tric
t, C
omm
unit
y, a
nd T
each
er C
hara
cter
isti
cs, b
y T
each
er T
urno
ver
Gro
up
Tur
nove
r G
roup
s, B
ased
on
Ann
ual A
vera
ge T
urno
ver,
199
6-20
00
Indi
cato
r
Yea
r U
rban
Dis
tric
ts
Rur
al D
istr
icts
T
urno
ver
Bel
ow
15%
Rur
al D
istr
icts
T
urno
ver
Bet
wee
n 16
% a
nd 2
9%
Rur
al D
istr
icts
T
urno
ver
30%
or
mor
e
Dis
tric
t Tea
cher
Tur
nove
r R
ate
Ave
rage
19
96-2
000
9%
10%
24
%
37%
Ave
rage
Dai
ly M
embe
rshi
p 20
01
20,6
69
1,29
9 1,
014
282
Ave
rage
Num
ber
of T
each
ers
2001
35
0-2,
800*
88
67
29
Ave
rage
Bas
e Sa
lary
of
Tea
cher
s 20
01
$31,
394
$32,
447
$35,
988
$34,
313
Dis
tric
t In
dica
tors
Exp
endi
ture
s pe
r St
uden
t (A
DM
) 19
99
$6,4
73
$9,5
71
$12,
172
$15,
994
Ave
r. N
umbe
r of
Com
mun
ities
in D
istr
ict
2001
8
5 8
6
Ave
rage
Pop
ulat
ion
per
Com
mun
ity
20
00
92,6
67
5,39
0 3,
033
1,16
4
Per
cent
Ala
ska
Nat
ive
Pop
ulat
ion
2000
11
%
33%
57
%
64%
Med
ian
Hou
seho
ld I
ncom
e 20
00
$51,
454
$46,
436
$41,
087
$37,
284
Med
ian
Val
ue, O
wne
r-O
ccup
ied
Hou
sing
20
00
$123
,131
$1
26,5
58
$88,
733
$92,
522
Une
mpl
oym
ent R
ate
2000
8%
13
%
15%
18
%
Com
mun
ity
Indi
cato
rs
(Ave
rage
acr
oss
com
mun
ities
)
Per
cent
Fam
ilie
s be
low
Pov
erty
Lin
e 20
00
8%
10%
16
%
19%
Per
cent
Tea
cher
s w
ith
1 Y
ear
Exp
erie
nce
2001
7%
7%
9%
13
%
Ave
rage
Yea
rs o
f E
xper
ienc
e 20
01
10.1
11
.8
8.8
7.5
Per
cent
Fem
ale
2001
73
%
61%
62
%
60%
Tea
cher
In
dica
tors
(
For
enti
re d
istr
ict)
Per
cent
Ala
ska
Nat
ive
2001
3%
8%
14
%
12%
* Th
is is
the
rang
e ra
ther
than
the
aver
age
amon
g ur
ban
dist
rict
s; th
e av
erag
e is
mis
lead
ing,
bec
ause
Anc
hora
ge h
as n
earl
y th
ree
tim
es th
e te
ache
rs a
s th
e ne
xt la
rges
t dis
tric
t.IS
ER
tabu
lati
ons
with
dat
a fr
om A
lask
a T
each
er P
lace
men
t; A
lask
a D
epar
tmen
ts o
f Edu
catio
n an
d E
arly
Dev
elop
men
t and
Com
mun
ity a
nd R
egio
nal A
ffai
rs;
U.S
. Cen
sus
Not
e: D
istr
ict i
ndic
ator
s an
d te
ache
r in
dica
tors
are
ave
rage
s ac
ross
dis
tric
ts in
eac
h gr
oup.
Com
mun
ity
indi
cato
rs a
re a
vera
ges
acro
ss c
omm
unit
ies
in e
ach
grou
p.

Retaining Quality Teachers for Alaska
14
Table 2 makes clear the patterns of difference between, on the one hand, urban districts and rural districts that have little difficulty in staffing their schools, and on the other, rural districts that are chronically difficult to staff.
High-turnover districts have significantly smaller populations and likewise far fewer teachers and students. The districts with the highest turnover had on average 29 teachers in 2001, compared with an average of 88 in rural districts with low turnover and between 350 and 2,800 in urban districts. Alaska Natives make up a substantial share of the small populations in high-turnover districts. In 2000, Alaska Natives made up between 57 and 64 percent of the community populations, compared with just 11 percent in urban districts and 33 percent in rural districts with lower turnover.
Base salaries of teachers in high-turnover districts are just modestly higher than salaries in urban districts, despite significantly higher living costs. The base salary is the bottom of the pay scale—what a district offers its newest, least experienced teachers —and it does not reflect average salaries. However, it is a reasonable indication of the salary differential among districts. In 2001, base salaries of teachers in high-turnover districts were in the range of 10 percent more than in districts with lower turnover. Salary levels may be critical in efforts to attract teachers to remote, high-turnover districts.
Districts with the highest turnover also have the highest per-pupil expenditures —reflecting the higher costs of living and doing business at remote rural sites; small schools in general also face higher costs because they can’t take advantage of economies of scale. In 1999, per-student costs in high-turnover districts were more than twice as high as in urban districts. These high per-pupil costs make rural districts vulnerable to critics who want to reduce state education spending at the expense of small, remote communities.
Substantial income differences also exist between districts with lower turnover and districts with higher turnover. In 2000, median household income in urban districts was $51,454—nearly 40 percent higher than the $37, 284 income in rural districts with the highest turnover.
The districts with high turnover also have higher unemployment and more poverty. The 2000 unemployment rate in urban areas was 8 percent, while the rate in districts with higher turnover was 15 to 18 percent. And because of the way unemployment is defined and recorded, these data significantly underestimate real unemployment in rural Alaska (for a discussion, see McDiarmid and Goldsmith, 1998). Also, as we might expect with higher unemployment, poverty was more widespread in high-turnover districts. While 8 percent of families in urban districts—and 10 percent in rural districts with low turnover—had incomes below the federal poverty level in 2000, between 16 and 19 percent of families in high-turnover districts had incomes below the federal poverty level.
Clearly, districts that have the highest turnover rates also have smaller populations that tend to include more Alaska Natives and are economically poorer by several measures. The finding that districts with higher poverty also have higher teacher turnover rates is consistent with national data (Darling-Hammond, 2000; Hanushek, Kain, and Rivkin, 2001).
Looking at teacher characteristics in Table 2, we again find noticeable differences between districts with higher and lower rates of turnover. Districts with the highest turnover rates employ more first-year teachers (13 percent) than do urban and low-turnover rural districts (7 percent each). Grissmer and his colleagues found a strong

Retaining Quality Teachers for Alaska
15
positive correlation between the proportion of teachers with two or more years of experience and student achievement (Grissmer et al., 2000). Correspondingly, urban and low-turnover rural districts employ teachers who have on average been teaching longer. In 2001, teachers in urban districts had been on the job an average of 10.1 years, and teacher in rural districts with low turnover had been working on average 11.8 years. By comparison, teachers in districts with the highest turnover had been working on average 7.5 years.
Table 2 also shows some differences by gender and race among teachers in high- and low-turnover districts. The percentage of women teaching in urban and low-turnover rural districts is larger than in the higher turnover districts—but the difference is not statistically significant. There are substantially more Alaska Native teachers —between 12 and 14 percent—in the high-turnover districts (which are also the districts with larger overall Alaska Native populations); in urban districts only 3 percent of teachers are Alaska Native and in low-turnover rural districts 8 percent.
In sum, teachers in districts with low turnover rates tend to be more experienced and are far less likely to be Alaska Native than teachers in high-turnover districts.
Demand for Teachers In Alaska The best proxy we have for teacher demand is the number of teachers hired. Chart
6 shows the number of annual hires over the six years from 1995 through 2000. Annual new hires statewide increased dramatically between 1995 and 1998—
from 817 to 1,386. Numbers of school-age children peaked during those years, which explains some of the new hires. But the need to hire more teachers may also reflect increased turnover due to a number of factors we’ve already discussed, including the relative decline of COL-adjusted Alaska teacher salaries and a rise in retirements. Another factor may have been the early retirement programs urban districts offered in an effort to reduce their operating expenses. The impact of these programs was less pronounced in 1999 and 2000. However, as Chart 6 shows, the trend has been toward fewer hires in recent years.

Retaining Quality Teachers for Alaska
16
Chart 6. Number of Teachers Hired in Alaska, 1996-2000
817
972
1,3301,386
1,335
1,065
0
200
400
600
800
1000
1200
1400
Tot
al H
ires
1995 1996 1997 1998 1999 2000Year
Source: Alaska Department of Education and Early Development, 2001
Teacher Demand in Urban and Rural Areas Given the high rural turnover rates we just reported, it is not surprising that
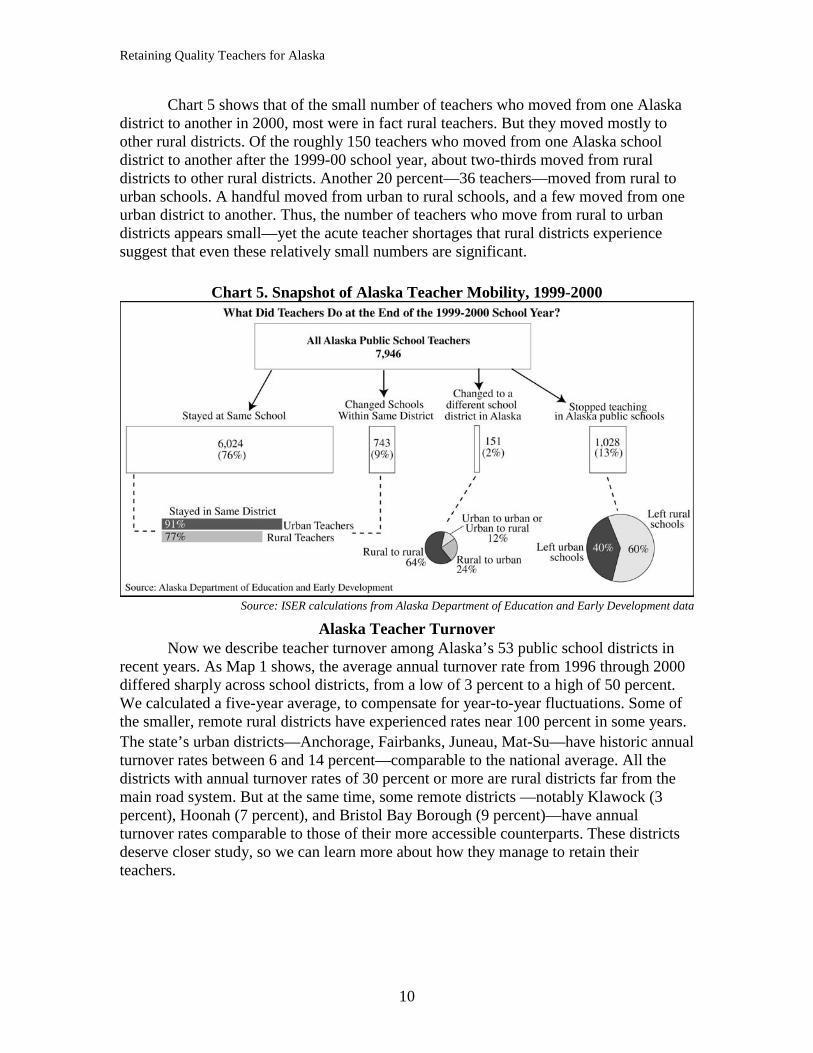
Alaska’s rural districts hire a disproportionately large share of new teachers. Chart 7 below shows the average annual number of new teachers that urban (with Anchorage shown separately) and rural districts hired from 1994-95 through 1999-2000.1 According to data from the Alaska Department of Education and Early Development, Alaska districts employed 8,206 full- and part-time teachers in 2001-02. Of these, 5,518—or 67 percent—worked for the five largest districts: Anchorage (2,836), Fairbanks North Star (911), Juneau (349), Kenai Peninsula (635), and Matanuska-Susitna (787). Yet these districts accounted, on average, for only 44 percent of the new teachers hired annually from 1994-1995 through 1999-2000. The remaining districts—mostly rural districts off the road system—employ only 32 percent of the full- and part-time teachers in the state but accounted for 56 percent of new hires during that period.
1 The definition of “urban” here is slightly different from the one ISER used in describing teacher turnover in the previous section. These figures are from Alaska Teacher Placement, which classifies as “urban” not only the four districts ISER included as urban but also a fifth district—the Kenai Peninsula. This shift does not change the urban-rural patterns discussed throughout this report.
Retaining Quality Teachers for Alaska
17
Chart 7. New Hires (Full-Time Equivalent), In Urban and Rural School Districts
(Annual Average, 1994-95 through 1999-2000)
274
175
581
Anchorage
Other Urban
Rural
Average Annual Turnover, 1994-95 through 1999-00 = 1,030
27%
56%
17%
Source: Alaska Teacher Placement, 2001
Demand by Specialization Charts 8 through 12 show average annual new hires by specialization among
Alaska’s urban and rural districts from 1994-95 through 1999-00. We have no reason to believe that the pattern of demand for specializations throughout the U.S. differs from that in Alaska. Chart 8 shows numbers of elementary teachers hired. On average, 297 (29 percent) of the annual average 1,030 hires were elementary teachers. Again, the number of new hires was disproportionately high in rural districts; on average, 62 percent of newly hired elementary teachers went to work for the smaller districts.
A similar pattern is evident in the hiring of secondary math and science teachers (charts 9 and 10). The school year 1997-98 presents an anomaly: that year, in the wake of an early retirement program, the Anchorage School District hired more math and science teachers than all the other districts in the state combined. But except for that unusual year, the pattern holds: rural districts annually hire a disproportionately large number of math and science teachers.
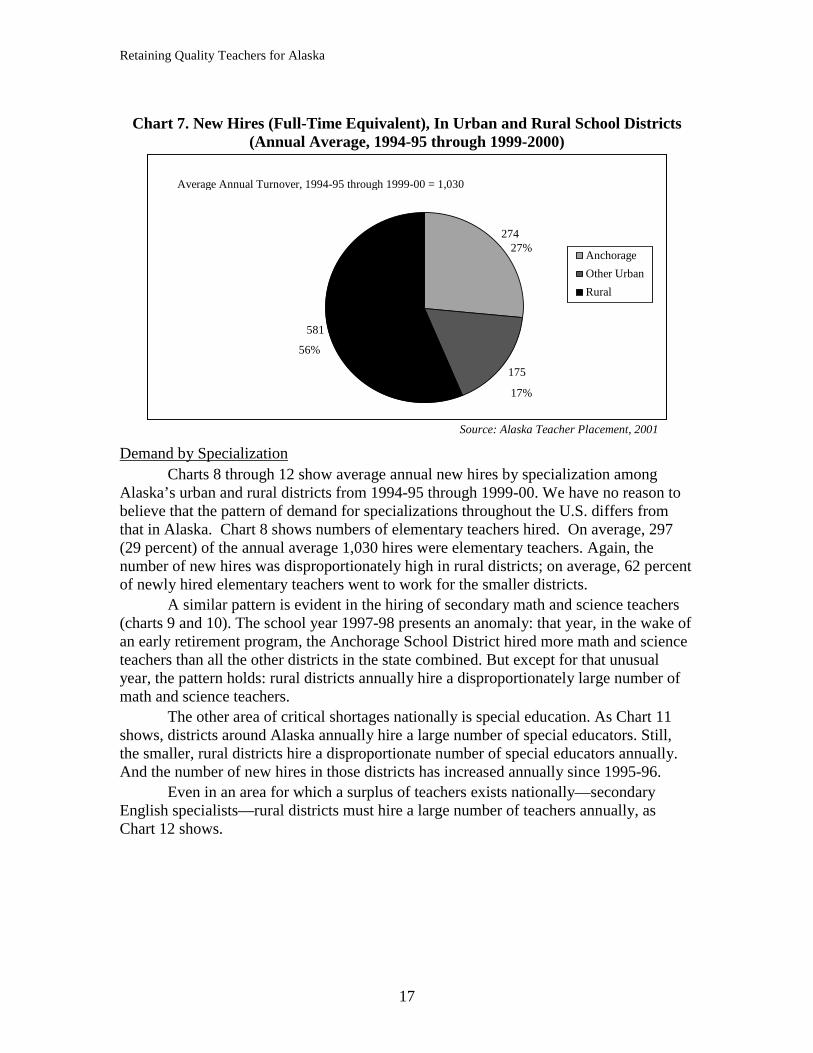
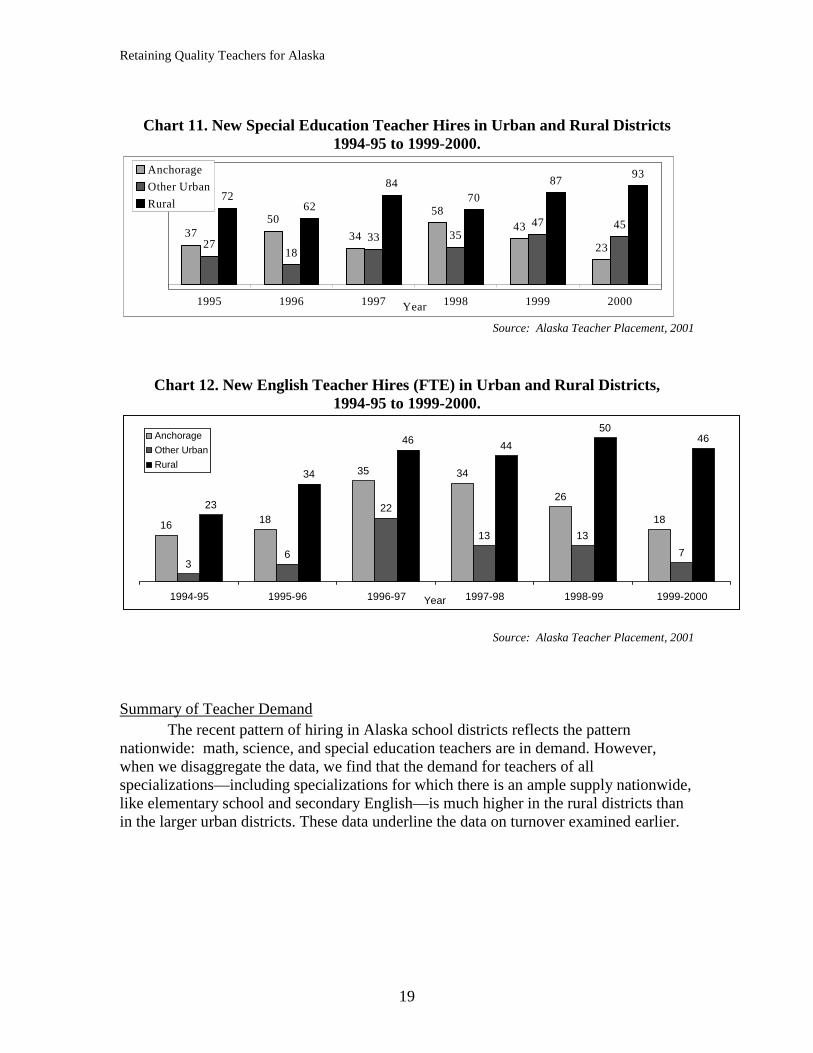
The other area of critical shortages nationally is special education. As Chart 11 shows, districts around Alaska annually hire a large number of special educators. Still, the smaller, rural districts hire a disproportionate number of special educators annually. And the number of new hires in those districts has increased annually since 1995-96.
Even in an area for which a surplus of teachers exists nationally—secondary English specialists—rural districts must hire a large number of teachers annually, as Chart 12 shows.

Retaining Quality Teachers for Alaska
18
Chart 8. New Elementary Teacher Hires (FTE) in Urban and Rural Districts, 1994-95 to 1999-2000
55 5271
111
7961
30 23
65
37
70
28
133 131
243
203226
162
1994-95 1995-96 1996-97 1997-98 1998-99 1999-2000Year
Anchorage
Other Urban
Rural
Source: Alaska Teacher Placement, 2001 Chart 9. New Math Teacher Hires (FTE) in Urban and Rural Districts
1994-95 to 1999-2000
6
16 15
34
12
77 7
16
8
15
9
1923
34
23
36
22
1994-95 1995-96 1996-97 1997-98 1998-99 1999-2000Year
AnchorageOther UrbanRural
Source: Alaska Teacher Placement, 2001
Chart 10. New Science Teacher Hires (FTE) in Urban and Rural Districts 1994-95 to 1999-2000.
9
17
9
35
1513
13
10
14
20
29
25
29
23
75
20
1994-95 1995-96 1996-97 1997-98 1998-99 1999-2000Year
AnchorageOther UrbanRural
Source: Alaska Teacher Placement, 2001
Retaining Quality Teachers for Alaska
19
Chart 11. New Special Education Teacher Hires in Urban and Rural Districts
1994-95 to 1999-2000.
3750
34
5843
232718
33 3547 45
7262
8470
8793
1995 1996 1997 1998 1999 2000Year
Anchorage
Other Urban
Rural
Source: Alaska Teacher Placement, 2001
Chart 12. New English Teacher Hires (FTE) in Urban and Rural Districts, 1994-95 to 1999-2000.
16 18
35 34
26
18
36
22
13 13
7
23
34
46 44
5046
1994-95 1995-96 1996-97 1997-98 1998-99 1999-2000Year
Anchorage
Other Urban
Rural
Source: Alaska Teacher Placement, 2001
Summary of Teacher Demand The recent pattern of hiring in Alaska school districts reflects the pattern
nationwide: math, science, and special education teachers are in demand. However, when we disaggregate the data, we find that the demand for teachers of all specializations—including specializations for which there is an ample supply nationwide, like elementary school and secondary English—is much higher in the rural districts than in the larger urban districts. These data underline the data on turnover examined earlier.

Retaining Quality Teachers for Alaska
20
III. SURVEY FINDINGS: WHY ALASKAN TEACHERS LEAVE THEIR JOBS
As we showed in the previous section, teachers in some Alaska districts and individual schools leave their jobs at high rates. If we are to reduce those high turnover rates—particularly in rural districts and schools—we need to understand more about the reasons why teachers leave. Some of those reasons are beyond the reach of policy. For instance, some teachers leave because they retire. Some are looking for new challenges in other professions. Similarly, teachers who move from one school to another often do so for reasons that policy cannot address—the desire to live in a particular location, the desire to have children attend particular schools, the need to be closer to specialized medical care, or the need to care for family members.
But other reasons that prompt teachers to leave their jobs are more amenable to policy instruments. For instance, the lack of strong and effective instructional leadership could be addressed by better training or incentives likely to attract people with the requisite skills, knowledge, and talent. The lack of professional growth and development opportunities could be addressed by providing the resources—human and fiscal—needed to offer such opportunities. Even a lack of communication between school professionals and parents and community members could be addressed through several mechanisms—for instance, through training and changes in organizational structures and procedures.
Consequently, if we are to craft policies that keep committed and effective teachers in our schools, we need to know why teachers leave their jobs. This is precisely what we set out to find with ISER’s 2001-2002 survey of exiting teachers.
We mailed 239 surveys to persons identified as teachers who had left their jobs in urban or rural districts at the end of the 2000-2001 school year. We had a 51 percent response rate from the urban surveys and a 59 percent response rate from the rural surveys. We had hoped for higher response rates—but nevertheless, these rates are high enough to produce useful results. Our response rates are also higher than the average for nationwide surveys of exiting teachers—who, after all, have little motivation to complete the surveys.
Research Methods
Questionnaire Before developing our survey, we did a thorough search of the Internet and print
sources for all exiting teacher surveys. In particular, survey instruments from the National Center for Education Statistics in the U.S. Department of Education served as valuable guides. We then developed our own survey, using items from other surveys that fit the Alaska context. We then asked district personnel directors and teachers to review the questionnaire, made revisions, and field-tested the revised questionnaire. (The questionnaire is online at http://www.iser.uaa.alaska.edu/).
Sampling Existing data demonstrated that hiring and retention issues differ significantly
between urban districts—defined here as those in or near Alaska’s large population centers—and rural districts, many of which are remote and far from the road system. So we stratified districts into urban (Anchorage, Fairbanks, Juneau, and Mat-Su Borough) and rural (all other districts).

Retaining Quality Teachers for Alaska
21
We further stratified rural districts by teacher turnover rates averaged across the years 1996-2000—low turnover (15 percent or less), medium turnover (16-29 percent), and high turnover (30 percent or more). We did this to increase the probability that all types of districts were equally represented in the final sample.
To design the sample, we first estimated the expected teacher turnover for each district, using the district’s total teachers in 2000-01 times its annual average turnover rate from 1995-1996 through 1999-2000. We calculated the sample size for each stratum to achieve the same level of precision for all. Table 3 shows the numbers of exiting teachers from each stratum, as well as sample sizes and response rates.
Table 3. Population and Sample Size for Teacher Exit Survey, 2001-02
Number of Exiting
Teachers, 2001
Number in Final
Sample
Number of Completed
Surveys Response
Rate Urban 431 77 39 51% Rural Total 583 162 96 59%
Low Turnover 134 60 40 67% Medium Turnover 338 57 33 58% High Turnover 111 45 23 51%
Total 1014 239 135 56%
Survey Process In December 2001, we mailed a survey to each respondent in our random sample
for whom we had a postal address, using names and addresses supplied by district personnel directors. A month later, we followed up this initial mailing with a letter. As the data came in, we entered it into a database and analyzed it using SPSS. To date, we have looked only at frequencies and urban/rural cross tabulations; we will carry out additional analyses later.
Response Rate A major problem with surveys of exiting teachers is that respondents have little
motivation to complete and return surveys. After all, they are on their way out. Some probably are leaving because they are dissatisfied with some aspects of their work life. This makes it even less likely that they will respond.
Although not as high as we had hoped, response rates for all our samples were over 50 percent. We mailed out 239 surveys. For the 77 teachers in our urban sample, we received 39 completed surveys, for a 51 percent response rate. This rate is above the average for such surveys. As noted above, we stratified rural districts by their historic teacher turnover rates. Of the 60 surveys sent to teachers exiting low-turnover rural districts, 40 (67 percent) were returned. Of the 57 surveys sent to teachers exiting medium-turnover districts, 33 (58 percent) were returned. Of the 45 surveys sent to teachers exiting high-turnover districts, 23 (52 percent) were returned. Thus, for our total rural sample of 162, we received completed surveys from 96 exiting teachers—or 59 percent.

Retaining Quality Teachers for Alaska
22
As much as we would like to follow up with a sample of non-respondents to learn why they did not respond, our only contact information for these exiting teachers is a postal address. Consequently, they are unlikely to respond to a request for additional information, having chosen not to respond to our first two contacts. We are also aware that some of the postal addresses we received were likely invalid. As a result, we do not know how many of the 43 percent who did not respond simply did not receive a survey. Again, these problems are typical in exit surveys.
Statistical Significance of Findings In the tables reporting our survey findings, we note which differences in
responses of urban and rural teachers are statistically significant—that is, which responses we can say with confidence reflect real differences between the two groups, rather than chance variation. Other responses that don’t meet the strict test of statistical significance can still help show patterns of difference among urban and rural teachers who left their jobs, when we have other information that supports the survey findings.
Characteristics of Exiting Teachers Most exiting teachers in our survey were women—75 percent of the urban
teachers and 62 percent of the rural teachers. The mean age of respondents was 43 for the urban teachers and 40 for rural teachers. Teachers leaving urban schools were significantly more likely to be married than those leaving rural schools—88 percent compared with 73 percent (Table 4). Both groups were predominantly white (100 percent of the urban and 97 percent of the rural). Three teachers who described themselves as Alaska Natives left their jobs at rural schools.
Teachers leaving rural schools were about twice as likely to be the primary wage-earners in their families as were those exiting urban schools (65 percent to 28 percent). These rural teachers were also likely to have more financial dependents than their urban counterparts had.
Table 4. Demographics of Exiting Teachers 2
Characteristic Urban (N=29) Rural (N=83) Female 77% 62% Mean Age 43 years 40 years Married 88% 65%*
*Significant at the 0.05 level Source: ISER survey of exiting teachers, 2001-02
2 The number of respondents reported in the tables showing survey results is a maximum of 112, rather than the 135 responses reported in Table 3. This is because 23 of the responses indicated that the respondent was not, in fact, an exiting teacher, but rather an exiting administrator or other staff member who was not a teacher.

Retaining Quality Teachers for Alaska
23
Plans for Following Year To learn more about the future plans of exiting teachers, we asked what their main
activity would be in the year after they left their jobs (Table 5). We found that many of both the urban and the rural exiting teachers planned to continue teaching in a new setting—but the proportion was much higher among rural teachers (53 percent) than among urban teachers (24 percent). Conversely, a much bigger share of the exiting urban teachers (37 percent) than of the rural teachers (10 percent) planned to retire.
Table 5. Main Activity for the Coming Year Among Teachers Who Left Their Jobs,
2000-2001 (Percentage Citing Activity) Urban Teachers
N=29 Rural Teachers
N=83 Following Year Activities
Teaching K-12 24% 53% Retiring 37% 10% Working outside education 15% 12% Caring for family members 10% 6% Other activity 0 9% College student 7% 0 Non-teaching work in education 2% 3% Unemployed/seeking work 0 4% Missing 2% 3% Don't know 2% 0 Total 100%* 100%*
*May total more than 100 % due to rounding. Source: ISER survey of exiting teachers, 2001-02
When asked if they planned to continue living in the communities where they had
been teaching, 35 percent of exiting urban teachers intended to stay put, compared with only 20 percent of rural teachers. This finding is consistent with the historical pattern of rural schools, staffed largely by teachers who are recruited from outside the community and who move when they leave their jobs. Interestingly, 67 percent of exiting rural teachers who said they planned to leave the communities where they had been teaching still planned to stay in Alaska.
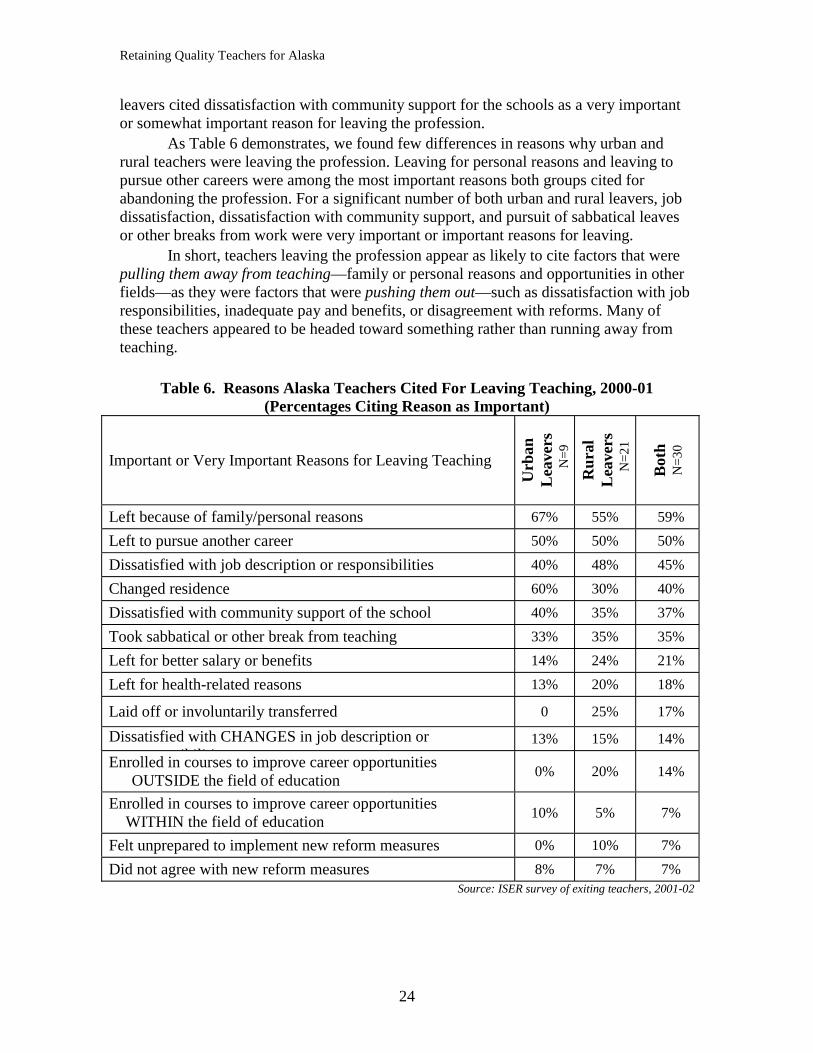
Why Alaskan Teachers Left the Profession Thirty teachers in our sample said they were leaving the profession entirely.
Nearly 60 percent identified “family or personal reasons” as important reasons they were leaving (Table 6). Responses of urban and rural teachers were not significantly different. Similarly, half of both urban and rural leavers reported that pursuing another career was a somewhat or very important reason for leaving the profession. Surprisingly, only 21 percent indicated that the opportunity for better pay and benefits was somewhat or very important in their decision to leave teaching.
Among those leaving the teaching profession, 40 percent of urban leavers and 48 percent of rural leavers cited dissatisfaction with the job of teaching as an important factor in their decision to leave. About 40 percent of urban leavers and 35 percent of rural
Retaining Quality Teachers for Alaska
24
leavers cited dissatisfaction with community support for the schools as a very important or somewhat important reason for leaving the profession.
As Table 6 demonstrates, we found few differences in reasons why urban and rural teachers were leaving the profession. Leaving for personal reasons and leaving to pursue other careers were among the most important reasons both groups cited for abandoning the profession. For a significant number of both urban and rural leavers, job dissatisfaction, dissatisfaction with community support, and pursuit of sabbatical leaves or other breaks from work were very important or important reasons for leaving.
In short, teachers leaving the profession appear as likely to cite factors that were pulling them away from teaching—family or personal reasons and opportunities in other fields—as they were factors that were pushing them out—such as dissatisfaction with job responsibilities, inadequate pay and benefits, or disagreement with reforms. Many of these teachers appeared to be headed toward something rather than running away from teaching.
Table 6. Reasons Alaska Teachers Cited For Leaving Teaching, 2000-01
(Percentages Citing Reason as Important)
Important or Very Important Reasons for Leaving Teaching
Urb
an
Lea
vers
N
=9
Rur
al
Lea
vers
N
=21
Bot
h N
=30
Left because of family/personal reasons 67% 55% 59%
Left to pursue another career 50% 50% 50%
Dissatisfied with job description or responsibilities 40% 48% 45%
Changed residence 60% 30% 40%
Dissatisfied with community support of the school 40% 35% 37%
Took sabbatical or other break from teaching 33% 35% 35%
Left for better salary or benefits 14% 24% 21%
Left for health-related reasons 13% 20% 18%
Laid off or involuntarily transferred 0 25% 17%
Dissatisfied with CHANGES in job description or responsibilities
13% 15% 14%
Enrolled in courses to improve career opportunities OUTSIDE the field of education
0% 20% 14%
Enrolled in courses to improve career opportunities WITHIN the field of education
10% 5% 7%
Felt unprepared to implement new reform measures 0% 10% 7%
Did not agree with new reform measures 8% 7% 7% Source: ISER survey of exiting teachers, 2001-02

Retaining Quality Teachers for Alaska
25
Why Alaskan Teachers Moved to New Districts A second group of 57 exiting teachers were moving from a teaching position in
one district to a position in another district. In addition to asking them why they were moving, we also asked for information about their new positions, since most of them (88 percent) knew what and where they would be teaching the following year (Table 7).
Most teachers in this group were moving to jobs similar to the ones they were leaving. Among teachers leaving their positions at urban schools, 90 percent were pursuing the same teaching specialization. Similarly, 66 percent of teachers moving from rural schools would be teaching the same subjects and age groups in new districts.
Table 7. Description of Alaskan Teachers Moving to Other Districts, 2000-01
Percentages answering “yes” to statement
Urb
an M
over
s (N
=17)
Rur
al M
over
s (N
=38)
Bot
h (
N=5
5)
Know next year’s teaching assignment 91% 87% 88%
Specialization will be the same 90% 66% 71%
Earnings will be more 40% 25% 29%
Position described realistically 100% 65% 74%* *Differences significant at p < .05. Source: ISER survey of exiting teachers, 2001-02
Apparently, most teachers are not leaving to earn more elsewhere. Only 40 percent of urban teachers and 25 percent of their rural counterparts reported they would be earning more in their new positions than in their old.
We had heard anecdotal accounts from some rural teachers, saying that the jobs they took hadn’t been accurately described to them at the time they signed on. So we also asked teachers who were moving to new districts whether the positions they were leaving had been accurately described to them before they took the jobs. Whereas all of the urban teachers who were changing districts reported that their jobs had been described realistically beforehand, only 65 percent of teachers moving from rural schools reported that to be true—a difference that was statistically significant.
Reasons Rural and Urban Teachers Cited as Important for Moving to New Districts Many teachers moving from both urban and rural districts cited similar reasons
for moving (Table 8). Most—all urban teachers and 73 percent of rural—reported that personal or family reasons were somewhat or very important reasons for their decision to move. Most teachers (63 percent) in both settings cited wanting to live in a new place as an important reason for moving. Similarly, the desire to teach in a different community was important to a little more than half the teachers who were moving to new districts.
Asked how well-supported they had felt in the jobs they were leaving, substantial proportions of the movers expressed dissatisfaction. Thirty-six percent of urban movers and 57 percent of rural movers cited dissatisfaction with support the school received from the community as an important reason for leaving. Similarly, 64 percent of urban movers and 60 percent of their rural counterparts cited dissatisfaction with support from their

Retaining Quality Teachers for Alaska
26
district administrators as a prime reason for moving on. Finally, 36 percent of urban movers and 47 percent of rural movers were dissatisfied with the support they received from the school board. Clearly, almost half the teachers—both rural and urban—moving to new teaching jobs felt they had received inadequate support from the community, the district office, and the school board. Substantial minorities (36 percent of urban and 38 percent of rural teachers) also cited dissatisfaction with professional development opportunities as an important reason for moving. About one in four movers overall—9 percent of urban but 27 percent of rural—cited lack of colleague support as an important reason for moving, and similar numbers cited changes in their job responsibilities. None of these differences in responses of urban and rural movers were statistically significant.
Living conditions were also important in teachers’ decisions to move to new jobs. The desire for more affordable housing was important to 64 percent of urban and 41 percent of rural movers, while 38 percent of rural and 36 percent of urban teachers cited the desire for better housing as an important factor in their decision to move.
Table 8. Reasons for Moving from One District to Another, 2000-01
(Percentages of Teachers Citing Reason as Important) Urban Movers
(N=17) Rural Movers
(N=38) Both
(N=55)
Reason for moving: Percent Percent Percent Personal or family reasons 100% 73% 80%* To reside elsewhere 50% 67% 63% Dissatisfied with district administrative support 64% 60% 61% To teach in other district or community 36% 57% 52% Dissatisfied with community support of school
36% 56% 51%
Dissatisfied with school board support 36% 47% 45% To have more affordable housing 64% 41 46% To have better housing 36% 38% 38% For better professional development opportunities
36% 38% 38%
For better shopping 36% 28% 30% For cultural events 9% 35% 29% Because job description or responsibilities changed
9% 32% 27%
Because colleague support unsatisfactory 9% 27% 23% For better salary or benefits 50% 14% 22%** For better medical care 0 30% 22%* For health-related reasons 9% 24% 21% Dissatisfied with education for movers’ children
0 25% 20%
Dissatisfied with job description or responsibilities
0 22% 17%
Because not prepared to enact reforms 0 19% 14% Because disagreed with reforms 9% 14% 13% Because laid-off or transferred 0 11% 8% To enroll in other career courses 9% 5% 6%
* Difference significant at <.05 level ** Significant at the <.01 level Source: ISER survey of exiting teachers, 2001-02

Retaining Quality Teachers for Alaska
27
Although one might expect that improved access to amenities would be a more important reason for rural teachers to move, our survey found no statistically significant difference in the importance urban and rural movers placed on access to amenities. Nine percent of urban and 35 percent of rural movers wanted access to different cultural events than those available in their previous school districts, and 36 percent of urban and 28 percent of rural movers wanted access to better shopping.
Some reasons for changing districts were important to relatively few urban or rural teachers—such reasons as being laid off or involuntarily transferred; enrolling in courses to improve career opportunities outside education; being dissatisfied with changes in the job description or responsibilities; feeling unprepared to implement new reforms; and disagreeing with new reform measures.
Areas of Disagreement Between Urban and Rural Movers Still, despite similarities in some reasons urban and rural movers cited for moving
to new districts, several differences are apparent, as Table 8 also shows. Most teachers move at least partly for reasons that may not be directly related to
their jobs—80 percent cited personal or family reasons. Another important non-professional reason why rural teachers move is for access to better education for their children: 28 percent of rural movers cited that as a reason, but no urban movers did. This difference does not, however, reach the threshold of statistical significance.
The relative lack of access to high-level medical care in rural Alaska is reflected in the fact that more than 24 percent of the rural movers cited health-related reasons as important in their decision to change districts, as compared with only 9 percent of urban movers. This difference was even more pronounced when we asked about access to better medical care as a reason for moving: 30 percent of rural movers cited this as an important reason for leaving their districts, but none of the urban teachers did—a difference that is statistically significant.
Only 14 percent of the rural movers cited wanting a better salary or benefits as an important reason for moving, while half of urban movers rated that as an important reason for moving on—a statistically significant difference. While rural teachers who moved to find better salary and benefits went to a variety of districts, all of the urban movers in our survey who were seeking better salary and benefits left the state.
Looking at teaching conditions as an incentive for changing districts, we found that a much greater proportion of rural teachers (27 percent) than of urban teachers (9 percent) reported dissatisfaction with support from colleagues as an important reason they were changing districts. Nearly a third of the rural movers reported dissatisfaction with changing job descriptions or responsibilities as an important reason for leaving—a reason judged important by only 9 percent of the urban movers.
In short, many teachers appear to be moving on to new districts because of an apparent desire to live elsewhere and for reasons related to their personal lives, families, and health. But many, especially those in rural schools, are also unhappy with their working conditions. They feel they are not getting the support they need—from district administrators, colleagues, school boards, or communities. Similarly, many urban movers also feel they are not getting the community or district support they need, and they share with their rural counterparts dissatisfaction with professional development opportunities.

Retaining Quality Teachers for Alaska
28
Why Alaskan Teachers Retired A third group of exiting teachers retired. This was a relatively small sample (21
teachers), and the differences between rural and urban retirees are not meaningful, so we report only the total. As Table 9 shows, most of the teachers (62 percent) were retiring because they became eligible for their full pension benefits. However, half the retirees also cited as somewhat important or very important their dissatisfaction with teaching as a profession. This dissatisfaction is also reflected in the 57 percent who cited their job descriptions or responsibilities as important reasons for retiring, and the 52 percent who identified changes in the job description or responsibilities as important reasons. Not all these changes appear related to recent reforms: only 26 percent of retirees rated the advent of the reforms as an important reason to retire. Clearly, more than half (58 percent) were also retiring because of personal or family reasons.
In short, many of those who retired appeared ready—not just because they were eligible for their pensions, but because they were dissatisfied with the job itself.
Table 9. Reasons Teachers Retired, 2000-01 (Percentages of Retiring Teachers Citing Reason As Important)
Somewhat or Very Important Reasons for Retiring from Teaching
Urb
an a
nd
Rur
al T
each
ers
(N=2
1)
Became eligible to receive full pension benefits 62%
Retired for other family or personal reasons 58%
Dissatisfied with job description or responsibilities 57%
Dissatisfied with CHANGES in job description or responsibilities 52%
Dissatisfied with teaching as a career 52%
Did not agree with new reform measures 26%
Did not feel prepared to implement new reform measures 14%
Became eligible to accept early retirement incentive 9%
Wanted to teach in a different state but my state teacher certification was not accepted there
0
Source: ISER survey of exiting teachers, 2001-02

Retaining Quality Teachers for Alaska
29
Job Satisfaction and Working Conditions We asked all exiting teachers—including those who quit teaching, retired, or
moved to new districts—two direct questions about their satisfaction with teaching and also asked them the extent to which they agreed or disagreed with a series of 30 statements about the conditions under which they worked before leaving. Finally, we asked another series of 10 questions about leadership at the schools teachers had left. These questions were motivated by what we have learned in recent years about the relationship between school leadership and teacher success (as measured by student assessment scores) and retention (see, for instance, Kelley, 1998 and Ingersoll, 2001).
Overall Satisfaction of Exiting Teachers We asked teachers whether they were satisfied with their teaching before they left
their jobs. Among exiting teachers, 56 percent of those leaving urban schools and 55 percent of those leaving rural schools expressed satisfaction. When we asked exiting teachers to compare their final year at the schools they had left with their prior years of teaching, 53 percent of urban teachers reported they were at least as satisfied with their teaching as they had been in prior years, but only 42 percent of teachers leaving rural schools expressed a comparable level of satisfaction.
As we would expect, teachers’ reported satisfaction differed among those who were retiring, leaving teaching, or moving to another district. Only 30 to 35 percent of rural and urban teachers leaving the profession were satisfied with their previous year of teaching—either overall or in comparison with earlier years of teaching.
Again, as we would expect, more teachers who were moving to other districts (rather than leaving the profession) were satisfied with their previous year—just over 50 percent. However, there was a significant difference in responses of urban and rural teachers changing districts: 91 percent of urban movers but only 39 percent of rural movers were satisfied with their previous year of teaching, in comparison with earlier years. This finding suggests a higher level of dissatisfaction with teaching among teachers leaving rural schools than among those leaving urban schools.
Exiting Teachers’ Satisfaction with Specific Working Conditions To understand more about exiting teachers’ satisfaction with their jobs and their
profession, we asked them to respond to a series of statements, indicating whether they agreed or disagreed with each statement. Some of the statements were positive, and agreement indicated satisfaction. Other statements were negative, so that agreement indicated dissatisfaction with some aspect of their jobs. In Table 10, the positive statements are in regular typeface, and the negative statements are in italics. All responses show the percentage of teachers agreeing with a statement, whether it was positive or negative. Asterisks indicate differences that are statistically significant in responses of urban and rural teachers.

Retaining Quality Teachers for Alaska
30
Table 10. Exiting Teachers’ Satisfaction with Their Jobs and Teaching Profession: Areas where a majority of both Urban and Rural Teachers were Satisfied
Statements about Teaching Conditions
Urb
an
Tea
cher
s N
=29
Rur
al
Tea
cher
s N
=83
Bot
h N
=112
Areas of High Satisfaction I was satisfied with the grades I was assigned to teach. 93% 88% 90% The school was located in a safe neighborhood. 86% 81% 83% I felt safe at the school. 84% 83% 83% The school’s security policies and practices were sufficient. 77% 64% 69% The school emphasized academic success. 84% 75% 79% The professional caliber of the faculty at the school was high. 79% 77% 78% I was satisfied with the level of job security at the school (e.g., low possibility of being laid off).
79% 73% 75%
I was satisfied with the policies and practices for assigning students to classes or sections for instruction.
65% 68% 67%
The procedures for teacher performance evaluation were satisfactory.
77% 62% 68%
Workplace Planning and Administration I did not have enough influence over the school's policies and practices.
39% 36% 37%
I did not have enough influence over the curriculum I taught. 21% 20% 21% The school administrators’ behavior toward the staff was supportive and encouraging.
68% 59% 63%
District administrators’ behavior toward the staff was supportive and encouraging.
58% 55% 56%
Professional Development I was pleased with the opportunities for professional growth and development that the school offered to teachers.
63% 55% 58%
There were many opportunities to collaborate with other teachers in the school.
49% 68% 60%*
Required professional development activities at the school usually closely matched my professional development goals.
31% 32% 32%
Workload I often felt that my teaching workload was too heavy. 65% 48% 55% Mainstreaming special needs students in regular classes made it difficult for me to teach.
56% 46% 50%
Some of the classes or sections I taught were too large. 65% 29% 43%** Time available for planning and preparation was insufficient. 70% 64% 66% There was not enough uninterrupted class time available for instruction.
42% 33% 37%

Retaining Quality Teachers for Alaska
31
Table 10, continued Statements about Teaching Conditions
Urb
an
Tea
cher
s N
=29
Rur
al
Tea
cher
s N
=83
Bot
h N
=112
Resources I was satisfied with my salary and benefits 56% 75% 68%* Resources and materials/equipment for my classrooms were sufficiently available.
56% 78% 69%*
Computers and other technology for my classrooms were sufficiently available.
37% 81% 64%**
The school facility (buildings and grounds) was in need of significant repair.
37% 45% 42%
Student, Parent and Community Attitudes Student behavior was a problem. 63% 61% 62% Most of the students in the school were motivated to learn. 65% 43% 51%* I received little support from parents. 43% 67% 58%* The school received little support from the community. 30% 45% 39%
*Difference significant at the <0.05 level **Difference significant at <0.01 level Source: ISER survey of exiting teachers, 2001-02
A surprisingly high proportion of teachers leaving both urban and rural schools were satisfied with many of the conditions in the schools they were leaving. Over 90 percent were satisfied with the grade level they taught. Contrary to some public perceptions—influenced perhaps by recent events in Kivalina—most rural teachers (83 percent) and their urban counterparts (84 percent) felt safe in their schools. Most (81 percent of rural and 86 percent of urban) also believed the neighborhoods where they taught were safe. And most (64 percent of rural teachers and 77 percent of urban) felt that their school’s security policies were sufficient.
Although more urban than rural teachers agreed that their school emphasized academics (84 percent compared with 75 percent), a sizeable majority of both groups agreed that academic success was emphasized. Most urban and rural teachers also thought that the professional caliber of the faculty at their schools was high.
Most exiting teachers (79 percent of urban and 73 percent of rural) were satisfied with the level of job security they had. Nearly as many (65 percent of urban teachers and 68 percent of rural teachers) were satisfied with the policies and practices for assigning students to classes or sections for instruction. The majority—77 percent of urban teachers and 62 percent of rural teachers—were also satisfied with teacher evaluation procedures at their schools.
Most teachers in both settings felt they had sufficient control over their work place. Only about 20 percent of both groups felt they did not have enough influence over the curriculum they taught. However, substantial minorities of both groups felt they did not have sufficient influence over their school’s policies and practices (39 percent of urban and 36 percent of rural exiting teachers).
Most of the exiting teachers agreed that school administrators had supported and encouraged them, although the percentage agreeing was higher among urban (68 percent) than among rural teachers (59 percent). Both groups were slightly less satisfied with the

Retaining Quality Teachers for Alaska
32
level of support from central district administrators – 58 percent of urban and 55 percent of rural exiting teachers.
Over half of both groups (63 percent of urban and 55 percent of rural exiting teachers) were pleased with the opportunities available to them for professional growth and development. However, rural teachers were much more likely to be satisfied with their opportunities to collaborate with colleagues. Just under half (49 percent) of urban teachers agreed that there were many opportunities to collaborate with their colleagues, compared with 68 percent of rural teachers—a statistically significant difference. And both groups were much less satisfied with required professional development activities. Less than one-third agreed that the required professional development in which they participated met their needs.
On the issue of workload, 65 percent of urban and 48 percent of rural teachers agreed that their workloads were too heavy. Around half—56 percent of urban and 46 percent of rural teachers—felt mainstreaming special-needs students into their regular classes made teaching difficult. As one might expect, when asked about class size, exiting urban teachers were significantly more like to agree that their classes were too large (65 percent) than were teachers in rural schools (29 percent). Many rural schools are so small that class size is not an issue.
Along with their workload concerns, most exiting teachers felt time pressures. The majority of both groups of teachers (66 percent of the combined sample) felt that there was insufficient time available for planning and preparation. A substantial minority (42 percent of urban and 33 percent of rural teachers) was also dissatisfied with the class time available for instruction.
Three out of four exiting rural teachers were satisfied with their salary and benefits; however, significantly fewer urban teachers (56 percent) were satisfied.
Availability of instructional materials and resources and of computers and other technology does not appear to have been a problem for exiting rural teachers: 78 percent agreed adequate resources were available, and 81 percent agreed that enough computers were available. However, exiting urban teachers were significantly less likely to agree: only 56 percent of urban teachers agreed adequate resources and materials were available and just 37 percent agreed that enough computers were available.
Somewhat more exiting rural teachers (45 percent) than urban teachers (37 percent) thought their school facilities needed repair—a result not surprising to those familiar with the conditions in many rural schools, but a difference that is not statistically significant.
Although student behavior is no more of a problem for rural than for urban teachers, a majority—62 percent—of the exiting teachers in both areas agreed that student behavior was in fact a problem. However, on the question of student motivation, we found a large and statistically significant difference: 65 percent of the urban teachers agreed that most students in their school were motivated to learn, but only 43 percent of the rural teachers believed their students were motivated.
Similarly, when we asked about parental support, significantly more exiting rural teachers (67 percent) than urban teachers (43 percent) reported feeling that they had received “little support from families.” When we asked about community support, we received similar (but not statistically significant) responses: 45 percent of rural teachers

Retaining Quality Teachers for Alaska
33
felt they received little community support, while only 30 percent of urban teachers cited such lack of support.
Summary: Teachers’ Feelings About Working Conditions In Schools They Left Many teachers from both urban and rural schools were surprisingly positive about
a number of aspects of the schools they were leaving. Clear majorities (60 percent) of teachers leaving both rural and urban schools felt satisfied with:
• Safety at their schools • Teaching assignments • The school’s emphasis on academic success • The professional caliber of the faculty • Job security • Student assignment policy • Procedures for teacher performance evaluations • Influence on school policy and curriculum
In other areas, teacher satisfaction was less clear—that is, while more than half of all teachers were still satisfied with the conditions listed below, that satisfaction wasn’t as pronounced. Either rural or urban exiting teachers or both were closer to being split, with less than 60 percent satisfied, with:
• Salary and benefits
• Opportunities for professional development
• Support from school and district administrators
• Mainstreaming special needs students
• Workload
• Availability of uninterrupted instructional time And majorities from both urban and rural schools were clearly dissatisfied with other conditions at the schools they had left:
• Time for planning and preparation • The match between required professional development activities and teachers’
professional development goals • Student behavior
Exiting urban and rural teachers disagreed about some conditions. Teachers leaving rural schools were significantly more likely to be dissatisfied with:
• Student motivation • Parental support
Teachers leaving urban schools were significantly more likely to be dissatisfied with: • Availability of computers and other instructional resources • Class size • Salary • Opportunities to collaborate with colleagues

Retaining Quality Teachers for Alaska
34
In short, exiting rural and urban teachers were dissatisfied with different aspects of their working conditions, and those differences have, of course, different policy implications. Exiting rural teachers were significantly more likely to be dissatisfied with their students’ motivation and effort and lack of support from parents. Exiting urban teachers were more likely to be dissatisfied with the work environment—instructional resources, class size, and salaries—provided by their districts. And interestingly, dissatisfaction was higher about instructional resources and class size than about salaries.
These results support findings of national studies (see Ingersoll, 2001 and Kardos, 2001), which emphasize the role working conditions—rather than primarily salary and benefits—play in influencing teachers’ decisions about staying or leaving.
Exiting Teachers’ Satisfaction with Instructional Leadership As noted above, we asked our sample of exiting teachers about leadership at the
schools they had just left. We hypothesized that the absence of effective leadership might be a primary reason why teachers decided to leave their schools.
But what we found does not seem to bear this hypothesis out. As Table 11 shows, most teachers from both urban and rural schools were satisfied with the effectiveness of the leadership at the schools they were leaving. Differences about a few measures of leadership emerged, with smaller proportions of rural teachers expressing satisfaction— but even in those areas, the majority of rural teachers rated their leaders as effective.
The first question we asked was about the school principal’s role in instructional leadership. About two thirds of teachers leaving both urban and rural schools reported that the principal took responsibility for such leadership. The next most frequently cited leaders were other teachers—including department chairs and the respondents themselves—identified by 28 percent of urban teachers and 25 percent of rural teachers. Ten percent of urban teachers and 8 percent of rural teachers reported that other administrative personnel (assistant principals or directors of curriculum or instruction) provided leadership. A few teachers in both groups reported that no one was responsible for leadership at their schools.
More than 80 percent of urban teachers and 70 percent of rural teachers rated their leaders as somewhat or very effective in encouraging them to change their methods if students weren’t learning, and in working with them to develop and attain curriculum standards. Almost as many teachers (72 percent overall) rated leaders as effective in communicating respect and the value of teachers and in encouraging professional collaboration among teachers (70 percent overall).
Significant differences between responses of urban and rural teachers emerged on two leadership issues. Almost all urban teachers (89 percent), but only 66 percent of rural teachers rated their leaders as effective at communicating with parents. And 85 percent of urban teachers but only 61 percent of rural teachers said their leaders effectively facilitated and encouraged professional development.
Another dimension of leadership teachers rated somewhat lower was “working with teaching staff to solve school or department problems.” Only 69 percent of the urban and 60 percent of the rural teachers agreed that their leaders engaged in such collaborative problem-solving. Differences in responses of urban and rural teachers were even smaller on the question of using student evaluation data in planning curriculum and instruction. In that area, 58 percent of urban teachers and 62 percent of rural teachers

Retaining Quality Teachers for Alaska
35
reported effective leadership. On developing broad agreement on the school’s mission, half of urban and 61 percent of rural teachers agreed that their leaders were effective.
Table 11. Exiting Teachers’ Evaluation of Effectiveness of School Leadership
(Percentages Who Rated Leader as Effective) Effectiveness of Instructional Leader Urban
N=26 Rural N=79
Both N=105
Encouraging teachers to change teaching methods if students were not doing well
81% 75% 77%
Working with staff to develop and attain curriculum standards 85% 72% 77% Communicating with parents 89% 66% 75%* Communicating respect and value of teachers 78% 68% 72% Facilitating and encouraging teachers’ professional development 85% 61% 71%* Encouraging professional collaboration among teachers 70% 70% 70% Working with teaching staff to solve school or department problems
69% 60% 64%
Encouraging the teaching staff to use student evaluation results in planning curriculum and instruction
67% 58% 63%
Developing broad agreement among the teaching staff about the school’s or department's mission
50% 61% 56%
• Difference significant at <.05 level Source: ISER survey of exiting teachers, 2001-02
In sum, while majorities of both urban and rural exiting teachers reported that
leadership in their schools was effective under many measures, significantly more rural teachers found leaders in their schools ineffective in professional development and in communication with parents.

Retaining Quality Teachers for Alaska
36
IV. TEACHER SUPPLY: PRODUCING TEACHERS IN ALASKA Most of those who teach in Alaska are prepared elsewhere. Nonetheless, the
roughly 30 percent of Alaska teachers who are prepared at colleges and universities in the state represent a substantial share of the teaching force. So policymakers and university administrators have responded to teacher shortages in some schools by trying to produce more teachers. In 2001, the University of Alaska’s board of regents decided to revive the four-year bachelor of education degree. But just five years earlier, the regents— concerned about the quality of teachers graduating from UA—had voted to phase out the four-year program and move teacher preparation to the graduate level.
That brief history is critical to understanding the data presented below. The recent dip in teacher production at the University of Alaska has been due largely to the policy change that occurred in 1996 and began to have effects in 1997.
Research Methods Our efforts to collect accurate information about the number of teachers
graduating from Alaska’s institutions of higher education were made difficult by the proliferation of education programs and by the fact that teacher candidates, enrolled in programs, may take more than the expected time to complete their course work. Thus, we focused on graduates rather than on the number of candidates enrolled.
Dr. Shirley Holloway, Alaska’s Commissioner of Education, contracted with Dr. Jerry Covey—a former commissioner—to gather data on teacher program graduates in preparation for the Governor’s Summit on Teacher Education, held in Anchorage in October 2001. To avoid duplication of effort and the resulting imposition on educators, we asked Dr. Covey to verify the data he collected for the summit. He provided a final report in December 2001, and we used his data on teacher education program graduates.
Elementary Education Graduates As Chart 13 shows, the number of elementary teachers graduating from the University of Alaska declined after 1998 on the Anchorage and Fairbanks campuses, the major producers of teachers in the state. After two years of higher-than-average numbers of graduates, the Southeast campus returned to its lower pre-1998 level of graduation. Overall, the number of elementary education graduates from UA declined by about one third between 1997-98 and 2000-01, dropping from 246 to 164.
One interpretation of this decline is that some potential elementary candidates may have been deterred by the prospect of having to pursue an undergraduate bachelor degree before entering a program to earn their teaching certificate—the change UA instituted in 1996, as described above. Some potential candidates might have found the additional year of study economically challenging, including not only another year of tuition costs but also the opportunity cost of being out of the labor force for an additional year. Some might have also found the prospect of pursuing a degree in a discipline rather than in education either irrelevant to teaching or academically intimidating.
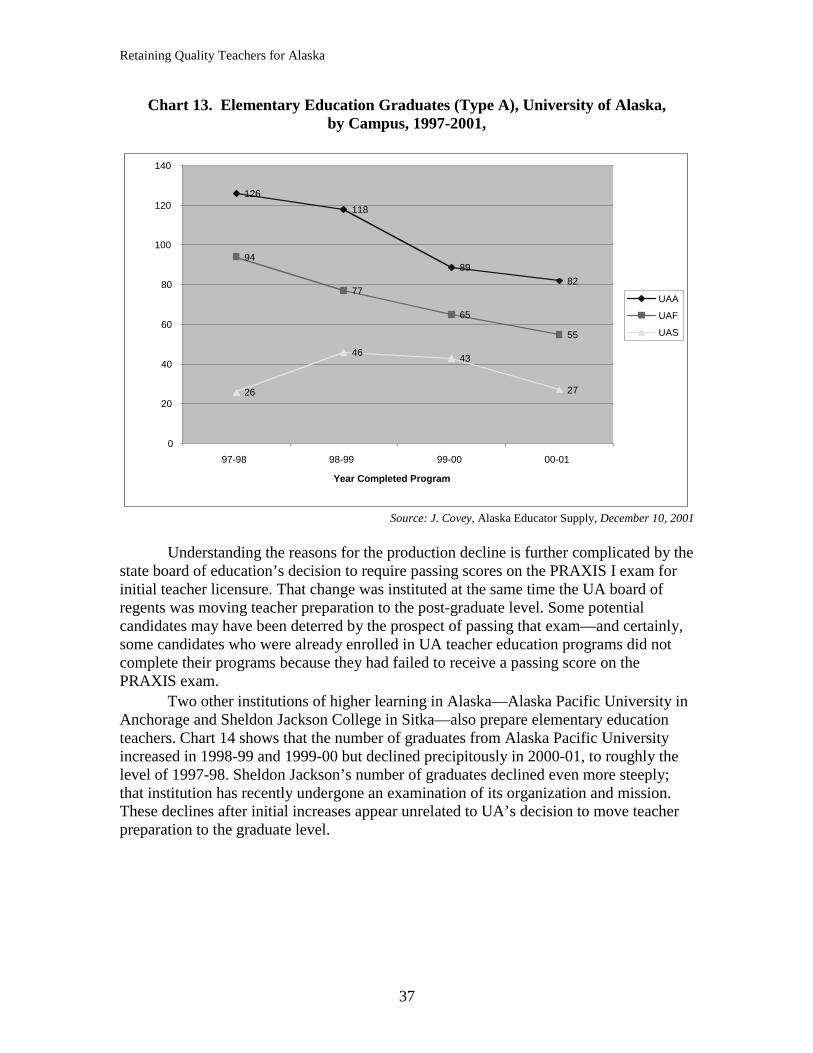
Retaining Quality Teachers for Alaska
37
Chart 13. Elementary Education Graduates (Type A), University of Alaska, by Campus, 1997-2001,
126
118
8982
94
77
65
55
26
4643
27
0
20
40
60
80
100
120
140
97-98 98-99 99-00 00-01
Year Completed Program
UAA
UAF
UAS
Source: J. Covey, Alaska Educator Supply, December 10, 2001
Understanding the reasons for the production decline is further complicated by the
state board of education’s decision to require passing scores on the PRAXIS I exam for initial teacher licensure. That change was instituted at the same time the UA board of regents was moving teacher preparation to the post-graduate level. Some potential candidates may have been deterred by the prospect of passing that exam—and certainly, some candidates who were already enrolled in UA teacher education programs did not complete their programs because they had failed to receive a passing score on the PRAXIS exam.
Two other institutions of higher learning in Alaska—Alaska Pacific University in Anchorage and Sheldon Jackson College in Sitka—also prepare elementary education teachers. Chart 14 shows that the number of graduates from Alaska Pacific University increased in 1998-99 and 1999-00 but declined precipitously in 2000-01, to roughly the level of 1997-98. Sheldon Jackson’s number of graduates declined even more steeply; that institution has recently undergone an examination of its organization and mission. These declines after initial increases appear unrelated to UA’s decision to move teacher preparation to the graduate level.

Retaining Quality Teachers for Alaska
38
Chart 14. Elementary Education Graduates (Type A) From Other Alaska Institutions of Higher Learning, 1997-2001
17
21
31
18
65
10
10
5
10
15
20
25
30
35
1997-98 1998-99 1999-00 2000-01
Year Completed Program
Alaska PacificUniversity
Sheldon JacksonCollege
Sources: J. Covey, Alaska Educator Supply, December 10, 2001
Finally, Chart 15 captures the primary story line: Production of elementary teachers in Alaska has declined significantly over the past four years. But at the same time, few school districts are reporting shortages of elementary classroom teachers, despite these declines. As we noted at the outset, the northwest region of the U.S. currently appears to have a surplus of elementary teachers.

Retaining Quality Teachers for Alaska
39
Chart 15. Elementary Education Graduates (Type A), from All Alaska Institutions
of Higher Education and from the University of Alaska, 1997-2001
269 267
238
183
246 241
197
164
0
50
100
150
200
250
300
1997-98 1998-99 1999-00 2000-01
Year Completed Program
All Alaskan IHEs
University of Alaska
Source: J. Covey, Alaska Educator Supply, December 10, 2001
Secondary Education Graduates As we noted above, Alaska, like other states, is experiencing shortages of
secondary teachers, particularly in math and science. Just as the production of elementary teachers declined in the wake of the UA regents’ decision to end the four-year bachelor of education program, so too did the production of secondary teachers. But that decline is less obviously related to the policy change, since the secondary programs had already evolved to the graduate level before the regents’ decision.
As Chart 16 shows, the Fairbanks campus suffered the most precipitous decline, with the number of secondary education graduates dropping from 61 in 1997-98 to 14 in 2000-01. At UAA, the number of graduates declined from 127 to 62 during that period. But the Southeast campus showed no decline and, in fact, experienced a significant increase in 2000-01.

Retaining Quality Teachers for Alaska
40
Chart 16. Secondary Education Graduates, University of Alaska, by Campus,
1997-2001
50
22
127
78 7362
40 35
16
26
1617
61
14
2221
0
25
50
75
100
125
150
1997-98 1998-99 1999-00 2000-01Year Program Completed
UAA
UAS
UAF
Total
Source: J. Covey, Alaska Educator Supply, December 10, 2001
Special Education Graduates Chart 17 shows the number of graduates from the special education certification
program at the University of Alaska Anchorage during the period 1996-2000. This is the only special education certification program in the state. Despite the high demand for certified special education teachers—not just in the state but across the nation—the number of those entering and graduating from the program did not increase substantially between 1996 and 2000, and in fact began declining in 2000. During the five-year period, 77 certified special education teachers graduated from the program, but only 15 graduated in 2000. This reflects a national trend: as many special education teachers leave their positions because of increasing caseloads and paperwork, fewer candidates enter special education programs. In 1999-2000, more than 12,000 openings for special education teachers nationwide were left vacant or filled by substitutes (SPeNSE, 2001).

Retaining Quality Teachers for Alaska
41
Chart 17. Graduates with Special Education Certification,
University of Alaska Anchorage, 1996-2000
8
1618 20
15
0
5
10
15
20
25
1996 1997 1998 1999 2000
Graduation Year
Source: Data supplied by Dr. Claudia Dybdahl, Director, Teacher Education Program, University of Alaska
Anchorage, June 2001
Summary: Producing Teachers in Alaska In short, overall production of teachers in Alaska has declined significantly over
the past five years. Given that there is a surplus of elementary teachers in the region, it is the nearly 50 percent decline in the production of secondary teachers that should be of greatest concern to policymakers. This decline cannot be easily explained by the UA regents’ decision to move teacher preparation to the graduate level, since that change had already occurred for secondary preparation programs before 1996. Other factors appear to be at work, but identifying the causes is beyond the scope of this report. Of equal concern is the recent decline in certified special education graduates.
How Many Teachers Who Graduate in Alaska are Likely to Go Into Classrooms? In considering policy directions, we need to remember that the number of
certified teachers who graduate from teacher education programs does not translate into a similar number in the classroom. As many as 40 percent of the graduates of traditional four-year bachelor of education programs do not enter classrooms after certification (Darling-Hammond, 2000). A greater percentage of the graduates of 5th year and 5-year programs enter classrooms, but as many as 10 to 20 percent do not (Andrew, 1981 and 1990; Shin, 1994). Thus, if Alaska’s colleges and universities produced, on average, 230 elementary teachers over the period 1997-2001, we might expect that about 143 teachers would actually enter classrooms. A higher percentage of graduates of secondary teacher preparation programs that are 5th year programs may be expected to actually enter the classroom—roughly 80 percent of the average of 85 annual graduates from 1997-2001, or 68 teachers.

Retaining Quality Teachers for Alaska
42
V. SURVEY OF ALASKA INSTRUCTIONAL AIDES
Overview As Alaska faces shortages of teachers in a number of remote districts, attention
has focused on a pool of potential teachers: instructional aides. For remote rural districts that often suffer turnover rates of 25 percent or more a year, supporting resident instructional aides who want to pursue certification seems an obvious strategy. Filling many or most of the positions in these schools with permanent residents of the community could improve curricular, instructional, and social continuity for rural students—and that would, in turn, improve their learning.
In addition, the recent No Child Left Behind legislation raises the ante for instructional aide qualifications. Under NCLB, paraprofessionals must have two years of postsecondary education, or demonstrate requisite skills on a “formal state or local academic assessment.” All paraprofessionals who were hired after January 8, 2000 and are paid with Title I funds must meet these requirements. By 2005-06, all Title I paraprofessionals will have to meet these requirements. Nationally, a number of school districts and institutions of higher education have collaborated to create career ladder programs to support para-educators in becoming certified teachers (DeWitt Wallace Readers Digest, 1997). Evaluations of some of these programs show that para-educators tend to persist in the programs, and that when they graduate, they go right into the classroom—and appear to be successful teachers.
In the past, the State of Alaska funded rural-based programs (such as X-CED) to provide course work and instructional support to para-educators and other rural residents who wanted to become teachers. As oil dollars—and consequently state revenues—declined, funds for such site-based support largely came to an end, although funding for a few outreach instructors and for distance-delivered programs has continued.
And as we will discuss in our survey results below, rural instructional aides need multiple supports to pursue certification. A critical area is developing the fundamental reading, writing, and numeracy skills required for college-level work. To have the time and the opportunity to develop these skills, many instructional aides would require other types of support such as tuition grants and child-care subsidies.
Against the cost of supporting aides who wish to earn certification must be balanced the high cost of teacher turnover. The costs are not only fiscal—training a new teacher typically costs $8,000 or more—but educational as well. As we noted above, high turnover rates are associated with low student achievement (Grissmer et al., 2000).
To find out more about the potential of instructional aides as a pool of prospective teachers, we surveyed a statewide sample. The questions we wanted to answer included: (1) What are the demographic characteristics of instructional aides in Alaska schools? (2) How many aides are interested in pursing bachelor’s degrees or certification? (3) What impediments do aides who would like to pursue certification face? (4) What differences exist between instructional aides in rural and urban schools?

Retaining Quality Teachers for Alaska
43
Survey Methods
Questionnaire To learn more about instructional aides, ISER researchers drafted a survey
questionnaire (available at http://www.iser.uaa.alaska.edu/) and sent it for review to six instructional aides and several educators knowledgeable about instructional aides (some of whom had previously been aides themselves). After that review process, we field-tested the instrument with aides who were attending the PRAXIS Institute sponsored by the Cook Inlet Tribal Council in the summer of 2001. We used their responses to further refine the questionnaire.
Procedures In fall of 2001, we surveyed the personnel directors of 53 school districts in the
state (the survey instrument is available at http://www.iser.uaa.alaska.edu/). All but four provided the names and mailing addresses of the aides in their districts. We drew a stratified random sample from these names. We then mailed surveys, with a cover letter, to our sample in November 2001. We continued to send follow-ups and replacement surveys until February 2002.
As we received surveys back in the mail, we entered the data into a database and subsequently analyzed these data using SPSS. In addition to running simple frequencies for all the items, we also tested the significance of differences between results from the rural and urban samples.
Sampling We divided our sample into three strata: (1) Anchorage School District; (2)
Fairbanks Northstar Borough School District, Juneau School District, and Matanuska-Susitna School district; and (3) rural school districts. We hypothesized that the instructional aides in rural districts might have issues and demographic characteristics distinctly different from those in urban areas. And given the size of the Anchorage School District (42 percent of all students enrolled in the state), we wanted to make sure that the three other urban districts were represented in the final sample. Table 12 shows the number of instructional aides in each stratum, as well as the number randomly selected for inclusion in our sample.
Table 12. Population and Sample Size for Instructional Aide Survey, 2000-01 Districts Total Number
of Aides* Number in
Final Sample Number of Completed
Surveys
Response Rate
Anchorage 609 83 39 52% Fairbanks 178 35 14 43%
Juneau 96 19 12 63% Matanuska-Susitna 114 23 7 35%
Rural 1,166 89 31 35% Total 2,373 249 103 41%
*Figures on total number of aides from Alaska Department of Education and Early Development.

Retaining Quality Teachers for Alaska
44
Response Rate Despite numerous follow-ups with aides who didn’t respond, we were unable to
achieve the response rate we had hoped for. However, the response rate we achieved is typical of self-administered, mail-out surveys. As Table 12 shows, we received 103 completed surveys of the 249 we mailed out. Among aides in urban schools, the response rate was 45 percent and among aides in rural schools 35 percent.
We do not know whether or how those who didn’t respond may differ from those who did respond. We may speculate, however, that those who did respond may be more likely to have an interest in additional educational opportunities. Readers should bear this in mind. These modest response rates urge caution in interpreting the results.
Results of Instructional Aide Survey
Demographic Characteristics of Instructional aides As Table 13 shows, all but a few of Alaska’s instructional aides in the 2000-01
school year were women. Aides in urban schools were almost exclusively white, while more than half in rural areas were Alaska Natives. About three-quarters of both urban and rural aides were married; 17 percent of urban aides and 12 percent of rural aides were widowed or divorced.
Just over a fourth of the urban aides and more than half the rural aides were the primary wage earners in their families. This has implications for policy development: to pursue further education, most rural aides would probably have to continue working, unless funds could be found to support their families while they studied.
Not surprisingly, rural aides were much more likely to report that subsistence foods were an important part of their family’s diet. Respondents from rural and urban schools reported comparable annual salaries—in the $15,000 to $17,000 range.
Rural aides appear to have significantly more experience than do urban aides. The rural aides in our sample had, on average, 9.1 years of experience as aides, compared with 6.2 years among urban aides. (Interestingly, nearly a third of urban aides in our sample reported that they had at some time held teaching licenses, while only one rural aide reported ever having held a teaching license.)
Table 13. Characteristics of Alaska Instructional Aides, 2000-01 Characteristic Urban
(N=72) Rural (N=31)
Female 94% 95% Married 76% 77% Widowed or Divorced 17% 12% Alaska Native 2% 54%** White 96% 50%** Primary wage earner 26% 56%** Rely on subsistence foods 11% 74%** Years as an instructional aide 6.2 9.1* Note: Racial composition of rural aides adds to more than 100% because two aides identified themselves as both Alaska Native and white. * Difference significant at the <.01 level ** Difference significant at the <.001 level.
Source: ISER survey of Alaska instructional aides, 2001-02

Retaining Quality Teachers for Alaska
45
Aides most often work in preschool through sixth grade (Table 14). Rural aides appear to work more often in the early grades (kindergarten through third grade) than do their urban counterparts—but that difference is not statistically significant.
Table 14. Grade Levels Where Alaska Instructional Aides Worked, 2000-01
(Percentage of Aides That Spent Any Time Working with Various Grade Levels) Grade Level
Urban (N=70)
Rural (N=30)
Preschool 13% 7% Kindergarten 16% 24% Grades 1-3 28% 46% Grades 4-6 39% 40% Grades 7-8 13% 17% Grades 9-12 20% 17%
Source: ISER survey of Alaska instructional aides, 2001-02
Significant differences do appear when we look at the distribution of aides across
programs (Table 15). Nearly 9 out of 10 instructional aides in urban schools spend at least some of their time working in special education, compared with just over a third in rural schools. This difference may reflect the higher case loads that special education teachers typically face in urban schools, as well as differences in funding. Conversely, rural aides are much more likely to work in regular classrooms than are urban aides.
Table 15. Programs Where Alaska Instructional Aides Worked, 2000-01
(Percentage of Aides That Spent Any Time Working in Various Programs) Instructional Program
Urban (N=70)
Rural (N=30)
Special Education 89% 37%* Title I 4% 9% Regular Instructional Program 22% 50%* Migrant Education 0 4% Bilingual 2% 7%
* Difference significant at the <.001 level Source: ISER survey of Alaska instructional aides, 2001-02
Education Levels and Post-Secondary Experience of Aides We found significant differences in education levels of urban and rural
instructional aides (Table 16). On the whole, urban aides were more likely to have education beyond high school. Among rural aides, 38 percent reported no formal education beyond high school, while another 40 percent reported “some college.” Over a third (35 percent) of the urban instructional aides, on the other hand, reported having at least a bachelor’s degree. This finding suggests that, in constructing career ladders for rural para-professionals, a first goal might appropriately be associate degrees.
This also speaks to the issues raised by No Child Left Behind legislation. Rural schools, especially, will face a crisis in hiring and retaining aides unless they can find

Retaining Quality Teachers for Alaska
46
ways to increase the educational level of their aides, very few of whom currently meet the new federal guidelines.
Table 16. Education Levels Among Alaska Instructional Aides, 2000-2001
Highest level of education completed
Urban (N=70)
Rural (N=30)
High school diploma/GED 13% 38%* Some college 43% 40% Associate’s degree 4% 0 College beyond AA degree 4% 9% Bachelor’s degree 18% 8% Some graduate-level study 13% 4% Graduate-level degree 4% 0 Total 100%** 100%**
* Difference significant at .01 level **May add to more or less than 100% due to rounding Source: ISER survey of Alaska instructional aides, 2001-02
We also asked aides—including those who held only high-school degrees—about
taking college-level courses and where they took those courses. Table 17 shows the percentages of aides who had taken at least one college-course from specific institutions. Remember that any given aide may have taken courses from more than one institution—so the percentages in Table 17 add up to more than 100.
Table 17. Sources of Post-Secondary Education Among Instructional Aides (Percentage of Aides Who Have Taken Courses from Specific Institutions)
Post-Secondary Institutions
Urban (N=70)
Rural (N=30)
A community college or rural campus in Alaska 17% 24% University of Alaska Anchorage 39% 13% University of Alaska Fairbanks 20% 17% University of Alaska Southeast 9% 9% Alaska Pacific University 13% 13% Sheldon Jackson College 0 0 Institutions outside Alaska 46% 24%
Source: ISER survey of Alaska instructional aides, 2001-02
Not surprisingly, more rural than urban aides—24 percent compared with 17
percent—had taken courses at either rural campuses or community colleges. Table 17 also shows how many aides had taken courses on the three main UA campuses. Given that a substantial share of those who responded to the survey were from Anchorage, it is unsurprising that 39 percent of urban aides had taken courses at UAA, compared with 13 percent of rural aides. About one fifth of both groups had taken courses at UAF. Smaller shares—about 9 percent of both—had taken courses at UAS.
About 13 percent of both urban and rural aides had taken classes at Alaska Pacific University, but none in our small sample had taken courses at Sheldon Jackson College.
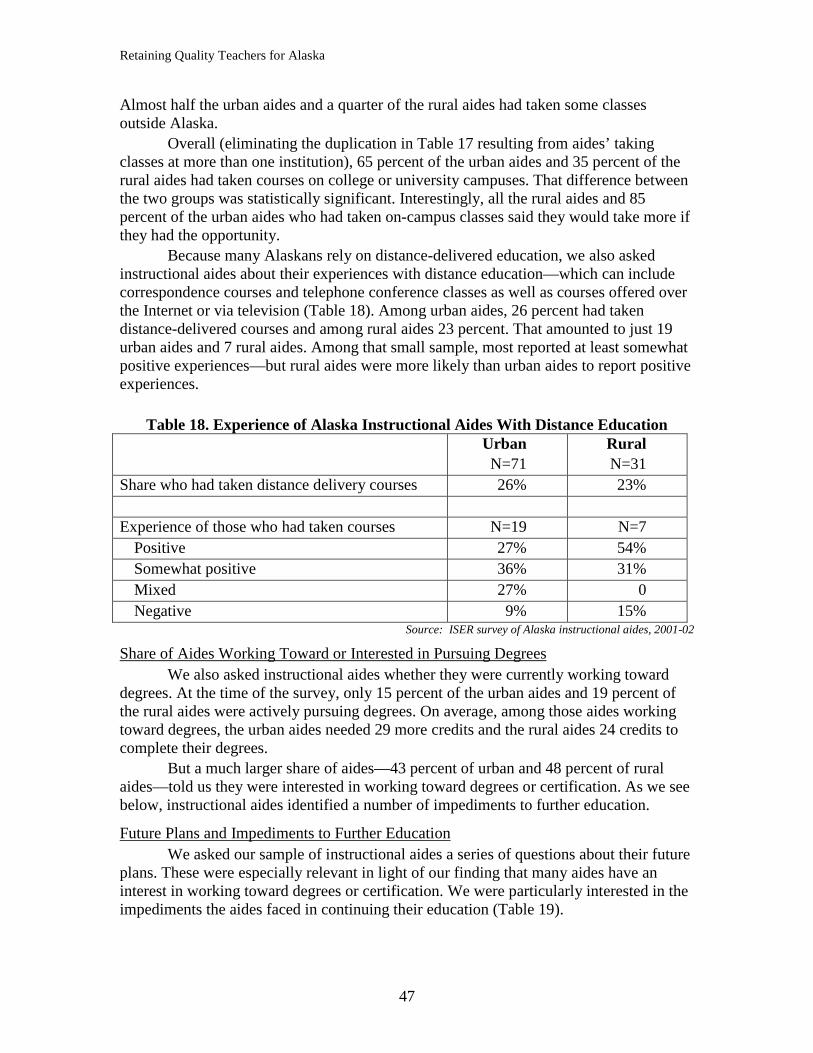
Retaining Quality Teachers for Alaska
47
Almost half the urban aides and a quarter of the rural aides had taken some classes outside Alaska.
Overall (eliminating the duplication in Table 17 resulting from aides’ taking classes at more than one institution), 65 percent of the urban aides and 35 percent of the rural aides had taken courses on college or university campuses. That difference between the two groups was statistically significant. Interestingly, all the rural aides and 85 percent of the urban aides who had taken on-campus classes said they would take more if they had the opportunity.
Because many Alaskans rely on distance-delivered education, we also asked instructional aides about their experiences with distance education—which can include correspondence courses and telephone conference classes as well as courses offered over the Internet or via television (Table 18). Among urban aides, 26 percent had taken distance-delivered courses and among rural aides 23 percent. That amounted to just 19 urban aides and 7 rural aides. Among that small sample, most reported at least somewhat positive experiences—but rural aides were more likely than urban aides to report positive experiences.
Table 18. Experience of Alaska Instructional Aides With Distance Education
Urban N=71
Rural N=31
Share who had taken distance delivery courses 26% 23% Experience of those who had taken courses N=19 N=7
Positive 27% 54% Somewhat positive 36% 31% Mixed 27% 0 Negative 9% 15%
Source: ISER survey of Alaska instructional aides, 2001-02
Share of Aides Working Toward or Interested in Pursuing Degrees We also asked instructional aides whether they were currently working toward
degrees. At the time of the survey, only 15 percent of the urban aides and 19 percent of the rural aides were actively pursuing degrees. On average, among those aides working toward degrees, the urban aides needed 29 more credits and the rural aides 24 credits to complete their degrees.
But a much larger share of aides—43 percent of urban and 48 percent of rural aides—told us they were interested in working toward degrees or certification. As we see below, instructional aides identified a number of impediments to further education.
Future Plans and Impediments to Further Education We asked our sample of instructional aides a series of questions about their future
plans. These were especially relevant in light of our finding that many aides have an interest in working toward degrees or certification. We were particularly interested in the impediments the aides faced in continuing their education (Table 19).

Retaining Quality Teachers for Alaska
48
Table 19. Impediments To Alaska Instructional Aides Obtaining Degrees
(Percentages Citing Specific Impediments) Impediments, including lack of:
Urban (N=37)
Rural (N=17)
Money for tuition 96% 100% Courses available when I have time 95% 76% Required courses available in community 56% 76% Good advice on courses available in community 60% 59% Affordable child care 27% 48% Child care with which I am comfortable 23% 36% Computer skills 32% 43% Support to help me read college-level material 18% 31% Support to help me write at college level 25% 60%* Support from superintendent and school board 59% 22%* Support from principal 37% 20% Support from family and friends 36% 8%* Support from teachers 21% 7% Support from my community 27% 18% Support in community for distance delivery courses 50% 33% Access to computer 17% 17%
* Difference significant at the <.05 level Source: ISER survey of Alaska instructional aides, 2001-02
As Table 19 shows, virtually all the aides who expressed an interested in working
toward degrees and certification identified lack of money for tuition as an impediment. Next in importance was aides’ not having access to courses when they had time to take them. This was followed by the lack of access to required courses in the aides’ communities—although this was an issue for only 56 percent of the urban aides compared with 76 percent of the rural aides. As we discussed earlier, rural aides in particular tend to be the major salary earners in their households and are involved in subsistence activities as well (see Table 13). Thus, many aides contemplating further education cannot easily move to places where classes are more readily available.
The majority of rural and urban aides interested in getting degrees also said that lack of good advice on which courses to take was an impediment. Where to go to get the information they need appears to be a major concern for both urban and rural aides.
Issues related to child care proved to be a concern for more rural than urban aides. Among our small sample of rural aides, 48 percent expressed concerns about the affordability of child care available to them and 36 percent had reservations about the quality. In contrast, only 27 percent of urban aides had similar concerns about the affordability of child care and 23 percent about the quality. These results are surprising, given the extended family networks on which many rural residents depend for child care.
More of the rural aides in our sample who expressed an interest in pursuing additional education saw lack of specific academic skills as barriers. In addition to the 43 percent of rural aides who thought their computer skills were not up to standard, a third judged their reading skills and nearly two-thirds their writing skills as not up to college standards. The scores of rural aides on the PRAXIS examination bear out these self-

Retaining Quality Teachers for Alaska
49
assessments. Clearly, any program designed to help rural aides become certified must include opportunities for them to improve their reading and writing skills. Far fewer urban aides thought their reading (18 percent) and writing (25 percent) skills would impede their progress toward certification.
For instructional aides to continue their education, they need support from many people with whom they work and live. As we see in Table 19, lack of such support seems to be a bigger impediment for urban than for rural aides. Significantly more urban (59 percent) than rural (22 percent) aides saw lack of support from the superintendent and school board to be an impediment. Similarly, 37 percent of the urban aides but only 20 percent of the rural aides saw lack of support from the principal as an impediment—a difference that is statistically significant. Very few rural aides saw lack of support from family and friends as an obstacle, but more than a third (36 percent) of the urban aides did. Relatively few in either group saw lack of community support as an issue.
The lack of support in their community for distance-delivered courses was an impediment cited by fairly high proportions of both urban (50 percent) and rural (33 percent) aides. On the other hand, access to a computer was an issue for only about 17 percent of both urban and rural aides.
In sum, the greatest impediment for both urban and rural instructional aides who said they would like to become certified was the money needed to pay tuition. A majority of both groups also identified as major impediments the limited availability of and access to required courses and good advice about which courses to take. Many rural aides rated concerns about affordable, quality child care as an issue, as well as help they need to upgrade their computer, reading, and writing skills. Many urban aides, on the other hand, were concerned that they might get inadequate support from the superintendent, school board, principal, and family and friends—concerns that relatively few rural aides shared.
Future Education Options To learn more about how educational programs might best fit the needs of
instructional aides, we asked a series of questions about which arrangements would best suit their circumstances.
An important issue for aides interested in further education is whether they could afford to leave their home communities for some period of time, to take required teacher preparation courses. So first we simply asked aides who had expressed an interest in further education how long they could afford to be away from home each year. The results of that question are shown in Table 20. We then asked those same aides how long they could afford to be away from home, if their travel, tuition, and living expenses were paid; those results are shown in Table 21. Finally, we asked the aides how long they could afford to be away from home, if not only their travel, tuition, and living expenses were paid but also some support for child care were provided (Table 22).

Retaining Quality Teachers for Alaska
50
Table 20. Longest Period Aides Could be Away From Home Each Year
Urban N=37
Rural N=17
Both N=54
No time 20% 42% 32% 1-3 weeks 40% 36% 38% 4-6 weeks 28% 16% 21% 7-12 weeks 0 0 0 Longer than 12 weeks 12% 6% 9% Total 100% 100% 100%
Source: ISER survey of Alaska instructional aides, 2001-02
When simply asked how long they could afford to be away from home each year
to take teacher-preparation courses, a majority of both urban and rural aides said they could not afford to be away at all or only for a short time (Table 20). Among rural aides, 42 percent said they could not afford to be away at all, and another 36 percent said they could be away no longer than 1 to 3 weeks. Among urban aides, 20 percent said they could not be away at all and another 40 percent said they could be absent no longer than 1 to 3 weeks. Very few said they could afford to be away longer than 6 weeks.
However, when we asked the same question and included support for tuition, travel, and living expenses, the numbers changed dramatically (Table 21). With financial support, almost all the aides in our sample said they could afford to be away for some time—and 42 percent of urban and 24 percent of rural aides said they could be away for longer than 12 weeks each year. Table 21. Longest Period Aides Could be Away From Home, If A Program Provided
A Scholarship For Travel, Tuition and Living Expenses
Urban N=37
Rural N=17
Both N=54
No time 8% 0 4% 1-3 weeks 13% 23% 18% 4-6 weeks 25% 42% 35% 7-12 weeks 13% 13% 13% Longer than 12 weeks 42% 24% 31% Total 100% 100% 100%
Source: ISER survey of Alaska instructional aides, 2001-02
And when we added child care support to the other financial supports, an even
higher proportion of aides reported that they could be away from their homes to pursue further education (Table 22). Nearly a third of rural and 44 percent of urban aides said they could be away from home 12 weeks or longer each year, with all that support.

Retaining Quality Teachers for Alaska
51
Table 22. Longest Period Aides Could Be Away From Home Each Year,
If a Program Paid Travel, Tuition and Living Expenses and Provided Some Support for Child Care
Urban N=37
Rural N=17
Both N=54
No time 4% 0 2% 1-3 weeks 13% 17% 15% 4-6 weeks 13% 30% 23% 7-12 weeks 26% 23% 23% Longer than 12 weeks 44% 30% 36% Total 100% 100% 100%
Source: ISER survey of Alaska instructional aides, 2001-02
Given the remoteness of many Alaska communities, computer technology
represents a means to provide additional education to aides. So we also asked the instructional aides who were interested in furthering their education about their level of comfort with computer technology. Almost all the sample of both urban and rural aides said they would be at least somewhat comfortable using computers to communicate with instructors—but urban aides were almost twice as likely to report themselves as “very comfortable” with the prospect of using computers for communications (Table 23).
Table 23. How Comfortable Do Aides Feel Using Computers to Take Classes and Communicate with Instructors?
Urban N=37
Rural N=17
Both N=54
Very comfortable 48% 25% 35% Somewhat comfortable 35% 75% 57% Not very comfortable 13% 0 6% Very uncomfortable 4% 0 2% Total 100% 100% 100%
Source: ISER survey of Alaska instructional aides, 2001-02
We also asked a series of questions about computer and Internet availability (Table 24). All rural aides and about 8 in 10 urban aides reported having access to both computers and Internet connections at school. But rural aides are far less likely to have either computers or Internet access at home. Just 55 percent of rural aides reported having computers at home, compared with 91 percent of urban aides. And only 38 percent of rural aides said they had Internet connections at home, versus 91 percent of urban aides.

Retaining Quality Teachers for Alaska
52
Table 24. Percentage of Instructional Aides with Computer and
Internet Connections at School and at Home Urban
N=37 Rural N=17
Both N=54
Computer available at school 83% 100% 92% School computer is connected to Internet 79% 100% 90% Computer available at home 91% 55% 73% Home computer is connected to Internet 91% 38% 62%
Source: ISER Survey Of Alaska Teacher Aides, 2001-02
Summary: Potential for Aides to Become Teachers As we noted earlier, rural aides who are permanent residents of the communities
where they work represent a potential pool of teacher candidates that could help reduce the high turnover rates that plague some remote rural districts. They also bring other strengths to the table besides their knowledge of the community including, on average, more than 9 years of experience in the classroom. Recent changes in federal law have profound implications for rural schools. Many of their instructional aides are paid with federal Title I monies; unless they increase their education, they will not qualify for that funding in the future.
At the same time, supporting those aides who would like to meet the new requirements or to become licensed teachers would require considerable resources. Rural aides, who are predominantly Alaska Natives, are more likely than their urban counterparts to be the primary wage earners in their families and to depend on subsistence foods. This suggests that many, if not most, could not simply stop working to continue their education. They would have to replace both their incomes and their contributions to the family subsistence effort—much of which is concentrated in the summer, when aides might otherwise have time to pursue their studies.
Nearly half the rural aides in the sample also reported that the lack of affordable, quality child care is a major impediment to their working toward a degree. This is a critical issue, because 92 percent of the rural aides are parents, and of those, 13 percent have at least one child younger than 5. On average, rural aides are parents or guardians of two children of school age.
Rural aides would also need opportunities to develop the academic skills that are critical to success in college. Four of ten have only high school diplomas and no college experience. Only about two of ten are currently enrolled in degree programs. Nearly two-thirds of the rural aides interested in furthering their education admit that they would need help in developing college-level writing skills, and a third would need help learning to read at a college level. Four of ten rural aides interested in more education also reported deficiencies in their computer skills. This suggests that before many of the rural aides could begin working toward degrees they would need courses to help them master college-level reading and writing.
Urban aides interested in becoming teachers face other challenges. Most do not feel that their superintendents and school boards would support their efforts to become licensed. More than a third do not think their principal would support such efforts, nor that their family and friends would support them.

Retaining Quality Teachers for Alaska
53
VI. CONCLUSIONS AND RECOMMENDATIONS Alaska, like most other states, is facing teacher shortages. These shortages are,
however, confined to certain specializations and to a few rural districts. For some remote rural districts, the shortage of teachers is not new. Beset with seemingly endemic teacher turnover, these districts must scramble every year to fill numerous openings.
Because Alaska depends on universities outside the state to prepare the majority of teachers for Alaskan schools, the state is particularly vulnerable to the vicissitudes of teacher labor markets in the other states. The specialization shortages—particularly in special education and in secondary math and science—are national in scope. Consequently, Alaska is competing with other states for teachers in these areas. Alaska’s school districts are not in a strong competitive position. Teachers’ salaries are comparatively modest, when you consider Alaska’s higher living costs—especially in rural communities, where living costs are higher than in urban Alaska and much higher than in most of the U.S.
The turnover problem in some rural districts is all the more disturbing because of recent research that shows a strong relationship between low teacher turnover and higher-than-average student achievement. Results from Alaska’s High School Graduation Qualifying Examination confirm that many of the remote rural districts that fared poorly on the test are precisely those that have historically experienced the highest rates of teacher turnover. Addressing the turnover problem may not be sufficient, by itself, to improve student achievement in these districts—but it may well be a necessary condition. As noted above, the performance of schools that enroll educationally disadvantaged students is a particular focus of the NCLB legislation. Failing to improve the achievement of low-performing schools will have profound consequences for the state as a whole.
A central question for state and university policymakers is how to respond to the geographic and specialization shortages we have identified and to the high rates of turnover in some remote rural districts. To assist policymakers, we collected and analyzed data from a variety of sources. We amassed and analyzed data from the Alaska Department of Education and Early Development, the University of Alaska, and from the Alaska Teacher Placement office at the University of Alaska Fairbanks. We also collected new data through a variety of means, including surveys and interviews. Specifically, we collected data from (1) personnel directors in 49 of Alaska’s 53 school districts; (2) directors of the teacher education programs in the state in 2001; (3) a representative sample of teachers who exited Alaska schools in 2001; and (4) a representative sample of rural and urban instructional aides in 2001-02. For the latter two surveys, our response rates were in the range of 45 to 55 percent—rates fairly typical of self-administered surveys with these populations. These rates do, however, urge caution in interpreting the data.
Given our analyses of these various data, what are the factors that appear to be contributing to the specific shortages that Alaska schools are experiencing?

Retaining Quality Teachers for Alaska
54
Teacher Supply: Declining Numbers of Alaska Graduates
• UA’s 1996 decision to require a baccalaureate degree for admission to teacher preparation programs may have affected the number of elementary graduates.
A major concern of policymakers has been the decline in the number of certified teachers graduating from University of Alaska preservice programs. The decline can be traced in large part to the upheaval created by the UA regents’ decision in 1996 to move all teacher preparation to the graduate level. That decision was prompted by research showing that teachers, especially elementary teachers, were often inadequately prepared in the subjects they taught (National Center for Research on Teacher Learning, 1991). In the period from 1997 through 2000, the three main campuses of the University of Alaska were understandably preoccupied with creating new post-baccalaureate programs and ensuring that students already enrolled in the old programs graduated. No doubt, some potential teacher candidates were discouraged by the requirement that they earn a disciplinary bachelor’s degree before beginning their professional preparation. We lack the data, however, to say how many were discouraged by the new requirements. • UA’s 2001 decision to again offer a bachelor’s degree in elementary education does
not address the decline in graduates where shortages are greatest—in secondary teachers, in special education teachers, and in remote, hard-to staff schools.
About a third fewer elementary teachers graduated from UA programs in 2000-01 than had graduated in 1997-98. But we could find little evidence of a shortage of elementary teachers. The only exception may be in the historically hard-to-staff districts in remote rural areas.
What should be of greater concern is the nearly 50 percent decline in secondary teachers graduating in the same period. UA’s 1996 move to a post-baccalaureate degree should not have affected candidates for secondary certification, because their program was already at the graduate level. Without further investigation, attempts to identify the causes of the decline would be mere speculation.
Given the high attrition—both nationally and regionally—among teachers certified to teach special education, the small number of UA graduates in special education over the past five years is also a concern. Whereas all Alaska districts combined hired, on average, 52 special education teachers annually during the period from 1996 to 2000, the University of Alaska has averaged about 15 special education graduates annually over the same period—or about 29 percent of the demand.
The shift back to an undergraduate elementary education degree could possibly make more teachers available for the remote rural areas where there are shortages of elementary teachers. Those shortages are also exacerbated by the scarcity of certified Alaska Native teachers, who are likely to be permanent residents of the remote communities they call home. Alaska Natives may represent the best long-term solution to the chronic teacher shortages in some remote districts but currently little is being done to help them move toward certification. Reinstitution of the four-year baccalaureate in elementary education may encourage more Alaska Natives to pursue certification, but it is too early to know.
In deciding on policies to address perceived shortages, policymakers should expect pressure on the university from administrators and school boards to produce more

Retaining Quality Teachers for Alaska
55
certified teachers: the more qualified teachers available in the market, the more selective districts can be and the better their bargaining position.
The decision to widen the gateway into teacher certification programs raises a second issue: increasing the general supply of teachers by no means insures that teachers will go where they are most needed—either geographically or by specialization. In fact, given the declining competitiveness of Alaska’s teacher salaries, UA-educated teachers could leave Alaska to teach in states that are raising salaries to address their own shortages. At least three of those states are in the western U.S. Unless the state and school districts attend to teacher compensation and working conditions, the University of Alaska could find itself producing teachers for schools in California and Texas.
Policy Implications: How Can We Produce More Alaska Teachers? • Developing targeted programs could address specific shortages.
Given the specific nature of Alaska’s teacher shortages, the university and the state may need to collaborate on programs designed to recruit and prepare teachers in the specializations where they are most needed. This would suggest collaboration with the historically difficult-to-staff districts to identify the specializations they need—including generalists or multi-subject endorsed teachers, who are in great demand in rural Alaska. The emphasis that the federal No Child Left Behind legislation places on reducing out-of-field teaching raises issues that cannot be ignored about preparing teachers for rural schools—where teachers frequently have to teach outside their fields. It isn’t clear what preparation programs could do to qualify teachers in the range of fields they might need in rural schools, particularly since teacher education programs are required to meet the NCATE standards.
Targeted programs could be designed with an understanding that they might be phased out or transformed after a few years, as needs changed. But universities are not noted for their organizational flexibility and nimbleness. Thus creating programs that can be adapted to changing circumstances will not be easy. In addition, production of teachers lags behind identification of shortages, and predicting future shortages is always risky. However, most shortage areas—especially, secondary science and math; special education; and difficult-to-staff remote rural districts—have proven persistent over the past decade. Developing programs to address those shortages is probably a safe bet.
• Developing programs specifically to prepare teachers for rural schools could address
shortages in hard-to-staff rural districts. To address historic shortages in hard-to-staff districts, the university and the state
need to develop programs to graduate more teachers who are permanent residents of rural communities. The state has not funded a program that specifically targets the development of teachers in remote rural communities in more than a decade. Although the Rural Educators Preparation Partnership (REPP) has enjoyed success in helping a small number of students complete their teacher preparation in rural Alaska, it is a federally funded program that must reapply for funding every three years. Some school districts, such as the Lower Kuskokwim, have established their own professional development programs for instructional aides and have had some success in growing their

Retaining Quality Teachers for Alaska
56
own. But districts have limited funds to commit to such programs, and smaller districts often lack the capacity to organize, fund, and oversee them. • Developing career ladders for and providing support to instructional aides could
produce more teachers in remote rural districts. As our survey data revealed, a large number of current instructional aides in rural
Alaska are interested in becoming teachers. But these potential candidates face a legion of obstacles: affordable, quality day care; funds for tuition; maintaining their incomes as the primary breadwinners in their families; and the demands of subsistence activities in summer months, when they would otherwise be available for classes.
Equally challenging is the inadequacy of their basic academic skills. Nearly 40 percent have no more than a high school education. Nearly two-thirds lack adequate writing skills, a third believe their reading skills are not up to college standard, and four of ten lack basic computer skills. Sadly, these data speak to the substandard high-school preparation many of the aides experienced. Any program for rural instructional aides would have to begin with opportunities to develop the basic skills they need to succeed at college-level work.
Recent changes in federal law make the availability of additional educational opportunities even more important for rural paraprofessionals. Soon, school districts will be unable to use their Title I funds to pay aides whose educational levels fall below federal requirements.
These challenges might seem insurmountable, the costs far greater than the current political will to address the obstacles. Yet, they must be viewed against what we know of the current situation in many remote rural districts: persistent, debilitating levels of teacher turnover; the high costs of recruiting and training new teachers every year or two; persistent low student achievement; and mounting concerns about student behavior and motivation. Developing a core of teachers who are permanent residents of these communities could be the cornerstone of policies and programs to reverse the trends in remote rural districts. As anyone familiar with the history of regional boarding schools and the home-boarding program knows, returning wholesale to the failed policies of the past is not the answer (Kleinfeld, 1973).
Districts may be able to partner with their non-profit Native regional corporations to develop career ladder programs for each region. These organizations appear to have the needed experience, having previously established career development programs for village health aides.
Alaska’s Declining Competitiveness
• Cost-of-living adjusted salaries for Alaska teachers have declined steadily over the past decade.
In the late 1970s and early 1980s, Alaska’s teacher salaries were the highest in the country. The American Federation of Teachers now ranks Alaska’s cost-of-living adjusted salaries as 40th among the 50 states. Even if that ranking overstates the cost-of-living differential between urban Alaska and the Lower 48, it may understate the differences between remote rural Alaska—where the shortages exist—and the Lower 48.

Retaining Quality Teachers for Alaska
57
Obviously, this decline must be reversed if Alaska is to recruit new teachers. Although a sizeable portion of the teaching force is place-bound, many teachers are free to sell their services to the highest bidder. Because of Alaska’s historic dependence on teachers from Outside, Alaska districts are particularly vulnerable to changes in the state’s competitive position.
Policy Implications: How Can We Improve Alaska’s Competitiveness? • Raising salaries to keep up with other states is critical.
A priority for the state must be to raise teachers’ salaries overall, to regain at least some of the competitive edge the state enjoyed in recruitment during the early to mid-1980s. Allocating more money to education at a time of declining state revenues and growing budgetary shortfalls seems unlikely. But policymakers and the electorate must be made to understand the consequences of failing to increase salaries. Hard-to-staff districts, as well as those that have not typically had to struggle to staff their schools, will find it increasingly difficult to compete for well-qualified teachers in areas where shortages are nationwide. Schools in which students are already performing poorly on the state assessments will have to rely on unqualified or under-qualified teachers and will continue to suffer high teacher turnover rates. A deck that is already stacked against many of the highest-need students in the state will become even more stacked. • Addressing housing cost and quality issues could help.
As a way to recruit and retain teachers in remote areas, districts might encourage the village corporations to provide loans for teachers to build housing. This might reduce the cost of housing for teachers and improve the quality—as well as increase the stake that teachers from outside have in the community. If teachers left during the summer, the housing could be rented out to generate income to offset high housing costs.
High Turnover Rates and Difficulty Recruiting in Some Rural Districts
• Many rural teachers leave because of dissatisfaction with their jobs. While no urban district had an average turnover rate greater than 14 percent
during the period 1996-2000, one-quarter of all rural districts experienced average turnover rates of 30 percent or more during the same period. In the 1980s, unusually generous teacher salaries and benefits combined with a general teacher surplus ameliorated some of the difficulties of staffing Alaska’s remote rural schools. Recently, however, as real salaries for teachers in Alaska’s rural schools have fallen and shortages appeared in high-need districts across the country, staffing has become a major problem for many—but not all—remote rural districts.
When we asked a representative sample of rural teachers why they left their positions, half cited dissatisfaction with their jobs. Many felt that the job they actually did was misrepresented during recruiting. They were also dissatisfied with: (1) student motivation and behavior; (2) community and parental support; (3) the school leader’s communication with parents; and (4) the relevance of professional development activities to their needs. Thus, while comparatively modest salaries may be responsible for the difficulty in recruiting teachers for hard-to-staff districts, it is working conditions, not pay, that is the primary issue for most teachers who leave rural teaching positions.

Retaining Quality Teachers for Alaska
58
These findings are consistent with research done nationally. Ingersoll (2001) found that for most teachers, school and district characteristics were as critical to their decision to leave their jobs as was compensation. He found that turnover was lower in schools where: (1) salaries are higher; (2) teachers receive more administrative support; (3) fewer problems with student discipline were reported; and (4) teachers had relatively more influence on the decision-making process.
These results suggest several possible actions to improve working conditions in rural schools.
Policy Implications: How Can We Reduce Turnover and Increase Recruitment? • School improvement efforts should include conversations between educators and the
community on goals for the school and academic and behavioral expectations for students.
To address issues of student motivation and behavior requires a concerted, collaborative effort by educators, on the one hand, and parents and community members, on the other. Problems with behavior and motivation can often be traced to inconsistent messages coming from home and school. Other research in Alaska has shown that when parents and educational professionals agree on values, and when students receive the same messages about appropriate behavior and learning goals at home and at school, students are unable to play one side off against the other and must bear down and do their work (Kleinfeld, 1979; Kleinfeld, McDiarmid, and Hagstrom, 1985).
State assessments have identified schools that clearly need additional support. A key part of that support will be convening school-community meetings to discuss goals and expectations.
• Professional development for principals could help them broker the conversation
between the school and the community about goals and expectations for student performance and behavior.
The conversation required to develop common expectations for student behavior and school performance should be at the core of communications between the school and the community. Each must listen to the other. Educators who do not plan to stay in the community need to make a special effort to hear what parents want from the school. As temporary residents, they need to be careful about imposing their agenda on the school when they will be gone in a year or two. Residents have to live with the consequences of educators’ decisions long after most of them are gone.
The school principal is obviously the person to broker these conversations. As the results of our survey show, principals’ failure to communicate with parents and community members is a major dissatisfaction among those who leave their teaching positions. This role for the principal is one that must be emphasized—and practiced —both in principal preparation programs and in state and district training for principals. • District- and school-level professional development must include teachers in
identifying their needs and planning activities. Districts and school administrators need to address teachers’ perception that much
of their professional development is irrelevant to the issues and problems they face.

Retaining Quality Teachers for Alaska
59
Although a mounting body of evidence clearly demonstrates the importance of teacher involvement in planning their professional development, some districts insist on controlling the agenda (McDiarmid and Kelly, in review; Sparks 2002). Involving teachers in planning professional development activities is not difficult (for a description of how this has been done elsewhere, see McDiarmid and Kelly). What apparently is a challenge for some administrators is relaxing their control. The advent of the benchmark tests and the High School Graduation Qualifying Examination has, understandably, ratcheted up administrators’ levels of anxiety, making them even less inclined to take the risk of turning professional development planning over to teachers. State-level policy interventions—such as those that were part of the Kentucky Educational Reform Act—may be needed to put teachers in control. • Induction programs that support teachers through the difficulties of the first-year of
teaching help keep them in the classroom. A major problem all states face is that a high number of new teachers—between
30 and 50 percent, depending on location—leave the profession within the first five years. Much of that attrition can be traced to the frustrations and sense of failure that new teachers feel. Even the best teacher education programs cannot fully prepare teachers for the unrelenting demands made on them when they are solely in charge of a classroom. Clearly, as other countries such as China have demonstrated, beginning teachers need and respond well to support from their more veteran colleagues and the school and district administration.
As research from California has shown, well-designed and funded induction programs for beginning teachers can dramatically reduce the number of teachers leaving the profession in their first few years (Bullard, 1998). Using a federal grant, the Alaska Department of Education and Early Development in 2001-02 funded mentor programs for new teachers in eighteen districts. Although it is too early to determine the effects of the program on teacher retention, data suggest that first-year teachers found the program helpful and felt encouraged to stay in their jobs.
The State of Alaska should fund induction programs in all districts, especially those experiencing high rates of teacher turnover. Districts can work in collaboration with the University of Alaska and NEA-Alaska to prepare teachers as mentors. This preparation is critical to the success of the program. The costs of such a program need to be weighed against the costs districts bear in recruiting and training new teachers.
In conclusion, the shortages that some Alaska districts face are unlikely to disappear in either the short- or long-term, without some major policy changes at the state and district levels and at the University of Alaska. Although graduating more highly qualified teachers should clearly remain a goal, the evidence suggests that we cannot simply “produce” our way out of our current shortages. Policymakers must directly address the conditions that cause high rates of turnover and difficulties in recruiting in some districts, if all students in all Alaska’s schools are to have the high quality opportunities to learn that they need and deserve.

Retaining Quality Teachers for Alaska
60
VII. REFERENCES Alaska Teacher Placement. (various years). Alaska Statewide Educator Supply and Demand Report. Fairbanks: Alaska Teacher Placement, University of Alaska Fairbanks. Andrew, M.D. (1981). A Five-Year Education Program: Successes and Challenges. Journal of Teacher Education, 32(3), 40-43. Andrew, M.D. (1990). Differences Between Graduates of 4-Year and 5-Year Teacher Preparation Programs. Journal of Teacher Education, 41(2), 45-51. American Association for Employment in Education. (2001). Educator Supply and Demand in the United States. Columbus, OH: Author. Online at: www.aaee.org. American Federation of Teachers. (2001 and 1998). Survey and Analysis of Teacher Salary Trends. Washington, D.C: Author. 1998 report online at http://www.aft.org/research/survey/final.pdf ; 2001 report at http://www.aft.org/research/survey01/index.html Bullard, C. (1998). Qualified Teachers for All California Students: Current Issues in Recruitment, Retention, Preparation and Professional Development. Sacramento: California Research Bureau, CRB-98-012. Darling-Hammond, L. (2000). Teacher Quality and Student Achievement: A Review of State Policy Evidence. Education Policy Analysis Archives, 8 (1). Online at http://epaa.asu.edu/epaa/v8n1. DeWitt Wallace Readers Digest. (1997, August). Pathways: Recruiting, Preparing and Retaining Teachers for America's Schools. New York: Author. Education Trust. (2002). All Talk, No Action: Putting an End to Out-of-Field Teaching. Washington D.C.: Education Trust. Online at http://www.edtrust.org/main/main/index.asp Feistritzer, E. (1999). The Making of a Teacher. Washington, D.C.: Center for Education Information. Feistritzer, E. (1998, January 28). The Truth Behind the Teacher Shortage. The Wall Street Journal. Gold, Y. (1996). Beginning Teacher Support: Attrition, Mentoring and Induction. In J. Sikula, (Ed.), Handbook of Research on Teacher Education (2nd ed.). New York: Simon & Schuster/Macmillan. Goldsmith, S. (2001). Economic Projections for Alaska and the Southern Railbelt. Anchorage: Institute of Social and Economic Research, University of Alaska Anchorage. Online at www.iser.uaa.alaska.edu.
Retaining Quality Teachers for Alaska
61
Goldsmith, S. (2002). Institute of Social and Economic Research, University of Alaska Anchorage. Personal communication. Grissmer, D., Flanagan, A. Kawata, J., and Williamson, S. (2002). Improving Student Achievement: What State NAEP Test Scores Tell Us. Santa Monica, CA: RAND. Hanushek, E., Kain, J., and Rivkin, S. (2001). Why Schools Lose Teachers. NBER Working Paper 8599. Cambridge, MA: National Board of Economic Research. Ingersoll, R. (2001). Teacher Turnover, Teacher Shortages, and the Organization of Schools. Seattle, WA: Center for Policy and Teaching, University of Washington. Kardos, S., Johnson, S., Peske, H., Kauffman, D., and Liu, E. (2001). Counting on Colleagues: New Teachers Encounter the Professional Culture of Their Schools. Educational Administration Quarterly, 37(2), 250-290. Kelley, C. (1998). The Kentucky School-Based Performance Award Program: School-Level Effects. Educational Policy, 12(3), 305-324. Kleinfeld, J. (1973). A Long Way From Home. Fairbanks: Center for Northern Educational Research and Institute of Social and Economic Research, University of Alaska. Kleinfeld, J. (1979). Eskimo School on the Andreafsky. New York: Praeger Publishers. Kleinfeld, J., McDiarmid, G. W., and Hagstrom, D. (1985). Alaska’s Small Rural High Schools: Are They Working? Anchorage: Institute of Social and Economic Research, University of Alaska Anchorage. McDiarmid, G.W., Goldsmith, S., Killorin, M., Sharp, S., and Hild, C. (1998). Expanding Job Opportunities for Alaska Natives. Interim Report. Anchorage: Institute of Social And Economic Research, University of Alaska Anchorage. Online at: http://www.iser.uaa.alaska.edu. McDiarmid, G. W. and Kelly, P. (in review). Teachers Planning Professional Development in a Reform Context: The Case of Kentucky. Submitted to Educational Evaluation and Policy Analysis. National Center for Education Statistics (NCES). (1997). America’s Teachers: Profile of a Profession, 1993-94. Washington, D.C.: U.S. Department of Education. National Center for Education Statistics. (1997). Characteristics of Stayers, Movers, and Leavers: Results from the Teacher Follow-up Survey: 1994-95. Washington, D.C.: U.S. Department of Education.

Retaining Quality Teachers for Alaska
62
National Center for Education Statistics. (various years). Digest of Education Statistics. Washington, D.C.: U.S. Department of Education. National Center for Education Statistics. (various years). Projections of Education Statistics. Washington, D.C.: U.S. Department of Education. National Center for Research on Teacher Learning. (1991). Findings from the Teacher Education and Learning to Teach Study: Final Report, The National Center for Research on Teacher Education. E. Lansing, MI: Michigan State University, Author. National Commission on Teaching and America’s Future. (1996). What Matters Most: Teaching for America’s Future. New York: Teachers College, Columbia University. Online at http://www.teacherscollege.edu/nctaf/publications/index.html ) North Central Regional Educational Laboratory (NCREL). (2000) Teacher Shortages in the Midwest: Current Trends and Future Issues. Oak Brook, IL: Author. Oakes, J. (1990). Multiplying Inequities: The Effects of Race, Social class, and Tracking on Opportunities to Learn Mathematics and Sciences. Santa Monica, CA: RAND. Oregon University System. (1999, July). K-12 Educator Supply and Demand: Facts, Figures and Trends. Eugene: OR: Author. Shin, H. (1994). Estimating Future Teacher Supply: An Application of Survival Analysis. Paper presented at the Annual Meeting of the American Educational Research Association, April 8-13, New Orleans, LA. Sparks, D. (2002). Designing Powerful Professional Development for Teachers and Principals. Oxford, OH: National Staff Development Council. Available only online at: http://www.nsdc.org/sparksbook.html The Study of Personnel Needs in Special Education (SPeNSE). (2001). Funded by Office of Special Education Programs, U.S. Department of Education, and conducted by Westat. See SPeNSE Web site at: http://www.spense.org Texas Center for Educational Research. (2000, November). The Cost of Teacher Turnover. Austin, TX: Author. U.S. Bureau of the Census. (2000). Summary File 1, available online at: http://factfinder.census.gov/servlet/BasicFactsServlet Washington Education Association. (2002). Special Education Task Force, 2002 Special Education Survey Report. Available online at: http://www.wa.nea.org/Jumps/2002_2/workload.htm