Rethinking Your Finance Functions Budgeting, Planning & Technology
BDO Canada Daniel Caringi ( [email protected] ) September 25th, 2014
Presenter
Presentation Notes
This session will address best practices for budgeting and planning that we’re seeing across the country, as well as new trends that are emerging. This includes the use of the cloud, real-time analytics, and more efficient ways of working. http://www.uwinnipeg.ca/w3/speakers.html
A journey of a thousand miles must begin with a single step. - Lao Tzu
WHAT WE WANT TO SHARE WITH YOU
Technology Trends And Its Impact On Finance
Best Practices And Evaluation Considerations
Getting Started On Your CPM Journey
BIOGRAPHY
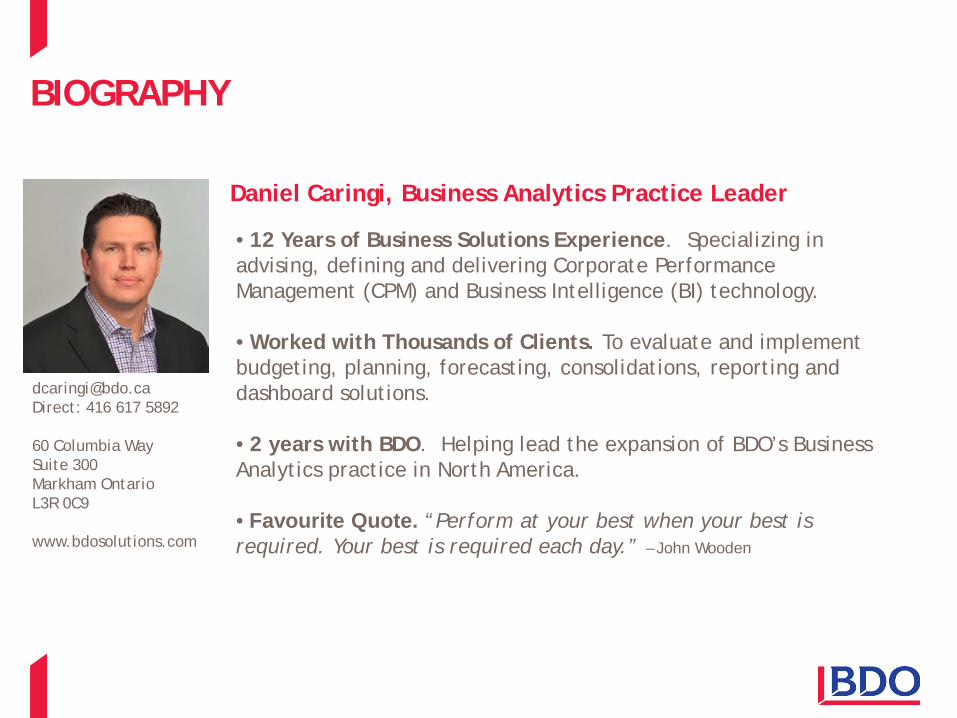
Daniel Caringi, Business Analytics Practice Leader
[email protected] Direct: 416 617 5892 60 Columbia Way Suite 300 Markham Ontario L3R 0C9 www.bdosolutions.com
• 12 Years of Business Solutions Experience. Specializing in advising, defining and delivering Corporate Performance Management (CPM) and Business Intelligence (BI) technology.
• Worked with Thousands of Clients. To evaluate and implement budgeting, planning, forecasting, consolidations, reporting and dashboard solutions.
• 2 years with BDO. Helping lead the expansion of BDO’s Business Analytics practice in North America. • Favourite Quote. “Perform at your best when your best is required. Your best is required each day.” – John Wooden
ABOUT BDO CANADA
5th Largest 465M+
Revenue
100+ Offices
3K Staff
90+ Years of Experience
AUDIT TAX ADVISORY SOLUTIONS
The Leader in Accounting and Advisory Services
Offering a breadth of expertise, innovative thinking and valuable insight. BDO Canada is the fifth largest accounting and advisory firm in Canada.
http://www.pyramidresearch.com/enterprise-cloud-readiness-index-excerpt.htm The Enterprise Cloud Services Readiness Index is based on successive aggregations of scores from Pyramid Research’s proprietary indicators from 49 countries globally. Pyramid Research defines enterprise cloud services readiness as the degree to which service providers in a given country can potentially leverage cloud services for the enterprise segment. This in turn is based on economic, demographic and enterprise adoption indicators. Those indicators are: 1) Businesses 2) Nominal GDP 3) Fiber-optic (FTTH/B) subscribers 4) 3G/4G subscribers 5) Broadband subscriber lines 6) Computers 7) Smartphones
New Rules Reduced Management Increased Productivity
Pay for what you use No patching, Maintenance Always the latest version
Shift from CapEx to OpEx Multi-layered security Internet enabled
Accelerate speed to value Reliable up-time Accessible anywhere
Model On-Premises Cloud
Acquisition Perpetual License Subscription Service
Business Capital Expense Operational Expense
Access Internal Networks Over the Internet
Technical Customer Maintains System Vendor Maintains System
What this means to you:
Presenter
Presentation Notes
http://elementsolutions.com/2013/08/01/cloud-computing-demystified-3s-4d-5e-is-all-you-need-to-know/ And the SaaS model delivers a huge number of other advantages over the traditional enterprise software model. With the software-as-a-service delivery model, There’s no new hardware, software, or IT support required for either initial implementation or ongoing maintenance. SaaS lowers the total cost of ownership compared to on-premise software, because with SaaS, IT isn’t needed to maintain the system. Implementation time can be fast; projects go live quickly, which means not only are they low cost but also they have immediate impact. Constant improvement and enhancement benefits all users, who immediately get access to new features, without the need for ongoing IT support. New features are released frequently, on a quarterly basis, bringing more new features sooner to customers. And web-based, easy-to-learn interfaces mean that even people without strong finance skills can participate in financial planning and reporting processes. This increases adoption and collaboration across the company. It’s automatically accessible worldwide, goes live quickly and is immediately accessible to employees spread across multiple locations. All of these factors, plus the fact that you can try it first on a free trial basis, add up to the fact that the cloud delivery model is low risk.
Finance leads 80-90% of CPM projects
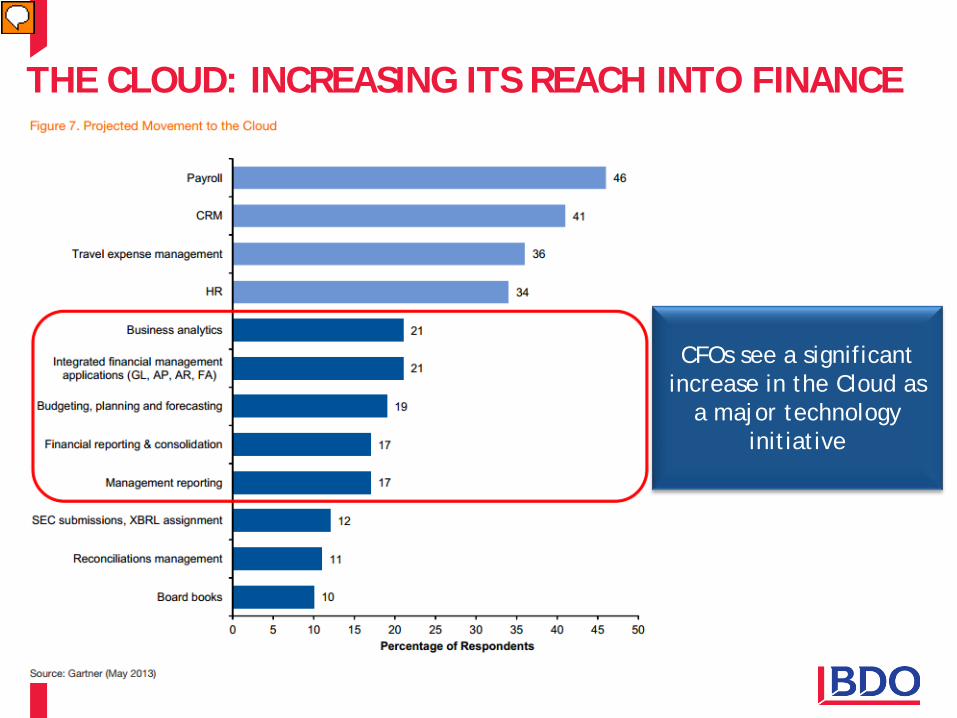
Business Analytics is the next wave of
innovation in the Cloud - Gartner
With the Cloud technology is no longer
an IT project, but a business project
Chances are, you’re using the Cloud today in both business and
your personal life
Rethink your spreadsheet based
Processes The Cloud is the future of CPM – BPM Partners
KEY TAKEAWAYS
GETTING STARTED ON YOUR CPM JOURNEY The correlation between Business Analytics and Finance
WHY IS TAKING ACTION IMPORTANT?
Speed And Agility Are Incredibly Important
Information Is Vast & Travels Fast
Transparency, Control & Accountability
Failure to act is often the biggest failure of all. - John Wooden
Presenter
Presentation Notes
Added the verbiage in red. It is too presumptive to state that the Finance dept is going to set strategy. The Board and the CEO are responsible for setting strategy, the CFO is now in a very good position to help the CEO set strategy.
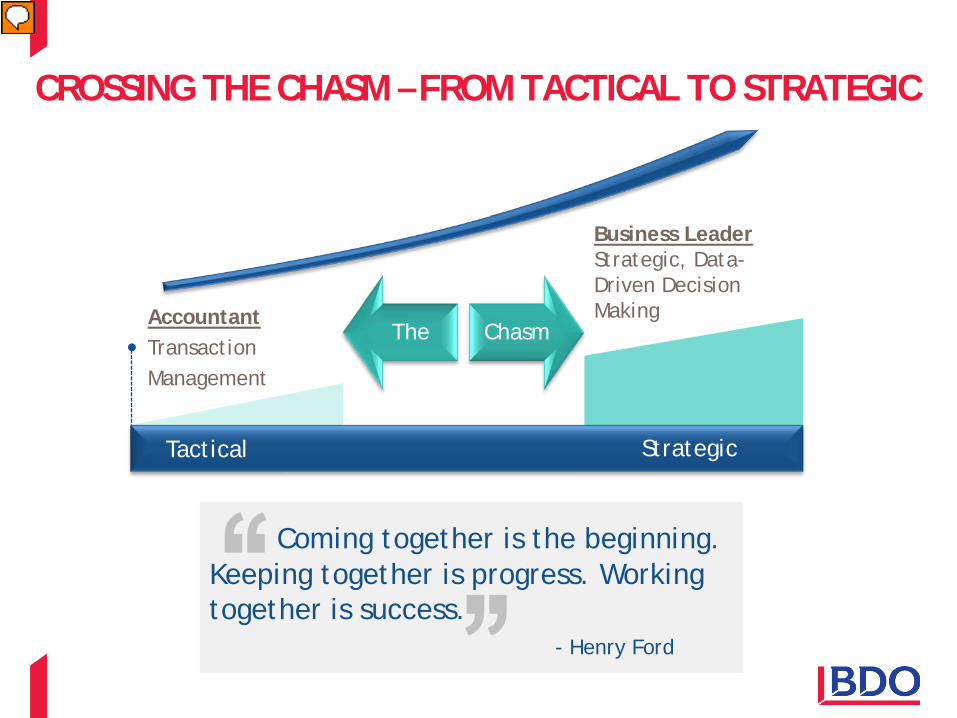
Accountant Transaction Management
Performance Management & Analysis
Business Leader Strategic, Data-Driven Decision Making
CROSSING THE CHASM – FROM TACTICAL TO STRATEGIC
The Chasm
Tactical Strategic
Coming together is the beginning. Keeping together is progress. Working together is success.
- Henry Ford
Presenter
Presentation Notes
So how do you go about transforming your organization to act less tactically and more strategically? This transformation involves spending less time on support tasks and more time acting as a business partner to the CEO and management team. More time leading your organization to think analytically, act collaboratively, and use the organization’s collective insight to make more strategic, data-driven decisions that give your organization competitive advantage. This transformation can be accomplished by moving from inefficient processes, teams that are not aligned, and silos of data to efficient processes, with broad organizational alignment, and a holistic view of critical business data.
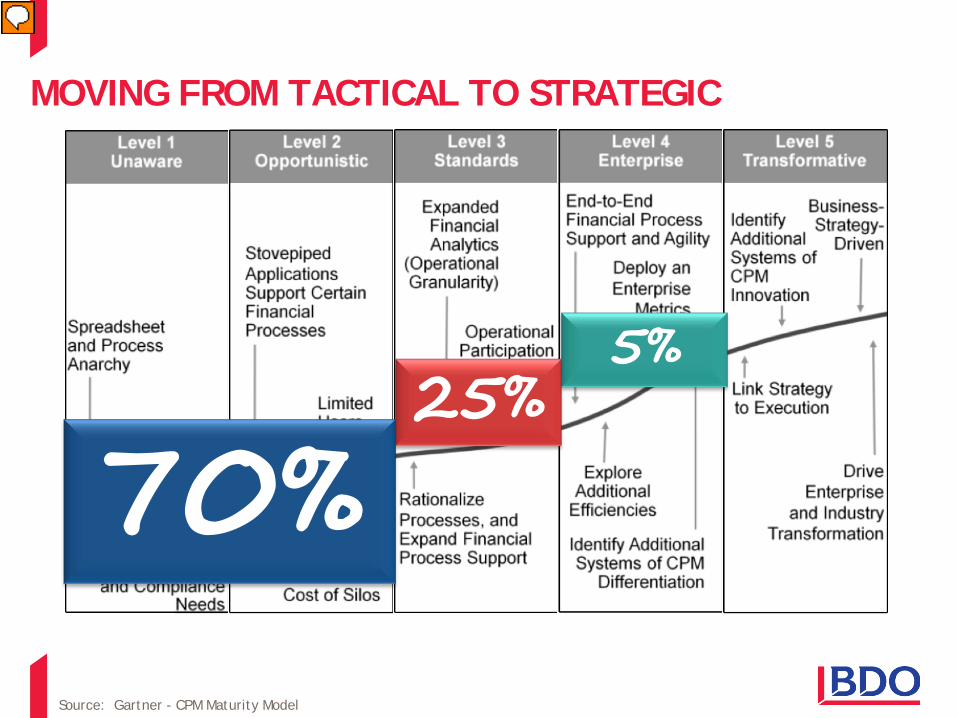
MOVING FROM TACTICAL TO STRATEGIC
Source: Gartner - CPM Maturity Model
70% 25%
5%
Presenter
Presentation Notes
*This slide builds and allows you to talk through the levels of the maturity model Gartner, a leading Industry Analyst, has created what they call a CPM Maturity Model. The purpose is to create the foundation for an enterprise-wide approach to performance management. The model is ultimately meant to be a framework for aligning and measuring financial processes, organizational process and operational execution. The key is in creating structure and process while linking strategy to operational execution. The model measures the Maturity of an organization’s Performance Management infrastructure/process/culture. Gartner defines five levels of Maturity. Level 1 Unaware This level as basically spreadsheet anarchy. CPM processes are performed in a highly inefficient manner because they typically involve the use of only spreadsheets or a combination of spreadsheets and-or homegrown-outdated products to consolidate financial results. Budgeting is done at a high level, low accountability across the organization Planning is a very resource intensive annual process that finance controls. Financial Reporting is labour intense, difficult to audit, carries high risk, often is inconsistent and/or error prone Typically these financial processes are viewed as a “necessary evil”, however may not provide business value. Recommended Actions: Start with small steps! Don’t rush out to change the world in one big bang. Look for quick PM wins, to gain organizational support for future more strategic PM goals. Assess current compliance needs, determine if manual compliance processes can be automated. Assess your consolidation and close process. Are there efficiencies to be gained by streamlining these processes? Implementing FC or close systems/processes can help bolster immediate tactical goals Compare current Budgeting processes. Building infrastructure here to reduce manual/error prone/limited budgeting processes will be a foundation for more sophisticated planning and forecasting. Level 2 – Opportunistic At this level the organization has implemented one or more CPM applications to address things such as consolidation, reporting, budgeting and/or forecasting. Efficiency and accuracy have increased however they are largely siloes. It does not tend to provide business value because the planning is short-term focused, with only finance involved. Planning and forecasting processes exist and may be supported within the CPM application, however CPM applications are typically supporting budgeting at a summary level of detail (typically mirroring the chart of accounts), which is meaningful to corporate, but disconnected from operational planning efforts. CPM applications don't link corporate finance and operational planning processes. This situation addresses the most glaring, finance-oriented CPM needs. This is where many organizations get stuck, why: They regard CPM as a tool to help finance streamline financial processes They are unaware of the systems/tools available in the market place They lack resources and vision for how PM can strategically alter their organization Recommendations to move to the next level: Assess where data outputs from current CPM infrastructure can be leveraged and used to improve business analytics Become more sophisticated in budgeting, planning and forecasting Support more driver and analytic based plans. Allow users to model financial outcomes by varying business drivers Involved business users at operational levels to contribute assumptions and create buy in Consider planning at more granular levels, with action-oriented levers that front line managers can contribute Ensure frequency of planning, meets the volatility of your business Level 3 - Standards This level describes an organization who has implemented several CPM modules, capture additional efficiencies within finance and start to create business value through greater operational insight, collaboration and organizational agility. CPM is not only used by finance but by other key operational units and stakeholders in the business. Organizations at this level have more-frequent planning, multiple stakeholders are involved, enhanced financial analytics and more granular operational reporting. Greater organizational agility and control is attained by linking corporate and operational plans, that more accurately model results from action-oriented drivers and significant events. Planning and Forecasting efforts include: More detailed operational data More frequent replanning as business conditions dictate Involvement of 100s or 1000s of people from within the organization to contribute or consume information (both numeric and commentary) TWO KEY Concept: CPM is no longer seen as a set of applications exclusively used within corporate finance. In addition to creating efficiencies, CPM applications are being used to create business value Recommendations to improve: Formalize your approach to strategy management Document strategy management processes Encourage management to identify leading indicators of Performance Educate C-Level on how technology can enable performance-driven cultures Level 4 – Enterprise This level involves organizations with a comprehensive CPM approach that is moving toward a performance management and data driven analytic culture. Planning processes become dynamic and can be conducted as frequently as changing business conditions require. Both corporate and operational participants contribute, collaborate and analysis information. The organizations experience valuable new business insights and greater organizational agility. Here you have almost reached the final stage of CPM Maturity, there just may be a few new CPM capabilities that will enable new business value. The high end of this level of maturity includes the use of an enterprise metrics framework. Most organizations are struggling to achieve this, and typically have a plethora of metrics that are disconnected and inconsistently defined. These are usually accessed through disconnected dashboards that may look pretty, but do little to improve the way performance is managed. Enterprise Metrics framework serves two purposes: It provides a common set of metrics that can be consistently measured and managed across an organization. It links achievement of corporate goals and objectives with operational activities. Recommendations: Monitor the every evolving market place for new developments (technology, techniques) for ways to enable increased business value. Level 5 – Transformative Here we have reached the pinnacle of CPM maturity. The business is driven by business strategy, strategy is linked to execution and decisions are made off of relevant decision making information. Keep in mind achieving this level is rare, it is a model to strive for and some capabilities are just not fully supported by CPM solutions yet, given technical gaps. By businesses understanding the value of CPM and where their organization may be sitting in the CPM maturity curve it can be a catalyst for businesses to further support evaluating CPM and implementing a solution such as CPM software. Where do you fit? Most organizations that we speak to are around Level 1 / Level 2; Prophix can help you move through the maturity model. Start with the area that makes sense for your organization, and move and expand over time , all with one unified solution.
HOW CPM APPLICATIONS ADDRESS EACH LEVEL
Revenue Planning
Budgeting
Reporting
Analysis
Collaboration
Workflow
Dashboards
& Scorecards
Strategic Planning
Consolidations
Forecasting
Personnel Planning
Best in class companies spend less time searching for data and more time making timely business decisions
Presenter
Presentation Notes
*This slide builds and allows you to talk through the levels of the maturity model Gartner, a leading Industry Analyst, has created what they call a CPM Maturity Model. The purpose is to create the foundation for an enterprise-wide approach to performance management. The model is ultimately meant to be a framework for aligning and measuring financial processes, organizational process and operational execution. The key is in creating structure and process while linking strategy to operational execution. The model measures the Maturity of an organization’s Performance Management infrastructure/process/culture. Gartner defines five levels of Maturity. Level 1 Unaware This level as basically spreadsheet anarchy. CPM processes are performed in a highly inefficient manner because they typically involve the use of only spreadsheets or a combination of spreadsheets and-or homegrown-outdated products to consolidate financial results. Budgeting is done at a high level, low accountability across the organization Planning is a very resource intensive annual process that finance controls. Financial Reporting is labour intense, difficult to audit, carries high risk, often is inconsistent and/or error prone Typically these financial processes are viewed as a “necessary evil”, however may not provide business value. Recommended Actions: Start with small steps! Don’t rush out to change the world in one big bang. Look for quick PM wins, to gain organizational support for future more strategic PM goals. Assess current compliance needs, determine if manual compliance processes can be automated. Assess your consolidation and close process. Are there efficiencies to be gained by streamlining these processes? Implementing FC or close systems/processes can help bolster immediate tactical goals Compare current Budgeting processes. Building infrastructure here to reduce manual/error prone/limited budgeting processes will be a foundation for more sophisticated planning and forecasting. Level 2 – Opportunistic At this level the organization has implemented one or more CPM applications to address things such as consolidation, reporting, budgeting and/or forecasting. Efficiency and accuracy have increased however they are largely siloes. It does not tend to provide business value because the planning is short-term focused, with only finance involved. Planning and forecasting processes exist and may be supported within the CPM application, however CPM applications are typically supporting budgeting at a summary level of detail (typically mirroring the chart of accounts), which is meaningful to corporate, but disconnected from operational planning efforts. CPM applications don't link corporate finance and operational planning processes. This situation addresses the most glaring, finance-oriented CPM needs. This is where many organizations get stuck, why: They regard CPM as a tool to help finance streamline financial processes They are unaware of the systems/tools available in the market place They lack resources and vision for how PM can strategically alter their organization Recommendations to move to the next level: Assess where data outputs from current CPM infrastructure can be leveraged and used to improve business analytics Become more sophisticated in budgeting, planning and forecasting Support more driver and analytic based plans. Allow users to model financial outcomes by varying business drivers Involved business users at operational levels to contribute assumptions and create buy in Consider planning at more granular levels, with action-oriented levers that front line managers can contribute Ensure frequency of planning, meets the volatility of your business Level 3 - Standards This level describes an organization who has implemented several CPM modules, capture additional efficiencies within finance and start to create business value through greater operational insight, collaboration and organizational agility. CPM is not only used by finance but by other key operational units and stakeholders in the business. Organizations at this level have more-frequent planning, multiple stakeholders are involved, enhanced financial analytics and more granular operational reporting. Greater organizational agility and control is attained by linking corporate and operational plans, that more accurately model results from action-oriented drivers and significant events. Planning and Forecasting efforts include: More detailed operational data More frequent replanning as business conditions dictate Involvement of 100s or 1000s of people from within the organization to contribute or consume information (both numeric and commentary) TWO KEY Concept: CPM is no longer seen as a set of applications exclusively used within corporate finance. In addition to creating efficiencies, CPM applications are being used to create business value Recommendations to improve: Formalize your approach to strategy management Document strategy management processes Encourage management to identify leading indicators of Performance Educate C-Level on how technology can enable performance-driven cultures Level 4 – Enterprise This level involves organizations with a comprehensive CPM approach that is moving toward a performance management and data driven analytic culture. Planning processes become dynamic and can be conducted as frequently as changing business conditions require. Both corporate and operational participants contribute, collaborate and analysis information. The organizations experience valuable new business insights and greater organizational agility. Here you have almost reached the final stage of CPM Maturity, there just may be a few new CPM capabilities that will enable new business value. The high end of this level of maturity includes the use of an enterprise metrics framework. Most organizations are struggling to achieve this, and typically have a plethora of metrics that are disconnected and inconsistently defined. These are usually accessed through disconnected dashboards that may look pretty, but do little to improve the way performance is managed. Enterprise Metrics framework serves two purposes: It provides a common set of metrics that can be consistently measured and managed across an organization. It links achievement of corporate goals and objectives with operational activities. Recommendations: Monitor the every evolving market place for new developments (technology, techniques) for ways to enable increased business value. Level 5 – Transformative Here we have reached the pinnacle of CPM maturity. The business is driven by business strategy, strategy is linked to execution and decisions are made off of relevant decision making information. Keep in mind achieving this level is rare, it is a model to strive for and some capabilities are just not fully supported by CPM solutions yet, given technical gaps. By businesses understanding the value of CPM and where their organization may be sitting in the CPM maturity curve it can be a catalyst for businesses to further support evaluating CPM and implementing a solution such as CPM software. Where do you fit? Most organizations that we speak to are around Level 1 / Level 2; Prophix can help you move through the maturity model. Start with the area that makes sense for your organization, and move and expand over time , all with one unified solution.
On average, a full time employee during a 40 hour work week spends 8.7 hours or 22% of time searching for the right information. Based on IDC research and factoring in a 50% increase in productivity (4.35 hours) with using a CPM solution, has the potential to save $6,526 a year
through improved operational efficiencies and individual employee performance.
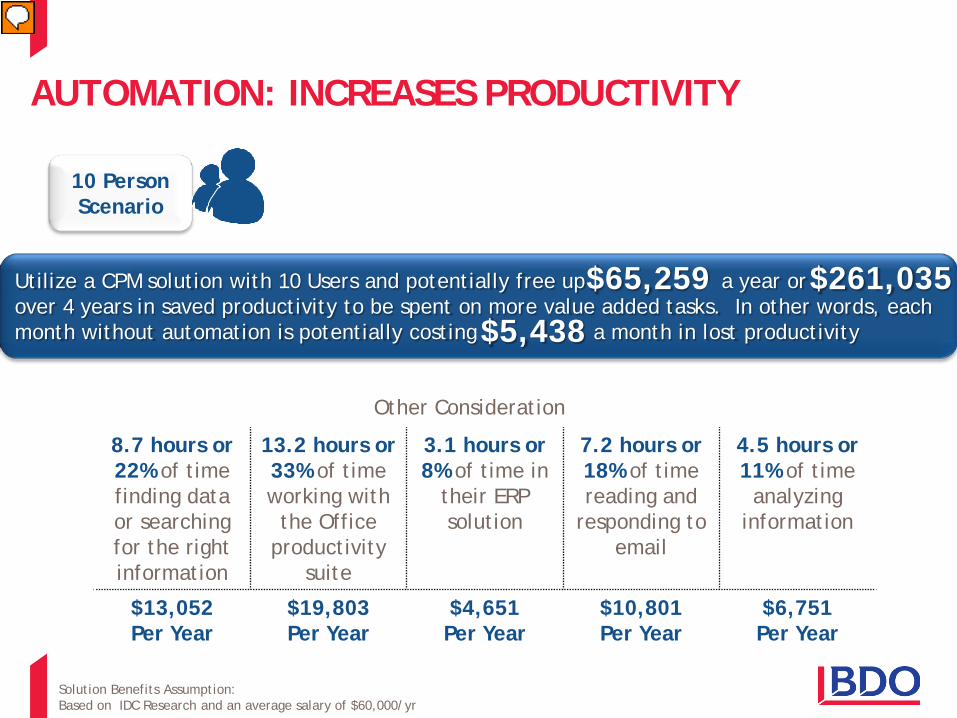
Utilize a CPM solution with 10 Users and potentially free up a year or over 4 years in saved productivity to be spent on more value added tasks. In other words, each month without automation is potentially costing a month in lost productivity
1 Person Scenario
AUTOMATION: INCREASES PRODUCTIVITY
10 Person Scenario
Solution Benefits Assumption: Based on IDC Research and an average salary of $60,000/yr
$65,259 $261,035
$5,438
8.7 hours or 22% of time finding data or searching for the right information
13.2 hours or 33% of time working with
the Office productivity
suite
3.1 hours or 8% of time in
their ERP solution
7.2 hours or 18% of time reading and
responding to email
4.5 hours or 11% of time
analyzing information
$13,052 Per Year
$19,803 Per Year
$4,651 Per Year
$10,801 Per Year
$6,751 Per Year
Other Consideration
Presenter
Presentation Notes
Based on IDC research the average information worker during a 40 hour work week spends: 8.7 hours or 22% of time finding data or searching for the right data/information Assumption: If we base this time on an average salary of $60,000 for an information worker it translates to $13,052 per year, per user 13.2 hours or 33% of time on various tasks such as working with Office productivity suites (creating, reviewing and distributing reports or other documents, preparing presentations etc.) Assumption: If we base this time on an average salary of $60,000 for an information worker it translates to $19,803 per year, per user. 3.1 hours or 8% of time in their ERP solution Assumption: If we base this time on an average salary of $60,000 for an information worker it translates to 4,651 per year, per user. 7.2 hours or 18% of time reading and responding to e-mail. Assumption: If we base this time on an average salary of $60,000 for an information worker it translates to $10,801 per year, per user. 4.5 hours or 11% of time analyzing information Assumption: If we base this time on an average salary of $60,000 for an information worker it translates to 6,751 per year, per user. Think of what you and your colleagues can accomplish by reducing the amount of time spent on non-value added tasks, such as creating reports and searching for data and taking more time on making decisions, the odds are that we will make better, smarter decision, faster than your competition with increased productivity.
5 STEPS TO HELP YOU START YOUR CPM JOURNEY
Presenter
Presentation Notes
Establish the right set of goals and objectives Focus on a few critical objectives (what I call difference makers) Establish clear timeframes Establish clear responsibilities Make them challenging but attainable Think critically about the challenge Reframe problems to get to the bottom of things, in terms of root causes Challenge current beliefs and mindsets, including your own Uncover hypocrisy, manipulation, and bias in organizational decisions Tying them to shareholder value (find a relevant, direct connection) Perform analysis to validate the goals/objectives Generally , historical data analysis perhaps using multiple modeling techniques Carefully synthesize available information: Seek patterns in multiple sources of data Encourage others to do the same Question prevailing assumptions and test multiple hypotheses simultaneously Consider the effect of step functions relevant range of activity, output for a given set of inputs
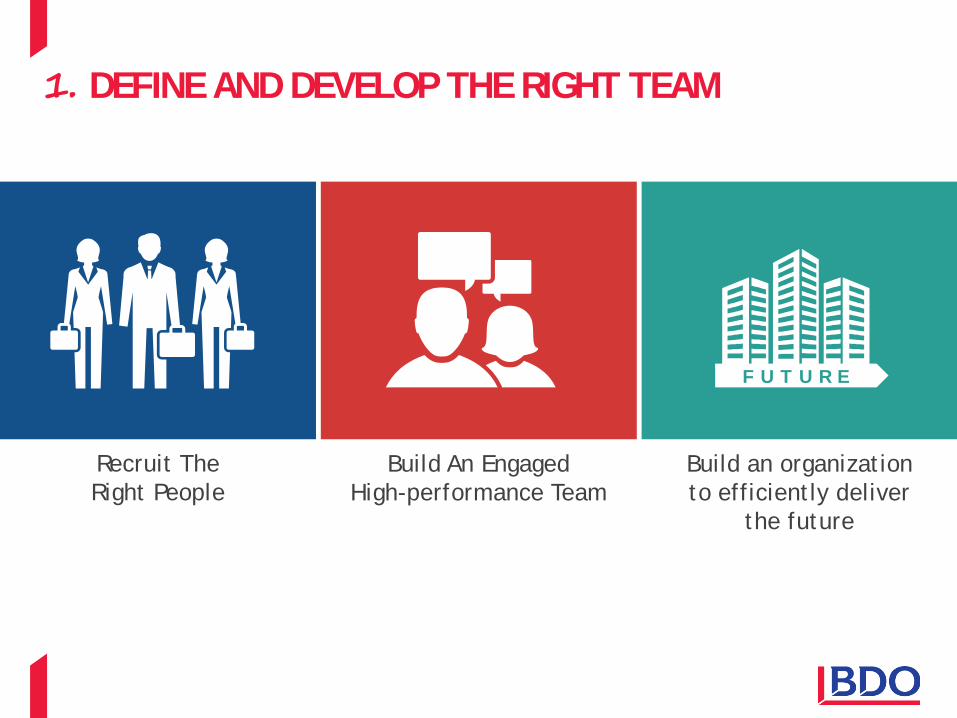
1. DEFINE AND DEVELOP THE RIGHT TEAM
Recruit The Right People
Build An Engaged High-performance Team
Build an organization to efficiently deliver
the future
F U T U R E
Communication skills Analytical skills
Industry Knowledge Technology knowledge
Leadership skills Change management skills
Regulatory compliance Deeper knowledge of geographic markets
Performance reporting and analytics Project management skills
Set metrics to measure progress/accomplishments Resource allocation and assignments Build and monitor consensus
Measure The Right Things
Tie Measurements & Metrics Goals/Objectives/Forecasts
Build a Risk Process (Low, Medium, High)
3. ESTABILISH RELEVANT METRICS
What you monitor, you can measure; what you measure you will manage.
Presenter
Presentation Notes
Analytics is Key to Risk Analysis and Responsiveness
Forrester - Align Financial Processes And Systems For Better Business Value And Compliance, August 2011
Plan and Predict • Plan and Strategize
• Set Goals • Budget
• Forecast
Measure and Optimize • Measure • Analyze • Resolve
• Optimize
Report and Comply • Account
• Consolidate • Report • Comply
4. LINK STRATEGY, EXECUTION AND REPORTING
Financial Systems and Data
Future
Present
Past
Understand the Past. Navigate the Present. Redefine the Future.
Presenter
Presentation Notes
It starts with building a Performance Management process – setting goals and strategies and rolling out budgets and plans against them, analyzing performance against goals, and reporting results – in most organizations this process happens sporadically, or with siloed spreadsheets.
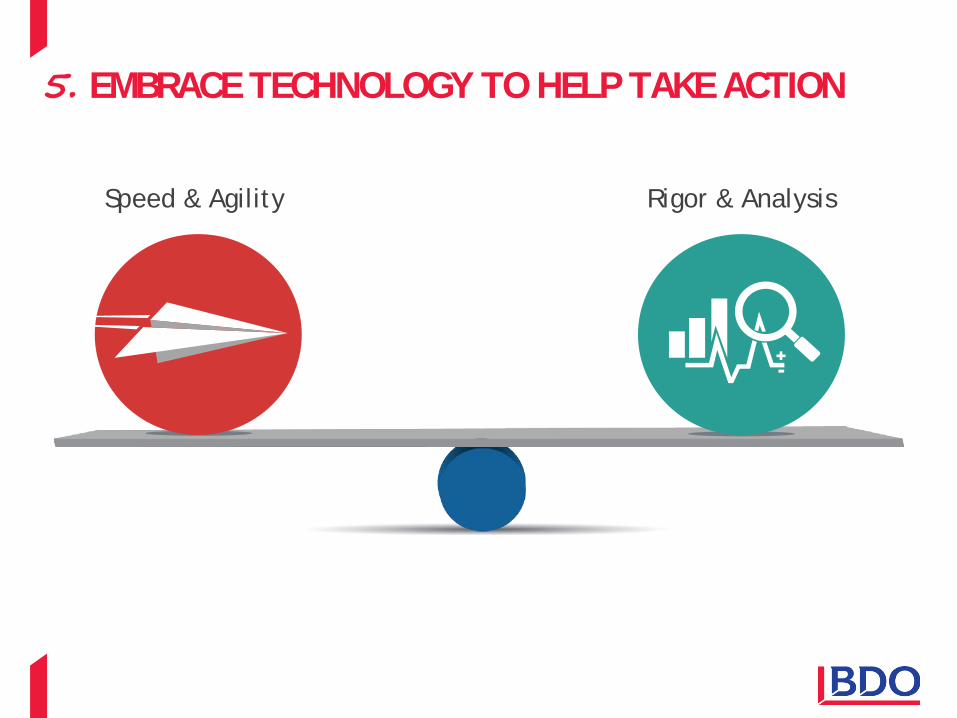
Speed & Agility Rigor & Analysis
5. EMBRACE TECHNOLOGY TO HELP TAKE ACTION
Automation of repetitive processes
increases productivity
Get organizational buy in to Performance
Management
Understand what “Level” of maturity
your school is at
Change management begins with assembling the right culture and
attitude
Help your managers run their businesses
more effectively
Failure to act is often the biggest failure of
all
KEY TAKEAWAYS
BEST PRACTICES & EVALUATION CONSIDERATION Questions to ask on your Cloud journey
5 BUSINESS PLANNING BEST PRACTICES
Switch From a Fixed Budget Process to Using Rolling Forecasts: o Business agility is important and as such plans should never be out of date o Automate the import of actuals to compare against plan and re-forecasts o Enable employees to work in tandem towards organizational goals
Automate Repetitive Processes (Spreadsheets):
o Spend less time collecting the data and more time analyzing it o Streamline and automate manually intensive and error prone processes o Enable spreadsheets to becomes a tool to leverage, not the tool of record
Utilize Driver Based Plans and Different Scenarios:
o Access historical data and trends for planning, budgeting and forecasting o Create detailed plans including revenue and utilization of key driver o Effectively scenario plan through what if analysis
1
2
3
5 BUSINESS PLANNING BEST PRACTICES
Enable Enterprise Wide Collaboration: o Make the execution of strategy an ongoing process, not a onetime event o Employee accountability helps drive both behaviour and performance o Break down data silos with a unified view the business
Close and Disclose Quickly:
o Gain visibility into real performance vs. plan in a timely, repeatable manner o Provide Finance the tools to reach into operations o Equip employees with self service analysis, reporting and dashboards
4
5
STARTING A CHANGE MANAGEMENT INITIATIVE
Consider the 5 primary change drivers to technology adoption: o Growth o Profitability o Control o Risk Reduction o Cost Reduction
For each of the 5 primary drivers ask yourself:
o Tactically, what are you trying to accomplish? o Operationally, how are you going to accomplish it? o Strategically, why are you doing this?
Steps to consider in your evaluation:
o List the challenges and needs from your employees (system audit) o Remember that you’re evaluating processes not features and functions o Evaluate for configuration not customization o Involve your team early and often (effective change management) o When in doubt work with industry leaders
1
2
3
CONSIDERATIONS FOR WHEN EVALUATING OPTIONS
Functionality:
o Seeing the forest for the trees
o Recognizing most will meet your needs
o All things being equal the remaining 4 drivers become the basis for a decision
Costs:
o Operational expense vs. Capital expense projects
o Total Cost of Ownership and Return on Investment = Overall Value
o All things being equal doing business is getting easier
Timing:
o Current vs. long term needs
o Understanding where you’re with your business cycle
o A healthy backlog is a positive – its not when you can start, but finish
1
2
3
5 decision metrics when selecting the right technology and vendor
CONSIDERATIONS FOR WHEN EVALUATING OPTIONS
Viability: o Partner viability is more important today than ever before o Is there a supporting partner ecosystem or is it proprietary o Work with those you can see doing business with
Technology:
o IT mandated ecosystem or endorsement o What is right for your business the Cloud or On Premise
4
5
Understand the impact of not only the right technology, but business partner will have on your project
QUESTIONS?
THANK YOU FOR YOUR TIME
BDO Solutions specializes in the selection, implementation and support of business solutions