retiree benefits in public pension systems -...
TRANSCRIPT

Retiree Benefits in Public Pension Systems
Law Enforcement Officers' and Fire Fighters' (LEOFF) Plan 2 Retirement Board
December 12, 2012
Annie Pennucci, John Bauer, and Stephanie LeeWashington State Institute for Public Policy
www.wsipp.wa.gov
OvertimeOvertimePortabilityPortabilityState PlansState PlansBackground
Washington State Institute for Public Policy
Created by the 1983 Legislature
Mission: carry out non-partisan research on projects assigned by the Legislature or Board of Directors
Senator Mike CarrellSenator Karen FraserSenator Jeanne Kohl-Welles Representative Glenn AndersonRepresentative Cary CondottaRepresentative Phyllis KenneyKen Conte, House Staff
Richard Rodger, Senate Staff
Stan Marshburn, OFM DirectorKari Burrell, Gov. Policy Office Sandra Archibald, Univ. of WALes Purce, The Evergreen State Col.Robert Rosenman, WA State Univ.Higher education vacancy
Board of DirectorsSenator Mark Schoesler, Co-Chair
Representative Mary Lou Dickerson, Co-Chair
Slide 2 of 20Washington State Institute for Public Policy December 12, 2012
OvertimeOvertimePortabilityPortabilityState PlansState PlansBackground
Study Assignment
“conduct an evaluation of the benefits provided in the pension plans offered by public employers in the state”
• Compare benefit levels across public retirement plans.
• Identify barriers to portability of retirement benefits among public employers in the state.
• Describe how “excess compensation” (including overtime) is handled in pension calculations.
Supplemental Operating Budget § 606 (13), 2012 Wash. Sess. Laws 2225
Link to report: http://www.wsipp.wa.gov/rptfiles/12-12-4101r.pdf
Slide 3 of 20Washington State Institute for Public Policy December 12, 2012

OvertimeOvertimePortabilityPortabilityBackgroundBackground State Plans
Comparing Benefit Levels Across State Plans
• “Income replacement” measure
• Assumptions:
Two hypothetical employees: age 65 & 55 with 30 years of service
Salary levels based on recent Washington retirees
Default contribution rates, median benefit multipliers
• Limitations:
Measure does not include Social Security, private savings/investments, COLA, health benefits
Assumptions about annuity purchases may not reflect actual behavior
Slide 4 of 20Washington State Institute for Public Policy December 12, 2012
OvertimeOvertimePortabilityPortabilityBackgroundBackground State Plans
0% 20% 40% 60% 80% 100%
California CalPERS 2Connecticut SERS 3
Georgia GSEPSMaryland ETPSMontana PERS
Tennessee TCRSFlorida FRS
Missouri MSEP 2011Illinois SERS 2Indiana PERF
Indiana TRFWisconsin WRS - DBNew Jersey TPAF 5New Jersey PERS 5
Minnesota GERPVirginia VRS 2Montana TRS
Vermont VSERS FVermont VSTRS C
South Dakota SDRSHawaii ERS Hybrid
Kansas KPERS 2Michigan SERS
Utah PERS 2 - DCUtah PERS 2
South Carolina SCRS 3Washington SERS 3
Washington TRS 3Washington PERS 3
Minnesota TRA 2Delaware SEPP
New York NYSTRS 6New York PERS 6
North Dakota TFFR 2Oklahoma TRS
West Virginia TRSWyoming PEPP 2
Washington PERS 2Washington SERS2
Washington TRS2Mississippi PERS 4
North Carolina TSERSMichigan PPRP
Idaho PERSIIowa IPERS
Nebraska SPPOklahoma PERS
Pennsylvania SERSWest Virginia PERS
Rhode Island ERSRIAlabama ERSAlabama TRSGeorgia TRS
Arizona ASRSSouth Carolina SCORP
Montana DCRPArkansas ATRS
Arkansas APERSNew Mexico NMERB
Texas ERSCalifornia CalSTRS
Pennsylvania PSERSOregon OPSRP
North Dakota NDPERS
Age 65, general/teacher Age 55, general/teacher
0% 20% 40% 60% 80% 100%
Ohio OPERS - MDPIllinois SERS 2
South Carolina SCRS 3Virginia VRS 2Utah PERS 2
North Dakota TFFR 2Maryland ETPS
Iowa IPERSRhode Island ERSRI
Minnesota GERPIdaho PERSI
New York NYSTRS 6New York PERS 6Minnesota TRA 2
Washington PERS 2Washington SERS2
Washington TRS2California CalPERS 2
New Jersey TPAF 5New Jersey PERS 5Washington SERS 3
Washington TRS 3Washington PERS 3
Oklahoma PERSOklahoma TRS
Kansas KPERS 2California CalSTRS
Florida FRSHawaii ERS Hybrid
Connecticut SERS 3Georgia GSEPSMichigan SERS
Utah PERS 2 - DCWisconsin WRS - DB
Montana PERSTennessee TCRS
Indiana PERFIndiana TRF
Michigan PPRPPennsylvania SERS
Arkansas ATRSMontana TRS
Vermont VSERS FVermont VSTRS C
South Carolina SCORPSouth Dakota SDRSMissouri MSEP 2011
Montana DCRPDelaware SEPP
West Virginia TRSWyoming PEPP 2
Mississippi PERS 4North Carolina TSERS
Oregon OPSRPNebraska SPP
West Virginia PERSAlabama ERSAlabama TRSGeorgia TRS
Arizona ASRSPennsylvania PSERS
Arkansas APERSNew Mexico NMERB
Texas ERS
Slide 5 of 20Washington State Institute for Public Policy December 12, 2012
OvertimeOvertimePortabilityPortabilityBackgroundBackground State Plans
Age 65, police/fire Age 55, police/fire
0% 20% 40% 60% 80% 100%
Georgia GERSUtah PSFRS 2 DCTennessee TCRSVirginia SPORS 2
North Carolina SLEOMaryland LEOPS
Rhode Island SPRBTVirginia VaLORS 2
Washington PSERS 2Washington WSPRS 2Washington LEOFF 2Connecticut HDP 2A
South Dakota Class BWisconsin WRSAlabama AERS
South Carolina PORSNew York PFRS 6
Hawaii ERSIdaho IPERS
Illinois SERS 2Minnesota CERP
Oregon PSRPIndiana POFP
Arizona PSPRS 2Kentucky SPRS
Arkansas ASPRS 2California CalPERS 2
Kansas KPF 2New York SRS 5
Ohio PERSVermont VSERS C
Maryland SPRSOklahoma PPRS
Pennsylvania SERSNorth Dakota NDPERS
Iowa PERSFlorida FRS
Texas LECOSWyoming WRSAlabama AERSUtah PSFRS 2
Minnesota PERANew Mexico PERF
0% 20% 40% 60% 80% 100%
Illinois SERS 2Utah PSFRS 2 DC
Pennsylvania SERSGeorgia GERS
Tennessee TCRSWashington PSERS 2
Virginia SPORS 2North Carolina SLEO
Maryland LEOPSRhode Island SPRBT
Virginia VaLORS 2Washington WSPRS 2Washington LEOFF 2Connecticut HDP 2A
South Dakota Class B -…Wisconsin WRSAlabama AERS
South Carolina PORSNew York PFRS 6
Hawaii ERSOregon PSRPIdaho IPERS
Minnesota CERPIndiana POFP
Arizona PSPRS 2Kentucky SPRS
Arkansas ASPRS 2California CalPERS 2
Kansas KPF 2New York SRS 5
Ohio PERSVermont VSERS C
Maryland SPRSOklahoma PPRS
North Dakota NDPERSUtah PSFRS 2
Iowa PERSFlorida FRS
Texas LECOSWyoming WRSAlabama AERS
Minnesota PERANew Mexico PERF
Slide 6 of 20Washington State Institute for Public Policy December 12, 2012

OvertimeOvertimeState PlansState PlansBackgroundBackground Portability
Local Public Pensions in Washington
• LEOFF was created in 1970 to consolidate local police and firefighter plans
• Most local governments participate in state plans
• Exceptions:
Seattle
Spokane
Tacoma
Lakewood
Sound Transit
Slide 7 of 20Washington State Institute for Public Policy December 12, 2012
OvertimeOvertimeState PlansState PlansBackgroundBackground Portability
58%
22%
37%38%
20%27%
0%
20%
40%
60%
80%
100%
DB DC Hybrid
Inc
om
e r
ep
lac
em
en
t
Employee A(stable)
Employee B(mobile)
Employee Job Mobility & Pension PortabilityStable vs. Mobile Employees in Hypothetical Plans
Slide 8 of 20Washington State Institute for Public Policy December 12, 2012
OvertimeOvertimeState PlansState PlansBackgroundBackground Portability
Washington State Portability Laws & Rules
• Dual membership:
Combine service credit across jobs for eligibility
Use highest salary across jobs
Purchase service credit
An option for most state plans (including LEOFF 2) and Seattle, Spokane, Tacoma
Does not apply to Lakewood, Sound Transit, other DC plans
Slide 9 of 20Washington State Institute for Public Policy December 12, 2012

PortabilityPortabilityState PlansState PlansBackgroundBackground Overtime
Department of Retirement Systems (DRS) data
• Members retiring from state plans 1/2009 to 6/2012:
Demographics, employer, pension plan, retirement date, average final compensation (AFC), cash-outs, excess comp.
Earnings history: compensation and hours worked up to ten years prior to retirement.
• Limitations – overtime hours and earnings not reported separately; no indication if mandatory or voluntary
Human Resource Management System (HRMS) data
• Covers state agency employees
Overtime and Excess Compensation Data
Slide 10 of 20Washington State Institute for Public Policy December 12, 2012
PortabilityPortabilityState PlansState PlansBackgroundBackground Overtime
Worker 1: no overtime
Worker 2: no overtime until last 5 years of career, then 20 hours/month
For Worker 2:
Pension benefits higher than anticipated
Contributions cover a small portion of costs
$0
$10,000
$20,000
$30,000
$40,000
$50,000
$60,000
$70,000
1 3 5 7 9 11 13 15 17 19 21 23 25 27 29
An
nu
al
sa
lary
Year in career
worker 1
worker 2
Stylized Example 1: End-of-Career Increases
Slide 11 of 20Washington State Institute for Public Policy December 12, 2012
PortabilityPortabilityState PlansState PlansBackgroundBackground Overtime
$0
$10,000
$20,000
$30,000
$40,000
$50,000
$60,000
$70,000
1 3 5 7 9 11 13 15 17 19 21 23 25 27 29
An
nu
al
sa
lary
Year in career
worker 1
worker 2
Stylized Example 2: Higher Hours Throughout Career
Worker 1: no overtime
Worker 2: consistent overtime hours throughout the career
For Worker 2:
Pension benefits higher as expected
Worker and employer contributions cover the costs
Slide 12 of 20Washington State Institute for Public Policy December 12, 2012

PortabilityPortabilityState PlansState PlansBackgroundBackground Overtime
$0
$2,000
$4,000
$6,000
$8,000
$10,000
119
113
107
101
95 89 83 77 71 65 59 53 47 41 35 29 23 17 11 5
Mo
nth
ly S
alar
y
Months to RetirementMA = moving average
LEOFF2
PERS2
TRS2(MA)
SERS2(MA)
SERS3(MA)
Average Earnings
Earnings rise with tenure for several reasons
These increases impact AFC levels
Seniority-based pay systems have advantages
Average Earnings Profiles for Washington Open Public Plans, Retirements from January 2009 to June 2012
Slide 13 of 20Washington State Institute for Public Policy December 12, 2012
PortabilityPortabilityState PlansState PlansBackgroundBackground Overtime
Average Hours
Higher earnings/hour, not hours worked, typically drive earnings growth
Avg. monthly hours not systematically higher during AFC periods
Average hours across plans and employer groups vary widely
Average Hours Profiles for Washington Open Public Plans, Retirements from January 2009 to June 2012
Slide 14 of 20Washington State Institute for Public Policy December 12, 2012
100
120
140
160
180
200
220
240
119
113
107
101
95 89 83 77 71 65 59 53 47 41 35 29 23 17 11 5
Mo
nth
ly H
ou
rs W
ork
ed
Months to RetirementMA = moving average
LEOFF 2
PERS 2
TRS 2(MA)SERS 2(MA)SERS 3(MA)
PortabilityPortabilityState PlansState PlansBackgroundBackground Overtime
Average Hours Before & During AFC Period
System/ Plan
NAvg. Hrs Pre-
AFCAvg. Hours
AFCDifference
Std Dev AFC Avg.
LEOFF1 109 186.3 182.9 -3.40 21.8
LEOFF2 731 195.4 194.9 -0.50 26.1
PERS1 3,577 170.2 169.3 -0.90 18.8
PERS2 6,182 173.0 172.1 -0.90 17.8
PERS3 158 171.1 169.0 -2.10 20.1
SERS2 1,115 147.2 146.1 -1.10 28.0
SERS3 251 143.0 140.8 -2.20 26.9
TRS1 1,968 153.1 154.1 1.00 18.7
TRS2 558 143.6 141.3 -2.30 14.1
TRS3 258 141.0 139.1 -1.90 18.3
WSPRS1 99 180.3 177.2 -3.10 9.7
Slide 15 of 20Washington State Institute for Public Policy December 12, 2012

PortabilityPortabilityState PlansState PlansBackgroundBackground Overtime
Variation in Hours Increases
Across all systems, roughly 3% of retirees worked 20 or more additional hours per month during AFC periods than before.
Difference in Average Monthly Hours: All Systems and Plans
Slide 16 of 20Washington State Institute for Public Policy December 12, 2012
PortabilityPortabilityState PlansState PlansBackgroundBackground Overtime
Variation in Hours Increases
Most work roughly the same hours before and during the AFC period.
Those who work overtime at the end of their career tended to do so earlier.
There are exceptions; extreme increases in hours are rare.
Hours decline for some members.
Retirees by Average Hours Before and During AFC Period: All Systems & Plans
Average Monthly Hours: AFC Period
(1) <128 (2) 128‐149 (3) 150‐166 (4) 167‐179 (5) 180‐192 (6) 193‐214 (7) 215+
Average Hours: Pre‐AFC (15‐29/wk) (30‐34/wk) (35‐38/wk) (39‐41/wk) (42‐45/wk) (45‐49/wk) (50+/wk)
(1) <128 (15‐29/wk) 699 131 35 20 3 0 1
(2) 128‐149 (30‐34/wk) 240 1153 382 65 11 7 2
(3) 150‐166 (35‐38/wk) 47 470 1189 369 32 5 9
(4) 167‐179 (39‐41/wk) 29 107 413 7151 357 34 13
(5) 180‐192 (42‐45/wk) 0 6 37 543 577 134 16
(6) 193‐214 (45‐49/wk) 1 2 4 59 137 236 50
(7) 215+ (50+/wk) 0 0 0 14 15 36 165
Slide 17 of 20Washington State Institute for Public Policy December 12, 2012
PortabilityPortabilityState PlansState PlansBackgroundBackground Overtime
Variation in Hours Increases
Detail for LEOFF 2
LEOFF 2 Retirees by Average Hours Before and During AFC Period
Average Monthly Hours: AFC Period
(1) <128 (2) 128‐149 (3) 150‐166 (4) 167‐179 (5) 180‐192 (6) 193‐214 (7) 215+
Average Hours: Pre‐AFC (15‐29/wk) (30‐34/wk) (35‐38/wk) (39‐41/wk) (42‐45/wk) (45‐49/wk) (50+/wk)
(1) <128 (15‐29/wk) 0 0 0 0 0 0 0
(2) 128‐149 (30‐34/wk) 0 0 0 0 0 0 0
(3) 150‐166 (35‐38/wk) 0 0 9 4 2 2 1
(4) 167‐179 (39‐41/wk) 0 0 2 180 40 2 1
(5) 180‐192 (42‐45/wk) 0 1 0 53 126 28 4
(6) 193‐214 (45‐49/wk) 0 0 0 11 24 93 23
(7) 215+ (50+/wk) 0 0 0 4 3 14 104
Slide 18 of 20Washington State Institute for Public Policy December 12, 2012

PortabilityPortabilityState PlansState PlansBackgroundBackground Overtime
Variation in Hours Increases
Detail for LEOFF 2
N Avg Hrs Pre-AFC
Avg Hours AFC
Std Dev AFC Avg
All LEOFF2 731 195.4 194.9 26.1 OSA Category Law Enforcement Officer 1st Class City 125 184.90 183.46 13.24
Law Enforcement Officer Other City 174 185.50 184.30 13.98
Sheriff or Deputy Sheriff 136 184.28 183.84 17.13
Fire Fighter 1st Class City 102 209.26 208.08 20.95
Fire Fighter Other City 171 213.15 214.38 34.39
Slide 19 of 20Washington State Institute for Public Policy December 12, 2012
PortabilityPortabilityState PlansState PlansBackgroundBackground Overtime
State Policies on Pensions and Overtime
Slide 20 of 20Washington State Institute for Public Policy December 12, 2012
• “Excess compensation” charges: WA, IL
• Limit AFC as % of final salary or as a $ amount (less than half of states)
• Set longer AFC period (FL, IL at 10 years)
• Exclude overtime from AFC (28 states)
• Exclude leave cash-outs from AFC (about half of states)
AFC = average final compensation

1
The 2012 Legislature directed the Washington State Institute for Public Policy (Institute) to evaluate pension benefits provided by public employers in Washington and other states.1 The legislation calls for an examination of public plans’:
benefit levels and adequacy;
benefit portability; and
impacts from overtime and excess compensation.
The assignment is detailed in Appendix A. The Institute consulted with the Office of the State Actuary, Department of Retirement Systems, and local government plan sponsors in conducting this study.2 We surveyed public pension plans in the 50 states to compare benefit levels. We also analyzed state data on recent retirees in Washington State to examine overtime and excess compensation. Finally, we contracted with a professional actuary who has expertise in public employee retirement systems to review our methods and findings.3 The report is organized in three parts:
Part 1: Public Pensions in Washington and Other States
Part 2: Portability of Local Public Pensions
Part 3: Overtime and Excess Compensation Analysis
1 Supplemental Operating Budget § 606 (13), 2012 Wash. Sess.
Laws 2225 2 Suggested citation: Pennucci, A., Bauer, J., Lee, S., &
DeShazo, A. (2012). Retiree benefits in public pension plans (Document No. 12-12-4101r). Olympia: Washington State Institute for Public Policy. 3 Mark C. Olleman, FSA, MAAA, EA, Consulting Actuary with
Milliman. http://www.milliman.com/why-milliman/consultants/olleman-mark.php
Summary
The 2012 Legislature directed the Institute to evaluate three topics related to public pension policies: benefit levels, portability, and excess compensation.
Pension Benefit Levels. We surveyed all 50 states to analyze pension plan features and benefit levels. To provide an “apples-to-apples” comparison, we calculated pension benefits using an “income replacement” measure (the percentage of a worker’s salary replaced by the pension at the time of retirement).
We found that, for general state employees and teachers, Washington’s pension plans provide income replacement near the average of the state systems reviewed. For law enforcement and fire fighters, Washington’s benefit levels are in the lower end of the distribution among state pension plans.
Benefit Portability. We collected information about local public pension plans in Washington State. Most local governments enroll their employees in the state systems. We identified five public entities that sponsor their own plans. For defined benefit plans, Washington’s portability laws reduce, but do not eliminate, the reduction in benefits for workers who move between state and local public plans. The portability rules do not apply to defined contribution plans.
Excess Compensation. Washington’s excess compensation law requires public employers to increase contributions to the state pension fund if a retiree’s pensionable income is more than twice the salary earned in the last year of working. Such late-career compensation growth may be due to substantial increases in overtime hours.
To examine this issue, we analyzed salary histories of all recent state retirees. On average, we did not find systematic increases in hours worked in the years just prior to retirement. There are, however, exceptions; a small fraction of employees work substantially more in the years that determine their pension benefits than they did in earlier years.
We gratefully acknowledge the helpful assistance from the Office of the State Actuary and Department of Retirement Systems as we conducted this study.
Washington State Institute for Public Policy
110 Fifth Avenue Southeast, Suite 214 PO Box 40999 Olympia, WA 98504-0999 (360) 586-2677 www.wsipp.wa.gov
December 2012
RETIREE BENEFITS IN PUBLIC PENSION SYSTEMS This 12/5/12 revision corrects details about Seattle and Tacoma public pension plans on pages 13-14.
2
OVERVIEW
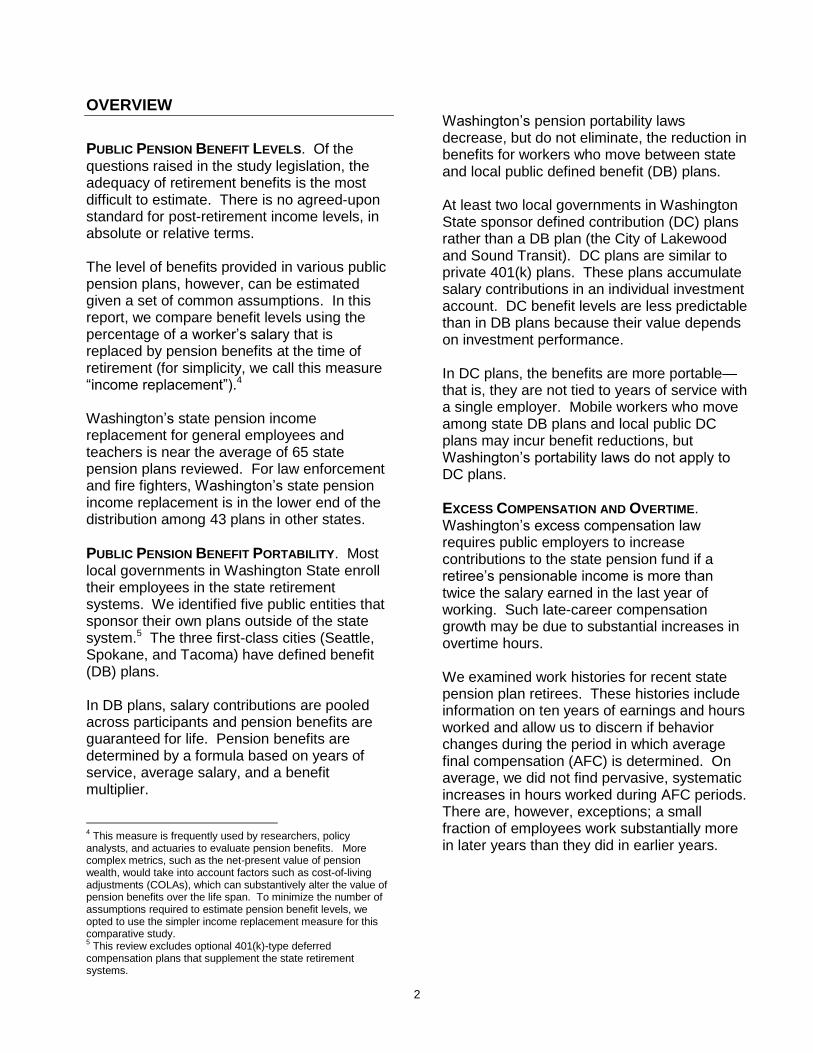
PUBLIC PENSION BENEFIT LEVELS. Of the
questions raised in the study legislation, the adequacy of retirement benefits is the most difficult to estimate. There is no agreed-upon standard for post-retirement income levels, in absolute or relative terms. The level of benefits provided in various public pension plans, however, can be estimated given a set of common assumptions. In this report, we compare benefit levels using the percentage of a worker’s salary that is replaced by pension benefits at the time of retirement (for simplicity, we call this measure “income replacement”).4 Washington’s state pension income replacement for general employees and teachers is near the average of 65 state pension plans reviewed. For law enforcement and fire fighters, Washington’s state pension income replacement is in the lower end of the distribution among 43 plans in other states.
PUBLIC PENSION BENEFIT PORTABILITY. Most local governments in Washington State enroll their employees in the state retirement systems. We identified five public entities that sponsor their own plans outside of the state system.5 The three first-class cities (Seattle, Spokane, and Tacoma) have defined benefit (DB) plans. In DB plans, salary contributions are pooled across participants and pension benefits are guaranteed for life. Pension benefits are determined by a formula based on years of service, average salary, and a benefit multiplier.
4 This measure is frequently used by researchers, policy
analysts, and actuaries to evaluate pension benefits. More complex metrics, such as the net-present value of pension wealth, would take into account factors such as cost-of-living adjustments (COLAs), which can substantively alter the value of pension benefits over the life span. To minimize the number of assumptions required to estimate pension benefit levels, we opted to use the simpler income replacement measure for this comparative study. 5 This review excludes optional 401(k)-type deferred
compensation plans that supplement the state retirement systems.
Washington’s pension portability laws decrease, but do not eliminate, the reduction in benefits for workers who move between state and local public defined benefit (DB) plans. At least two local governments in Washington State sponsor defined contribution (DC) plans rather than a DB plan (the City of Lakewood and Sound Transit). DC plans are similar to private 401(k) plans. These plans accumulate salary contributions in an individual investment account. DC benefit levels are less predictable than in DB plans because their value depends on investment performance. In DC plans, the benefits are more portable—that is, they are not tied to years of service with a single employer. Mobile workers who move among state DB plans and local public DC plans may incur benefit reductions, but Washington’s portability laws do not apply to DC plans.
EXCESS COMPENSATION AND OVERTIME. Washington’s excess compensation law requires public employers to increase contributions to the state pension fund if a retiree’s pensionable income is more than twice the salary earned in the last year of working. Such late-career compensation growth may be due to substantial increases in overtime hours. We examined work histories for recent state pension plan retirees. These histories include information on ten years of earnings and hours worked and allow us to discern if behavior changes during the period in which average final compensation (AFC) is determined. On average, we did not find pervasive, systematic increases in hours worked during AFC periods. There are, however, exceptions; a small fraction of employees work substantially more in later years than they did in earlier years.

3
PART 1: PUBLIC PENSIONS IN WASHINGTON AND OTHER STATES
The Washington State Legislature directed the Institute to compare Washington’s state public pension plans with other states’ plans. We begin with an overview of Washington State pension systems, and then compare plan features and benefit levels among states. The sub-sections are organized as follows:
1A) Washington State Pension Plans
1B) Comparison of Public Pension Plans across the United States
1A. WASHINGTON STATE PENSION PLANS
Exhibit 1 lists Washington State’s major retirement systems.6 The systems provide pension benefits to general state employees, teachers and school staff, and public safety personnel. Each system includes one to three pension plans. Which plan employees join depends on where they work and when they were hired.
Exhibit 1 Washington State Pension Plans
System Plans
1 2 3
Public Employees' Retirement System (PERS)
Teachers' Retirement System (TRS)
School Employees' Retirement System (SERS)
Public Safety Employees' Retirement System (PSERS)
Law Enforcement Officers' and Fire Fighters' Retirement System (LEOFF)
Washington State Patrol Retirement System (WSPRS)
WSIPP survey of state plans (see Appendix B).
6 Because we had a short time frame for this study, we exclude
plans for judges (now closed to new employees, who now join PERS) and TIAA-CREF for higher education faculty (this plan is not administered by the state). We also exclude optional “deferred compensation” plans.
Plans 1. Washington State began offering public employee pensions soon after the creation of Social Security in 1935. The Teachers’ Retirement System (TRS) opened in 1938,7 and the Public Employees’ Retirement System (PERS) and Washington State Patrol Retirement System (WSPRS) followed in 1947. The Law Enforcement Officers' and Fire Fighters' Retirement System (LEOFF) opened in 1970 to consolidate local policy and fire fighters into a state system.8 These first generation pension plans were closed to new employees starting in 1977. Washington’s early public pension plans provide retirees with a “defined benefit”—a monthly payment for life based on a formula. The formula includes an employee’s years of service, highest salary, and a set benefit multiplier (2%):
Plans 1 Benefit Formula
Pension Benefit
= Up to 30 years of service
X
Average of 2 highest
salary years X
2% multi-plier
An employee must work five years before becoming eligible to eventually collect these benefits. This eligibility requirement is called “vesting.” A pensioner’s years of service, including vesting years, are counted in the benefit formula. Individuals can draw retirement benefits after 30 years of service.9 WSPRS and LEOFF have earlier retirement ages (see Appendix B for details). To illustrate: a state employee who retires after 30 years with $50,000 highest average salary would have a PERS annual pension benefit of $30,000:
7 The Judges Retirement Fund, now closed, pre-dated TRS by
one year (1937). 8 http://www.drs.wa.gov/employer/employerhand
book/chpt1/history.htm 9 Plans 1 members can also retire at age 60 (vested at five
years) or age 55 with 25 years of service.
For example:
$30,000 = 30 X $50,000 X 2%

4
Public employers and employees contribute a percentage of employee salaries to the pension fund.10 The combined contributions are invested by the Washington State Investment Board (WSIB). Investment returns pay for most of the plan’s benefits.11 If a person leaves state employment before vesting (five years), there is no formula benefit. The employee contributions plus interest can be withdrawn (with tax penalties) or rolled over into a new retirement account. If a member is vested and leaves employment before their retirement age, they have the option to leave their contributions in the account while accruing interest. A member may collect their benefit when they reach the age of normal retirement with five years of service. Plans 2. In 1977, Washington State opened new “Plan 2” pensions and PERS, TRS, and LEOFF (now referred to as “Plans 1”) were closed.12 New employees who would have previously joined Plans 1 instead enrolled in Plans 2. Like Plans 1, the new plans were designed to give retirees a “defined benefit” for life following the same basic formula, although there are differences in retirement ages and other provisions. The Plans 2 have a set retirement age; members cannot collect pensions before age 65 without reductions in benefits.13 The Plans 2 also have a longer time frame for the average final salary period (five years rather than two). There is no service cap for Plans 2 (service beyond 30 years counts in the benefit calculation) and Plans 2 members get an automatic cost-of-living adjustment (COLA).14
10
Plans 1 employees contribute 6% and employers contribute an actuarially determined amount. 11
http://www.leg.wa.gov/SCPP/Documents/2008/Pensions_101.pdf 12
One reason for this change was to address the actuarial funded status of the plans. As of November 2012, the PERS 1 funded ratio was 71% (81% for TRS 1); all other Washington State plans’ funded ratios are over 100%. See http://osa.leg.wa.gov/Actuarial_Services/Publications/PDF_Docs/Presentations/SOSP-WSIB11-15-12.pdf 13
The 2012 Legislature set the early retirement factors (ERFs) at a reduction of 5% of benefits per year younger than 65. 14
Up to 3% based on the Consumer Price Index (CPI). For Plans 1, COLAs are not automatic and must be authorized in new legislation, except for LEOFF 1 which has an automatic COLA.
Plans 2 Benefit Formula
Pension Benefit
= Years of service
X
Average of 5 highest
salary years X
2% multi- plier
WSPRS Plan 2 was created in 2003, after some systems had already introduced a new type of plan, the “Plans 3.” Plans 3. In 1996, Washington State began to offer teachers a “Hybrid” retirement option (TRS 3) which includes both a DB and a DC component. DC retirement plans are similar to 401(k) plans, which were becoming more common in the private sector. In DC plans, the accumulated contributions plus interest and investment returns are distributed as a lump sum upon retirement.15 The rationale for adding a DC component was to improve the portability of pensions, given an increasingly mobile workforce and desires to benefit from stock market gains during this period.16 In Washington State’s Plan 3 pensions, employees contribute to the DC component and employers contribute to the DB component. The defined benefit is half the amount as in Plans 1 and 2 (a 1% multiplier instead of 2%). The vesting period is longer (ten versus five years).17 Plans 3 early retirement requires fewer service credit years (ten versus twenty years as in Plans 2).
15
Retirees can also purchase annuities that convert the lump sum into a stream of payments similar to a DB plan. 16
The enacting legislation for TRS 3 indicated intent for “a new public retirement system that balances flexibility with stability, provides both increased employee control of investments and responsible protection of the public's investment in employee benefits, and encourages the pursuit of public sector careers without preventing employees from transitioning into other public or private sector employment.” Teachers’ retirement system plan III, 1995 Wash. Sess. Laws 805. 17
Plans 3 members can vest in five years if at least one year of service occurred when the employee was older than age 44.

5
Plans 3 Benefit Formula
Pension Benefit
= Years of service
X Average of 5 highest
salary years X
1% multi- plier
-plus-
Defined contributions, interest, and investment returns
Plans 3 in SERS and PERS were opened to new employees in 2000 and 2002. For the DC component, individuals can choose to invest 5-15% of their salary and can direct how contributions are invested.18 For this part of the plan, there is no guaranteed post-retirement income. The value of a worker’s DC assets upon retirement is determined by contribution levels and investment performance. There is no vesting requirement for the DC component; if public employees leave their positions before the end of the vesting period, they can take their contributions plus interest with them. Exhibit 2 displays the number of members in each of Washington’s major pension plans. Exhibit 3 summarizes the main characteristics of Plans 1, 2, and 3.
18
Individuals can manage their own investments under the “self-directed investment program” (SDIP), or choose to have their contributions directed to the WSIB to be invested in the “total allocation portfolio” (TAP).
Exhibit 2 2011 Membership by Washington Pension Plan
and Employment/Retirement Status
System Plans
1 2 3
PERS Employed 7,733 117,096 27,588
Retired 53,264 24,711 1,388
TRS Employed 3,740 10,285 52,178
Retired 36,118 2,657 2,934
SERS Employed
20,784 31,548
Retired 3,823 2,605
PSERS Employed
4,187
Retired 15
LEOFF Employed 250 16,805
Retired 7,932 2,015
WSPRS Employed 767 315
Retired 875 0 Data source: Office of the State Actuary, Actuarial Valuation Report, Washington, September 2012
Exhibit 3 Washington State Pension Plan Features
System Plans
1 2 3
Years to vest 5 5 10
Normal retirement age (NRA) NA* 65 65
Earliest possible retirement age NA 55** 55**
Average final salary period (yrs) 2 5 5
Benefit multiplier 2% 2% 1%
Automatic COLA*** No Yes Yes
Maximum years of service 30 NA NA
DC component No No Yes
WSIPP survey of state plans (see Appendix B) *Any age with 30 years experience, age 55 with 25, or age 60 with 5. **With benefit reductions for each year between ages 55-65. ***Indexed to Consumer Price Index up to 3%.

6
1B. COMPARISON OF PUBLIC PENSION PLANS
ACROSS THE UNITED STATES
This section describes retirement plans in other states and presents a comparative analysis of benefit levels. How were plans selected for comparison? The design of public retirement systems is complex. Each plan has its own eligibility criteria, retirement ages, contribution rates, benefit calculation factors, and distribution methods. To compare like-plans to like, we limit our review to open state public pension plans that:
cover general state employees, teachers, and/or law enforcement and fire fighters;19
are the most recently opened plan in the state that is currently enrolling new hires; and
allow members to pay into Social Security (as Washington State employees may do).20
Our review includes 65 plans for general state employees and teachers, and 43 for law enforcement and fire fighters. Institute staff searched plan documents, laws, rules, and websites of state-administered retirement systems in each of the 50 states. Appendix B provides details on each plan included in our comparative review.
19
We selected general state employees and teachers because they represent two of the largest systems (PERS and TRS). We examined law enforcement and firefighter plans separately because they tend to have lower retirement ages. We did not collect comparative information for other retirement systems in Washington because we had a short time frame for the study. 20
This excludes plans from these states: Alaska, Colorado, Louisiana, Maine, Massachusetts, Nevada, and New Hampshire. It is important to note that Washington members of LEOFF and WSPRS plans have the option to choose whether to contribute to Social Security, and most do not. Likewise, in many state plans, such as California STRS, most employees opt out of Social Security; they are included in our analysis because individuals can choose to opt in.
The following summary highlights key features of state public pension plans:
Plan type (DB, DC, or Hybrid)
Vesting rules
Retirement ages
Experience requirements
Contribution rates
Benefit calculation factors
Cost of living adjustments (COLAs)
Plan Type. Of the 65 state plans for general employees and teachers included in our review, 50 (77%) are DB plans. We also identified four DC plans and 11 Hybrid plans. Thirty-eight (88%) of the 43 state pensions reviewed for law enforcement and fire fighters are DB plans; one is DC and four are Hybrid. Vesting. In most (78%) of the open public plans reviewed, employees vest at five or ten years (see Exhibit 4). The average of the total vesting years across plans is seven years. Most of Washington’s open plans require ten years to vest for DB retirement; LEOFF and PSERS plan members vest in five years. Normal Retirement Age. Among the plans we reviewed, the most common age for normal retirement is 65. Because some plans allow for earlier retirements, the average normal retirement age is 63.5 years. In Washington State, normal retirement age is 65 for general plans and teachers, and 55 for law enforcement and fire fighters. Service Credit Years. In DB and Hybrid plans, once members reach normal retirement age, they can retire and receive benefits if they have worked a certain number of years (usually five; the average is 6.5). Some plans require as many as ten years of service before an individual can retire with full benefits. In Washington State, Plans 1 and 2 require five, and Plans 3 require ten.

7
Exhibit 4 Vesting Requirements
General Employee and Teacher Plans
Law Enforcement and Firefighter Plans
WSIPP survey of state plans (see Appendix B)
Early Retirement. Among the plans reviewed for this report, early retirement is usually allowed at age 55, with reductions in benefits. The average number of required service credit years for early retirement is 11, but the most common number of service years required to retire early is five.
When individuals retire early, their benefits are reduced by a certain amount based on how far they are from normal retirement age. The most frequent benefit reduction percentage is 5% per year younger than normal retirement age.21 Employee Contribution Rates. To fund pensions, employees contribute 5% of their salary, on average. Some employees contribute as much as 10%, and some as little as 2%. Some plans are “non-contributory”—
21
This is the amount that Washington changed its early retirement factors to in 2012; it was previously 3%.
only the employer contributes to the pension fund. We identified two non-contributory plans for general employees and teachers, and five for law enforcement plans. Employer Contribution Rates. For general and teacher plans, the most common employer contribution is 6%, while the average is 12%. Some employers pay up to 34% for pension benefits. For law enforcement and fire fighters, the employer contributions tend to be higher—an average of 17% and a maximum of 61%. Benefit Multiplier. The most frequent benefit multiplier used in the average final compensation calculation (AFC) is 2%, the same as Washington’s Plans 1 and 2. (See Exhibit 5, next page). The average multiplier is 1.84%. The highest benefit multiplier is 3.13%, and the lowest is 1%. Law enforcement and firefighter plans tend to have higher multipliers (average of 2.2%).22
Hybrid plans generally have lower benefit multipliers because the plans include a DC component. For example, in Washington, the Hybrid Plans 3 benefit multiplier is 1%, and 2% in the DB Plans 1 and 2. Average Final Compensation (AFC) Years. Most of the DB and Hybrid plans reviewed calculate retiree benefits based on the highest average salary in a three or five year period (see Exhibit 6, next page).
Cost-of-Living Adjustments (COLAs). A COLA increases the retiree’s benefit based on the changes of the Consumer Price Index (CPI). The adjustments are granted annually and can be automatic or on an ad hoc basis. Of the general and teacher plans reviewed, 57% offer an automatic post-retirement COLA. In 29% of the plans, COLAs are determined by the state legislature or the funded ratio of their plan. Nine plans do not offer a post-retirement COLA (some recently suspended theirs). Of plans that do offer an automatic COLA, 38% are a fixed amount, the average being 2.5%, with 3% being the most common.
22
Washington LEOFF and WSPRS plan members can opt to
pay in to Social Security, and most choose not to.
3% 5% 8%
46%
2% 5%
32%
0%
20%
40%
60%
80%
0 3 4 5 6 8 10
Perc
en
t o
f p
lan
s
Years to vest
2% 5% 10%
40%
5%
33%
2% 2%
0%
20%
40%
60%
80%
0 3 4 5 8 10 15 20
Perc
en
t o
f p
lan
s
Years to vest

8
Washington’s Plans 2 and 3 offer a COLA (up to 3%, indexed to the Consumer Price Index), but not the closed Plans 1.23 The percentage of law enforcement and firefighter plans that offer COLAs is similar to general and teacher plans.
DC plans do not have COLAs. Retirees from DC plans can purchase a life-annuity that may include a COLA, such as Washington’s Total Allocation Portfolio (TAP) annuity.24
Exhibit 5 Benefit Multipliers
General Employee and Teacher Plans
Law Enforcement and Firefighter Plans
WSIPP survey of state plans (see Appendix B)
23
Washington Plans 1 allow members to decide whether they want to reduce their benefit multiplier and receive a COLA after they retire. The maximum COLA option is the same as Plans 2/3, up to 3% annually. 24
Plan 3 retirees in Washington can opt to purchase a TAP Annuity under RCW 41.34.060. This annuity product offers an automatic 3% annual COLA and currently grows at the Pension Funding Council rate of 7.9%.
Exhibit 6 AFC Periods
General Employee and Teacher Plans
Law Enforcement and Firefighter Plans
WSIPP survey of state plans (see Appendix B)
13%
34%
44%
3% 6%
0%
20%
40%
60%
80%
1 to1.49%
1.5 to1.9%
2 to2.49%
2.5 to2.9%
3% ormore
Perc
en
t o
f p
lan
s
Benefit multiplier
10% 10%
38% 36%
5%
0%
20%
40%
60%
80%
1 to1.49%
1.5 to1.9%
2 to2.49%
2.5 to2.9%
3% ormore
Perc
en
t o
f p
lan
s
Benefit multiplier
7% 3%
31%
3% 3%
49%
3%
0%
20%
40%
60%
80%
1 2 3 3.5 4 5 8
Perc
en
t o
f p
lan
s
Years in AFC period
5% 2% 5%
40%
2% 5%
36%
5%
0%
20%
40%
60%
80%
1 1.5 2 3 3.5 4 5 8
Perc
en
t o
f p
lan
s
Years in AFC period

9
Plan by Plan Comparison of Benefit Levels
Of the questions raised in the study legislation, the adequacy of retirement benefits is the most difficult to estimate. There is no agreed-upon standard for post-retirement income levels, in absolute or relative terms. The level of benefits provided in various pension plans, however, can be estimated and compared, given a set of common assumptions. In this report, we compare benefit levels using a metric commonly used by researchers, policy analysts, and actuaries—the percentage of a worker’s salary that is replaced by retirement benefits at the time of retirement, which we refer to as “income replacement.” 25 This income replacement measure allows us to directly compare pension benefits in different public plans for a certain person at a single point in time. Using salary history data from the Department of Retirement Systems (DRS), we developed earnings profiles of recent retirees. We then estimated what each profile’s income replacement would be in Washington’s and other state pension systems. The technical details are in Appendix C. Assumptions. To construct an “apples-to-apples” comparison of different types of retirement plans, we had to make a variety of assumptions. First, we created earnings profiles for two hypothetical Washington retirees, one age 65 and one age 55,26 both with 30 years of service. This allowed us to compute average final compensation (AFC) under the various plan definitions. We used assumptions about pension fund growth (7.9%) currently adopted by the Washington State Pension Funding Council. When comparing various state plans, we used default
25
More complex metrics, such as the net-present value of pension wealth, would take into account plan provisions such as cost-of-living allowances (COLAs), which can substantively alter the value of pension benefits over the life span. To minimize the number of assumptions required to estimate pension benefit levels, we opted to use the simpler income replacement measure for this comparative study. 26
For early retirement, we calculated benefits using the 5% (per year younger than 65) reduction in benefits set by the 2012 Legislature (SB 6378). For other states, we collected information about the plans’ early retirement percentage-per-year benefit reduction and calculated the benefits the same way.
contribution rates for each plan, and when plans had more than one possible benefit factor for retirees under a DB plan, we selected the midpoint. Key features of each plan, including AFC, contribution rates, and benefit factors, are described in Appendix B. Limitations. This analysis examines only the state benefit portion of retirement income, and not other important sources such as Social Security and individual savings plans. Because we examined benefit levels at the time of retirement rather than over the lifespan, the results do not account for provisions such as COLAs,27 health or disability benefits, or joint (spouse) and survivor benefits.28 In addition, because DC plans do not usually provide for automatic payment of benefits after retirement, we assumed that DC plan beneficiaries would not cash out a lump sum of benefits at retirement, but rather purchase an annuity that would guarantee them regular income for a number of years into the future. The details of all assumptions can be found in Appendix C.
27
Our computations of first-year income replacement for DB plans (which make up the majority of plans) do not include COLAs; COLAs would not apply in the first year after retirement. However, our computations of income replacement for DC and Hybrid plans do. Because we must compute the long-term growth of DC plan investments in order to calculate the first-year income replacement, we necessarily had to assume post-retirement COLAs and a rate of growth for DC plans and the DC portion of Hybrid plans. These assumptions are described in detail in Appendix C. 28
In many plans, these provisions are optional. Our estimates do not include these in order to minimize the number of assumptions made in our analysis.

10
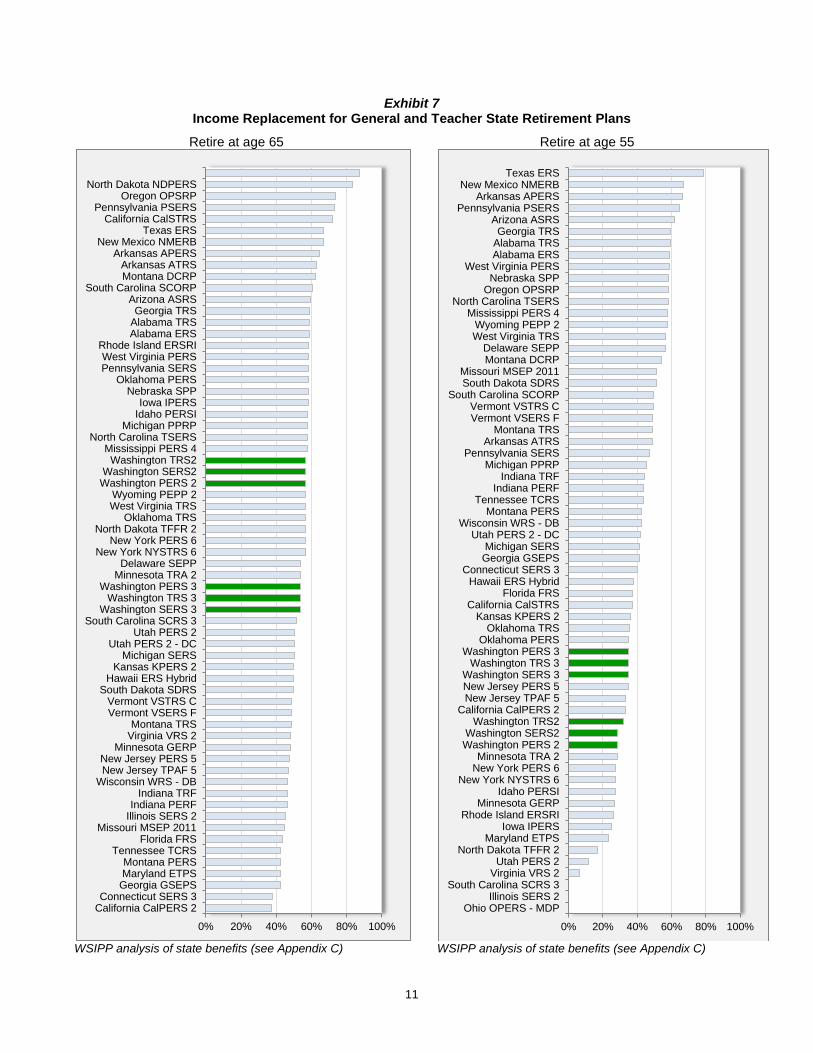
Results. Exhibits 7 and 8 (next two pages) display the income replacement measure for each state plan reviewed. For general and teacher plans, Washington’s income replacement for a worker retiring at age 65 with 30 years of service is near average among states. The income replacement is 57% for Plans 2 and 56% for Plans 3.29 Washington’s general and teacher plans rank lower among states at the earlier retirement age (55). Plans 3 fall slightly below average and Plans 2 in the bottom quarter of states. Washington’s income replacement for law enforcement and fire fighters retiring at age 65 with 30 years of service is the same as for general and teacher plans (57%). These plans rank low (in the bottom quarter) in comparison with other states’ plans for law enforcement and fire fighters.
For an earlier retirement age (55), LEOFF 2 and WSPRS 2 provide the same income replacement (57%) and rank below average. For PSERS 2 members, retiring at age 55 involves an early retirement benefit reduction, so the income replacement is 48%, in the bottom quarter of the plans reviewed.
29
For the DC component of Plans 3, we assume the default contribution rate (5% of salary). These plans would rank higher if employees opted for higher contribution rates.
11
Exhibit 7 Income Replacement for General and Teacher State Retirement Plans
Retire at age 65
WSIPP analysis of state benefits (see Appendix C)
Retire at age 55
WSIPP analysis of state benefits (see Appendix C)
0% 20% 40% 60% 80% 100%
California CalPERS 2Connecticut SERS 3
Georgia GSEPSMaryland ETPSMontana PERS
Tennessee TCRSFlorida FRS
Missouri MSEP 2011Illinois SERS 2Indiana PERF
Indiana TRFWisconsin WRS - DBNew Jersey TPAF 5New Jersey PERS 5
Minnesota GERPVirginia VRS 2Montana TRS
Vermont VSERS FVermont VSTRS C
South Dakota SDRSHawaii ERS Hybrid
Kansas KPERS 2Michigan SERS
Utah PERS 2 - DCUtah PERS 2
South Carolina SCRS 3Washington SERS 3
Washington TRS 3Washington PERS 3
Minnesota TRA 2Delaware SEPP
New York NYSTRS 6New York PERS 6
North Dakota TFFR 2Oklahoma TRS
West Virginia TRSWyoming PEPP 2
Washington PERS 2Washington SERS2
Washington TRS2Mississippi PERS 4
North Carolina TSERSMichigan PPRP
Idaho PERSIIowa IPERS
Nebraska SPPOklahoma PERS
Pennsylvania SERSWest Virginia PERS
Rhode Island ERSRIAlabama ERSAlabama TRSGeorgia TRS
Arizona ASRSSouth Carolina SCORP
Montana DCRPArkansas ATRS
Arkansas APERSNew Mexico NMERB
Texas ERSCalifornia CalSTRS
Pennsylvania PSERSOregon OPSRP
North Dakota NDPERS
0% 20% 40% 60% 80% 100%
Ohio OPERS - MDPIllinois SERS 2
South Carolina SCRS 3Virginia VRS 2Utah PERS 2
North Dakota TFFR 2Maryland ETPS
Iowa IPERSRhode Island ERSRI
Minnesota GERPIdaho PERSI
New York NYSTRS 6New York PERS 6Minnesota TRA 2
Washington PERS 2Washington SERS2
Washington TRS2California CalPERS 2
New Jersey TPAF 5New Jersey PERS 5Washington SERS 3
Washington TRS 3Washington PERS 3
Oklahoma PERSOklahoma TRS
Kansas KPERS 2California CalSTRS
Florida FRSHawaii ERS Hybrid
Connecticut SERS 3Georgia GSEPSMichigan SERS
Utah PERS 2 - DCWisconsin WRS - DB
Montana PERSTennessee TCRS
Indiana PERFIndiana TRF
Michigan PPRPPennsylvania SERS
Arkansas ATRSMontana TRS
Vermont VSERS FVermont VSTRS C
South Carolina SCORPSouth Dakota SDRSMissouri MSEP 2011
Montana DCRPDelaware SEPP
West Virginia TRSWyoming PEPP 2
Mississippi PERS 4North Carolina TSERS
Oregon OPSRPNebraska SPP
West Virginia PERSAlabama ERSAlabama TRSGeorgia TRS
Arizona ASRSPennsylvania PSERS
Arkansas APERSNew Mexico NMERB
Texas ERS

12
Exhibit 8 Income Replacement for Law Enforcement and Firefighter State Retirement Plans
Retire at age 65
WSIPP analysis of state benefits (see Appendix C)
Retire at age 55
WSIPP analysis of state benefits (see Appendix C)
0% 20% 40% 60% 80% 100%
Georgia GERS
Utah PSFRS 2 DC
Tennessee TCRS
Virginia SPORS 2
North Carolina SLEO
Maryland LEOPS
Rhode Island SPRBT
Virginia VaLORS 2
Washington PSERS 2
Washington WSPRS 2
Washington LEOFF 2
Connecticut HDP 2A
South Dakota Class B
Wisconsin WRS
Alabama AERS
South Carolina PORS
New York PFRS 6
Hawaii ERS
Idaho IPERS
Illinois SERS 2
Minnesota CERP
Oregon PSRP
Indiana POFP
Arizona PSPRS 2
Kentucky SPRS
Arkansas ASPRS 2
California CalPERS 2
Kansas KPF 2
New York SRS 5
Ohio PERS
Vermont VSERS C
Maryland SPRS
Oklahoma PPRS
Pennsylvania SERS
North Dakota NDPERS
Iowa PERS
Florida FRS
Texas LECOS
Wyoming WRS
Alabama AERS
Utah PSFRS 2
Minnesota PERA
New Mexico PERF
0% 20% 40% 60% 80% 100%
Illinois SERS 2
Utah PSFRS 2 DC
Pennsylvania SERS
Georgia GERS
Tennessee TCRS
Washington PSERS 2
Virginia SPORS 2
North Carolina SLEO
Maryland LEOPS
Rhode Island SPRBT
Virginia VaLORS 2
Washington WSPRS 2
Washington LEOFF 2
Connecticut HDP 2A
South Dakota Class B -…
Wisconsin WRS
Alabama AERS
South Carolina PORS
New York PFRS 6
Hawaii ERS
Oregon PSRP
Idaho IPERS
Minnesota CERP
Indiana POFP
Arizona PSPRS 2
Kentucky SPRS
Arkansas ASPRS 2
California CalPERS 2
Kansas KPF 2
New York SRS 5
Ohio PERS
Vermont VSERS C
Maryland SPRS
Oklahoma PPRS
North Dakota NDPERS
Utah PSFRS 2
Iowa PERS
Florida FRS
Texas LECOS
Wyoming WRS
Alabama AERS
Minnesota PERA
New Mexico PERF

13
PART 2: PORTABILITY OF LOCAL PUBLIC PENSION PLANS
Part of the legislative direction for this study calls for an examination of “barriers to the portability of retirement benefits between public employers in the state.” This section describes locally sponsored public retirement plans, defines “portability,” and describes policy options to address portability issues.
LOCAL PUBLIC RETIREMENT PLANS IN
WASHINGTON STATE
Most public employers in Washington participate in one of the state-administered systems described in the previous section. All county and most city employees enroll in the state systems administered by the Washington State Department of Retirement Systems (DRS). As shown in Exhibit 9, we identified only four cities that offer their own retirement plans in lieu of DRS-administered plans—the three first-class cities (Seattle, Tacoma, and Spokane), and Lakewood. Most other public employees (such as utilities, ports, and local law enforcement) participate in the state system. Sound Transit is one public entity that offers its own plan with no option to enroll in PERS or another state system.30
30
We identified these plans by conducting Internet searches and consulting with DRS, OSA, legislative staff and members, and retirement benefit professionals. Our list of local plans may not be exhaustive; we did not have time to conduct a comprehensive survey of all local governments in the state. Additionally, we did not review supplementary, optional defined contribution plans that many local governments offer in addition to the state-administered plans. We restricted our review to all locally sponsored plans that are the primary source of retirement benefits for local governments in Washington State.
Exhibit 9 Local Public Retirement Plans in Washington
Plan Type
Seattle City Employees' Retirement System
DB
Spokane City Employees' Retirement System
DB
Tacoma Employees' Retirement Services DB
Lakewood International City Management Association - Retirement Corporation (ICMA-RC) 401A plan
DC
(Sound Transit) Central Puget Sound Regional Transit Authority Pension Plan
DC
WSIPP review of local public plans DB = defined benefit DC = defined contribution
All three first-class cities sponsor DB plans. For each, the benefit multiplier is 2% and the AFC period is two years (similar to the state’s Plans 1). Seattle. The City of Seattle’s plan has a retirement age of 62 with five years of creditable service, or any age with 30 years. Employees vest after five years and contribute 10.03% of their salary to the fund (the city contributes 11.01%). The pension includes a post-retirement COLA of 1.5% per year. Members participate in Social Security. Spokane. Spokane’s plan has a retirement age of 62 with five years creditable service. Employees can also retire if they meet the “rule of 75” (age 50 with 25 years of service, or age 55 with 20 years, and so on). Employees vest after five years. Both employees and employers contribute 8% of salary to the pension fund. No post-retirement COLA is provided. Pension benefits are limited to 70% of the final average salary. Members participate in Social Security. Tacoma. Tacoma’s plan has a retirement age of 60 with any years of service, any age with 30 years, or the “rule of 80” (e.g., age 55 with 25 years). Employees vest after five years. Employees contribute 9.2% of salary and employers, 10.8%, to the pension fund. An automatic COLA is provided, depending on

14
the CPI. Members participate in Social Security. Lakewood. In Lakewood, the city and employees make contributions to the International City Management Association-Retirement Corporation (ICMA-RC) Internal Revenue Code (IRC) 401(a) plan.31 The employee chooses how contributions are invested, given choices ranging from conservative (low risk) to aggressive (high risk). Employees vest 20% for each of first five years of service, after which they are fully vested. Prior service credit in Washington State DRS plans is credited towards the vesting schedule in Lakewood. For example, if an individual had worked in a full-time job with a DRS-administered plan for two years, upon employment with the city of Lakewood, the employee would be 100% vested in three years. Individuals covered under Lakewood’s plan do not pay into Social Security; instead, the city and county contribute an additional percentage of salary for an “SS Replacement” plan.32 Sound Transit. Similar to Lakewood, the Central Puget Sound Regional Trust Authority (Sound Transit) offers employees an ICMA-RC administered 401(a) retirement plan. Both employees and Sound Transit contribute to the benefits33 and employees vest 20% per year of service for the first five years of service. Sound Transit also offers an optional Internal Revenue Code section 457 deferred compensation plan.34 Members do not participate in Social Security. Other Local Public Plans. Some public employers in Washington allow newly hired employees a choice between a local plan and a state plan. For example, the University of Washington offers employees a choice 31
7.62% and 5.08% of salary, respectively. 32
6.20% and 4.77% respectively. For the Social Security component, individuals are vested immediately. 33
10% and 12% respectively. 34
In deferred compensation plans, employees can divert up to $17,000 in salary per year to a tax-deferred investment account.
between a state plan and the University’s own tax-deferred DC plan.35 For other public employers, such as the Port of Seattle, whether individuals join a DRS-administered plan or a local plan depends on whether their union offers retirement benefits. For example, while most Port employees are in a PERS plan, members of Local 3236 instead join the Plumbers and Pipefitters DB pension plan.37 The Port also matches employee contributions to a DC plan for up to $2,200 annually. Similar to most local public employers, Washington State retirement systems include an option for state employees to voluntarily participate in a DC plan.38
WHAT IS “PORTABILITY”?
Pension portability refers to the ability of workers to change jobs without losing value in their retirement benefits. There is a tradeoff between predictability and portability in the design of pension plans. Portability issues tend to arise with DB plans and mobile workers (members who change jobs over the course of their careers). In these plans, the pension benefit is based on the length of job tenure and salary level. DB plans provide predictable benefits that increase the longer employees stay on the job. When employees leave, they no longer accrue additional benefits. In contrast, the accumulated contributions in DC retirement accounts continue growing from investment returns whether an employee
35
For more information about the University of Washington Retirement Plan, see http://www.washington.edu/admin/hr/benefits/retirement/plans/uwrp/index.html 36
Local 32 of the United Association of Journeymen and Apprentices of the Plumbing and Pipefitting Industry of the United States and Canada- AFL-CIO 37
http://www.portseattle.org/Business/Labor-Relations/Documents/Labor_Mgt_Agreement_2008_2011.pdf 38
Participants are charged a 0.129% administrative fee. For more information about Washington’s deferred compensation program, see: https://www.dcprovider.com/PDF/washington/DCP_Overview.pdf

15
stays in the same job or not (so long as the employee does not cash out the balance when changing jobs). In this case, the benefits are not pre-determined by formula (they depend on investment performance), so the ultimate benefit level is more uncertain. DC plans have become more common in the private sector as the American workforce has become increasingly mobile. In the public sector, DB plans continue to be the norm for state retirement systems, as shown in the previous section. Comparison of Benefit Levels for Stable and Mobile Workers
To illustrate how retirement benefits are impacted by job mobility, we estimated benefit levels comparing two hypothetical workers with similar earnings profiles:
a “stable employee” (Employee A); and
a “mobile employee” (Employee B). Employee A stays in the same job for 30 years, whereas Employee B changes jobs over the course of their career. We compare pension benefits at the time of retirement for each of these workers. Appendix D provides details about the analysis. Across pension plan types, at the time of retirement, the hypothetical mobile employee accrues annual pension benefits that are 14% to 21% less than those of a stable employee in DB and Hybrid plans (see Exhibit 10). In DC plans, assuming that salaries tend to increase with a job change, the mobile employee receives a slightly higher benefit at the time of retirement than a stable employee (although as a percentage of income, the value is slightly lower).39
39
We assume that the employee’s salary increases by 5% at each job change, which increases the value of the DC contributions. We also assume that employees roll over the DC account upon each job change (rather than cashing it out). We varied some of the assumptions in the analysis to see how sensitive our results are to different specifications. Appendix D discusses the sensitivity analysis.
Exhibit 10 Income Replacement at Retirement:
Two Hypothetical Employees40
WSIPP modeling of plan structures (see Appendix D)
Washington State Portability Rules
To address portability issues for DB and Hybrid plans, Washington allows individuals to be part of more than one state pension plan under “dual membership” provisions.41 Individuals qualify for dual membership if they:
are currently a member of one of Washington’s systems;
previously contributed to a different Washington system; and
have not yet retired or received disability benefits.
Dual membership rules apply to defined benefits in the following plans:
PERS 1, 2, 3
TRS 1, 2, 3
SERS 2, 3
PSERS 2
LEOFF 2
WSPRS 1, 2
First class cities (Seattle, Spokane and Tacoma)
40
This example is not specific to Washington’s plans. 41
RCW 41.54. The deferred indexed vested benefit for Plans 3 and LEOFF 2 also provide for greater portability.
58%
22%
37% 38%
20% 27%
0%
20%
40%
60%
80%
100%
DB DC Hybrid
Inco
me r
ep
lacem
en
t
Employee A(stable)
Employee B(mobile)

16
Dual membership allows people who have accumulated retirement benefits in more than one system to:
Combine service credit earned in all dual member systems to become eligible for retirement.
For example, if an employee works five years for the state in PERS2 and 15 years for the city of Spokane, the employee could retire at age 55 with benefits from both systems.
Use the highest base salary across jobs to calculate your retirement benefit for both systems.
Continuing the example above, if the AFC was $50,000 at the state and $55,000 at the city, the pension benefits for both would be based on the higher AFC.
Purchase service credit for previously withdrawn service by repaying the amount withdrawn plus interest.
If the employee had cashed out their PERS 2 balance upon taking the city job, the employee could purchase five years of service credit based on their time at the state, so the city benefit would be AFC * 20 * 2% rather than AFC * 15 * 2%.42
Across Washington State plans, retirees can also purchase up to five years of “air time” service credits (years not worked).43 This credit cannot be used to determine eligibility for retirement, but can increase the monthly retirement benefit for life. For Washington State workers in a DB plan, the portability laws increase the mobile employee’s pension benefits so that they are more comparable to those of a stable employee. Using assumptions similar to those used to compare state plans (see Appendix D for details), we found that for a
42
http://drs.wa.gov/publications/member/multisystem/ dualMembership.htm#ex1 43
The purchase cost is based on an annuity factor that varies by age and plan.
stable employee, income replacement might be 58%, compared to 38% for a mobile employee without portability. The mobile employee’s income replacement would increase to 51% with portability rules applied. Portability rules have fiscal implications, because they increase benefits for mobile workers. Washington’s Office of the State Actuary analyzes data regarding these fiscal implications and uses the results to adjust contribution rates to cover the increased costs. The portability rules do not apply to DC plans, and income replacement tends to be lower for these types of benefits. If the state desired to offer portability for individuals who move from a state plan to a local public DC plan, policy options include:
allowing the service years at the DC job to count in determining retirement eligibility and/or the benefit amount for the DB plan; and
allowing the final salary for the DC job to count in determining the benefit amount for the DB plan.
Like dual membership, these potential policy options have fiscal implications for state pension funds. Under the second option, employees who start out in a DRS-administered plan would have contributions made at an earlier (lower) salary rate, but their benefits would be based on the higher end-of-career AFC while in the DC plan. These higher costs would be borne by the DRS plans, unless provisions were made to charge sponsors of DC plans for the higher DB pension costs.

17
PART 3: OVERTIME AND EXCESS COMPENSATION ANALYSIS
As part of this study’s assignment, the Legislature directed the Institute to examine the:
“treatment of overtime earnings in public employee retirement plans relative to the treatment of earnings in other states, including the impact of excess compensation on state retirement system contribution rates with a particular emphasis on agencies that operate on a 24-hour basis, such as the state patrol, ferry system, and state prisons.”44
We begin with an overview of “excess compensation” definitions and rules in Washington and other states. We then use data from Washington State DRS to examine changes in earnings and hours worked among recent retirees. The data allow us to determine the extent to which behavior changes during AFC determination periods. We also assess the contribution of overtime payments to total compensation for recent state agency retirees using Human Resource Management System (HRMS) data. The sub-sections are organized as follows:
2A) Excess Compensation Rules in Washington and Other States
2B) Overtime and Excess Compensation Analysis of Washington Data
2A. EXCESS COMPENSATION RULES IN
WASHINGTON AND OTHER STATES
In Washington State, “excess compensation” refers to specific types of reportable compensation that exceed statutory limits for inclusion in pension benefit calculations. When an individual is reported by DRS as having excess compensation, the employer is billed the present value of the resulting increase in an employee's retirement benefit.
44
Supplemental Operating Budget § 606 (13), 2012 Wash. Sess. Laws 2225
Washington State statute defines “excess compensation” as one of the following:
(a) A cash-out of unused annual leave in excess of two hundred forty hours;
(b) A cash-out of other forms of leave, including sick leave and holiday leave;
(c) A payment for a personal expense, if the payment qualifies as reportable compensation in the employee's own retirement system;
(d) That portion of any payment, such as an overtime or incentive payment, that exceeds twice the employee's regular rate of pay for the period of time that the overtime or incentive payment applies; and
(e) A termination or severance payment.45 Excess compensation is rare, especially among members of open plans. (See Appendix E, Exhibit E3.) Among employees retiring between January 2009 and June 2012, 18% of PERS1 members had some reported excess compensation. Only seven of the more than 10,000 PERS2 retirees (less than a tenth of 1%) over this period had reported excess compensation. In Plans 2 and 3, leave cash-outs are not included in pension calculations. Implications of End-of-Career Compensation Increases
Salary growth over the course of an individual’s career is expected as experience and productivity increase. If pay jumps sharply at the end of a career, the resulting increase in pension benefits can substantially raise pension costs. The increase in costs may not be fully borne by the retiree and their employer. To the extent that these costs are unexpected, they could force future contribution rates to rise. The following two stylized examples illustrate how overtime hours or salary increases concentrated at the end of a career impact pensions.
45
RCW 41.50.150.

18
Stylized Example 1: End-of-career increases. This example illustrates the fiscal implications of hours and/or salaries that increase substantially and unexpectedly during the AFC period. The example illustrates the strong incentives for employees to supply more hours of work toward the end of a career. It also demonstrates that the costs of resulting extra pension benefits are not fully covered by the worker’s or employer’s contributions. The specific assumptions used in this analysis are described in Appendix E. In Exhibit 11, Worker 1 supplies the same number of hours every year and annual salary increases steadily throughout the career. Worker 2’s hours and earnings follow a similar trajectory until the last five years of the career (the AFC period). During the AFC period, Worker 2 supplies 250 hours of overtime (just over 20 hours a month).
Exhibit 11 Stylized Example 1:
Illustration of Late-career Salary Increases
WSIPP stylized model (see Appendix E)
The resulting impact on AFC and pension benefits is summarized in Exhibit 12. Worker 2 contributes an extra $2,500 to the system and gets an extra $97,000 in expected pension benefits. The worker and employer contributions combined cover only a small portion of the gain in benefits. The Office of the State Actuary measures and accounts for wage trends in its pension funding analyses. Any required increases in contribution rates are spread across all employers and employees in a plan. Excess compensation (monitored by DRS) applies if overtime or other late-career compensation increases cause salary to more than double.
Exhibit 12
Stylized Example 1: Summary Impact of Overtime on Pension Benefits and Contributions
Worker 1 Worker 2
AFC $51,967 $61,337
Annual Pension Benefit $31,180 $36,802
PDV Pension Benefits $537,116 $633,951
Value worker contributions at retirement
$161,721 $164,234
Value employer contributions at retirement
$246,098 $249,921
Total contribution value $407,819 $414,154
Extra contribution by Worker 2
$2,512
Extra contribution by Employer 2
$3,823
Total extra contributions
$6,335
PDV of extra pension benefit (gain)
$96,836
WSIPP analysis of stylized model (see Appendix E) PDV = present discounted value.
$0
$10,000
$20,000
$30,000
$40,000
$50,000
$60,000
$70,000
1 3 5 7 9 11131517192123252729
An
nu
al
sala
ry
Year in career
worker 1
worker 2
19
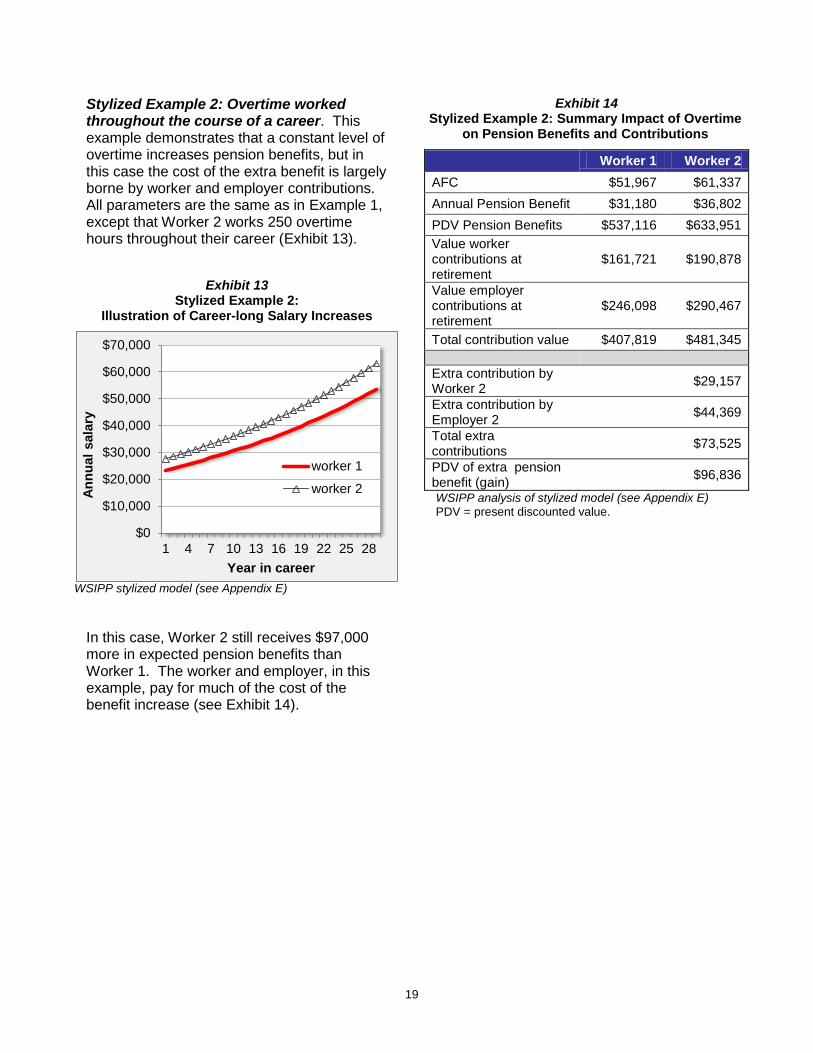
Stylized Example 2: Overtime worked throughout the course of a career. This example demonstrates that a constant level of overtime increases pension benefits, but in this case the cost of the extra benefit is largely borne by worker and employer contributions. All parameters are the same as in Example 1, except that Worker 2 works 250 overtime hours throughout their career (Exhibit 13).
Exhibit 13 Stylized Example 2:
Illustration of Career-long Salary Increases
WSIPP stylized model (see Appendix E) In this case, Worker 2 still receives $97,000 more in expected pension benefits than Worker 1. The worker and employer, in this example, pay for much of the cost of the benefit increase (see Exhibit 14).
Exhibit 14 Stylized Example 2: Summary Impact of Overtime
on Pension Benefits and Contributions
Worker 1 Worker 2
AFC $51,967 $61,337
Annual Pension Benefit $31,180 $36,802
PDV Pension Benefits $537,116 $633,951
Value worker contributions at retirement
$161,721 $190,878
Value employer contributions at retirement
$246,098 $290,467
Total contribution value $407,819 $481,345
Extra contribution by Worker 2
$29,157
Extra contribution by Employer 2
$44,369
Total extra contributions
$73,525
PDV of extra pension benefit (gain)
$96,836
WSIPP analysis of stylized model (see Appendix E) PDV = present discounted value.
$0
$10,000
$20,000
$30,000
$40,000
$50,000
$60,000
$70,000
1 4 7 10 13 16 19 22 25 28
An
nu
al
sala
ry
Year in career
worker 1
worker 2
20
Policy Options to Minimize Unexpected Impacts on Pension Systems
Some states, including Washington, have laws to limit end-of-career increases to pensionable salary, including:
charging employers for excess compensation;
placing a limit on how high the AFC can be;
lengthening the AFC period; and
restricting includable compensation (e.g. excluding leave cash-outs).46
Charging Employers. In our review of other states’ pension plans, we identified one other state, Illinois, that charges employers for excess compensation as Washington does. In Illinois, the employer pays contributions on any salary increase that exceeds 6% of the members’ final average salary. Limiting AFC or Benefit Amounts. Rather than charging for excess compensation, we found that many states simply limit the size of the AFC, either in terms of a percentage of the final year of salary or as a set benefit dollar amount. Nineteen states limit AFC to between 60% and 120% of final salary in at least one of their open public pension plans. Most of these states set the limit at 100% (see Exhibit 15).47 Federal law limits the amount of AFC to be included in pension benefit calculations to less than $250,000.48 Eight states set lower limits for general state employee and teacher plans. At least six states set a lower limit for law enforcement and fire fighters (see Exhibit 16).
46
Painter, D. (2012, May). Pension spiking. Presentation to the Washington State Joint Select Committee on Pension Policy, Olympia, WA. 47
Note that some states have different limits for different plans; in the graphs, we display the higher one or states that have multiple plans 48
Internal Revenue Code (IRC) Section 401(a)(17)

21
Exhibit 15
States that Limit AFC as a Percentage of the Highest Average Salary
General Employee and Teacher Plans
WSIPP survey of state plans (see Appendix B)
Law Enforcement and Firefighter Plans49
WSIPP survey of state plans (see Appendix B)
49
Washington’s 75% limitation is for WSPRS 2.
0% 40% 80% 120%
Maryland
Michigan
Nebraska
Vermont
Arkansas
Florida
Georgia
Mississippi
Rhode Island
Alabama
California
Delaware
Illinois
Iowa
Kansas
New Mexico
North Dakota
West Virginia
Montana
0% 20% 40% 60% 80% 100%
Tennessee
Texas
Maryland
South Carolina
Rhode Island
Wisconsin
Indiana
Washington
Wyoming
Arizona
Connecticut
Illinois
Minnesota
New Mexico
New York
Iowa
Arkansas
California
Ohio
Hawaii
Georgia
Alabama

22
Exhibit 16 States that Limit AFC to Less than the Federal
Limit ($250,000)
General and Teacher Plans
WSIPP survey of state plans (see Appendix B)
Law Enforcement and Firefighter Plans
WSIPP survey of state plans (see Appendix B)
AFC Periods. Twenty-six states have the same AFC periods as Washington’s open plans. Two states have longer AFC periods (Illinois and Florida). For law enforcement and firefighter plans, most states have an AFC period of three to five years; Washington’s is five years. Two states have eight-year AFC periods (see Exhibit 17).
$22,000
$40,000
$50,000
$106,800
$106,800
$110,100
$110,100
$200,000
$0 $50,000 $100,000 $150,000 $200,000
Montana
New Jersey
West Virginia
Illinois
Vermont
South Carolina
Utah
Georgia
$62,000
$106,800
$106,800
$110,000
$110,000
$179,000
$0 $50,000 $100,000 $150,000
New York
Illinois
New Mexico
Tennessee
Texas
Oklahoma

23
Exhibit 17 States by AFC Period
General and Teacher plans
WSIPP survey of state plans (see Appendix B)
Law Enforcement and Firefighter Plans
WSIPP survey of state plans (see Appendix B)
0.0 2.0 4.0 6.0 8.0
California
Georgia
Alabama
Arkansas
Delaware
Iowa
Maine
Massachusetts
Missouri
Nebraska
Nevada
Ohio
Oregon
Pennsylvania
South Dakota
Vermont
Wisconsin
Idaho
Colorado
Mississippi
North Carolina
Arizona
Connecticut
Hawaii
Indiana
Kansas
Kentucky
Louisiana
Maryland
Michigan
Minnesota
Montana
New Hampshire
New Jersey
New Mexico
New York
North Dakota
Oklahoma
Rhode Island
South Carolina
Tennessee
Texas
Utah
Virginia
Washington
West Virginia
Wyoming
Florida
Illinois
- 5 10
Indiana
Pennsylvania
Oklahoma
Georgia
Michigan
Vermont
Alabama
California
Colorado
Connecticut
Delaware
Iowa
Kansas
Louisiana
Maine
Massachusetts
Montana
Nebraska
Nevada
New Jersey
New Mexico
North Dakota
Ohio
Oregon
South Dakota
Texas
Wisconsin
Wyoming
Idaho
Arkansas
North Carolina
Arizona
Hawaii
Kentucky
Maryland
Minnesota
New Hampshire
New York
Rhode Island
South Carolina
Tennessee
Utah
Virginia
Washington
West Virginia
Wyoming
Florida
Illinois

24
Overtime. Overtime is generally defined as hours worked beyond the regular 40-hour work week. Employers typically offer a higher rate of pay (1.5 to 2 times more than base pay) for overtime. Some types of jobs require more overtime than others (such as law enforcement, ferry workers, and corrections officers). For the general public employee and teacher plans, 12 states include overtime in AFC calculations,50 and 11 plans do for law enforcement and fire fighters.51 In Washington State, overtime is included in AFC calculations for general plans,52 as well as for the LEOFF 2 plan. There is no limit on the amount of overtime that counts in the AFC, but if the overtime pushes AFC to more than twice the regular pay, the employer must pay additional contributions (determined by the state actuary) under the “excess compensation” law described earlier. Unused Sick and Vacation Leave. When an employee retires with a balance of sick or vacation leave, some states allow that amount to be included in AFC. Twenty-six states allow sick leave to be included and 15 allow vacation leave (see Appendix B for details). In Washington State, leave cash-outs are only included in AFC in Plans 1. Severance and Subsistence Pay. Severance pay is additional pay granted to an employee when they leave employment. Our review of other states’ open plans found that no states include this payment in with AFC calculations. Subsistence pay is money paid to an employee for reimbursement of expenses while on the job. The only state that includes subsistence pay in the AFC within the general plans is Oregon. For law
50
Alabama, Arizona, California, Connecticut, Delaware, Hawaii, Illinois, Kentucky, Maryland, Michigan, Minnesota, Mississippi, Missouri, Montana, Nebraska, New Hampshire, New Jersey, New York, Ohio, South Dakota, Vermont, and Washington. 51
Arizona, California, Connecticut, Kentucky, Louisiana, Montana, Nebraska, New Jersey, New Mexico, New York, Oklahoma, Rhode Island, South Dakota, Virginia, Washington (LEOFF 2 only), and Wisconsin. 52
TRS 1 also includes overtime; TRS 2 and 3 do not.
enforcement plans, Virginia also includes subsistence pay in AFC calculations.
2B. OVERTIME AND EXCESS COMPENSATION
ANALYSIS OF WASHINGTON DATA
The Data
Washington State DRS provided data for individuals retiring from one of the state plans during the three and a half years from January 2009 to June 2012. These data included information for roughly 27,000 pension system members from LEOFF, PERS, SERS, TRS and WSPRS plans.53 In addition to information about their pensions, data also included monthly compensation and hours worked histories for about 20,500 of the retirees. These histories, which include up to ten years of data, allowed us to examine the extent to which earnings and hours increase during AFC determination periods (see Appendix E for a more detailed description of these data). The main limitation with the DRS data is that overtime earnings are not reported separately by employers. Job classification and job title are also not reported. We support the current efforts by DRS to increase the level of detail that employers report regarding types of compensation, hours worked and job classification. Average Earnings and Hours
On average, earnings rise gradually with tenure. Exhibit 18 displays the average earnings profiles for recent retirees in Washington’s open plans. The graph presents average monthly earnings over the ten years prior to retirement.54 The rise in earnings over a career does increase average final compensation levels. These increases vary across plans and workers. It is important to note that the extent
53
The data include information for 119 WSPRS1 retirees; no information was available for WSPRS2. 54
Earnings and hours vary dramatically by month for SERS and TERS plan members, so the chart uses 12-month moving averages (MA) for these members.

25
to which earnings increase with tenure is determined by many factors. Workers with more education, for example, tend to have steeper earning profiles. Also, seniority-based pay systems tend to create steeper earnings profiles by providing regular salary step increases. Increases in average earnings per hour, rather than total hours, largely drive the observed increases in earnings with tenure. Among recent retirees in Washington’s state pension systems, monthly hours worked tend to be stable throughout a worker’s tenure, though there is a tendency for hours to decline marginally when workers are closer to retirement. In all of Washington’s state-administered public pension systems, average monthly hours are not systematically higher during AFC periods (Exhibit 19, next page).
Overtime practices vary across occupations and employers, and we see large differences in average hours per month across plans and groups of workers. Persistently high overtime is common among some employers (per our Stylized Example 2), and this contributes to the high AFCs for their employees. Exhibit 20 (next page) examines earnings growth across plans and groups in greater detail. Variation in earnings growth across these groups does not tend to be driven by changes in average hours worked over time (Exhibit 21, page 27). See Appendix E for additional detailed analysis across employers.
Exhibit 18 Average Earnings Profiles for Washington’s Open Public Plans
Retirements from January 2009 to June 2012
WSIPP analysis of DRS data on recent retirees (see Appendix E)
$0
$2,000
$4,000
$6,000
$8,000
$10,000
119
114
109
104
99
94
89
84
79
74
69
64
59
54
49
44
39
34
29
24
19
14 9 4
Mo
nth
ly S
ala
ry
Months to Retirement MA = moving average
LEOFF2
PERS2
TRS2 (MA)
SERS2 (MA)
SERS3 (MA)

26
Exhibit 19 Hours Profiles for Washington’s Open Public Plans
WSIPP analysis of DRS data on recent retirees (see Appendix E)
Exhibit 20 Average Monthly Earnings Before and During AFC Period
Retirements from January 2009 to June 2012
Plan/System N Avg. Earnings
Pre-AFC
Avg. Earnings
AFC
Avg. Increase
% Increase
LEOFF1 109 $6,811 $8,458 $1,647 24.2%
LEOFF2 731 $6,149 $7,633 $1,484 24.1%
PERS1 3577 $4,287 $5,088 $801 18.7%
PERS2 6182 $3,946 $4,672 $726 18.4%
PERS3 158 $4,201 $4,991 $789 18.8%
SERS2 1115 $2,345 $2,756 $411 17.5%
SERS3 251 $2,254 $2,616 $362 16.1%
TRS1 1968 $6,031 $7,142 $1,111 18.4%
TRS2 558 $5,631 $6,674 $1,043 18.5%
TRS3 258 $5,276 $6,282 $1,006 19.1%
WSPRS1 99 $6,190 $7,348 $1,158 18.7%
PERS2: FERRIES 52 $4,417 $5,156 $738 16.7% PERS1: CORRECTIONS 93 $4,017 $4,693 $676 16.8% PERS2: CORRECTIONS 324 $3,522 $4,157 $635 18.0%
WSIPP analysis of DRS data (see Appendix E) Note: Reference periods vary by plan. Plans 1: AFC periods include the 24 months prior to retirement (12 months prior for LEOFF1). Pre-AFC periods can include up to 96 months. Plans 2/3: The AFC and Pre-AFC periods include up to 60 months for the open plans.
100
120
140
160
180
200
220
240
1 7
13
19
25
31
37
43
49
55
61
67
73
79
85
91
97
10
3
10
9
11
5
Mo
nth
ly H
ou
rs W
ork
ed
Months to Retirement MA = moving average
LEOFF2Hours
PERS2Hours
TRS2 Hours(MA)
SERS2Hours (MA)
SERS3Hours (MA)

27
Exhibit 21
Average Monthly Hours Before and During AFC Period Retirements from January 2009 to June 2012
Plan/System N Avg. Hrs Pre-
AFC Avg. Hours
AFC Difference
Std Dev AFC Avg.
LEOFF1 109 186.3 182.9 -3.40 21.8
LEOFF2 731 195.4 194.9 -0.50 26.1
PERS1 3,577 170.2 169.3 -0.90 18.8
PERS2 6,182 173.0 172.1 -0.90 17.8
PERS3 158 171.1 169.0 -2.10 20.1
SERS2 1,115 147.2 146.1 -1.10 28.0
SERS3 251 143.0 140.8 -2.20 26.9
TRS1 1,968 153.1 154.1 1.00 18.7
TRS2 558 143.6 \141.3 -2.30 14.1
TRS3 258 141.0 139.1 -1.9
0 18.3
WSPRS1 99 180.3 177.2 -3.10 9.7
PERS2: FERRIES 52 178.5 179.5 1.00 13.6
PERS1: CORRECTIONS 93 179.0 176.3 -2.70 10.2
PERS2: CORRECTIONS 324 180.0 179.1 -0.90 16.7
Total 15,475 167.3 166.5 -0.79 19.2
WSIPP analysis of DRS data (see Appendix E)
Variation in AFC Hours Gains
Although we do not observe systematic increases in average hours during AFC periods, there are exceptions. As demonstrated in Exhibit 22, some employees (8%) work substantially more hours during AFC periods, in comparison with the pre-AFC period. Three percent work more than 20 additional hours per month. Most (77%) work less or the same amount during the AFC period as the pre-AFC period.
Exhibit 22 Difference in Average Monthly Hours in AFC
and Pre-AFC Periods All Washington Systems & Plans,
Retirements from January 2009 to June 2012
WSIPP analysis of DRS data (see Appendix E)
31%
46%
15%
5% 3%
0%
10%
20%
30%
40%
50%
60%
70%
<-2 -2 to <2 2 to <10 10 to<20
20+
Perc
en
t o
f re
tire
es
Change in hours post─pre AFC

28
Exhibit 23 shows how many retirees worked more, less, or the same amount of hours before and during the AFC period. The shaded squares indicate the number of people who worked about the same amount of hours during the AFC as before. For example, 7,151 recent retirees worked a typical 40-hour week before and during the AFC period. Among those who worked a typical 40-hour week prior to the AFC period, 413 worked marginally less (35-38 hours) and 357 worked marginally more (42-45 hours) during the AFC period.
Exhibit 23 illustrates some important points. First, most members tend to work roughly the same number of hours before and during the AFC period. Those who work overtime during the end of their career tended to also do so earlier in their career (like Stylized Example 2). Second, there are exceptions—hours increased substantially for some members, and extreme increases are rare. Third, hours decline for some members. See Appendix E for detailed analyses by plan and employer groups.
Exhibit 23 Number of Retirees by Average Hours Before and During the AFC Period
Average Monthly Hours: AFC Period (1) <128 (2) 128-149 (3) 150-166 (4) 167-179 (5) 180-192 (6) 193-214 (7) 215+ Total
Average Hours: Pre-AFC
(15-29/wk) (30-34/wk) (35-38/wk) (39-41/wk) (42-45/wk) (45-49/wk) (50+/wk)
(1) <128 (15-29/wk) 699 131 35 20 3 0 1 889
(2) 128-149 (30-34/wk) 240 1153 382 65 11 7 2 1860
(3) 150-166 (35-38/wk) 47 470 1189 369 32 5 9 2121
(4) 167-179 (39-41/wk) 29 107 413 7151 357 34 13 8104
(5) 180-192 (42-45/wk) 0 6 37 543 577 134 16 1313
(6) 193-214 (45-49/wk) 1 2 4 59 137 236 50 489
(7) 215+ (50+/wk) 0 0 0 14 15 36 165 230
Total 1016 1869 2060 8221 1132 452 256 15006
WSIPP analysis of DRS data (see Appendix E)

29
Hours Worked and Pension Rule Incentives
Some employees do increase hours worked during AFC periods. It is not clear whether this is due to increased job responsibilities versus behavior intended to increase pensions. The following statistical regression analysis attempts to gauge the extent to which pension plan rules—the time periods included in AFC calculations—affect hours worked. We take advantage of the 'natural experiment' that arises from differences in AFC periods across PERS 1 (two years) and PERS 2 and 3 (five years). PERS 1 members have an incentive to increase hours worked during the last 24 months years prior to retirement. PERS 2 and 3 members have an incentive to increase hours during the last 60 months prior to retirement. Importantly, from 24 to 60 months prior to retirement, the incentives operate only on PERS 2 and 3 members. We estimated the extent to which hours deviate from trend during the 60 to 24 month period prior to retirement for PERS 1 versus PERS 2 and 3 members. We would expect the increase in hours to be higher during this period for PERS 2 and 3 members, since they have the greater incentive for working more. Each additional hour worked increases their AFC and results in relatively large increases in lifetime pension benefits. We estimated ‘fixed effects’ regressions, which examine changes in hours from month to month for individual members. The method effectively controls for observed and unobserved member characteristics that do not change over time. We estimated several different models using different functional forms (see Appendix E for results). We first estimated the regressions using data for all recent PERS retirees. These estimates suggest that members do respond to retirement incentives, but the overall impact on hours is modest. PERS 2 and 3 members tended to work marginally more hours during the 60 to 24 month test period. PERS 1 members, after controlling for time trend and
member characteristics, worked 0.6 additional hours per month, whereas PERS 2 and 3 members worked an additional 0.8 hours per month. The larger increase in hours among PERS 2 and 3 members provides some evidence for an incentive effect. On average, however, the effect was small. Across all recent PERS 2 and 3 retirees, the pension incentive appears to have increased hours worked by 0.20 hours per month. This is an overall average; some members increased hours substantially, others not at all. We would expect the incentive effect to be greater among employers where overtime is more prevalent. We did not, however, find this to be the case (calling into question the robustness of our test). We identified two groups of PERS employers with higher than average rates of overtime. Among non-state agencies, public utility districts (PUD) and ports report high monthly hours. Overtime also appears to be more prevalent among some state agencies (such as the Department of Corrections and Department of Transportation). We estimated the regression tests for these employer groups (see Appendix E). The estimates for PUD and Port employees were sensitive to the functional form of the regression— the results varied across different models. All estimates suggest that PERS 1, 2, and 3 members worked more hours during the incentive period, with estimates ranging from 1 to 2 hours more per month. According to some models, PERS 2 and 3 workers increased hours by more than did PERS 1 members, providing evidence of an incentive effect. However, in other models, PERS 1, 2, and 3 members increased hours by similar amounts (about an hour per month). Estimates for the selected state agencies tell a similar story. All PERS members increase monthly hours during the AFC period by roughly an hour per month on average.

30
Overtime Compensation for State Agency Retirees
Human Resource Management System (HRMS) data provide information on earnings components, including overtime, for state agency employees. The Washington State Office of Financial Management extracted HRMS data for retirees in our analysis. The following section summarizes earnings information for recent state agency retirees from PERS 1, 2, and 3 who are matched with the HRMS data. The earnings data run from the second half of 2006 through the first half of 2012. For this analysis, we excluded the partial years and focus on the 2007 to 2011 data to obtain estimates of annual overtime compensation. We also excluded annual earnings observations for cases where the worker retires during that year. After these restrictions, we were left with 5,764 annual earnings observations for 1,811 state agency retirees. For each retiree in the sample, we calculate total annual compensation and total annual overtime compensation. The HRMS data are largely confined to the AFC periods for these retirees. We cannot examine differences in the importance of overtime before and during AFC periods. However, we use the data to examine the contribution of overtime to total annual earnings for this sample of state agency retirees. Among the state agency retirees included in these data, 28% had overtime compensation at some time in the five-year period. Across all workers, including those with no overtime in the five-year period, annual overtime compensation averaged $735 (accounting for 1.26% of total compensation; see Exhibit 24). Among the subset of employees who did work overtime in the five-year period, annual overtime compensation averaged $2,670 (accounting for 4.6% of total compensation).
Exhibit 24 Average Annual Overtime (OT) Compensation
and Share of Total Compensation
Sample of State Agency Retirees
Average OT pay
OT Share of Annual
Compensation
All Retirees, including OT=0
$735 1.26%
Retirees with OT>0 $2,670 4.6%
WSIPP analysis of HRMS data (see Appendix E) Note: State agency retirees from January 2009 to June 2012. Compensation data from 2007 to 2011. Data include 5,764 annual earnings records for 1,811 retirees. 28% of annual earnings records include some overtime compensation.
Overtime compensation is substantial for some retirees. When overtime compensation is received, it exceeds $5,000 per year in 13.4% of cases; it exceeds $10,000 in 5.2% of cases (Exhibit 25).
Exhibit 25 Overtime (OT) Compensation (Among cases where OT > 0)
OT Range Annual earnings
from to observations %
$1 <$100 168 10.6%
$100 <$500 330 20.8%
$500 <$1000 209 13.2%
$1,000 <$2500 395 24.9%
$2,500 <$5000 273 17.2%
$5,000 <$10,000 130 8.2%
$10,000+
83 5.2%
Total
1,588 100.0%
WSIPP analysis of HRMS data (see Appendix E) Note: Data include 1,588 annual earnings records for cases where OT compensation is included.

31
The following table summarizes overtime compensation among the larger agencies in our sample. By agency, the sample sizes are relatively small. We suggest that future analyses examine compensation among all
employees (not only recent retirees) in the agencies where overtime appears to be more prevalent.
Exhibit 26 Overtime (OT) Compensation by Agency
Sample of Retirees (January 2009 - June 2012)
Agency Retirees in sample
Annual earnings observations
% observations with OT>0
Avg. OT comp, where OT>0
OT share of total comp, where OT>0
OT share of total comp, where OT>0
Department of Transportation 185 593 55.1% $2,065 $3,744 5.5%
Department of Corrections 206 667 52.2% $1,937 $3,712 6.5%
Dept. of Natural Resources 40 126 34.1% $1,636 $4,795 9.7%
Department of Licensing 39 124 32.3% $319 $989 2.0%
Dept of Social & Health Serv. 623 1959 26.3% $516 $1,961 3.6%
Department of Fish & Wildlife 46 159 20.8% $472 $2,277 3.8%
Dept of Labor & Industries 87 269 13.8% $154 $1,123 2.1%
Employment Security Dept 74 239 11.7% $242 $2,064 3.4%
WSIPP analysis of HRMS (see Appendix E)

32
CONCLUSION
The 2012 Legislature directed the Institute to evaluate Washington’s and other state and local public retirement systems. We found that, compared with other state plans, Washington’s state pensions provide income replacement at or below the average levels. In Washington State, most local governments participate in the state retirement systems. Washington has portability laws that decrease, but do not eliminate, the reduction in benefits for workers who move between state employment and local governments that opt out of the state systems. We examined whether members of Washington’s state pension plans significantly increase their hours worked late in their careers (when compensation is counted in pension calculations). We did not find systematic increases in hours worked in the years just prior to retirement, although there are some exceptions.
Acknowledgements
The authors gratefully acknowledge the helpful assistance from the Office of the State Actuary (Matt Smith and Darren Painter) and the provision of data and review by the Department of Retirement Systems (Dave Nelsen and Chris Carson) as we conducted this study. We would also like to thank the Office of Financial Management for supplying payroll system data, Mark Olleman for his expert review, Laura Harmon for data support, and Steve Aos for consultation on statistical methods.
For further information, contact:
Annie Pennucci at (360) 586-3952, [email protected], John Bauer at (360) 586-2883, [email protected], or Stephanie Lee at (360) 586-3951, [email protected] Document No. 12-12-4101r
Washington State Institute for Public Policy
The Washington State Legislature created the Washington State Institute for Public Policy in 1983. A Board of Directors—representing the legislature, the governor, and public universities—governs the Institute and guides the development of all activities. The Institute’s mission is to carry out practical research, at legislative direction, on issues of importance to Washington State.

Washington State Institute for Public Policy
110 Fifth Avenue Southeast, Suite 214 PO Box 40999 Olympia, WA 98504-0999 (360) 586-2677 www.wsipp.wa.gov
December 2012
RETIREE BENEFITS IN PUBLIC PENSION SYSTEMS
APPENDICES

2
APPENDIX A: LEGISLATIVE STUDY DIRECTION
The Washington State Institute for Public Policy was directed to “conduct an evaluation of the benefits provided in the pension plans offered by public employers in the state” including an examination of:
(i) “The level of benefits offered by the state retirement plans and retirement plans sponsored by local government employers relative to the benefits provided in other states;
(ii) The adequacy of pension benefits provided to public employees, including barriers to retirement;
(iii) Barriers to the portability of retirement benefits between public employers in the state, including opportunities to improve benefit portability and compatibility; and
(iv) The treatment of overtime earnings in public employee retirement plans relative to the treatment of earnings in other states, including the impact of excess compensation on state retirement system contribution rates with a particular emphasis on agencies that operate on a 24-hour basis, such as the state patrol, ferry system, and state prisons.”
Supplemental Operating Budget § 606 (13), 2012 Wash. Sess. Laws 2225

3
APPENDIX B: FEATURES OF STATE PUBLIC PENSION PLANS
Washington’s retirement systems are structured similar to many public pension plans in the United States. This appendix provides details on other states plans, including:
Benefit type (DB, DC, or Hybrid)
Vesting rules
Retirement ages
Experience requirements
Contribution rates
Benefit calculation factors
Cost of living adjustments (COLAs)
Rules related to overtime and “excess compensation” How were plans selected for comparison? The design of public retirement systems is complex. Each plan has its own eligibility criteria, retirement ages, contribution rates, benefit calculation factors, and distribution methods. To compare like-plans to like, we limit our review to open state public pension plans that:
cover general state employees, teachers, and/or law enforcement and fire fighters;
are the most recently opened plan in the state; and
allow members to pay into Social Security in addition to state retirement plans (as Washington State employees do).
1
We selected general state employees and teachers because they represent two of the largest systems (PERS and TRS). We examined law enforcement and firefighter plans separately because they tend to have lower retirement ages. We did not collect comparative information for other retirement systems in WA because we had a short time frame for the study.
Exhibit B1 lists the general state employee and teacher plans and provides details on the pension benefit structure for each plan.
Exhibit B2 provides the same information for firefighters and law enforcement.
Exhibit B3 lists excess compensation provisions for general state employee and teacher plans.
Exhibit B4 lists excess compensation provisions for firefighters and law enforcement.
1 It is important to note that Washington members of LEOFF and WSPRS plans have the option to choose whether to contribute in
to Social Security, and most do not. Likewise, in many state plans, such as California STRS, most employees opt out of Social Security; they are included in our analysis because individuals can choose to opt in.

4
Key to Exhibits Employee type: Exhibit B1
S = State Employees L = Local Employees T = Teachers SE = School Employees
Employee type: Exhibit B2 S= State Police FF= Firefighters L= Local Police LE = Law Enforcement CO = Corrections Officers
Plan type
DB = Defined benefit DC = Defined contribution H = Hybrid
General
COLA = Cost-of-living Adjustment AFC = Average Final Compensation SCY = Service Credit Years
Because many contribution rates are determined actuarially and can vary year to year, we present the most recent contribution rate for each plan.

5
Exhibit B1 General State Employee and Teacher Plans Provisions
Plan Plan Name Emp. Type
Plan Type
Age/Exp. For Norm.
Ret.
Vesting Period
Age/Exp. For Early
Ret.
% Reduction/ Year Early
Ret.
Employee Contr.
Employer Cont.
Average Final
Comp. Years
Multiplier Automatic
COLA?
Alabama - ERS
Employees' Retirement System
S, L DB any/25; 60/10
10 None
7.5% 11.07% 3 2.01% No - Ad hoc
Alabama - TRS
Teachers’ Retirement System
T DB any/25; 60/10
10 None
7.5% 11.71% 3 2.01% No - Ad hoc
Arizona - ASRS
Arizona State Retirement System
S, L, T
DB
55/30; 60/25; 62/10; 65/any
10 50/5 5.0% 11.14% 11.14% 5 2.10% Yes - Fixed
2.5%
Arkansas - APERS
Arkansas Public Employees'
Retirement System S, L DB
any/28, 55/35; 65/5
5 any/25; 55/10
6.0% 5.0% 12.46% 3 2.22% Yes - Fixed
3%
Arkansas - ATRS
Arkansas Teacher Retirement System
T DB any/28;
60/5 5
any/25; under age
60 5.0% 6.0% 14.00% 3 2.15%
Yes - Fixed 3%
California - CalPERS 2
California Public Employees'
Retirement System - Tier 2
S, T DB 65/5 5 50/5 1.5% 8.0% 8.00% 1 1.25%
Yes - Based on CPI.
Capped at 2%
California - CalSTRS
California State Teachers'
Retirement System T DB 60/5 5 50/30; 55/5 6.0% 8.0% 8.25% 1 2.40%
Yes -Fixed 2%
Connecticut - SERS 3
Connecticut State Employees
Retirement System - Tier 3
S, T DB any/25; 65/10
10 58/10 6.0% 2.0% 9.00% 5 1.33%
Yes - Minimum of 2% Capped
at 7.5%
Delaware - SEPP
State Employees' Pension Plan
S, T DB any/30; 60/15; 62/5
5 any/25; 55/15
2.4% 3.0% 8.90% 3 1.85% No - Ad hoc

6
Exhibit B1 General State Employee and Teacher Plans Provisions
Plan Plan Name Emp. Type
Plan Type
Age/Exp. For Norm.
Ret.
Vesting Period
Age/Exp. For Early
Ret.
% Reduction/ Year Early
Ret.
Employee Contr.
Employer Cont.
Average Final
Comp. Years
Multiplier Automatic
COLA?
Florida - FRS
Florida Retirement System `Pension
Plan
S, L, T
DB 58/33; 65/8
8 any/below
30 5.0% 3.0% 5.18% 8 1.60%
Yes - Fixed 3%
Georgia - GSEPS
Georgia's State Employees’ Pension
and Savings Plan S H
any/30; 60/10
10 any/25 7.0% DB: 0%,
DC: 1.3% DB: 12%, DC: 0%
2 1.00%
No - Based on
investment earnings
Georgia - TRS
Teachers’ Retirement System
of Georgia T DB
any/30; 60/10
10 any/25 7.0% 6.0% 11.41% 2 2.00% Yes - Fixed
3%
Hawaii - ERS Hybrid
Employees' Retirement System -
Hybrid Plan S, L DB
60/30; 65/10
10 55/20 5.0% 8.0% 15.0% 5 1.75% Yes - Fixed
1.5%
Idaho - PERSI
Public Employee Retirement System
of Idaho
S, L, T
DB 65/5, R90 5 55/5 3.0% 6.45% 10.44% 3.5 2.00%
Yes - Fixed 1% with
investment based
increase. Capped at
6%
Illinois - SERS 2
State Employees Retirement System -
Tier 2 S DB 67/10 10 62/10 6.0% 4.00% 34.19% 8 1.67%
Yes - Lesser of 3% or half
of CPI
Indiana - PERF
Public Employees' Retirement Fund
S, L H 55/30; 60/15; 65/10
10 50/15 5.0% DB: 0%, DC: 3%
DB: 10%, DC: 0%
5 1.10% No - Ad hoc
Indiana - TRF
Teachers' Retirement Fund
T H 55/30; 60/15; 65/10
10 50/15 5.0% DB: 0%, DC: 3%
DB: 7.5%, DC: 0%
5 1.10% No - Ad hoc

7
Exhibit B1 General State Employee and Teacher Plans Provisions
Plan Plan Name Emp. Type
Plan Type
Age/Exp. For Norm.
Ret.
Vesting Period
Age/Exp. For Early
Ret.
% Reduction/ Year Early
Ret.
Employee Contr.
Employer Cont.
Average Final
Comp. Years
Multiplier Automatic
COLA?
Iowa - IPERS
Iowa Public Employees'
Retirement System
S, L, T
DB 62/20; 65/any;
R88 4 55/4 6.0% 5.78% 8.67% 3 2.00%
Yes - Based on CPI.
Capped at 1.5%
Kansas - KPERS 2
Kansas Public Employees'
Retirement System - Tier 2
S, L, T
DB 60/30; 65/5
5 55/10 5.8% 6.0% 9.37% 5 1.75% No COLA
Maryland - ETPS
Employees' and Teachers' Pension
System - Contributory
S, L, T
DB 65/10; r90 10 55/15 6.0% 7.0% 16.92% 5 3%
Yes - Based on CPI.
Capped at 2.5%
Michigan - PPRP
Pension Plus Retirement Plan
SE H 60/10 10 55/15 5.0% DB: 0%, DC: 2%
DB: 0%, DC: 1%
5 1.50% Yes - Fixed
2%
Michigan - SERS
State Employees’ Retirement System -
401k S DC 60/4 4
before 59.5/4
10.0% 3.0% 7.0%
Minnesota - GERP
General Employees' Retirement Plan
S DB 65/any;
R90 5 55/5 4.6% 5.0% 5.0% 5 1.70% No - Ad hoc
Minnesota - TRA 2
Teachers Retirement
Association - Tier 2 T DB 65/3 3 55/3 4.9% 6.0% 6.0% 5 1.90% No - Ad hoc
Mississippi - PERS 4
Public Employees' Retirement System
of Mississippi -Tier 4
S, L, T
DB any/30;
60/8 8 None
9.0% 14.26% 4 2.00%
Yes - Fixed 3%

8
Exhibit B1 General State Employee and Teacher Plans Provisions
Plan Plan Name Emp. Type
Plan Type
Age/Exp. For Norm.
Ret.
Vesting Period
Age/Exp. For Early
Ret.
% Reduction/ Year Early
Ret.
Employee Contr.
Employer Cont.
Average Final
Comp. Years
Multiplier Automatic
COLA?
Missouri - MSEP 2011
Missouri State Employee's Plan
2011 S DB
67/10; R90
10 62/10 6.0% 4.0% 14.45% 1 1.70%
Yes - Based on CPI.
Capped at 5%
Montana - DCRP
Defined Contribution Retirement Plan
S, L, T
DC 59.5 Immedi
ate 7.9% 4.19%
Montana - PERS
Public Employees Retirement System
S, L DB 65/5;
70/any 5
any/25; 55/5
6.0% 7.9% 7.17% 5 1.50% Yes - Fixed
3%
Montana - TRS
Teachers' Retirement System
T DB any/25;
60/5 5 50/5 6.0% 7.15% 2.49% 3 1.67%
Yes - Fixed 1.5%.
Nebraska - SPP
School Pension Plan T DB 65/any;
R85 5
any/35; 60/5
3.0% 8.28% 9.08% 3 2.00%
Yes - Based on CPI.
Capped at 2.5%
New Jersey - PERS 5
Public Employees' Retirement System
Tier 5
S, L, T
DB 65/any 10 any/30 3.0% 7.5% 11.2% 5 1.67% Suspended
New Jersey - TPAF 5
Teachers Pension And Annuity Fund
Tier 5 T DB 65/10 10 any/30 3.0% 6.5% 14.1% 5 1.67% Suspended
New Mexico - NMERB
Education Retirement Board
T DB any/30;
67/5; R80 5
under 60/less than 35
7.2% 9.15% 11.15% 5 2.35%
Yes - Based on CPI.
Capped at 4%
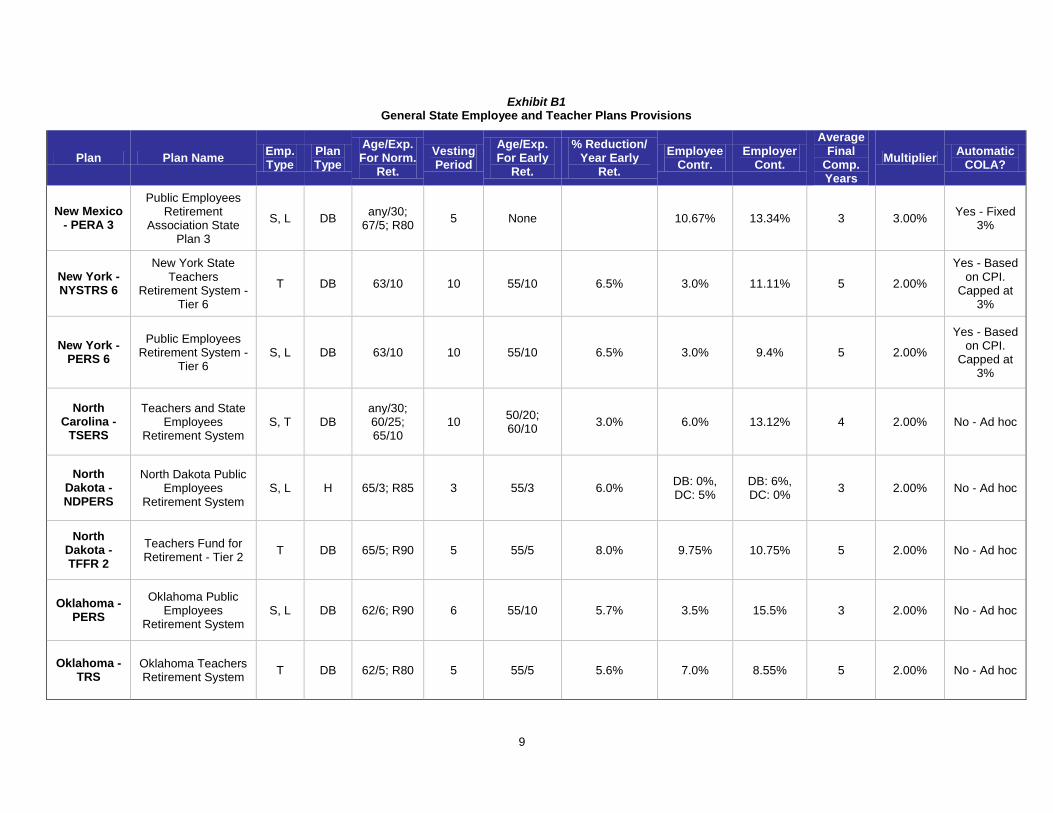
9
Exhibit B1 General State Employee and Teacher Plans Provisions
Plan Plan Name Emp. Type
Plan Type
Age/Exp. For Norm.
Ret.
Vesting Period
Age/Exp. For Early
Ret.
% Reduction/ Year Early
Ret.
Employee Contr.
Employer Cont.
Average Final
Comp. Years
Multiplier Automatic
COLA?
New Mexico - PERA 3
Public Employees Retirement
Association State Plan 3
S, L DB any/30;
67/5; R80 5 None
10.67% 13.34% 3 3.00%
Yes - Fixed 3%
New York - NYSTRS 6
New York State Teachers
Retirement System - Tier 6
T DB 63/10 10 55/10 6.5% 3.0% 11.11% 5 2.00%
Yes - Based on CPI.
Capped at 3%
New York - PERS 6
Public Employees Retirement System -
Tier 6 S, L DB 63/10 10 55/10 6.5% 3.0% 9.4% 5 2.00%
Yes - Based on CPI.
Capped at 3%
North Carolina -
TSERS
Teachers and State Employees
Retirement System S, T DB
any/30; 60/25; 65/10
10 50/20; 60/10
3.0% 6.0% 13.12% 4 2.00% No - Ad hoc
North Dakota - NDPERS
North Dakota Public Employees
Retirement System S, L H 65/3; R85 3 55/3 6.0%
DB: 0%, DC: 5%
DB: 6%, DC: 0%
3 2.00% No - Ad hoc
North Dakota - TFFR 2
Teachers Fund for Retirement - Tier 2
T DB 65/5; R90 5 55/5 8.0% 9.75% 10.75% 5 2.00% No - Ad hoc
Oklahoma - PERS
Oklahoma Public Employees
Retirement System S, L DB 62/6; R90 6 55/10 5.7% 3.5% 15.5% 3 2.00% No - Ad hoc
Oklahoma - TRS
Oklahoma Teachers Retirement System
T DB 62/5; R80 5 55/5 5.6% 7.0% 8.55% 5 2.00% No - Ad hoc

10
Exhibit B1 General State Employee and Teacher Plans Provisions
Plan Plan Name Emp. Type
Plan Type
Age/Exp. For Norm.
Ret.
Vesting Period
Age/Exp. For Early
Ret.
% Reduction/ Year Early
Ret.
Employee Contr.
Employer Cont.
Average Final
Comp. Years
Multiplier Automatic
COLA?
Oregon - OPSRP
Oregon Public Service Retirement
Plan S, L H
58/30; 65/any
5 55/5 8.0% DB: 0%, DC: 6%
DB: 6%, DC: 0%
1 LAST 1.50%
Yes - Based on CPI.
Capped at 2%
Pennsylvania - PSERS
Public School Employees
Retirement System T DB
any/35; 60/30; 62/1
5 55/25 3.0% 7.5% 7.5% 3 2.50% No - Ad hoc
Pennsylvania - SERS
State Employees Retirement System
S DB any/35;
60/3 5 any/5 4.5% 6.25% 7.29% 3 2.00% No - Ad hoc
Rhode Island - ERSRI
Employees' Retirement System
of Rhode Island S, T H 65/5 5 None
DB: 3.8%, DC: 5%
DB: 0%, DC: 1%
5 1.00% Suspended
South Carolina - SCORP
South Carolina Optional Retirement
Plan
S, L, T
DC 59.5 Immedi
ate 7.0% 5.0%
South Carolina - SCRS 3
South Carolina Retirement System -
Class 3
S, L, T
DB 65/8; R90 8 60/8 5.0% 7.0% 15.0% 5 1.82%
Yes - Based on CPI.
Capped at 2%
South Dakota -
SDRS
South Dakota Retirement System
Class A
S, L, T
DB 65/3 3 55/3 3.0% 6.0% 6.0% 3 1.70%
Yes - Based on CPI.
Capped at 3.1%
Tennessee - TCRS
Tennessee Consolidated
Retirement System Contributory
T DB any/30;
60/5 5 55/10 4.8% 5.0% 8.88% 5 1.50%
Yes - Based on CPI.
Capped at 3%

11
Exhibit B1 General State Employee and Teacher Plans Provisions
Plan Plan Name Emp. Type
Plan Type
Age/Exp. For Norm.
Ret.
Vesting Period
Age/Exp. For Early
Ret.
% Reduction/ Year Early
Ret.
Employee Contr.
Employer Cont.
Average Final
Comp. Years
Multiplier Automatic
COLA?
Texas - ERS Employees
Retirement System S DB
60/5; 65/10; R80
5 50/12; 55/10
5.0% 6.5% 6.0% 3 2.30% No - Ad hoc
Utah - PERS 2
Tier 2 Hybrid Retirement System
S H any/35;
65/4 4 62/10 7.0%
DB: 0%, DC: 0%
DB: 8%, DC: 1.59%
5 1.50% Yes - Fixed
2.5%
Utah - PERS 2
(DC)
Tier 2 Defined Contribution Plan
S DC 59.5/4 4
0.0% 10.0%
Vermont - VSERS F
Vermont State Employees'
Retirement System - Group F
S DB any/30;
62/5 5 55/5 6.0% 6.4% 17.11% 3 1.67%
Yes - Based on CPI.
Capped at 5%
Vermont - VSTRS C
Vermont State Teachers'
Retirement System - Group C
T DB any/30; 62/any
5 55/5 6.0% 5.0%
3 1.67%
Yes - Based on CPI.
Capped at the lesser of 5%, or 50%
of CPI
Virginia - VRS 2
Virginia Retirement System Plan 2
S, L, T
DB 65/5; R90 5 60/5 6.0% 5.0% 6.58% 5 1.70%
Yes - Based on CPI.
Capped at 5%
Washington - PERS 2
Public Employees Retirement System
Plan 2 S DB 65/5 5 55/30 5.0% 4.64% 7.21% 5 2.00%
Yes - Based on CPI.
Capped at 3%
Washington - PERS 3
Public Employees Retirement System
Plan 3 S H 65/5 5; 10 55/30 5.0%
DB: 0%, DC: 5%
DB: 7.21%, DC: 0%
5 1.00%
Yes - Based on CPI.
Capped at 3%

12
Exhibit B1 General State Employee and Teacher Plans Provisions
Plan Plan Name Emp. Type
Plan Type
Age/Exp. For Norm.
Ret.
Vesting Period
Age/Exp. For Early
Ret.
% Reduction/ Year Early
Ret.
Employee Contr.
Employer Cont.
Average Final
Comp. Years
Multiplier Automatic
COLA?
Washington - SERS 2
School Employees' Retirement System
Plan 2 SE DB
55/20; 65/5
5 55/30 5.0% 4.09% 7.58% 5 2.00%
Yes - Based on CPI.
Capped at 3%
Washington - SERS 3
School Employees' Retirement System
Plan 3 SE H 65/10 5; 10 55/30 5.0%
DB: 0%, DC: 5%
DB: 7.59%, DC: 0%
5 1.00%
Yes - Based on CPI.
Capped at 3%
Washington - TRS 2
Teacher Retirement System Plan 2
T DB 65/5; 55/20
5 55/30 5.0% 4.69% 8.04% 5 2.00%
Yes - Based on CPI.
Capped at 3%
Washington - TRS 3
Teacher Retirement System 3
T H 55/10; 65/5
5; 10 55/30 5.0% DB: 0%, DC: 5%
DB: 8.05%, DC: 0%
5 1.00%
Yes - Based on CPI.
Capped at 3%
West Virginia -
PERS
Public Employees Retirement System
S, L DB 60/5; R80 5 55/10
4.5% 14.0% 3 2.00% No - Ad hoc
West Virginia -
TRS
Teachers Retirement System
T DB any/35;
60/5 5
before 55/between
30-35
6.0% 15.0% 5 2.00% No - Ad hoc
Wisconsin - WRS
Wisconsin Retirement System
Defined Benefit Plan
S, L, T
DB 65/any;
R87 5 55/5 4.8% 6.0% 11.3% 3 1.60% No - Ad hoc
Wyoming - PEPP 2
Public Employee Retirement Plan 2
S, L, T
DB 65/4; R85 4 55/4 5.0% 7.0% 7.12% 5 2.00% Suspended

13
Exhibit B2 Police and Firefighter Plans Provisions
Plan Plan Name Emp. Type
Plan Type
Age/Exp. For
Norm. Ret
Vesting Period
Age/Exp. For
Early Ret.
% Reduction/Year Early
Ret.
Employee. Cont.
Employer Cont.
Average Final
Comp. Years
Multiplier Automatic
COLA?
Alabama - AERS
Alabama Employees’
Retirement System S DB
any/25; 52/10
10 None
10.0% 29.92% 3 2.88% No - Ad hoc
Alabama - AERS
Alabama Employees’
Retirement System
CO, LE, FF
DB any/25; 60/10
10 None
8.5% 9.42% 3 2.50% No - Ad hoc
Arizona - PSPRS 2
Public Safety Personnel
Retirement System
S, L, FF
DB 52.5/25; any/25
5 any/less than 25
4.0% 7.65% 20.89% 5 2.50%
No - Contingent on
investment earnings.
Arkansas - ASPRS 2
Arkansas State Police Retirement
System - Tier II Non-Contributory
S DB any/30;
65/5 5
55/less than 30
6.0% non-
contributory 22.0% 4 2.48% Yes - Fixed 3%
California - CalPERS 2
Public Employees Retirement System
- Tier 2
S, FF, LE
DB 65/10 10 55/10 6.0% non-
contributory 10.82% 3 2.50%
Yes - Based on CPI.
Capped at 2%
Connecticut - HDP 2A
Hazardous Duty Plan - Tier 2A
S, L, FF
DB any/20 5 55/10 3.0% 4.0% 6.89% 3 2.00% Yes - Minimum of 2% Capped
at 7.5%
Florida - FRS
Florida Retirement System - Special
Risk Class
S, L, FF
DB 60/8;
any/30 8
less than 60/8
5.0% 3.0% 17.0% 8 3.00% Yes - Fixed 3%
Georgia - GERS
Georgia Employees'
Retirement System S H
55/10; any/30
10 any/25 7.0% DB: 0%; DC:
1.3%
DB: 8.07%;
DC: 1.25% 2 1.00% No - Ad hoc
Hawaii - ERS
Employees' Retirement System - Contributory Plan
S, FF DB 60/10 10 55/25 1.7% 14.2% 19.7% 5 2.25% Yes - Fixed
1.5%
Idaho - IPERS
Idaho Public Employees'
Retirement System S, FF DB 60; R80 5 50/5 3.0% 7.7% 10.44% 3.5 2.30% Yes - Fixed 1%

14
Exhibit B2 Police and Firefighter Plans Provisions
Plan Plan Name Emp. Type
Plan Type
Age/Exp. For
Norm. Ret
Vesting Period
Age/Exp. For
Early Ret.
% Reduction/Year Early
Ret.
Employee. Cont.
Employer Cont.
Average Final
Comp. Years
Multiplier Automatic
COLA?
Illinois - SERS 2
State Employees' Retirement System
- Tier 2 S, FF DB 60/20 10 None
12.5% 27.98% 8 2.50%
Yes - Lesser of 3% or half of
CPI
Indiana - POFP
Police Officers & Firefighters'
Pension S, FF DB 52/20 20 50/20 7.0% 6.0% 19.7% 1 1.00%
No - Ad hoc, based on
investment returns
Iowa - PERS
Public Employee Retirement System - Special Service
Class
L, FF DB 55/any; any/4
4 None
6.84% 10.27% 3 2.73%
No - Ad hoc, based on
reserves from a separate
account
Kansas - KPF 2
Kansas Police & Fire Fighters - Tier
2 S, FF DB
50/25; 55/20; 60/15
15 50/20 4.8% 7.0% 16.43% 3 2.50% No COLA
Kentucky - SPRS
State Police Retirement System
S DB any/20;
55/5 5 50/15 6.50% 8.0% 30.07% 5 2.50%
Yes - Based on CPI.
Capped at 5%
Maryland - LEOPS
Law Enforcement Officers Pension
System LE DB
50/any; any/25
10 None
7.0% 46.81% 5 2.00% Yes - Based
on CPI. Capped at 5%
Maryland - SPRS
State Police Retirement System
S DB 50/any; any/25
10 None
8.0% 61.21% 3 2.55%
Yes - Based on CPI.
Capped at 2.5%
Minnesota - CERP
Correctional Employees'
Retirement Plan CO DB 55/5 5 50/5 2.4% 6.0% 8.5% 5 2.40% Yes - Fixed 3%

15
Exhibit B2 Police and Firefighter Plans Provisions
Plan Plan Name Emp. Type
Plan Type
Age/Exp. For
Norm. Ret
Vesting Period
Age/Exp. For
Early Ret.
% Reduction/Year Early
Ret.
Employee. Cont.
Employer Cont.
Average Final
Comp. Years
Multiplier Automatic
COLA?
Minnesota - PERA
Public Employee Retirement
Association, Police and Fire Fund
L, FF DB 55/10; 65/1
10 50/10; any/30
6.0% 9.75% 14.0% 5 3.00% Yes - Fixed 1%
New Mexico - SPAC
State Police and Correctional
S, CO DB any/20 5 None
10.85% 21.85% 3 3.00% Yes - Fixed
2%. Capped at 4%
New York - PFRS 5
Police and Firemen’s
Retirement System - Tier 5
S, FF DB 62/10; any/20
10 55/10 3.0% 4.5% 21.6% 5 2.22% Yes - Based
on CPI. Capped at 3%.
New York - SRS 5
State and Local Retirement System: State Police Tier 5
S DB 62/10; any/20
10 55/10 50% of AFC 3.0% 22.0% 3 2.50% Yes - Fixed 2%
North Carolina -
SLEO
State Law Enforcement
Officers LE DB
55/10; any/30
10 50/15 other 6.0% 13.12% 4 1.85% Yes - Fixed 1%
North Dakota - NDPERS
ND National Guard, Police and FF
Retirement System
S, L, FF
H 55/3 3 50/3 6.0% DB: 0%; DC:
4%
DB: 7.64%; DC: 0%
3 2.00% No - Ad hoc
Ohio - PERS
Public Employees' Retirement System: Law Enforcement
Division
S, L, FF
DB 48/25; 62/15
5 52/15 Reduced
benefit factor of 1.5%
12.1% 17.4% 3 2.50% Yes - fixed 3%
Oklahoma - PPRS
Police Pension and Retirement System
L DB 50/any; any/20
10 None
8.0% 13.0% 1.5 2.50% Yes - Based
on CPI. Capped at 2%

16
Exhibit B2 Police and Firefighter Plans Provisions
Plan Plan Name Emp. Type
Plan Type
Age/Exp. For
Norm. Ret
Vesting Period
Age/Exp. For
Early Ret.
% Reduction/Year Early
Ret.
Employee. Cont.
Employer Cont.
Average Final
Comp. Years
Multiplier Automatic
COLA?
Oregon - PSRP
Public Service Retirement Plan
S, L, FF
H 60/5 5 50/5 8.0% DB: 0%; DC:
6%
DB: 8.52%; DC: 0%
3 1.35% Yes - Based
on CPI. Capped at 2%
Pennsylvania - SERS
State Employees' Retirement System:
Classes A-3, A-4 S DB 60 10 any 50% AFC 5.0% 8.43% 1 2.50% No - Ad hoc
Rhode Island - SPRBT
State Police Retirement Benefit
Trust S DB 55/5 5 52/5 50% AFC 8.75% 14.45% 5 2.00%
Yes - Fixed 2%. Capped at
2%
South Carolina -
PORS
Police Officers Retirement System
S DB 55/8;
any/27 8 None
7.3% 10.0% 3 2.14%
Yes - Based on CPI.
Capped at 2%
South Dakota
Class B - Public Safety
LE DB 55/3 3 45/3 3.0% 8.0% 8.0% 3 2.00%
Yes - Based on CPI.
Capped at 3.1%
Tennessee - TCRS
Tennessee Consolidated
Retirement System Non-Contributory
LE DB 60/5;
any/30 5 55/10 4.0%
non-contributory
5.0% 5 1.50% Yes - Based
on CPI. Capped at 3%
Texas - LECOS
Law Enforcement & Custodial Officers' Supplemental Plan
LE DB 50/20; R80
any/20 3.0% 7.0% 5.5% 3 2.80% No - Ad hoc
Utah - PSFRS 2
Tier 2 Hybrid Retirement System
S, FF H
65/4; 62/10; 60/20; any/25
4 60/<25 7.0% non-
contributory
DB: 1.59%;
DC: 8.41% 5 1.50%
Yes - Fixed 1.5%

17
Exhibit B2 Police and Firefighter Plans Provisions
Plan Plan Name Emp. Type
Plan Type
Age/Exp. For
Norm. Ret
Vesting Period
Age/Exp. For
Early Ret.
% Reduction/Year Early
Ret.
Employee. Cont.
Employer Cont.
Average Final
Comp. Years
Multiplier Automatic
COLA?
Utah - PSFRS 2
DC
Tier 2 Defined Contribution Plan
S, FF DC 59.5 4 None
non-contributory
12.0%
Vermont - VSERS C
Vermont State Employees'
Retirement System - Group C
S, LE DB 55/5 5 50/20 No reduction 8.28% 17.11% 2 2.50% Yes - Based
on CPI. Capped at 5%
Virginia - SPORS 2
State Police Officers'
Retirement System 2
S DB 60/5; 50/25
5 50/5 6.0% 5.0% 21.16% 5 1.85% Yes - Fixed 3%
Virginia - VaLORS 2
Virginia Law Officers'
Retirement System 2
LE DB 60/5; 50/25
5 50/5 6.0% 5.0% 13.09% 5 2.00% No - Based on
investment returns
Washington - LEOFF 2
Law Enforcement Officers & Fire Fighters Plan 2
S, FF DB 53/5 5 50/20 5.0% 8.46% 5.24% 5 2.00% Yes - Based
on CPI. Capped at 3%
Washington - PSERS 2
Public Safety Employees
Retirement System Plan 2
S, FF DB 65/5; 60/10
5 53/20 5.0% 6.36% 8.87% 5 2.00% Yes - Based
on CPI. Capped at 3%
Washington - WSPRS 2
Washington State Patrol Retirement
Services 2 S DB
55/any; any/25
0 (active);
5 inactive)
55/5; 60/5
5.0% 6.59% 8.07% 5 2.00% Yes - Based
on CPI. Capped at 3%
Wisconsin - WRS
Protective Employees' in SS
S, L FF
DB 53/25;
54/<25; 5 50/5 4.8% 6.65% 9.75% 3 2.00% No - Ad hoc
Wyoming - LEP
Law Enforcement Plan
LE DB 60/4;
any/20 4 None
8.6% 8.6% 3 HC 2.50%
No - Ad hoc. Capped at 2%
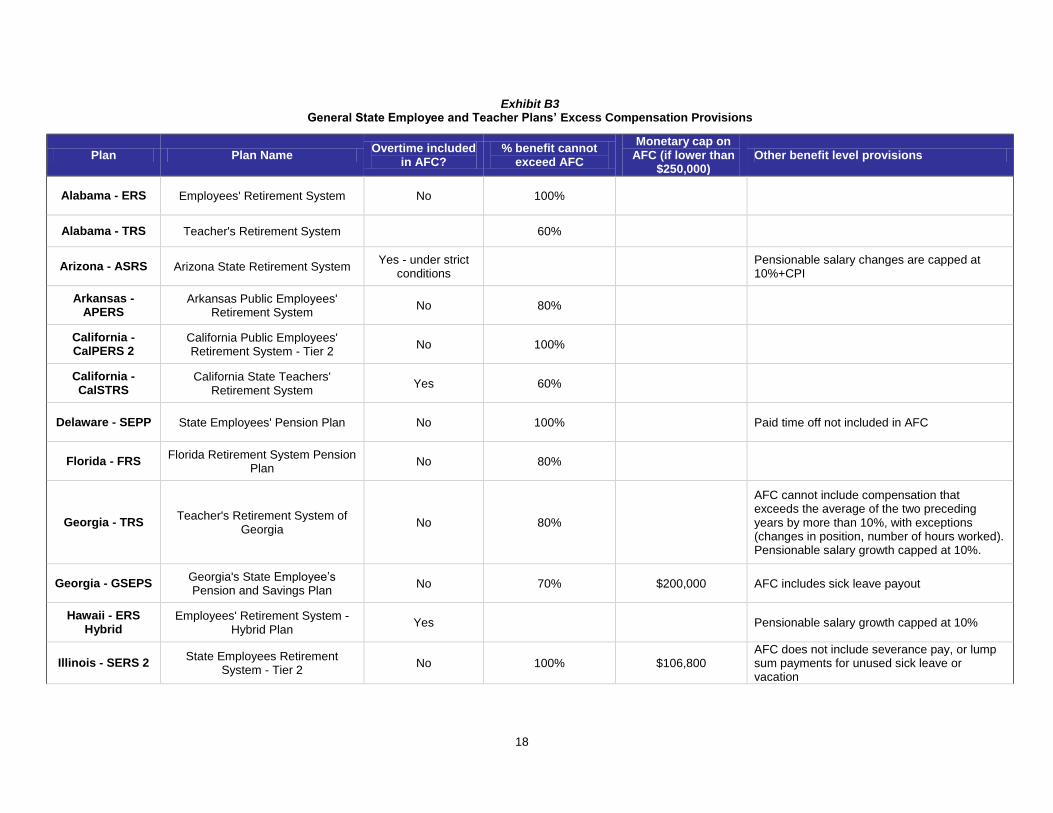
18
Exhibit B3 General State Employee and Teacher Plans’ Excess Compensation Provisions
Plan Plan Name Overtime included
in AFC? % benefit cannot
exceed AFC
Monetary cap on AFC (if lower than
$250,000) Other benefit level provisions
Alabama - ERS Employees' Retirement System No 100%
Alabama - TRS Teacher's Retirement System
60%
Arizona - ASRS Arizona State Retirement System Yes - under strict
conditions Pensionable salary changes are capped at 10%+CPI
Arkansas - APERS
Arkansas Public Employees' Retirement System
No 80%
California - CalPERS 2
California Public Employees' Retirement System - Tier 2
No 100%
California - CalSTRS
California State Teachers' Retirement System
Yes 60%
Delaware - SEPP State Employees' Pension Plan No 100%
Paid time off not included in AFC
Florida - FRS Florida Retirement System Pension
Plan No 80%
Georgia - TRS Teacher's Retirement System of
Georgia No 80%
AFC cannot include compensation that exceeds the average of the two preceding years by more than 10%, with exceptions (changes in position, number of hours worked). Pensionable salary growth capped at 10%.
Georgia - GSEPS Georgia's State Employee’s Pension and Savings Plan
No 70% $200,000 AFC includes sick leave payout
Hawaii - ERS Hybrid
Employees' Retirement System - Hybrid Plan
Yes
Pensionable salary growth capped at 10%
Illinois - SERS 2 State Employees Retirement
System - Tier 2 No 100% $106,800
AFC does not include severance pay, or lump sum payments for unused sick leave or vacation

19
Exhibit B3 General State Employee and Teacher Plans’ Excess Compensation Provisions
Plan Plan Name Overtime included
in AFC? % benefit cannot
exceed AFC
Monetary cap on AFC (if lower than
$250,000) Other benefit level provisions
Indiana - PERF Public Employees' Retirement
Fund
Unused paid leave is included in AFC, with a maximum of $2,000 given for unused sick leave and paid time off
Indiana - TRF Teachers' Retirement Fund No
Unused sick leave is included in AFC
Iowa - IPERS Iowa Public Employees' Retirement
System No 100%
Kansas - KPERS 2
Kansas Public Employees' Retirement System - Tier 2
No 100%
260 days of unused sick leave converts to 1 SCY, and counts towards a member's AFC
Maryland - ETPS Employees' and Teachers' Pension
System - Contributory Yes 60%
Michigan - SERS State Employee's Retirement
System - 401k Defined Contribution Yes 60%
Michigan - PPRP Pension Plus Retirement Plan
Includes unused sick leave in AFC
Mississippi - PERS 4
Public Employees' Retirement System of Mississippi - Tier 4
Yes 80%
Missouri - MSEP 2011
Missouri State Employee's Plan 2011
No
Includes unused sick leave in AFC
Montana - PERS Public Employees Retirement
System Yes 120% $22,000
Montana - TRS Teachers' Retirement System No 80%
No unused sick leave or vacation is included in AFC
Nebraska - SPP School Pension Plan No 75%
New Jersey - PERS 5
Public Employees' Retirement System Tier 5
Yes
10% salary growth cap in AFC calculation

20
Exhibit B3 General State Employee and Teacher Plans’ Excess Compensation Provisions
Plan Plan Name Overtime included
in AFC? % benefit cannot
exceed AFC
Monetary cap on AFC (if lower than
$250,000) Other benefit level provisions
New Jersey - TPAF 5
Teachers Pension And Annuity Fund Tier 5
No
$40,000
New Mexico - PERA 3
Public Employees Retirement Association State Plan 3
No 100%
New Mexico - NMERB
Education Retirement Board
Unused sick leave contributes to AFC 10 days of sick leave counts as 1 SCY
New York - PERS 6
Public Employees Retirement System - Tier 6
No
AFC cannot exceed a member's highest 3 years' average salary
New York - NYSTRS 6
New York State Teachers Retirement System - Tier 6
Yes
OT is counted in AFC as the average of OT a member does across 6 years.
North Carolina - TSERS
Teachers and State Employees Retirement System
No
Unused sick leave is calculated in AFC, with a maximum of up to 240 hours
North Dakota - NDPERS
North Dakota Public Employees Retirement System
100%
Rhode Island - ERSRI
Employees' Retirement System of Rhode Island
No 94.5%
South Carolina - SCORP
South Carolina Optional Retirement Plan
No
$110,100
South Dakota - SDRS
South Dakota Retirement System Class A
No
Paid vacation, sick leave, and holidays are counted towards AFC
Texas - ERS Employees Retirement System No
AFC does not include severance pay, or lump sum payment for unused sick leave or vacation
Utah - PERS 2 (DC)
Tier 2 Defined Contribution Plan No
$110,100
Utah - PERS 2 Tier 2 Hybrid Retirement System Yes
AFC is 90% of highest monthly salary. 5% salary growth cap in AFC calculation. If it is higher, the employee will be charged for compensation. Members make contributions on overtime.

21
Exhibit B3 General State Employee and Teacher Plans’ Excess Compensation Provisions
Plan Plan Name Overtime included
in AFC? % benefit cannot
exceed AFC
Monetary cap on AFC (if lower than
$250,000) Other benefit level provisions
Vermont - VSTRS C
Vermont State Teachers' Retirement System - Group C
75% $106,800
AFC includes unused sick leave; employer pays any salary increase that exceeds 6% of AFC. Employers pay for additional sick days granted within last 4 yrs of SCY that increases service credit
Washington - SERS 2
School Employees' Retirement System Plan 2
Yes
If AFC is more than 200% of the last year’s salary, employers must make increased contributions (determined by state actuary). Unused sick leave not calculated in AFC. Members make contributions on OT.
Washington - PERS 2
Public Employees Retirement System Plan 2
Yes
If AFC is more than 200% of the last year’s salary, employers must make increased contributions (determined by state actuary).Employer is liable for any extra retirement costs in lieu of excess compensation. Members make contributions on OT.
Washington - TRS 2
Teacher Retirement System Plan 2 No
If AFC is more than 200% of the last year’s salary, employers must make increased contributions (determined by state actuary). Members make contributions on OT.
Washington - SERS 3
School Employees' Retirement System Plan 3
Yes
If AFC is more than 200% of the last year’s salary, employers must make increased contributions (determined by state actuary).
Washington - PERS 3
Public Employees Retirement System Plan 3
Yes
If AFC is more than 200% of the last year’s salary, employers must make increased contributions (determined by state actuary). Employer is liable for any extra retirement costs in lieu of excess compensation.
Washington - TRS 3
Teacher Retirement System 3 No
If AFC is more than 200% of the last year’s salary, employers must make increased contributions (determined by state actuary).A cash out of any form of leave other than annual is excess compensation to the extent they are included in the calculation of the member's retirement benefit.
West Virginia - PERS
Public Employees Retirement System
100% $50,000

22
Exhibit B3 General State Employee and Teacher Plans’ Excess Compensation Provisions
Plan Plan Name Overtime included
in AFC? % benefit cannot
exceed AFC
Monetary cap on AFC (if lower than
$250,000) Other benefit level provisions
West Virginia - TRS
Teachers Retirement System No
AFC does not include vacation payouts
Wisconsin - WRS Wisconsin Retirement System
Defined Benefit Plan No
Pensionable salary growth capped at 7.5%.
Wyoming - PEPP 2
Public Employee Retirement Plan 2
Unused sick leave is included in AFC

23
Exhibit B4 Law Enforcement and Firefighter Plans Excess Compensation Provisions
State Plan name Overtime included
in AFC? % not allowed to
exceed AFC
Monetary cap on AFC (if lower than
$250,000) Other benefit level provisions
Alabama - AERS Alabama Employees’ Retirement System (State Police)
97%
Alabama - AERS Alabama Employees’ Retirement System (CO, LE, FF)
No Pensionable salary increases capped at 15%. Members are paid for up to 300 hours of annual leave upon retirement
Arizona - PSPRS 2
Public Safety Personnel Retirement System
Yes 80% Pensionable salary increases capped at 15%.
Arkansas - ASPRS 2
Arkansas State Police Retirement System - Tier II Non-Contributory
85%
California - CalPERS 2
Public Employees Retirement System - Tier 2
Yes 90% Unused sick leave and vacation are not included in AFC
Connecticut - HDP 2A
Hazardous Duty Plan - Tier 2A Yes 80%
Florida - FRS Florida Retirement System - Special Risk Class
No Pensionable salary changes are capped at 10%+CPI
Georgia - GERS Georgia Employees' Retirement System
No 95%
Hawaii - ERS Employees' Retirement System - Contributory Plan
No 94.50%
Illinois - SERS 2 State Employees' Retirement System - Tier 2
No 80% $106,800 Unused sick leave and vacation are included in AFC
Indiana - POFP Police Officers & Firefighters' Pension
No 70%
Iowa - PERS Public Employee Retirement System
82%
Kentucky - SPRS State Police Retirement System Yes
Maryland - LEOPS
Law Enforcement Officers Pension System
60%
Maryland - SPRS State Police Retirement System 50% Unused sick leave is included in AFC. 22 days converts to 1 month of service credit
Minnesota - CERP
Correctional Employees' Retirement Plan
No 80%

24
Exhibit B4 Law Enforcement and Firefighter Plans Excess Compensation Provisions
State Plan name Overtime included
in AFC? % not allowed to
exceed AFC
Monetary cap on AFC (if lower than
$250,000) Other benefit level provisions
New Mexico - SPAC
State Police and Correctional Yes 80% $106,800 Unused sick leave and vacation are not included in AFC
New York - PFRS 5
Police and Firemen’s' Retirement System - Tier 5
Yes 80% $62,000 The maximum pension payable to Tier 2, 3, 5 and 6 members is the benefit payable on completion of 32 years of service
New York - SRS 5
State and Local Retirement System: State Police Tier 5
Yes
Ohio - PERS Public Employees' Retirement System: Law Enforcement Division
90%
Oklahoma - PPRS
Police Pension and Retirement System
No $179,000
Oregon - PSRP Public Service Retirement Plan No Salary changes are capped at 10%+CPI
Rhode Island - SPRBT
State Police Retirement Benefit Trust
Yes 65%
South Carolina - PORS
Police Officers Retirement System No 60%
South Dakota - Class B - Public
Safety Class B - Public Safety Yes
Tennessee - TCRS
Tennessee Consolidated Retirement System Non-Contributory
No 50% $110,000 Unused sick leave and vacation are not included in AFC
Texas - LECOS Law Enforcement & Custodial Officers' Supplemental Plan
No 50% $110,000
AFC limit is based on the annual maximum wage for Social Security deductions, $110,000. Base salary does not include fringe benefits, OT, or severance pay. Employers are charged for excess compensation over the annual limit
Utah - PSFRS 2 Tier 2 Hybrid Retirement System No Unused sick leave is included in AFC to a limit of 1 service credit year maximum
Virginia - VaLORS 2
Virginia Law Officers' Retirement System 2
Yes
Washington - LEOFF 2
Law Enforcement Officers & Fire Fighters Plan 2
Yes If AFC is more than 200% of the last year’s salary, employers must make increased contributions (determined by state actuary).

25
Exhibit B4 Law Enforcement and Firefighter Plans Excess Compensation Provisions
State Plan name Overtime included
in AFC? % not allowed to
exceed AFC
Monetary cap on AFC (if lower than
$250,000) Other benefit level provisions
Washington - PSERS 2
Public Safety Employees Retirement System Plan 2
If AFC is more than 200% of the last year’s salary, employers must make increased contributions (determined by state actuary).
Washington - WSPRS 2
Washington State Patrol Retirement Services 2
No 75% If AFC is more than 200% of the last year’s salary, employers must make increased contributions (determined by state actuary).
Wisconsin - WRS Protective Employees' in SS Yes 65% Does not include severance pay, separation bonuses, expense allowances or fringe benefits
Wyoming - PFP Plan B
Paid Firefighters Plan B 75%

26
APPENDIX C: COMPARATIVE BENEFIT LEVELS BY PUBLIC PENSION PLAN
To conduct an “apples-to-apples” comparison of benefit levels across public pension plans, we constructed long-term earnings histories for two hypothetical public employees, one age 65 at retirement, with 30 years of service, and one age 55, also with 30 years of service. Assumptions about earnings levels for these two employees were based on data from Washington State’s Department of Retirement Systems (DRS). The structure of this dataset is described in Appendix E. Our measure for comparability of benefits across plans was a basic measure of “income replacement.” That is, of the final salary earned by the employee, what percentage will be earned by the employee from their public pension plan in the first year after retirement? It is crucial to note that in our computations of income replacement, we did not factor in income from Social Security, savings, or private investments, nor did we include estimations of taxes that may need to be paid on retirement income or the provision of health benefits. We used the DRS data to compute the median final salary for all retirees in the dataset who retired from Washington State service at age 65 between January 1, 2009 and June 30, 2012. The median final salary was $55,075. We also had data on individuals’ salaries covering the 10 years before retirement. We selected all employees for whom salary data from their retirement year and for 10 years prior were available (n=2,045). From that group, we identified all those workers whose final salaries fell between the 40
th percentile and the 60
th
percentile (n=409), and computed mean nominal earnings at each year to approximate salary growth for employees earning around the median Washington State salaries. We then imputed a linear annualized growth rate (2.99%) and assumed the same growth rate back to when our hypothetical employees began working, 30 years prior to their retirement. As DRS data did not have a sufficient sample of retirees at age 55 to conduct a parallel analysis for age 55 retirees in Washington, we assumed the same salary level for our age 55 hypothetical retiree as our 65-year-old retiree. The resulting stream of nominal wages (annual salary) is represented in Exhibit C1.
Exhibit C1 Projected Annual Salaries for Retiree Profiles
Years experience
Age (retire at 65)
Age (retire at 55)
Annual salary
0 35 25 $22,750
1 36 26 $23,430
2 37 27 $24,131
3 38 28 $24,853
4 39 29 $25,596
5 40 30 $26,362
6 41 31 $27,150
7 42 32 $27,962
8 43 33 $28,798
9 44 34 $29,660
10 45 35 $30,547
11 46 36 $31,461
12 47 37 $32,402
13 48 38 $33,371
14 49 39 $34,369
15 50 40 $35,397
16 51 41 $36,456
17 52 42 $37,546
18 53 43 $38,669
19 54 44 $39,825
20 55 45 $41,017
21 56 46 $42,243
22 57 47 $43,507
23 58 48 $44,808
24 59 49 $46,148
25 60 50 $47,529
26 61 51 $48,950
27 62 52 $50,414
28 63 53 $51,922
29 64 54 $53,475
30 65 55 $55,075
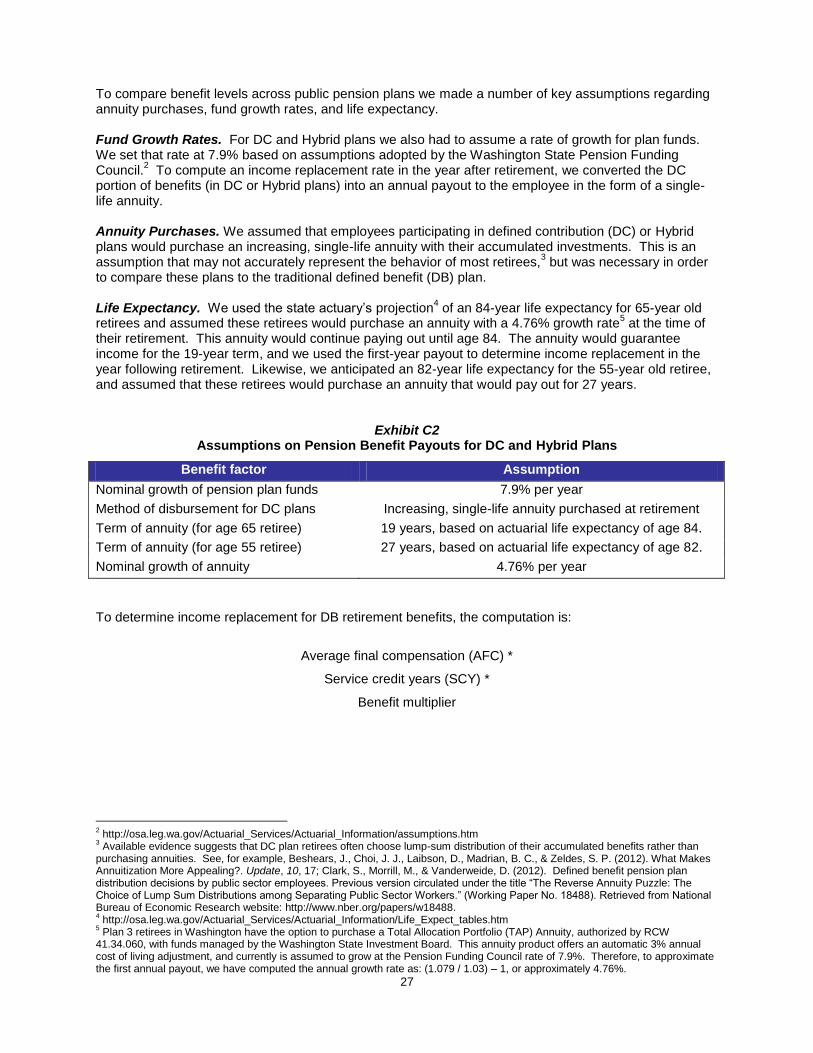
27
To compare benefit levels across public pension plans we made a number of key assumptions regarding annuity purchases, fund growth rates, and life expectancy. Fund Growth Rates. For DC and Hybrid plans we also had to assume a rate of growth for plan funds. We set that rate at 7.9% based on assumptions adopted by the Washington State Pension Funding Council.
2 To compute an income replacement rate in the year after retirement, we converted the DC
portion of benefits (in DC or Hybrid plans) into an annual payout to the employee in the form of a single-life annuity. Annuity Purchases. We assumed that employees participating in defined contribution (DC) or Hybrid plans would purchase an increasing, single-life annuity with their accumulated investments. This is an assumption that may not accurately represent the behavior of most retirees,
3 but was necessary in order
to compare these plans to the traditional defined benefit (DB) plan. Life Expectancy. We used the state actuary’s projection
4 of an 84-year life expectancy for 65-year old
retirees and assumed these retirees would purchase an annuity with a 4.76% growth rate5 at the time of
their retirement. This annuity would continue paying out until age 84. The annuity would guarantee income for the 19-year term, and we used the first-year payout to determine income replacement in the year following retirement. Likewise, we anticipated an 82-year life expectancy for the 55-year old retiree, and assumed that these retirees would purchase an annuity that would pay out for 27 years.
Exhibit C2 Assumptions on Pension Benefit Payouts for DC and Hybrid Plans
Benefit factor Assumption
Nominal growth of pension plan funds 7.9% per year
Method of disbursement for DC plans Increasing, single-life annuity purchased at retirement
Term of annuity (for age 65 retiree) 19 years, based on actuarial life expectancy of age 84.
Term of annuity (for age 55 retiree) 27 years, based on actuarial life expectancy of age 82.
Nominal growth of annuity 4.76% per year
To determine income replacement for DB retirement benefits, the computation is:
Average final compensation (AFC) *
Service credit years (SCY) *
Benefit multiplier
2 http://osa.leg.wa.gov/Actuarial_Services/Actuarial_Information/assumptions.htm
3 Available evidence suggests that DC plan retirees often choose lump-sum distribution of their accumulated benefits rather than
purchasing annuities. See, for example, Beshears, J., Choi, J. J., Laibson, D., Madrian, B. C., & Zeldes, S. P. (2012). What Makes Annuitization More Appealing?. Update, 10, 17; Clark, S., Morrill, M., & Vanderweide, D. (2012). Defined benefit pension plan distribution decisions by public sector employees. Previous version circulated under the title “The Reverse Annuity Puzzle: The Choice of Lump Sum Distributions among Separating Public Sector Workers.” (Working Paper No. 18488). Retrieved from National Bureau of Economic Research website: http://www.nber.org/papers/w18488. 4 http://osa.leg.wa.gov/Actuarial_Services/Actuarial_Information/Life_Expect_tables.htm
5 Plan 3 retirees in Washington have the option to purchase a Total Allocation Portfolio (TAP) Annuity, authorized by RCW
41.34.060, with funds managed by the Washington State Investment Board. This annuity product offers an automatic 3% annual cost of living adjustment, and currently is assumed to grow at the Pension Funding Council rate of 7.9%. Therefore, to approximate the first annual payout, we have computed the annual growth rate as: (1.079 / 1.03) – 1, or approximately 4.76%.

28
For DC benefits, we used the assumptions described above to estimate the total accumulated benefit by age of retirement. We assumed the employee would purchase an annuity for remaining years of life expectancy and draw down increasing, regular benefits on that purchase. In the hypothetical situation illustrated in Exhibit C4, an annuity purchased for $170,679 with a fixed rate of 4.76% and a 19-year term (age 65 retiree) would provide an initial annual benefit of $13,845. The same annuity purchased for a 27-year term (age 55 retiree) would provide an initial annual benefit of $11,358. Assumptions about annuity growth rates strongly impact estimated income replacement in retirement. The Total Allocation Portfolio (TAP) annuity product available to Washington State Plan 3 retirees provides 7.9% growth and an automatic 3% COLA.
6 Retirees electing to
purchase annuities in the private market may not receive COLAs and might expect lower rates of growth in their accumulated contributions
7. An
Institute synthesis of current (11/30/12) annuity quotes
8 for age 65 retirees in Washington State
with $170,679 in accumulated value yielded a mean rate of 1.89% growth with a fixed payment (no COLA) (Exhibit C4).
6 The Plan 3 Annuity Guide is available online at:
http://www5.icmarc.org/xp/pubs/code/processRequest.jsp?RFID=C1108 7 The TAP annuity investments are managed by the
Washington State Investment Board, which has access to investments in private equity that are not available to a typical investor or mutual fund. Other DC and Hybrid plans may not offer options with this type of professional investment management, and may experience lower fund growth rates. 8 We obtained quotes from
http://www.immediateannuities.com/ for men and women aged 65 in Washington State for a single life annuity. Monthly payments were converted to an annual sum. We used the life expectancies of men and women in WA (83 and 85 respectively) to estimate an annuity term, and imputed a growth rate for each quote. We then computed the mean growth rate.
Exhibit C3 Projected Accumulation of DC Plan Benefits
for Hypothetical PERS 3 Retiree
Years experience
Annual salary
Accumulated plan worth
9
0 $22,750 $0
1 $23,430 $1,137
2 $24,131 $2,399
3 $24,853 $3,795
4 $25,596 $5,337
5 $26,362 $7,039
6 $27,150 $8,913
7 $27,962 $10,975
8 $28,798 $13,240
9 $29,660 $15,725
10 $30,547 $18,451
11 $31,461 $21,436
12 $32,402 $24,702
13 $33,371 $28,274
14 $34,369 $32,176
15 $35,397 $36,436
16 $36,456 $41,085
17 $37,546 $46,153
18 $38,669 $51,676
19 $39,825 $57,692
20 $41,017 $64,241
21 $42,243 $71,367
22 $43,507 $79,117
23 $44,808 $87,543
24 $46,148 $96,699
25 $47,529 $106,646
26 $48,950 $117,447
27 $50,414 $129,173
28 $51,922 $141,899
29 $53,475 $155,705
30 $55,075 $170,679
9 PERS 3 is a Hybrid plan, so these DC benefits make up
only a portion of the total retirement benefits. This hypothetical employee contributed 5% toward his or her DC plan at the end of each year in a single annual contribution. Five percent is the mandatory default contribution rate for PERS 3.

29
Exhibit C4 Comparison of DC Plan Benefits under Different Assumptions (Age 65 Retiree)
TAP Private market
Accumulated DC benefits (time of retirement) $170,679 $170,679
Annuity annual growth rate 7.9% 1.89%
COLA 3% per year 0%
Annual payout in first year after retirement $13,845 $10,776
TAP is an optional annuity product provided by the Washington State Department of Retirement Systems.
The following tables display the results for the state pension plans reviewed.
Exhibit C5 Income Replacement for General State Employee and Teacher Plans
Plan Type of employees covered Type of
plan
Income replacement:
Age 65
Income replacement:
Age 55
Alabama ERS State, Local, and Police DB 59% 59%
Alabama TRS Teachers DB 59% 59%
Arizona ASRS State, Local and Teachers DB 59% 59%
Arkansas APERS State and Local DB 65% 65%
Arkansas ATRS Teachers DB 63% 47%
California CalPERS 2 State, Teachers, Public Agency DB 38% 32%
California CalSTRS Teachers DB 72% 36%
Connecticut SERS 3 State, Teachers DB 38% 38%
Delaware SEPP State and Teachers DB 54% 54%
Florida FRS State, Local and Teachers DB 43% 37%
Georgia GSEPS State Hybrid 42% 40%
Georgia TRS Teachers DB 59% 59%
Hawaii ERS Hybrid State, Local, Police, Firefighters DB 50% 37%
Idaho PERSI State, Local and Teachers DB 58% 27%
Illinois SERS 2 State DB 45% 0%
Indiana PERF State and Local Hybrid 46% 44%
Indiana TRF Teachers Hybrid 46% 44%
Iowa IPERS State, Local and Teachers DB 58% 23%
Kansas KPERS 2 State, Local and Teachers DB 50% 35%
Maryland ETPS State, Local and Teachers DB 42% 17%
Michigan PPRP School Employees Hybrid 58% 44%
Michigan SERS State DC 50% 41%
Minnesota GERP State and Local DB 48% 26%
Minnesota TRA 2 Teachers DB 54% 27%
Mississippi PERS 4 State, Local and Teachers DB 57% 57%
Missouri MSEP 2011 State DB 45% 51%
Montana DCRP State,Llocal and Teachers DC 62% 51%
Montana PERS State and Local DB 42% 42%
Montana TRS Teachers DB 49% 49%

30
Exhibit C5 Income Replacement for General State Employee and Teacher Plans
Plan Type of employees covered Type of
plan
Income replacement:
Age 65
Income replacement:
Age 55
Nebraska SPP Teachers DB 58% 58%
New Jersey PERS 5 State, Local, Teachers DB 47% 33%
New Jersey TPAF 5 Teachers DB 47% 33%
New Mexico NMERB Teachers DB 67% 67%
New Mexico PERA 3 State and Local DB 87% 87%
New York NYSTRS 6 Teachers DB 57% 27%
New York PERS 6 State and Local DB 57% 27%
North Carolina TSERS State and Teachers DB 57% 57%
North Dakota NDPERS State and Local Hybrid 83% 79%
North Dakota TFFR 2 Teachers DB 57% 11%
Oklahoma PERS State and Local DB 58% 35%
Oklahoma TRS Teachers DB 57% 35%
Oregon OPSRP State, Local Hybrid 74% 58%
Pennsylvania PSERS Teachers DB 73% 62%
Pennsylvania SERS State Employees, Police, Judicial DB 58% 45%
Rhode Island ERSRI State and Teachers Hybrid 58% 25%
South Carolina SCORP State, Local and Teachers DC 60% 49%
South Carolina SCRS 3 State, Local and Teachers DB 52% 0%
South Dakota SDRS State, Local and Teachers DB 50% 50%
Tennessee TCRS Teachers DB 42% 42%
Texas ERS State DB 67% 67%
Utah PERS 2 Public Employees Hybrid 50% 7%
Utah PERS 2 - DC Public Employees DC 50% 41%
Vermont VSERS F State DB 49% 49%
Vermont VSTRS C Teachers DB 49% 49%
Virginia VRS 2 State, Local and Teachers DB 48% 0%
Washington PERS 2 State DB 57% 28%
Washington PERS 3 State Hybrid 53% 35%
Washington SERS 3 School Employees Hybrid 53% 35%
Washington SERS2 School Employees DB 57% 28%
Washington TRS 3 Teachers Hybrid 53% 35%
Washington TRS2 Teachers DB 57% 28%
West Virginia PERS State and Local DB 58% 58%
West Virginia TRS Teachers DB 57% 57%
Wisconsin WRS State, Local and Teachers DB 47% 42%
Wyoming PEPP 2 State, Local and Teachers DB 57% 57%

31
Exhibit C6 Income Replacement for Law Enforcement and Firefighter Plans
Plan Type of employees covered Type of
plan
Income replacement:
Age 65
Income replacement:
Age 55
Alabama AERS State, Local Police & Firefighters DB 59% 59%
Alabama AERS State Police DB 84% 84%
Arizona PSPRS 2 State and Local Police & Firef. DB 71% 71%
Arkansas ASPRS 2 State Police DB 71% 71%
California CalPERS 2 Law Enforcement, Firefighters DB 73% 73%
Connecticut HDP 2A State, Local Police, Firefighters DB 58% 58%
Florida FRS State, Local Police, Firefighters DB 81% 81%
Georgia GERS Public Safety Hybrid 42% 40%
Hawaii ERS Police and Firefighters DB 64% 64%
Idaho IPERS Police & Firefighters DB 67% 67%
Illinois SERS 2 Police & Firefighters DB 68% 0%
Indiana POFP Police & Firefighters DB 70% 70%
Iowa PERS Local Police, Firefighters & others DB 80% 80%
Kansas KPF 2 Police and Firefighters DB 73% 73%
Kentucky SPRS State Police DB 71% 71%
Maryland LEOPS State Law Enforcement DB 57% 57%
Maryland SPRS State Police DB 74% 74%
Minnesota CERP Correctional officers DB 68% 68%
Minnesota PERA Local Police, Firefighters & others DB 85% 85%
New Mexico PERF State Police, Correctional Officers DB 87% 87%
New York PFRS 6 State Police & Firefighters DB 63% 63%
New York SRS 5 Correctional Officers DB 73% 73%
North Carolina SLEO State Law Enforcement DB 53% 53%
North Dakota NDPERS National Guard, Police, FF Hybrid 78% 75%
Ohio PERS State, Local Police, Firefighters DB 73% 73%
Oklahoma PPRS Municipal Police DB 74% 74%
Oregon PSRP State, Local Police, Firefighters Hybrid 70% 64%
Pennsylvania SERS State Police - Class AA DB 75% 38%
Rhode Island SPRBT State Police DB 57% 57%
South Carolina PORS State Police DB 61% 61%
South Dakota Class B State Law Enforcement DB 58% 58%
Tennessee TCRS Law Enforcement DB 42% 42%
Texas LECOS Law Enforcement DB 82% 82%
Utah PSFRS 2 Police and Firefighters Hybrid 85% 77%
Utah PSFRS 2 DC Police and Firefighters DC 42% 35%
Vermont VSERS C State Police & Law Enforcement DB 74% 74%
Virginia SPORS 2 State Police DB 52% 52%
Virginia VaLORS 2 State Law Enforcement DB 57% 57%
Washington LEOFF 2 Law enforcement/fire fighters DB 57% 57%
Washington PSERS 2 Public safety officers DB 57% 48%
Washington WSPRS 2 State Patrol DB 57% 57%
Wisconsin WRS State & Local Police, Safety DB 58% 58%
Wyoming WRS Firefighters DB 82% 82%

32
APPENDIX D: BENEFIT PORTABILITY ANALYSIS
To illustrate how retirement benefits are impacted by job mobility, we estimated benefit levels comparing two hypothetical workers with similar earnings profiles: one who stays in the same job (Employee A) and the other who is mobile (Employee B). Employee A stays in the same job for 30 years, whereas Employee B changes jobs over the course of their career. We compare pension benefits at the time of retirement for each of these workers. We compare four types of plans:
Defined Benefit (DB)
Defined Contribution (DC)
Hybrid (half DB/half DC)
Defined Benefit with portability provisions (described below) We use the income replacement for our metric using the same methods described in Appendix C. Assumptions:
Employee A stays in the same job for 30 years
Employee B changes jobs at years 7, 10, and 22
Both employees’ salaries grow at approximately 3% per year (based on the salary profiles in Appendix C)
For each job change, Employee B’s salary increases by an additional five percent, and they cash out and spent their contributions if they change jobs before the vesting period ends
Public employers in all the jobs have the same pension rules:
o For our defined benefit examples:
Average final salary period of three years;
Benefit multiplier of 2% for defined benefit plans and 1% for Hybrid plans;
Vest at five years (for DB and Hybrid plans).
o For our defined contribution plans:
The nominal growth is assumed to be 7.9%;
Contribution rates: 8% from the employer (goes to the DB portion only in the Hybrid plan) and 5% from the employee (goes to DC portion only in the Hybrid plan).
Annuitization assumptions: retirees purchase a TAP annuity (see Appendix C for details) with a 7.9% growth rate and automatic 3% COLA.
Portability Provisions
Employees are eligible to retire if the years of service combined across jobs meets the minimum
(e.g., age 60 with 30 years of experience)
The highest average final salary across jobs can be used to calculate benefits for each pension plan (up to 65% salary replacement).
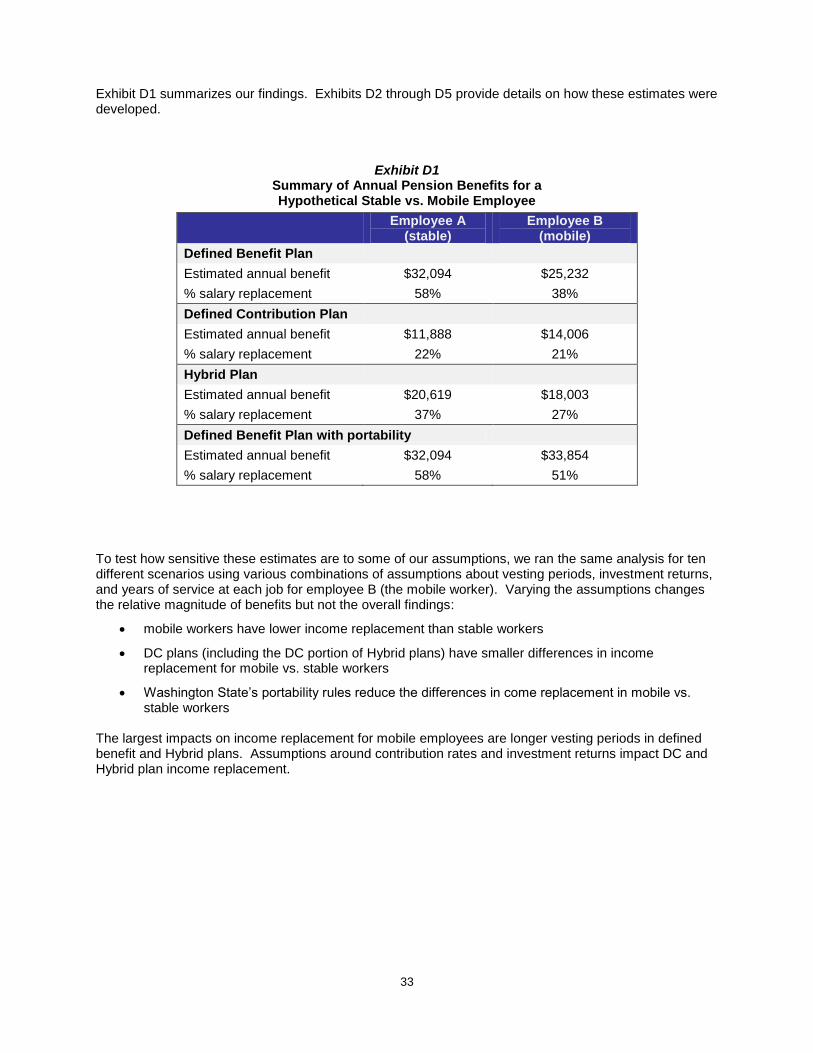
33
Exhibit D1 summarizes our findings. Exhibits D2 through D5 provide details on how these estimates were developed.
Exhibit D1 Summary of Annual Pension Benefits for a Hypothetical Stable vs. Mobile Employee
Employee A
(stable) Employee B
(mobile)
Defined Benefit Plan
Estimated annual benefit $32,094 $25,232
% salary replacement 58% 38%
Defined Contribution Plan
Estimated annual benefit $11,888 $14,006
% salary replacement 22% 21%
Hybrid Plan
Estimated annual benefit $20,619 $18,003
% salary replacement 37% 27%
Defined Benefit Plan with portability
Estimated annual benefit $32,094 $33,854
% salary replacement 58% 51%
To test how sensitive these estimates are to some of our assumptions, we ran the same analysis for ten different scenarios using various combinations of assumptions about vesting periods, investment returns, and years of service at each job for employee B (the mobile worker). Varying the assumptions changes the relative magnitude of benefits but not the overall findings:
mobile workers have lower income replacement than stable workers
DC plans (including the DC portion of Hybrid plans) have smaller differences in income replacement for mobile vs. stable workers
Washington State’s portability rules reduce the differences in come replacement in mobile vs. stable workers
The largest impacts on income replacement for mobile employees are longer vesting periods in defined benefit and Hybrid plans. Assumptions around contribution rates and investment returns impact DC and Hybrid plan income replacement.

34
Exhibit D2 Pension Benefits for Stable (“A”) versus Mobile (“B”) Employee:
Defined Benefit Plan
Age Year
Working
Annual Salary Average Final
Salary Years of Service
Annual Pension Benefits
Increment
per year of service DC Contributions (cumulative)
A B A B A B A B A B A B
30 1 $19,430 $19,430
$19,430 $19,430
31 2 $24,131 $24,131
$24,131 $24,131
32 3 $24,853 $24,853
$24,853 $24,853
33 4 $25,596 $25,596
$25,596 $25,596
34 5 $26,362 $26,362
$26,362 $26,362
35 6 $27,150 $27,150
$27,150 $27,150
36 7 $27,962 $29,320
$27,611
7
$3,865
$552 $27,962 $29,320
37 8 $28,798 $30,196
$28,798 $30,196
38 9 $29,660 $31,100
$29,660 $31,100
39 10 $30,547 $33,585
$31,627
3 No benefit
(not vested) $30,547 $33,585
40 11 $31,461 $34,590
$31,461 $34,590
41 12 $32,402 $35,624
$32,402 $35,624
42 13 $33,371 $36,690
$33,371 $36,690
43 14 $34,369 $37,787
$34,369 $37,787
44 15 $35,397 $38,917
$35,397 $38,917
45 16 $36,456 $40,082
$36,456 $40,082
46 17 $37,546 $41,280
$37,546 $41,280
47 18 $38,669 $42,515
$38,669 $42,515
48 19 $39,825 $43,786
$39,825 $43,786
49 20 $41,017 $45,096
$41,017 $45,096
50 21 $42,243 $46,444
$42,243 $46,444
51 22 $43,507 $50,156
$47,232
12
$11,336
$945 $43,507 $50,156
52 23 $44,808 $51,656
$44,808 $51,656
53 24 $46,148 $53,201
$46,148 $53,201
54 25 $47,529 $54,793
$47,529 $54,793
55 26 $48,950 $56,431
$48,950 $56,431
56 27 $50,414 $58,119
$50,414 $58,119
57 28 $51,922 $59,857
$51,922 $59,857
58 29 $53,475 $61,648
$53,475 $61,648
59 30 $55,075 $66,574 $53,491 $62,693 30 8 $32,094 $10,031 $1,070 $1,254 $55,075 $66,574

35
Exhibit D3 Pension Benefits for Stable (“A”) versus Mobile (“B”) Employee:
Defined Contribution Plan
Age Year
Working
Annual Salary Average Final
Salary Years of Service
Annual Pension Benefits
Increment
per year of service
DC Contributions
(cumulative)
A B A B A B A B A B A B
30 1 $23,430 $23,430
$3,287 $3,287
31 2 $24,131 $24,131
$6,671 $6,671
32 3 $24,853 $24,853
$10,158 $10,158
33 4 $25,596 $25,596
$13,748 $13,748
34 5 $26,362 $26,362
$17,446 $17,446
35 6 $27,150 $27,150
$21,254 $21,254
36 7 $27,962 $29,320
$25,176 $25,367
37 8 $28,798 $30,196
$29,216 $29,602
38 9 $29,660 $31,100
$33,376 $33,965
39 10 $30,547 $33,585
$37,661 $38,676
40 11 $31,461 $34,590
$42,074 $43,528
41 12 $32,402 $35,624
$46,619 $48,525
42 13 $33,371 $36,690
$51,300 $53,671
43 14 $34,369 $37,787
$56,121 $58,971
44 15 $35,397 $38,917
$61,086 $64,430
45 16 $36,456 $40,082
$66,200 $70,053
46 17 $37,546 $41,280
$71,466 $75,843
47 18 $38,669 $42,515
$76,890 $81,807
48 19 $39,825 $43,786
$82,477 $87,948
49 20 $41,017 $45,096
$88,230 $94,274
50 21 $42,243 $46,444
$94,156 $100,789
51 22 $43,507 $50,156
$100,258 $107,824
52 23 $44,808 $51,656
$106,543 $115,070
53 24 $46,148 $53,201
$113,017 $122,532
54 25 $47,529 $54,793
$119,684 $130,218
55 26 $48,950 $56,431
$126,550 $138,134
56 27 $50,414 $58,119
$133,621 $146,286
57 28 $51,922 $59,857
$140,904 $154,682
58 29 $53,475 $61,648
$148,405 $163,330
59 30 $55,075 $66,574
$156,131 $172,668

36
Exhibit D4 Pension Benefits for Stable (“A”) versus Mobile (“B”) Employee:
Hybrid Plan
Age
Year Working
Annual Salary Average Final
Salary Years of Service
Annual Pension Benefits
Increment
per year of service
DC Contributions
(cumulative)
A B A B A B A B A B A B
30 1 $23,430 $23,430
$1,264 $1,264
31 2 $24,131 $24,131
$2,566 $2,566
32 3 $24,853 $24,853
$3,907 $3,907
33 4 $25,596 $25,596
$5,288 $5,288
34 5 $26,362 $26,362
$6,710 $6,710
35 6 $27,150 $27,150
$8,175 $8,175
36 7 $27,962 $29,320
$27,611
7
$1,933
$276 $9,683 $9,756
37 8 $28,798 $30,196
$11,237 $11,385
38 9 $29,660 $31,100
$12,837 $13,063
39 10 $30,547 $33,585
$31,627
3 No benefit
(not vested) $14,485 $14,875
40 11 $31,461 $34,590
$16,182 $16,741
41 12 $32,402 $35,624
$17,930 $18,663
42 13 $33,371 $36,690
$19,731 $20,643
43 14 $34,369 $37,787
$21,585 $22,681
44 15 $35,397 $38,917
$23,495 $24,781
45 16 $36,456 $40,082
$25,461 $26,943
46 17 $37,546 $41,280
$27,487 $29,170
47 18 $38,669 $42,515
$29,573 $31,464
48 19 $39,825 $43,786
$31,722 $33,826
49 20 $41,017 $45,096
$33,935 $36,259
50 21 $42,243 $46,444
$36,214 $38,765
51 22 $43,507 $50,156
$47,232
12
$5,668
$472 $38,561 $41,471
52 23 $44,808 $51,656
$40,978 $44,258
53 24 $46,148 $53,201
$43,468 $47,128
54 25 $47,529 $54,793
$46,032 $50,084
55 26 $48,950 $56,431
$48,673 $53,128
56 27 $50,414 $58,119
$51,393 $56,264
57 28 $51,922 $59,857
$54,194 $59,493
58 29 $53,475 $61,648
$57,079 $62,819
59 30 $55,075 $66,574 $53,491 $62,693 30 8 $16,047 $5,015 $535 $627 $60,050 $66,411

37
Exhibit D5 Pension Benefits for Stable (“A”) versus Mobile (“B”) Employee:
Defined Benefit Plan with Portability Provisions Applied
Age Year
Working
Annual Salary Average Final
Salary Years of Service
Annual Pension Benefits
Increment
per year of service
DC Contributions
(cumulative)
A B A B A B A B A B A B
30 1 $23,430 $23,430
31 2 $24,131 $24,131
32 3 $24,853 $24,853
33 4 $25,596 $25,596
34 5 $26,362 $26,362
35 6 $27,150 $27,150
36 7 $27,962 $29,320 $27,611 7 $8,777 $1,254
37 8 $28,798 $30,196
38 9 $29,660 $31,100
39 10 $30,547 $33,585 $31,627 3 No benefit
(not vested)
40 11 $31,461 $34,590
41 12 $32,402 $35,624
42 13 $33,371 $36,690
43 14 $34,369 $37,787
44 15 $35,397 $38,917
45 16 $36,456 $40,082
46 17 $37,546 $41,280
47 18 $38,669 $42,515
48 19 $39,825 $43,786
49 20 $41,017 $45,096
50 21 $42,243 $46,444
51 22 $43,507 $50,156 $47,232 12 $15,046 $1,254
52 23 $44,808 $51,656
53 24 $46,148 $53,201
54 25 $47,529 $54,793
55 26 $48,950 $56,431
56 27 $50,414 $58,119
57 28 $51,922 $59,857
58 29 $53,475 $61,648
59 30 $55,075 $66,574 $53,491 $62,693 30 8 $32,094 $10,031 $1,070 $1,254

38
APPENDIX E: OVERTIME AND EXCESS COMPENSATION— ANALYSIS OF WASHINGTON DATA
Organization of this Appendix This appendix begins with a description of the data used in our analyses. We then show information about Washington State public retirees between 2009 and June 2012, including the number of retirees, which state pension plan they retired from, as well as their average AFC, retirement age, cash-outs, excess compensation, and overtime hours. We use two stylized examples to illustrate how overtime hours concentrated at the end of a career impact pensions differently than persistently high overtime. Finally, this appendix includes details about our multivariate regression test, using individual-level Washington State data, of the extent to which end-of-career increases in hours among recent Washington retirees are related to pension benefit incentives.
E1. Data Sources
E2. Washington State Retiree Information
E3. Stylized Examples
E4. Test for Hours Increases Related to Pension Rule Incentives
E1. DATA SOURCES Department of Retirement Systems Data The Washington State Department of Retirement Systems (DRS) provided data for all individuals retiring from one of the state plans during a three and a half year period: January 1, 2009 to June 30, 2012. The DRS data include information on 26,799 pension system members. Two types of DRS data are provided: retiree summary and earnings history. Retiree Summary Data. The retiree summary data include the following information about each retiree:
demographics (gender, date of birth, age at retirement)
employer
pension system and plan
retirement date
average final compensation (AFC)
cash-out portion of AFC
excess compensation portion of AFC Earnings History Data. The earnings history data include compensation and hours worked histories for about 20,500 retirees for up to ten years prior to retirement. These data are monthly and span the period from January 1999 to June 2012. Monthly compensation includes earnings, lump sum payments and cash-outs. The main limitation with these data is that overtime earnings are not reported separately. Job classification and title are also not reported.

39
Human Resource Management System (HRMS) Data The HRMS provides information on earnings components, including overtime. These data are available only since July of 2006. The Office of Financial Management (OFM) extracted HRMS data for the retirees in our analysis of DRS data (members who retired from January 2009 to June 2012). HMRS only includes data for state agency employees. Data Exclusions and Restrictions Since the month prior to retirement is often atypical, it is excluded in the analysis of earnings and hours trends. The analysis relies on hours as reported to the DRS. Members with no earnings during the 6 months prior to retirement are excluded from the analysis. The following hours exclusions were imposed in the analysis. Monthly observations were excluded if:
hours = 0
hours < 60 per month (less than 15 hours per week)
hours > 640 (excludes only 20 monthly observations) The analysis was limited to those members with sufficient AFC and pre-AFC monthly observations.
Plan 1 members with fewer than 18 observed AFC months were excluded.
Plan 2/3 members with fewer than 36 observed AFC months were excluded.
Members with fewer than 36 observed pre-AFC months were excluded.
LEOFF1 members with fewer than 10 observed AFC months were excluded (LEOFF1 AFC is determined by final salary)
The results are not overly sensitive to these restrictions. The regression analysis further restricted observations to normal retirements, excluding disability and other types. Normal retirement accounts for 94 percent of all retirements. Note that earnings typically decline in cases of disability.

40
E2. WASHINGTON STATE RETIREE INFORMATION
Exhibit E1 Retirees, Average Final Compensation and Age at Retirement by System and Plan
Retirements from January 2009 to June 2012
System & Plan Retirees Average AFC Average Retirement Age
LEOFF1 229 $8,543 61
LEOFF2 1,161 $7,388 56
PERS1 4,868 $5,108 62
PERS2 10,152 $4,467 64
PERS3 984 $4,829 63
SERS2 1,802 $2,476 65
SERS3 1,710 $2,564 64
TRS1 2,596 $5,993 62
TRS2 1,055 $5,148 64
TRS3 2,123 $5,473 63
WSPRS1 119 $7,725 53
Total 26,799 $4,771 63
Notes: Data did not include WSPRS2 retirees. There were very few retirees from JRS1 and PSERS2. Plans 1 are closed.
Exhibit E2
Cash-Out Compensation Included in AFC Retirements from January 2009 to June 2012
System & Plan
Retirees # with cash-
outs > 0 % receiving cash-outs
Avg where cash-outs >
0
Avg across all retirees
Total Payments
PERS1 4,868 2,691 55.3% $318 $176 $856,439
TRS1 2,596 465 17.9% $266 $48 $123,812
WSPRS1 119 88 73.9% $554 $410 $48,751
Notes: Cash-outs include leave balances. Leave cash-outs are excluded from plans 2/3. No cash-out compensation was reported for LEOFF.

41
Exhibit E3 Excess Compensation
Retirements from January 2009 to June 2011
System & Plan
Retirees # with
amount > 0
% having excess comp
Avg where excess comp
> 0
Avg across all retirees
PERS1 4,868 885 18.2% $324 $59
PERS2 10,152 7 0.1% $551 $0
PERS3 984 3 0.3% $133 $0
SERS2 1,802 2 0.1% $894 $1
TRS1 2,596 284 10.9% $28 $3
Total 20,402 1,181 5.8% $255 $15
Notes: Employers are charged the present value of the benefit stream generated by these amounts. No excess compensation was reported for LEOFF1, LEOFF2, SERS3, TRS2, TRS3, and WSPRS1. Many (88%) of the PERS1 retirees with excess compensation are employed by cities, counties and utility districts. The N is lower than in Exhibit E1 because LEOFF plans are excluded.
The degree to which earnings increase with tenure varies across systems and plans (Exhibits E4 and E6). Note that earnings vary dramatically by month for SERS and TRS members, so the chart uses 12-month moving averages (MA) for these members.
Exhibit E4 Average Earnings Profiles for Open Plans with Recent Retirees
(Earnings per month) Retirements from January 2009 to June 2012
$0
$1,000
$2,000
$3,000
$4,000
$5,000
$6,000
$7,000
$8,000
$9,000
11
911
410
910
499
94
89
84
79
74
69
64
59
54
49
44
39
34
29
24
19
14 9 4
Months to Retirement MA = moving average
LEOFF2
PERS2
TRS2 (MA)
SERS2 (MA)
SERS3 (MA)

42
Exhibit E5 Average Hours Profiles for Open Plans with Recent Retirees
(Hours per month) Retirements from January 2009 to June 2012
We do not observe systematic increases in average hours worked, as reported to DRS, in AFC periods (Exhibits E5 and E7). Increases in average earnings per hour largely drive the overall increases in earnings with tenure. However, the number of average hours worked varies across plans, and this variation contributes to differences in the overall level of earnings.
Exhibit E6 Average Monthly Earnings Before and During AFC Period
Retirements from January 2009 to June 2012
Plan/System N Avg. Earnings
Pre-AFC Avg. Earnings
AFC Avg.
Increase % Increase
LEOFF1 109 $6,811 $8,458 $1,647 24.2%
LEOFF2 731 $6,149 $7,633 $1,484 24.1%
PERS1 3577 $4,287 $5,088 $801 18.7%
PERS2 6182 $3,946 $4,672 $726 18.4%
PERS3 158 $4,201 $4,991 $789 18.8%
SERS2 1115 $2,345 $2,756 $411 17.5%
SERS3 251 $2,254 $2,616 $362 16.1%
TRS1 1968 $6,031 $7,142 $1,111 18.4%
TRS2 558 $5,631 $6,674 $1,043 18.5%
TRS3 258 $5,276 $6,282 $1,006 19.1%
WSPRS1 99 $6,190 $7,348 $1,158 18.7%
PERS2: FERRIES 52 $4,417 $5,156 $738 16.7% PERS1: CORRECTIONS 93 $4,017 $4,693 $676 16.8% PERS2: CORRECTIONS 324 $3,522 $4,157 $635 18.0% Note: Reference periods vary by plan. Plans 1: AFC periods include the 24 months prior to retirement (12 months prior for LEOFF1). Pre-AFC periods can include up to 96 months. Plans 2/3: Pre-AFC and AFC periods both include up to 60 months for the open plans.
100
120
140
160
180
200
220
240
1 7
13
19
25
31
37
43
49
55
61
67
73
79
85
91
97
10
3
10
9
11
5
Mo
nth
ly H
ou
rs W
ork
ed
Months to Retirement MA = moving average
LEOFF2Hours
PERS2Hours
TRS2Hours(MA)
SERS2Hours(MA)
SERS3Hours(MA)

43
Exhibit E7 Average Monthly Hours Before and During AFC Period
Retirements from January 2009 to June 2012
Plan/System N Avg. Hours
Pre-AFC Avg. Hours
AFC Difference
Std Dev AFC Avg.
LEOFF1 109 186.3 182.9 -3.40 21.8
LEOFF2 731 195.4 194.9 -0.50 26.1
PERS1 3,577 170.2 169.3 -0.90 18.8
PERS2 6,182 173.0 172.1 -0.90 17.8
PERS3 158 171.1 169.0 -2.10 20.1
SERS2 1,115 147.2 146.1 -1.10 28.0
SERS3 251 143.0 140.8 -2.20 26.9
TRS1 1,968 153.1 154.1 1.00 18.7
TRS2 558 143.6 141.3 -2.30 14.1
TRS3 258 141.0 139.1 -1.90 18.3
WSPRS1 99 180.3 177.2 -3.10 9.7
PERS2: FERRIES 52 178.5 179.5 1.00 13.6
PERS1: CORRECTIONS 93 179.0 176.3 -2.70 10.2
PERS2: CORRECTIONS 324 180.0 179.1 -0.90 16.7
Total 15,475 167.3 166.5 -0.79 19.2
Exhibits E8 and E9 provide additional detail for employer types within PERS 2.
Exhibit E8 PERS2: Average Monthly Earnings Before and During AFC Period
Employer Type
N Avg. Earnings Pre-
AFC Avg. Earnings
AFC Avg.
Increase % Increase
City 506 $4,272 $5,144 $873 20.4%
County 1,806 $4,056 $4,847 $785 19.4%
State 2,593 $3,864 $4,517 $653 16.9%
State Ed 906 $3,263 $3,847 $584 17.9%
Utility 218 $5,776 $6,997 $1221 21.1%
Exhibit E9 PERS2: Average Monthly Hours Before and During AFC Period
Employer Type
N Avg. Hrs Pre-
AFC Avg. Hours
AFC Std Dev AFC
Avg.
City 506 173.3 172.6 15.9
County 1,806 172.1 171.4 20.3
State 2,593 174.4 173.2 13.2
State Ed 906 168.8 167.4 20.8
Utility 218 181.9 182.1 15.9
Notes: City includes Cities and First Class Cities. County includes Counties and County Subdivisions. State includes non-education state agencies. State Ed includes state colleges and universities. Utilities include Public Utility Districts and WA Public Utility Districts

44
Although AFC hours are not substantially higher than in pre-AFC periods, some groups of employees do work consistently higher hours throughout their careers. Average hours worked is relatively high, for example, among LEOFF and WSP members, and these higher hours contribute to higher AFCs. Exhibit E10 summarizes the relationship between average monthly hours worked and average monthly AFC levels across systems and plans. Each point in the exhibit represents average values for a plan.
Exhibit E10 Average Monthly Hours by Average Monthly AFC
Plan Average Hours AFC
LEOFF1 183 $8,867
WSPRS1 177 $7,928
LEOFF2 195 $7,664
TRS1 154 $6,294
TRS2 141 $5,814
TRS3 139 $5,468
PERS1 169 $5,379
PERS3 169 $5,059
PERS2 172 $4,719
SERS2 146 $2,611
SERS3 141 $2,464
Overall average hours worked does not tend to increase during AFC periods. Some members, however, do work longer hours toward the end of their careers; and there are cases where the increases are substantial. Across all plans, roughly 23 percent of retirees had some gain in average AFC hours. Note that 31 percent, on the other hand, worked fewer hours (Exhibit E11). The distribution of gains varies across plans (Exhibit E12).
$0
$1,000
$2,000
$3,000
$4,000
$5,000
$6,000
$7,000
$8,000
$9,000
$10,000
120 140 160 180 200
Av
era
ge A
FC
Average hours per month
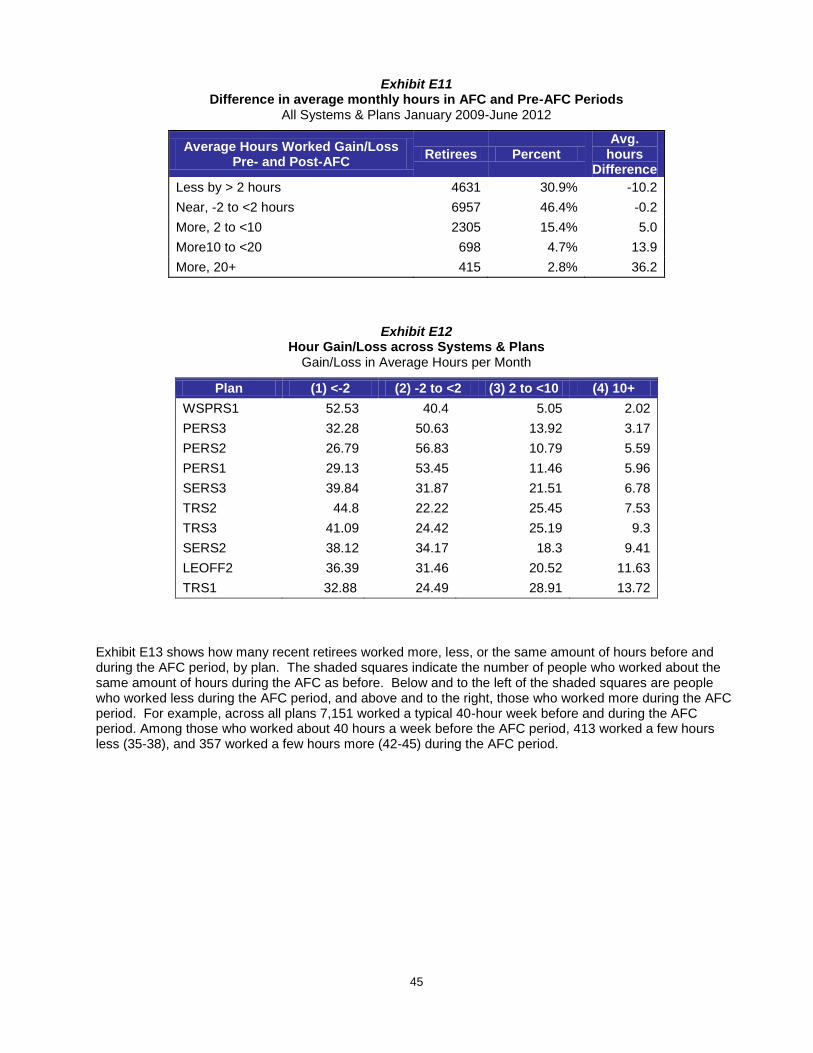
45
Exhibit E11 Difference in average monthly hours in AFC and Pre-AFC Periods
All Systems & Plans January 2009-June 2012
Average Hours Worked Gain/Loss Pre- and Post-AFC
Retirees Percent Avg.
hours Difference
Less by > 2 hours 4631 30.9% -10.2
Near, -2 to <2 hours 6957 46.4% -0.2
More, 2 to <10 2305 15.4% 5.0
More10 to <20 698 4.7% 13.9
More, 20+ 415 2.8% 36.2
Exhibit E12 Hour Gain/Loss across Systems & Plans
Gain/Loss in Average Hours per Month
Plan (1) <-2 (2) -2 to <2 (3) 2 to <10 (4) 10+
WSPRS1 52.53 40.4 5.05 2.02
PERS3 32.28 50.63 13.92 3.17
PERS2 26.79 56.83 10.79 5.59
PERS1 29.13 53.45 11.46 5.96
SERS3 39.84 31.87 21.51 6.78
TRS2 44.8 22.22 25.45 7.53
TRS3 41.09 24.42 25.19 9.3
SERS2 38.12 34.17 18.3 9.41
LEOFF2 36.39 31.46 20.52 11.63
TRS1 32.88 24.49 28.91 13.72
Exhibit E13 shows how many recent retirees worked more, less, or the same amount of hours before and during the AFC period, by plan. The shaded squares indicate the number of people who worked about the same amount of hours during the AFC as before. Below and to the left of the shaded squares are people who worked less during the AFC period, and above and to the right, those who worked more during the AFC period. For example, across all plans 7,151 worked a typical 40-hour week before and during the AFC period. Among those who worked about 40 hours a week before the AFC period, 413 worked a few hours less (35-38), and 357 worked a few hours more (42-45) during the AFC period.

46
Exhibit E13 Number of Retirees by Average Hours before and During the AFC Period
All Systems & Plans Average Monthly Hours: AFC Period
(1) <128 (2) 128-149 (3) 150-166 (4) 167-179 (5) 180-192 (6) 193-214 (7) 215+ Total
Average Hours: Pre-AFC (15-29/wk) (30-34/wk) (35-38/wk) (39-41/wk) (42-45/wk) (45-49/wk) (50+/wk)
(1) <128 (15-29/wk) 699 131 35 20 3 0 1 889
(2) 128-149 (30-34/wk) 240 1153 382 65 11 7 2 1860
(3) 150-166 (35-38/wk) 47 470 1189 369 32 5 9 2121
(4) 167-179 (39-41/wk) 29 107 413 7151 357 34 13 8104
(5) 180-192 (42-45/wk) 0 6 37 543 577 134 16 1313
(6) 193-214 (45-49/wk) 1 2 4 59 137 236 50 489
(7) 215+ (50+/wk) 0 0 0 14 15 36 165 230
Total 1016 1869 2060 8221 1132 452 256 15006
LEOFF2 Average Monthly Hours: AFC Period
(1) <128 (2) 128-149 (3) 150-166 (4) 167-179 (5) 180-192 (6) 193-214 (7) 215+ Total
Average Hours: Pre-AFC (15-29/wk) (30-34/wk) (35-38/wk) (39-41/wk) (42-45/wk) (45-49/wk) (50+/wk)
(1) <128 (15-29/wk) 0 0 0 0 0 0 0 0
(2) 128-149 (30-34/wk) 0 0 0 0 0 0 0 0
(3) 150-<167 (35-38/wk) 0 0 9 4 2 2 1 18
(4) 167-<180 (39-41/wk) 0 0 2 180 40 2 1 225
(5) 180-<193 (42-45/wk) 0 1 0 53 126 28 4 212
(6) 193-<215 (45-49/wk) 0 0 0 11 24 93 23 151
(7) 215+ (50+/wk) 0 0 0 4 3 14 104 125
Total 0 1 11 252 195 139 133 731
PERS1 Average Monthly Hours: AFC Period
(1) <128 (2) 128-149 (3) 150-166 (4) 167-179 (5) 180-192 (6) 193-214 (7) 215+ Total
Average Hours: Pre-AFC (15-29/wk) (30-34/wk) (35-38/wk) (39-41/wk) (42-45/wk) (45-49/wk) (50+/wk)
(1) <128 (15-29/wk) 125 22 8 8 1 0 0 164
(2) 128-149 (30-34/wk) 37 110 23 17 3 0 0 190
(3) 150-166 (35-38/wk) 9 35 161 95 7 0 2 309
(4) 167-179 (39-41/wk) 7 28 104 2275 81 6 3 2504
(5) 180-192 (42-45/wk) 0 1 6 127 117 36 4 291
(6) 193-214 (45-49/wk) 0 0 2 12 31 43 8 96
(7) 215+ (50+/wk) 0 0 0 3 2 7 11 23
Total 178 196 304 2537 242 92 28 3577
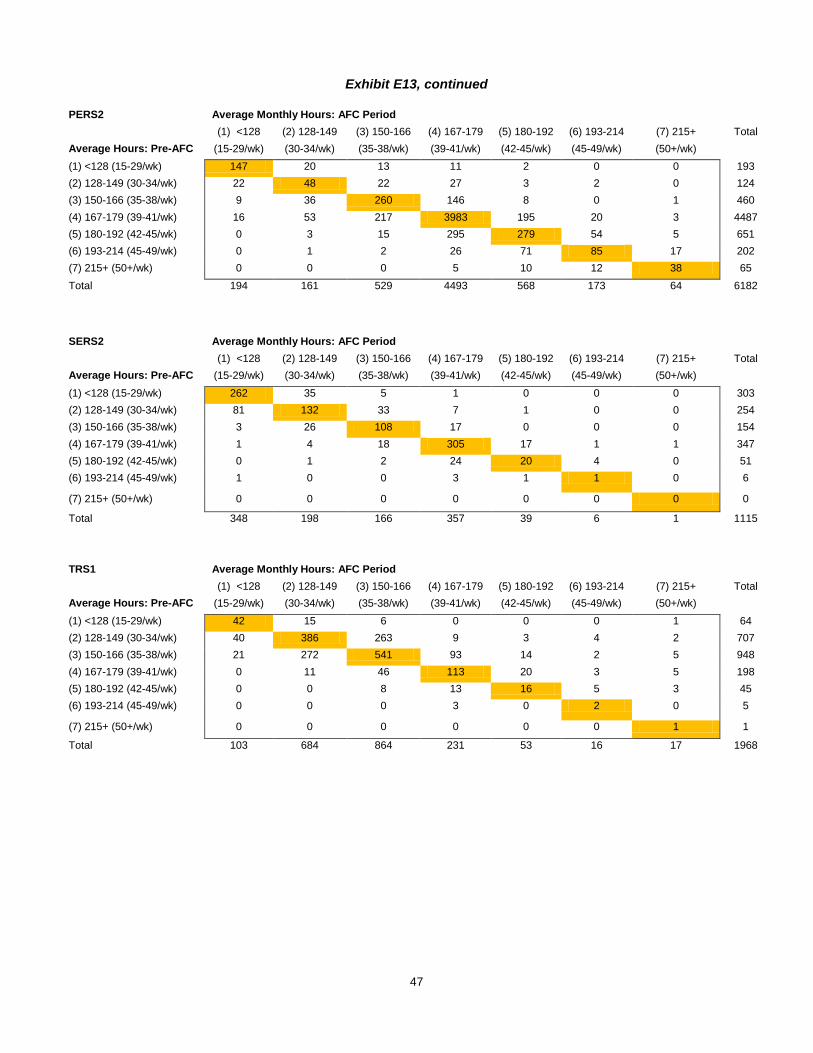
47
Exhibit E13, continued
PERS2 Average Monthly Hours: AFC Period
(1) <128 (2) 128-149 (3) 150-166 (4) 167-179 (5) 180-192 (6) 193-214 (7) 215+ Total
Average Hours: Pre-AFC (15-29/wk) (30-34/wk) (35-38/wk) (39-41/wk) (42-45/wk) (45-49/wk) (50+/wk)
(1) <128 (15-29/wk) 147 20 13 11 2 0 0 193
(2) 128-149 (30-34/wk) 22 48 22 27 3 2 0 124
(3) 150-166 (35-38/wk) 9 36 260 146 8 0 1 460
(4) 167-179 (39-41/wk) 16 53 217 3983 195 20 3 4487
(5) 180-192 (42-45/wk) 0 3 15 295 279 54 5 651
(6) 193-214 (45-49/wk) 0 1 2 26 71 85 17 202
(7) 215+ (50+/wk) 0 0 0 5 10 12 38 65
Total 194 161 529 4493 568 173 64 6182
SERS2 Average Monthly Hours: AFC Period
(1) <128 (2) 128-149 (3) 150-166 (4) 167-179 (5) 180-192 (6) 193-214 (7) 215+ Total
Average Hours: Pre-AFC (15-29/wk) (30-34/wk) (35-38/wk) (39-41/wk) (42-45/wk) (45-49/wk) (50+/wk)
(1) <128 (15-29/wk) 262 35 5 1 0 0 0 303
(2) 128-149 (30-34/wk) 81 132 33 7 1 0 0 254
(3) 150-166 (35-38/wk) 3 26 108 17 0 0 0 154
(4) 167-179 (39-41/wk) 1 4 18 305 17 1 1 347
(5) 180-192 (42-45/wk) 0 1 2 24 20 4 0 51
(6) 193-214 (45-49/wk) 1 0 0 3 1 1 0 6
(7) 215+ (50+/wk) 0 0 0 0 0 0 0 0
Total 348 198 166 357 39 6 1 1115
TRS1 Average Monthly Hours: AFC Period
(1) <128 (2) 128-149 (3) 150-166 (4) 167-179 (5) 180-192 (6) 193-214 (7) 215+ Total
Average Hours: Pre-AFC (15-29/wk) (30-34/wk) (35-38/wk) (39-41/wk) (42-45/wk) (45-49/wk) (50+/wk)
(1) <128 (15-29/wk) 42 15 6 0 0 0 1 64
(2) 128-149 (30-34/wk) 40 386 263 9 3 4 2 707
(3) 150-166 (35-38/wk) 21 272 541 93 14 2 5 948
(4) 167-179 (39-41/wk) 0 11 46 113 20 3 5 198
(5) 180-192 (42-45/wk) 0 0 8 13 16 5 3 45
(6) 193-214 (45-49/wk) 0 0 0 3 0 2 0 5
(7) 215+ (50+/wk) 0 0 0 0 0 0 1 1
Total 103 684 864 231 53 16 17 1968

48
Exhibit E13, continued
TRS2 Average Monthly Hours: AFC Period
(1) <128 (2) 128-149 (3) 150-166 (4) 167-179 (5) 180-192 (6) 193-214 (7) 215+ Total
Average Hours: Pre-AFC (15-29/wk) (30-34/wk) (35-38/wk) (39-41/wk) (42-45/wk) (45-49/wk) (50+/wk)
(1) <128 (15-29/wk) 29 20 1 0 0 0 0 50
(2) 128-149 (30-34/wk) 28 302 20 2 0 1 0 353
(3) 150-166 (35-38/wk) 1 68 54 5 0 0 0 128
(4) 167-179 (39-41/wk) 0 5 5 12 1 1 0 24
(5) 180-192 (42-45/wk) 0 0 1 0 0 0 0 1
(6) 193-214 (45-49/wk) 0 1 0 0 0 0 0 1
(7) 215+ (50+/wk) 0 0 0 1 0 0 0 1
Total 58 396 81 20 1 2 0 558
LEOFF2 Retiree Detail This section provides additional detail for LEOFF2 retirees. Exhibit E14 summarizes variation in hours across OSA categories (law enforcement and firefighter classifications).
Exhibit E14 LEOFF2 Retirees: Average Monthly Hours Before and During AFC Period
Retirements from January 2009 to June 2011
N
Avg Hrs Pre-AFC
Avg Hours AFC
Std Dev AFC Avg
All LEOFF2 731 195.4 194.9 26.1
OSA Category
Law Enforcement Officer 1st Class City 125 184.90 183.46 13.24
Law Enforcement Officer Other City 174 185.50 184.30 13.98
Sheriff or Deputy Sheriff 136 184.28 183.84 17.13
Fire Fighter 1st Class City 102 209.26 208.08 20.95
Fire Fighter Other City 171 213.15 214.38 34.39
Note: AFC period includes the 60 months prior to retirement. Other OSA categories (not reported here due to small n) include fire fighter other (Port Authority), university police officer, port police officer, fish and wildlife enforcement officer.
We typically do not observe increases in overall average hours, as reported to DRS, during the AFC period. Some members, however, do increase hours significantly (Exhibit E15, next page).

49
Exhibit E15 LEOFF2 Retirees: Pre-AFC to AFC Gain/Loss in Average Hours
Retirements from January 2009 to June 2011
Gain/Loss in Average Hours Per Month
(% of Retirees)
<-2 -2 to <2 2 to <10 10+ n
All LEOFF2 36.39 31.46 20.52 11.63 731
OSA Category
Law Enforcement Officer 1st Class City 40.8 37.6 16.8 4.8 125
Law Enforcement Officer Other City 35.6 36.8 23.6 4.0 174
Sheriff or Deputy Sheriff 33.8 33.1 23.5 9.6 136
Fire Fighter 1st Class City 29.4 32.4 27.5 10.8 102
Fire Fighter Other City 38.6 21.6 15.2 24.6 171
Note: Other OSA categories (not reported here due to small n) include fire fighter other (Port Authority), university police officer, port police officer, fish and wildlife enforcement officer.
E3. STYLIZED EXAMPLES OF THE IMPACT OF OVERTIME
Stylized Example (1) This example illustrates the fiscal implications of increased hours worked during the AFC period and the strong incentives to working more at the end of a career. It also demonstrates that the costs of the resulting extra pension benefits are not fully covered by worker or employer contributions.
Exhibit E16 Stylized Example Assumptions
Growth in nominal earnings 3%
Regular hours per year 2080
Worker 1 overtime 0 hours
Worker 2 overtime 0 hours for years 1 - 25, 250 hours per year during last 5 years (roughly 5 hours OT per week)
AFC Period 5 years
Years of service 30
Years of retirement 19 (life expectancy of 84, age of retirement 65)
Pension benefit 30*0.02*AFC
Contribution rates
Member 4.6%
Employer 7.0%
Growth rate for value of contributions 7.9%
Discount rate
Member perspective 1% = 1.04/1.03
Employer perspective 4.76% =1.079/1.03
COLA 3%

50
Exhibit E17
Illustration of Late-career Salary Increases: Stylized Example (1)
Exhibit E18 Summary of Impact of Stylized Example (1)
Worker 2 contributes an extra $2,500 to the system and gets an extra $97,000 in expected pension benefits. The worker and employer contributions combined cover only a small portion of the gain in benefits.
$0
$10,000
$20,000
$30,000
$40,000
$50,000
$60,000
$70,000
1 3 5 7 9 11 13 15 17 19 21 23 25 27 29
An
nu
al
sala
ry
Year in career
worker 1
worker 2
Worker 1 Worker 2
AFC $51,967 $61,337
Annual Pension Benefit $31,180 $36,802
PDV of Pension Benefits $537,116 $633,951
Value of worker contributions at retirement $161,721 $164,234
Value of employer contributions $246,098 $249,921
Total contribution value at retirement $407,819 $414,154
Extra contribution by Worker 2
$2,512
Extra contribution by Employer 2
$3,823
Total extra contributions
$6,335
PDV of extra pension benefit (gain)
$96,836

51
Stylized Example (2) This example demonstrates that a constant level of overtime increases pension benefit, but in this case the cost of the extra benefit is largely borne by worker and employer contributions. All parameters are the same as in Example (1), except that Worker 2 works 250 overtime hours throughout their career.
Exhibit E19
Illustration of Career-long Salary Growth: Stylized Example (2)
Exhibit E20 Summary of Impact of Stylized Example (2)
Worker 1 Worker 2
AFC $51,967 $61,337
Annual Pension Benefit $31,180 $36,802
PDV of Pension Benefits $537,116 $633,951
Value of worker contributions at retirement $161,721 $190,878
Value of employer contributions $246,098 $290,467
Total contribution value at retirement $407,819 $481,345
Extra contribution by Worker 2
$29,157
Extra contribution by Employer 2
$44,369
Total extra contributions
$73,525
PDV of extra pension benefit (gain)
$96,836
In this case, Worker 2 still receives an additional $97,000 in NPV of pension benefit. The worker and employer, in this example, pay for much of the cost of the benefit increase.
$0
$10,000
$20,000
$30,000
$40,000
$50,000
$60,000
$70,000
1 3 5 7 9 11 13 15 17 19 21 23 25 27 29
An
nu
al
sala
ry
Year in career
worker 1
worker 2

52
E4. TEST FOR HOURS INCREASES RELATED TO PENSION RULE INCENTIVES: PERS 1, 2, AND 3 Among recent retirees in Washington’s state pension systems, monthly hours tend to be stable throughout a worker’s tenure, although there is a tendency for them to decline closer to retirement. In all of Washington’s state-administered public pension systems, average monthly hours are not systematically higher during AFC periods. As demonstrated earlier, some employees—23%—do work longer hours during AFC periods; three percent work more than 20 additional hours per month, in comparison with the pre-AFC period. Most (77%) work less or the same amount. We do observe substantial AFC-period hour gains among some workers. But, it is not clear whether these gains are due to increased job responsibilities verses behavior intended to increase pensions. The following regression analysis attempts to gauge the extent to which pension plan rules—the time period included in AFC calculations—affect hours worked. We exploit the 'natural experiment' that arises from differences in AFC periods across PERS1 (2 years) and PERS2/3 (5 years) plans. PERS1 members have an incentive to increase hours worked during the last 24 months prior to retirement. PERS2 members have an incentive to increase hours during the last 60 months prior to retirement. Importantly, from 60 to 24 months prior to retirement, the incentives operate only on PERS2/3 members. The regression analyses presented below estimate the extent to which hours deviate from trend during the 60 to 24 month period prior to retirement for PERS1 versus PERS2/3 members. We would expect hours gains to be higher during this period for PERS 2/3 members. Higher gains would indicate that members were responding to pension benefit incentives. Fixed effects models were estimated. These models derive estimates by examining changes in hours over time for individual members. The method effectively controls for observed and unobserved member characteristics that do not change over time. Models with different functional forms were examined. We first estimated a set of fixed effect regression models for all PERS retirees. We then estimated the same models focusing on employer groups within PERS where there appears to be more opportunity for overtime. Regressions for All PERS Members Observations include PERS1, 2 and 3 members retiring between January 2009 and June 2012. The dependent variable is monthly hours worked. Independent variables include: Time (month 1 to 120) Time squared D60p1 (dummy variable = 1 in months 60 to 24 prior to retirement for PERS1 retirees, 0 otherwise) D60p23 (dummy variable = 1 in months 60 to 24 prior to retirement for PERS2/3 retirees, 0 otherwise) The difference in the estimated coefficients for D60p23 and D60p1 provide a measure of how hours respond to pension incentives. Five models with different functional forms are estimated.
Model 1: Includes only the test period dummies (D60pi, D60p23).
Model 2: Adds a simple time trend (Time).
Model 3: Adds a nonlinear time trend (Time and Time squared).
Model 4: Allows the time trend coefficients to differ for PERS1 versus PERS2/3 members.
Model 5: Allows all estimated coefficients to vary for PERS1 versus PERS2/3 members (by estimating separate regressions for the plans).

53
Exhibit E21 Regression Models for All PERS Members
Model 1
Model 2
Model 3
Model 4
N 1,084,566
1,084,566
1,084,566
1,084,566
R-Square 0.528
0.529
0.529
0.530
Independent Variables
Parameter Estimate t Value Estimate t Value Estimate t Value Estimate t Value
Time
-0.021 -42.680 0.035 16.110 0.047 17.030
TimeSquared
0.000 -26.240 -0.001 -27.460
D60p1 0.615 11.190 1.139 20.250 0.614 10.280 0.629 9.380
D60p23 0.818 19.380 1.360 30.860 0.833 17.210 0.827 16.000
Time*PERS1
-0.031 -6.840
TimeSquared*PERS1
0.000 10.780
Estimated Incentive Effect
0.20
0.22
0.22
0.20
Model 5 (Separate PERS1 - PERS2/3 regressions)
N 402,514
682,052 R-Square 0.535
0.525
PERS1 Only PERS2/3 Only
Parameter Estimate t Value Estimate t Value
Time 0.016 4.380 0.047 17.110
Time Squared 0.000 -7.410 -0.001 -27.600
D60p1 0.629 9.300 D60p23
0.827 16.080
Estimated Incentive Effect 0.20
Implications for PERS2/3 Costs The difference in the estimated coefficients for D60p23 and D60p1 suggest that PERS2/3 retirees, as a whole, increased monthly hours marginally in response to pension incentives—an average increase of 0.21 hours per month. What does this modest increase in hours imply for PERS 2/3 pension costs? By assuming a wage rate of $28 per hour, the annual AFC increases by about $70 and lifetime pension benefits increase by about $520.
Impact on monthly AFC (@ $28 per hour) $5.88
Impact on annual AFC $70.56
Impact on Annual Pension Benefit $42.34
NPV of Pension Benefit Stream $522
Assumptions: 30 years of service, discount rate of 4.76%, 19 years of retirement
We would expect the incentive effect to be greater among employers where overtime is more prevalent. We did not, however, find this to be the case; calling into question the robustness of our test.

54
Employer Group Analysis We identified employer groups where there appears to be more opportunity for overtime by examining 3 factors:
(1) 'Normal' hours (2) Average hours per month (3) Variation in hours per month
Normal Hours. First, we examined the frequency distribution of monthly hours among PERS members. Most members work between 160 and 184 hours per month; 69% of monthly hours fall in this range, which corresponds to 37 - 42 hours per week. We looked for employers where larger shares of employees worked hours outside of the normal range. Average Hours. Second, we examined the average hours per month across employers, looking for those with relatively high average monthly hours. Variation in Hours. Third, we looked for employers with wide variation in hours worked among their employees. Through these criteria, we identified the following employer groups within PERS where there appears to be greater opportunity for overtime. We estimated the regression models for these groups.
Non-state agencies
o Public Utility Districts (PUDs)
o Ports
State agencies
o Department of Corrections
o Department of Transportation (includes ferries)
o Department of Agriculture
o Eastern State Hospital

55
Regression for Public Utility Districts and Ports Retirees The average estimated impact incentive effect is 0.63 hours per month across PUD and Ports workers. Estimates in this case, however, are sensitive to functional form.
Exhibit E22 Regression Models for PUD and Ports in PERS
Model 1
Model 2
Model 3
Model 4
N 58,011
58,011
58,011
58,011
R-Square 0.405
0.405
0.406
0.406
Independent Variables
Parameter Estimate t Value Estimate t Value Estimate t Value Estimate t Value Time -0.010 -3.580 0.102 7.980 0.136 8.900 TimeSquared
-0.001 -9.000 -0.001 -9.920
D60p1 1.037 2.850 1.303 3.510 0.240 0.620 0.936 2.100 D60p23 2.061 8.720 2.330 9.400 1.264 4.600 0.971 3.360 Time*PERS1 -0.113 -4.050 TimeSquared*PERS1
0.001 4.340
Estimated Incentive Effect
1.02
1.03
1.02
0.04
Model 5 (separate PERS1 - PERS2/3 regressions)
N 17,166
40,845 R-Square 0.341
0.424
PERS1 Only PERS2/3Only
Parameter Estimate t Value Estimate t Value
Time 0.022 1.050 0.136 8.560
TimeSquared -0.0002 -1.400 -0.001 -9.530
D60p1 0.936 2.340 D60p23
0.971 3.230
Estimated Incentive Effect 0.04

56
Regression for Selected State Agencies: Corrections, Transportation, Agriculture, and Eastern State
Hospital
These agencies were selected because their employees appear to have more opportunity to engage in overtime. We expect hour gains to be greater for these retirees. In fact, the regression estimates suggest that PERS2/3 retirees from these agencies had relatively large hour gains during the 60 to 24 months prior to retirement. However, similar gains were also observed for the PERS1 retirees among these employers. The regressions, therefore, did not provide strong evidence of a response to pension incentives.
Exhibit E23 Regression Models for Selected State Agencies
Model 1
Model 2
Model 3
Model 4
N 108,217
108,217
108,217
108,217
R-Square 0.401
0.402
0.402
0.403
Independent Variables
Parameter Estimate t Value Estimate t Value Estimate t Value Estimate t Value Time -0.021 -12.980 0.054 7.500 0.073 8.420 TimeSquared
-0.001 -10.690 -0.001 -11.770
D60p1 1.246 6.420 1.771 8.940 1.074 5.150 1.262 5.330 D60p23 1.283 9.560 1.831 13.020 1.129 7.280 1.044 6.370 Time*PERS1 -0.060 -3.880 TimeSquared*PERS1
0.001 5.170
Estimated Incentive Effect
0.04
0.06
0.05
-0.22
Model 5 (separate PERS1- PERS2/3 regressions)
N
34,975
73,242
R-Square 0.338
0.428
PERS1 Only PERS2/3 Only
Parameter Estimate t Value Estimate t Value
Time 0.014 1.090 0.073 8.350
TimeSquared -0.0002 -1.870 -0.001 -11.680
D60p1 1.262 5.420
D60p23
1.044 6.320
Estimated Incentive
Effect -0.22
For further information, contact:
Annie Pennucci at (360) 586-3952, [email protected], John Bauer at (360) 586-2883, [email protected], or Stephanie Lee at (360) 586-3951, [email protected] Document No. 12-12-4101a
Washington State Institute for Public Policy
The Washington State Legislature created the Washington State Institute for Public Policy in 1983. A Board of Directors—representing the legislature, the governor, and public universities—governs the Institute and guides the development of all activities. The Institute’s mission is to carry out practical research, at legislative direction, on issues of importance to Washington State.