retirees and retirement amid covid-19...• the analysis contained in this report was prepared...
TRANSCRIPT

© 2020 Transamerica Institute®
Retirees and Retirement Amid COVID-1920th Annual Transamerica Retirement Survey of Retirees
September 2020

Introduction
About the Authors Page 3
About Transamerica Center for Retirement Studies® Page 4
About the Survey Page 5
Methodology: 20th Annual Transamerica Retirement Survey of Retirees Page 6
Methodology: June 2020 Supplemental Survey Page 7
Acknowledgements Page 8
Retirees and Retirement Amid COVID-19
Key Highlights Page 10
Recommendations for Retirees Page 22
Recommendations for Policymakers Page 23
Detailed Findings
– How Retirees Are Faring Amid the Pandemic Page 25
– Before the Pandemic: Retirees’ Financial Vulnerabilities Page 37
– Life and Living Arrangements in Retirement Page 56
– When and How Retirement Happened Page 67
– Looking Back on Financial Preparations for Retirement Page 75
Appendix: A Demographic Portrait of Retirees Page 83
Table of Contents
2

Catherine Collinson serves as CEO and president of Transamerica Institute®, a nonprofit private foundation which includes
Transamerica Center for Retirement Studies®. She is a champion for Americans who are at risk of not achieving a financially
secure retirement. Catherine oversees all research, publications, and outreach initiatives, including the Annual Transamerica
Retirement Survey. In 2015, Catherine was also named executive director of the Aegon Center for Longevity and Retirement.
With two decades of retirement services experience, Catherine has become a nationally recognized voice on retirement trends for
the industry. She has testified before Congress on matters related to employer-sponsored retirement plans among small
business, which featured the need to raise awareness of the Saver’s Credit among those who would benefit most from the
important tax credit.
In 2018, Catherine was named an Influencer in Aging by PBS’ Next Avenue. In 2016, she was honored with a Hero Award from the
Women’s Institute for a Secure Retirement (WISER) for her tireless efforts in helping improve retirement security among women.
Catherine serves on the Advisory Board of the Milken Institute’s Center for the Future of Aging. She co-hosts the ClearPath: Your
Roadmap to Health & Wealth radio show on Baltimore’s WYPR, an NPR news station.
Catherine is employed by Transamerica Corporation. Since joining the organization in 1995, she has held a number of positions
with responsibilities including the incorporation of Transamerica Center for Retirement Studies as a nonprofit private foundation
in 2007 and its expansion into Transamerica Institute in 2013, as well as the creation of the Aegon Center for Longevity and
Retirement in 2015.
Patti Rowey serves as vice president of Transamerica Institute. She is retirement and market trends expert and helps manage
and execute all research initiatives, including the Annual Transamerica Retirement Survey. Patti has more than 20 years of
retirement services experience, specializing in market research covering a broad range of stakeholders, including retirement plan
participants and sponsors, financial advisors, and retirees. She is employed by Transamerica Corporation.
Heidi Cho is a senior research content analyst for Transamerica Institute. She began her career as an intern at Transamerica
Center for Retirement Studies in 2012. She joined the organization full time in 2014 upon graduating from the University of
Southern California. She is employed by Transamerica Corporation.
About the Authors
3

• Transamerica Center for Retirement Studies® (TCRS) is a division of Transamerica Institute® (The Institute),
a nonprofit, private foundation. TCRS is dedicated to educating the public on emerging trends surrounding
retirement security in the United States. Its research emphasizes employer-sponsored retirement plans,
including companies and their employees, retirees, and the implications of legislative and regulatory
changes. For more information about TCRS, please visit to www.transamericacenter.org.
• The Institute is funded by contributions from Transamerica Life Insurance Company and its affiliates, and
may receive funds from unaffiliated third parties.
• TCRS and its representatives cannot give ERISA, tax, investment, or legal advice. This material is provided
for informational purposes only and should not be construed as ERISA, tax, investment, or legal advice.
Interested parties must consult and rely solely upon their own independent advisors regarding their
particular situation and the concepts presented here.
• Although care has been taken in preparing this material and presenting it accurately, TCRS disclaims any
express or implied warranty as to the accuracy of any material contained herein and any liability with
respect to it.
About Transamerica Center for Retirement Studies®
4
• Since 1998, Transamerica Center for Retirement Studies® (TCRS) has conducted a national survey of U.S.
business employers and workers regarding their attitudes toward retirement. The overall goals for the study
are to illuminate emerging trends, promote awareness, and help educate the public. It has grown to be one
of the longest running and largest national surveys of its kind. This survey is the third time TCRS has
conducted research among retirees; the first time was in 2015.
• The Harris Poll was commissioned to conduct the Transamerica Retirement Survey of Retirees for TCRS.
TCRS is not affiliated with The Harris Poll.
• The Harris Poll has been tracking public opinion, motivations and social sentiments in the U.S. since 1963.
It is now part of Harris Insights & Analytics, a global consulting and market research firm that delivers social
intelligence for transformational times. Its mission is to provide insights and advisory to help leaders make
the best decisions possible. To learn more, please visit www.theharrispoll.com.
About the Survey
5

• The analysis contained in this report was prepared internally by the research team at Transamerica Center
for Retirement Studies® (TCRS).
• A 27-minute, online survey was conducted between November 13 - December 4, 2019 among a nationally
representative sample of 2,040 retirees. Retirees met the following criteria:
– U.S. residents, age 50 or older
– Consider themselves to be fully (N=1,841) or semi-retired (N=199)
– Worked for a for-profit company employing one or more people for the majority of their career
• Data were weighted as follows:
– Census data were referenced for education, age by gender, race/ethnicity, region, and household
income. Results were weighted where necessary to bring them into line with the population of U.S.
residents age 50+ who are retired or semi-retired.
– The weighting also adjusts for attitudinal and behavioral differences between those who are online
versus those who are not, those who join online panels versus those who do not, and those who
respond to surveys versus those who do not.
• Percentages are rounded to the nearest whole percent. Percentages revised to total to 100% in charts
when necessary.
Methodology: 20th Annual Transamerica Retirement Survey of Retirees
6

Methodology: June 2020 Supplemental Survey
• A supplemental online survey was conducted between June 18 - 22, 2020 by The Harris Poll on behalf
of TCRS among a nationally representative sample of 2,001 U.S. adults.
• The data in the report are shown for a subsample of 411 adults who self-identify as being retired and
age 50+.
• Data were weighted as follows:
- Census data were referenced for education, age by gender, race/ethnicity, region, household
income, education, employment, marital status, and size of household where necessary to align
them with their actual proportions in the population of U.S. residents age 50+ who are retired.
- The weighting also adjusts for attitudinal and behavioral differences between those who are online
versus those who are not, those who join online panels versus those who do not, and those who
respond to surveys versus those who do not.
• Percentages are rounded to the nearest whole percent. Percentages revised to total to 100% in charts
when necessary.
7

Acknowledgements
8
Kelly Allsup
Kent Callahan
Sean Cassidy
Heidi Cho
Wonjoon Cho
Catherine Collinson
Andrew Cook
Phil Eckman
Steve Eichmann
Kristin Elia
Lard Friese
Sheri Gebe
Michelle Gosney
David Schulz
Laura Scully
Frank Sottosanti
Ashlee Vogt
Patti Vogt Rowey
Mihaela Vincze
Holly Waters
Steven Weinberg
Christopher Wells
Hank Williams
David Hopewell
Elizabeth Jackson
David Krane
Emily Lauder
Bryan Mayaen
Liz Miklya
Jaclyn Mora
Mark Mullin
Jay Orlandi
Kerry Paredes
Maurice Perkins
Jamie Poston
Julie Quinlan

Retirees and Retirement Amid COVID-19
9

Retirees are vulnerable. Many live on fixed incomes,
experience declines in health, lack resources to afford
long-term care, and fear they may outlive their
savings. The coronavirus pandemic has only
exacerbated risks to their health and their financial
well-being.
Retirees and Retirement Amid COVID-19 is based on
findings from the 20th Annual Transamerica
Retirement Survey, one of the largest and longest
running surveys of its kind, which comprises a survey
conducted in late 2019 and comparisons from a
supplemental survey in June 2020. The June survey
was conducted as states were beginning to reopen
after widespread stay-at-home orders and large
segments of the U.S. economy had temporarily closed
in March through May due to the pandemic. The
report examines retirees’ finances, their lives and
living arrangements, what prompted them to retire,
and their preparations during their working years. It
identifies issues and opportunities, and offers
actionable insights for current and future retirees.
Key Highlights
10

How Retirees Are Faring Amid the Pandemic
Amid the pandemic, most retirees indicate their retirement confidence has stayed the same, although it should be noted that
relatively few were “very confident” before the pandemic. Looking more closely at their financial situations, there are indicators
that many may be unable to withstand or recover from a major financial setback. Some are indeed at risk of running out of
savings.
• Retirement Confidence Largely Unchanged Amid Pandemic. Three in four retirees (75 percent) say their confidence in their
ability to maintain a comfortable lifestyle throughout retirement in light of the pandemic has stayed the same. Fifteen percent
of retirees say their confidence has declined in light of the pandemic, four percent say their confidence has improved, and six
percent don’t know.
• Three in Four Retirees Are Confident About Retirement. Amid the pandemic, 76 percent of retirees are confident that they will
be able to maintain a comfortable lifestyle throughout retirement, with 29 percent being “very confident” and 47 percent being
“somewhat confident.” Eighteen percent are “not too confident,” while six percent of retirees are “not at all confident” that
they will be able to maintain a comfortable lifestyle throughout retirement.
• Retirees Would Rely on Savings if Finances Are Impacted by COVID-19. When asked what sources of funds they have used or
would use if their finances have been or would be negatively impacted by the pandemic, retirees’ most frequently cited source
is savings (56 percent). Other sources include: credit cards (18 percent), withdrawal from a retirement account such as a
401k, 403(b), or IRA (18 percent), and CARES Act stimulus money (18 percent). Retirees are less likely to cite reliance on a
significant other’s or spouse’s income (9 percent), loans from family and friends (5 percent), home equity loans from a bank (4
percent) and unemployment benefits (3 percent).
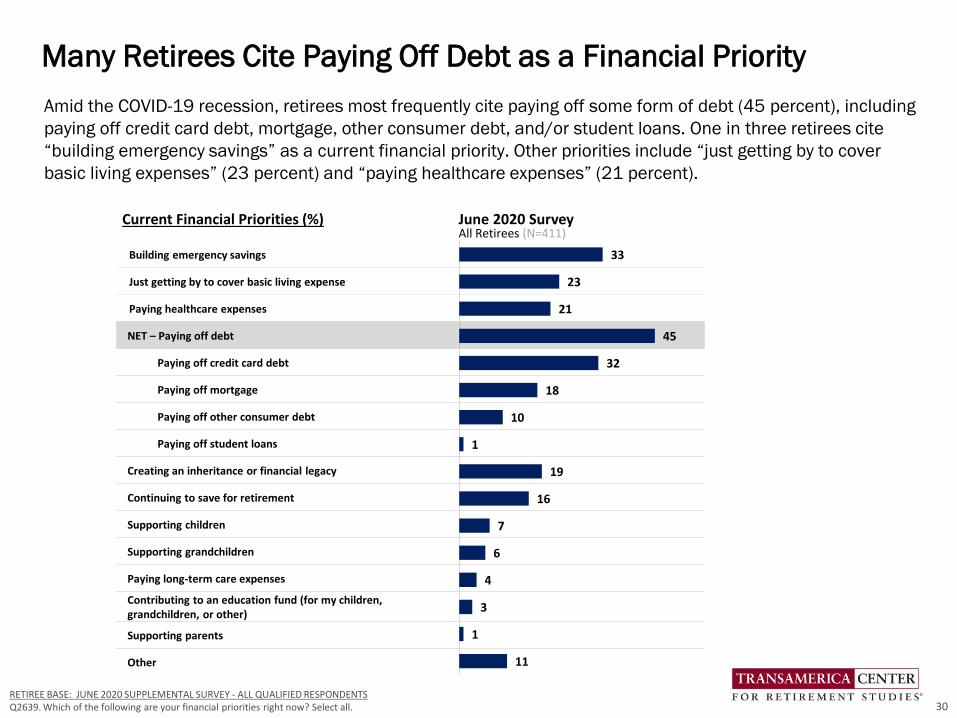
• Many Retirees Cite Paying Off Debt as a Financial Priority. Amid the COVID-19 recession, retirees most frequently cite paying off
some form of debt (45 percent), including paying off credit card debt, mortgage, other consumer debt, and/or student loans.
One in three retirees cite “building emergency savings” as a current financial priority. Other priorities include “just getting by to
cover basic living expenses” (23 percent) and “paying healthcare expenses” (21 percent).
• Few Retirees Have a Written Retirement Strategy. Fifty-eight percent of retirees amid the pandemic have a current financial
strategy for retirement – but only 18 percent have it in writing, while 40 percent have a plan that is not written. Many retirees
amid the pandemic (42 percent) do not have a financial strategy for retirement.
Key Highlights
11
How Retirees Are Faring Amid the Pandemic (cont.)
• Almost Half Never Discuss Their Financial Situation With Others. Amid the pandemic, only nine percent of retirees frequently
discuss retirement savings with their family and friends. Forty-five percent occasionally do so, while 46 percent never do so.
• Plans for Receiving Long-Term Care. When asked what their plans are for receiving long-term care should their health decline
and they need help with daily activities and/or nursing care, retirees most often cite a reliance on family and friends (41
percent). Fewer retirees plan to move into an assisted living community and/or nursing home (19 percent). An alarming one
in five retirees haven’t thought about their plans for receiving long-term care (19 percent) or don’t have any plans for such
care (21 percent).
• Retirees Should Consider Legal Documentation. When asked about the types of legal documents they have set forth in
writing, a last will and testament is the most often cited during the pandemic (53 percent), followed by power of attorney for
healthcare or medical proxy (32 percent), and advance directive or living will (30 percent). Amid the pandemic, 30 percent
have none of these documents in place.
• Most Retirees Have a Positive Outlook on Life. Retirees are far more likely to cite positive attitudes and experiences than
negative. Amid the pandemic, most retirees agree that they are generally happy (91 percent), have a close relationship with
their families and/or friends (91 percent), and are confident in their ability to manage their finances (90 percent). In contrast,
relatively few retirees cite negative attitudes and such as feeling anxious and depressed (24 percent), having trouble making
ends meet (21 percent), and feeling isolated and lonely (20 percent).
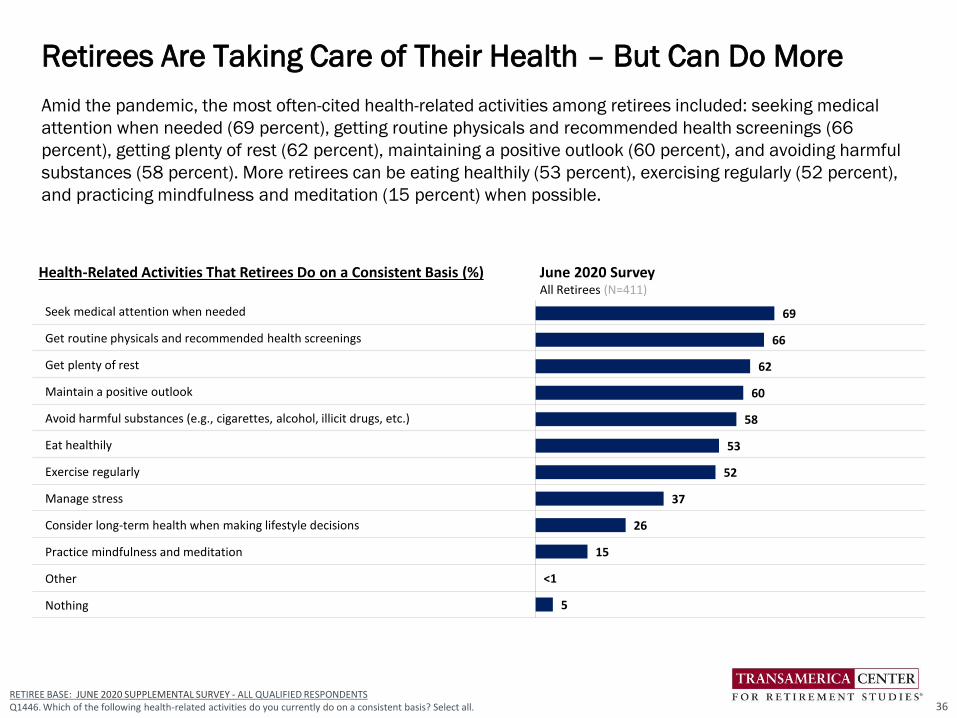
• Retirees Are Taking Care of Their Health – But Can Do More. Amid the pandemic, the most often-cited health-related
activities among retirees included: seeking medical attention when needed (69 percent), getting routine physicals and
recommended health screenings (66 percent), getting plenty of rest (62 percent), maintaining a positive outlook (60 percent),
and avoiding harmful substances (58 percent). More retirees can be eating healthily (53 percent), exercising regularly (52
percent), and practicing mindfulness and meditation (15 percent) when possible.
Key Highlights
12

Before the Pandemic: Retirees’ Financial Vulnerabilities
• Few “Strongly Agree” They Have Built a Large Enough Nest Egg. Before the pandemic, fewer than half of retirees (47 percent)
agree that they have built a large enough retirement nest egg, of whom only 15 percent “strongly agree” and 32 percent
“somewhat agree.” Seventeen percent “somewhat disagree” and 30 percent “strongly disagree.” Six percent of retirees are
“not sure.”
• Retirees Cite Diverse Sources of Income. Nearly all retirees (95 percent) expect Social Security to be a source of income over
the course of their retirement. The other most frequently cited sources of retirement income include other savings and
investments (40 percent), 401(k)/403(b)/IRAs (35 percent), and company-funded pension plans (30 percent). Relatively few
retirees cite home equity (9 percent), inheritance (6 percent), or paid work (3 percent) as sources of income.
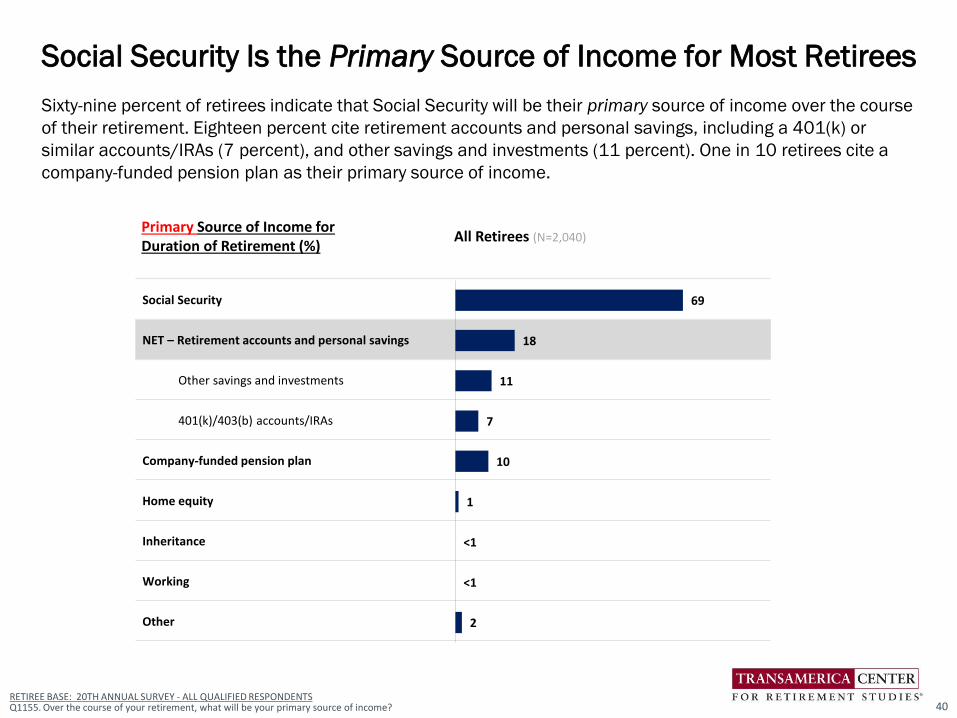
• Social Security Is the Primary Source of Income for Most Retirees. Sixty-nine percent of retirees indicate that Social Security
will be their primary source of income over the course of their retirement. Eighteen percent cite retirement accounts and
personal savings, including a 401(k) or similar accounts/IRAs (7 percent), and other savings and investments (11 percent).
One in 10 retirees cite a company-funded pension plan as their primary source of income.
• Nine in 10 Retirees Are Currently Receiving Social Security. The vast majority of retirees (91 percent) are currently receiving
income from Social Security benefits. Among them, the median age they started receiving benefits was 62 – the earliest age
that most workers can claim Social Security, albeit at a permanently reduced amount of benefit. Depending on their year of
birth, the age at which workers are eligible to receive “full” benefits is between 65 and 67. The survey finds 32 percent of
retirees started receiving benefits between age 65 and 69. Only three percent started receiving benefits at age 70 or older,
with age 70 being when people are eligible to receive maximum monthly benefits.
• Retirees Have a Variety of Savings and Investments. Retirees currently have a wide variety of savings and investments,
including checking accounts (77 percent), savings accounts (62 percent), and equity in their primary residence (47 percent).
Retirees are less likely to have retirement accounts such as IRAs (35 percent), annuities (18 percent), and/or 401(k),
403(b), or similar plans (18 percent). Twelve percent have no savings and investments.
• Many Retirees Have Limited Household Savings. Given the number of years they will be spending in retirement, retirees have
limited household savings. Retirees have $45,000 (estimated median) in household savings (excluding home equity).
Twenty-one percent have savings of less than $50,000, while 16 percent do not have any savings. Thirty-three percent of
retirees have savings of $100,000 or more. Retirees have $78,000 (estimated median) in home equity. Thirty-nine percent
have home equity of $100,000 or more. Twenty-four percent do not have any home equity.
Key Highlights
13

Before the Pandemic: Retirees’ Financial Vulnerabilities (cont.)
• Many Retirees Have Limited Household Income. Prior to the pandemic, retirees reported an annual household income of
$29,000 (estimated median). Twenty-seven percent reported having an income of less than $25,000.
• Retirees’ Household Debt. Many retirees are still paying off household debt. Forty-six percent have non-mortgage debt (e.g.,
credit card debt, car loans, student loans, medical debt, etc.), including 32 percent who have between $1 and $10,000 and
14 percent with $10,000 or more. Among those who have non-mortgage debt, the estimated median is $3,000. Twenty-
three percent of retirees have mortgage debt (including any equity loans or lines of credit), including 17 percent who have
between $1 and $100,000 and six percent with $100,000 or more. Among those with mortgage debt, the estimated
median is $42,000.
• Many May Be Overlooking Important Factors in Their Strategies. Among retirees who have a financial strategy for
retirement, 82 percent have factored in Social Security and Medicare benefits and 67 percent have factored in basic living
expenses. Fewer than half have considered other factors, such as total retirement savings and income needs (48 percent)
and a plan to help ensure their saving last their lifetimes (44 percent).
• Approximately One in Three Use a Professional Financial Advisor. Only 31 percent of retirees use a professional financial
advisor to help manage their retirement savings/investments.
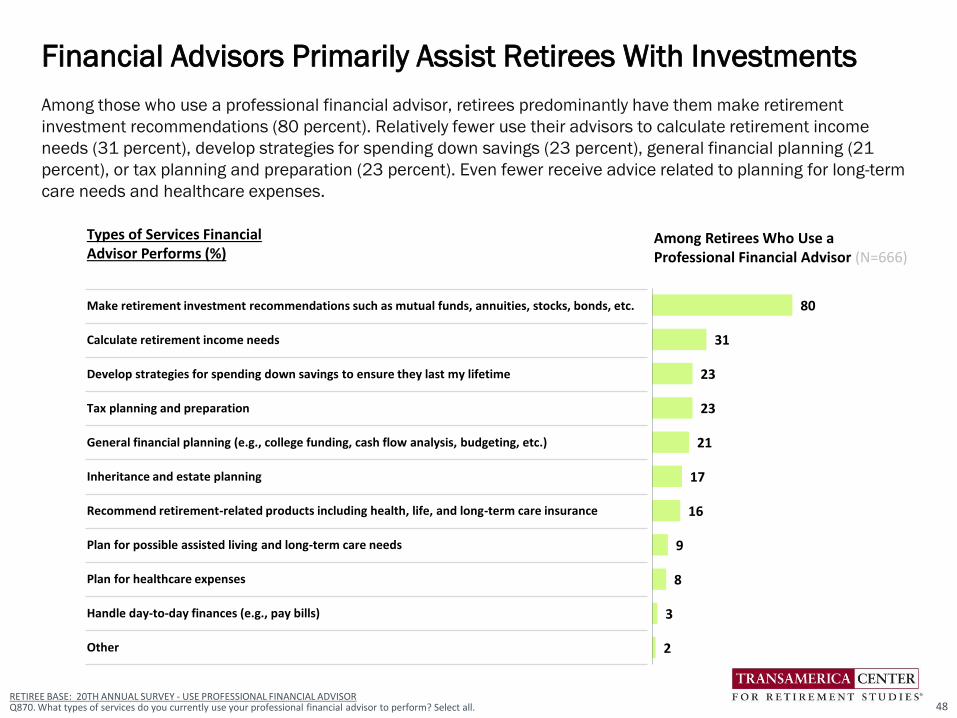
• Financial Advisors Primarily Assist Retirees With Investments. Among those who use a professional financial advisor,
retirees predominantly have them make retirement investment recommendations (80 percent). Relatively fewer use their
advisors to calculate retirement income needs (31 percent), develop strategies for spending down savings (23 percent),
general financial planning (21 percent), or tax planning and preparation (23 percent). Even fewer receive advice related to
planning for long-term care needs and healthcare expenses.
• Retirees Have a Variety of Insurance Coverage. The three most commonly held types of insurance among retirees are major
medical insurance (80 percent), prescription drug coverage insurance (75 percent), and homeowner’s/renter’s insurance
(70 percent). Other types of insurance coverage include: life insurance (48 percent), dental insurance (37 percent), vision
insurance (36 percent), and Medigap/Medicare supplemental insurance (35 percent). Notably, only 11 percent of retirees
have long-term care insurance.
Key Highlights
14

Before the Pandemic: Retirees’ Financial Vulnerabilities (cont.)
• Most Retirees Have Health Insurance Through Medicare. Among retirees with major medical insurance, Medicare is by far the
most common provider of insurance: 58 percent are the primary insured on a Medicare plan, and 13 percent are on Medicare
through their spouse/partner. Medicare Advantage plans are the next most commonly cited provider of major medical with 38
percent being the primary insured on a Medicare Advantage plan and seven percent being covered through their
spouse/partner. Far fewer retirees have major medical insurance through a prior employer, traditional insurance market,
Medicaid, VA benefits, or other sources.
• Spouse/Partner’s Retirement Savings. Among retirees who are married or living with their partner, 58 percent indicate that their
spouse/partner saves or has saved in a retirement plan of his or her own.
• Familiarity With Spouse/Partner’s Retirement Plan and Savings. The majority of retirees who are married or living with their
partner (88 percent) are familiar with their spouse/partner’s retirement plan and savings (58 percent “very familiar” and 30
percent “somewhat familiar”). Six percent are “not too familiar” and six percent are “not at all familiar” with their
spouse’s/partner’s retirement plan and savings.
• Most Retirees Do Not Have Financial Dependents. Sixty-three percent of retirees do not support anyone financially. Among those
who are married or living with their spouse/partner, 27 percent of retirees financially support their spouse/partner. Eight
percent of retirees support their children, while four percent support their grandchildren.
• Only One in 10 Receive Financial Support. Eleven percent of retirees receive some form of financial support in retirement,
including six percent from their children and four percent from a government agency other than Social Security. The vast
majority of retirees (88 percent) are not receiving financial support.
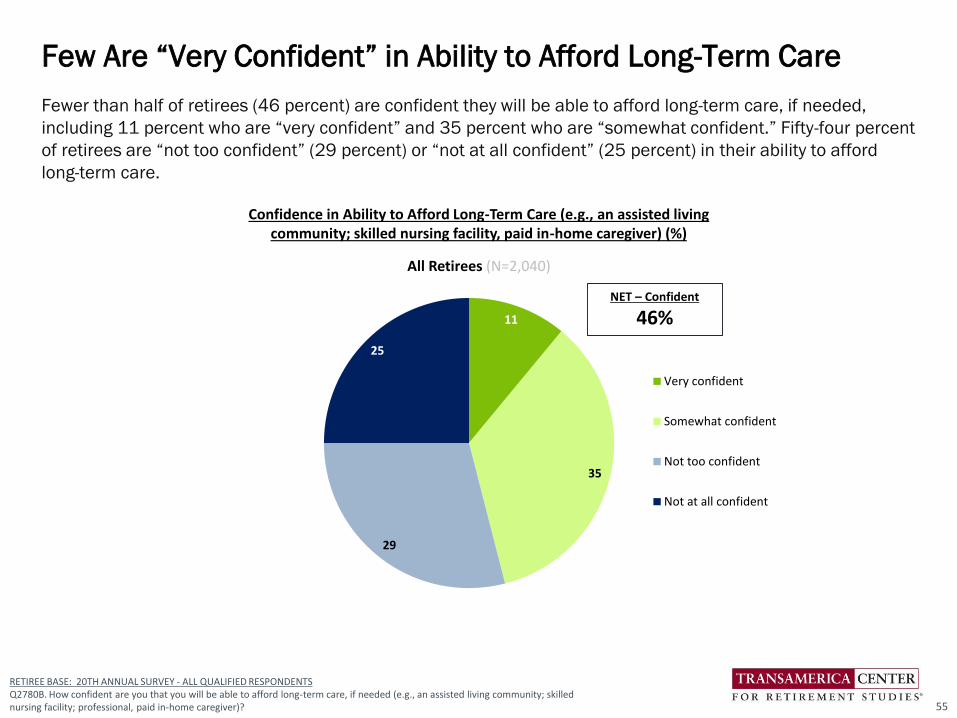
• Few Are “Very Confident” in Ability to Afford Long-Term Care. Fewer than half of retirees (46 percent) are confident they will be
able to afford long-term care, if needed, including 11 percent who are “very confident” and 35 percent who are “somewhat
confident.” Fifty-four percent of retirees are “not too confident” (29 percent) or “not at all confident” (25 percent) in their ability
to afford long-term care.
While the survey findings highlight the many ways in which retirees are financially vulnerable, it also reveals action steps that
retirees can be taking to help mitigate risks and improve their outcomes. These steps include careful planning, seeking
professional advice, if needed, and having an open dialogue with family and close friends.
Key Highlights
15

Life and Living Arrangements in Retirement
Most retirees are enjoying life in retirement. Prior to the pandemic, they were spending their time on a wide variety of activities
and, for the most part, maintaining their standard of living. Many are taking steps to protect their health (although they can do
even more). Some are even planning to live to age 100 or older. Nevertheless, retirees also have some well-founded retirement
fears.
• Most Aspects of Life Have Stayed the Same Since Retiring. Retirees report aspects of their life – standard of living, financial
situation, happiness, enjoyment of life, and general health – have mostly stayed the same since entering retirement.
Approximately four in 10 retirees say their enjoyment of life (40 percent) and happiness (38 percent) have improved since
entering retirement. Approximately three in 10 retirees indicate their financial situation (32 percent) and general health (31
percent) has declined in retirement.
• Retirees Are Spending Their Time on a Variety of Activities. Before the pandemic, when asked how they are spending their time
in retirement, retirees cite a wide variety of activities, including spending more time with family and friends (61 percent),
pursuing hobbies (42 percent), and traveling (37 percent). Twenty percent are doing volunteer work and 15 percent are taking
care of their grandchildren. Just three percent of retirees are doing some form of paid work such as pursuing an encore career
(2 percent), continuing to work in the same field (1 percent), and/or starting a business (<1 percent).
• More Than One in Four Retirees Are or Have Been Caregivers. Since retiring, 28 percent of retirees are currently or have
dedicated a significant amount of their time serving as a caregiver to a family member or friend who needs help taking care of
themselves. Among them, nine percent are currently caregiving and 19 percent have done so in the past.
• Greatest Retirement Fears Include Financial and Health Issues. When asked about their greatest retirement fears, retirees
most frequently cite declining health that requires long-term care (44 percent) and a reduction in or elimination of Social
Security (41 percent). Losing their independence (36 percent) and outliving their savings and investments (32 percent) are
also often cited retirement fears.
• Many Retirees Are “Not Sure” to What Age They Plan to Live. It is a bit of an uncomfortable question to ask people how long
they plan to live; however, it is an important question for financial planning. When asked what age they are planning live to,
more than half of retirees (53 percent) responded that they are “not sure,” which is a reasonable answer given the nature of
the question. Among retirees who provided a specific age, the median age they are planning to live to is 90. Fourteen percent
of retirees plan to live to age 100 or older.
Key Highlights
16

Life and Living Arrangements in Retirement (cont.)
• Retirees Want to Remain in Their Own Home. The vast majority of retirees (90 percent) indicate remaining in their own home as
they get older is important to them, including 69 percent indicating it is “very important” and 21 percent “somewhat important.”
Only seven percent indicate that it is not important, including five percent indicating “not too important” and two percent “not at
all important.”
• The Majority of Retirees Own Their Homes. Three in four retirees (75 percent) own their homes, while 22 percent rent and two
percent live with relatives or friends. Seventy-three percent of retirees currently live in a single family home, while 19 percent live
in a multi-unit apartment or condo. Only four percent live in a retirement community.
• Almost Four in 10 Retirees Have Moved Since Retiring. Since entering retirement, almost four in 10 retirees (38 percent) have
moved to a new home, while 62 percent have stayed in the home that they lived in before retiring. Among those who moved,
frequently cited reasons for doing so include moving closer to family and friends (32 percent), reduced expenses (29 percent),
downsizing into a smaller home (29 percent), having started a new chapter in life (22 percent), and moving to a better climate (22
percent). Of note, nine percent of retirees moved into an aging-friendly home.
• Retirees Cite a Variety of Criteria in Choosing Where to Live. When choosing where to live in retirement, retirees’ top three criteria
are proximity to family and friends (61 percent), affordable cost of living (55 percent), and access to excellent healthcare and
hospitals (46 percent). Other frequently cited criteria include: low crime rate (35 percent), good weather (33 percent), and leisure
and recreational activities (25 percent).
• Most Retirees Live With Spouse/Partner or Alone. While 53 percent of retirees currently live with their spouse/partner, more than
a third (35 percent) live alone. Ten percent live in the same household with their children, four percent with their grandchildren,
and four percent with other relatives. Among retirees who currently live with others who are not their spouse/partner, 54 percent
indicate that the other person(s) moved into their residence, while 18 percent of retirees moved into the other person’s residence,
and 28 percent indicate that they and the other person(s) all moved into a different residence.
Retirees are doing well, albeit with legitimate health- and financial-related fears. Some of their fears may be beyond their control to
solve, while others could be mitigated by proactively taking steps to address them.
Key Highlights
17

When and How Retirement Happened
Retirement is highly personal. People retire at different ages and for different reasons. For some, retirement is the culmination
of careful planning and preparation. For many others, retirement happens as a result of unforeseen circumstances such as
health issues or job loss. The survey findings illustrate the array of circumstances in which people retire, whether they are
continuing to work in retirement, and how they transitioned into retirement.
• More Than Half Retired Before Age 65. Ninety-four percent of retirees are fully retired and six percent consider themselves
semi-retired. Among those who are fully retired, the median age at which they retired is 63. More than half of the fully retired
(54 percent) retired before age 65. Seventeen percent retired at age 65. Twenty-five percent retired after age 65, including
11 percent who retired between ages 66 and 69, 12 percent who retired in their 70s, and two percent who fully retired at
age 80 or older. Four percent of the fully retired say they do not expect to ever stop working.
• Reasons for Working in Retirement Include Health and Financial. Among retirees who retired after age 65 or plan to do so,
their rationales for doing so are nearly evenly split between financial-related reasons (67 percent) and healthy aging-related
reasons (66 percent). The five most often cited specific reasons are: wanting the income (56 percent), being active (51
percent), enjoying what they do (44 percent), keeping their brain alert (41 percent), and having a sense of purpose (29
percent).
• Nearly Two in Five Retirees Immediately Stopped Working. When asked how their transition into retirement is happening or
happened, nearly two in five (39 percent) immediately stopped work when they reached a specific age (33 percent) or
amount of money (6 percent). Nineteen percent transitioned into retirement either by working in a different capacity that is
less demanding or brings more personal satisfaction (10 percent) or working reduced hours with more leisure time to enjoy
life (9 percent). Twenty percent continued to work in retirement as long as possible until they could no longer work anymore.
• The Majority Retired Sooner Than Planned. The majority of retirees (58 percent) retired sooner than they had planned.
Approximately one in three retirees (36 percent) indicate they retired when they had planned to do so. Six percent retired
later than planned.
Key Highlights
18
When and How Retirement Happened (cont.)
• Reasons for Retiring Sooner Than Planned: Work and Ill-Health. Among the 58 percent of retirees who retired sooner than
planned, about half (51 percent) cite employment-related reasons, including job loss (23 percent), organizational changes at
their place of employment (15 percent), unhappiness with their job (13 percent), and/or took a retirement incentive or buyout
(9 percent). Forty-eight percent cite health and/or family-related reasons, including their own ill health (32 percent), family
responsibilities (11 percent), and/or their spouse/partner retired (8 percent). Only nine percent of retirees retired sooner than
planned because of financial ability, including having saved enough and could afford to retire (8 percent) and/or they received
a financial windfall (1 percent).
• Reasons for Retiring Later Than Planned: Financial and Health. Among the small proportion (6 percent) of retirees who retired
later than planned, 62 percent cite financial-related reasons. The most frequently cited financial reason is needing the income
(42 percent), followed by hadn’t saved enough for retirement (21 percent), Social Security less than expected (16 percent),
and general anxieties about their financial situation (14 percent). Sixty-five percent of retirees who retired later than planned
cite healthy aging-related reasons, including enjoying their work (49 percent), staying active (49 percent), and keeping their
brain alert (37 percent). Twenty-five percent indicate that their employer requested that they stay longer. Seven percent
indicate their spouse/partner retired sooner than planned.
Retirees’ circumstances regarding when and how they retired exemplify common risks: employment issues, ill-health, and
financial need. Especially now, amid the pandemic, their experience offers a cautionary tale for those currently in the workforce
on the importance of maintaining good health, financial planning, and competitive job skills. Retirees’ experiences also
underscore the need for careful planning including contingency plans if forced into retirement sooner than expected.
Key Highlights
19

Looking Back on Financial Preparations for Retirement
In addition to shedding light on retirees’ current financial situation, the survey findings yield insights into their retirement
preparations during their working years, including what they did well and what they could have done differently. These lessons
learned can be very helpful for future generations of retirees in their own planning efforts.
• Retirees Started Saving at Age 40 – And Some Never Saved. Thirty percent of retirees started saving before the age of 40,
while 39 percent started saving in their forties or older. An alarming 31 percent of retirees indicate they did not save for
retirement. Among retirees who saved for retirement, they first started saving at age 40 (median).
• Nearly Two-Thirds Participated in Workplace Retirement Plans. For the majority of their working careers, 63 percent of retirees
participated in one or more forms of employer-sponsored retirement benefits, including 47 percent who participated in a
401(k) or similar plan and 36 percent who participated in a company-funded defined benefit plan. However, a large minority of
retirees (37 percent) worked for employers that did not offer any retirement benefits.
• Six in 10 Retirees Saved for Retirement Outside of Work. The majority of retirees (59 percent) saved for retirement outside of
work.
• Only One in 10 Had a Written Strategy Before Retiring. Fifty-four percent of retirees had a financial strategy for retirement
before they retired. However, among them only 12 percent had a written plan, while 42 percent had a plan but it was not
written down. Forty-six percent did not have a retirement strategy.
• Three in 10 Used a Financial Advisor Before Retiring. Before retiring, three in 10 retirees (31 percent) used a professional
financial advisor to help them manage their retirement savings or investments.
• Two-Thirds Say Their Employers Did “Nothing” to Help Transition. Nearly two-thirds of retirees (64 percent) say their most
recent employers did “nothing” to help pre-retirees transition into retirement and 20 percent are “not sure” what their
employers did. Among the few whose employers helped pre-retirees, the most frequently cited offerings are seminars and
education about transitioning into retirement (6 percent), financial counseling about retirement (5 percent), the ability to
reduce work hours and shift from full- to part-time (4 percent), accommodating flexible work schedules and arrangements (4
percent), and encourage succession planning, training and mentoring (4 percent).
Key Highlights
20

Looking Back on Financial Preparations for Retirement (cont.)
• Retirees’ Insights on How They Could Have Better Prepared. When looking back on their retirement preparations, more than
three in four retirees (78 percent) agree they wish they would have saved more and on a consistent basis. About two-thirds did
as much as they could to prepare for retirement (68 percent). Almost as many retirees wish they had been more
knowledgeable about retirement saving and investing (66 percent). Many retirees agree they waited too long to concern
themselves with saving and investing for retirement (53 percent) and that debt interfered with their ability to save for
retirement (48 percent).
Most retirees saved for retirement during their working years and most participated in employer-sponsored retirement plans –
although it should be noted that some were never offered benefits and some never saved. Among those who did save for
retirement, many may not have saved enough to achieve a level of retirement income that will support them throughout their
lifetimes. In retrospect, most retirees could have been more proactive about saving, investing, and planning when they were in
the workforce. Nonetheless, some retirees could have done everything right and still find themselves unprepared because the
underlying assumptions have changed (e.g., life expectancies, housing and healthcare costs, government benefits).
Key Highlights
21

1. Set forth a written financial plan to help ensure that your savings last your lifetime. Factor in living expenses, debt repayment,
savings and investments, sources of guaranteed retirement income, healthcare needs, insurance protections, investment
returns, inflation, taxes, the possible need for long-term care, and a potential legacy. Seek professional advice, if needed.
2. Keep saving as much as you can. Whether semi-retired or fully retired, strive to live within your means and set aside additional
savings.
3. Pay off debt and avoid taking on new debt, especially high-interest rate credit card or consumer debt. For those with mortgage
debt, determine the optimal approach for paying it off, considering your overall financial situation, the terms of the loan, and
the amount owed.
4. Consider an encore career, part-time work, or volunteer engagements to bring additional income and/or opportunities to stay
active and involved.
5. Get savvy about Social Security. Learn how Social Security claiming strategies can help maximize long-term benefits.
6. Plan and budget for home modifications that will enable you to age in place. If modifications are cost prohibitive or infeasible,
consider other alternatives such as moving to a different home or a retirement community.
7. Confront the possibility of needing long-term care. Learn about types of available care, associated costs, and possible eligibility
for support services. Research and obtain long-term care insurance, if appropriate for your situation.
8. Identify and enlist a trusted loved one(s). Have frank conversations about your wishes and concerns, and build a common
understanding about the potential need for financial and/or caregiving support.
9. Put your affairs in order and establish legal documents, as needed, including a financial power of attorney, a power of attorney
for healthcare or medical proxy, a HIPAA waiver, an advance directive or living will, a last will and testament, funeral and burial
arrangements, and/or a trust.
10. Don’t become a victim of elder fraud. Be hypervigilant, learn about scams and how to avoid them, protect your identity, and
safeguard your assets. Be cautious of scams related to the coronavirus.
11. Maintain social connections by staying involved with family, friends, and community. During pandemic restrictions, reach out by
phone, social media, virtual gatherings and other engagements that can help safeguard your health.
12. Take good care of your health to promote well-being and enjoyment of life -- and potentially reduce healthcare-related costs.
Recommendations for Retirees
22
23
Recommendations for Policymakers
1. Address Social Security and Medicare funding issues. The sooner reforms are implemented to the
programs, the more time people will have to make adjustments to their financial plans for retirement.
2. Consider adjusting the Social Security benefit formula to address the abnormally low Average Wage Index
for 2020 due to COVID-19. Without an adjustment, this abnormality will lower benefits for all workers
turning age 60 in 2020.
3. Support family caregivers by providing Social Security credits to those who have to forego employment in
order to provide care. Establish medical training programs for caregivers.
4. Protect retirees from elder financial exploitation and fraud by continuing current funding levels to the
Consumer Financial Protection Bureau, and creating a forum for federal, state, and local agencies to work
together and share resources.
5. Engage leaders from across sectors and disciplines to collaborate, innovate and implement financially
viable delivery models for long-term care.
6. Ensure accessible and affordable health care options are available to all retirees.
7. Identify and implement reforms to help retirees with out-of-pocket medical and drug costs.
8. Support lifelong learning initiatives to help retirees who are interested in learning new skills to continue
working in retirement.
9. Create new incentives and remove disincentives for employers to hire and retain age 50+ employees, offer
phased retirement programs, and create opportunities for encore careers.
10. Preserve and enhance existing tax and other incentives for workers to save for retirement.

Detailed Findings
Retirees and Retirement Amid COVID-19
24

How Retirees Are Faring Amid the Pandemic
25
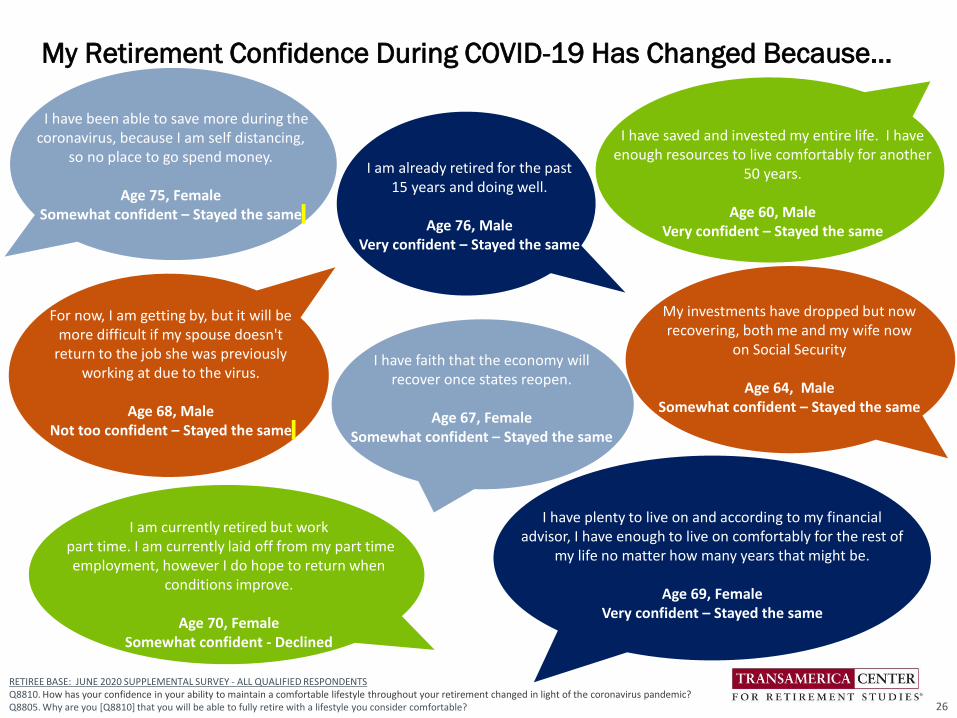
My Retirement Confidence During COVID-19 Has Changed Because…
RETIREE BASE: JUNE 2020 SUPPLEMENTAL SURVEY - ALL QUALIFIED RESPONDENTSQ8810. How has your confidence in your ability to maintain a comfortable lifestyle throughout your retirement changed in light of the coronavirus pandemic?Q8805. Why are you [Q8810] that you will be able to fully retire with a lifestyle you consider comfortable? 26
I have plenty to live on and according to my financial advisor, I have enough to live on comfortably for the rest of
my life no matter how many years that might be.
Age 69, Female Very confident – Stayed the same
My investments have dropped but now recovering, both me and my wife now
on Social Security
Age 64, Male Somewhat confident – Stayed the same
I have saved and invested my entire life. I have enough resources to live comfortably for another
50 years.
Age 60, MaleVery confident – Stayed the same
I have faith that the economy will recover once states reopen.
Age 67, FemaleSomewhat confident – Stayed the same
I am already retired for the past 15 years and doing well.
Age 76, MaleVery confident – Stayed the same
I have been able to save more during the coronavirus, because I am self distancing,
so no place to go spend money.
Age 75, Female Somewhat confident – Stayed the same
For now, I am getting by, but it will be more difficult if my spouse doesn't
return to the job she was previously working at due to the virus.
Age 68, Male Not too confident – Stayed the same
I am currently retired but workpart time. I am currently laid off from my part time employment, however I do hope to return when
conditions improve.
Age 70, Female Somewhat confident - Declined

Retirement Confidence Largely Unchanged Amid Pandemic
Three in four retirees (75 percent) say their confidence in their ability to maintain a comfortable lifestyle
throughout retirement in light of the pandemic has stayed the same. Fifteen percent of retirees say their
confidence has declined in light of the pandemic, four percent say their confidence has improved, and six
percent don’t know.
27RETIREE BASE: JUNE 2020 SUPPLEMENTAL SURVEY - ALL QUALIFIED RESPONDENTSQ8810. How has your confidence in your ability to maintain a comfortable lifestyle throughout your retirement changed in light of the coronavirus pandemic?
15
75
46
Declined
Stayed the same
Improved
Don't know/Not sure
How has your confidence in your ability to maintain a comfortable lifestyle in retirementchanged in light of the coronavirus pandemic? (%)
June 2020 Survey
All Retirees (N=411)

Amid the pandemic, 76 percent of retirees are confident that they will be able to maintain a comfortable
lifestyle throughout retirement, with 29 percent being “very confident” and 47 percent being “somewhat
confident.” Eighteen percent are “not too confident,” while six percent of retirees are “not at all confident” that
they will be able to maintain a comfortable lifestyle throughout retirement.
Three in Four Retirees Are Confident About Retirement
RETIREE BASE: JUNE 2020 SUPPLEMENTAL SURVEY - ALL QUALIFIED RESPONDENTSQ880. How confident are you that you will be able to maintain a lifestyle you consider comfortable throughout your retirement?
How confident are you that you will be able to maintain a lifestyle you consider comfortable throughout your retirement? (%)
28
June 2020 Survey
All Retirees (N=411)
NET – Confident
76%
29
47
18
6
Very confident Somewhat confident Not too confident Not at all confident

Retirees Would Rely on Savings if Finances Are Impacted by COVID-19
When asked what sources of funds they have used or would use if their finances have been or would be
negatively impacted by the pandemic, retirees’ most frequently cited source is savings (56 percent). Other
sources include: credit cards (18 percent), withdrawal from a retirement account such as a 401k, 403(b), or
IRA (18 percent), and CARES Act stimulus money (18 percent). Retirees are less likely to cite reliance on a
significant other’s or spouse’s income (9 percent), loans from family and friends (5 percent), home equity
loans from a bank (4 percent) or unemployment benefits (3 percent).
29
RETIREE BASE: JUNE 2020 SUPPLEMENTAL SURVEY - ALL QUALIFIED RESPONDENTSQ8830. Which of the following sources of funds have you used/do you think you would rely on if your finances are negatively impacted by the coronavirus pandemic? Select all.
56
18 18 18
9 5 4 3
<1
17
Savings Credit cards Withdrawalfrom a
retirementaccount
such as a 401(k),403(b), or IRA
CARES Actstimulus money
Significantother orspouse'sincome
Loan froma friend or
familymember
Loan froma bank including
home equityloan
Unemploymentbenefits
Severance pay Other
Which of the following sources of funds have you used/do you think you would rely on if your finances are negatively impacted by the coronavirus pandemic? Select all. (%)
June 2020 Survey
All Retirees (N=411)
Amid the COVID-19 recession, retirees most frequently cite paying off some form of debt (45 percent), including
paying off credit card debt, mortgage, other consumer debt, and/or student loans. One in three retirees cite
“building emergency savings” as a current financial priority. Other priorities include “just getting by to cover
basic living expenses” (23 percent) and “paying healthcare expenses” (21 percent).
Many Retirees Cite Paying Off Debt as a Financial Priority
RETIREE BASE: JUNE 2020 SUPPLEMENTAL SURVEY - ALL QUALIFIED RESPONDENTSQ2639. Which of the following are your financial priorities right now? Select all.
Current Financial Priorities (%) June 2020 SurveyAll Retirees (N=411)
Building emergency savings
Just getting by to cover basic living expense
Paying healthcare expenses
NET – Paying off debt
Paying off credit card debt
Paying off mortgage
Paying off other consumer debt
Paying off student loans
Creating an inheritance or financial legacy
Continuing to save for retirement
Supporting children
Supporting grandchildren
Paying long-term care expenses
Contributing to an education fund (for my children, grandchildren, or other)
Supporting parents
Other
30
33
23
21
45
32
18
10
1
19
16
7
6
4
3
1
11

RETIREE BASE: JUNE 2020 SUPPLEMENTAL SURVEY - ALL QUALIFIED RESPONDENTS Q1155. Since retiring/semi-retiring, which of the following best describes your current financial strategy for retirement?
Fifty-eight percent of retirees amid the pandemic have a current financial strategy for retirement – but only 18
percent have it in writing, while 40 percent have a plan that is not written. Many retirees amid the pandemic
(42 percent) do not have a financial strategy for retirement.
Few Retirees Have a Written Retirement Strategy
Current Financial Strategy for Retirement (%)
31
I have a written plan I have a plan, but it is not written down
I do not have a plan
18
40
42
NET – Have a Plan
58%
June 2020 Survey
All Retirees (N=411)

Amid the pandemic, only nine percent of retirees frequently discuss retirement savings with their family and
friends. Forty-five percent occasionally do so, while 46 percent never do so.
Almost Half Never Discuss Their Financial Situation With Others
RETIREE BASE: JUNE 2020 SUPPLEMENTAL SURVEY - ALL QUALIFIED RESPONDENTS Q1515. How frequently do you discuss your retirement savings, investments, and financial situation with family and close friends?
Frequency of Retirement Discussion with Family and Friends (%)
32
Frequently Occasionally Never
9
45
46
June 2020 SurveyAll Retirees (N=411)
NET – Frequently/ Occasionally
54%

When asked what their plans are for receiving long-term care should their health decline and they need help with
daily activities and/or nursing care, retirees most often cite a reliance on family and friends (41 percent). Fewer
retirees plan to move into an assisted living community and/or nursing home (19 percent). An alarming one in five
retirees haven’t thought about their plans for receiving long-term care (19 percent) or don’t have any plans for
such care (21 percent).
Plans for Receiving Long-Term Care
RETIREE BASE: JUNE 2020 SUPPLEMENTAL SURVEY - ALL QUALIFIED RESPONDENTSQ2775. If your health declines and you need help with daily activities and/or nursing care, what are your plans for receiving such care? Select all. 33
Plans for Long-Term Care Assistance (%) June 2020 SurveyAll Retirees (N=411)
NET – Rely on family and friends
My spouse to care for me
Family members (other than my spouse/partner) to care for me
Friends to care for me
NET – Assisted living/nursing home
Assisted living community
Nursing home (e.g., skilled nursing facility)
Use a professional, paid in-home caregiver
Seek reduced-fee services from a community organization
Other
I haven’t thought about it
I don't have any plans
41
27
20
2
19
16
10
17
4
1
19
21

When asked about the types of legal documents they have set forth in writing, a last will and testament is the
most often cited during the pandemic (53 percent), followed by power of attorney for healthcare or medical
proxy (32 percent), and advance directive or living will (30 percent). Amid the pandemic, 30 percent have none
of these documents in place.
Retirees Should Consider Legal Documentation
RETIREE BASE: JUNE 2020 SUPPLEMENTAL SURVEY - ALL QUALIFIED RESPONDENTSQ1517. Which of the following legal documents have you set forth in writing? Select all.
Types of Legal Documentation in Place (%) June 2020 SurveyAll Retirees (N=411)
NET – Selected one or more options
Last will and testament
Power of attorney or medical proxy to allow a designated individual(s) to make medical decisions on your behalf
Advance directive or living will instructing physicians and other medical personnel about end-of-life healthcare preferences and any care you wish to decline
Power of attorney to allow a designated individual (s) to make financial decisions on your behalf
Funeral and burial arrangements
HIPAA waiver to allow a designated individual(s) to speak to your physiciansand insurance providers on your behalf
A trust
Other
None
34
69
53
32
30
28
19
18
11
1
30

RETIREE BASE: JUNE 2020 SUPPLEMENTAL SURVEY - ALL QUALIFIED RESPONDENTS Q5025. How much do you agree or disagree with the following statements?
Retirees are far more likely to cite positive attitudes and experiences than negative. Amid the pandemic, most
retirees agree that they are generally happy (91 percent), have a close relationship with their families and/or
friends (91 percent), and are confident in their ability to manage their finances (90 percent). In contrast, relatively
few retirees cite negative attitudes and such as feeling anxious and depressed (24 percent), having trouble
making ends meet (21 percent), and feeling isolated and lonely (20 percent).
Most Retirees Have a Positive Outlook on Life
Attitudes and ExperiencesNET – Strongly/Somewhat Agree (%)
June 2020 SurveyAll Retirees (N=411)
Positive Attitudes and Experiences
I have a close relationship with family and/or friends
I am generally a happy person
I am confident in my ability to manage my finances
I am enjoying my life
I have a positive view of aging
I have a strong sense of purpose
I have an active social life
Negative Attitudes and Experiences
I often feel anxious and depressed
I am having trouble making ends meet
I am isolated and lonely
35
91
91
90
84
81
79
47
24
21
20
Amid the pandemic, the most often-cited health-related activities among retirees included: seeking medical
attention when needed (69 percent), getting routine physicals and recommended health screenings (66
percent), getting plenty of rest (62 percent), maintaining a positive outlook (60 percent), and avoiding harmful
substances (58 percent). More retirees can be eating healthily (53 percent), exercising regularly (52 percent),
and practicing mindfulness and meditation (15 percent) when possible.
Retirees Are Taking Care of Their Health – But Can Do More
36RETIREE BASE: JUNE 2020 SUPPLEMENTAL SURVEY - ALL QUALIFIED RESPONDENTSQ1446. Which of the following health-related activities do you currently do on a consistent basis? Select all.
Health-Related Activities That Retirees Do on a Consistent Basis (%) June 2020 SurveyAll Retirees (N=411)
Seek medical attention when needed
Get routine physicals and recommended health screenings
Get plenty of rest
Maintain a positive outlook
Avoid harmful substances (e.g., cigarettes, alcohol, illicit drugs, etc.)
Eat healthily
Exercise regularly
Manage stress
Consider long-term health when making lifestyle decisions
Practice mindfulness and meditation
Other
Nothing
69
66
62
60
58
53
52
37
26
15
<1
5
Before the Pandemic: Retirees’ Financial
Vulnerabilities
37

Before the pandemic, fewer than half of retirees (47 percent) agree that they have built a large enough retirement
nest egg, of whom only 15 percent “strongly agree” and 32 percent “somewhat agree.” Seventeen percent
“somewhat disagree” and 30 percent “strongly disagree.” Six percent of retirees are “not sure.”
Few “Strongly Agree” They Have Built a Large Enough Nest Egg
RETIREE BASE: 20TH ANNUAL SURVEY - ALL QUALIFIED RESPONDENTSQ800. How much do you agree or disagree that you have built a large enough retirement nest egg?
Built Large Enough Nest Egg (%)
15
32
17
30
6
Strongly agree Somewhat agree Somewhat disagree Strongly disagree Not sure
All Retirees (N=2,040)
NET – Agree
47%
38

RETIREE BASE: 20TH ANNUAL SURVEY - ALL QUALIFIED RESPONDENTSQ1150. Over the course of your retirement, what will be all your sources of income? Select all.
Nearly all retirees (95 percent) expect Social Security to be a source of income over the course of their retirement.
The other most frequently cited sources of retirement income include other savings and investments (40 percent),
401(k)/403(b)/IRAs (35 percent), and company-funded pension plans (30 percent). Relatively few retirees cite
home equity (9 percent), inheritance (6 percent), or paid work (3 percent) as sources of income.
Retirees Cite Diverse Sources of Income
Current Sources of Retirement Income (%) All Retirees (N=2,040)
Social Security
NET – Retirement accounts and personal savings
Other savings and investments
401(k)/403(b) accounts/IRAs
Company-funded pension plan
Home equity
Inheritance
Working
Other
95
55
40
35
30
9
6
3
6
39
RETIREE BASE: 20TH ANNUAL SURVEY - ALL QUALIFIED RESPONDENTSQ1155. Over the course of your retirement, what will be your primary source of income?
Sixty-nine percent of retirees indicate that Social Security will be their primary source of income over the course
of their retirement. Eighteen percent cite retirement accounts and personal savings, including a 401(k) or
similar accounts/IRAs (7 percent), and other savings and investments (11 percent). One in 10 retirees cite a
company-funded pension plan as their primary source of income.
Social Security Is the Primary Source of Income for Most Retirees
Primary Source of Income for Duration of Retirement (%)
All Retirees (N=2,040)
Social Security
NET – Retirement accounts and personal savings
Other savings and investments
401(k)/403(b) accounts/IRAs
Company-funded pension plan
Home equity
Inheritance
Working
Other
69
18
11
7
10
1
<1
<1
2
40

RETIREE BASE: 20TH ANNUAL SURVEY - ALL QUALIFIED RESPONDENTS Q1540. Are you currently receiving income from Social Security benefits?RETIREE BASE: 20TH ANNUAL SURVEY - RECEIVING SOCIAL SECURITY BENEFIT PAYMENTSQ1555. At what age did you start receiving income from Social Security benefits?
The vast majority of retirees (91 percent) are currently receiving income from Social Security benefits. Among
them, the median age they started receiving benefits was 62 – the earliest age that most workers can claim
Social Security, albeit at a permanently reduced amount of benefit. Depending on their year of birth, the age at
which workers are eligible to receive “full” benefits is between 65 and 67. The survey finds 32 percent of retirees
started receiving benefits between age 65 and 69. Only three percent started receiving benefits at age 70 or
older, with age 70 being when people are eligible to receive maximum monthly benefits.
Nine in 10 Retirees Are Currently Receiving Social Security
Currently Receiving Social Security Benefits (%)
9
3
39
9
21
11
2
1
5
<60
60-61
62
63-64
65
66-69
70
>70
Not sure
Among Those Receiving Social Security Benefits, Age at Which They Started Receiving (%) (N=1,739)
MEDIAN AGE62
91 6 3All Retirees
Yes - I am currently receiving Social Security benefit payments
No - I have not yet started receiving Social Security benefit payments
No - I am not eligible to receive Social Security retirement benefits
N=2,040
*Some people are eligible to receive Social Security earlier than 62 due to disability or death of a spouse.
41

Current Types of Savings and Investments (%) All Retirees (N=2,040)
Checking account
Savings account
Primary residence
Cash
Life insurance policy
IRA
Stocks
Mutual fund
CD
401(k), 403(b), or similar plan
Annuity
Money market fund
Bonds
Real estate investment other than primary residence
Exchange-traded fund (ETF)
Business
Other investments
I have no savings and investments
Retirees currently have a wide variety of savings and investments, including checking accounts (77 percent),
savings accounts (62 percent), and equity in their primary residence (47 percent). Retirees are less likely to
have retirement accounts such as IRAs (35 percent), annuities (18 percent), and/or 401(k), 403(b), or similar
plans (18 percent). Twelve percent have no savings and investments.
Retirees Have a Variety of Savings and Investments
77
62
47
46
36
35
27
21
20
18
18
18
12
9
6
1
2
12
RETIREE BASE: 20TH ANNUAL SURVEY - ALL QUALIFIED RESPONDENTSQ750. Now that you are retired/semi-retired, what types of savings and investments do you currently have? Select all. 42

Given the number of years they will be spending in retirement, retirees have limited household savings.
Retirees have $45,000 (estimated median) in household savings (excluding home equity). Twenty-one percent
have savings of less than $50,000, while 16 percent do not have any savings. Thirty-three percent of retirees
have savings of $100,000 or more.
Retirees have $78,000 (estimated median) in home equity. Thirty-nine percent have home equity of $100,000
or more. Twenty-four percent do not have any home equity.
Many Retirees Have Limited Household Savings
Not sure 9 10Decline to answer 15 13
Estimated Median $45,000 $78,000
Note: The median is estimated based on the approximate midpoint of the range of each response category. Non-responses are excluded from the estimate.
RETIREE BASE: 20TH ANNUAL SURVEY - ALL QUALIFIED RESPONDENTSQ1310. Approximately how much money does your household currently have saved in the following?
Household savings excluding home equity (includes IRAs, 401(k)s, 403(b)s,
bank accounts, brokerage accounts, etc., and any other savings)
43
16
9
12
6
15
18
$500k or more
$100k to less than $500k
$50k to less than $100k
$5k to less than $50k
$1 to less than $5k
None 24
14
18
15
6 $500k or more
$250k to less than $500k
$100k to less than $250k
$1 to less than $100k
None
Home equity
Household Savings (%)All Retirees (N=2,040)

Prior to the pandemic, retirees reported an annual household income of $29,000 (estimated median). Twenty-
seven percent reported having an income of less than $25,000.
Many Retirees Have Limited Household Income
RTIREE BASE: 20TH ANNUAL SURVEY - ALL QUALIFIED RESPONDENTSQ1265. Which of the following best represents your household income last year before taxes? 44
Not sure 2Decline to answer 6
Estimated Median $29,000
Note: The median is estimated based on the approximate midpoint of the range of each response category. Non-responses are excluded from the estimate.
Annual Household Income (%)
27
29
14
9
922
20th Annual Survey
$200k or more
$150k to less than $200k
$100k to less than $150k
$75k to less than $100k
$50k to less than $75k
$25k to less than $50k
Less than $25k
All Retirees
N=2,040

Many retirees are still paying off household debt.
Forty-six percent have non-mortgage debt (e.g., credit card debt, car loans, student loans, medical debt, etc.),
including 32 percent who have between $1 and $10,000 and 14 percent with $10,000 or more. Among those
who have non-mortgage debt, the estimated median is $3,000.
Twenty-three percent of retirees have mortgage debt (including any equity loans or lines of credit), including 17
percent who have between $1 and $100,000 and six percent with $100,000 or more. Among those with
mortgage debt, the estimated median is $42,000.
Retirees’ Household Debt
Not sure 4 4Decline to answer 8 9
Estimated Median(excluding “none” responses)
$3,000 $42,000
Note: The median is estimated based on the approximate midpoint of the range of each response category. Non-responses are excluded from the estimate.
RETIREE BASE: 20TH ANNUAL SURVEY - ALL QUALIFIED RESPONDENTSQ1315. Approximately how much debt does your household currently have ?
Non-mortgage debt (including credit card debt, car loan(s), student loan(s),
medical debt, etc.)
45
42
22
10
8411
$100k or more
$50k to less than $100k
$25k to less than $50k
$10k to less than $25k
$5k to less than $10k
$1 to less than $5k
None
64
21266 6
Mortgage debt (including any equity loans or lines of credit)
Household Debt (%)All Retirees (N=2,040)

Among retirees who have a financial strategy for retirement, 82 percent have factored in Social Security and
Medicare benefits and 67 percent have factored in basic living expenses. Fewer than half have considered other
factors, such as total retirement savings and income needs (48 percent) and a plan to help ensure their saving
last their lifetimes (44 percent).
Many May Be Overlooking Important Factors in Their Strategies
Components of Current Financial Strategy for Retirement (%) Among Retirees with a Written or Unwritten Retirement Strategy (N=1,188)
Social Security and Medicare benefits
Basic living expenses
Total retirement savings and income needs
A plan to help ensure my savings last throughout my retirement
A budget
Ongoing healthcare costs
Investment returns
Housing
Long-term care needs
Inflation
Pursuing retirement dreams
Estate planning
Tax planning
Paying off mortgage
Paying off non-mortgage debt
Home modifications
Supporting others*
Contingency plans for retiring sooner than expected and/or savings shortfalls
Other
Not sure
82
67
48
44
42
42
39
31
26
24
23
20
20
20
14
11
10
6
2
3
*Note: “Excluding my spouse/parent” among those with a spouse/partner.RETIREE BASE: 20TH ANNUAL SURVEY - HAVE FINANCIAL STRATEGY FOR RETIREMENTQ1511. Which of the following did you factor into your current financial strategy for retirement? Select all. 46

RETIREE BASE: 20TH ANNUAL SURVEY - ALL QUALIFIED RESPONDENTSQ860. Do you currently use a professional financial advisor?
Only 31 percent of retirees use a professional financial advisor to help manage their retirement
savings/investments.
Approximately One in Three Use a Professional Financial Advisor
Currently Use a Professional Financial Advisor to Help Manage Retirement Savings or Investments (%)
47
31
69
All Retirees (N=2,040)
Yes No
RETIREE BASE: 20TH ANNUAL SURVEY - USE PROFESSIONAL FINANCIAL ADVISORQ870. What types of services do you currently use your professional financial advisor to perform? Select all.
Types of Services Financial Advisor Performs (%)
Make retirement investment recommendations such as mutual funds, annuities, stocks, bonds, etc.
Calculate retirement income needs
Develop strategies for spending down savings to ensure they last my lifetime
Tax planning and preparation
General financial planning (e.g., college funding, cash flow analysis, budgeting, etc.)
Inheritance and estate planning
Recommend retirement-related products including health, life, and long-term care insurance
Plan for possible assisted living and long-term care needs
Plan for healthcare expenses
Handle day-to-day finances (e.g., pay bills)
Other
Among those who use a professional financial advisor, retirees predominantly have them make retirement
investment recommendations (80 percent). Relatively fewer use their advisors to calculate retirement income
needs (31 percent), develop strategies for spending down savings (23 percent), general financial planning (21
percent), or tax planning and preparation (23 percent). Even fewer receive advice related to planning for long-term
care needs and healthcare expenses.
Financial Advisors Primarily Assist Retirees With Investments
Among Retirees Who Use a Professional Financial Advisor (N=666)
80
31
23
23
21
17
16
9
8
3
2
48

The three most commonly held types of insurance among retirees are major medical insurance (80 percent),
prescription drug coverage insurance (75 percent), and homeowner’s/renter’s insurance (70 percent). Other
types of insurance coverage include: life insurance (48 percent), dental insurance (37 percent), vision
insurance (36 percent), and Medigap/Medicare supplemental insurance (35 percent). Notably, only 11 percent
of retirees have long-term care insurance.
Retirees Have a Variety of Insurance Coverage
Current Types of Insurance (%) All Retirees (N=2,040)
Major medical insurance (including Medicare, Medicaid, other)
Prescription drug coverage
Homeowner’s or renter’s insurance
Life insurance
Dental insurance
Vision insurance
Medigap/Medicare supplemental insurance
Liability or umbrella insurance
Long-term care insurance
Cancer insurance
Disability insurance
Critical illness insurance
Other
None of the above
80
75
70
48
37
36
35
16
11
5
3
2
4
2
RETIREE BASE: 20TH ANNUAL SURVEY - ALL QUALIFIED RESPONDENTSQ775. Which of the following types of insurance do you currently have? Select all. 49

Among retirees with major medical insurance, Medicare is by far the most common provider of insurance: 58
percent are the primary insured on a Medicare plan, and 13 percent are on Medicare through their spouse/partner.
Medicare Advantage plans are the next most commonly cited provider of major medical with 38 percent being the
primary insured on a Medicare Advantage plan and seven percent being covered through their spouse/partner. Far
fewer retirees have major medical insurance through a prior employer, traditional insurance market, Medicaid, VA
benefits, or other sources.
Most Retirees Have Health Insurance Through Medicare
RETIREE BASE: 20TH ANNUAL SURVEY - HAVE MAJOR MEDICAL INSURANCEQ780. Which of the following best describes your provider(s) of major medical insurance? Select all.
Major Medical Insurance Provider (%) Among Retirees Who Have Major Medical Insurance (N=1,635; Married/Partner N=931)
Medicare (A, B, and/or D)
Medicare Advantage
Medicaid
Retiree health benefits from previous employer
Coverage from the traditional insurance market
VA benefits
Tricare
Current employer coverage
Coverage from an Exchange
COBRA benefits
Other
58
38
11
10
7
6
4
2
2
1
4
13
7
3
7
3
3
2
5
1
1
6
I am the primary insured
My spouse/partner is the primary insured
50

RETIREE BASE: 20TH ANNUAL SURVEY - MARRIED/CIVIL UNION OR LIVING WITH PARTNERQ850. Does or did your spouse or partner put money into a retirement plan of his or her own?
Among retirees who are married or living with their partner, 58 percent indicate that their spouse/partner saves
or has saved in a retirement plan of his or her own.
Spouse/Partner’s Retirement Savings
Spouse/Partner Saves in a Retirement Plan (%)
58
39
3
Yes
No
Not sure
Retirees Who Are Married or Living with Partner (N=1,142)
51

The majority of retirees who are married or living with their partner (88 percent) are familiar with their
spouse/partner’s retirement plan and savings (58 percent “very familiar” and 30 percent “somewhat familiar”).
Six percent are “not too familiar” and six percent are “not at all familiar” with their spouse’s/partner’s
retirement plan and savings.
Familiarity With Spouse/Partner’s Retirement Plan and Savings
RETIREE BASE: 20TH ANNUAL SURVEY - MARRIED/CIVIL UNION OR LIVING WITH PARTNERQ1520. How familiar are you with your spouse or partner’s retirement plan and savings?
Familiarity with Spouse/Partner’s Retirement Plan and Savings (%)
Retirees Who Are Married or Living with Partner (N=1,142)
5830
6
6
Very familiar
Somewhat familiar
Not too familiar
Not at all familiar
NET – Familiar
88%
52

Financially Dependent on Retiree (%) All Retirees (N=2,040)
My spouse or partner*
My children
My grandchildren
Siblings or other relatives
My parents/Parents-in-law
Other
No one
Sixty-three percent of retirees do not support anyone financially. Among those who are married or living with
their spouse/partner, 27 percent of retirees financially support their spouse/partner. Eight percent of retirees
support their children, while four percent support their grandchildren.
Most Retirees Do Not Have Financial Dependents
*Note: Only asked among retirees who have a spouse or partner.
RETIREE BASE: 20TH ANNUAL SURVEY - ALL QUALIFIED RESPONDENTS Q2760. Who of the following, if any, do you support financially? Select all.
27
8
4
2
1
1
63
53

RETIREE BASE: 20TH ANNUAL SURVEY - ALL QUALIFIED RESPONDENTSQ3505. Do you receive financial support from your family (other than your spouse/partner) or others in retirement? Select all.
Eleven percent of retirees receive some form of financial support in retirement, including six percent from their
children and four percent from a government agency other than Social Security. The vast majority of retirees
(88 percent) are not receiving financial support.
Only One in 10 Receive Financial Support
Do You Receive Financial Support from Your Family (Other Than Your Spouse/Partner) or Others in Retirement? (%)
All Retirees (N=2,040)
NET – Yes, receive financial support
From my children
From a government agency other than Social Security (e.g., SNAP, housing voucher)
From other family members excluding my spouse/partner or children
From friends
From a faith-based organization
From a nonprofit organization (that is not faith-based)
No
Not sure
11
6
4
3
1
<1
<1
88
1
54
Fewer than half of retirees (46 percent) are confident they will be able to afford long-term care, if needed,
including 11 percent who are “very confident” and 35 percent who are “somewhat confident.” Fifty-four percent
of retirees are “not too confident” (29 percent) or “not at all confident” (25 percent) in their ability to afford
long-term care.
Few Are “Very Confident” in Ability to Afford Long-Term Care
RETIREE BASE: 20TH ANNUAL SURVEY - ALL QUALIFIED RESPONDENTSQ2780B. How confident are you that you will be able to afford long-term care, if needed (e.g., an assisted living community; skilled nursing facility; professional, paid in-home caregiver)?
11
35
29
25
Very confident
Somewhat confident
Not too confident
Not at all confident
All Retirees (N=2,040)
NET – Confident
46%
Confidence in Ability to Afford Long-Term Care (e.g., an assisted living community; skilled nursing facility, paid in-home caregiver) (%)
55

Life and Living Arrangements in Retirement
56

Most Aspects of Life Have Stayed the Same Since Retiring
Retirees report aspects of their life – standard of
living, financial situation, happiness, enjoyment of
life, and general health – have mostly stayed the
same since entering retirement.
Approximately four in 10 retirees say their
enjoyment of life (40 percent) and happiness (38
percent) have improved since entering retirement.
Approximately three in 10 retirees indicate their
financial situation (32 percent) and general
health (31 percent) has declined in retirement.
57RETIREE BASE: 20TH ANNUAL SURVEY - ALL QUALIFIED RESPONDENTSQ2774. Since entering retirement/semi-retirement, have the following aspects of your life improved, declined, or stayed the same?
Since entering retirement/semi-retirement, have the following aspects of your life improved, declined, or stayed the same? (%)
All Retirees (N=2,040)
Improved Declined Stayed the same Not sure
15
20
38
40
13
17
32
12
15
31
67
47
48
43
56
1
1
2
2
<1
Standardof living
Financialsituation
Happiness
Enjoymentof life
Generalhealth

Before the pandemic, when asked how they are spending their time in retirement, retirees cite a wide variety of
activities, including spending more time with family and friends (61 percent), pursuing hobbies (42 percent), and
traveling (37 percent). Twenty percent are doing volunteer work and 15 percent are taking care of their
grandchildren. Just three percent of retirees are doing some form of paid work such as pursuing an encore career
(2 percent), continuing to work in the same field (1 percent), and/or starting a business (<1 percent).
Retirees Are Spending Their Time on a Variety of Activities
RETIREE BASE: 20TH ANNUAL SURVEY - ALL QUALIFIED RESPONDENTSQ1419. Now that you are retired, how are you spending your time? Select all.
How Retirees Are Spending Their Time (%) All Retirees (N=2,040)
Spending more time with family and friends
Pursuing hobbies
Traveling
Doing volunteer work
Taking care of my grandchildren
Caregiving for a loved one
Pursuing an encore career (pursuing a new role, work, activity, or career)
Continue working in the same field
Starting a business
Other
None of the above
61
42
37
20
15
9
2
1
<1
9
11
58
NET – Paid Work
3%

Since retiring, 28 percent of retirees are currently or have dedicated a significant amount of their time serving
as a caregiver to a family member or friend who needs help taking care of themselves. Among them, nine
percent are currently caregiving and 19 percent have done so in the past.
More Than One in Four Retirees Are or Have Been Caregivers
RETIREE BASE: 20TH ANNUAL SURVEY - ALL QUALIFIED RESPONDENTS Q2755. Since retiring/entering semi-retirement, have you dedicated a significant amount of time serving as a caregiver to a family member or friend who need help taking care of themselves? Examples of caregiving include: feeding, bathing, dressing, providing medication, assisting with medical appointments, providing transportation, running errands, financial and household administration, etc.
Dedicated a Significant Amount of Time in Retirement Serving as Caregiver to a Family Member or Friend Who Needs Help Taking Care of Themselves (%)
9
19
70
2Yes, I am currently serving asa caregiver
Yes, I have been a caregiversince retiring/entering semi-retirement, but am notcurrently a caregiver
No
Not sure
All Retirees (N=2,040)
59
NET – Yes, serving/have served as a caregiver
28%

When asked about their greatest retirement fears, retirees most frequently cite declining health that requires
long-term care (44 percent) and a reduction in or elimination of Social Security (41 percent). Losing their
independence (36 percent) and outliving their savings and investments (32 percent) are also often cited
retirement fears.
Greatest Retirement Fears Include Financial and Health Issues
Greatest Fears About Retirement (%) All Retirees (N=2,040)
NET – Financial Fears
Social Security will be reduced or cease to exist in the future
Outliving my savings and investments
Possible long-term care costs
Not being able to meet the basic financial needs of my family
Affordable housing
NET – Health and Healthcare Fears
Declining health that requires long-term care
Cognitive decline, dementia, Alzheimer's disease
Lack of access to adequate and affordable healthcare
Losing my independence
NET – Social
Feeling isolated and alone
Finding meaningful ways to spend time and stay involved
Being laid off - not being able to retire on my own terms*
Other
None of the above
69
41
32
31
22
15
59
44
31
20
36
23
14
13
<1
1
14
*Note: Only asked among retirees who are semi-retired
RETIREE BASE: 20TH ANNUAL SURVEY - ALL QUALIFIED RESPONDENTSQ1421. Since entering retirement/semi-retirement, what are your greatest fears? Select all. 60

It is a bit of an uncomfortable question to ask people how long they plan to live; however, it is an important
question for financial planning. When asked what age they are planning live to, more than half of retirees (53
percent) responded that they are “not sure,” which is a reasonable answer given the nature of the question.
Among retirees who provided a specific age, the median age they are planning to live to is 90. Fourteen percent
of retirees plan to live to age 100 or older.
Many Retirees Are “Not Sure” to What Age They Plan to Live
RETIREE BASE: 20TH ANNUAL SURVEY - ALL QUALIFIED RESPONDENTSQ2785. What age are you planning to live to?
<1 2 311
17 14
53
Age <60 60-69 70-79 80-89 90-99 100+ Not Sure
All Retirees (N=2,040)
Median Age: 90
Planning to Live to Age (%)
61
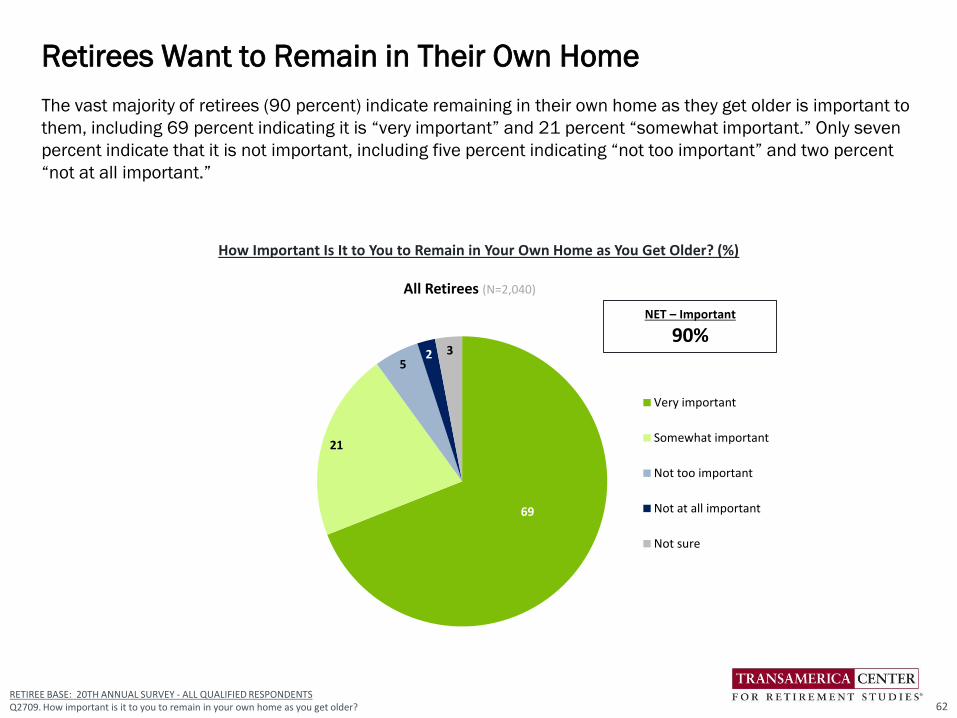
The vast majority of retirees (90 percent) indicate remaining in their own home as they get older is important to
them, including 69 percent indicating it is “very important” and 21 percent “somewhat important.” Only seven
percent indicate that it is not important, including five percent indicating “not too important” and two percent
“not at all important.”
Retirees Want to Remain in Their Own Home
RETIREE BASE: 20TH ANNUAL SURVEY - ALL QUALIFIED RESPONDENTSQ2709. How important is it to you to remain in your own home as you get older?
How Important Is It to You to Remain in Your Own Home as You Get Older? (%)
69
21
52 3
Very important
Somewhat important
Not too important
Not at all important
Not sure
All Retirees (N=2,040)
NET – Important
90%
62

Three in four retirees (75 percent) own their homes, while 22 percent rent and two percent live with relatives or
friends.
Seventy-three percent of retirees currently live in a single family home, while 19 percent live in a multi-unit
apartment or condo. Only four percent live in a retirement community.
The Majority of Retirees Own Their Homes
RETIREE BASE: 20TH ANNUAL SURVEY - ALL QUALIFIED RESPONDENTSQ2712. Do you own or rent your home?Q2710. What type of home do you currently live in?
Type of Home Living in During Retirement (%)
73
19
44
Single family home
Multi-unit apartment orcondominium complex
Retirement community
Other
All Retirees (N=2,040)
12
22
75Own
Rent
Neither - I live withrelatives or friends
Other
Own vs. Rent Home (%)
All Retirees (N=2,040)
63
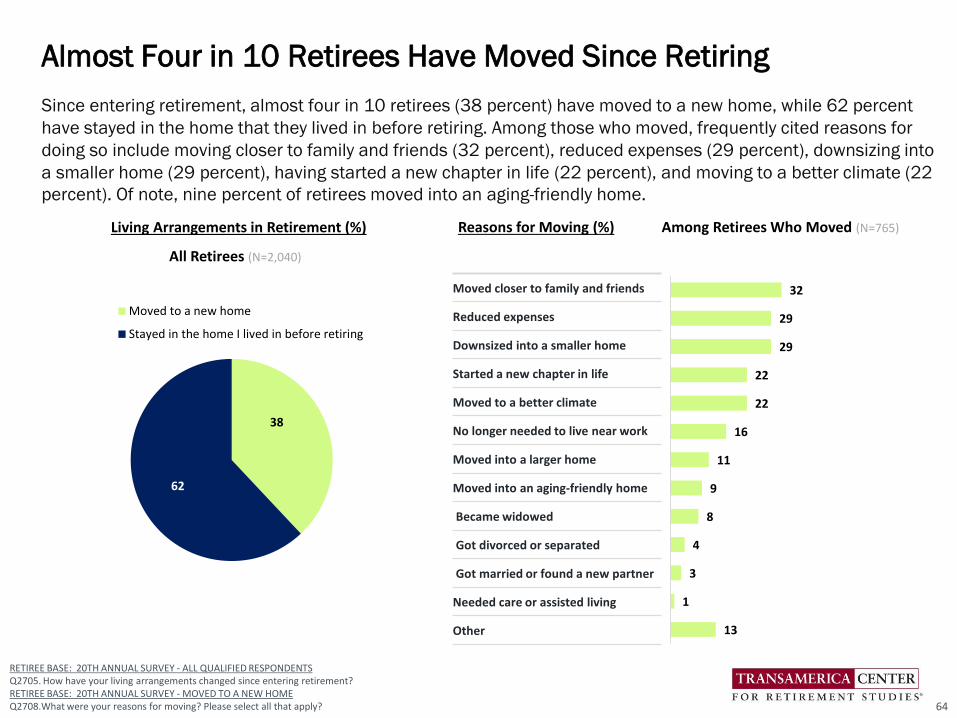
Reasons for Moving (%) Among Retirees Who Moved (N=765)
Moved closer to family and friends
Reduced expenses
Downsized into a smaller home
Started a new chapter in life
Moved to a better climate
No longer needed to live near work
Moved into a larger home
Moved into an aging-friendly home
Became widowed
Got divorced or separated
Got married or found a new partner
Needed care or assisted living
Other
Since entering retirement, almost four in 10 retirees (38 percent) have moved to a new home, while 62 percent
have stayed in the home that they lived in before retiring. Among those who moved, frequently cited reasons for
doing so include moving closer to family and friends (32 percent), reduced expenses (29 percent), downsizing into
a smaller home (29 percent), having started a new chapter in life (22 percent), and moving to a better climate (22
percent). Of note, nine percent of retirees moved into an aging-friendly home.
Almost Four in 10 Retirees Have Moved Since Retiring
RETIREE BASE: 20TH ANNUAL SURVEY - ALL QUALIFIED RESPONDENTSQ2705. How have your living arrangements changed since entering retirement?RETIREE BASE: 20TH ANNUAL SURVEY - MOVED TO A NEW HOMEQ2708.What were your reasons for moving? Please select all that apply?
38
62
Moved to a new home
Stayed in the home I lived in before retiring
Living Arrangements in Retirement (%)
All Retirees (N=2,040)
32
29
29
22
22
16
11
9
8
4
3
1
13
64
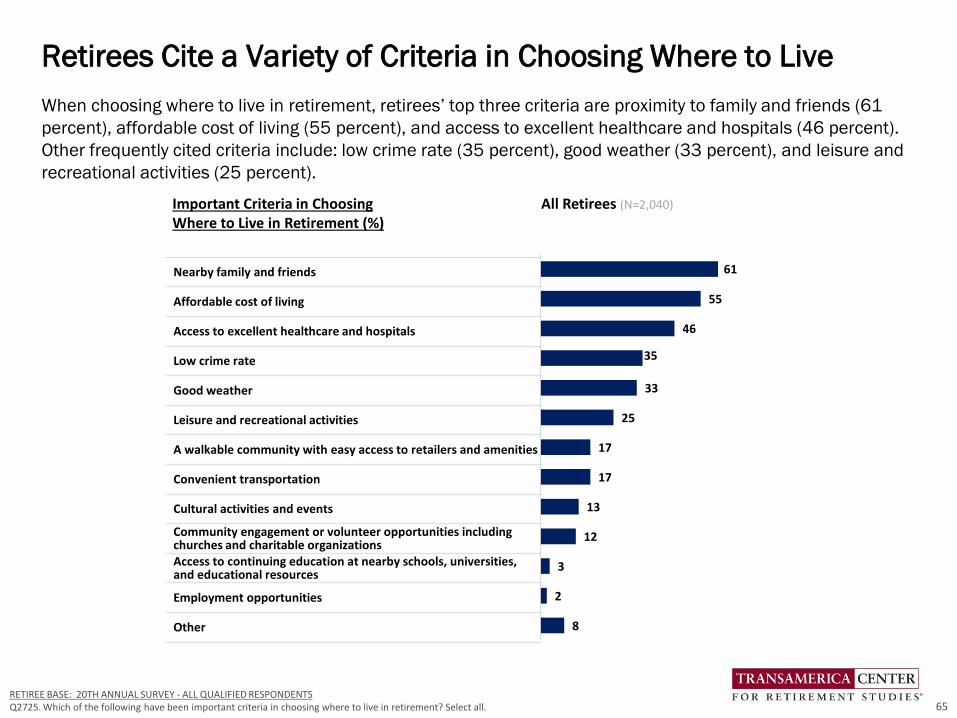
Important Criteria in Choosing Where to Live in Retirement (%)
All Retirees (N=2,040)
Nearby family and friends
Affordable cost of living
Access to excellent healthcare and hospitals
Low crime rate
Good weather
Leisure and recreational activities
A walkable community with easy access to retailers and amenities
Convenient transportation
Cultural activities and events
Community engagement or volunteer opportunities including churches and charitable organizationsAccess to continuing education at nearby schools, universities, and educational resources
Employment opportunities
Other
When choosing where to live in retirement, retirees’ top three criteria are proximity to family and friends (61
percent), affordable cost of living (55 percent), and access to excellent healthcare and hospitals (46 percent).
Other frequently cited criteria include: low crime rate (35 percent), good weather (33 percent), and leisure and
recreational activities (25 percent).
Retirees Cite a Variety of Criteria in Choosing Where to Live
RETIREE BASE: 20TH ANNUAL SURVEY - ALL QUALIFIED RESPONDENTSQ2725. Which of the following have been important criteria in choosing where to live in retirement? Select all.
61
55
46
35
33
25
17
17
13
12
3
2
8
65

While 53 percent of retirees currently live with their spouse/partner, more than a third (35 percent) live alone.
Ten percent live in the same household with their children, four percent with their grandchildren, and four
percent with other relatives. Among retirees who currently live with others who are not their spouse/partner, 54
percent indicate that the other person(s) moved into their residence, while 18 percent of retirees moved into
the other person’s residence, and 28 percent indicate that they and the other person(s) all moved into a
different residence.
Most Retirees Live With Spouse/Partner or Alone
RETIREE BASE: 20TH ANNUAL SURVEY - ALL QUALIFIED RESPONDENTSQ2715. Who do you currently live with in your household? Select all.RETIREE BASE: 20TH ANNUAL SURVEY - CURRENTLY LIVING WITH OTHERS WHO ARE NOT SPOUSE/PARTNERQ2717. You mentioned you are currently living with others who are not a spouse or partner in your household. Did you move into their residence or did they move into your residence?
Who Do You Currently Live With in Your Household? (%)
All Retirees (N=2,040)
My spouse/partner
Alone
My children
My grandchildren
Other relatives
Friends or acquaintances
Other
53
35
10
4
4
2
2
66
Did You Move Into Their Residence or Did They Move Into Your Residence? (%)
54
18
28
They moved into my residence
I moved into their residence
We all moved into a different residence
Among Retirees Who Are Currently Living With Others (Excluding Spouse or Partner) (N=404)

When and How Retirement Happened
67

What Prompted You to Decide That it Was Time to Retire?
RETIREE BASE: 20TH ANNUAL SURVEY - ALL QUALIFIED RESPONDENTSQ1565. What prompted you to decide that it was time to retire? 68
It was time!
Age 79, Male, Retired at 65
Job loss, compounded by the need forparental caregiving - it just didn’t make sense
to pursue a new professional position at that time.
Age 59, Male, Retired at 57
My husband had alreadybeen retired for six years.
The timing was good for my workplace so I was able to
retire in my terms.
Age 63, Female, Retired at 60
I was prepared for retirement both financially and
psychologically. It was time.
Age 69, Male, Retired at 62
I was under a lot of stressfrom the last job and decided that
if I had waited until I was 65 to retire,I would probably have a heart attack
and/or stroke before then.
Age 77, Female, Retired at 62
I had planned the age in advance.
Age 63, Female, Retired at 63
I was unhappy with changes atmy place of employment and after meeting with
my financial planner (and being able to have medical coverage under COBRA until I was of age to go on
Medicare), I was sure that I could retire and maintainmy standard of living.
Age 66, Male, Retired at 63
I would have keptworking if there had not been
major changes at the company I was with. My income and hours were cut drastically. My family and I decided to relocate to a different state where the
cost of living is much lower.
Age 72, Female, Retired at 65

Ninety-four percent of retirees are fully retired and six percent consider themselves semi-retired. Among those
who are fully retired, the median age at which they retired is 63. More than half of the fully retired (54 percent)
retired before age 65. Seventeen percent retired at age 65. Twenty-five percent retired after age 65, including
11 percent who retired between ages 66 and 69, 12 percent who retired in their 70s, and two percent who fully
retired at age 80 or older. Four percent of the fully retired say they do not expect to ever stop working.
More Than Half Retired Before Age 65
RETIREE BASE: 20TH ANNUAL SURVEY - ALL QUALIFIED RESPONDENTSQ1601A. Do you consider yourself to be…RETIREE BASE: 20TH ANNUAL SURVEY - FULLY RETIRED RESPONDENTQ915. At what age did you consider yourself fully retired or no longer working?
94
6
Fully retired Semi-retired
Do You Consider Yourself to Be… (%)
All Retirees (N=2,040)
69
1013
31
17
119
3 24
BeforeAge 55
55-59 60-64 65 66-69 70-74 75-79 80+ Althoughfully
retired,I do not
expect toever stopworking
Median: Age 63
Age Considered Self to Be Fully Retired or No Longer Working (%)
Among Those Self-Identified as Being Fully Retired (N=1,841)

Reasons for Working in Retirement Include Health and Financial
70RETIREE BASE: 20TH ANNUAL SURVEY - RETIRED AFTER 65 OR PLANNING TO RETIRE AFTER 65Q1530. What are your reason(s) for working in retirement or past age 65? Select all.
Reasons for Working in Retirement or Past Age 65 (%) Among Those Who Have or Plan to Retire After Age 65N=510
NET – Financial-related reasons
I want the income
Concerned that Social Security will be less than expected
Can’t afford to retire because I haven’t saved enough
Need health benefits
Concerned that employer retirement benefits will be less than expected
Anxious about volatility in financial markets and investment performance
NET – Healthy-aging related reasons
Be active
Enjoy what I do
Keep my brain alert
Have a sense of purpose
Maintain social connections
Personal development
None of the above
67
56
20
19
15
6
3
66
51
44
41
29
18
10
19
Among retirees who retired after age 65 or plan to do so, their rationales for doing so are nearly evenly split
between financial-related reasons (67 percent) and healthy aging-related reasons (66 percent). The five most
often cited specific reasons are: wanting the income (56 percent), being active (51 percent), enjoying what they
do (44 percent), keeping their brain alert (41 percent), and having a sense of purpose (29 percent).

When asked how their transition into
retirement is happening or happened,
nearly two in five (39 percent) immediately
stopped work when they reached a specific
age (33 percent) or amount of money (6
percent).
Nineteen percent transitioned into
retirement either by working in a different
capacity that is less demanding or brings
more personal satisfaction (10 percent) or
working reduced hours with more leisure
time to enjoy life (9 percent).
Twenty percent continued to work in
retirement as long as possible until they
could no longer work anymore.
Nearly Two in Five Retirees Immediately Stopped Working
RETIREE BASE: 20TH ANNUAL SURVEY - ALL QUALIFIED RESPONDENTSQ1546. How did your transition into retirement take place?/How is your transition into retirement taking place?
22
6
33
9
10
20
All Retirees
Continued working as long aspossible until I can/could no longerwork anymore
Continued working as long aspossible in a different capacity thatwas less demanding and/or broughtgreater personal satisfaction
Continued working as long aspossible but with reduced workhours with more leisure time toenjoy life
Immediately stopped working onceI reached a specific age and beganpursuing retirement dreams
Immediately stopped working onceI saved a specific amount of moneyand began pursuing retirementdreams
Not sure
NET Immediately
Stopped
39%
NET Transitioned
19%
N=2,040
How did your transition into retirement take place? (%)
71

The majority of retirees (58 percent) retired sooner than they had planned. Approximately one in three retirees
(36 percent) indicate they retired when they had planned to do so. Six percent retired later than planned.
The Majority Retired Sooner Than Planned
RETIREE BASE: 20TH ANNUAL SURVEY - ALL QUALIFIED RESPONDENTSQ1547. Did you enter into retirement/semi-retirement when you had planned?
Did you retire when you had planned? (%)
All Retirees (N=2,040)
58
36
6
I retired sooner than planned
I retired when planned
I retired later than planned
72
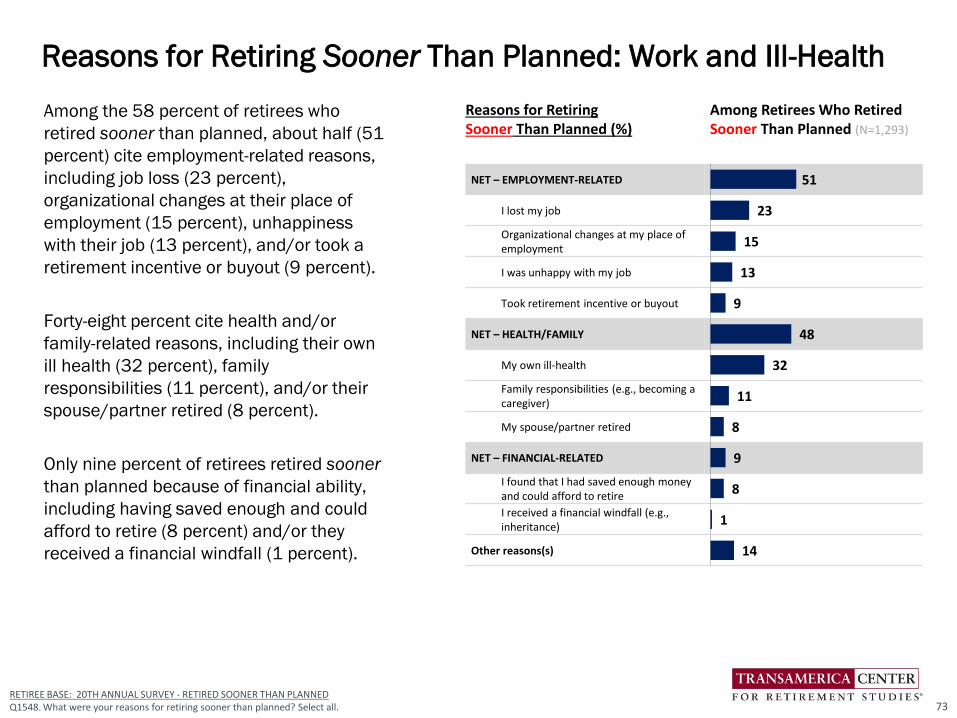
Among the 58 percent of retirees who
retired sooner than planned, about half (51
percent) cite employment-related reasons,
including job loss (23 percent),
organizational changes at their place of
employment (15 percent), unhappiness
with their job (13 percent), and/or took a
retirement incentive or buyout (9 percent).
Forty-eight percent cite health and/or
family-related reasons, including their own
ill health (32 percent), family
responsibilities (11 percent), and/or their
spouse/partner retired (8 percent).
Only nine percent of retirees retired sooner
than planned because of financial ability,
including having saved enough and could
afford to retire (8 percent) and/or they
received a financial windfall (1 percent).
Reasons for Retiring Sooner Than Planned: Work and Ill-Health
RETIREE BASE: 20TH ANNUAL SURVEY - RETIRED SOONER THAN PLANNEDQ1548. What were your reasons for retiring sooner than planned? Select all.
Reasons for Retiring Sooner Than Planned (%)
Among Retirees Who Retired Sooner Than Planned (N=1,293)
NET – EMPLOYMENT-RELATED
I lost my job
Organizational changes at my place of employment
I was unhappy with my job
Took retirement incentive or buyout
NET – HEALTH/FAMILY
My own ill-health
Family responsibilities (e.g., becoming a caregiver)
My spouse/partner retired
NET – FINANCIAL-RELATED
I found that I had saved enough money and could afford to retire
I received a financial windfall (e.g., inheritance)
Other reasons(s)
51
23
15
13
9
48
32
11
8
9
8
1
14
73

Among the small proportion (6 percent) of
retirees who retired later than planned, 62
percent cite financial-related reasons. The
most frequently cited financial reason is
needing the income (42 percent), followed by
hadn’t saved enough for retirement (21
percent), Social Security less than expected
(16 percent), and general anxieties about their
financial situation (14 percent).
Sixty-five percent of retirees who retired later
than planned cite healthy aging-related
reasons, including enjoying their work (49
percent), staying active (49 percent), and
keeping their brain alert (37 percent).
Twenty-five percent indicate that their
employer requested that they stay longer.
Seven percent indicate their spouse/partner
retired sooner than planned.
Reasons for Retiring Later Than Planned: Financial and Health
RETIREE BASE: 20TH ANNUAL SURVEY - RETIRED LATER THAN PLANNEDQ1550. What were your reasons for retiring later than planned? Select all. 74
Reasons For Retiring Later Than Planned (%)
Among Retirees Who Retired Later Than Planned* (N=114)
NET – HEALTHY-AGING RELATED
Staying active
Enjoying my work
Keeping my brain alert
NET – FINANCIAL-RELATED
Needing the income
I hadn't saved enough for retirement
Social Security less than expected
General anxieties about my financial situation
Needing employee health benefits
Employer benefits less than expected
Recovering from a major financial setback
Making up for time out of the workforce
My employer requested that I stay longer
My spouse/partner retired sooner than planned
Other reasons(s)
65
49
49
37
62
42
21
16
14
9
5
3
2
25
7
12
75
Looking Back on Financial Preparations for
Retirement

Thirty percent of retirees started saving before the age of 40, while 39 percent started saving in their forties or
older. An alarming 31 percent of retirees indicate they did not save for retirement. Among retirees who saved
for retirement, they first started saving at age 40 (median).
Retirees Started Saving at Age 40 – And Some Never Saved
RETIREE BASE: 20TH ANNUAL SURVEY - ALL QUALIFIED RESPONDENTSQ790. At what age did you first start saving for retirement?
2
12
16 17 16
5
1
31
Age <20 20-29 30-39 40-49 50-59 60-69 70+ I did not savefor retirement
Age First Started Saving for Retirement (%)
All Retirees (N=2,040)
76
Median: Age 40

For the majority of their working careers, 63 percent of retirees participated in one or more forms of employer-
sponsored retirement benefits, including 47 percent who participated in a 401(k) or similar plan and 36 percent
who participated in a company-funded defined benefit plan. However, a large minority of retirees (37 percent)
worked for employers that did not offer any retirement benefits.
Nearly Two-Thirds Participated in Workplace Retirement Plans
RETIREE BASE: 20TH ANNUAL SURVEY - ALL QUALIFIED RESPONDENTSQ1180. Which of the following retirement benefits at your employer(s) did you participate in for the majority of your working career? Select all.
Participation in Retirement Benefits for the Majority of Working Career (%)
All Retirees (N=2,040)
NET – EMPLOYEE-FUNDED PLAN
Employee-funded 401(k) plan
Other employee self-funded plan (e.g., SIMPLE, SEP)
NET – COMPANY-FUNDED DEFINED BENEFIT PLAN
Company-funded defined benefit pension plan
Company-funded cash balance plan
Other
None. My employer did not offer any retirement benefits.
47
43
5
36
34
4
4
37
NET – Had Any Retirement Benefits
63%
77

The majority of retirees (59 percent) saved for retirement outside of work.
Six in 10 Retirees Saved for Retirement Outside of Work
RETIREE BASE: 20TH ANNUAL SURVEY - ALL QUALIFIED RESPONDENTSQ740. Before entering retirement, did you save for retirement outside of work, such as in an IRA, mutual fund, bank account, etc.?
59
41
Yes
No
All Retirees (N=2,040)
Saved for Retirement Outside of Work (%)
78

RETIREE BASE: 20TH ANNUAL SURVEY - ALL QUALIFIED RESPONDENTSQ1160. Which of the following best describes your financial strategy for retirement before retiring?
Fifty-four percent of retirees had a financial strategy for retirement before they retired. However, among them
only 12 percent had a written plan, while 42 percent had a plan but it was not written down. Forty-six percent
did not have a retirement strategy.
Only One in 10 Had a Written Strategy Before Retiring
Financial Strategy for Retirement Before Retiring (%)
12
42
46
I had a written plan
I had a plan, but it was notwritten down
I did not have a plan
All Retirees (N=2,040)
NET – Had a Financial Strategy
54%
79

Before retiring, three in 10 retirees (31 percent) used a professional financial advisor to help them manage
their retirement savings or investments.
Three in 10 Used a Financial Advisor Before Retiring
RETIREE BASE: 20TH ANNUAL SURVEY - ALL QUALIFIED RESPONDENTSQ1521. Before retiring/semi-retiring, did you use a professional financial advisor to help manage your retirement savings or investments?
Before Retiring, Did You Use a Professional Financial Advisor to Help Manage Your Retirement Savings or Investments? (%)
31
69
Yes
No
All Retirees (N=2,040)
80

Nearly two-thirds of retirees (64 percent) say their most recent employers did “nothing” to help pre-retirees transition
into retirement and 20 percent are “not sure” what their employers did. Among the few whose employers helped pre-
retirees, the most frequently cited offerings are seminars and education about transitioning into retirement (6
percent), financial counseling about retirement (5 percent), the ability to reduce work hours and shift from full- to part-
time (4 percent), accommodating flexible work schedules and arrangements (4 percent), and encourage succession
planning, training and mentoring (4 percent).
Two-Thirds Say Their Employers Did “Nothing” to Help Transition
RETIREE BASE: 20TH ANNUAL SURVEY - ALL QUALIFIED RESPONDENTSQ1533. In which of the following ways, if any, does your current or most recent employer help its pre-retirees transition into retirement? Select all.
How Employers Help Pre-Retirees Transition Into Retirement (%)
All Retirees (N=2,040)
Provides seminars and education about transitioning into retirement
Offers financial counselling about retirement
Enables employees to reduce work hours and shift from full-time to part-time
Accommodates flexible work schedules and arrangements
Encourages employees to participate in succession planning, training and mentoring
Offers retirement-oriented lifestyle and transition planning resources
Enables employees to take positions that are less stressful or demanding
Provides information about encore career opportunities
Other
Nothing
Not sure
6
5
4
4
4
3
2
1
2
64
20
81
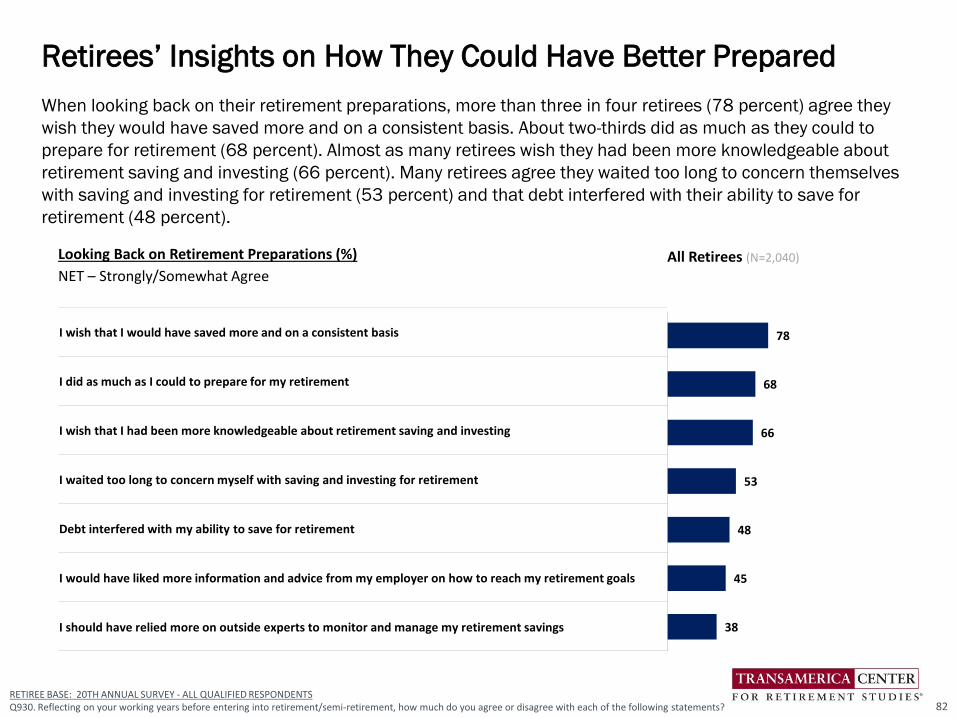
When looking back on their retirement preparations, more than three in four retirees (78 percent) agree they
wish they would have saved more and on a consistent basis. About two-thirds did as much as they could to
prepare for retirement (68 percent). Almost as many retirees wish they had been more knowledgeable about
retirement saving and investing (66 percent). Many retirees agree they waited too long to concern themselves
with saving and investing for retirement (53 percent) and that debt interfered with their ability to save for
retirement (48 percent).
Retirees’ Insights on How They Could Have Better Prepared
Looking Back on Retirement Preparations (%)
NET – Strongly/Somewhat AgreeAll Retirees (N=2,040)
I wish that I would have saved more and on a consistent basis
I did as much as I could to prepare for my retirement
I wish that I had been more knowledgeable about retirement saving and investing
I waited too long to concern myself with saving and investing for retirement
Debt interfered with my ability to save for retirement
I would have liked more information and advice from my employer on how to reach my retirement goals
I should have relied more on outside experts to monitor and manage my retirement savings
RETIREE BASE: 20TH ANNUAL SURVEY - ALL QUALIFIED RESPONDENTSQ930. Reflecting on your working years before entering into retirement/semi-retirement, how much do you agree or disagree with each of the following statements?
78
68
66
53
48
45
38
82

Appendix: A Demographic Portrait of Retirees
83

A Portrait of Retirees
*The June 2020 supplemental survey shows Hispanic status separate from race categorization.
RETIREE BASE: 20TH ANNUAL SURVEY and JUNE 2020 SUPPLEMENTAL SURVEY - ALL QUALIFIED RESPONDENTS
Characteristics20th Annual
All Retirees (%)N=2,040
June 2020All Retirees (%)
N=411Gender Male 41 43
Female 57 57
Transgender 1 <1
Other <1 n/a
Decline to answer <1 n/a
Marital Status Married/ Living with partner 54 56
Divorced/Separated/Widowed 40 38
Never married 6 6
Level of Education Less Than High School Diploma 2 7
High School Diploma 52 45
Some College or Trade School 25 26
College Graduate or More 21 22
Annual Household Income Less than $25,000 27 28
$25,000 to $49,999 29 30
$50,000 to $99,999 23 26
$100,000+ 13 15
Not sure 2 n/a
Decline to Answer 6 1
Estimated Median $29,000 $37,000
General Health (Self-Described)
Excellent 11 9
Good 62 66
Fair 23 21
Poor 4 4
Sexuality LGBT 3 3
Did not identify as LGBT 95 95
Decline to Answer 2 2
Race* White 83 88
Black/African American 6 5
Asian/Pacific Islander 3 2
Hispanic 6 6
Native America/Alaskan Native <1 1
Other Race <1 3
Decline to Answer 2 1
Receiving Long-Term Care Assistance
Yes 2 n/a
No 97 n/a
Not sure 1 n/a
84
