retirement and cognitive function - pension research council · retirement and cognitive function...
TRANSCRIPT

Retirement and Cognitive Function
Raquel Fonseca, Arie Kapteyn, and Gema Zamarro
May 2016
PRC WP2016
Pension Research Council Working Paper
Pension Research Council
The Wharton School, University of Pennsylvania
3620 Locust Walk, 3000 SH-DH
Philadelphia, PA 19104-6302
Tel.: 215.898.7620 Fax: 215.573.3418
Email: [email protected]
All findings, interpretations, and conclusions of this paper represent the views of the author(s) and not those of
the Wharton School or the Pension Research Council. © 2016 Pension Research Council of the Wharton School
of the University of Pennsylvania. All rights reserved.

Retirement and Cognitive Function
Raquel Fonseca, Arie Kapteyn, and Gema Zamarro
Abstract
We survey the recent literature on the effects of retirement on cognitive functioning at older
ages. We describe results from studies using similar data sets (HRS, SHARE and ELSA),
definitions of cognition, and instruments to capture causal effects. The studies yield widely
varying results. Most papers find that being retired leads to a decline of cognition, controlling
for different specifications of age functions and other covariates. However, richer
specifications using fixed effects, dynamic specifications, or alternative specifications of
instrumental variables often lead to large changes in the size and significance of the estimated
effects. We replicate several of these results using the same data sets. We discuss the factors
that are likely causing the differences across specifications, including endogeneity of right hand
side variables, and heterogeneity across gender, occupation or skill levels.
Raquel Fonseca
RAND Corporation
1776 Main Street
M5e Room: 5107
Santa Monica, CA 90407
Email: [email protected]
Arie Kapteyn
Center for Economic and Social Research
635 Downey Way
Los Angeles, CA 90089-3332
Gema Zamarro
University of Arkansas
219B Graduate Education Building
College of Education and Health
Professions
Fayetteville, AR 72701

73
Does Retirement Affect Cognitive Function?
The topic of how retirement affects cognitive function has attracted much interest over the
last decade. The subject is of interest for at least two key reasons. First is the desire for a better
understanding of the effect of prolonging working life at older ages on well-being. Second is
interest in the policy implications of these effects on how countries deal with underfunded
retirement plans and aging populations. Encouraging individuals to delay retirement could have
significant financial and non-financial (e.g. health and well-being) implications for individuals and
societies. Given the importance of this topic, this chapter surveys the recent literature on the effects
of retirement on cognitive functioning at older ages, and then it assesses the robustness of estimates
of the effect of retirement on cognitive capability.
It is fair to say that there is no clear consensus in the literature on the effect of retirement
on cognitive functioning. Some studies find that being retired leads to a decline in cognition, but
richer specifications (i.e., including fixed effects, dynamic specifications, or alternative
specifications of instrumental variables) often lead to large changes in the size and significance of
the estimated effects. Other papers find a negative effect of retirement on cognition (e.g.
Rohwedder and Willis 2010; Bonsang et al. 2012, Mazzonna and Peracchi 2012, 2014), while still
other studies find small or even positive effects, especially when these are disaggregated by
different types of occupations (e.g. Coe et al. 2012, Bianchini and Borella 2014). Other papers find
significant effects only for women (Coe and Zamarro 2011).
The present study uses data sets across several countries – namely the U.S. Health and
Retirement Study (HRS), the English Longitudinal Study of Aging (ELSA), and the Survey of
Health, Ageing and Retirement in Europe (SHARE) – to replicate several of these analyses. Our
goal is to get a better understanding of the sources of the different effects found in the literature.
We show that results are very sensitive to differences in econometric specifications. In particular,
74
the use of country fixed-effects to control for unobserved country differences tends to reduce the
estimated effect of retirement on cognition dramatically, suggesting that unobserved differences
across countries affect both retirement ages and cognitive decline. This remains true for different
subgroups including blue collar/ white collar jobs; physically demanding jobs; or high skilled jobs.
In what follows, we first survey the empirical literature on aging and cognitive functioning.
Second, we summarize results found in prior empirical literature on the effect of retirement on
episodic memory. We focus on studies using similar datasets (HRS, SHARE and ELSA),
definitions of cognition, and instrumental variables to capture causal effects. Third, we replicate
several of these results using the same datasets. We discuss the factors that appear to explain
differences found across papers that use different specifications, including the endogeneity of right
hand side variables, and heterogeneity across gender, occupation, or skill levels. Finally, we
conclude.
Measuring Cognitive Function and its Determinants
Our goal is to understand whether being retired affects cognitive functioning. In this section,
we first briefly describe the different measures of cognitive functioning used in the literature we
survey. Second, we summarize the main findings in the literature on aging and cognition, as well
as the main factors affecting cognitive abilities and its decline.
Cognitive functioning. Following the psychological theory on cognition (Cattel-Horn-Carrol
theory),1we identify two types of cognitive functioning: fluid intelligence, and crystallized
intelligence. Fluid intelligence involves processes related to recall, in particular, episodic memory,
i.e working memory, including long-term memory and how fast we process information (perceptual
speed).2 Crystallized intelligence relates to our knowledge and verbal learning, primarily affected
by education. Crystallized intelligence seems to be rather stable over time and can even improve

75
with age (Hertzog et al. 2008; Dixon et al. 2004; Park et al. 2002; Schaie 1994), while fluid
intelligence is more likely to decline with age (Anderson and Craik, 2000; Prull et al. 2000). The
environment can also affect memory at older ages, as well as the intellectual stimulus individuals
face routinely (Salthouse 2006, 2009; Small 2002; van Praag et al. 2000). Most economic studies
on cognitive function focus on fluid abilities likely to affect dementing illnesses such as memory
or attention (Morris et al. 2001; Adam, Van der Linden, et al. 2007b). The decline in fluid cognition
may affect individual decision making and adversely affect well-being. The papers discussed below
all use similar measures of cognitive functioning, namely on immediate and delayed recall.
Prior evidence on cognitive functioning, aging, and factors other than retirement. To better
understand how the process of aging can affect cognitive functioning, we describe findings across
several disciplines including psychology, epidemiology, gerontology, neuroscience, and
economics. Schaie (1989), who reviewed findings from the Seattle Longitudinal Study on adult
cognitive development, found an important decline in cognitive functioning at later ages. This
decline in cognitive abilities with age was also documented by Hertzog et al. (2008); Bäckman et
al. (2005); Dixon et al. (2004); Peterson et al. (2002); Anderson and Craik (2000); Prull et al. (2000)
and Schaie (1994), among others. Demographic variables such as gender may correlate with
cognitive functioning as well, although results in the literature are mixed. Lei et al. (2012) found
lower cognitive functioning for women than for men; Johnson and Bouchard (2007) reported better
memory among women than among men; and Halpern (2012) showed small or no evidence of
cognitive functioning differences by gender.
Cognitive reserve refers to the phenomenon that people whose brains show extensive
Alzheimer’s pathology may have manifested very little clinical cognitive impairment when alive.
Evidence suggests that education, activities, and occupation can affect peoples’ cognitive reserve
(e.g., Stern 2002, 2003). The role of education in cognition has been studied by Banks and

76
Mazzonna (2012), Maurer (2010), McFadden (2008), and Evans et al. (1993), among others. Other
factors, such as leisure activities, lifestyle, behavior, and social networks, may also affect cognitive
functioning and have also studied in the literature.3
Does Retirement affect Cognitive Functioning?
A main reason economists seek to evaluate whether retirement affects cognitive functioning
is that they seek to understand how retirement might affect well-being at older ages and possibly
to extend employees’ working lives. During recent decades, many countries have increased
retirement eligibility ages for public pensions and/or are switching from defined benefit to defined
contribution pension systems. These reforms can have different effects upon countries and
individuals, including peoples’ employment decisions. If employment status were to have an effect
on individuals’ cognitive functioning, the implications for policy-making would differ depending
on the direction of the effect. For instance, if staying longer in the labor market were thought to
be protective of memory capacity, encouraging workers to work longer would support pension
system financial sustainability (Dave et al. 2008; Bonsang et al. 2012). It could also potentially
reduce health care and long-term care expenditures, assuming that implied memory loss is related
to increased risk of dementia and increases in disability (Albert et al. 2002; Lyketsos et al. 2002;
Tabert et al. 2002). It would further aid autonomy and the capacity for sound financial decisions,
including saving decisions (Christelis et al. 2010; Banks et al. 2010; Brown et al. 2012), and more
generally it would enhance well-being and quality of life at later ages (OECD 2013).
Prior studies reach conflicting conclusions on the effects of retirement on memory, both
with respect to the sign and size of the effect. The studies we review here use comparable measures
of cognitive abilities, although they differ in their definitions of retirement. Commonly-used
datasets are (1) the Health and Retirement Study (HRS) for the U.S.; (2) the English Longitudinal

77
Study of Ageing (ELSA) for England; and (3) the Survey of Health, Ageing and Retirement
(SHARE) for Europe. 44
One of the first studies of the effect of retirement on cognitive function was by Adam et al.
(2007a). Using HRS, SHARE, and ELSA data for the year 2004, they reported a negative effect
of retirement on a word recall test. They used the sum of the number of correct answers on an
immediate 10-item word recall test and the number of correct answers to the same list of items,
about 10 minutes later. They considered both individual retirement status and how long (s)he had
been retired. Their analysis did not provide a causal interpretation of the impact of retirement on
cognitive abilities.
Table 4.1 summarizes nine recent studies on the same topic. As one can see, the studies
differ with respect to the number of countries used in the analysis; whether the analysis was solely
based on a cross section of countries, or whether longitudinal data were used; the age range
considered; and whether men and women were analyzed separately. Some studies differentiated
between blue and white collar jobs before retirement (i.e., Mazzona and Peracchi 2014 and
Bianchini and Borella 2014).
Insert Table 4.1 here
All the studies in the table defined cognitive functioning with the measure used by Adam
et al. (2007a), i.e. the sum of immediate and delayed recalled words from a list of 10 words. We
denote this variable simply as ‘word recall’ from now on, and it ranges from 0 to 20.5, 6
Three main definitions of retirement can be identified. The first focuses on self-reported
labor force status. Sometimes this definition also takes into account whether individuals are
receiving old age pension benefits. ‘Retired’ is generally defined as a (0, 1) dummy variable. A
second definition follows Lazear (1986) by equating being retired as not working for pay. The third
definition is a continuous variable related to retirement duration.7 Most authors measure retirement
78
duration as the elapsed time between the individual’s retirement date and interview date (Coe et al.
2012) and/or the elapsed time since the last job ended (Bonsang et al. 2012).
All studies control for age in some form. While Rohwedder and Willis (2010) and Bonsang
et al. (2012) did control for age, they did not explore the effects of other covariates. By contrast, as
table 4.1 shows, other studies included a large number of other covariates including years of
schooling, demographic, socio-economic status (SES hereafter), health, country dummies, wave
dummies, cohort, and regional dummies.
Some authors allow for what is called a ‘honeymoon phase’ (Atchley 1976, 1982), which
refers to the fact that, when people first retire, they often spend more time engaging in activities
that they lacked time for when working. These activities could have a positive effect on their
cognitive abilities or delay their decline. Though this phase does not last long (Ekerdt et al. 1983;
Gall et al. 1997; Mein et al. 2003; Mojon-Azzi et al. 2007; Westerlund et al. 2010), it must be taken
into account when analyzing the relationship between retirement and cognition (Bonsang et
al.2012; Mazzonna and Peracchi 2012, 2014; Bianchini and Borella 2014). Occupational
characteristics such as being a blue-collar worker or having a physically demanding job can also
affect cognitive functioning differently from those associated with being a white-collar worker or
having an intellectually engaging job (Jorm et al 1998; Potter et al. 2008). Several studies (Coe et
al. 2012; Mazzonna and Peracchi 2014, and Bianchini and Borella 2014) have evaluated how
occupation can mediate the effect of retirement on cognitive functioning.
Retirement and Cognitive Function: Causal or Not?
Most authors begin with a descriptive analysis showing correlations of retirement and
cognition. For instance, Rohwedder and Willis (2010) and Adam et al. (2007a) documented a
positive relationship between working and cognitive functioning. Both studies compared the

79
employment rates of men age 60-64 and 50-54, and they noted a fall in the number of words recalled
by men age 60-64 relative to men age 50-54 across a number of SHARE countries, England, and
the US. When Adam et al. (2007a) controlled for occupational activities, they found that not
working was negatively and significantly correlated with recall. Rohwedder and Willis (2010),
using working for pay versus not working as their retirement variable, found that retired
individuals’ memory scores decreased by an average of 4.9 words (on a 0-20 scale) with retirement.
Coe and Zamarro (2011) used a broad retirement definition including as retirees retired,
homemakers, disabled and sick individuals out of the labor force as retirees. This variable was
conditioned on having been working for pay at age 50. Their study confirmed a significant but
small negative association between retirement and cognition when demographics, SES, and health
controls were included (the estimated coefficient implied a 0.28 reduction in the number of words
recalled out of 20, significant at 5%). Effects of retirement on verbal fluency were found to be
insignificant. The cross-country analyses undertaken in these three papers were based exclusively
on data from 2004.
Coe et al. (2012) and Bonsang et al. (2012), focus only on US HRS panel data, and they
used a continuous retirement duration variable as an explanatory variable instead of the retirement
dummy. Coe et al. (2012) found no significant correlation of word recall and retirement for blue-
collar workers, but they did find a highly significant small negative correlation for white-collar
workers (-0.04 fewer words recalled on a 0-20 scale). They also explored other cognitive function
indicators such as numeracy and self-rated memory, and found similar results. Mazzona and
Peracchi (2012) separately examined immediate and delayed recall as well as an ‘orientation in
time’ variable, and verbal fluency and numeracy. They found a significant but small negative
correlation of retirement duration on both immediate recall and delayed recall [-0.010* to -
0.018*** fewer words on a 0-10 scale].

80
These results are interesting but cannot be interpreted as causal because cognitive
endowments could affect both cognitive functioning outcomes and retirement decisions. For
instance, less educated individuals or people with more physically demanding jobs might retire
earlier than highly educated individuals or individuals with more intellectually challenging jobs
(Glymour et al. 2008; Evans et al. 1993; Jorm et al. 1998; Potter et al. 2008). Additionally, common
factors like preferences, behavior, or health could affect both retirement and cognitive abilities
(Frederik 2005; Benjamin et al. 2006; Dohmen et al. 2007). To address these issues, some authors
also analyzed the effect of retirement on cognition using instrumental variable (IV) approaches.
Eligibility ages for both early and full pension benefits were typically used as instruments, derived
from the institutional information in Pensions at a Glance (OECD 2011) and/or provided by the
US Social Security Administration (2014). The instruments used capture the timing of eligibility
for public pensions, and most of the studies used these policy variables in relation to the interview
date and the respondent’s age. An exception is Coe et al. (2012) who used as an instrument the
early retirement windows offered by employers as reported in the HRS.
To be suitable instruments, these variables must be correlated with retirement but affect
cognition only through their effect on retirement, and not vice versa. Earlier studies on the effect
of retirement on health have shown that these proposed instruments are very strong predictors of
retirement behavior (Charles 2004; Coe and Lindeboom 2008; Neuman 2008; Bound and
Waidmann 2007).
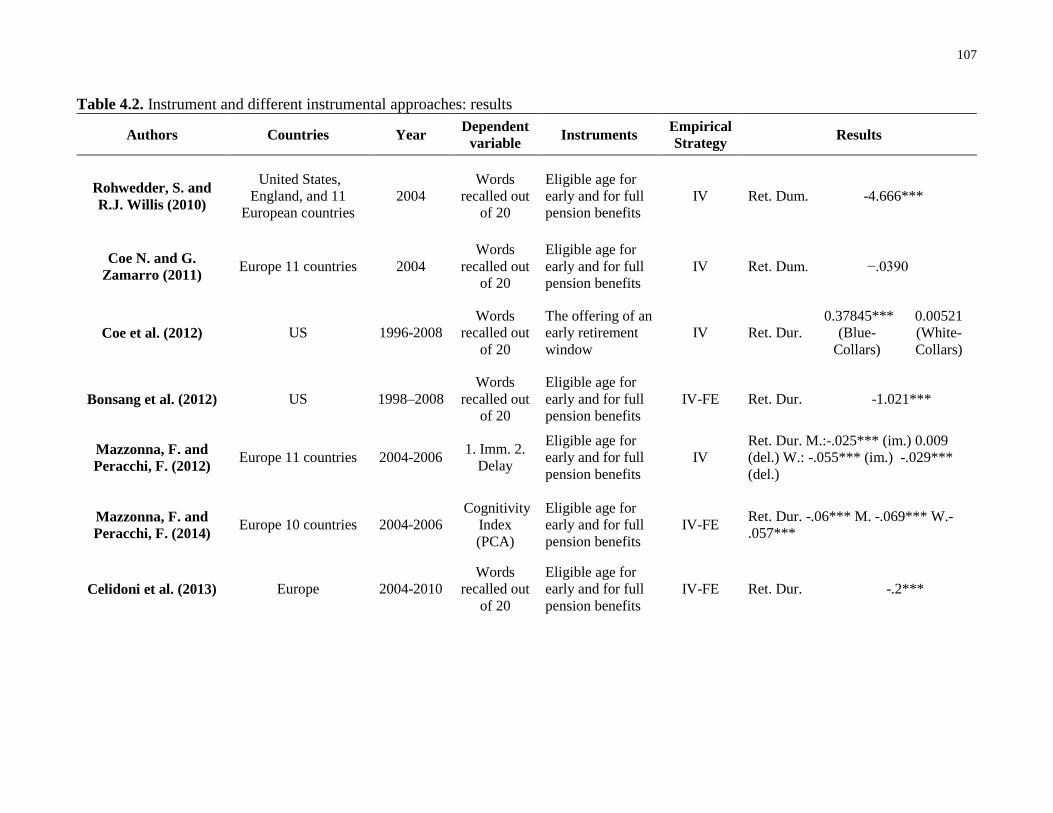
The studies reviewed in Table 4.2 offer a less clear-cut conclusion. We summarize the
various approaches in Table 4.2.
Insert Table 4.2 Here
To overview the instrumental variable results, Rohwedder and Willis (2010) found a
significant reduction of 4.67 words on a scale of 0 to 20 with retirement (significant at the one
81
percent level). However, this effect disappeared when Coe and Zamarro (2011) controlled for
country dummies. Coe et al. (2012) showed a significant and positive effect for US blue-collar
workers, with a coefficient of about 0.38 additional words. Bingley and Martinello (2013) showed
that the effect of retirement on cognition declined when they controlled for years of schooling (-
3.0 versus -5.6 reduction in words recalled). When estimating the model for men and women
separately, they found a lower effect of retirement on word recall for women than for men.
Mazzonna and Peracchi (2012) accounted for attrition, cohort effects, and learning effects, and they
found a small significant negative effect of retirement duration on cognitive abilities (-.025 words
per year in retirement in immediate memory recall for men, and -.055 words per year in retirement
for women in immediate recall).
To deal with unobserved heterogeneity across individuals, some authors have adopted a
fixed effect (FE) approach in the instrumental variable setting. For instance, Bonsang et al. (2012)
reported a significant and negative retirement coefficient of -1.01 words in a baseline model using
fixed effect methods. After controlling for different age specifications and retirement durations,
they found less robust results. Using principal components analysis, Mazzona and Peracchi (2014)
constructed a cognitive capability index based on various cognition measures. They analyzed a
dummy for retirement similar to that in Rohwedder and Willis (2010), and they also analyzed the
effect of retirement duration as in Mazzonna and Peracchi (2012). They found a small negative
effect of retirement duration with their cognitive index, so that more time in retirement implied a
larger decrease in cognitive functioning. They also found a positive effect of immediate retirement
on cognition for white-collar jobs, and no significant effect for blue-collar jobs, as well as a
negative effect of retirement duration for both groups. When only using fixed effects and
controlling for age and time dummies Celedoni et al. (2013) found a positive but small effect on
the retirement dummy (-.4) and a small negative and significant coefficient for retirement duration

82
(-0.10). People recalled -0.13 fewer words per year in retirement (on a 0-20 scale), depending on
the specification of age. The authors also found a small negative effect of -.2 words per year in
retirement on cognition with a combined IV-FE approach and excluding the retirement dummy
from the regressions. Bianchini and Borella (2014) interacted the number of years in retirement
with the retirement dummy for individuals who actually retired during the sample period, so that
they were observed both when working and retired. Interestingly, using a similar approach to
Celidoni et al. (2013), they found the opposite result: a significant small positive effect of
retirement duration on cognition (with an estimated increase in words recalled on a 0-20 scale equal
to 0.39 per year in retirement).
In summary, most studies reported small and sometimes insignificant effects of retirement
on cognition. The exceptions were Rohwedder and Willis (2010), Bonsang et al. (2012) and
Bingley and Martinello (2013) who found significant negative effects of retirement on words
recalled (about -3 and -5 words on a scale of 0 to 20 words for Rohwedder and Willis (2010) and
Bingley and Martinello (2013), respectively and about -1 word per year in retirement for Bonsang
et al. (2012).
Disaggregating Cognitive Abilities and Reconciling Results
To better understand the sources of differential effects of retirement on cognition documented
in the prior literature, we also use the HRS, ELSA, and SHARE surveys from 2004 to 2012. We
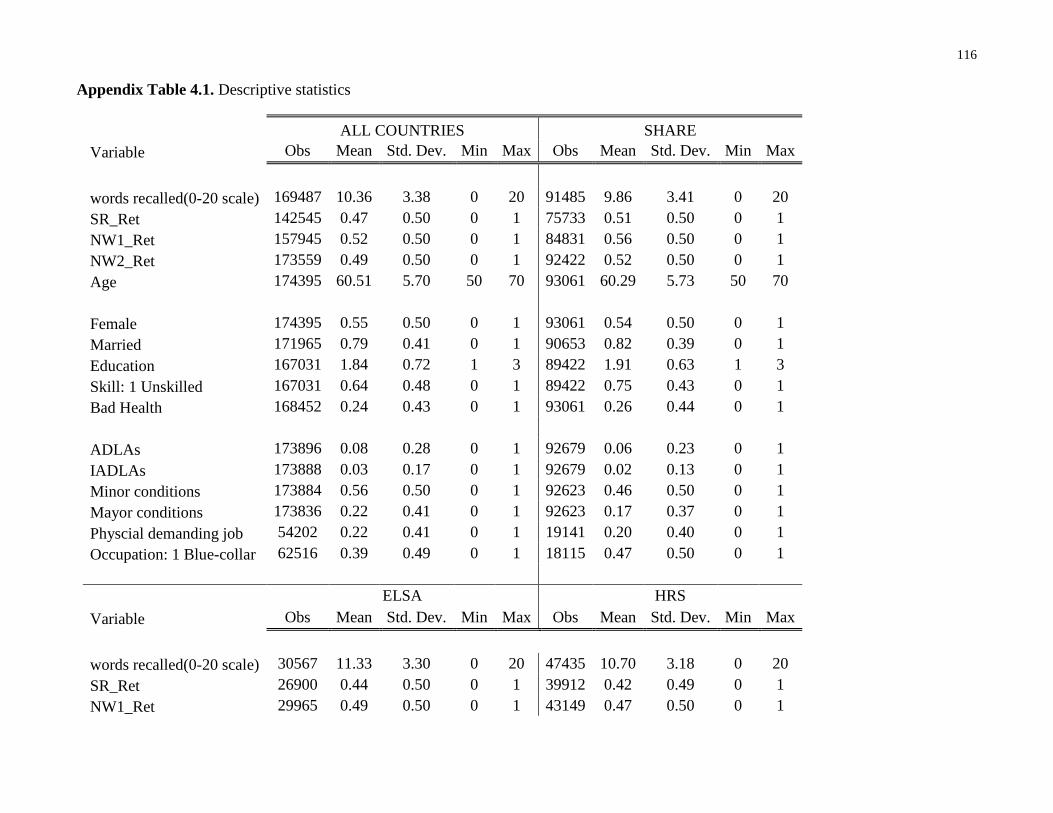
also focus on countries with at least three waves (13 countries). 8 (Descriptive statistics for the
baseline samples appear in Appendix A.)
Our goal is to reconcile the divergent results in the literature by evaluating different
econometric specifications and operationalisations of retirement. In particular we estimate effects
of retirement on cognitive ability using Ordinary Least Squares (OLS), Instrumental Variable

83
Methods, Fixed Effects and Instrumental Variable Fixed Effect (IV-FE) methods, for all surveys
combined.9
We also present specifications using a variety of control variables. A first specification
includes none at all, while a second specification adds age, cohort, and gender. Note that by
controlling for age, we account for the natural decline of memory with age. Therefore, our estimates
of the effect of retirement capture changes in the age trajectory due to retirement. The third
specification adds country fixed effects to the set of controls. The final two specifications include
as controls demographic information (marital status and level of education), and health outcomes
(self-reported health, number of limitations with activities and medical conditions). We are aware
that the last two specifications could raise endogeneity issues. For instance, in the former
specification, marital status could affect cognitive abilities via social activities as part of the family
network. In the latter specification, one might be concerned that health is affected by cognition,
while health could also be affected by retirement. We have conducted various robustness checks
including incorporating income, wealth and other social network control variables. Since the results
do not differ much, they are reported in Appendix A.
Our first retirement definition is based on self-reports of current job status (SR_Ret). The
second definition includes homemakers with those who say they are sick or disabled the set of
retirees, but we condition on working at the age of 50 (NW1_Ret), as in Coe and Zamarro (2011).
Our third definition of retirement is the most inclusive and defines as retired all those are not
working now (NW2_Ret), as in Rohwedder and Willis (2010).
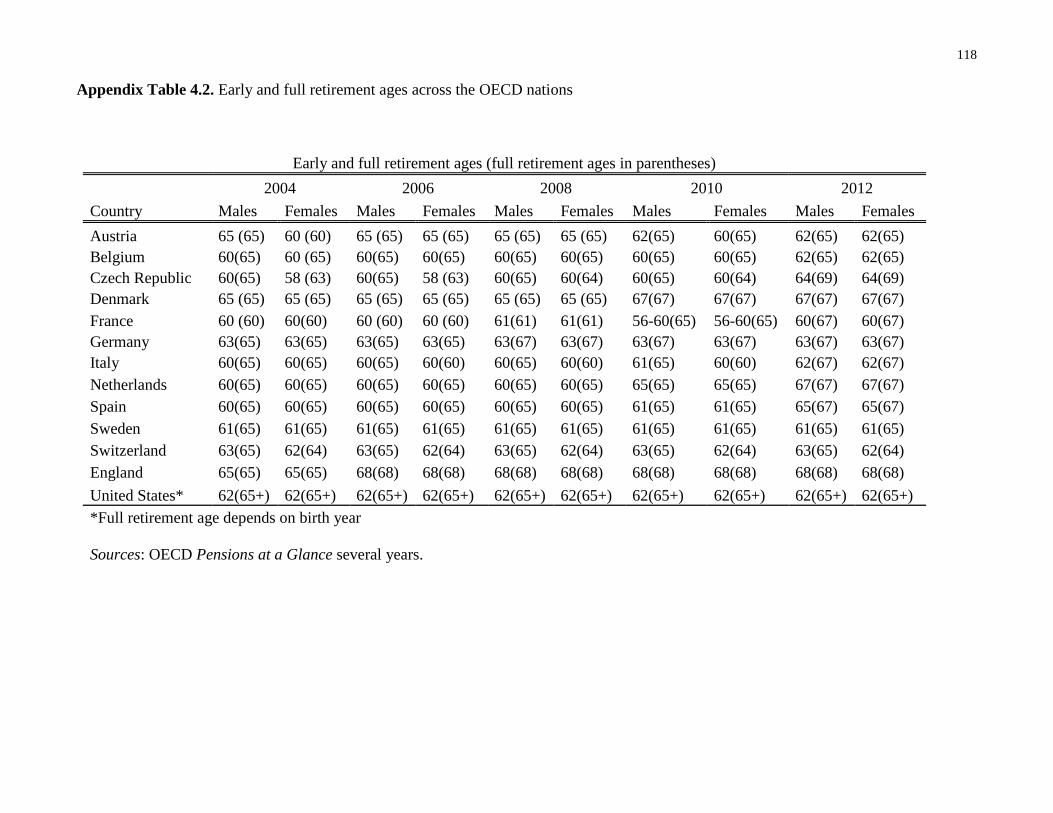
To address the potential endogeneity of retirement (i.e. that cognitive decline may affect
when someone retires), we instrument using two variables that indicate whether the respondent was
eligible for full or early retirement public pensions using the country- and gender-specific pension-
eligibility ages described in Appendix B.10

84
Pooled results. Table 4.3 presents the estimates for all surveys pooled together. Overall, the
Ordinary Least Square (OLS) estimates reveal a significant negative correlation between retirement
and cognition scores (on a 0-20 scale) ranging from -1.28 words for specifications without controls,
to -0.28 words with more detailed controls. The more controls we add, the lower the estimated
coefficient. The size of the effect does vary depending on the definition of retirement used: for
instance the definition based on the respondent reporting not working (NW2_Ret) generates the
highest estimated negative effects, followed by NW1_Ret and self-reported retirement status
(SR_Ret).
Insert Table 4.3 here
The IV estimates are mostly larger than the OLS results,11 but results change dramatically
when country fixed effects are included. Excluding country controls means that our estimates are
based on variation within and across countries. Hence cognition levels of those above retirement
age are compared with cognition levels of those below. Including country fixed effects changes the
sources of identification and interpretation of the estimated retirement effects. Specifically, with
country effects, retirement impacts are estimated by comparing individuals in the same country
above and below retirement eligibility age (Coe and Zamarro 2011). In most cases, combining
country fixed effects with IV restores the estimated negative effect of retirement on cognition, but
the effects become mostly small and often insignificant.
Heterogeneity across individuals. If the causal effect of retirement on cognition is heterogeneous
across respondents, then the estimated effect recovered by IV will be a weighted average of the
effects for those individuals induced to change their decisions because of the instrument. In our
case, the instruments are based on retirement eligibility, so the issue is which labor force
participants are induced to retire once they reach the eligibility age. This is what is known as the
local average treatment effect (LATE; Imbens & Angrist 1994; Angrist & Pischke 2015).

85
Accordingly, studies that estimate the same model with different IVs or use samples from different
populations may obtain very different estimates of the causal effects.
Average cognitive scores differ between men and women. Men recall 9.58 words on
average while women recall 10.39 words. These numbers are quite stable over the period studied.
Figure 4.1 shows that the averages vary across countries, but women always score better than men.
Moreover, Table 4.4 shows results of OLS estimates by gender, which are seen to be similar. In the
IV specifications, results for women mostly retain significant and negative coefficients even
controlling for all co-variates, while for men the coefficients of interest lose significance once we
control for country fixed effects. The IV-FE estimates for men are statistically insignificant, while
for women, the estimated effects of retirement on cognition remain negative and mostly statistically
significant even when country fixed effects and covariates are included.
Insert Figure 4.1 here
Insert Table 4.4 here
As Bingley and Martinello 2013 argued, the differences in eligibility ages across gender
could be correlated with education level. Table 4.5 provides a breakdown of results for two
different education levels. Here, the OLS and IV estimates are similar across the two groups,
although the coefficients are smaller for better-educated than lower-educated individuals. The IV-
FE models generate generally insignificant results for both groups.
Insert Table 4.5 here
It is also of interest to differentiate results by occupation. One variable we use measures
physical effort in the current job directly, while a second variable is constructed by matching
peoples’ reported occupations to administrative classifications (ISCO coding for Continental
Europe; SOC2010 for England, Census coding for the U.S.) to distinguish between blue collar and

86
white collar jobs. (More details about the variables can be found in Appendix A). We find that
people working in physically demanding jobs recall about 10 words, while those in less physically
demanding jobs recall about 11. Similar differences arise when comparing blue-collar jobs and
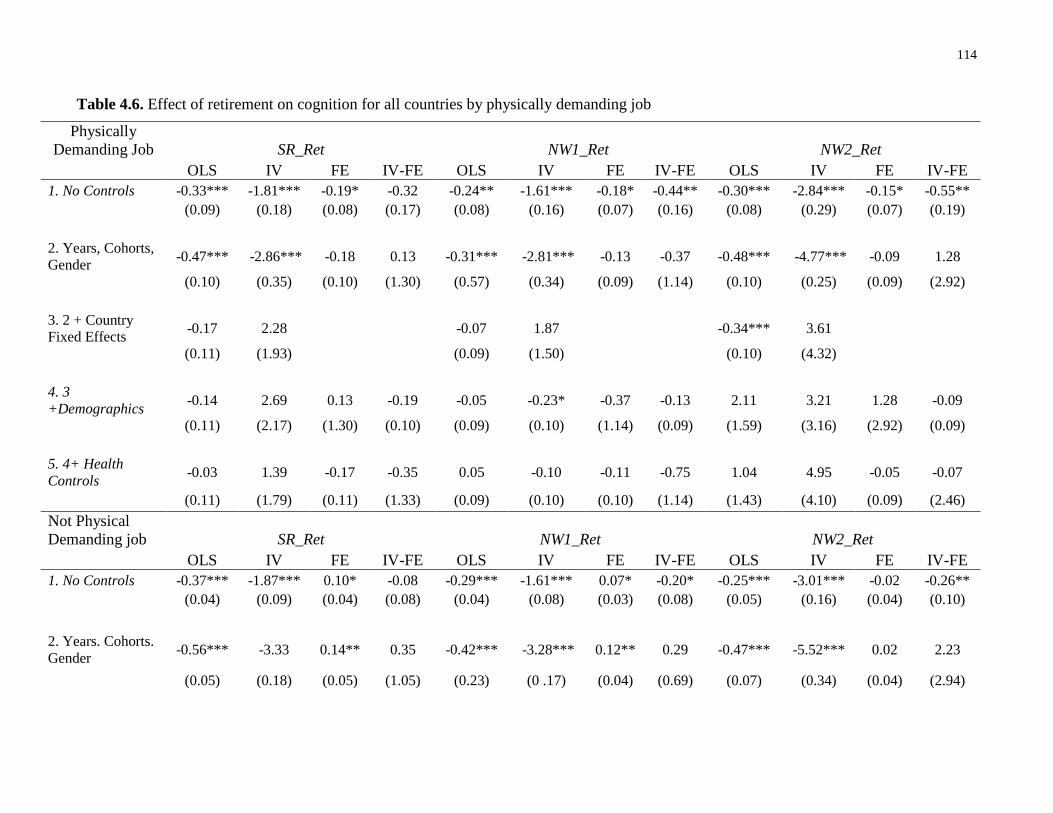
white-collar jobs. Table 4.6 summarizes results according to the physical demanding job definition.
Insert Table 4.6 here
To sum up the results, our analysis shows that the estimated effects of retirement on
cognition are quite sensitive to model specification. In particular, results are especially sensitive to
the inclusion of country fixed effects used to control for unobserved country differences. When
these are controlled for, estimated effect of retirement on cognition are small and mostly
insignificant.
Conclusions
In this chapter we have reviewed the empirical literature estimating the effects of retirement
on cognitive function. We use several internationally comparable datasets and show there is wide
variation in outcomes. In particular, estimates are very sensitive to econometric specifications, and
the use of country fixed effects in particular dramatically reduces the estimated effect of retirement
on cognition. This is also true for population subgroups distinguished by blue collar/ white collar;
physical demands; and job skill level. The upshot of our work is therefore that previous studies’
findings must be considered quite fragile. It should be pointed out that our IV strategy aims to
identify a sharp immediate effect of retirement on cognition, rather than considering the effect of
retirement duration on cognitive decline. Our review of the literature suggests that the effects of
those estimates are equally fragile.

87
Appendix
Appendix A: Data Description.
We use data from several longitudinal surveys of the over-50 population: the Health and
Retirement Study (HRS) for the U.S., the English Longitudinal Study of Ageing (ELSA) for
88
England, and the Study of Health, Ageing and Retirement in Europe (SHARE). Since SHARE was
introduced in 2004, we focus our analysis on the year 2004 and subsequent waves of all surveys
through 2012. We analyze five waves for HRS and ELSA, and four waves for SHARE (wave 3 of
SHARE collects life histories and does not contain cognitive abilities variables). HRS, ELSA, and
SHARE all cover a wide range of topics including demographics (age, gender, and education),
labor supply, income, pension benefits, wealth, health, and cognitive function. They contain
identical question wordings whenever possible.
Cognitive functioning variables. All three surveys ask several questions about cognitive
functioning. Their measures of cognitive abilities are comparable and follow similar interview
procedures. Below we describe the construction of the word recall variable for each survey.
HRS: The interviewer read a list of 10 nouns (e.g., lake, car, army, etc.) to the respondent.
Immediate Word Recall: After reading the list, individuals were asked to recall as many words as
possible. The list could be given in any order. Between waves, the list of nouns may have changed.
Delayed Word Recall: After approximately five minutes of being asked other survey questions
(e.g., about other cognition items), individuals were asked to recall the list again in any order. The
sum of the outcomes of both Immediate Word Recall (10 words) and Delayed Word Recall (10
words) is used to build a recall summary score. Values range from 0 to 20.
ELSA: A list of 10 nouns could be read from a computer screen or by the interviewer if there were
technical issues. Respondents were given the following instructions:
‘The computer will now read a set of 10 words. I would like you to recall as many as you can. We
have purposely made the list long so it will be difficult for anyone to recall all the words. Please
listen carefully to the set of words as they cannot be repeated. When it has finished, I will ask you
to recall aloud as many of the words as you can, in any order. Is this clear?’

89
After several other questions were asked, the respondent was asked to recall the words again.
The summary test recall score is the sum of both immediate and delayed word recall for a maximum
of 20. Values range from 0 to 20.
SHARE: As in ELSA, a list of 10 nouns could be read from a computer screen. At the beginning
of the immediate word recall exercise, the interviewer read this message: ‘Please listen carefully,
as the set of words cannot be repeated. When I have finished, I will ask you to recall aloud as many
of the words as you can, in any order. Is this clear?’
As in the HRS, for the delayed word recall the respondent was asked to recall the words again
after several questions were asked about other cognitive abilities. The summary test recall score is
again the sum of both the immediate and delayed word recall for a maximum of 20. A drawback
of SHARE is that all respondents in the household in waves 1 and 2 could receive the exact same
test each time. The survey corrected this issue in waves 4 and 5.
Retirement. All three surveys ask similar questions about current work status and retirement status.
HRS measures self-reported work status by asking: (1) working now, (2) unemployed and looking
for work, (3) temporarily laid off, on sick or other leave, (4) disabled, (5) retired, (6) homemaker,
(7) other (specify). For the salaried workers, there is a follow-up question whether individuals are
currently working for pay.
ELSA measures self-reported work status by asking: (1) retired, (2) employed, (3) self-employed,
(4) unemployed, (5) permanently sick or disabled, (6) Looking after home or family, (7) Other, and
(8) Spontaneous: semi-retired.
SHARE measures self-reported work status by asking: (1) retired, (2) employed or self-employed
(including working for family business), (3) unemployed and looking for work, (4) permanently
sick or disabled, (5) homemaker, (6) other (Renter, Living off own property, Student, Doing
voluntary work)
90
We define three binary measures of retirement: SR_Ret is based on self-reported current
work status; NW1_Ret also includes as retired homemakers, sick or disabled, and those non-
temporarily away from the labor force (if respondents declared they worked at age 50); NW2_Ret
includes all those who are not working now.
Other covariates. Demographic variables include age, age-squared, female, being married or in a
couple, and interactions with being female. Other controls include as cohort, years and country
dummies, and three education levels (tertiary, secondary, and primary).
Several health variables are used. A binary indicator is included for having at least one
major chronic condition from a list including cancer, lung disease, heart attack, and stroke. A
second indicates having at least one minor chronic condition from a list including hypertension,
diabetes and arthritis. Self-reported health is also included (=1 if the individual reports bad or poor
health and 0 otherwise). Impairment indicators (ADLA and iADLA) for limitations with daily
activities are also considered. Similar questions are asked in all surveys about difficulties in five
basic activities: bathing, dressing, eating, getting in and out of bed, and walking across a room.
Individuals are classified as having any ADL limitation if they reported limitations with one or
more of the five activities. Those who reported having some difficulty with preparing meals,
shopping, making phone calls, taking medications and managing money are classified as having an
iADL limitation.
Physically demanding jobs are coded as follows. ELSA distinguishes four categories:
sedentary occupation, standing occupation, physical work, and heavy manual work. We set the
variable ‘physically demanding job’ equal to 1 for the last two categories, and 0 otherwise. HRS
asks directly if the current job requires physical effort ‘whether all/almost all the time’, ‘most of
the time’, ‘some of the time’ and ‘none/almost none of the time’. We set a ‘physically demanding
job’ variable equal to 1 for ‘all/almost all the time’, and 0 otherwise. In SHARE, individuals are

91
asked: My job is physically demanding. Would you say you ‘strongly agree’, ‘agree’, ‘disagree’
and ‘strongly disagree’? In our analyses the ‘physically demanding job’ variable is set to 1 for
‘strongly agree’, and 0 otherwise. Our blue-collar and white-collar definitions are based on
SHARE's ISCO coding and the HRS 1980 and 2000 census coding. For ELSA we use the categories
in the SOC2010 volume 3: the National Statistics Socio-economic classification (NS-SEC rebased
on SOC2010). Blue collar jobs are defined as those that involve routine or manual work; white
collar jobs are defined as managerial and professional occupations or intermediate occupations.
Insert Appendix Table 4.1 here
Appendix B: Early and Full Retirement Ages
Insert Appendix Table 4.2 here
Appendix C: First State Estimations
Insert Appendix Table 4.3 here
Insert Appendix Table 4.4 here
Insert Appendix Table 4.5 here
Insert Appendix Table 4.6 here
Appendix D: Disaggregate estimates for each of the three surveys: HRS, ELSA, and
SHARE
Insert Appendix Table 4.7 here
Appendix E Comparing blue collar and white collar jobs.
Insert Appendix Table 4.8 here

92
References
Adam, S., E. Bonsang, S. Germain, and S. Perelman (2007a). ‘Retirement and Cognitive Reserve:
A Stochastic Frontier Approach Applied to Survey Data,’ HECULg, CREPP Working
93
Papers No. 4.
Adam, S., M. Van der Linden, A. Ivanoiu, A.C. Juillerat, S. Béchet, and E. Salmon (2007b).
‘Optimization of Encoding Specificity for the Diagnosis of Early AD: the RI-48 task,’
Journal of Clinical and Experimental Neuropsychology, 29(5): 477-487.
Albert, S. M., S. Glied, H. Andrews, Y. Stern, and R. Mayeux (2002). ‘Primary Care Expenditures
Before the Onset of Alzheimer’s Disease,’ Neurology, 59(4): 573-578.
Anderson, N. D., and F. I. M. Craik (2000). ‘Memory in the Aging Brain,’ in E. Tulving and F. I.
M. Craik, ed., The Oxford Handbook of Memory. Oxford: Oxford University Press, pp.
411–425.
Angrist, J.D. and J-S. Pischke (2015). Mastering 'Metrics: the Path from Cause to Effect. Princeton:
Princeton University Press.
Atchley, R. C. (1976). The Sociology of Retirement. New York, Halsted Press.
Atchley, R. C. (1982). ‘Retirement as a Sociological Institution,’ Annual Review of Sociology, 8(1):
263–287.
Bäckman, L., S. Jones, A. K. Berger, E. J. Laukka and B. J. Small (2005). ‘Cognitive Impairment
in Preclinical Alzeimer’s Disease: A Meta-Analysis,’ Neuropsychology, 19(4): 520–531.
Banks, J., C. O’Dea, Z. Oldfield (2010). ‘Cognitive Function, Numeracy and Retirement Saving
Trajectories,’ The Economic Journal, 120(548): F381-F410.
Banks, J., F. Mazzonna (2012). ‘The Effect of Education on Old Age Cognitive Abilities: Evidence
from a Regression Discontinuity Design,’ The Economic Journal, 122(560): 418–448.
Benjamin, D., S. Brown, and J. Shapiro (2006). ‘Who is ‘Behavioral’? Cognitive Ability and
Anomalous Preferences.’ Journal of the European Economic Association, 11(6): 1231-
1255.
94
Bianchini, L. and M. Borella (2014). ‘Cognitive Functioning and Retirement in Europe,’ CeRP
Working Paper No. 139. Turin, Italy: Center for Research on Pensions and Welfare Policies.
Bingley, P. and A. Martinello (2013). ‘Mental Retirement and Schooling’, European Economic
Review, 63(c): 292-298.
Bonsang, E., S. Adam and S. Perelman (2012). ‘Does Retirement Affect Cognitive Functioning?’
Journal of Health Economics, 31(13): 490-501.
Börsch-Supan, A., and M. Schuth (2013). ‘Early Retirement, Mental Health and Social Networks,’
In D.A. Wise, ed., Discoveries in the Economics of Aging. Chicago, IL: University of
Chicago Press, pp. 225-254.
Bound, J. and T. Waidmann (2007). ‘Estimating the Health Effects of Retirement.’ MRRC
Working Paper No. 168. Ann Arbor, MI: Michigan Retirement Research Center.
Brown, J.R., A. Kapteyn, E.F.P Luttmer, O.S. Mitchell (2012). ‘Cognitive Constraints on Valuing
Annuities.’ NBER Working Paper No. 19168. Cambridge, MA: National Bureau of
Economic of Research.
Carroll, J.B. (1993). Human Cognitive Abilities: A Survey of Factor-Analytic Studies. Cambridge,
UK: Cambridge University Press.
Cattell, R. B. (1941). ‘Some Theoretical Issues in Adult Intelligence Testing,’ Psychological
Bulletin, 38(7): 592.
Celidoni, M., C. Dal Bianco, and G. Weber (2013). ‘Early Retirement and Cognitive Decline. A
Longitudinal Analysis using SHARE data,’ ‘Marco Fanno’ Working Paper No. 174. Padua,
Italy: Department of Economics and Management, University of Padua.
Charles, K. K. (2004). ‘Is Retirement Depressing? Labor Force Inactivity and Psychological Well-
Being in Later Life,’ Research in Labor Economics, 23: 269–299.
95
Christelis, D., T. Jappelli, and M. Padula (2010). ‘Cognitive Abilities and Portfolio Choice,’
European Economic Review, 54 (1): 18–38.
Coe N.B., H.M. von Gaudecker, M. Lindeboom, and J. Maurer (2012). ‘The Effect of Retirement
on Cognitive Functioning,’ Health Economics, 21(8): 913–927.
Coe, N. and M. Lindeboom (2008). ‘Does Retirement Kill You? Evidence from Early Retirement
Windows,’ CentER Discussion Paper Series No. 93. Chestnut Hill, MA: Center for
Retirement Research.
Coe, N. B. and G. Zamarro (2011). ‘Retirement Effects on Health in Europe,’ Journal of Health
Economics, 30(1): 77-86.
Dave, D., I. Rashad and J. Spasojevic (2008). ‘The Effects of Retirement on Physical and Mental
Health Outcomes,’ Southern Economic Journal, 75(2): 497-523.
Dixon, R., L. Backman, and L. G. Nilsson (2004). New Frontiers in Cognitive Aging. Oxford, UK:
Oxford University Press.
Dohmen, T., A. Falk, D. Huffman, and U. Sunde (2007). ‘Are Risk Aversion and Impatience
Related to Cognitive Ability?’ The American Economic Review, 100(3): 1238-1260).
Ekerdt, D. J., R. Bosse, and J. S. Locastro (1983). ‘Claims that Retirement Improves Health,’
Journal of Gerontology, 38(2): 231–236.
Evans D.A., L.A. Beckett, M.S. Albert, et al. (1993). ‘Level of Education and Change in Cognitive
Function in a Community Population of Older Persons,’ Ann Epidemiol, 3(1): 71-77.
Ferrer, E., T.A. Salthouse, W.F. Stewart and B.S. Schwartz (2004). ‘Modeling Age and Retest
Processes in Longitudinal Studies of Cognitive Abilities,’ Psychology and Aging, 19(2):
243-259.
Fratiglioni, L., S. Paillard-Borg, B. Winblad (2004). ‘An Active and Socially Integrated Lifestyle
in Late Life Might Protect Against Dementia,’ The Lancet, Neurology, 3(6): 343-353.

96
Frederick, S. (2005). ‘Cognitive Reflection and Decision Making,’ Journal of Economic
Perspectives, 19(4): 25-42.
Gall, L. T., D. R. Evans and J. Howard (1997). ‘The Retirement Adjustment Process: Changes in
the Well-Being of Male Retirees Across Time,’ Journal of Gerontology Series B:
Psychological Sciences and Social Sciences, 52(3) 110–117.
Glymour, M. M., I. Kawachi, C. S. Jencks, and L. F. Berkman (2008). ‘Does Childhood Schooling
Affect Old Age Memory or Mental Status? Using State Schooling Laws as Natural
Experiments,’ Journal of Epidemiology and Community Health, 62(6): 532-537.
Halpern D.F. (2012). Sex Differences in Cognitive Abilities. New York, NY: Psychology Press.
Hertzog C., A. F. Kramer, R. Wilson and U. Lindenberg (2008). ‘Enrichment Effects on Adult
Cognitive Development: Can the Functional Capacity of Older Adults be Preserved and
Enhanced?’ Psychological Science in the Public Interest, 9(1): 1-65.
Horn J.L., and R.B. Cattell (1967). ‘Age Differences in Fluid and Crystallized Intelligence,’ Acta
Psychologica, 26(2): 107–129.
Horn, J. L. (1965). ‘Fluid and Crystallized Intelligence: A Factor Analytic and Developmental
Study of the Structure among Primary Mental Abilities,’ Unpublished doctoral dissertation,
University of Illinois, Champaign.
Imbens, G.W., and J. D. Angrist (1994). ‘Identification and Estimation of Local Average Treatment
Effects’. Econometrica, 62(2): 467–475.
Johnson, W. & T. J. Bouchard (2007). ‘Sex Differences in mental Ability: A Proposed Means to
Link them to Brain Structure and Function.’ Intelligence, 35(3): 197-209
Jorm, A.F, B. Rodgers, A.S. Hendersen, A.E. Korten, P.A. Jacomb, H. Christensen, and A.
Mackinnon (1998). ‘Occupation type as a predictor of cognitive decline and dementia in
old age.’ Age and Ageing, 27(4): 477-83.

97
Laezar, E. P. (1986). ‘Retirement from the Labor Force.’ Handbook of Labor Economics, 1(5):
305-55.
Lei, X., H. Yuqing J. J. McArdle, J. P. Smith, and Y. Zhao (2012). ‘Gender Differences in
Cognition among Older Adults in China,’ Journal of Human Resources, 47(4): 951-971.
Lyketsos, C. G., O. Lopez, B. Jones, A. L. Fitzpatrick, J. Breitner, and S. DeKosky (2002).
‘Prevalence of Neuropsychiatric Symptoms in Dementia and Mild Cognitive Impairment:
Results from the Cardiovascular Health Study,’ Journal of American Medical Association,
288(12): 1475-1483.
Maurer, J. (2010). ‘Height, Education and Cognitive Function at Older Ages: International
Evidence from Latin America and the Caribbean,’ Economics and Human Biology, 8(2):
168-176.
Mazzonna, F. and F. Peracchi (2012). ‘Ageing, Cognitive Abilities and Retirement,’ European
Economic Review, 56(4): 691-710.
Mazzonna, F. and F. Peracchi (2014). ‘Unhealthy Retirement? Evidence of Occupation
Heterogeneity,’ CEPRA Working Paper 1401. Lugano, Switzerland: Center for Economic
and Political Research on Aging,
McArdle, J. J. and J. R. Woodcock (1997). ‘Expanding Test-Retest Designs to Include
Developmental Time-Lag Components,’ Psychological Methods, 2(4): 403–435.
McFadden, D. (2008), ‘Human Capital Accumulation and Depreciation,’ Applied Economic
Perspectives and Policy, 30(3): 379-385.
Mein, G., P. Martikainen, H. Hemingway, S. Stansfeld, and M. Marmot (2003). ‘Is Retirement
Good or Bad for Mental and Physical Health Functioning? Whitehall II Longitudinal Study
of Civil Servants,’ Journal of Epidemiology and Community Health, 57(1): 46–49.

98
Midanik, L. T., K. Soghikian, L.J. Ransom, and I.S. Tekawa (1995). ‘The Effect of Retirement on
Mental Health and Health Behaviors: The Kaiser Permanente Retirement Study,’ Journals
of Gerontology Series B: Psychological Sciences and Social Sciences, 50(1), S59-S61.
Mojon-Azzi, S., A. Sousa-Poza, and R. Widmer (2007). ‘The Effect of Retirement on Health: A
Panel Analysis Using Data from the Swiss Household Panel,’ Swiss Medical Weekly,
137(41): 581–585.
Morris, J. C. , M. Storandt, J. P. Miller, D. W. McKeel, J. L. Price, E. H. Rubin, and L. Berg
(2001). ‘Mild Cognitive Impairment Represents Early-Stage Alzheimer Disease,’ Archives
Neurology, 58(3): 397-405.
Morris, M., D. Evans, H. Liesi, J. Bienias (1999). ‘Methodological Issues in the Study of Cognitive
Decline,’ American Journal of Epidemiology, 149(9): 789–793.
Neuman K. (2008). ‘Quit your Job and Get Healthier? The Effect of Retirement on Health,’ Journal
of Labor Research, 29(2): 177–201.
OECD (2011). Pensions at a Glance 2011: Retirement-Income Systems in OECD and G20
Countries. Paris, France: Organization for Economic and Co-operation and Development.
OECD (2013). OECD Guidelines on Measuring Subjective Well-being. Paris, France:
Organization for Economic and Co-operation and Development.
Park, D. C., G. Lautenschlager, T. Hedden, N. S. Davidson, A. D. Smith, and P. K. Smith (2002).
‘Models of Visuospatial and Verbal Memory Across the Adult Life Span,’ Psychology and
Aging, 17(2): 299-320.
Peterson, M., A. Kramer, and A. Colcombe (2002). ‘Contextual Guidance of Attention in Younger
and Older Adults.’ Acta Psychologica, 122(2006): 288-304..

99
Potter, G. G., M. J. Helms, and B. L. Plassman (2008). ‘Associations of Job Demands and
Intelligence with Cognitive Performance among Men in Late Life,’ Neurology, 70(19):
1803-1808.
Prull, M. W., J. D. E. Gabrieli, and S. A. Bunge (2000). ‘Age-related Changes in Memory: A
Cognitive Neuroscience Perspective,’ in F. I. M. Craik and A. Timothy, ed., Salthouse
Handbook of Aging and Cognition II. Mahwah, NJ: Lawrence Erlbaum Associates, pp. 91–
153.
Rabbitt, P., P. Diggle, D. Smith, F. Holland, and L. McInnes (2001). ‘Identifying and Separating
the Effects of Practice and of Cognitive Ageing During a Large Longitudinal Study of
Elderly Community Residents,’ Neuropsychologia, 39(5): 532–543.
Rohwedder, S. and R.J. Willis (2010). ‘Mental Retirement,’ Journal of Economic Perspectives,
24(1): 119-138.
Salthouse, T. A. (2006). ‘Mental Exercise and Mental Aging,’ Perspectives on Psychological
Science, 1(1): 68–87.
Salthouse, T. A. (2009). ‘When does Age-Related Cognitive Decline Begin?’ Neurobiology of
Aging, 30(4): 507–514.
Scarmeas, N. and Y. Stern (2003). ‘Cognitive Reserve and Lifestyle,’ Journal of Clinical and
Experimental Neuropsychology, 25(5): 625-633.
Schaie, T. A. (1994). ‘The Course of Adult Intellectual Development,’ American Psychologist,
49(4): 304–313.
Schaie, T. A. (1996). Intellectual Development in Adulthood: The Seattle Longitudinal Study,
Cambridge University Press.
Schaie, W. (1989). ‘The Hazards of Cognitive Aging,’ The Gerontologist, 29 (4): 484-493.

100
Small G.W (2002). ‘What we Need to Know About Age Related Memory Loss,’ British Medical
Journal, 324(7352): 1502–1505.
United States Social Security Administration (2014). Retirement Age Calculator. Washington, DC:
Social Security Administration. <https://www.ssa.gov/planners/retire/ageincrease.html>.
Stern, Y. (2002). ‘What is Cognitive Reserve? Theory and Research Application of the Reserve
Concept,’ Journal of the International Neuropsychological Society, 8(3): 448–460.
Stern, Y. (2003). ‘The Concept of Cognitive Reserve: A Catalyst for Research,’ Journal of Clinical
and Experimental Neuropsychology, 25( 5): 589–593
Tabert, M.H., S. M. Albert, L. Borukhova-Milov, Y. Camacho, G. Pelton, X. Liu, Y. Stern and
D.P. Devanand. (2002). ‘Functional Deficits in Patients with Mild Cognitive Impairment
Prediction of AD,’ Neurology, 58(5): 758-764.
Van Praag, H. , G. Kempermann, and F. H. Gage (2000). ‘Neural Consequences of Environmental
Enrichment,’ Nature Review Neuroscience, 1(3): 191-196.
Westerlund, H., J. Vahtera, J. E. Ferrie, A. Singh-Manoux, J. Pentti, M. Melchior, C. Leineweber,
M. Jokela, J. Siegrist, M. Goldberg. and M. Kivimaki (2010). ‘Effect of Retirement on
Major Chronic Conditions and Fatigue: French GAZEL Occupational Cohort Study,’
British Medical Journal, 341(1): pp. c6149.

101
Endnotes
1 See Cattell (1941); Horn (1965); Horn and Cattell(1967); and Carroll (1993) for details.
2 We need to keep in mind possible measurement errors in using these variables and the context in
which cognitive tests are conducted (Morris et al. 1999). These include re-testing effects:
performance tends to improve when individuals repeat cognitive tests (Ferrer et al., 2004; Rabbitt
et al. 2001; Schaie 1996; McArdle and Woodcock 1997).
3 Leisure activities, lifestyle, and social networks are thought to affect cognitive functioning. The
idea behind this is that engaging in activities that stimulate an individual’s brain may maintain or
repair cognitive functioning. Some evidence for the importance of social contacts at older ages can
be found in Hertzog et al. (2008), Salthouse (2006), Scarmeas and Stern (2003), Fratiglioni et al.
(2004), and Börsch-Supan and Schuth (2013) among others. Some studies relate personality traits
like patience and risk aversion to cognition (e.g., Frederik 2005; Benjamin et al. 2006; Dohmen et
al. 2007; Midanik et al. 1995)
4 More details about the data sets and variables can be found in Appendix A.
5 See Appendix A for details
6 Adam et al.( 2007a) exclude from the analysis the respondents that cannot recall any words.
7 Adam et al. (2007a) use five dummy variables to define the retirement status in order to capture
the retirement duration. The category of working variables was their reference variable and the
other variables were ranges as <5 years retired, [5-9], [10-15], more than 15 years retired and
having never worker.
8 The 13 countries are: Austria, Belgium, Czech Republic, Denmark, France, Germany, Italy, the
Netherlands, Spain, Sweden, Switzerland, US and UK.

102
9 We also run the models separately for each of the three surveys HRS, ELSA, and SHARE. Results
can be found in Appendix D. The OLS estimates confirm the same results through the different
surveys. The IV and IV-FE results vary somewhat across surveys but generally retirement is only
found to have a significant negative effect on cognition in the models without country fixed effects.
10 The ages for the US refer to Social Security claiming ages rather than retirement ages; 62 is the
earliest age at which one can claim Social Security. For comparison purposes we treat the US early
claiming age and full retirement age similar to the treatment of early and full retirement ages in the
European countries.
11 First stage estimates are presented in Appendix C and show that the instruments are positively
related to the retirement variables. These estimates show that the instruments in general continue
to be good predictors of retirement despite the multiple definitions of retirement and the alternative
specifications. Their coefficients decrease when controls are introduced but they remain significant
at 1% in almost all cases.

103
Figure 4.1. Cognitive functioning and gender differences
Source: Authors’ computation.
0
2
4
6
8
10
12
Ave
rag
e W
ord
s R
eca
lled
Male Female

104
Table 4.1. Data set, samples, dependent and independent variables in the reviewed papers
Authors Countries Data Set Year Sample Cognitive Abilities Retirement Explanatory
Variables
Rohwedder, S.
and R.J. Willis
(2010)
United
States,
England,
and 11
European
countries
HRS,
SHARE
and
ELSA
2004 Men and women
together
(60-64 years)
Memory test scores
(recall summary
score 20)
Retired(dummy) Different age forms
Coe N. and G.
Zamarro (2011)
Europe 11
countries
SHARE 2004 Men (50-69 years
old)
1. Memory test
scores (recall
summary score 20)
2. Verbal fluency
Retired(dummy)
(cond. Working
age 50)
Demographic; SES ;
health and country
dummies
Coe et al. (2012) US HRS 1996-
2008
1. Blue and white
collars workers 2.
50-70 years old 3.
Men and women
together
1. Self‐rated
memory, 2.
Immediate, delayed
and total word
recall, 3. Working
memory and 4.
Numeracy
Retirement duration
(years in
retirement)-
continuous variable
Demographic;
education. wave
dummies.
Bonsang et al.
(2012)
US HRS 1998–
2008
Men and women
together (51-75
years old)
working at 50
Memory test scores
(recall summary
score 20)
Retirement duration
(non parametric
specification) after
one year of
retirement
Different age forms

105
Mazzonna, F.
and Peracchi, F.
(2012)
Europe 11
countries
SHARE 2004-
2006
1. 50-70 years old
2. Menand
women
separately
1. Immediate
memory 2. Delay
memory 3.
Orientation in time
4. Verbal fluency 5.
Numerancy
Retirement duration
(years in
retirement)-
continuous variable
Demographic; SES;
country, cohort and
regional dummies
Mazzonna, F.
and Peracchi, F.
(2014)
Europe 10
countries
SHARE 2004-
2006
Men and Women
separately.
Occupations:
Physical
demanding job
1. Memory test
scores (recall
summary score 20)
2. Verbal fluency 3.
Numerancy 4.
Cognitivity Index
(PCA)
Retired (dummy)
and retirement
duration (years in
retirement)-
continuous variable
Demographic; SES ;
health
Celidoni et al.
(2013)
Europe SHARE 2004-
2010
Men and women
separately and all
together
Memory test scores
(recall summary
score 20)
Lag of retired
dummy + retirement
duration
Demographic; SES ;
health
Bingley, P. and
Martinello, A.
(2013)
United
States,
England,
and 11
European
countries
HRS,
SHARE
and
ELSA
2004 Men and women
and all together
Memory test scores
(recall summary
score 20)
Retired(dummy) Different age forms
and years of
schooling.

106
Bianchini, L.
and M. Borella
(2014)
Europe SHARE 2004-
2010
Men and women
together. 50-70
working at age
50. Blue/white
collars workers
Memory test scores
(recall summary
score 20)
Retired (dummy)
and retirement
duration
Demographic; SES;
health; behaviour;
learning and
contextual factor
Source: Authors’ computations.
107
Table 4.2. Instrument and different instrumental approaches: results
Authors Countries Year Dependent
variable Instruments
Empirical
Strategy Results
Rohwedder, S. and
R.J. Willis (2010)
United States,
England, and 11
European countries
2004
Words
recalled out
of 20
Eligible age for
early and for full
pension benefits
IV Ret. Dum. -4.666***
Coe N. and G.
Zamarro (2011) Europe 11 countries 2004
Words
recalled out
of 20
Eligible age for
early and for full
pension benefits
IV Ret. Dum. −.0390
Coe et al. (2012) US 1996-2008
Words
recalled out
of 20
The offering of an
early retirement
window
IV Ret. Dur.
0.37845***
(Blue-
Collars)
0.00521
(White-
Collars)
Bonsang et al. (2012) US 1998–2008
Words
recalled out
of 20
Eligible age for
early and for full
pension benefits
IV-FE Ret. Dur. -1.021***
Mazzonna, F. and
Peracchi, F. (2012) Europe 11 countries 2004-2006
1. Imm. 2.
Delay
Eligible age for
early and for full
pension benefits
IV
Ret. Dur. M.:-.025*** (im.) 0.009
(del.) W.: -.055*** (im.) -.029***
(del.)
Mazzonna, F. and
Peracchi, F. (2014) Europe 10 countries 2004-2006
Cognitivity
Index
(PCA)
Eligible age for
early and for full
pension benefits
IV-FE Ret. Dur. -.06*** M. -.069*** W.-
.057***
Celidoni et al. (2013) Europe 2004-2010
Words
recalled out
of 20
Eligible age for
early and for full
pension benefits
IV-FE Ret. Dur. -.2***

108
Bingley, P. and
Martinello, A. (2013)
United States,
England, and 11
European countries
2004
Words
recalled out
of 20
Eligible age for
early and for full
pension benefits.
They valid it
controlling for
years of schooling
IV
Ret.
Dum.
-
3.014***
M.
-5.485***
W. -
1.607**
Bianchini, L. and M.
Borella (2014) Europe 2004-2010
Words
recalled out
of 20
Eligible age for
early and for full
pension benefits
IV-FE Ret. Dur. 0.3919***
Source: Authors’ computations.

109
Table 4.3 Effects of retirement on cognition for all countries
Notes: Ordinary Least Squares (OLS); Instrumental Variable Methods (IV); Fixed Effects (FE); Instrumental Variable Fixed Effect Methods
(IV-FE). Retirement definitions: SR_Ret is based on self-reports of current job status; NW1_Ret includes homemakers along with those
who say they are sick or disabled into the set of retirees, but conditions on working at the age of 50; NW2_Ret defines as retired all those are
not working now.
Source: Authors’ computations.
SR_Ret NW1_Ret NW2_Ret
OLS IV FE IV-FE OLS IV FE IV-FE OLS IV FE IV-FE
1. No Controls -1.19*** -2.18*** 0.05 -0.23* -1.18*** -2.28*** 0.02 -0.34*** -1.27*** -2.74*** -0.08** -0.41**
(0.02) (0.02) (0.03) (0.09) (0.02) (0.03) (0.02) (0.09) (0.02) (0.03) (0.02) (0.13)
2. Years,
Cohorts, Gender -0.83*** -5.68*** 0.006 -0.78 -0.97*** -6.19*** -0.007 -0.78 -1.12*** -8.77*** -0.09*** -1.19
(0.02) (0.20) (0.03) (0.52) (0.02) (0.23) (0.03) (0.46) (0.02) (0.39) (0.02) (1.02)
3. 2 + Country
Fixed Effects -0.60*** -0.70** 0.006 -0.78 -0.69*** -0.61* -0.007 -0.09*** -0.88*** -0.70 -0.78 -1.19
(0.02) (0.26) (0.03) (0.52) (0.02) (0.26) (0.03) (0.02) (0.02) (0.44) (0.46) (1.02)
4. 3+
Demographics -0.44*** -0.70** 0.007 -0.80 -0.46*** -0.48 -0.005 -0.77 -0.61*** -0.61 -0.09** -1.09
(0.02) (0.25) (0.03) (0.52) (0.02) (0.26) (0.03) (0.46) (0.02) (0.42) (0.03) (0.99)
5. 4+ Health
Controls -0.28*** -0.75** 0.007 -0.65 -0.28*** -0.57* -0.008 -0.08** -0.41*** -0.81* -0.65 -0.90
(0.02) (0.23) (0.03) (0.47) (0.02) (0.24) (0.03) (0.02) (0.02) (0.36) (0.43) (0.86)

110
Table 4.4. Effect of retirement on cognition for all countries by gender
Men SR_Ret NW1_Ret NW2_Ret
OLS IV FE IV-FE OLS IV FE IV-FE OLS IV FE IV-FE
1. No Controls -1.28*** -2.18*** 0.03 0.04 -1.21*** -2.09*** -0.001 -0.19 -1.34*** -2.58*** -0.10** -0.19
(0.03) (0.04) (0.04) (0.13) (0.03) (0.04) (0.04) (0.13) (0.03) (0.05) (0.04) (0.18)
2. Years,
Cohorts, Gender -0.89*** -4.86*** -0.04 0.24 -0.89*** -4.76*** -0.04 -0.20 -1.07*** -6.87*** -0.13** -0.17
(0.04) (0.25) (0.05) (0.65) (0.04) (0.26) (0.05) (0.59) (0.03) (0.42) (0.04) (1.12)
3. 2 + Country
Fixed Effects -0.65*** 0.05 -0.69*** 0.11 -0.92*** 0.49
(0.04) (0.33) (0.04) (0.32) (0.03) (0.48)
4. 3
+Demographics -0.48*** 0.01 -0.01 0.28 -0.49*** 0.11 -0.03 -0.15 -0.66*** 0.38 -0.10* -0.05
(0.04) (0.32) (0.05) (0.64) (0.04) (0.32) (0.05) (0.59) (0.03) (0.46) (0.04) (1.09)
5. 4+ Health
Controls -0.32*** 0.04 -0.02 0.34 -0.28*** 0.10 -0.01 -0.08 -0.43*** 0.29 -0.09* 0.17
(0.04) (0.31) (0.05) (0.59) (0.04) (0.31) (0.05) (0.55) (0.03) (0.43) (0.04) (1.01)
Women SR_Ret NW1_Ret NW2_Ret
OLS IV FE IV-FE OLS IV FE IV-FE OLS IV FE IV-FE
1. No Controls -1.16*** -2.18*** 0.08 -0.51*** -1.29*** -2.44*** 0.05 -0.49*** -1.40*** -2.89*** -0.06 -0.61**
(0.03) (0.04) (0.04) (0.15) (0.03) (0.05) (0.04) (0.14) (0.03) (0.05) (0.04) (0.19)
2. Years,
Cohorts, Gender -0.77*** -6.60*** 0.05 -2.13* -1.04*** -7.79*** 0.01 -1.46* -1.17*** -10.02*** -0.07* -3.05
(0.04) (0.35) (0.05) (0.83) (0.04) (0.41) (0.04) (0.71) (0.03) (0.65) (0.04) (1.88)

111
3. 2 + Country
Fixed Effects -0.56*** -1.62*** -0.66*** -1.52** -0.85*** -2.51**
(0.04) (0.44) (0.03) (0.47) (0.03) (0.88)
4. 3
+Demographics -0.4*** -1.57*** 0.04 -2.24** -0.42*** -1.27** 0.01 -1.54* -0.57*** -2.13** -0.08* -2.89
(0.04) (0.41) (0.05) (0.84) (0.03) (0.45) (0.04) (0.72) (0.03) (0.79) (0.04) (1.81)
5. 4+ Health
Controls -0.25*** -1.58*** 0.03 -1.83* -0.26*** -1.39*** -0.005 -1.29 -0.38*** -2.17*** -0.08 -2.38
(0.04) (0.37) (0.05) (0.73) (0.03) (0.42) (0.04) (0.66) (0.03) (0.64) (0.04) (1.44)
Notes: Ordinary Least Squares (OLS); Instrumental Variable Methods (IV); Fixed Effects (FE); Instrumental Variable Fixed Effect Methods
(IV-FE). Retirement definitions: SR_Ret is based on self-reports of current job status; NW1_Ret includes homemakers along with those
who say they are sick or disabled into the set of retirees, but conditions on working at the age of 50; NW2_Ret defines as retired all those are
not working now.
Source: Authors’ computations.

112
Table 4.5. Effect of retirement on cognition for all countries by skill education
Middle and
Low-skilled
workers SR_Ret NW1_Ret NW2_Ret
OLS IV FE IV-FE OLS IV FE IV-FE OLS IV FE IV-FE
1. No Controls -1.07*** -1.91*** 0.07 0.05 -1.05*** -2.07*** 0.06 -0.04 -1.09*** -2.45*** -0.05 -0.01
(0.03) (0.04) (0.04) (0.13) (0.03) (0.04) (0.04) (0.13) (0.03) (0.05) (.0.03) (0.18)
2. Years,
Cohorts, Gender -0.73*** -2.5*** 0.03 -0.09 -0.86*** -2.64*** -0.01 -0.03 -0.95*** -3.01*** -0.03 -0.26
(0.03) (0.60) (0.05) (0.51) (0.03) (0.13) (0.04) (0.49) (0.03) (0.15) (0.49) (1.13)
3. 2 + Country
Fixed Effects -0.52*** -0.62* -0.61*** -0.39 -0.73*** -0.45
(0.03) (0.28) (0.03) (0.30) (0.03) (0.51)
4. 3
+Demographics -0.04 -0.21 -0.04 -0.21 -0.01 -0.16 -0.01 -0.16 -0.09** -0.43 -0.09** -0.43
(0.05) (0.53) (0.05) (0.53) (0.04) (0.50) (0.04) (0.50) (0.04) (1.13) (0.03) (1.13)
5. 4+ Health
Controls -0.04 -0.16 -0.04 -0.16 -0.35*** 0.08 -0.35*** 0.08 -0.56*** 0.37 -0.56*** 0.37
(0.05) (0.49) (0.05) (0.49) (0.04) (0.62) (0.04) (0.62) (0.04) (1.14) (0.04) (1.14)
Higher-skilled
workers SR_Ret NW1_Ret NW2_Ret
OLS IV FE IV-FE OLS IV FE IV-FE OLS IV FE IV-FE
1. No Controls -0.70*** -1.54*** 0.04 -0.66*** -0.60*** -1.51*** -0.02 -0.74*** -0.68*** -1.92*** -0.11* -0.95***
(0.04) (0.05) (0.05) (0.16) (0.03) (0.05) (0.04) (0.15) (0.04) (0.07) (0.04) (0.19)
2. Years,
Cohorts, Gender -0.39*** -1.55*** 0.08 -2.27 -0.36*** -1.69*** 0.03 -1.6 -0.55*** -2.09*** -0.07 -2.19
(0.05) (0.16) (0.05) (1.56) (0.04) (0.17) (0.05) (1.05) (0.04) (0.24) (0.05) (2.30)

113
3. 2 + Country
Fixed Effects -0.39*** -0.03 -0.35*** 0.08 -0.56*** 0.37
(0.05) (0.75) (0.04) (0.62) (0.04) (1.14)
4. 3
+Demographics -0.39*** -0.06 0.07 -2.27 -0.35*** 0.03 0.01 -1.63 -0.55*** 0.24 -0.08 -2.02
(0.05) (0.75) (0.05) (1.57) (0.04) (0.61) (0.05) (1.05) (0.04) (1.11) (0.05) (2.21)
5. 4+ Health
Controls -0.26*** -0.34 0.07 -2.04 -0.19*** -0.24 0.01 -1.7 -0.39*** -0.34 -0.06 -2.19
(0.05) (0.64) (0.06) (1.32) (0.04) (0.56) (0.05) (0.97) (0.04) (0.88) (0.05) (1.93)
Notes: Ordinary Least Squares (OLS); Instrumental Variable Methods (IV); Fixed Effects (FE); Instrumental Variable Fixed Effect Methods
(IV-FE). Retirement definitions: SR_Ret is based on self-reports of current job status; NW1_Ret includes homemakers along with those
who say they are sick or disabled into the set of retirees, but conditions on working at the age of 50; NW2_Ret defines as retired all those are
not working now.
Source: Authors’ computations.
114
Table 4.6. Effect of retirement on cognition for all countries by physically demanding job
Physically
Demanding Job SR_Ret NW1_Ret NW2_Ret
OLS IV FE IV-FE OLS IV FE IV-FE OLS IV FE IV-FE
1. No Controls -0.33*** -1.81*** -0.19* -0.32 -0.24** -1.61*** -0.18* -0.44** -0.30*** -2.84*** -0.15* -0.55**
(0.09) (0.18) (0.08) (0.17) (0.08) (0.16) (0.07) (0.16) (0.08) (0.29) (0.07) (0.19)
2. Years, Cohorts,
Gender -0.47*** -2.86*** -0.18 0.13 -0.31*** -2.81*** -0.13 -0.37 -0.48*** -4.77*** -0.09 1.28
(0.10) (0.35) (0.10) (1.30) (0.57) (0.34) (0.09) (1.14) (0.10) (0.25) (0.09) (2.92)
3. 2 + Country
Fixed Effects -0.17 2.28 -0.07 1.87 -0.34*** 3.61
(0.11) (1.93) (0.09) (1.50) (0.10) (4.32)
4. 3
+Demographics -0.14 2.69 0.13 -0.19 -0.05 -0.23* -0.37 -0.13 2.11 3.21 1.28 -0.09
(0.11) (2.17) (1.30) (0.10) (0.09) (0.10) (1.14) (0.09) (1.59) (3.16) (2.92) (0.09)
5. 4+ Health
Controls -0.03 1.39 -0.17 -0.35 0.05 -0.10 -0.11 -0.75 1.04 4.95 -0.05 -0.07
(0.11) (1.79) (0.11) (1.33) (0.09) (0.10) (0.10) (1.14) (1.43) (4.10) (0.09) (2.46)
Not Physical
Demanding job SR_Ret NW1_Ret NW2_Ret
OLS IV FE IV-FE OLS IV FE IV-FE OLS IV FE IV-FE
1. No Controls -0.37*** -1.87*** 0.10* -0.08 -0.29*** -1.61*** 0.07* -0.20* -0.25*** -3.01*** -0.02 -0.26**
(0.04) (0.09) (0.04) (0.08) (0.04) (0.08) (0.03) (0.08) (0.05) (0.16) (0.04) (0.10)
2. Years. Cohorts.
Gender -0.56*** -3.33 0.14** 0.35 -0.42*** -3.28*** 0.12** 0.29 -0.47*** -5.52*** 0.02 2.23
(0.05) (0.18) (0.05) (1.05) (0.23) (0 .17) (0.04) (0.69) (0.07) (0.34) (0.04) (2.94)

115
3. 2 + Country
Fixed Effects -0.20*** -0.39 -0.15** 0.12 -0.36*** 7.07
(0.05) (0.90) (0.05) (0.71) (0.05) 6.27
4. 3
+Demographics -0.19*** -0.51 0.13* 0.45 -0.12** 0.33 0.12** 0.32 -0.28*** (9.11) 0.03 2.36
(0.05) (0.93) (0.05) (1.12) (0.04) (0.71) (0.04) (0.70) (0.05) 6.65 (0.04) (2.85)
5. 4+ Health
Controls -0.14** -0.75 0.12* 0.32 -0.07 -0.10 0.11* 0.22 -0.21*** 3.05 0.02 3.70
(0.05) (0.78) (0.05) (0.90) (0.04) (0.66) (0.04) (0.62) (0.05) (3.18) (0.05) (3.49)
Notes: Ordinary Least Squares (OLS); Instrumental Variable Methods (IV); Fixed Effects (FE); Instrumental Variable Fixed Effect Methods
(IV-FE). Retirement definitions: SR_Ret is based on self-reports of current job status; NW1_Ret includes homemakers along with those
who say they are sick or disabled into the set of retirees, but conditions on working at the age of 50; NW2_Ret defines as retired all those are
not working now.
Source: Authors’ computations.
116
Appendix Table 4.1. Descriptive statistics
ALL COUNTRIES SHARE
Variable Obs Mean Std. Dev. Min Max Obs Mean Std. Dev. Min Max
words recalled(0-20 scale) 169487 10.36 3.38 0 20 91485 9.86 3.41 0 20
SR_Ret 142545 0.47 0.50 0 1 75733 0.51 0.50 0 1
NW1_Ret 157945 0.52 0.50 0 1 84831 0.56 0.50 0 1
NW2_Ret 173559 0.49 0.50 0 1 92422 0.52 0.50 0 1
Age 174395 60.51 5.70 50 70 93061 60.29 5.73 50 70
Female 174395 0.55 0.50 0 1 93061 0.54 0.50 0 1
Married 171965 0.79 0.41 0 1 90653 0.82 0.39 0 1
Education 167031 1.84 0.72 1 3 89422 1.91 0.63 1 3
Skill: 1 Unskilled 167031 0.64 0.48 0 1 89422 0.75 0.43 0 1
Bad Health 168452 0.24 0.43 0 1 93061 0.26 0.44 0 1
ADLAs 173896 0.08 0.28 0 1 92679 0.06 0.23 0 1
IADLAs 173888 0.03 0.17 0 1 92679 0.02 0.13 0 1
Minor conditions 173884 0.56 0.50 0 1 92623 0.46 0.50 0 1
Mayor conditions 173836 0.22 0.41 0 1 92623 0.17 0.37 0 1
Physcial demanding job 54202 0.22 0.41 0 1 19141 0.20 0.40 0 1
Occupation: 1 Blue-collar 62516 0.39 0.49 0 1 18115 0.47 0.50 0 1
ELSA HRS
Variable Obs Mean Std. Dev. Min Max Obs Mean Std. Dev. Min Max
words recalled(0-20 scale) 30567 11.33 3.30 0 20 47435 10.70 3.18 0 20
SR_Ret 26900 0.44 0.50 0 1 39912 0.42 0.49 0 1
NW1_Ret 29965 0.49 0.50 0 1 43149 0.47 0.50 0 1

117
NW2_Ret 31609 0.48 0.50 0 1 49528 0.44 0.50 0 1
Age 31630 60.57 5.42 50 70 49704 60.89 5.77 50 70
Female 31630 0.54 0.50 0 1 49704 0.57 0.50 0 1
Married 31622 0.78 0.41 0 1 49690 0.74 0.44 0 1
Education 27917 1.96 0.89 1 3 49692 1.64 0.73 1 3
Skill: 1 Unskilled 27917 0.58 0.49 0 1 49692 0.49 0.50 0 1
Bad Health 25687 0.21 0.41 0 1 49704 0.23 0.42 0 1
ADLAs 31612 0.12 0.33 0 1 49605 0.11 0.31 0 1
IADLAs 31612 0.03 0.16 0 1 49597 0.05 0.22 0 1
Minor conditions 31621 0.55 0.50 0 1 49640 0.74 0.44 0 1
Mayor conditions 31621 0.23 0.42 0 1 49592 0.31 0.46 0 1
Physcial demanding job 11612 0.28 0.45 0 1 23449 0.20 0.40 0 1
Occupation: 1 Blue-collar 19851 0.39 0.49 0 1 24550 0.33 0.47 0 1
Notes: The following are the variables listed in the above table: Survey of Health, Ageing and Retirement in Europe (SHARE)
English Longitudinal Study of Aging (ELSA), and U.S. Health and Retirement Study (HRS).
Source: Authors’ computations
118
Appendix Table 4.2. Early and full retirement ages across the OECD nations
Early and full retirement ages (full retirement ages in parentheses)
2004 2006 2008 2010 2012
Country Males Females Males Females Males Females Males Females Males Females
Austria 65 (65) 60 (60) 65 (65) 65 (65) 65 (65) 65 (65) 62(65) 60(65) 62(65) 62(65)
Belgium 60(65) 60 (65) 60(65) 60(65) 60(65) 60(65) 60(65) 60(65) 62(65) 62(65)
Czech Republic 60(65) 58 (63) 60(65) 58 (63) 60(65) 60(64) 60(65) 60(64) 64(69) 64(69)
Denmark 65 (65) 65 (65) 65 (65) 65 (65) 65 (65) 65 (65) 67(67) 67(67) 67(67) 67(67)
France 60 (60) 60(60) 60 (60) 60 (60) 61(61) 61(61) 56-60(65) 56-60(65) 60(67) 60(67)
Germany 63(65) 63(65) 63(65) 63(65) 63(67) 63(67) 63(67) 63(67) 63(67) 63(67)
Italy 60(65) 60(65) 60(65) 60(60) 60(65) 60(60) 61(65) 60(60) 62(67) 62(67)
Netherlands 60(65) 60(65) 60(65) 60(65) 60(65) 60(65) 65(65) 65(65) 67(67) 67(67)
Spain 60(65) 60(65) 60(65) 60(65) 60(65) 60(65) 61(65) 61(65) 65(67) 65(67)
Sweden 61(65) 61(65) 61(65) 61(65) 61(65) 61(65) 61(65) 61(65) 61(65) 61(65)
Switzerland 63(65) 62(64) 63(65) 62(64) 63(65) 62(64) 63(65) 62(64) 63(65) 62(64)
England 65(65) 65(65) 68(68) 68(68) 68(68) 68(68) 68(68) 68(68) 68(68) 68(68)
United States* 62(65+) 62(65+) 62(65+) 62(65+) 62(65+) 62(65+) 62(65+) 62(65+) 62(65+) 62(65+)
*Full retirement age depends on birth year
Sources: OECD Pensions at a Glance several years.

119
Appendix Table 4.3. First stage results, pooled data
Dependent
Variables
SR_Ret
NW1_Ret NW2_Ret
First Stage
1. No Controls Above full
retirement age
0 .25*** 0 .22*** 0 .20***
(0 .003) (0 .003) (0 .003)
Above early
retirement age
0.42*** 0.38*** 0.29***
(0 .003) (0 .003) (0 .003)
2. Years, Cohorts,
Gender
Above full
retirement age
0.48*** 0.04*** 0.04***
(0.004) (0.004) (0.004)
Above early
retirement age
0.14*** 0.12*** 0.08***
(0.003) (0.003) (0.003)
3. 2 + Country
Fixed Effects
Above full
retirement age
0.031*** 0.025*** 0.022***
(0.004) (0.004) (0.004)
Above early
retirement age
0.10*** 0.10*** 0.05***
(0 .003) (0 .003) (0 .003)
4. 3
+Demographics Above full
retirement age
0.035*** 0.025*** 0.024***
(0 .004) (0 .004) (0 .004)
Above early
retirement age
0.10*** 0.10*** 0.05***
(0 .003) (0 .003) (0 .003)
5. 4+ Health
Controls
Above full
retirement age
0.05*** 0.04*** 0.08***
(0 .004) (0 .004) (0 .19)
Above early
retirement age
0.12*** 0.11*** 0.03
(0 .003) (0 .003) (0 .02)
Notes: The following are the variables listed in the above table: self-reports of current job status (SR_Ret ),
homemakers with those who say they are sick or disabled (NW1_Ret), and all those who are not working now (NW2_Ret).
Source: Authors’ computations

120
Appendix Table 4.4. First stage results by skill group, pooled data
Dependent
Variables SR_Ret NW1_Ret NW2_Ret SR_Ret NW1_Ret NW2_Ret
First Stage: Unskilled workers First Stage: Middle and Skilled workers
1. No Controls Above full
retirement age
0 .22*** 0 .19*** 0 .18*** 0 .30*** 0 .27*** 0 .23***
(0 .00) (0 .00) (0 .00) (0 .00) (0 .00) (0 .00)
Above early
retirement age
0.45*** 0.39*** 0.29*** 0.34*** 0.35*** 0.25***
(0 .00) (0 .00) (0 .00) (0 .00) (0 .00) (0 .00)
2. Years, Cohorts,
Gender
Above full
retirement age
0.04*** 0.04*** 0.04*** 0.03*** 0.03*** 0.02*
(0.00) (0.00) (0.00) (0.00) (0.00) (0.00)
Above early
retirement age
0.16*** 0.13*** 0.08*** 0.06*** 0.07*** 0.03***
(0.00) (0.00) (0.00) (0.00) (0.00) (0.00)
3. 2 + Country
Fixed Effects
Above full
retirement age
0.03*** 0.03*** 0.02*** 0.03*** 0.02** 0.02**
(0.00) (0.00) (0.00) (0.00) (0.00) (0.00)
Above early
retirement age
0.12*** 0.11*** 0.06*** 0.05*** 0.07*** 0.03***
(0.00) (0.00) (0.00) (0.00) (0.00) (0.00)
4. 3
+Demographics Above full
retirement age
0.03*** 0.02*** 0.02*** 0.03*** 0.01** 0.02*
(0.00) (0.00) (0.00) (0.00) (0.00) (0.00)
Above early
retirement age
012*** 011*** 0.06*** 0.06*** 0.07*** 0.03***
(0.00) (0.00) (0.00) (0.00) (0.00) (0.00)
5. 4+ Health
Controls
Above full
retirement age
0.04*** 0.03*** 0.03*** 0.04*** 0.03*** 0.03***
(0.00) (0.00) (0.00) (0.00) (0.00) (0.00)
Above early
retirement age
0.13*** 0.11*** 0.06*** 0.06*** 0.08*** 0.05***
(0.00) (0.00) (0.00) (0.00) (0.00) (0.00)
Notes: The following are the variables listed in the above table: self-reports of current job status (SR_Ret ),
homemakers with those who say they are sick or disabled (NW1_Ret), and all those who are not working now (NW2_Ret).
Source: Authors’ Computations

121
Appendix Table 4.5. First stage results by physical demanding jobs groups, pooled data
Dependent
Variables SR_Ret NW1_Ret NW2_Ret SR_Ret NW1_Ret NW2_Ret
Fisrt Stage: Physical demanding job Fisrt Stage: More Intelectual job
1. No Controls Above full
retirement age
0 .25*** 0 .23*** 0 .13*** 0 .28*** 0 .27*** 0 .14***
(0 .014) (0 .01) (0 .01) (0 .007) (0 .007) (0 .006)
Above early
retirement age
0.24*** 0.26*** 0.14*** 0.20*** 0.25*** 0.13***
(0 .011) (0 .01) (0 .01) (0 .005) (0 .005) (0 .005)
2. Years, Cohorts,
Gender
Above full
retirement age
0.024*** -0.03** 0.01 0.08*** 0.05*** -0.01
(0.017) (0.02) (0.02) (0.008) (0.006) (0.08)
Above early
retirement age
0.07*** 0.01 0.09*** 0.03*** 0.06*** -0.001
(0.011) (0.01) (0.01) (0.005) (0.006) (0.005)
3. 2 + Country
Fixed Effects
Above full
retirement age
0.01*** 0.00 -0.03 0.06*** 0.04*** -0.007
(0.016) (0.004) (0.02) (0.008) (0.009) (0.008)
Above early
retirement age
0.05*** 0.07*** 0.01 0.03*** 0.06*** 0.01
(0 .013) (0 .01) (0 .01) (0 .006) (0 .007) (0 .006)
4. 3
+Demographics Above full
retirement age
-0.006 0.014 0.05*** 0.06*** 0.04*** -0.009
(0 .01) (0 .02) (0 .02) (0 .009) (0 .009) (0 .008)
Above early
retirement age
0.06*** 0.07*** 0.01 0.03*** 0.06*** 0.01
(0 .01) (0 .014) (0 .01) (0 .006) (0 .007) (0 .006)
5. 4+ Health
Controls
Above full
retirement age
0.01*** -0.00 -0.03 0.07*** 0.05*** 0.002
(0 .02) (0 .02) (0 .02) (0 .009) (0 .009) (0 .008)
Above early
retirement age
0.06*** 0.07*** 0.02* 0.04*** 0.07*** 0.02***
(0 .01) (0 .01) (0 .01) (0 .006) (0 .007) (0 .006)
Notes: The following are the variables listed in the above table: self-reports of current job status (SR_Ret ),
homemakers with those who say they are sick or disabled (NW1_Ret), and all those who are not working now (NW2_Ret).
Source: Authors’ computations
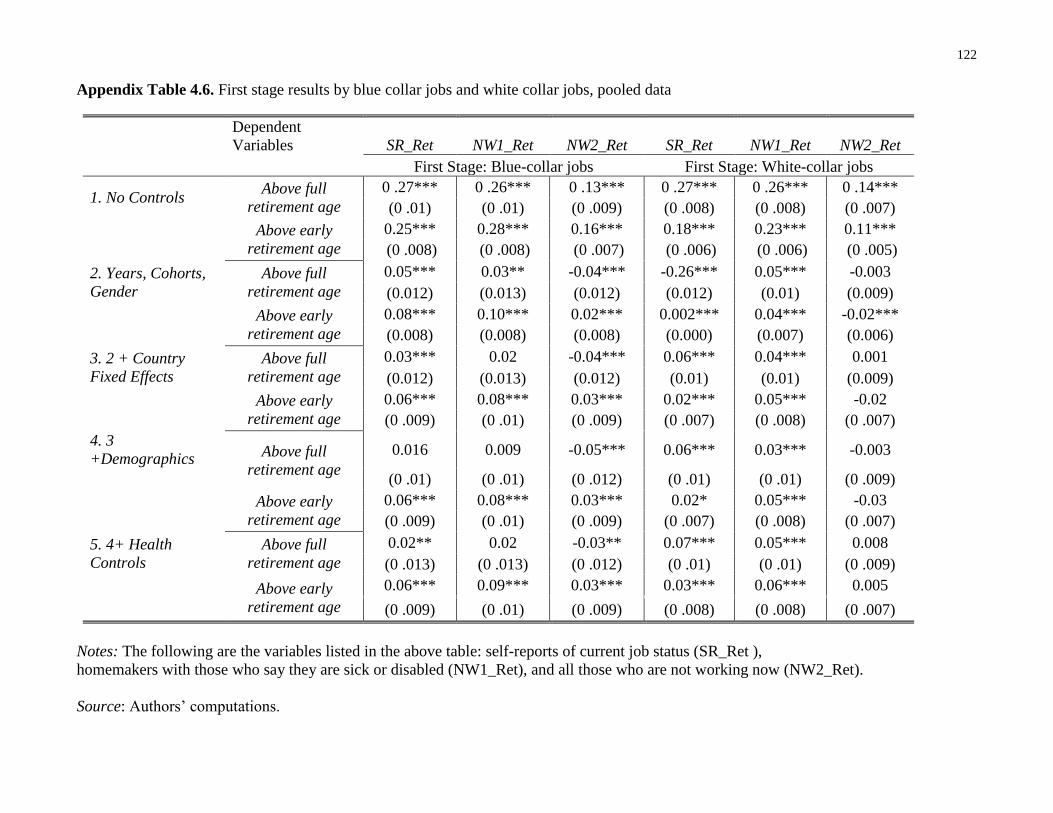
122
Appendix Table 4.6. First stage results by blue collar jobs and white collar jobs, pooled data
Dependent
Variables SR_Ret NW1_Ret NW2_Ret SR_Ret NW1_Ret NW2_Ret
First Stage: Blue-collar jobs First Stage: White-collar jobs
1. No Controls Above full
retirement age
0 .27*** 0 .26*** 0 .13*** 0 .27*** 0 .26*** 0 .14***
(0 .01) (0 .01) (0 .009) (0 .008) (0 .008) (0 .007)
Above early
retirement age
0.25*** 0.28*** 0.16*** 0.18*** 0.23*** 0.11***
(0 .008) (0 .008) (0 .007) (0 .006) (0 .006) (0 .005)
2. Years, Cohorts,
Gender
Above full
retirement age
0.05*** 0.03** -0.04*** -0.26*** 0.05*** -0.003
(0.012) (0.013) (0.012) (0.012) (0.01) (0.009)
Above early
retirement age
0.08*** 0.10*** 0.02*** 0.002*** 0.04*** -0.02***
(0.008) (0.008) (0.008) (0.000) (0.007) (0.006)
3. 2 + Country
Fixed Effects
Above full
retirement age
0.03*** 0.02 -0.04*** 0.06*** 0.04*** 0.001
(0.012) (0.013) (0.012) (0.01) (0.01) (0.009)
Above early
retirement age
0.06*** 0.08*** 0.03*** 0.02*** 0.05*** -0.02
(0 .009) (0 .01) (0 .009) (0 .007) (0 .008) (0 .007)
4. 3
+Demographics Above full
retirement age
0.016 0.009 -0.05*** 0.06*** 0.03*** -0.003
(0 .01) (0 .01) (0 .012) (0 .01) (0 .01) (0 .009)
Above early
retirement age
0.06*** 0.08*** 0.03*** 0.02* 0.05*** -0.03
(0 .009) (0 .01) (0 .009) (0 .007) (0 .008) (0 .007)
5. 4+ Health
Controls
Above full
retirement age
0.02** 0.02 -0.03** 0.07*** 0.05*** 0.008
(0 .013) (0 .013) (0 .012) (0 .01) (0 .01) (0 .009)
Above early
retirement age
0.06*** 0.09*** 0.03*** 0.03*** 0.06*** 0.005
(0 .009) (0 .01) (0 .009) (0 .008) (0 .008) (0 .007)
Notes: The following are the variables listed in the above table: self-reports of current job status (SR_Ret ),
homemakers with those who say they are sick or disabled (NW1_Ret), and all those who are not working now (NW2_Ret).
Source: Authors’ computations.

123
Appendix Table 4.7. Effect of retirement on cognition by survey
HRS SR_Ret NW1_Ret NW2_Ret
OLS IV FE IV-FE OLS IV FE IV-FE OLS IV FE IV-FE
1. No Controls -1.05*** -1.56*** -0.46*** -1.81*** -0.89*** -1.39*** -0.38*** -1.76*** -1.01*** -1.95*** -0.35*** -2.34***
(0.04) (0.06) (0.06) (0.16) (0.04) (0.06) (0.05) (0.13) (0.04) (0.08) (0.04) (0.17)
2. Years, Cohorts,
Gender -0.89*** -0.30 -0.12 0.20 -0.73*** -0.12 -0.08 -0.08 -0.98*** 0.25 -0.13** 0.35
(0.05) (0.45) (0.06) (0.5) (0.05) (0.43) (0.05) (0.43) (0.04) (0.73) (0.05) (0.70)
3. 2
+Demographics -0.65*** 0.23 -0.12 0.19 -0.53*** 0.48 -0.08 -0.09 -0.66*** 1.18 -0.13** 0.35
(0.05) (0.45) (0.06) (0.49) (0.04) (0.42) (0.05) (0.43) (0.04) (0.76) (0.05) (0.70)
4. 3+ Health
Controls -0.37*** 0.14 -0.10 0.18 -0.28*** 0.29 -0.06 -0.08 -0.40*** 0.77 -0.11* 0.29
(0.05) (0.43) (0.06) (0.49) (0.04) (0.40) (0.05) (0.43) (0.04) (0.67) (0.05) (0.69)
ELSA SR_Ret NW1_Ret NW2_Ret
OLS IV FE IV-FE OLS IV FE IV-FE OLS IV FE IV-FE
1. No Controls -0.74 -2.54*** 0.03 -1.14* -0.79*** -2.75*** 0.04 -1.64*** -0.90*** -2.94*** 0.0002 -1.43**
(0.05) (0.1) (0.06) (0.48) (0.05) (0,11) (0,05) (0,50) (0.05) (0.12) (0.05) (0,46)
2. Years, Cohorts,
Gender -0.83*** -5.68*** 0.04 0.03 -0.98*** -6.19*** 0,06 0.42 -1.13*** -8.77*** 0,01 0,34
(0.02) (0.20) (0.07) (0.66) (0.02) (0.23) (0,06) (0,71) (0.03) (0.34) (0.06) (0,86)
3. 2
+Demographics 0.07 -1.62* 0.07 -0.18 -0.19** -1,80 0,08 0,16 -0.34*** -2.29* 0,03 0,11
(0.07) (0.76) (0.07) (0.70) (0,06) (0,94) (0,06) (0,75) (0.06) (1.14) (0.06) (0,90)
4. 3+ Health
Controls 0.15* -1.97 0.06 -0.33 -0.28*** -2,49 0,06 -0,15 -0.41*** -3,24 0,05 -0,30

124
(0.07) (1.20) (0.08) (0.83) (0.02) (1,50) (0,07) (0,87) (0.02) (1.85) (0.07) (1,10)
SHARE SR_Ret NW1_Ret NW2_Ret
OLS IV FE IV-FE OLS IV FE IV-FE OLS IV FE IV-FE
1. No Controls -1.29*** -1.84*** 0.38*** 0.91*** -1.33*** -2.02*** 0.32*** 0.99*** -1.43*** -2.31** 0.13** 1.93***
(0.03) (0.04) (0.05) (0.12) (0.03) (0.04) (0.04) (0.13) (0.03) (0.04) (0.04) (0.22)
2. Years,
Cohorts, Gender -0.75*** -2.13*** -0.04 -0.189 -1.04*** -2.38*** -0.02 0.12 -1.15*** -2.49*** -0.07 0.39
(0.04) (0.19) (0.05) (0.38) (0.03) (0.25) (0.05) (0.43) (0.03) (0.26) (0.05) (0.89)
3. 2 + Country
Fixed Effects -0.52*** -0.84*** -0.75*** -0,57 -0.83*** -0.65
(0.04) (0.24)
(0.03) (0.30)
(0.03) (0,37)
4. 3
+Demographics -0.31*** -0.65** -0.04 -0.19 -1.03*** -2.38*** -0.01 0.12 -1.15*** -2.49*** -0.07 0.39
(0.04) (0.24) (0.05) (0.38) (0.03) (0.25) (0.05) (0.43) (0.03) (0.26) (0.04) (0.88)
5. 4+ Health
Controls -0.21*** -0.66** -0.04 -0.28 -0.75*** -0.56 -0.01 -0.03 -0.83*** -0.65 -0.06 0.09
(0.04) (0.23) (0.056) (0.40) (0.03) (0.30) (0.05) (0.45) (0.03) (0.37) (0.04) (0.89)
Notes: The following are the variables listed in the above table: self-reports of current job status (SR_Ret ),
homemakers with those who say they are sick or disabled (NW1_Ret), and all those who are not working now (NW2_Ret).
Source: Authors’ computations.

125
Appendix 4.8. Effect of retirement on cognition, pooled data by occupation
Blue-collar
workers SR_Ret NW1_Ret NW2_Ret
OLS IV FE IV-FE OLS IV FE IV-FE OLS IV FE IV-FE
1. No Controls -0.27*** -1.46*** 0.02 -0.003 -0.23*** -1.37*** 0.03 -0.13 -0.20** -2.40*** 0.02 -0.16
(0.06) (0.12) (0.06) (0.11) (0.06) (0.11) (0.05) (0.11) (0.06) (0.20) (0.05) 90.13)
2. Years,
Cohorts, Gender -0.35*** -2.51*** -0.04 0.06 -0.21*** -2.23*** 0.03 -0.33 -0.35*** -5.48*** 0.03 0.56
(0.07) (0.37) (0.07) (0.84) (0.06) (0.32) (0.06) (0.68) (0.07) (1.01) (0.06) (1.59)
3. 2 + Country
Fixed Effects -0.18* 0.034 -0.08 0.90 -0.27*** 0.65
(0.07) (0.38)
(0.06) (0.32)
(0.07) (0.74)
4. 3
+Demographics -0.16* 0.10 -0.003 -0.25 -0.08 0.25 0.06 -0.62 -0.17* 1.80 0.05 -0.07
(0.07) (1.28) (0.07) (0.89) (0.07) (0.89) (0.06) (0.70) (0.07) (1.91) (0.06) (1.54)
5. 4+ Health
Controls -0.10 -0.04 0.002 0.13 -0.04 0.06 0.04 -0.32 -0.09 1.59 0.06 -0.26
(0.07) (1.12) (0.08) (0.84) (0.07) (0.85) (0.07) (0.67) (0.07) (1.96) (0.07) (1.56)
White-collar
workers SR_Ret NW1_Ret NW2_Ret
OLS IV FE IV-FE OLS IV FE IV-FE OLS IV FE IV-FE
1. No Controls -0.35*** -2.16*** 0.03 -0.26* -0.27*** -1.76*** -0.01 -0.37*** -0.28*** -3.42*** -0.12** -0.49***
(0.05) (0.11) (0.05) (0.10) (0.05) (0.09) (0.04) (0.10) (0.05) (0.19) (0.04) (0.12)
2. Years.
Cohorts. Gender -0.48*** -3.45*** 0.13* 0.96 -0.33** -3.35*** 0.09 0.85 -0.50*** -5.44*** -0.05 -1.37
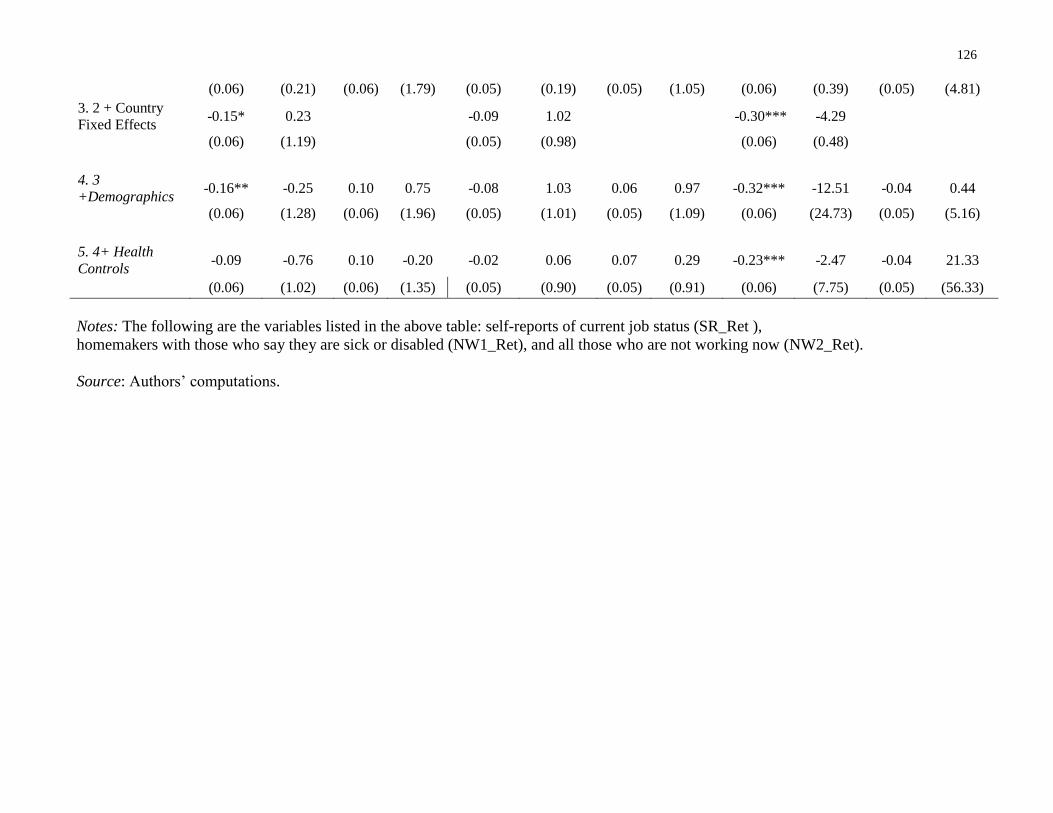
126
(0.06) (0.21) (0.06) (1.79) (0.05) (0.19) (0.05) (1.05) (0.06) (0.39) (0.05) (4.81)
3. 2 + Country
Fixed Effects -0.15* 0.23 -0.09 1.02 -0.30*** -4.29
(0.06) (1.19)
(0.05) (0.98)
(0.06) (0.48)
4. 3
+Demographics -0.16** -0.25 0.10 0.75 -0.08 1.03 0.06 0.97 -0.32*** -12.51 -0.04 0.44
(0.06) (1.28) (0.06) (1.96) (0.05) (1.01) (0.05) (1.09) (0.06) (24.73) (0.05) (5.16)
5. 4+ Health
Controls -0.09 -0.76 0.10 -0.20 -0.02 0.06 0.07 0.29 -0.23*** -2.47 -0.04 21.33
(0.06) (1.02) (0.06) (1.35) (0.05) (0.90) (0.05) (0.91) (0.06) (7.75) (0.05) (56.33)
Notes: The following are the variables listed in the above table: self-reports of current job status (SR_Ret ),
homemakers with those who say they are sick or disabled (NW1_Ret), and all those who are not working now (NW2_Ret).
Source: Authors’ computations.