retirement-income systems in 53 countries pensions panorama
TRANSCRIPT

75%
50%
25%0 1 2 3
Pensions Panorama
Edward Whitehouse
Retirement-IncomeSystems in 53 Countries


Pensions Panorama


Pensions PanoramaRetirement-Income Systems in 53 Countries
Edward Whitehouse
THE WORLD BANKWASHINGTON, D.C.

© 2007 The International Bank for Reconstruction and Development / The World Bank1818 H Street NWWashington DC 20433Telephone: 202-473-1000Internet: www.worldbank.orgE-mail: [email protected]
All rights reserved.
1 2 3 4 10 09 08 07
The findings, interpretations, and conclusions expressed in this volume do not necessarily reflect theviews of the Executive Directors of the World Bank or the governments they represent.
The World Bank does not guarantee the accuracy of the data included in this work. The bound-aries, colors, denominations, and other information shown on any map in this work do not implyany judgement on the part of the World Bank concerning the legal status of any territory or theendorsement or acceptance of such boundaries.
Rights and PermissionsThe material in this publication is copyrighted. Copying and/or transmitting portions or all of thiswork without permission may be a violation of applicable law. The International Bank for Recon-struction and Development/The World Bank encourages dissemination of its work and willnormally grant permission to reproduce portions of the work promptly.
For permission to photocopy or reprint any part of this work, please send a request with completeinformation to the Copyright Clearance Center Inc., 222 Rosewood Drive, Danvers, MA 01923, USA;telephone: 978-750-8400; fax: 978-750-4470; Internet: www.copyright.com.
All other queries on rights and licenses, including subsidiary rights, should be addressed to theOffice of the Publisher, The World Bank, 1818 H Street NW, Washington, DC 20433, USA; fax: 202-522-2422; e-mail: [email protected].
ISBN-10: 0-8213-6764-1ISBN-13: 978-0-8213-6764-3eISBN-10: 0-8213-6765-XDOI: 10.1596/978-0-8213-6764-3
Library of Congress Cataloging-in-Publication Data has been applied for.
Cover photos: Curt Carnemark, World Bank, and Jonathan French, World Bank.Cover design: Serif Design Group, Inc.

Edward Whitehouse works in the Social Policy Division of the Organisation for EconomicCo-operation and Development (OECD). While this volume was being prepared, he wasDirector of Axia Economics, a London-based consultancy specializing in the micro-economic analysis of public policy. He was also coeditor of the World Bank’s PensionReform Primer program.
v
Biographical Note


vii
Contents
Biographical Note v
Background and Acknowledgments xi
Abbreviations xiii
PART I: CROSS-COUNTRY ANALYSIS
1 Introduction 3
2 Typology 5
3 Parameters 11
4 Modeling Pensions 25
5 Pension Entitlements 31
6 Net Pension Entitlements 35
7 The Link between Pensions and Earnings 39
8 Conclusions 43
PART II: COUNTRY STUDIES BY REGION
9 Introduction 49
10 High-Income OECD CountriesAustralia 53Austria 56Belgium 59Canada 62

viii PENSIONS PANORAMA: RETIREMENT-INCOME SYSTEMS IN 53 COUNTRIES
Denmark 65Finland 68France 71Germany 74Greece 77Iceland 80Ireland 83Italy 86Japan 89Republic of South Korea 92Luxembourg 95The Netherlands 98New Zealand 101Norway 104Portugal 107Spain 110Sweden 113Switzerland 116The United Kingdom 119The United States 122
11 Eastern Europe and Central AsiaBulgaria 127Croatia 130The Czech Republic 133Estonia 136Hungary 139Latvia 142Lithuania 145Poland 148The Slovak Republic 151Turkey 154
12 Latin America and the CaribbeanArgentina 159Chile 162Colombia 165Costa Rica 168The Dominican Republic 171El Salvador 174Mexico 177Peru 180Uruguay 183
13 Middle East and North AfricaAlgeria 189Bahrain 192Djibouti 195The Arab Republic of Egypt 198The Islamic Republic of Iran 201

CONTENTS ix
Jordan 204Libya 207Morocco 210Tunisia 213The Republic of Yemen 216
References 219
Index 221
Figure7.1 The Link between Preretirement Earnings and Pension Entitlements
(Gross pension entitlement as a proportion of economywide average earnings to individual earnings) 40
Tables2.1 Structure of Pension Systems 63.1 Summary of Pension System Parameters, High-Income OECD Countries 143.2 Summary of Pension System Parameters, Eastern Europe and Central Asia 163.3 Summary of Pension System Parameters, Latin America and the Caribbean 173.4 Summary of Pension System Parameters, Middle East and North Africa 183.5 Earnings Measure and Valorization: Earnings-Related Schemes 193.6 Procedures for Adjustment of Pensions in Payment:
Earnings-Related Schemes 225.1 Gross Replacement Rates by Earnings Level, Mandatory Pension
Programs, Men (Percentage of individual preretirement gross earnings) 326.1 Net Replacement Rates by Earnings Level, Mandatory Pension
Programs, Men (Percentage of individual preretirement net earnings) 36


xi
THE ACCURATE PRESENTATION OF PENSION SYSTEMS OF A COUNTRY and the comparison ofsystems across countries are crucial parts of policy analysis and reform. This is equallyvalid for the high-income countries of the Organisation for Economic Co-operation andDevelopment (OECD) as it is for the low- and middle-income countries that are theclients of the World Bank. Yet such presentations and comparisons are far from easy, andthey require a well-thought-through methodology, access to detailed information at thecountry level, verification of information and outcome by country specialists, and anetwork of pension experts who provide feedback and input and thus help improve theproduct over time.
The calculation of pension entitlements uses the Axia Economics APEX (Analysis ofPension Entitlements across Countries) model. This and the country models were devel-oped with the financial support of the OECD (Directorate for Employment, Labour, andSocial Affairs, Economics Department; Directorate for Financial and Enterprise Affairs,Centre for Tax Policy and Administration); the World Bank (Social Protection Department,Middle East and North Africa Region, South Asia Region); the International Federation ofPension Fund Administrators (FIAP); and Watson Wyatt (as part of the World EconomicForum’s “Global Pension-System Readiness” initiative).
I am especially grateful to Robert Palacios of the World Bank, who has providedconstant encouragement and inspiration (along with more mundane help in finding infor-mation, particularly on Eastern Europe and Latin America). Monika Queisser of theOECD’s Social Policy Division contributed enormously to modeling the OECD countriesand coauthored the report Pensions at a Glance: Public Policies across OECD Countries(OECD 2005; see also Queisser and Whitehouse 2006). David Robalino of the World Bankprovided information on the Middle East and North Africa and many fruitful method-ological discussions (results for this region were published in Robalino et al. [2005]). GordonKeenay of KPMG modeled personal income taxes and social security contributions for the30 OECD countries.
Numerous people have offered valuable information, advice, and encouragement.These include Bernard Casey of the Pensions Institute, Cass Business School, CityUniversity, London; Richard Disney, Professor of Economics at the University ofNottingham; John Martin and Martine Durand, Director and Deputy Director, respectively,of Employment, Labour, and Social Affairs at the OECD; Peter Hicks, Assistant DeputyMinister, Social Development, Canada; Robert Holzmann, Sector Director of Social
Background and Acknowledgments

Protection and Labor at the World Bank; David Lindeman, formerly of the World Bank andOECD; Montserrat Pallares-Miralles of the World Bank; Mark Pearson, Head of SocialPolicy at the OECD; John Piggott, Professor of Economics at the University of New SouthWales; Anita Schwarz and Yvonne Sin of the World Bank; and David Stanton and AdairTurner of the Pensions Commission in the United Kingdom. Delegates to the OECDWorking Party on Social Policy patiently helped us understand their countries’ pensionsystems and checked the modeling results.
The analysis has benefited from discussion at numerous events: a seminar at theCentre for Pensions and Superannuation, University of New South Wales, April 2002(Whitehouse 2002); the conference “Pension System Perspectives,” Vilnius, December2002; “Adequate and Sustainable Pensions through Private Provision: Lessons from andfor Reforms in Central and Eastern Europe,” Tallinn, April 2003; a seminar at the Instituteof Ageing, University of Oxford, May 2003; World Bank workshops on pension reform inJohannesburg, Malta, Cape Town, and Paris, February, June, July, and September 2003; aseminar at the Directorate of Employment, Labour, and Social Affairs, OECD, Paris, July2003; the conference “Financial Security in Retirement in Post-socialist Countries,” Kiev,October 2003; a seminar at the World Bank, Washington, DC, November 2003; a presenta-tion at the OECD Working Party on Social Policy, Paris, November 2003; a joint OECDand BMGS (Federal Ministry of Social Security, Germany) conference on “SustainableOld-Age Provision,” Berlin, November 2004; a seminar at the Brookings Institution,Washington, DC, May 2005; and at the APPAM Conference, Washington, DC, November2005.
Full responsibility for the results rests with the author: any views expressed commitneither the OECD Secretariat nor the World Bank nor any of their member governments.
xii PENSIONS PANORAMA: RETIREMENT-INCOME SYSTEMS IN 53 COUNTRIES

ACC Accident Compensation Corporation (New Zealand)APEX Analysis of Pension Entitlements across CountriesATI aggregate taxable income (Belgium)ATP Arbeidsmarkedets Tillægspension (Denmark)BMGS Federal Ministry of Social Security (Germany)CSG contribution sociale generalisée (France)DB defined-benefitDC defined-contributionFIAP International Federation of Pension Fund AdministrationGDP gross domestic productITP Industrins och handelns tilläggspension (Sweden)Mig minimum income guarantee (United Kingdom)OECD Organisation for Economic Co-operation and DevelopmentPAYG pay as you goPBU basic universal benefit (Argentina)SA social assistanceS2P state second pension (United Kingdom)UF Unidades de Fomento (Chile)
xi i i
Abbreviations


Part I: Cross-Country Analysis


PENSIONS PANORAMA PROVIDES A COMPENDIUM OF FACTS and analysis that should informpolicy making and public debate about retirement-income systems around the world.Robert Holzmann, Director of Social Protection at the World Bank, and Mark Pearson,Head of Social Policy at the Organisation for Economic Co-operation and Development(OECD), introduce the report.
Reforming pensions is a central policy issue in developed and developing countriesalike. However, it is challenging and controversial because it involves long-term planningby governments faced with numerous short-term pressures. Pension reform usually pro-vokes heated ideological debates and, often, street protests.
There are valuable lessons to be learned from other countries’ pension systems and theirexperiences of retirement-income reforms. However, national pension systems are verycomplicated and international comparisons are consequently very difficult. Many interna-tional analyses get bogged down in institutional, technical, and legal detail, making itimpossible to transfer policy lessons between countries. This study combines painstaking,rigorous analysis with clear, easy-to-understand presentation of empirical results.
Pensions Panorama does not advocate any particular kind of pension system or type ofpension reform. We hope the analysis in this report can inform debates on retirement-income systems by presenting “hard” data that people with different visions for the futureof pensions can all use as a reference point.
International comparisons of retirement-income regimes to date have tended to focuson the question of fiscal and financial sustainability: whether the pension promises madeto today’s workers will be affordable in the future. Much less attention has been paid tothe future adequacy of pension benefits, to the impact of pension reforms on the distribu-tion of income among older people, and on the means to combat old-age poverty. Theseissues, which may be termed social sustainability, are a core concern of this study.
The OECD published the report Pensions at a Glance: Public Policies across OECDCountries in 2005. This study extends the analysis to cover 23 countries that are not mem-bers of the OECD. These nations lie in three different regions of the world: Eastern Europeand Central Asia, Latin America and the Caribbean, and the Middle East and North Africa.Together, the countries covered in this report account for a quarter of the world’s populationand approximately 58 percent of workers around the world who are covered by formalpension systems.
Structure of the Report
The following section sets out a typology: a way of defining and classifying different kinds ofpension schemes. It shows which countries have which types of pension schemes, coveringall elements of the retirement-income system, including resource-tested benefits and basicpensions as well as public, earnings-related, and compulsory private pension plans. Next,the study sets out the institutional detail: the parameters and rules of different parts ofthe retirement-income system. The parameters are followed by the methodology: How are
3
1. Introduction
pension entitlements modeled? What assumptions are used? The baseline assumptionswill not be to everyone’s taste, but the beauty of the pension models is that the value ofthese variables may be changed.
The next section presents the core, empirical results: future pension entitlements oftoday’s workers with different levels of earnings from all sources. This section includes thefamiliar replacement rate indicator: individual pension entitlements as a proportion ofindividual earnings when working. The following section explores the important role thatpersonal income taxes and social security contributions play in determining the relativeincomes of older people. In particular, it shows net replacement rates (that is, pension netof taxes and any contributions, relative to earnings, net of taxes and contributions). The thirdsection on empirical results looks at the link between pension entitlements in retirement andearnings in work. This analysis highlights the key differences in philosophy between dif-ferent countries’ retirement-income systems. Moreover, changes to the pensions-earningslink have been central to many recent reforms to retirement-income regimes.
Conclusions
The concluding section sets out a number of dimensions in which the pension systems of 53countries differ. What is the target replacement rate? What weights are given to the objectivesof adequacy and insurance? How strongly are pension entitlements linked to earnings whenworking? What are the relative roles of the public and private sectors? Are antipoverty bene-fits universal or resource tested? Are insurance pensions provided through defined-benefitsystems, points schemes, notional accounts, or defined-contribution schemes?
These questions are central to pension policy making. This report’s clarity, objectivity,and rigor should contribute hugely to an improved debate on the future of retirement-income systems.
Future Developments
The World Bank and the OECD aim to continue this productive cooperation over theanalysis of pension systems in a number of ways. First, the OECD, in cooperation with theEuropean Commission, is updating the models to parameters and rules for 2004. This cov-ers the 36 countries that are members of the European Union or the OECD. Second, theanalysis of the OECD and European Union countries is being extended to look at pensionentitlements of workers who do not follow the full careers assumed in this report. Forexample, many systems offer protection for people who have time out of paid work caringfor children. The effect of childcare absences on pension entitlements will be modeled. Inaddition, the extended analysis will look at how retirement earlier or later than the normalpension age affects pension benefits. Third, the pension models will be expanded to othercountries, with the first group being in Asia, including India and China.
This report represents a first, albeit a huge, step toward a consistent, rigorous empir-ical analysis of pension systems and entitlements around the world. It should be a vitalstarting point for anyone thinking about pensions or about reforming retirement-income regimes.
Robert HolzmannWorld Bank, Washington, DC
Mark PearsonOECD, Paris
4 PENSIONS PANORAMA: RETIREMENT-INCOME SYSTEMS IN 53 COUNTRIES

THERE HAVE BEEN NUMEROUS TYPOLOGIES OF RETIREMENT-INCOME SYSTEMS. The terminol-ogy used in these categories has become very confusing. This paper uses a descriptiveclassification that may be applied consistently to 53 countries with diverse retirement-income systems.
The approach adopted here is based on the role and objective of each part of the pensionsystem. The framework has two mandatory tiers: a redistributive part and an insurancepart. Redistributive components of pension systems are designed to ensure that pension-ers achieve some absolute, minimum standard of living. Insurance components aredesigned to achieve a target standard of living for retirement that is based on the standardof preretirement years.1 Within these tiers, schemes are further classified by their form(public or private, defined benefit or defined contribution). This typology, therefore,clearly separates form from function, and description from prescription. Table 2.1 summa-rizes the pension systems of 53 countries, divided into the redistributive first tier and theinsurance second tier.
First-Tier, Redistributive Pensions
Nearly all countries have safety nets that aim to prevent poverty among older people.These schemes, called first-tier, redistributive schemes here, can be of four different types:basic pension schemes, separate targeted retirement-income programs, minimum pensionswithin earnings-related plans, and social assistance. All of these are provided by the publicsector and are mandatory.
BasicIn basic pension schemes, the benefit is either flat rate, that is, the same amount is paid toevery retiree, or the amount is determined by the number of working years (not by pastearnings). Additional income from other sources does not change entitlement to the basicpension.
Basic pension schemes are common in the high-income OECD countries (10 out of 24countries) and in Eastern Europe and Central Asia (4 out of 10 countries). However, thereare no examples in the Middle East and North Africa and just one in Latin America and theCaribbean.
TargetedTargeted plans, in contrast, pay higher benefits to poorer pensioners and reduced benefitsto better-off retirees. The targeting takes three different forms. First, benefits may bepension income tested (where the value depends only on the level of pension income aretiree receives), broader income tested (reduced payments if, for example, a retiree hasincome from savings), or broader means tested (reducing the pension to take account ofboth income and assets). Some countries do not have specific, targeted programs forolder people, but poor older people are entitled to the same general social-assistance
5
2. Typology

6 PENSIONS PANORAMA: RETIREMENT-INCOME SYSTEMS IN 53 COUNTRIES
Table 2.1. Structure of Pension Systems
First tier: universal coverage, Second tier: Tier: function redistributive mandatory, insurance
Provision Public Public Private
Type Targeted Basic Minimum Type Type
High-income OECD countriesAustralia ✔ DCAustria ✔ DBBelgium ✔ ✔ DBCanada ✔ ✔ DBDenmark ✔ ✔ DB + DC DCFinland ✔ DBFrance ✔ ✔ DB + pointsGermany ✔ PointsGreece ✔ ✔ DBIceland ✔ DBIreland ✔ ✔Italy ✔ n. acs.Japan ✔ DBKorea, Rep. of ✔ DBLuxembourg ✔ ✔ ✔ DBNetherlands ✔ ✔ DBNew Zealand ✔Norway ✔ ✔ PointsPortugal ✔ ✔ DBSpain ✔ DBSweden ✔ n. acs. DB + DCSwitzerland ✔ ✔ DB defined creditUnited Kingdom ✔ ✔ ✔ DBUnited States ✔ DB
Eastern Europe and Central AsiaBulgaria ✔ ✔ DB DCCroatia ✔ Points DCCzech Republic ✔ ✔ ✔ DBEstonia ✔ ✔ Points DCHungary ✔ DB DCLatvia ✔ n. acs. DCLithuania ✔ DB DCPoland ✔ n. acs. DCSlovak Republic ✔ PointsTurkey ✔ ✔ DB
Latin America and the CaribbeanArgentina ✔ DCChile ✔ DCColombia ✔ DCCosta Rica ✔ DB DCDominican Republic ✔ DCEl Salvador ✔ DCMexico ✔ DCPeru ✔ DCUruguay ✔ DB DC
(continued on the next page)

TYPOLOGY 7
Table 2.1. (continued)
benefits available to the whole population. These cases are also shown in the “targeted”column of table 2.1.
Virtually all of the OECD countries have some targeted pension scheme or social-assistance program. Most of the Latin American and Caribbean systems have a publiclyprovided minimum pension to support those with small entitlements to mandatoryprivate pensions. However, less than half of the 10 countries of Eastern Europe andCentral Asia have minimum pensions. Indeed, Croatia, Hungary, and the Slovak Republichave abolished or plan to abolish their targeted pensions as part of their fundamentalpension reforms.
MinimumMinimum pensions are similar to targeted plans since they also aim to prevent pensionsfrom falling below a certain level. However the institutional set-up and the eligibility con-ditions are different. Minimum pensions are defined as schemes that are governed by therules of the second-tier, earnings-related pension provision. (This means that the schemescalled minimum pensions in Latin America and the Caribbean, for example, are hereclassified as targeted programs since they are institutionally separate from second-tierprovision.) Usually, retirees must have paid contributions for a minimum number of yearsin order to receive benefits.
Minimum credits in earnings-related schemes, such as those in Belgium and the UnitedKingdom, have a similar effect: benefits for workers with very low earnings are calculatedas if the worker had earned at a higher level.
Overall, eight high-income OECD countries have a minimum pension or minimumcredits in their earnings-related schemes. They are also very common in Eastern Europeand Central Asia (7 out of 10 countries) and in the Middle East and North Africa (all exceptthe Republic of Yemen).
Approximately half of the OECD countries and those of Eastern Europe and CentralAsia rely on one primary instrument to prevent old-age poverty. The other half employ acombination of two or three schemes. In the other two regional groupings of countries, allhave only one redistributive program.
First tier: universal coverage, Second tier: Tier: function redistributive mandatory, insurance
Provision Public Public Private
Type Targeted Basic Minimum Type Type
Middle East and North AfricaAlgeria ✔ DBBahrain ✔ DBDjibouti ✔ DBEgypt, Arab Rep. of ✔ DBIran, Islamic Rep. of ✔ DBJordan ✔ DBLibya ✔ DBMorocco ✔ DBTunisia ✔ DBYemen, Rep. of DB
Note: n. acs. = notional accounts. The Slovak Republic has also introduced mandatory defined-contributionpensions (from January 2005).
Second-Tier, Mandatory Insurance
The second tier in this typology of pension schemes plays an insurance role. It aims toensure that retired people have an adequate replacement rate (retirement income relativeto earnings before retirement) and not just a poverty-preventing absolute standard ofliving. Like the first tier, it is mandatory. Only Ireland and New Zealand of the 53 countriesin this study do not have some form of mandatory, second-tier provision.
Defined BenefitOf the 53 countries, 32 have public, defined-benefit (DB) plans, making that by far themost common form of pension-insurance provision.
In DB schemes, the amount a pensioner receives depends on the number of years ofcontributions and on some measure of individual earnings throughout the working life.
DB schemes are the only kind of insurance pension found in the Middle East andNorth Africa. These schemes are rare in Latin America and the Caribbean: only CostaRica and Uruguay have a DB scheme for new workers. Half of Eastern Europe andCentral Asia and more than half of the high-income OECD countries have public DBprograms.
Defined ContributionThe second most common form of pension-insurance provision is the defined-contribution(DC) plan. Nineteen out of the 53 countries have DC plans.
In these schemes, each worker has an individual account in which contributions are savedand invested, and the accumulated capital is usually converted into a pension-incomestream at retirement; lump-sum withdrawals are rarely permitted. Typically, the capital hasto be used to buy an annuity (a guaranteed pension payment until death), which meetscertain conditions (such as indexation of benefits and provision of survivors’ benefits).
Although only three high-income OECD countries have mandatory DC schemes, theyare very common in Latin America and the Caribbean (all nine countries) and in EasternEurope and Central Asia (seven out of ten countries).
PointsFinally, some countries have earnings-related schemes that do not follow the traditional DBmodel. First, there are six points systems: the French occupational plans and the Croatian,Estonian, German, Norwegian, and Slovak public pension schemes.
Workers earn pension points based on their individual earnings for each year of contri-bution. At retirement, the sum of pension points is multiplied by a pension-point value toconvert them into a regular pension payment.
Notional AccountsFour countries also have notional-accounts schemes: the public plans of Italy, Latvia,Poland, and Sweden.
These are schemes that record each worker’s contributions in an individual account andapply a rate of return to the accounts. The accounts are notional in that both the incomingcontributions and the interest charged to them exist only on the books of the managinginstitution. At retirement, the accumulated notional capital in each account is convertedinto a stream of pension payments using a formula based on life expectancy at the timeof retirement.
8 PENSIONS PANORAMA: RETIREMENT-INCOME SYSTEMS IN 53 COUNTRIES

TYPOLOGY 9
Defined CreditsMandatory contributions to Swiss occupational plans look at first like a DC scheme, sinceindividuals and their employers must pay a contribution rate that varies with age.However, the government sets the minimum rate of return that the scheme must pay anda mandatory annuity rate at which the accumulation is converted into a flow of pensionpayments. Hence, the system has more elements of a DB than a DC plan.
Notes
1. Voluntary provision, individual or employer-provided, comprises a third tier. However,the focus of this report is on mandatory pensions alone.


11
THE MAIN FEATURES OF 53 COUNTRIES’ pension systems are summarized in tables 3.1through 3.4. This follows the typology of the previous section (table 2.1), dividing thepension system into two tiers. The summary necessarily leaves out much of the institu-tional details. Complete descriptions are provided in country chapters in Part II of thereport.
First-Tier, Redistributive Schemes
The level of benefits under first-tier, redistributive schemes is expressed as a percentage ofaverage earnings in each country.
In the cases of minimum pensions and basic pension schemes, the benefit entitlement isshown for workers who enter the workforce at age 20 and work without interruption untilthey reach the standard pension eligibility age. The social-assistance level is shown underthe targeted category only when there is no specific, targeted scheme for poor pensioners.(Only full-career workers with very low earnings will be eligible for the targeted andsocial-assistance programs; the majority of beneficiaries will be those with short and inter-rupted contribution histories.) The final row shows the total first-tier benefit to which afull-career worker would be entitled. This is relevant because, in some cases, workers canreceive several different types of first-tier benefits at the same time, while in others, theyare only eligible for one of the different programs.
The average minimum retirement benefit across the 24 high-income OECD countriesis 31 percent of average earnings. The basic pension in Japan and targeted schemes inFinland and the United States are on the low side, providing benefits worth approximatelyone-fifth of average earnings. At the other end of the spectrum, Luxembourg and Portugalhave a minimum pension well above 40 percent of average earnings.
The overall minimum retirement income is generally much lower in Eastern Europeand Central Asia than in the high-income OECD countries, averaging approximately 20percent of average earnings. Only Latvia and Turkey have benefits close to the average ofthe high-income OECD countries.
The average minimum retirement benefits in Latin America and the Caribbean and inthe Middle East and North Africa lie between the averages of the other two groups ofcountries at approximately 28 percent. However, the range of benefit levels is morediverse. For example, the Islamic Republic of Iran has a minimum of two-thirds of averageearnings and Colombia, one-half. The Republic of Yemen has no minimum pension, andthe Arab Republic of Egypt pays just 7 percent of average earnings.
Second-Tier, Earnings-Related Schemes
The second-tier insurance schemes offer several types of earnings-related plans: definedbenefit, points, or notional accounts. The main parameter that accounts for differences inthe value of these schemes is the accrual rate per year of contribution—that is, the rate at
3. Parameters

12 PENSIONS PANORAMA: RETIREMENT-INCOME SYSTEMS IN 53 COUNTRIES
which a worker earns benefit entitlements for each year of coverage. The accrual rate isexpressed as a percentage of the earnings that are covered by the pension scheme. Mostpension schemes cover only part of workers’ earnings up to a ceiling to calculate pensionbenefits. The rationale behind such ceilings is the view that higher-income workers cansave individually if they want to reach a higher replacement rate.
Only three of the high-income OECD countries (Australia, Ireland, and New Zealand)do not have an earnings-related, second-tier scheme. Most of the Latin American andCaribbean countries have abolished their earnings-related plans as part of a fundamentalpension reform that introduced mandatory DC schemes for new workers. Only two retainan earnings-related scheme. In Eastern Europe and Central Asia, the seven countries thatintroduced mandatory DC have retained a public, earnings-related element in the pensionpackage, even for new workers.
Most countries have traditional defined-benefit schemes for which accrual rates maybe calculated in a straightforward way. For alternative types of earnings-related schemes—points systems and notional accounts—it is also possible to calculate an effectiveaccrual rate.
For points systems, such as the German public plan, French occupational schemes, andthe new Slovak public pension, the effective accrual rate (shown in tables 3.1 through 3.4)is the ratio of the cost of a pension point to the pension-point value, expressed as apercentage of individual earnings. This ratio, like the accrual rate in DB schemes, givesthe benefit earned each year as a proportion of earnings in that year. The details of thiscalculation are set out below.
In the notional-accounts schemes, the effective accrual rate is calculated in a similarway. Again, this ratio gives the annual pension entitlement as a proportion of earnings in agiven year.
In fewer than half of the countries with earnings-related plans (of all three types), theaccrual rates are linear: that is, a single percentage rate applies across the range of coveredearnings and to each year of coverage. In the other countries, the pension benefit earnedfor each year of coverage varies, with individual earnings, with the number of years ofcontributions, or with individual age. Tables 3.1 through 3.4 show a typical accrual rate inthese cases; the details are provided in the country chapters.
In eight cases, the accrual rate varies with earnings (indicated in the tables by [w]). In thepublic schemes of the Czech Republic, Norway, Portugal, Switzerland, and the UnitedStates, the pattern is progressive, giving higher replacement rates to lower-incomeworkers. In the United Kingdom, the accrual rates are U-shaped, highest for low earners,then smaller, then higher again. In the occupational plans of France and Sweden,the accrual rates are designed to offset the redistribution in the public scheme; they pay ahigher replacement rate to high earners on pay above the ceiling of the public plan. In theoccupational plans of Finland and Switzerland, pension accrual increases with age ([a] intable 3.1).
Nine countries have accrual rates that vary with length of service ([y]). In Luxem-bourg, the accrual rate increases for people with a longer contribution history. In theother eight countries (Costa Rica, Egypt, Libya, Morocco, Spain, Tunisia, Turkey, andUruguay), the pattern is the reverse of that in Luxembourg. The highest accrual rate isfor the first few years of coverage and the lowest for later years in longer contributionhistories.
Accrual rates tend to be highest in Middle East and North Africa, averaging nearly 2.4percent. The two countries from Latin America and the Caribbean that retain a DB schemehave accrual rates just below 2.0 percent. In the high-income OECD countries, the average isjust under 1.5 percent, while in Eastern Europe and Central Asia, it is just over 0.8 percent.

Defined-Contribution Schemes
The largest DC programs are found in Latin America and the Caribbean. Chile, Colombia, ElSalvador, and Peru all require contributions of more than 10 percent of earnings (includingadministrative charges and disability insurance). In Mexico, the contribution is 6.5 percentof earnings with the government paying 5.5 percent of the minimum wage into allaccounts. For an average earner, the total contribution comes to 7.1 percent of earnings.
Contribution rates tend to be lower in the DC systems of Eastern Europe, averaging 6.25percent compared with 9.50 percent in the countries of Latin America and the Caribbean.This is no surprise since all the Eastern European countries with DC programs haveretained a sizable public, earnings-related pension, which is a rare policy in Latin Americanand Caribbean countries.
Ceilings on Pensionable Earnings
Most high-income OECD countries do not require high earners to contribute to the pen-sion system on their entire earnings. Usually, a limit is set on the earnings used to calculateboth contribution liability and pension benefits. This ceiling on the earnings covered bythe pension system has an important effect on the structure, size, and cost of the second-tier systems. High ceilings or the absence of a ceiling means that high-income workersreceive a high replacement rate, and there is little need for voluntary private pensions.
In the other three groups of countries, ceilings are either absent or set at a very high levelrelative to average earnings. The exceptions are Hungary, Poland, and Turkey in EasternEurope and Central Asia; El Salvador (mandatory DC scheme) and Uruguay (public DBscheme) in Latin America and the Caribbean; and Egypt and Morocco in the Middle Eastand North Africa.
The ceiling on public pensions averaged across 16 high-income OECD countries is 190percent of average economywide earnings. At roughly the level of average economy-wide earnings, the Canadian ceiling is exceptionally low. Belgium, France, Switzerland,and Sweden also have relatively low ceilings, at 116 to 132 percent of average earnings.In these countries, approximately 15 to 20 percent of workers earn above the ceiling ofthe public scheme.
Tables 3.1 through 3.4 also show ceilings for mandatory DC pensions and for mandatoryoccupational plans (in France, Sweden, and Switzerland, for example). Including these pro-grams, the overall ceiling for 17 high-income OECD countries averages 275 percent ofaverage earnings.
Pension Eligibility Ages
Table 3.1 shows that the majority of high-income OECD countries have a standard retire-ment age of 65 for men. Iceland, Norway, and the United States stand out as having a stan-dard pension age of 67. At the other extreme, France is the only high-income country toallow normal retirement at age 60.
Pension ages are generally lower in the other three groups of countries. In EasternEurope and Central Asia, they are usually somewhere between 60 and 65, with an averageof 62.75.
In Latin America and the Caribbean and the Middle East and North Africa, the rulesregarding retirement are more complex. The DC pensions of Latin America can typicallybe drawn at any age provided the pension reaches a minimum absolute value (or some-times a minimum replacement rate). The pension ages shown, therefore, tend to be those
PARAMETERS 13

14 PENSIONS PANORAMA: RETIREMENT-INCOME SYSTEMS IN 53 COUNTRIES
Table 3.1. Summary of Pension System Parameters, High-Income OECD Countries
Australia Austria Belgium Canada Denmark Finland France Germany Greece Iceland Ireland Italy
First tier(% average earnings)Targeted 23 37 23 16 17 21 31 24 12 25h 28 22Basic n.a. n.a. n.a. 14 17 n.a. n.a. n.a. n.a. n.a. 31 n.a.Minimum n.a. n.a. 38a n.a. n.a. n.a. 29 n.a. 40 n.a. n.a. n.a.
Overallentitlement 23 37 38 30 34 21 31 24 40 25 31 22(full-career worker)
Second tierEarnings-relatedType None DB DB DB DB/DC DB DB/points Points DB DB None n. acs.Accrual rate n.a. 1.78 1.50 0.63 n.a. 1.50 [a]d 1.75 [w]e,f 1.00 2.57e 1.40 n.a. 1.75(% indiv. earnings)
DefinedcontributionContributionrate 9 n.a. n.a. n.a. 1 n.a. n.a. n.a. n.a. n.a. n.a. n.a.(% indiv. earnings)
Ceilings(% average earnings)Public n.a. 164 129 100 n.a. n.a. 128 164 325g n.a. n.a. 357Private/occupational 234 n.a. n.a. n.a. n.a. None 385 n.a. n.a. None n.a. n.a.
Pension ageNormal 65 65 65 65 65 65 60 65 65 67 65 65(women) 65 60 65 65 65 65 60 65 65 67 65 65Early 55 n.a. 60 60 n.a. 60 n.a. 63 57 n.a. n.a. 57(women) 55 n.a. 60 60 n.a. 60 n.a. 63 57 n.a. n.a. 57
(continued on the next page)
Sources: OECD, national officials, 2002.
Note: n.a. = not applicable. n. acs.= notional accounts. [w] = varies with earnings; [y] = varies with years of service; [a] = varieswith age.
Parameters and rules of 2002 plus any long-term changes that have already been legislated. See “Modeling” section for moredetails.
a. Belgium and the United Kingdom: minimum benefit calculated from minimum credit. b. Portugal and the United States: higher accrual rates for lower earnings, lower accruals on higher earnings. d. Finland: higher accrual rates at older ages. e. France, Greece, and Sweden: data shown combine two different programs.f. France and Sweden: higher accrual rate on higher earnings. g. Greece and Luxembourg: effective ceiling calculated from maximum pension. h. Iceland: includes three different programs. i. Luxembourg: accrual rate is higher for longer contribution periods. k. The Netherlands: accrual rate varies between occupational schemes. l. Norway: lower accrual rate on higher earnings. m. Spain: higher accrual rate on earlier years of service and lower on later years.

PARAMETERS 15
Table 3.1. (continued)
Korea, Luxem- New United UnitedJapan Rep. of bourg Netherlands Zealand Norway Portugal Spain Sweden Switzerland Kingdom States
First tier(% average earnings)Targeted n.a. n.a. 36 34 n.a. 33 20 n.a. 34 26 26 20Basic 19 30 12 34 38 18 n.a. n.a. n.a. n.a. 20 n.a.Minimum n.a. n.a. 46 n.a. n.a. n.a. 44 33 n.a. 19 13a n.a.Overallentitlement 19 30 46 34 38 33 44 33 34 26 33 20(full-career worker)
Second tierEarnings-relatedType DB DB DB DB None Points DB DB n. acs. DB DB DBAccrual rate 0.71 0.75 1.85 1.75k n.a. 1.05 2.25 3.00 1.21 1.70 0.89 0.91(% indiv. [y]i [w]l [w]b [y]m [w]e,f [w/a] [w] [w]b
earnings)
DefinedcontributionContributionrate n.a. n.a. n.a. n.a. n.a. n.a. n.a. n.a. 4.5e n.a. n.a. n.a.(% indiv. earnings)
Ceilings(% average earnings)Public 175 189 240g n.a. n.a. 219 None 189 132 116 156 262Private/occupational n.a. n.a. n.a. None n.a. n.a. n.a. n.a. 367 116 n.a. n.a.
Pension ageNormal 65 60 65 65 65 67 65 65 65 65 65 67(women) 65 60 65 65 65 67 65 65 65 64 65 67Early 60 55 57 60 n.a. n.a. 55 60 61 63 n.a. 62(women) 60 55 57 60 n.a. n.a. 55 60 61 62 n.a. 62
at which people are eligible for the public pension benefit (usually, the minimum pension).Three countries pay these pensions from age 65. The rest have lower eligibility ages: theaverage for this group is just under 62.5.
In the DB systems of the countries in the Middle East and North Africa, retirement ispossible at very early ages provided a minimum number of years of contributions havebeen made. In Egypt and the Islamic Republic of Iran, the pension can be drawn at anyage subject to 20 and 30 years’ contributions, respectively. Although the normal pensionage is typically 60 (except in Djibouti and Libya), early retirement for a full-careerworker is possible at an average age of 50 (in the nine countries with early retirementprovisions).
Early retirement provisions are less common in the high-income OECD countries thanin the other three groups. Retirement is possible before the normal pension age in 16 out of24 cases.

16 PENSIONS PANORAMA: RETIREMENT-INCOME SYSTEMS IN 53 COUNTRIES
Table 3.2. Summary of Pension System Parameters, Eastern Europe and Central Asia
Czech SlovakBulgaria Crotia Republic Estonia Hungary Latvia Lithuania Poland Republic Turkey
First tier(% average earnings)Targeted 14 n.a. 10 14 n.a. n.a. n.a. 24 n.a. 6Basic n.a. 11 8 7 n.a. n.a. 17 n.a. n.a. n.a.Minimum 16 n.a. 12 n.a. 22 33 n.a. n.a. 22 28
Overall entitlement 16 11 12 14 22 33 17 24 22 28(full-career worker)
Second tierEarnings-relatedType DB Points DB Points DB n. acs. DB n. acs. Points DBAccrual rate 1.00 0.25 0.45 [w]a 0.50 1.22 0.60 0.50 0.67 1.19 2.00 [y]c
(% indiv. Earnings)
Defined contributionContribution rate 2.0 5.0 n.a. 6.0 8.0 10.0 5.5 7.3 n.a. n.a.(% indiv. Earnings)
Ceilings(% average earnings)Public 370 None None 1,000 220 700 500 245 300 173Private/occupational 370 None n.a. 1,000 220 700 500 n.a. n.a. n.a.
Pension ageNormal 63 65 63 63 62 62 62.5 65 62 60(women) 60 60 59–63b 63 62 62 60 60 62 58Early n.a. 60 60 60 n.a. n.a. n.a. n.a. n.a. n.a.(women) n.a. 55 56–60c 60 n.a. n.a. n.a. n.a. n.a. n.a.
Sources: OECD, World Bank, national officials, 2002.
Note: Pension ages for women are shown only where they are different from men’s. Early pension ages are only shown whererelevant. n.a. = not applicable. n. acs.= notional accounts. [w] = varies with earnings; [y] = varies with years of service; [a] = varies with age.
Parameters and rules of 2002 plus any long-term changes that have already been legislated. See “Modeling” section for more details.
a. The Czech Republic: higher accrual rates for lower earnings, lower accruals on higher earnings. b. The Czech Republic: pension ages for women vary with the number of children they have. c. Turkey: higher accrual rate on earlier years of service and lower on later years.
Pension eligibility ages for women are lower than for men in many countries: 6 of the10 countries of Eastern Europe and Central Asia, 5 of the 9 countries of Latin America andthe Caribbean, and 7 of the 10 from Middle East and North Africa. In the high-incomeOECD countries, in contrast, nearly all countries have already equalized men andwomen’s pension ages or are gradually doing so (for example, Belgium and the UnitedKingdom).
Defining Earnings
Earnings-related pension schemes must define and measure individuals’ earnings to cal-culate their pension benefits. There are two ways in which policy may differ betweencountries: the period over which earnings are measured and the way earnings are adjustedto reflect changes in living standards between the time pension rights accrued and thetime they are claimed (table 3.5). These variables have a powerful influence on the level ofbenefits.
PARAMETERS 17
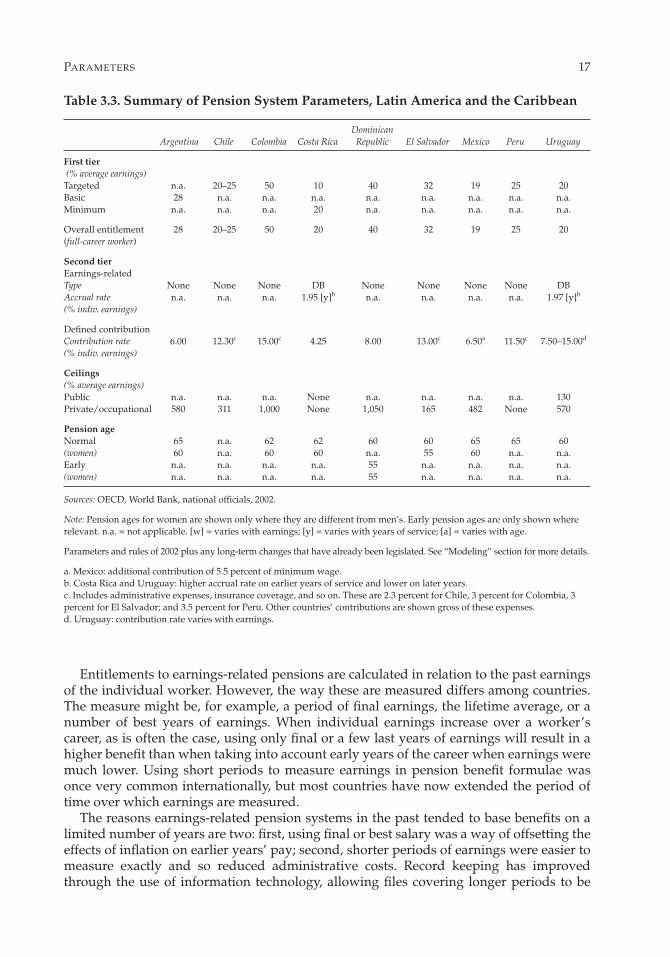
Table 3.3. Summary of Pension System Parameters, Latin America and the Caribbean
DominicanArgentina Chile Colombia Costa Rica Republic El Salvador Mexico Peru Uruguay
First tier(% average earnings)Targeted n.a. 20–25 50 10 40 32 19 25 20Basic 28 n.a. n.a. n.a. n.a. n.a. n.a. n.a. n.a.Minimum n.a. n.a. n.a. 20 n.a. n.a. n.a. n.a. n.a.
Overall entitlement 28 20–25 50 20 40 32 19 25 20(full-career worker)
Second tierEarnings-relatedType None None None DB None None None None DBAccrual rate n.a. n.a. n.a. 1.95 [y]b n.a. n.a. n.a. n.a. 1.97 [y]b
(% indiv. earnings)
Defined contributionContribution rate 6.00 12.30c 15.00c 4.25 8.00 13.00c 6.50a 11.50c 7.50–15.00d
(% indiv. earnings)
Ceilings(% average earnings)Public n.a. n.a. n.a. None n.a. n.a. n.a. n.a. 130Private/occupational 580 311 1,000 None 1,050 165 482 None 570
Pension ageNormal 65 n.a. 62 62 60 60 65 65 60(women) 60 n.a. 60 60 n.a. 55 60 n.a. n.a.Early n.a. n.a. n.a. n.a. 55 n.a. n.a. n.a. n.a.(women) n.a. n.a. n.a. n.a. 55 n.a. n.a. n.a. n.a.
Sources: OECD, World Bank, national officials, 2002.
Note: Pension ages for women are shown only where they are different from men’s. Early pension ages are only shown whererelevant. n.a. = not applicable. [w] = varies with earnings; [y] = varies with years of service; [a] = varies with age.
Parameters and rules of 2002 plus any long-term changes that have already been legislated. See “Modeling” section for more details.
a. Mexico: additional contribution of 5.5 percent of minimum wage. b. Costa Rica and Uruguay: higher accrual rate on earlier years of service and lower on later years. c. Includes administrative expenses, insurance coverage, and so on. These are 2.3 percent for Chile, 3 percent for Colombia, 3percent for El Salvador; and 3.5 percent for Peru. Other countries’ contributions are shown gross of these expenses. d. Uruguay: contribution rate varies with earnings.
Entitlements to earnings-related pensions are calculated in relation to the past earningsof the individual worker. However, the way these are measured differs among countries.The measure might be, for example, a period of final earnings, the lifetime average, or anumber of best years of earnings. When individual earnings increase over a worker’scareer, as is often the case, using only final or a few last years of earnings will result in ahigher benefit than when taking into account early years of the career when earnings weremuch lower. Using short periods to measure earnings in pension benefit formulae wasonce very common internationally, but most countries have now extended the period oftime over which earnings are measured.
The reasons earnings-related pension systems in the past tended to base benefits on alimited number of years are two: first, using final or best salary was a way of offsetting theeffects of inflation on earlier years’ pay; second, shorter periods of earnings were easier tomeasure exactly and so reduced administrative costs. Record keeping has improvedthrough the use of information technology, allowing files covering longer periods to be

18 PENSIONS PANORAMA: RETIREMENT-INCOME SYSTEMS IN 53 COUNTRIES
Table 3.4. Summary of Pension System Parameters, Middle East and North Africa
Egypt, Iran, Arab Islamic Yemen,
Algeria Bahrain Djibouti Rep. of Rep. of Jordan Libya Morocco Tunisia Rep. of
First tier(% average earnings)Targeted n.a. n.a. n.a. n.a. n.a. n.a. n.a. n.a. n.a. n.a.Basic n.a. n.a. n.a. n.a. n.a. n.a. n.a. n.a. n.a. n.a.Minimum 33 42 21 7 67 35 25 18 29 n.a.
Overall entitlement 33 42 21 7 67 35 25 18 29 0(full-career worker)
Second tierEarnings-relatedType DB DB DB DB DB DB DB DB DB DBAccrual rate 2.50 2.20 1.50 2.20 [y]b 3.30 2.50 2.30 [y]a 2.00 [y]a 2.67 [y]a 2.50(% indiv. earnings)
Defined contributionContribution rate n.a. n.a. n.a. n.a. n.a. n.a. n.a. n.a. n.a. n.a.(% indiv. earnings)
Ceilings(% average earnings)Public 815 None None 176 800 None None 218 322 NonePrivate/occupational n.a. n.a. n.a. n.a. n.a. n.a. n.a. n.a. n.a. n.a.
Pension ageNormal 60 60 55 60 60 60 65 60 60 60(women) 55 55 55 60 55 55 60 60 60 55Early 50 45 n.a. Yesc Yesc 45 62 55 50 50(women) 45 45 n.a. Yesc Yesc 45 No 55 50 46
Sources: World Bank, national officials, 2002.
Note: Pension ages for women are shown only where they are different from men’s. Early pension ages are only shown whererelevant. n.a. = not applicable. [w] = varies with earnings; [y] = varies with years of service; [a] = varies with age.
Parameters and rules of 2002 plus any long-term changes that have already been legislated. See “Modeling” section for more details.
a. Libya, Morocco, and Tunisia: higher accrual rate on earlier years of service and lower on later years. b. Egypt: accrual rate for both basic and variable wage schemes. However, earnings measure and valorization differ. (See“Defining Earnings.”)c. Egypt, the Islamic Republic of Iran: early retirement at any age with 20 and 30 years’ contributions, respectively.
maintained rather than relying on a few years’ final salary. Also, computerization allowsvalorization of earlier years’ earnings (see below) to be calculated easily. This means thatpension formulae based on final salary are no longer needed as a way of protecting againstinflation. Furthermore, the problems of using short periods to measure earnings inpension formulae have become apparent, including high costs, strategic manipulation ofearnings profiles, and disproportionately higher benefits going to higher-income workersbecause they tend to have more steeply rising age-earnings profiles.
Earnings MeasuresOf the 20 high-income OECD countries with earnings-related schemes, 17 currently use orwill use lifetime average, or very close to lifetime average, pay in the benefit formula.The exceptions are the public schemes of France, Greece, and Spain, and the Norwegianpoints-based scheme and Swedish occupational pensions. Some countries—Austria,Finland and Portugal—are currently phasing in longer averaging periods for earnings intheir benefit calculation.

PARAMETERS 19
Table 3.5. Earnings Measure and Valorization: Earnings-Related Schemes
Earnings measure Valorization
High-income OECD countriesAustralia n.a. n.a.Austria Best 15 years, moving to Yes, to be decided (earnings
40 years probable)Belgium Lifetime average PricesCanada Lifetime average, excluding Average earnings
15% of worst years Denmark n.a. n.a.Finland Final 10 years, moving to 50% of prices and 50% of average
lifetime average earnings, moving to 80% of pricesand 20% of average earnings
France Best 20 years, moving to Prices (public)25 years (public)Lifetime average Prices (occupational)(occupational points)
Germany Lifetime average (points) Average earnings; adjustment forchanges in contributions and poten-tial contribution to voluntarypensions
Greece Final 5 years Pension increases of public sectorworkers
Iceland Lifetime average (occupational) Fixed rateIreland n.a. n.a.Italy Lifetime average (notional Moving to an average of GDP
accounts) growth over 5 yearsJapan Lifetime average Average earningsKorea, Rep. of Lifetime average Average earningsLuxembourg Lifetime average Average earningsNetherlands Lifetime average for approx. Average earnings (occupational)
two-thirds, and final for one-third of schemes (occupational)
New Zealand n.a. n.a.Norway Best 20 years (points) Average earningsPortugal Best 10 out of final 15 years, 75% prices and 25% average
moving to lifetime average earnings with maximum real growthof 0.5%
Spain Final 15 years Prices up to 2 years beforeretirement
Sweden Lifetime average (notional accounts) Average earnings with adjustment Final (occupational scheme) for demographics (notional
accounts)Switzerland Lifetime average (public scheme) Average earnings
Lifetime average (occupational) Minimum interest rate specifiedUnited Kingdom Lifetime average Average earningsUnited States Best 35 years Average earnings up to age 60;
prices from age 62 to 67
(continued on the next page)

20 PENSIONS PANORAMA: RETIREMENT-INCOME SYSTEMS IN 53 COUNTRIES
Table 3.5. (continued)
Earnings measure Valorization
Eastern Europe and Central AsiaBulgaria n.a. n.a.Croatia 10 consecutive best years, moving 50% of prices and 50% of average
to lifetime average earningsCzech Republic Since 1985, moving to 30 years Average earningsEstonia Lifetime average (points) 50% of prices and 50% of average
earningsHungary Since 1988, moving to lifetime Average earnings
averageLatvia Lifetime average (notional accounts) Covered wage billLithuania Lifetime average Average earningsPoland Lifetime average (notional Prices + 75% of real wage-bill
accounts) growth; policy changes to real wage-bill growth but at least price inflation from 2004
Slovak Republic Lifetime average (points) Average earningsTurkey Lifetime average GDP growth
Latin America and the CaribbeanArgentina n.a. n.a.Chile n.a. n.a.Colombia n.a. n.a.Costa Rica Best 48 of final 60 months NoneDominican Republic n.a. n.a.El Salvador n.a. n.a.Mexico n.a. n.a.Peru n.a. n.a.Uruguay Final 10 years Average earnings
Middle East and North AfricaAlgeria Final 5 years NoneBahrain Final 2 years NoneDjibouti Final 10 years Yes, to be decidedEgypt, Arab Rep. of Final 2 years (basic wage scheme) None
Lifetime average (variable 2% pension increase per year wage scheme) of service
Iran, Islamic Rep. of Final 2 years NoneJordan Final 2 years NoneLibya Final 3 years NoneMorocco Higher of final 3 or final 5 years NoneTunisia Final 10 years PricesYemen, Rep. of Final 2 years None
Sources: OECD, World Bank, national officials, 2002.
Note: n.a. = not applicable (country does not have an earnings-related scheme).
Lifetime average earnings measures also predominate in Eastern Europe and Central Asia.However, in the Middle East and North Africa, final salary schemes are almost universal.
ValorizationValorization is the adjustment of past earnings to account for changes in living standardsbetween the time pension rights are earned and the time they are claimed. In final salary

PARAMETERS 21
schemes, there is obviously no need for valorization. However, it is universal practice inschemes where benefits are based on earnings measured over a longer period.
Until very recently, valorization has received much less attention than the related policyof indexation of pensions in payment despite the powerful impact valorization exerts onpension benefits.
Adjustments related to valorization exist also in the different variants of earnings-related schemes. In notional accounts, the exact corollary to valorization is the notionalinterest rate applied, which again adjusts benefits between the time they were earned andthe time they are drawn. Similarly, procedures for uprating the value of a pension point inpoints systems have the same effect (OECD 2005, annex I.1).
Table 3.5 shows valorization rules—and the equivalent policies for notional accountsand points systems—in the final column.
Of the 20 high-income OECD countries with earnings-related schemes, 11 valorize inline with growth of earnings (or close, as in the United States). The same applies in four ofthe Eastern European and Central Asian countries. Valorization is purely with prices inBelgium, France (both the public scheme and occupational plans), Iceland, Korea and Spain.
Croatia, Estonia, Finland, Poland, and Portugal valorize with a mix of earnings andprices. In Italy and Turkey, adjustments are linked to a measure of gross domestic product(GDP) growth, and in Latvia, to the covered wage bill.
The effect of valorization policy on pension entitlements can be very large. This isdue to a compound-interest effect. On the baseline economic assumptions—real wagegrowth of 2.0 percent and price inflation of 2.5 percent—price valorization for a fullcareer (between ages 20 and 65) results in a pension that would be 40 percent lowerthan a policy of full adjustment of earlier years’ pay in line with economywide averageearnings.
Indexation
Pensions in payment are often adjusted during retirement to reflect changes in costs orstandards of living over time. The aim is to protect older people from inflation. Theadjustment of pension scheme parameters also has a powerful impact on the value ofentitlements.
Few countries had formal indexation rules when pension schemes were established.However, the high-inflation era of the 1970s led many governments to adopt automaticprocedures for adjusting pensions in payment (Weaver 1998).
Many countries moved from earnings to price indexation during the 1980s and 1990s asa cost-cutting measure (since wages tend to grow faster than prices). With price indexa-tion, the purchasing power of pensions is preserved. However, the standard of living ofindividual retirees over time falls behind that of workers.
Indexing Pensions in PaymentTable 3.6 shows that most high-income OECD countries adjust earnings-related pensionsin line with prices.
There are some exceptions. Luxembourg links pensions in payment to earningsgrowth; Germany, to earnings growth with an adjustment for changes in pensioncontributions.
In Eastern Europe and Central Asia, just the Czech Republic and Turkey index to prices.Six of these countries have some form of mixed indexation, with pension increases linkedpartly to prices and partly to earnings growth. Mixed indexation also applies in Finlandand in Switzerland (which pioneered the policy).

22 PENSIONS PANORAMA: RETIREMENT-INCOME SYSTEMS IN 53 COUNTRIES
Table 3.6. Procedures for Adjustment of Pensions in Payment: Earnings-RelatedSchemes
Country Scheme Prices Wages Notes
High-income OECD countries % %Austria n.a. n.a. Discretionary; prices assumed in
modelingBelgium 100 Price index excludes alcohol, cigarettes,
and fuel; increases only if inflationexceeds 2%
Canada 100Finland Occupational 80 20France Earnings-related 100
Occupational 100 No automatic procedure but recentpractice
Germany 100 Wages net of pension contributionsGreece n.a. n.a. DiscretionaryIceland Occupational 100 Minimum legal upratingItaly 75–100 Increase between full and 75% price
indexation depending on pension levelJapan 100Korea, Rep. of 100Luxembourg 100 Increase if inflation exceeds 2.5%;
additional adjustment to wagesNetherlands Occupational 100 No legal requirement but customaryNorway 100 No legal requirement but recent
practicePortugal 100Spain 100Sweden Earnings-related n.a. n.a. Gross earnings less growth norm of
1.6%Occupational 100
Switzerland Earnings-related 50 50Occupational n.a. n.a. Discretionary
United Kingdom 100United States 100
Eastern Europe and Central AsiaBulgaria n.a. n.a.Croatia 50 50Czech Republic 100 Adjustment to prices plus increases of at
least one-third of real wage growthEstonia 50 50Hungary 50 50Latvia 50 50 Prices plus 25% of real wage bill,
moving to 50% from 2011Lithuania n.a. n.a. DiscretionaryPoland 80 20 Proposal to shift to pure price indexationSlovak Republic 50 50Turkey 100
(continued on the next page)

PARAMETERS 23
Italy and Greece have policies of progressive indexation, which gives smaller increases onlarger pensions and larger increases on smaller pensions.
In practice, pension-benefit increases in the high-income OECD countries have oftenstrayed from the index set out in the rules (see Vordring and Goudswaard 1997).
Indexation of pensions in payment is almost entirely absent in Middle East and NorthAfrica. There are just two exceptions. Egypt pays a flat increase on basic wage pensionsthat has recently been just 10 percent a year (while inflation has been both higher andlower than this level). Tunisia links pensions in payment to the minimum wage.
Elsewhere in Middle East and North Africa, benefit adjustments are discretionary (therehas to be an annual review, but there is no fixed procedure for determining the increase)or ad hoc (there is no requirement for periodic review of benefits, but there have beensporadic increases in recent years).
Defined-Contribution PlansIn Latin America and the Caribbean, most countries allow workers a choice of ways ofwithdrawing their pension benefits. Typically, these include life annuities (an insurancecompany guarantees the payment) or phased withdrawals (a defined portion of theaccount balance may be taken out each year).
In the first case, the risk of longevity is borne by the insurer, which makes the pay-ment as long as the individual survives. In the second case, the individual bears thelongevity risk since a long life means that the accumulated balance will be very small atadvanced ages.
In Eastern Europe and Central Asia, in contrast, most countries require benefits to bewithdrawn as an indexed annuity, typically linked to prices.
Australia offers the broadest range of withdrawal options. Individuals may choosefrom a range of income streams (including annuities with different upratings) or makelump-sum withdrawals. Currently, most benefits are taken as lump sums.
Table 3.6. (continued)
Country Scheme Prices Wages Notes
Latin America and the Caribbean % %Costa Rica 100Uruguay 100 To civil-service wage index
Middle East and North AfricaAlgeria n.a. n.a. Discretionary; annual reviewBahrain n.a. n.a. Ad hocDjibouti n.a. n.a. DiscretionaryEgypt, Arab Rep. of Basic wage n.a. n.a. Annual increases; recently 10%
Variable wage n.a. n.a. No adjustmentIran, Islamic Rep. of n.a. n.a. DiscretionaryJordan n.a. n.a. DiscretionaryLibya n.a. n.a. Ad hocMorocco n.a. n.a. Ad hocTunisia 100 Minimum wageYemen, Rep. of n.a. n.a. Ad hoc
Sources: OECD, World Bank, national officials, 2002.
24 PENSIONS PANORAMA: RETIREMENT-INCOME SYSTEMS IN 53 COUNTRIES
Indexing Pension-System ParametersIndexation policy affects the value of pension benefits other than the earnings-relatedschemes (table 3.6).
Governments also adjust targeted and basic pension benefits, usually on an annualbasis. This policy has much more significance for the value of pension entitlements thandoes the indexation of pensions in payment.
Take the United Kingdom’s basic pension scheme as an example. This has been linkedto prices since 1981, when it was worth 23.7 percent of average earnings. Today it is worthjust 15.8 percent of average earnings. The change in indexation procedure reduced notonly the entitlements of pensioners but also the benefits of all future workers. If the proce-dure continues, then the basic pension for new entrants will be worth just 6.4 percent ofaverage earnings when they retire in 45 years’ time, just 40 percent of its value relativeto earnings now. (This calculation uses the baseline real-earnings-growth assumption of2 percent per year.)
Canada also links its basic pension to prices. Canada and Sweden link their targetedschemes to prices (while the United Kingdom now links this to average earnings). Theimplication, over the long periods involved in pension policy, is that these programs willbecome obsolete. For new entrants, the minimum retirement income in 45 years’ timewould be just 12 percent of average earnings in Canada and 14 percent in Sweden. It isdifficult to believe that it will be politically possible to pay such low incomes to poor, oldpeople. As a result, these policies are unlikely to be sustainable or, indeed, sustained.
A similar argument applies to other parameters of the pension system. Canada linksthe ceiling of its earnings-related pension scheme to prices. The ceiling is already atapproximately the average earnings. In 45 years’ time, it would be just 40 percent of averageearnings. Most pensioners would then be getting the same benefit. Again, it is unlikelythat the scheme will be transformed to such a degree.
The modeling implicitly assumes that these benefits and parameters are linked to averageearnings (see below).
Taxes and Contributions
Pensioners often do not pay social security contributions. Income taxes are progressive:taxes on lower pension incomes are less than those paid on (higher) work earnings. Mostincome taxes give preferential treatment to pension incomes or to pensioners. Replace-ment rates (pensions relative to earnings) are higher net of taxes and contributions thangross. Relevant features of income taxes and social security contributions are shown inthree categories in the country studies in Part II of this report.
First, there are age-based tax allowances and tax credits, which exceed those availableto taxpayers of working age. In many cases, these concessions are targeted at those withmodest incomes and are withdrawn as income increases.
Second, there are reliefs for some or all of pension income received. Several countriesfully or partially exempt pensions paid from public sources from the personal income tax.Moreover, in some cases, there is a preferential tax treatment for modest pensions paidfrom private sector schemes.
Third, social security contributions are typically levied only on wage income and not onpension benefits. However, some countries charge contributions on pension income forhealth and long-term care insurance or for survivor’s benefits.

25
THIS REPORT ADOPTS A MICROECONOMIC APPROACH to comparing retirement-income systems,looking at prospective individual entitlements under 53 countries’ pension regimes. Thesemicroeconomic techniques were first developed for the retirement-income reviews of nineOECD countries (OECD 2001).
Future Entitlements Under Today’s Rules
The pension entitlements that are compared are those that are currently legislated.Pension-system parameters reflect, where possible, the situation in the year 2002.
Changes in rules that have already been legislated, but are being phased in gradually,are assumed to be fully in place from the start. (In some cases where there has been sys-temic change, such as in the Slovak Republic and Sweden, the modeling calculates whatthe parameters of the new system would have been had it been in place in 2002.)
It is assumed that the pension rules remain unchanged. This steady-state assumption isalso applied to value parameters, such as the level of ceilings or basic pensions. These areassumed to remain at the same level relative to average earnings (see the discussion onindexation above).
Full-Career, Single Workers
The calculations show the pension entitlements of a worker who enters the system todayand retires after a full career. A full career is defined as entering at age 20 and working untilthe standard pension-eligibility age, which, of course, varies among countries. The impli-cation is that the length of career varies with the statutory retirement age: 40 years forretirement at age 60, 45 years for retirement at 65.
The reason for modeling only full careers is that periods out of the labor market arecovered in many countries’ pension systems with credits for periods in higher education,military service, unemployment, child rearing, and so on. Assuming that people are notcovered by the pension system during career gaps would produce inaccurate figures forpension entitlements.
The results are shown only for a single person because the rules governing benefitsfor married couples are complex in many countries and entitlements depend on bothpartners’ career histories.
Coverage
The pension models presented here include all mandatory pension schemes for privatesector workers, regardless of whether they are public (that is, they involve payments fromgovernment or from social security institutions, as defined in the System of NationalAccounts) or private. Systems with near-universal coverage are also included, provided they
4. Modeling Pensions

26 PENSIONS PANORAMA: RETIREMENT-INCOME SYSTEMS IN 53 COUNTRIES
cover at least 90 percent of employees. For example, this degree of coverage of occupationalplans is achieved through centralized collective bargaining in the Netherlands and inSweden.
In Canada, Denmark, the United Kingdom, and the United States, there is broad cover-age of voluntary, occupational pensions, and these play an important role in providingretirement incomes. However, coverage is significantly below 90 percent, so they have notbeen included. However, results including these schemes are available in the OECD report(OECD 2005).
Mandatory personal pensions, known as individual accounts in some countries, are alsoincluded. These are of the defined-contribution type, so the pension benefit depends oncontributions made and investment returns earned. The countries that have recently intro-duced these schemes have made them mandatory for new labor-market entrants; themajority of older workers are covered only by the old, public schemes in some of thesecountries. This report focuses on the retirement-income arrangements of new labor-marketentrants, and so assumes that people are covered by defined-contribution pensions.1
Resource-tested benefits for which retired people may be eligible are also included inpension models. As described above, these can be means tested, where both assets andincome are taken into account, purely income tested, or withdrawn only against pensionincome. Leaving these benefits out of the model would give a misleading picture of thesituation of low-income retirees. The comparisons assume all entitled pensioners take upthese benefits. Where there are broader means tests, taking account also of assets, theincome test is taken as binding. It is assumed that the entire income during retirementcomes from the mandatory pension scheme when calculating pension entitlements (orfrom the voluntary pension in the four countries where these are modeled).
In many countries, there are entirely separate schemes for civil servants and otherpublic sector workers (see Palacios and Whitehouse [2005] for an analysis of theseschemes). Some countries also have special programs for agricultural workers and the self-employed. These schemes are not included here. The comparisons currently look onlyat the main national scheme for private sector employees.
Pension entitlements are compared for workers with earnings between 0.3 times and3.0 times the economywide average. This large range permits the pensions of both thepoorer and richer workers to be examined, and it is sufficiently broad to include peoplewho are employed part-time.
Economic Variables
The comparisons of pension entitlements are based upon a single set of economic assump-tions for all countries. In practice, the level of pensions received is affected by economicgrowth, wage growth, and inflation, and these vary across countries. A single set ofassumptions, however, ensures that the outcomes of the different pension regimes arenot affected by different economic conditions. In this way, differences across countries inpension levels reflect differences in pension systems and policies alone.
The baseline assumptions are the following:
• Real earnings growth is 2.00 percent per year (given the assumption for price inflation,this implies nominal wage growth of 4.55 percent).
• Individual earnings are assumed to grow in line with the economywide average. Thus,in the baseline case, the individual is assumed to remain at the same point in the earn-ings distribution, earning the same percentage of average earnings in every year of theworking life.

• Price inflation is 2.5 percent per year.• Real rate of return on defined-contribution pensions is 3.5 percent per year.2
• Discount rate (for actuarial calculations) is 2 percent per year.• Mortality rates are calculated with baseline modeling, which uses country-specific
projections (made in 2002) from the United Nations and the World Bank populationdatabase for the year 2040.
Changes in these baseline assumptions will obviously affect the resulting pensionentitlements. The OECD report (OECD 2005) includes a sensitivity analysis of the effect ofthese assumptions.
This analysis allows, for example, for economywide earnings growth of between 0 and3 percent per year, for returns on defined-contribution schemes of between 0 and 6 percentper year, and for individual earnings that grow faster than the economywide average byup to 2 percentage points per year or slower by up to 1 percentage point per year.
Defined-Contribution Schemes
Where there are data on administrative changes, these are deducted from the contributionin calculating benefits. (See Whitehouse [2000, 2001] for a discussion of administrativecharges.)
The calculations assume that when DC benefits are received in retirement, they are paidin the form of a price-indexed life annuity at an actuarially fair price.
Studies of voluntary annuity markets in the United Kingdom and the United Stateshave shown that annuities pay out less than they would if insurance companies were tobase their calculations on the relevant interest rates and projected population mortality.This does not mean that prices are “actuarially unfair” since they reflect the longer lifeexpectancy of people who choose to buy an annuity. In mandatory annuity markets, whichare relevant to the mandatory DC schemes modeled in this paper, prices are much closer tothe actuarially fair level (Finkelstein and Poterba 2002, 2004).
The actuarially fair annuity rate is calculated from mortality data. Because of improve-ments in life expectancy, someone retiring at a given age after having contributed a givenamount to a DC scheme will in the future receive a lower pension than a person retiringtoday would receive.
Similarly, the notional annuity rate in notional-accounts schemes is calculated frommortality data using the indexation rules and discounting assumptions employed byeach country.
Average Earnings
It is difficult to produce data on average earnings that are consistent across countries.Consequently, the OECD’s average-production worker series is currently the only one avail-able for all 30 OECD member countries (OECD 2005). For the 23 countries that are not mem-bers of the OECD, average earnings figures have been obtained from national sources.
Taxes and Social Security Contributions
The information on taxes and social security contributions on which the calculations of thenet indicators are based can be found in each country chapter in Part II of this report. For the30 OECD countries, the chapters describe the tax and social security contribution regimes ineach country as they applied to pensioners in 2002. General provisions and the tax treatment
MODELING PENSIONS 27

of workers for 2002 can be found in the OECD report Taxing Wages (2003). The conventionsused in that report, such as which payments are considered taxes, are discussed here.
For the 23 countries that are not in the OECD, country chapters include information ontax treatment of both pensioners and workers and general information on the tax scheduleand rates of social security contributions.
The same steady-state assumption used for pensions is also applied here. The modelingassumes that tax systems and social security contributions remain unchanged in the future.This implicitly means that value parameters, such as tax allowances or contribution ceilings,are adjusted annually in line with average earnings, while rate parameters, such as the per-sonal income tax schedule and social security contribution rates, remain unchanged.
Indicators and Results
The basic indicators used in this paper are as follows:
• Replacement rate, pension entitlements as a share of individual lifetime-averageearnings
• Relative pension level, pension entitlements as a share of average economywideearnings
• Pension wealth, the discounted stream of future pension payments
The replacement rate is best interpreted as an indicator of the insurance role of thepension system. It shows to what extent pension systems aim to preserve the previous,personal standard of living of a worker moving from employment into retirement.
Often, the replacement rate is expressed as the ratio of the pension over the final earn-ings a worker had before retirement. However, the indicator used here shows the pensionbenefit as a share of individual lifetime-average earnings (revalued in line with economy-wide earnings’ growth). Under the baseline assumptions, workers earn the same percentageof economywide average earnings throughout their career, meaning that their individualearnings track the assumed growth in economywide earnings. In this case, lifetime-average revalued earnings and individual final earnings are identical.
Expressed algebraically, individual earnings in any time period i can be expressed as amultiple of earnings in the base period (w0):wi = w0 (l + g)i where w is earnings and g is thegrowth of (individual and economywide) earnings. Revaluing pay in line with earningsgrowth gives for each period: wi = w0 (l + g)i (l + g)R–i. This is constant over time so final andlifetime-average revalued earnings are equal.
If people move up the earnings distribution as they get older, then their earnings justbefore retirement would be higher than they were on average over their lifetimes. In thatcase, replacement rates calculated on individual final earnings would be lower than thosecalculated on individual lifetime-average revalued earnings.
For comparison of countries that use different earnings measures, pension entitle-ments for all countries are presented as a proportion of individual lifetime-average earn-ings revalued in line with growth in economywide average earnings. Most of the OECDcountries’ earnings-related pension schemes use individual lifetime-average pay reval-ued in line with economywide average earnings—the same as the earnings measure tocalculate pensions (table 3.5). For others, replacement rates presented here look differentthan those calculated using the earnings measure based on the rules of the nationalpension systems.
The relative pension level is best seen as an indicator of pension adequacy since itshows what benefit level a pensioner will receive in relation to the average wage earner inthe respective country. Individual replacement rates may be quite high, but the pensioner
28 PENSIONS PANORAMA: RETIREMENT-INCOME SYSTEMS IN 53 COUNTRIES

may still receive only a small fraction of economywide average earnings. If, for example,a low-income worker—who earned only 30 percent of economywide average earnings—hasa replacement rate of 100 percent, the benefit will amount to only 30 percent of economy-wide average earnings. For an average wage earner, the replacement rate and the relativepension level will be the same.
Pension wealth is an indicator that takes into account all future pension payments to aretiree. It therefore depends not only on the level of pensions paid, but also on how longthey are paid. The number of years that someone can expect to receive a pension willdepend both on the age of retirement and life expectancy at that age. The way that benefitsare adjusted to price or wage growth during the period of payment will also influencepension wealth. The details of calculating pension wealth are set out below.
A Worked Example
X starts working at age 20 and works continuously until he retires at age 65. He starts outwith an annual salary of $10,000. The salary corresponds to 75 percent of economywideaverage earnings at that time. His earnings grow by 2 percent each year. Economywideearnings grow at the same rate. X thus earns 75 percent of average earnings over his entirecareer.
When X retires, all his past salaries between the time that they were earned and theretirement age are increased in line with the growth in economywide average earnings, aprocedure called valorization in this report (see above). In this case, valorization is linkedto economywide average-earnings growth. X’s lifetime-average revalued salary, which isthe earnings measure used in the pension calculation, is $23,900.
The explanation is as follows: taking i as the number of years since labor-market entry,valorization means that each year’s earnings are increased by 1.02(44-i). Each year, X’s earn-ings increase by a constant amount, so at any given time they are equal to earnings at entryage ($10,000) multiplied by 1.02i. Thus, in each year of the working life, revalued earnings are first-year earnings multiplied by 1.0244-i � 1.02i, giving average lifetime-revalued earningsof $10,000 � 1.0244 = $23,900.
The pension system has an accrual rate of 1.5 percent of earnings per year. X’s grosspension is thus 45 � 0.015 � $23,900 = $16,130. His gross replacement rate is $16,130/$23,900 = 67.5%.
On his gross pension, X has to pay 10 percent in taxes and health-insurance contribu-tions. The net pension is therefore $16,130 � (100 – 10)% = $14,510. While he was work-ing, X had to pay 20 percent in taxes and social security contributions so that his netearnings at the time of retirement were $19,120. His net replacement rate is therefore$14,510/$19,120 = 75.9%.
To assess his pension level relative to average earnings, X divides his gross pensionentitlement by gross average economywide earnings in the year of retirement. X’s earn-ings at retirement are $23,900, while the economywide average is $31,790 (since X earns 75percent of the average). Thus, X’s gross relative pension level is $16,130/$31,790 = 50.7%.
The net relative pension level is calculated in the same way but using the taxes andsocial security contributions that X pays as a pensioner and a worker pays on averagegross earnings. Workers on average gross earnings pay 25 percent in taxes and socialsecurity contributions, giving net average earnings of $31,790 � (100 – 25)% = $23,840.Therefore, X’s net relative pension level is $14,510/$23,840 = 60.6%.
When X retires, male life expectancy at age 65 will be 83 years in his country, giving anexpected retirement duration of 18 years. X’s pension wealth is the discounted stream ofpension payments during retirement, weighted by the probability that he will still be alive
MODELING PENSIONS 29

at that particular age. The discount rate is designed to reflect the fact that money receivedin the future is worth less than money received today; the rate used is 2 percent per year.The calculation also allows for the postretirement adjustment of pension benefits: in thiscase, X’s pension is increased annually in line with price inflation. The actuarial calcula-tions show that the present value of pension benefits is 14.8 times the annual flow (whichis less than the 18 years’ expected duration of retirement because future benefits arediscounted).
Notes
1. See Mattil and Whitehouse (forthcoming) for a discussion. 2. This rate of return is assumed to be net of administrative charges. In practice, this
assumption might disguise genuine differences in administrative fees between countries.See Whitehouse (2000, 2001).
30 PENSIONS PANORAMA: RETIREMENT-INCOME SYSTEMS IN 53 COUNTRIES

31
GROSS REPLACEMENT RATES ARE COMPARED ACROSS 53 COUNTRIES for people with differentlevels of earnings. Table 5.1 shows gross replacement rates at earnings between 0.5 and 2.5times the average.
The replacement rate at average earnings is perhaps the most familiar indicator inpension analysis. At this earnings level, the average gross replacement rate is 56 percentin the 24 high-income OECD countries. The average replacement rate is exactly the samein the 10 countries of Eastern Europe and Central Asia and very similar, on average, in the9 countries of Latin America and the Caribbean. However the pension promise is muchlarger in the Middle East and North Africa: the replacement rate averages 78 percent in the10 countries analyzed, meaning pensions are nearly 40 percent higher on average than inthe other 43 countries.
There is substantial variation within all the regions. The most diverse region (measuredby the ratio of the standard deviation to the mean) is Latin America and the Caribbean.Projected replacement rates vary from 36 percent in Mexico to over 100 percent inUruguay (meaning that the pension is higher than earnings before retirement).
The high-income OECD countries are similarly (albeit slightly less) diverse. Luxembourgis an outlier: the replacement rate for a full-career worker exceeds 100 percent. Austria,Greece, Italy, and Spain also provide high pensions to full-career workers on averageearnings: replacement rates exceed 75 percent. The gross replacement rate at average earn-ings is approximately 50 percent in France, Iceland, Japan, and Norway. Not surprisingly,Ireland—which has only basic and targeted pensions and no earnings-related scheme—hasthe lowest replacement rate at average earnings. In the United Kingdom, the earnings-related public scheme does not result in a high pension: the scheme has a low accrual rateand does not cover the first slice of earnings (up to approximately one-fifth of the average).
Eastern Europe and Central Asia has more uniform replacement rates than high-incomeOECD and Latin American and Caribbean countries. Half of the countries are in the 50–60percent range. Nevertheless, there is still substantial variation, from 38 percent in Croatiato 87 percent in Turkey.
The Middle East and North African replacement rates are uniform to a similar degree asEastern Europe and Central Asia’s. Djibouti is something of an outlier: its recent reformsubstantially cut the pension promise. The gross replacement rate at average earnings of37.5 percent is one of the lowest in the whole group of 53 countries. In contrast, the othercountries in this region offer high pensions: half of the 10 countries have replacement ratesat average earnings of 80 percent or more. Half of the highest 12 replacement rates arefound in Middle Eastern and North African countries.
Low Earners
At low earnings, defined as half of the average, the pension entitlements of full-careerworkers vary less than they do at average earnings among the high-income OECD coun-tries. The average replacement rate at half of the average is 75 percent.
5. Pension Entitlements

32 PENSIONS PANORAMA: RETIREMENT-INCOME SYSTEMS IN 53 COUNTRIES
Table 5.1. Gross Replacement Rates by Earnings Level, Mandatory Pension Programs, Men(Percentage of individual preretirement gross earnings)
Individual earnings, multiple of average
0.5 0.75 1 1.5 2 2.5
High-income OECD countriesAustralia 65.1 48.4 40.0 31.7 26.2 21.9Austria 78.3 78.3 78.3 78.3 64.3 51.5Belgium 61.6 41.1 37.3 31.9 23.9 19.2Canada 72.4 52.4 42.5 28.4 21.3 17.0Denmark 82.4 56.4 43.3 30.3 23.8 19.8Finland 80.0 71.5 71.5 71.5 71.5 71.5France 84.2 56.1 49.4 47.3 44.0 42.1Germany 47.3 45.8 45.8 45.8 37.6 30.1Greece 84.0 84.0 84.0 84.0 84.0 84.0Iceland 85.5 63.7 52.8 42.8 41.3 40.3Ireland 61.3 40.9 30.6 20.4 15.3 12.3Italy 78.8 78.8 78.8 78.8 78.8 78.8Japan 69.2 56.6 50.3 44.0 36.9 29.5Korea, Rep. of 60.9 47.4 40.6 33.8 29.3 23.5Luxembourg 115.5 106.5 101.9 97.4 95.2 89.8Netherlands 68.7 68.3 68.3 68.3 68.3 68.3New Zealand 75.1 50.1 37.6 25.0 18.8 15.0Norway 65.3 56.1 52.6 46.5 38.4 31.8Portugal 103.1 68.8 66.7 65.9 65.5 64.7Spain 80.1 80.1 80.1 80.1 75.6 60.5Sweden 87.8 72.5 64.8 64.6 66.2 67.1Switzerland 62.8 60.2 58.2 44.2 33.1 26.5United Kingdom 67.4 46.4 37.1 29.3 22.5 18.0United States 53.1 44.6 40.3 36.1 30.6 27.0
Average 74.6 61.5 56.4 51.1 46.4 42.1
Eastern Europe and Central AsiaBulgaria 49.7 49.7 49.7 49.7 40.0 33.5Croatia 47.3 41.3 38.4 35.4 33.9 33.0Czech Republic 70.5 53.3 44.4 31.7 25.4 21.6Estonia 58.4 53.9 51.6 49.4 48.2 47.5Hungary 75.4 75.4 75.4 75.4 75.4 66.3Latvia 63.6 58.2 58.2 58.2 58.2 58.2Lithuania 69.9 58.9 53.4 47.8 45.1 43.4Poland 56.9 56.9 56.9 56.9 56.9 55.8Slovak Republic 48.6 48.6 48.6 48.6 48.6 48.6Turkey 96.2 90.2 87.2 84.1 71.9 57.5
Average 63.7 58.6 56.4 53.7 50.4 46.5
Latin America and the CaribbeanArgentina 104.6 76.6 62.6 48.6 41.6 37.4Chile 45.0 43.8 43.8 43.8 43.8 43.8Colombia 100.0 66.7 50.0 46.1 46.1 46.1Costa Rica 89.0 89.0 89.0 89.0 89.0 89.0Dominican Republic 105.3 70.2 52.6 35.1 29.4 29.4El Salvador 64.1 42.7 38.7 38.7 38.7 38.7
(continued on the next page)

As at average earnings, Luxembourg has the highest pensions, offering a replacementrate above 115 percent. Another set of high-income OECD countries have high pensionsfor low earners but offer average earners replacement rates nearer the average for allcountries. Portugal, for example, has an exceptionally high minimum pension, and theearnings-related scheme has a higher accrual rate for low-income workers. Similarly,France, Iceland, and Sweden have relatively high income-tested or minimum pensions.
At the other end of the scale, German social assistance and the means-tested scheme inthe United States pay only about one-fifth of average economywide earnings (table 3.1).This means that gross replacement rates for workers on half average earnings are approxi-mately 50 percent. Countries with redistributive systems, such as Canada, New Zealand,and the United Kingdom, pay little to workers on average earnings, but they move moretoward the middle of the scale when it comes to benefits for low earners. Replacementrates for low and average earners in the Netherlands are very similar, even though thebasic pension, worth more than a third of average earnings (table 3.1), is at a fairly highlevel. This is because of the franchise, a calculation mechanism applied in the Netherlands,which means that occupational pensions are not earned on the first slice of earnings. TheNetherlands therefore has the 7th highest replacement rate among the high-income OECDcountries for average earners, but only the 15th highest for low earners.
In Eastern Europe and Central Asia, countries tend to offer a slightly higher replace-ment rate to low earners than to middle earners. The replacement rate is 64 percent onaverage for low earners.
Latin America and Caribbean countries pay gross replacement rate of 78 percent to lowearners, somewhat more than the OECD countries. Argentina, Colombia, Costa Rica, theDominican Republic, and Uruguay have among the highest replacement rates for lowearners of all 53 countries.
PENSION ENTITLEMENTS 33
Table 5.1. (continued)
Individual earnings, multiple of average
0.5 0.75 1 1.5 2 2.5
Mexico 39.1 37.0 36.0 34.9 34.4 34.1Peru 49.4 39.1 39.1 39.1 39.1 39.1Uruguay 102.6 102.6 102.6 90.5 72.8 58.2
Average 77.7 63.1 57.2 51.8 48.3 46.2
Middle East and North AfricaAlgeria 80.0 80.0 80.0 80.0 80.0 80.0Bahrain 84.0 79.2 79.2 79.2 79.2 79.2Djibouti 42.5 37.5 37.5 37.5 37.5 37.5Egypt, Arab Rep. of 90.5 87.0 85.3 75.2 63.6 50.9Iran, Islamic Rep. of 132.0 115.5 115.5 115.5 115.5 115.5Jordan 69.6 67.5 67.5 67.5 67.5 67.5Libya 80.0 80.0 80.0 80.0 80.0 80.0Morocco 70.0 70.0 70.0 70.0 70.0 61.1Tunisia 64.0 64.0 64.0 64.0 64.0 64.0Yemen, Rep. of 100.0 100.0 100.0 100.0 100.0 100.0
Average 81.3 78.1 77.9 76.9 75.7 73.6
Source: Axia Economics APEX model, 2002.
Note: n.a. = not applicable. n. acs.= notional accounts. [w] = varies with earnings; [y] = varies with years ofservice; [a] = varies with age.

34 PENSIONS PANORAMA: RETIREMENT-INCOME SYSTEMS IN 53 COUNTRIES
In the Middle East and North Africa, replacement rates for low-income workers are, onaverage, a little higher than they are for middle earners: 81 and 78 percent, respectively. In half of the countries, the replacement rates are the same at the two earnings levels.
High Earners
Finally, at high earnings, Luxembourg has the highest replacement rate of the high-incomeOECD countries, with a replacement rate a little short of 95 percent. (High earnings aredefined as double the economywide average.) The Islamic Republic of Iran and theRepublic of Yemen pay 100 percent or greater replacement rates even to high earners.
The effect of pension ceilings is apparent on benefits in some countries that paid highreplacement rates to middle earners but much lower replacement rates to high earners.These include Egypt, Turkey, and Uruguay.
The countries with pure flat-rate systems—Ireland and New Zealand—are naturally theleast generous to these high earners, even with New Zealand’s exceptionally high basic pen-sion of nearly 40 percent of average earnings. Canada and the United Kingdom—althoughthey have earnings-related schemes—also provide benefits that are broadly flat rate.
On average, replacement rates are approximately 10 percentage points lower for highearners than middle earners in the high-income OECD countries and in Latin America andthe Caribbean. This differential is about six points in Eastern Europe and Central Asia. Thereplacement rates are the same for middle and high earners (with double average pay) inall of Middle East and North Africa except Egypt.

35
THE AMOUNT OF TAXES AND SOCIAL SECURITY CONTRIBUTIONS people have to pay affectsliving standards when working and in retirement. The net replacement rate, presentedin table 6.1, takes this effect into account. It shows individual net pensions relative toindividual net earnings.1
As expected, net replacement rates are higher than gross replacement rates. For the 24high-income OECD countries, net replacement rates are one-fifth larger than grossreplacement rates for average earners: 68 percent rather than 56 percent. The difference iseven larger in Eastern Europe and Central Asia. The 30 percent differential between netand gross replacement rates stems from the fact that many countries do not tax pensions oreffectively do not tax pensions because standard income tax reliefs are so high that veryfew retirees are liable for tax.2 Net replacement rates average 73 percent, compared with 56percent for gross in Eastern Europe and Central Asia. The differentials are smaller in theother two groups of countries: 13 percent in Latin America and the Caribbean and 15 percentin the Middle East and North Africa. The smaller differential reflects the smaller overalltax burden in these countries compared with high-income OECD countries or EasternEurope and Central Asia. In addition, tax concessions either for pensioners or for pensionincome are less common.
Among the high-income OECD countries, the difference in taxes paid by pensionersand workers is the highest in Belgium and Germany. In Belgium the large difference isbecause of the strongly progressive direct tax system, the relatively high direct tax burden,and the relatively low gross replacement rate. In Germany, the difference between grossand net replacement rates reflects the generous tax treatment of pension income. The effectof taxes and contributions on net versus gross entitlements is the smallest in Korea andLuxembourg. In Korea, this is because of a low general tax burden. In Luxembourg, thehigh gross replacement rate of approximately 100 percent means that older people do notbenefit from the general progressivity of the tax system in the way that they do in otherOECD countries with gross replacement rates much lower than 100 percent.
In Eastern Europe and Central Asia, taxes and contributions affect the results mostsignificantly in Bulgaria, which does not tax pension income, and Croatia, which does notlevy contributions on pension income and has a much higher tax allowance forpensioners than for workers. The smallest differentials in this group of countries—inEstonia and Turkey—are still, however, only a little below the average for the high-incomeOECD countries.
In Latin America and the Caribbean and in the Middle East and North Africa, there ismuch less variation than in the other groups in the differential between gross and netreplacement rates. The only exception is Egypt, with a gross replacement rate of 85 percentfor an average earner and a net replacement rate of 120 percent because pension income isnot subject to tax.
Measured on a net basis, pension entitlements in the Middle East and North Africaremain the highest, with an average of 88 percent. The other entitlements for average
6. Net Pension Entitlements

36 PENSIONS PANORAMA: RETIREMENT-INCOME SYSTEMS IN 53 COUNTRIES
Table 6.1. Net Replacement Rates by Earnings Level, Mandatory Pension Programs, Men(Percentage of individual preretirement net earnings)
Individual earnings, multiple of average
0.5 0.75 1 1.5 2 2.5
High-income OECD countriesAustralia 77.0 61.2 52.4 43.1 36.5 31.3Austria 91.2 93.4 93.2 93.5 79.3 63.2Belgium 82.7 63.8 62.8 50.6 40.6 34.2Canada 89.4 67.6 57.1 39.5 30.6 25.1Denmark 95.6 68.0 54.1 42.5 35.5 30.8Finland 90.7 78.8 78.8 79.2 78.3 79.3France 98.0 70.8 65.0 58.7 55.3 53.4Germany 61.7 66.6 71.8 79.2 67.0 54.2Greece 99.9 99.9 99.9 99.9 99.9 99.9Iceland 95.8 77.1 65.9 54.1 57.2 55.1Ireland 63.0 47.0 36.6 27.4 21.9 18.3Italy 89.3 88.0 88.8 88.4 89.1 89.0Japan 80.1 66.3 59.1 51.9 44.3 35.8Korea, Rep. of 65.3 51.4 44.3 38.1 34.0 27.8Luxembourg 125.0 115.0 109.8 105.6 104.2 100.1Netherlands 82.5 88.2 84.1 85.8 83.8 82.8New Zealand 77.1 52.0 39.5 27.9 22.0 18.1Norway 85.5 73.1 65.1 58.2 50.1 42.8Portugal 115.9 79.8 79.8 84.4 86.3 86.9Spain 88.7 89.4 88.3 88.4 83.4 68.8Sweden 90.2 76.4 68.2 70.1 74.3 75.0Switzerland 71.4 68.9 67.3 53.0 41.4 34.3United Kingdom 78.4 57.7 47.6 38.2 29.8 24.7United States 61.4 54.6 51.0 44.9 39.0 35.5
Average 85.7 73.1 67.9 62.6 57.7 52.8
Eastern Europe and Central AsiaBulgaria 67.1 73.8 75.2 74.0 61.8 52.9Croatia 66.7 63.1 61.6 59.7 59.6 58.9Czech Republic 88.3 68.3 58.2 42.9 35.3 31.0Estonia 59.9 60.6 60.9 61.3 61.5 61.7Hungary 86.6 90.9 90.5 99.1 92.6 81.8Latvia 89.2 83.7 81.8 76.7 74.1 72.5Lithuania 81.7 75.1 71.3 67.2 64.9 63.5Poland 69.6 69.7 69.7 69.8 70.5 71.0Slovak Republic 58.2 59.4 60.2 63.1 65.7 67.8Turkey 113.2 106.7 103.3 99.9 84.3 66.8
Average 78.1 75.1 73.3 71.4 67.0 62.8
Latin America and the CaribbeanArgentina 119.2 89.3 73.7 57.8 50.3 45.7Chile 53.3 52.6 53.5 54.5 56.3 58.5Colombia 108.8 72.6 54.4 50.2 50.2 50.3Costa Rica 102.9 103.0 103.1 103.1 103.2 103.2Dominican Republic 111.8 74.6 55.9 37.3 31.6 32.6
(continued on the next page)

earners are 73 percent in Eastern Europe and Central Asia, 68 percent in high-incomeOECD countries, and 66 percent in Latin America and the Caribbean.
The effect of taxes and contributions on net replacement rates for low earners (at halfaverage earnings) is more muted than for average earners in nearly every case. This isbecause low-income workers typically pay less in taxes and contributions than those withaverage earnings. In many cases, their retirement incomes are below the level of income taxstandard reliefs (allowances, credits, and so on). Thus, they are unable to benefit fully fromthese additional reliefs. Compared with the 20 percent differential between net and grossreplacement rates at average earnings in high-income OECD countries, the difference forlow earners is 15 percent on average. There is a similar effect in Eastern Europe and CentralAsia, with a 30 percent differential at average earnings and 23 percent at half average.
Similarly, taxes and contributions mean that net replacement rates are higher than grossreplacement rates for high earners than for average earners in most countries.
Net replacement rates have the highest average in the Middle East and North Africa, atnearly 90 percent for average earners, just over 90 percent for low earners (on half theaverage), and 87 percent for high earners (on double the average). They are especially highin the Islamic Republic of Iran, at approximately 125 percent and even higher for low earn-ers. Net replacement rates exceed 100 percent for all earners in the Republic of Yemen andfor low and middle earners in Egypt.
The net replacement rate is 73 percent for average earners in Eastern Europe andCentral Asia, 68 percent in the high-income OECD countries, and 66 percent in LatinAmerica and the Caribbean. For low earners, the difference between the four groups ofcountries is smaller, with net replacement rates ranging from 78 percent in Eastern Europeand Central Asia to just over 90 percent in Middle East and North Africa.
NET PENSION ENTITLEMENTS 37
Table 6.1. (continued)
Individual earnings, multiple of average
0.5 0.75 1 1.5 2 2.5
El Salvador 65.1 43.4 39.3 41.2 44.3 44.4Mexico 50.4 46.4 45.1 44.3 44.1 44.2Peru 54.8 43.4 43.9 46.4 47.8 48.3Uruguay 125.1 125.3 125.4 110.8 89.5 71.8
Average 87.9 72.3 66.0 60.6 57.5 55.4
Middle East and North AfricaAlgeria 89.6 89.3 89.1 88.8 88.7 88.7Bahrain 88.4 83.4 83.4 83.4 83.4 83.4Djibouti 48.7 42.8 43.4 44.7 45.3 44.6Egypt, Arab Rep. of 117.5 118.3 119.8 104.8 90.5 73.5Iran, Islamic Rep. of 141.9 124.2 124.2 126.5 129.5 131.3Jordan 77.5 75.2 76.1 77.2 77.7 78.7Libya 89.0 90.2 91.2 93.6 96.1 98.8Morocco 72.6 72.6 74.1 75.2 75.8 68.1Tunisia 73.1 72.8 72.7 73.5 73.4 73.9Yemen, Rep. of 106.2 106.3 106.3 106.3 106.3 106.3Average 90.5 87.5 88.0 87.4 86.7 84.7
Source: Axia Economics APEX model, 2002.
Note: n.a. = not applicable. n. acs.= notional accounts. [w] = varies with earnings; [y] = varies with years ofservice; [a] = varies with age.

Notes
1. See Keenay and Whitehouse (2002a, 2002b, 2003a, 2003b) for a more detailed analysisof the role of personal taxes in old-age support.
2. These differentials are percentages, not percentage points.
38 PENSIONS PANORAMA: RETIREMENT-INCOME SYSTEMS IN 53 COUNTRIES
39
DIFFERENT COUNTRIES’ PENSION SYSTEMS STRIKE very different balances between thegoals of adequacy—guaranteeing that all older people meet a minimum standard ofliving—and insurance—ensuring a certain standard of living in retirement relative tothat when working.
The relative pension level is the individual pension divided by economywide averageearnings rather than by individual earnings as in the replacement rate results presentedabove. Figure 7.1 shows relative pension levels on the vertical axis and individual preretire-ment earnings on the horizontal. Countries have been grouped by the degree to which pen-sion benefits are related (or not) to individual preretirement earnings. For each region, theresults are ordered from the weakest to the strongest link between pension and earnings.
The 24 high-income OECD countries have been divided into four groups. In the firstset of four countries (fig. 7.1a), there is little or no link between pension entitlements andpreretirement earnings. In Ireland and New Zealand, pension benefits are purely flat rate.In Canada, the relative pension level varies little: from 36 percent for low earners to 42 percentfor those on average earnings and above. Although Canada has an earnings-relatedpension scheme, its target replacement rate is very low, its ceiling is set at averageeconomywide earnings, and a resource-tested benefit is withdrawn against additionalincome from the earnings-related scheme. Thus, the relative pension level changes littlewith individual preretirement earnings, although the composition of the pension packagevaries (between targeted, basic, and earnings-related benefits). In Denmark, basic and tar-geted schemes dominate the mandatory retirement-income regime.
In the second set of five countries (fig. 7.1b), the link between pension entitlements andpreretirement earnings is also weak, despite the fact that all of the countries have manda-tory earnings-related or defined-contribution pensions. Australia, Iceland, and the UnitedKingdom all have significant resource-tested public schemes. There are important mini-mum credits in the earnings-related pension plans of Belgium and the United Kingdom.The Korean pension system has a strongly progressive formula since benefits depend onboth individual and economywide average earnings.
At the other end of the spectrum lie countries with a very strong link between pensionentitlements and preretirement earnings (fig. 7.1d). In Finland and the Netherlands, thereis no ceiling on pensionable earnings in the occupational schemes. In Italy, the ceiling onpensionable earnings in the public plan is well over three times average economywideearnings. In these countries, the replacement rate is constant for much of the earningsrange. The contrast with the nine countries in figures 7.1a and 7.1b—where pension valuesare constant or close to flat, and replacement rates decline with earnings—is stark.
The final six high-income OECD countries lie toward the middle in terms of the linkbetween pension entitlements and preretirement earnings (fig. 7.1c). In Switzerland,Norway, and the United States, this results mainly from progressive formulae in earn-ings-related schemes. Redistributive programs—minimum and targeted schemes inFrance and Portugal, the basic scheme in Japan—explain these other countries’ presencein this group.
7. The Link between Pension andEarnings
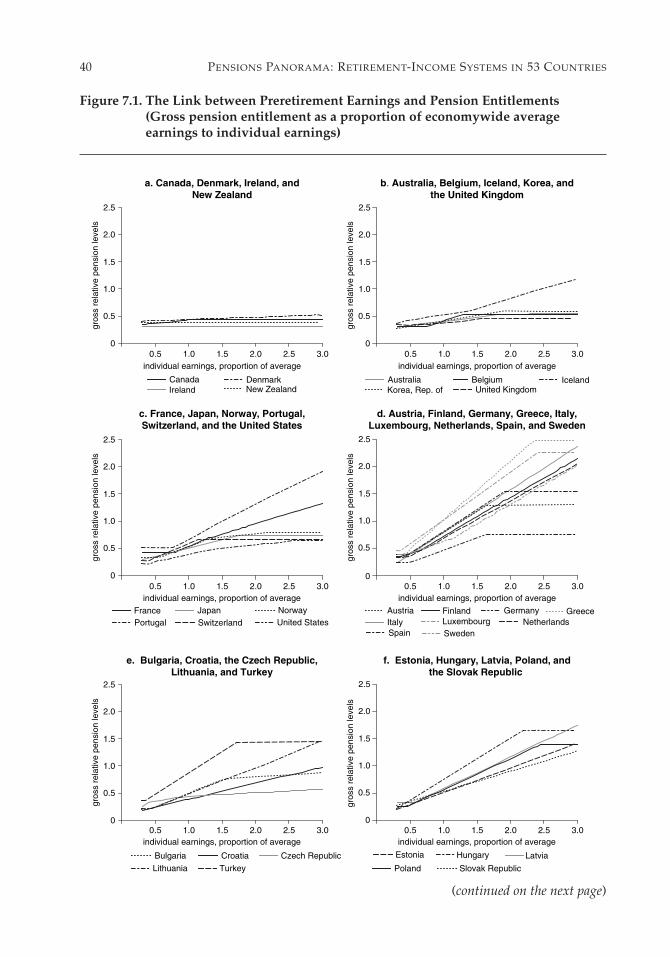
40 PENSIONS PANORAMA: RETIREMENT-INCOME SYSTEMS IN 53 COUNTRIES
a. Canada, Denmark, Ireland, andNew Zealand
b. Australia, Belgium, Iceland, Korea, andthe United Kingdom
0
0.5
1.0
1.5
2.0
2.5
gros
s re
lativ
e pe
nsio
n le
vels
0.5 1.0 1.5 2.0 2.5 3.0
0
0.5
1.0
1.5
2.0
2.5
0.5 1.0 1.5 2.0 2.5 3.0
0
0.5
1.0
1.5
2.0
2.5
0.5 1.0 1.5 2.0 2.5 3.00
0.5
1.0
1.5
2.0
2.5
0.5 1.0 1.5 2.0 2.5 3.0
0
0.5
1.0
1.5
2.0
2.5
0.5 1.0 1.5 2.0 2.5 3.0
individual earnings, proportion of average
0
0.5
1.0
1.5
2.0
2.5
gros
s re
lativ
e pe
nsio
n le
vels
0.5 1.0 1.5 2.0 2.5 3.0individual earnings, proportion of average
c. France, Japan, Norway, Portugal,Switzerland, and the United States
d. Austria, Finland, Germany, Greece, Italy,Luxembourg, Netherlands, Spain, and Sweden
individual earnings, proportion of average
gros
s re
lativ
e pe
nsio
n le
vels
individual earnings, proportion of average
gros
s re
lativ
e pe
nsio
n le
vels
e. Bulgaria, Croatia, the Czech Republic,Lithuania, and Turkey
f. Estonia, Hungary, Latvia, Poland, andthe Slovak Republic
gros
s re
lativ
e pe
nsio
n le
vels
individual earnings, proportion of average
gros
s re
lativ
e pe
nsio
n le
vels
individual earnings, proportion of average
DenmarkCanadaIreland
IcelandBelgiumKorea, Rep. of United KingdomAustralia
PortugalFrance
United StatesNorway
SwitzerlandJapan
Hungary
Poland Slovak Republic
Estonia Latvia
LuxembourgFinland GermanyAustria
NetherlandsItalySpain Sweden
Lithuania
Czech RepublicCroatiaBulgaria
Turkey
New Zealand
Greece
Figure 7.1. The Link between Preretirement Earnings and Pension Entitlements(Gross pension entitlement as a proportion of economywide average earnings to individual earnings)
(continued on the next page)

There is a similar degree of divergence in the relationship between pension entitlementsand earnings in Latin America and the Caribbean (figs. 7.1g and 7.1h). Argentina has a sig-nificant, public basic scheme, resulting in a relatively flat profile of pension level againstpreretirement earnings. In Colombia and the Dominican Republic, there are very highminimum pensions worth 50 percent or more of average earnings. Given the contributionrate required for the defined-contribution scheme, workers with earnings beyond averageearnings in Colombia, and well beyond the average in the Dominican Republic, wouldstill be entitled to the minimum pension.
There are six Latin American countries with a closer link between earnings and pen-sion entitlements. In Chile, El Salvador, Mexico, and Peru, the contributions to defined-contribution schemes are fairly comparable, and minimum pensions are set at a similarlevel relative to average earnings, much below the level in Colombia and the DominicanRepublic, for example. Costa Rica and Uruguay still have public, defined-benefit schemes.In Costa Rica, the schemes have quite a high replacement rate, with the defined-contribution
THE LINK BETWEEN PENSION AND EARNINGS 41
g. Argentina, Colombia, andthe Dominican Republic
h. Chile, Costa Rica, El Salvador,Mexico, Peru, and Uruguay
individual earnings, proportion of average
gros
s re
lativ
e pe
nsio
n le
vels
Argentina
individual earnings, proportion of averagegr
oss
rela
tive
pens
ion
leve
ls
i. Bahrain, Djibouti, the Arab Republic of Egypt,the Islamic Republic of Iran, and Jordan
j. Algeria, Libya, Morocco, Tunisia,and the Republic of Yemen
0
0.5
1.0
1.5
2.0
2.5
0.5 1.0 1.5 2.0 2.5 3.0
individual earnings, proportion of average
gros
s re
lativ
e pe
nsio
n le
vels
0
0.5
1.0
1.5
2.0
2.5
0.5 1.0 1.5 2.0 2.5 3.0individual earnings, proportion of average
gros
s re
lativ
e pe
nsio
n le
vels
0
0.5
1.0
1.5
2.0
2.5
0.5 1.0 1.5 2.0 2.5 3.0
0
0.5
1.0
1.5
2.0
2.5
0.5 1.0 1.5 2.0 2.5 3.0
ColombiaDominican Republic
Costa RicaUruguayEl SalvadorChile
PeruMexico
Bahrain Egypt, Arab Rep. of DjiboutiIran, Islamic Rep. of Jordan
LibyaAlgeria MoroccoYemen, Rep. ofTunisia
Figure 7.1. (continued)
Note: To ease comparisons between countries, the vertical axis is capped at 2.5.

plan providing additional pension. In Uruguay, the defined-benefit and defined-contributionschemes cover different slices of earnings.
In the Middle East and North Africa, there is generally a close link between earningsand pension entitlement. Coverage of retirement-income systems in this region is gener-ally much narrower than in the other groups of countries. It is unsurprising that thereshould be a close link between earnings and pensions when coverage is narrow becauseredistribution is difficult under such circumstances. Ceilings affect the results only inEgypt and Morocco. Minimum pensions are significant in Djibouti, Jordan, and, especially,the Islamic Republic of Iran. Elsewhere, minimum pensions affect only a very smallnumber of full-career workers.
The relationship between pension and earnings is more diverse in Eastern Europe andCentral Asia. Again, the left-hand panel (fig. 7.1e) shows the countries with the weakerlink, the right-hand, those with a stronger link. In Croatia, the Czech Republic, and Lithuania,there is a basic element to pensions. In Bulgaria, there is a maximum pension that affectsthe earnings-related benefits of higher earners. The Czech Republic also has a progressiveformula in its earnings-related pension scheme.
The other countries of Eastern Europe and Central Asia (fig. 7.1f) have a strong linkbetween pensions and earnings. In Estonia, Latvia, and the Slovak Republic ceilings onpensionable pay are three times economywide average earnings or more. Minimum pen-sions are also fairly low in these countries: 14 percent of average earnings in Estonia and24 percent in Poland, for example.
42 PENSIONS PANORAMA: RETIREMENT-INCOME SYSTEMS IN 53 COUNTRIES

43
THE 53 COUNTRIES ANALYZED SHOW NUMEROUS, very different approaches to pensionprovision. They vary in many dimensions.
Target Replacement Rate
First, pension provision differs in the target replacement rate. The gross replacement ratefor an average earner ranges from 30 percent in Ireland to 116 percent in the IslamicRepublic of Iran. The target gross replacement rate is nearly four times higher in theIslamic Republic of Iran than it is in Ireland. Replacement rates for average earners are also100 percent or more in Luxembourg, Uruguay, and the Republic of Yemen. Most of thehighest targets are in the Middle East and North Africa, although replacement rates above80 percent are also promised in Greece, Spain, and Turkey. In contrast, target replacementrates for average earners are 40 percent or less in Australia, Djibouti, Mexico, and theUnited States, among others.
The size of the target replacement rate for mandatory pensions illustrates the balanceof voluntary versus mandatory provision that particular countries have adopted. It is,of course, no accident that voluntary private pension provision is widespread in coun-tries such as Canada, the United Kingdom, and the United States that have relativelysmall mandatory pensions. In countries with high replacement rates under the manda-tory system, covered members have no need to make any voluntary provision forretirement.
Adequacy versus Insurance
A second dimension in which pension systems differ is the relative emphasis placed onredistribution or pension adequacy versus insurance or pension-replacement rates. In thelanguage of the typology set out at the beginning of this paper, it is the difference inweight that is given to first-tier or second-tier pensions.
The English-speaking countries tend to emphasize pension adequacy with redistributivepension systems that have a weak link or no link between pension entitlements and pre-retirement earnings. Mandatory pensions are said to be targeted, meaning that replacementrates are higher for people who had lower pay when in work. These countries includeAustralia, Canada, Ireland, New Zealand, the United Kingdom, and, to a slightly lesserextent, the United States. The emphasis on adequacy and redistribution is also strong insome Nordic countries, such as Denmark, Iceland, and Norway. The pension systems ofArgentina, Belgium, Colombia, the Czech Republic, Croatia, the Dominican Republic, andSwitzerland are also progressive.
In the Middle East and North Africa, the emphasis is very firmly on providing the sameor very similar replacement rates to all workers, so there is a strong link between pensionsand earnings. The same is true of many continental European countries, such as Greece,Hungary, Italy, Latvia, the Netherlands, Poland, and the Slovak Republic. In Latin
8. Conclusions

America and the Caribbean, only Costa Rica has such a strong link between pensionentitlements and preretirement pay.
Public or Private Provision?
A third way in which pension systems differ from one another is in the relative role of thepublic and private sectors in pension provision. As discussed above, a lower targetreplacement rate from the mandatory system means a larger role for voluntary, privateprovision. However, in many countries, the private sector is involved in running themandatory pension system. The best-known cases of pension reforms that increasethe role of the private sector are in Latin America and the Caribbean. In Chile, El Salvador,Mexico, and Peru, nearly all pension benefits in the future are likely to come from pri-vate, defined-contribution plans. Although Costa Rica and Uruguay also have defined-contribution schemes, the public, earnings-related benefit will continue to dominate.
Seven of the 10 countries of Eastern Europe and Central Asia under study now alsohave defined-contribution provision.1 Unlike Latin America and the Caribbean, the provi-sion acts only as a partial substitute for public, earnings-related schemes. Workers in thenew system will continue to get part of their pension from the public sector and part fromprivate pensions. However, even here, the balance of responsibility between public andprivate sectors varies, illustrated by the range of contributions from 2 percent in Bulgariato the eventual 10 percent in Latvia.
There is no private sector involvement in mandatory pensions in the Middle East andNorth Africa, and voluntary provision is also, in most cases, rare.
The private sector plays an important role in mandatory pension provision in approxi-mately one-third of the high-income OECD countries. In Iceland and Switzerland, private,occupational pensions are mandatory. In the Netherlands and Sweden, occupational pen-sions are best thought of as quasi-mandatory, since coverage of more than 90 percent isachieved through industrial relations agreements. Australia introduced a mandatorydefined-contribution plan in 1992, which, when mature, will play a major role in retirement-income provision. Sweden also recently introduced a mandatory defined-contributionscheme, while Denmark has a long-standing defined-contribution provision. Workers inthe United Kingdom were permitted to “contract out” of the public, earnings-relatedscheme in 1978. Initially, only occupational defined-benefit plans were permitted to substi-tute for the public scheme, but this has since been extended to defined-contributionschemes. Between 50 and 75 percent of employees have used this option to substituteprivate for public provision since the 1970s.
Designing the First Tier
In Latin America and the Caribbean and the Middle East and North Africa, there is littlevariation in the design of first-tier, adequacy-oriented pensions. There are minimum pensionsthat are part of earnings-related schemes in the Middle East and North Africa. In LatinAmerica and the Caribbean, minimum pensions are generally a separate, targeted publicbenefit that tops up benefits from private, defined-contribution schemes. Eastern Europeanand Central Asian countries have also changed their first-tier pensions in fundamental pen-sion reforms. For example, Poland abolished its basic pension when it moved to a system ofnotional accounts and a minimum pension. There has been increased targeting of benefitsin high-income OECD countries. In the future, Canada, France, Sweden, and the UnitedKingdom will all rely more on resource-tested benefits to provide retirement incomes.
44 PENSIONS PANORAMA: RETIREMENT-INCOME SYSTEMS IN 53 COUNTRIES
Designing the Second Tier
In the past, public defined-benefit schemes were the way most countries providedsecond-tier pensions, with few exceptions. France, Germany, and Norway have long usedpoints systems, which are closely related to defined-benefit schemes. Iceland and theNetherlands have never had public, earnings-related schemes. Second-tier pension provi-sion is now much more diverse. First, all 9 Latin American and Caribbean countries and 7out of 10 Eastern European and Central Asian countries have introduced private, defined-contribution plans, as discussed above. Second, countries that have maintained publicprovision of earnings-related pensions have adopted a greater variety of designs. Estoniaand the Slovak Republic, for example, have adopted points systems. Italy, Latvia, Poland,and Sweden have opted for the notional-accounts variant. These changes have all acted toincrease diversity in the design of second-tier insurance pensions.
The 53 countries studied in this paper, which span all continents of the world, have aremarkable variety of retirement-income systems. Countries can learn valuable lessonsfrom each other in designing and reforming pension systems. It is hoped that this paper,by comparing pension systems in a consistent way, will ease the transmission of construc-tive policy lessons between countries.
Notes
1. The Slovak Republic has (since January 2005) also introduced mandatory defined-contribution pensions.
CONCLUSIONS 45


Part II: Country Studies by Region


THE FIRST PART OF PENSIONS PANORAMA COMPARED RETIREMENT-INCOME SYSTEMS acrosscountries. It described the parameters and rules of pension schemes and calculated thevalue of pension entitlements for workers on different levels of earnings. This second part,in contrast, proceeds country by country. It provides more detail on the parameters andrules in each country and gives country-specific results for pension entitlements. Part Iexplains the methodology underlying the calculations presented here.
The country chapters follow a standard schema. First, there are detailed descriptions ofthe rules and parameters of the pension schemes:1
• Qualifying conditions, pension eligibility (or retirement) age, and years of contribu-tions required to receive a pension.
• Benefit calculation, the rules for each of the schemes making up the pension system,such as earnings-related schemes, mandatory private plans, and resource-testedschemes.
• Treatment of pensioners under the personal income tax and social security contribu-tions, including any reliefs for pension income. For OECD countries, general rules ofpersonal income taxes and social security contributions can be found in Taxing Wages(OECD 2003). For countries outside the OECD, summary information on the taxsystem is given in Part II.
Values of the parameters of pension, tax, and social security contribution systems aregiven in national currencies and as a proportion of average earnings.2 Parameter values innational currencies are generally rounded to the nearest currency unit.
A summary results table gives relative pension levels, replacement rates, and pensionwealth at different individual levels of earnings. These are given in both gross and netterms (the latter taking account of taxes and contributions paid when working and whendrawing the pension). Summary charts show the breakdown of the gross relative pensionvalue into the different components of the pension scheme (the first row of the figures). Asfar as possible, the same terminology is used to describe these schemes as was set out inPart I. Some standard abbreviations are used in the legends of the charts:
• SA: social assistance• Targeted: separate resource-tested schemes for older people• Minimum: a minimum pension within an earnings-related scheme• Basic: a pension based only on number of years of coverage or residency
49
9. Introduction

• Earnings-related: all public earnings-related programs, including notional accountsand points schemes as well as traditional defined-benefit plans
• DC: defined-contribution, mandatory private plans• Occupational: mandatory pensions, which can be provided by employers through
industrywide schemes (the Netherlands) and profession-based schemes (Sweden) orcan be provided publicly (Finland, France)
There are some retirement-income programs that are difficult to classify, including thenew savings credit in the United Kingdom, the government’s flat-rate contribution to DCplans in Mexico, the end-of-year scheme in Luxembourg, and the ATP scheme in Den-mark. These programs are described in the relevant country chapters.
The second row of country figures shows the effect of personal income taxes and socialsecurity contributions on relative pension values and replacement rates, giving the grossand net values.
The figures use a standard scale to ease comparisons between countries: the scale forreplacement rates runs to 125 percent, while that for relative pension values runs to2.5 times average earnings. In some cases, pension benefits exceed these maxima, and sothe measure has been capped at these levels.
The final row of country figures shows, for reference, the taxes and contributions paidby pensioners and workers. This illustrates the source of any concessions to older peoplein these systems since the values are shown for workers and pensioners with the sameincome. The effect of taxes and contributions on net replacement rates is more complexthan illustrated here. Since replacement rates are usually less than 100 percent, the normalprogressivity of the tax system means that people tend to pay fewer taxes when retiredregardless of any concessions.
The final row also shows the sources of the net replacement rate. In addition to the compo-nents of the pension system shown in the first row of charts, the sources include the effect oftaxes and contributions. The computation uses the results of the tax models on the amount oftaxes paid on earnings of a particular level and the amount of taxes due on the pensionentitlement calculated for someone earning at that level.
Notes
1. Note that the modeling relates to single, full-career workers drawing pension from thenormal eligibility age. Systems can (a) have complex rules for periods out of the labor mar-ket (caring for children or in unemployment, for example); (b) treat married couples as asingle unit; or (c) adjust benefits for early and late retirement. Since these rules do not affectthe modeling under the current assumptions, they are described only briefly.
2. For the 30 OECD countries, these are the earnings of the average production worker,as explained in Taxing Wages (OECD 2003). For other countries, average earnings are takenfrom national sources.
50 PENSIONS PANORAMA: RETIREMENT-INCOME SYSTEMS IN 53 COUNTRIES

51
10. High-Income OECD Countries

AUSTRALIA’S PENSION SYSTEM HAS TWO COMPONENTS: a means-tested age pension plus thesuperannuation guarantee, a compulsory contribution to a private pension plan. Theseplans are mainly defined-contribution plans.
Qualifying Conditions
The age pension is paid from age 65 for men. Women’s pensionable age—currently 62.5—will increase gradually to become 65 from 2013. The minimum age for withdrawing super-annuation guarantee benefits is currently 55, increasing to 60 by 2025.
Benefit Calculation
Defined ContributionThe superannuation guarantee was introduced in 1992. It consists of a mandatoryemployer contribution to a private pension plan. The mandatory contribution rate hasbeen 9 percent since 2002/03. Employers need not contribute for workers earning less thanA$ 450 a month (equivalent to A$ 5,400 a year or about 12 percent of average earnings).There is also a limit to the earnings covered by the superannuation guarantee: employersneed not contribute for employees’ pay above this threshold. For calendar 2002, this limitwas A$ 113,460 (calculated from a quarterly limit of A$ 27,510 for 2001/02 and A$ 29,220for 2002/03). This limit—worth approximately 2.5 times average earnings—is indexedto earnings. For comparison with other countries, the capital from the superannuationguarantee is converted to a price-indexed annuity.
TargetedThe value of the age pension is adjusted biannually. The average for calendar 2002 givesan annual benefit of A$ 10,984. The age pension’s value is set to ensure that it does not fallbelow 25 percent of pretax male average weekly earnings. The age pension is withdrawnonce income from other sources exceeds a threshold, known as the free area. The calendaryear figure for 2002 was A$ 2,964, approximately 7 percent of average earnings. The with-drawal rate is 40 percent. There is also an asset test.
Personal Income Tax and Social Security Contributions
Older Australians are entitled to two additional tax concessions. The more generous credit(the senior Australians tax offset) is available for those of pensionable age. This is A$ 2,230 forsingles since 2002 with income up to an income threshold of A$ 20,000 and is withdrawnat a rate of 12.5 percent for income in excess of the threshold. The credit is nonrefundable;it cannot create a negative tax liability. Taxpayers eligible for the senior Australians tax off-set benefit from a higher value of the low-income Medicare levy threshold (A$ 20,500).
53
Australia

54 PENSIONS PANORAMA: RETIREMENT-INCOME SYSTEMS IN 53 COUNTRIES
The superannuation guarantee has a complex tax treatment, with some tax extractedat all three possible stages. A 15 percent tax is levied on employer contributions to thefund. A superannuation surcharge is also applied to contributions for higher-incomeworkers. The maximum surcharge is 15 percent. The threshold where the superannuationsurcharge first applies is worth approximately 1.9 times average earnings, and the full15 percent rate applies once earnings reach 2.3 times the average. Investment earnings ofthe superannuation fund are taxed, again at 15 percent. Benefits are taxable at normal rateson withdrawal but are subject to a 15 percent rebate. (However, the first A$ 1,000 does notattract a rebate.)
There are no social security contributions in Australia.
Pension Modeling Results
Individual earnings, multiple of average
Results 0.5 0.75 1 1.5 2 2.5
Gross pension level 32.5 36.3 40.0 47.5 52.4 54.7(% of average earnings)
Net pension level 42.6 47.5 52.4 59.2 62.3 64.0(% of average net earnings)
Gross replacement rate 65.1 48.4 40.0 31.7 26.2 21.9(% of individual earnings)
Net replacement rate 77.0 61.2 52.4 43.1 36.5 31.3(% of individual net earnings)
Gross pension wealth 5.7 6.2 6.7 7.7 8.3 8.6(multiple of average earnings) 6.7 7.2 7.8 8.9 9.6 10.0
Net pension wealth 7.5 8.1 8.8 9.6 9.9 10.1(multiple of average net earnings) 8.8 9.5 10.2 11.1 11.5 11.7
Source: OECD pension models.
Note: Results in italics are for women where the results of women are different from those of men.

HIGH-INCOME OECD COUNTRIES 55
a. Gross pension level b. Gross replacement rate
gros
s re
plac
emen
t rat
e
0.25
0
0.50
0.75
1.00
1.25
0.5 1.0 1.5 2.0 2.5 3.0individual earnings, proportion of average
DC targeted
c. Gross and net pension levels d. Gross and net replacement rates
0.5
0
1.0
1.5
2.0
2.5
net a
nd g
ross
rel
ativ
e pe
nsio
n le
vels
0.5 1.0 1.5 2.0 2.5 3.0individual earnings, proportion of average
net gross
net a
nd g
ross
rep
lace
men
t rat
es
net gross
0.25
0
0.50
0.75
1.00
1.25
0.5 1.0 1.5 2.0 2.5 3.0individual earnings, proportion of average
e. Taxes paid by pensioners and workers f. Sources of net replacement rate
0.1
0
0.2
0.3
0.4
0.5
prop
ortio
n of
ear
ning
s an
d in
com
e
0.5 1.0 1.5 2.0 2.5 3.0individual pension and earnings, proportion of average earnings
worker: total pensioner: total
0.5
0
1.0
1.5
2.0
2.5
gros
s re
lativ
e pe
nsio
n le
vel
0.5 1.0 1.5 2.0 2.5 3.0individual earnings, proportion of average
DC targeted
0.25
0
0.50
0.75
1.00
prop
ortio
n of
net
rep
lace
men
t rat
e
0.5 1.0 1.5 2.0 2.5 3.0individual earnings, proportion of average
taxes and contributions DC
targeted
Australia
Source: OECD pension models.

56
AUSTRIA HAS A DEFINED-BENEFIT PUBLIC scheme with an income-tested top-up for low-income pensioners.
Qualifying Conditions
Normal pension age is 65 for men and 60 for women. There is a coverage condition:180 months’ (15 years’) employment in the last 30 years or 300 months (25 years) duringthe full lifetime. Alternatively, 180 months of contributions actually paid (as opposed tocoverage alone) are sufficient. Insured months are either contributory months (fromemployment or voluntary contributions) or supplementary (credited months, known asErsatz-zeiten) for which only limited contributions are paid.
Benefit Calculation
Earnings-RelatedThe pension benefit currently accrues at 2.00% of earnings for each year of contributions,but this will fall gradually, reaching 1.78 percent by 2009. The earnings measure is currentlythe best 15 years’ earnings. The valorization procedure is complex, although in practiceadjustments have been closer to price inflation than to earnings growth. The averagingperiod is being extended; it will reach 40 years from 2028. Valorization under this newprocedure is still under discussion. The modeling takes this full-career measure andassumes that earlier years’ earnings are revalued in line with earnings growth.
Contributions are payable up to a ceiling of €39,240, approximately 175 percent ofaverage earnings.
In recent years, pensions in payment were adjusted in line with prices up to theaverage pension; pensions above this threshold were increased by a flat amount, whichwas equal to the absolute increase given to the average pensioner. This method was usedad hoc, but it is not legally determined. Thus, adjustment of pensions in payment is dis-cretionary. For the pension wealth calculations, the modeling assumes all pensions areprice indexed.
TargetedThere is a means-tested top-up (Ausgleichszulage) that ensures a minimum retirementincome of €631 per month for single people and €900 for a couple. There are 14 annualpayments. Again, adjustment of the safety-net income is discretionary; the modelingimplicitly assumes that it will rise in line with average earnings.
Personal Income Tax and Social Security Contributions
There are no special rules for pensioners. Pensioners are unable to claim the deduction forwork expenses if their only income is a pension.
Austria
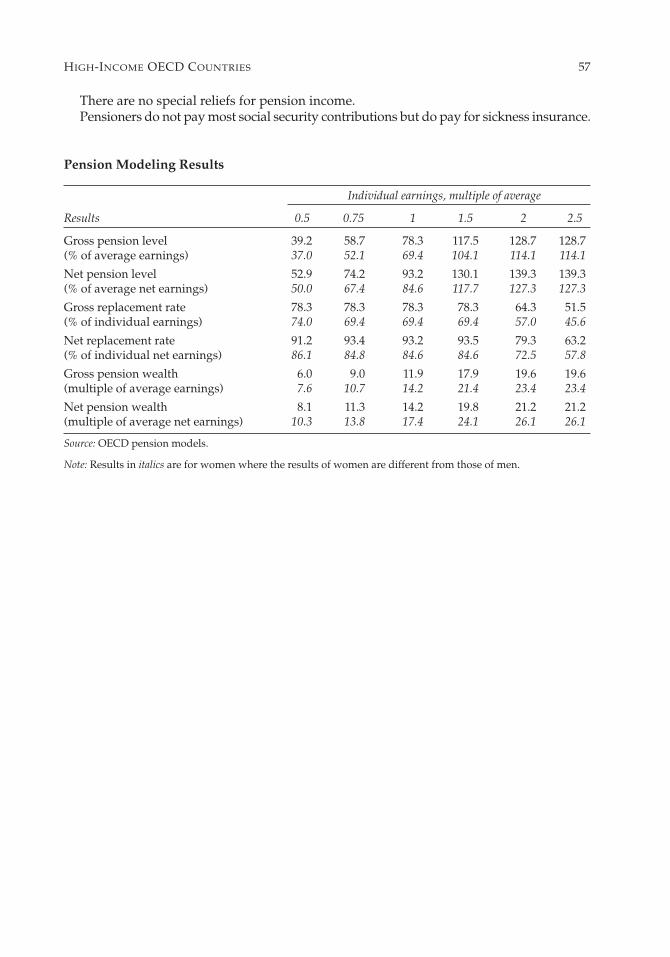
There are no special reliefs for pension income.Pensioners do not pay most social security contributions but do pay for sickness insurance.
Pension Modeling Results
Individual earnings, multiple of average
Results 0.5 0.75 1 1.5 2 2.5
Gross pension level 39.2 58.7 78.3 117.5 128.7 128.7(% of average earnings) 37.0 52.1 69.4 104.1 114.1 114.1
Net pension level 52.9 74.2 93.2 130.1 139.3 139.3(% of average net earnings) 50.0 67.4 84.6 117.7 127.3 127.3
Gross replacement rate 78.3 78.3 78.3 78.3 64.3 51.5(% of individual earnings) 74.0 69.4 69.4 69.4 57.0 45.6
Net replacement rate 91.2 93.4 93.2 93.5 79.3 63.2(% of individual net earnings) 86.1 84.8 84.6 84.6 72.5 57.8
Gross pension wealth 6.0 9.0 11.9 17.9 19.6 19.6(multiple of average earnings) 7.6 10.7 14.2 21.4 23.4 23.4
Net pension wealth 8.1 11.3 14.2 19.8 21.2 21.2(multiple of average net earnings) 10.3 13.8 17.4 24.1 26.1 26.1
Source: OECD pension models.
Note: Results in italics are for women where the results of women are different from those of men.
HIGH-INCOME OECD COUNTRIES 57

58 PENSIONS PANORAMA: RETIREMENT-INCOME SYSTEMS IN 53 COUNTRIES
a. Gross pension level b. Gross replacement rate
0.5
0
1.0
1.5
2.0
2.5
gros
s re
lativ
e pe
nsio
n le
vel
0.5
0
1.0
1.5
2.0
2.5
net a
nd g
ross
rel
ativ
e pe
nsio
n le
vels
0.5
0
1.0
1.5
2.0
2.5
net a
nd g
ross
rep
lace
men
t rat
es
earnings-related targeted earnings-related targeted
0.25
0
0.50
0.75
1.00
1.25
gros
s re
plac
emen
t rat
e
0.5 1.0 1.5 2.0 2.5 3.0individual earnings, proportion of average
0.5 1.0 1.5 2.0 2.5 3.0individual earnings, proportion of average
0.5 1.0 1.5 2.0 2.5 3.0individual earnings, proportion of average
0.5 1.0 1.5 2.0 2.5 3.0individual earnings, proportion of average
0.5 1.0 1.5 2.0 2.5 3.0individual earnings, proportion of average
0.5 1.0 1.5 2.0 2.5 3.0individual pension and earnings, proportion of average earnings
c. Gross and net pension levels d. Gross and net replacement rates
net gross net gross
e. Taxes paid by pensioners and workers f. Sources of net replacement rate
0.1
0
0.2
0.3
0.4
0.5
worker: total worker: income taxpensioner: total pensioner: income tax
0.25
0
0.50
0.75
1.00
prop
ortio
n of
net
rep
lace
men
t rat
e
prop
ortio
n of
ear
ning
s an
d in
com
e
taxes and contributions earnings-relatedtargeted
Austria
Source: OECD pension models.

59
BELGIUM HAS AN EARNINGS-RELATED PUBLIC SCHEME with a minimum pension and ameans-tested safety net.
Qualifying Conditions
The pension may be claimed at age 60 with 30 years’ contributions. This condition willincrease to 35 years in 2005. Since a full-career worker will meet this condition, the model-ing assumes that people draw the pension from age 60. Normal pensionable age is 65 formen. For women, the eligibility age in 2002 was 62. It will increase to 63 in 2003, to 64 in2006, and 65 in 2009.
Benefit Calculation
Earnings-RelatedThe full replacement rate for a single pensioner is 60 percent. For shorter contribution his-tories, the pension is proportionally reduced. The earnings measure is average lifetimepay. Earlier years’ earnings are revalued in line with prices. There is a ceiling on pension-able earnings of €39,368 for 2002 (approximately 125 percent of average earnings). Thisceiling was frozen between 1982 and 1999.
Pensions in payment are uprated in line with prices. There have also been discretionaryreal increases, which have recently been very limited (either to the lowest or the longest-running pensions).
MinimumThere is a minimum annual credit: annual earnings of less than €13,956 (equivalent toapproximately 45 percent of average earnings) are inflated to a minimum level. At least15 years’ insurance is necessary to qualify for the minimum credit. (This gives an effectiveminimum pension for a full-career worker of €11,495 for a single person, worth 37 percentof average earnings.)
The minimum earnings-related pension is €9,438 for a single person meeting the fullcontribution condition. This is worth approximately 30 percent of average earnings. Thebenefit value can be reduced proportionally for less-than-full careers, but only if the bene-ficiary has a minimum of two-thirds of the full number of years. The minimum pension isindexed to prices. Pensioners receive whichever is higher of the minimum pension and thepension from the minimum annual credit.
TargetedThe safety-net income for the elderly is €7,163 for a pensioner living alone and €4,775 fora pensioner living with others. Indexation is again to prices excluding certain goods.
Belgium

Personal Income Tax and Social Security Contributions
There are no special credits or allowances for pensioners. Pensions are taxable. There is anadditional tax reduction of €1,590 for a single person in receipt of pension income. This issubject to restrictions based on the ratio of pension income to aggregate taxable income(ATI) and on total ATI.
Pensioners with a pension above a threshold pay social security contributions of 3.55percent for health and disability. However, the net pension may not fall below €1,023 permonth. There are also “solidarity” contributions of between 0.5 and 2.0 percent levied onall pensions that exceed €13,401 per annum for single pensioners.
Pension Modeling Results
Individual earnings, multiple of average
Results 0.5 0.75 1 1.5 2 2.5
Gross pension level 30.8 30.8 37.3 47.9 47.9 47.9(% of average earnings)
Net pension level 52.1 52.1 62.8 68.4 68.4 68.4(% of average net earnings)
Gross replacement rate 61.6 41.1 37.3 31.9 23.9 19.2(% of individual earnings)
Net replacement rate 82.7 63.8 62.8 50.6 40.6 34.2(% of individual net earnings)
Gross pension wealth 5.5 5.5 7.3 9.4 9.4 9.4(multiple of average earnings) 6.3 6.3 8.4 10.7 10.7 10.7
Net pension wealth 9.3 9.3 11.3 12.9 12.9 12.9(multiple of average net earnings) 10.7 10.7 12.9 14.8 14.8 14.8
Source: OECD pension models.
Note: Results in italics are for women where the results of women are different from those of men.
60 PENSIONS PANORAMA: RETIREMENT-INCOME SYSTEMS IN 53 COUNTRIES

HIGH-INCOME OECD COUNTRIES 61
a. Gross pension level b. Gross replacement rate
0
0.5
1.0
1.5
2.0
2.5
gros
s re
lativ
e pe
nsio
n le
vel
0
0.5
1.0
1.5
2.0
2.5
net a
nd g
ross
rel
ativ
e pe
nsio
n le
vels
0.5 1.0 1.5 2.0 2.5 3.0individual earnings, proportion of average
earnings-related minimumSA
earnings-related minimumSA
0
0.25
0.50
0.75
1.00
1.25
0
0.25
0.50
0.75
1.00
1.25
gros
s re
plac
emen
t rat
e
0.5 1.0 1.5 2.0 2.5 3.0individual earnings, proportion of average
c. Gross and net pension levels d. Gross and net replacement rates
0.5 1.0 1.5 2.0 2.5 3.0individual earnings, proportion of average
net a
nd g
ross
rep
lace
men
t rat
es
0.5 1.0 1.5 2.0 2.5 3.0individual earnings, proportion of average
e. Taxes paid by pensioners and workers f. Sources of net replacement rate
0
0.1
0.2
0.3
0.4
0.5
prop
ortio
n of
ear
ning
s an
d in
com
e
0.5 1.0 1.5 2.0 2.5 3.0individual pension and earnings, proportion of average earnings
worker: total worker: income taxpensioner: total pensioner: income tax
0
0.25
0.50
0.75
1.00
prop
ortio
n of
net
rep
lace
men
t rat
e
0.5 1.0 1.5 2.0 2.5 3.0individual earnings, proportion of average
taxes and contributions earnings-related
minimum SA
net gross net gross
Belgium
Source: OECD pension models.Note: SA = social assistance.

62
IN CANADA, UNIVERSAL, FLAT-RATE PENSION, KNOWN AS OLD-AGE SECURITY, can be toppedup with an income-tested benefit, known as the guaranteed income supplement. A tier ofearnings-related benefits is provided by the Canada Pension Plan and Québec PensionPlan. These two plans offer broadly similar benefits.
Qualifying Conditions
The basic pension is subject to a residency test, with 2.5 percent of the maximum pensionearned for each year of residence after age 18 up to a maximum of 40 years. A minimum of10 years’ residency is required to receive any benefit. It is payable from age 65. For theearnings-related scheme, normal pension age is again 65, but an early pension may beclaimed from age 60.
Benefit Calculation
BasicThe average 2002 level of old-age security was C$ 5,320 (14 percent of average earnings).The value of the basic pension is price indexed. This pension is subject to an income testoperated through the tax system. Once income exceeds C$ 56,968, the basic pension iswithdrawn at a 15 percent rate. This threshold, equivalent to just less than 1.5 times aver-age earnings, is indexed to prices.
TargetedThe guaranteed income supplement gives a maximum pension, including the basic pen-sion, which averaged C$ 11,600 in 2002 (30 percent of average earnings) for a singleperson. This is withdrawn against income other than the basic pension at a 50 percent rate.The benefit level is price indexed.
Earnings-RelatedThis scheme targets a 25 percent replacement rate based on average lifetime salary, withearlier years’ pay revalued in line with economywide earnings. The full benefit requires 40 years’ contributions with proportional reductions for shorter work histories. Themaximum earnings-related pension for 2002 was C$ 779 a month (just under a quarter ofaverage earnings).
People earning less than C$ 3,500 a year (10 percent of average earnings) are notrequired to contribute. There was a ceiling of C$ 39,100 in 2002 (just over average earn-ings) on both contributions and benefits. The ceiling is indexed to prices, while the con-tribution floor is frozen in nominal terms. The value of the earnings-related pension isindexed to prices.
Canada

Personal Income Tax and Social Security Contributions
Under the personal income tax, an additional age credit of 16 percent on an amount of C$ 3,728 in 2002 is available if total income is C$ 27,749 or less. The amount of age credit isreduced at a rate of 15 percent of income in excess of C$ 27,749.
There is also a credit of 16 percent on the first C$ 1,000 of pension or annuity income.Only pension income other than from the public schemes is eligible. Public pensionbenefits are taxable, with the exception of the targeted scheme.
Social security contributions are not levied on pension income.
Pension Modeling Results
Individual earnings, multiple of average
Results 0.5 0.75 1 1.5 2 2.5
Gross pension level 36.2 39.3 42.5 42.5 42.5 42.5(% of average earnings)
Net pension level 48.7 52.9 57.1 57.2 57.2 57.2(% of average net earnings)
Gross replacement rate 72.4 52.4 42.5 28.4 21.3 17.0(% of individual earnings)
Net replacement rate 89.4 67.6 57.1 39.5 30.6 25.1(% of individual net earnings)
Gross pension wealth 5.5 6.0 6.5 6.5 6.5 6.5(multiple of average earnings) 6.4 7.0 7.6 7.6 7.6 7.6
Net pension wealth 7.4 8.1 8.7 8.7 8.7 8.7(multiple of average net earnings) 8.7 9.4 10.2 10.2 10.2 10.2
Source: OECD pension models.
Note: Results in italics are for women where the results of women are different from those of men.
HIGH-INCOME OECD COUNTRIES 63

64 PENSIONS PANORAMA: RETIREMENT-INCOME SYSTEMS IN 53 COUNTRIES
a. Gross pension level b. Gross replacement rate
earnings-related basic
targeted
earnings-related basic
targetedgr
oss
repl
acem
ent r
ate
c. Gross and net pension levels d. Gross and net replacement rates
0.5
1.0
1.5
2.0
2.5
net a
nd g
ross
rel
ativ
e pe
nsio
n le
vels
0.5
1.0
1.5
2.0
2.5
gros
s re
lativ
e pe
nsio
n le
vel
individual earnings, proportion of averagenet gross
0.25
0 0
0.50
0.75
1.00
1.25
0.25
0 0
0.50
0.75
1.00
1.25
net a
nd g
ross
rep
lace
men
t rat
es
individual earnings, proportion of averagenet gross
e. Taxes paid by pensioners and workers f. Sources of net replacement rate
0.1
0.2
0.3
0.4
0.5
prop
ortio
n of
ear
ning
s an
d in
com
e
0.5 1.0 1.5 2.0 2.5 3.0individual pension and earnings, proportion of average earnings
worker: total worker: income taxpensioner: total
0.25
0 0
0.50
0.75
1.00
prop
ortio
n of
net
rep
lace
men
t rat
e
0.5 1.0 1.5 2.0 2.5 3.0
0.5 1.0 1.5 2.0 2.5 3.0 0.5 1.0 1.5 2.0 2.5 3.0
individual earnings, proportion of average individual earnings, proportion of average0.5 1.0 1.5 2.0 2.5 3.0 0.5 1.0 1.5 2.0 2.5 3.0
individual earnings, proportion of average
taxes and contributions earnings-relatedbasic targeted
Canada
Source: OECD pension models.

65
DENMARK HAS A PUBLIC BASIC SCHEME with an income-tested supplement for low-incomepensioners. There are also two schemes based on individuals’ contribution records, theArbeidsmarkedets Tillægspension (ATP) and SP, or special pension savings schemes.Voluntary occupational schemes cover about 80 percent of the workforce.
Qualifying Conditions
The normal pension age is 65. A full state old-age pension requires 40 years’ residence.Shorter periods qualify for a prorated benefit (subject to a minimum of three years’ resi-dence).
Benefit Calculation
BasicThe full amount of the basic scheme is DKK 52,524 per year (17 percent of average earn-ings). An earnings test reduces the benefit by 30 percent if pay exceeds DKK 223,200 peryear (approximately 75 percent of average earnings).
TargetedThe full supplement is DKK 52,872 per year for single people (approximately 17 percent ofaverage earnings). The benefit is tested against all sources of income except the basic pen-sion. It is withdrawn at a rate of 30 percent once income exceeds DKK 49,200 a year for sin-gle people (approximately 16 percent of average earnings). The basic amount and thepension supplement are uprated annually in line with average earnings. If nominal earn-ings growth exceeds 2 percent a year, up to 0.3 percentage points of the excess is put in a reserve.
ATPTwo-thirds of the contributions for ATP are paid by employers and one-third by workers.The contribution depends on hours worked (not earnings). A full-time employee in theprivate sector paid DKK 2,684 in 2002. The contribution is adjusted sporadically; the mod-eling assumes it increases in line with average earnings. A notional nominal interest rate of1.5 percent is applied. However, ATP is a with-profit scheme: if actual returns exceed 1.5percent, pensions are increased. The model assumes that the ATP earns the same interestrate as defined-contribution schemes. Pensions in payment increase with prices if financialconditions allow.
Defined ContributionThe contribution to the SP is 1 percent of earnings. If the accumulated balance is lessthan DKK 15,000 at age 65, it is paid as a lump sum. If it is between DKK 15,000 andDKK 120,000, then one-tenth of the balance is paid out in the first year, one-ninth the next
Denmark

year, and so on. If the balance is more than DKK 120,000 at age 65, then the payments aremade monthly, with annual adjustments to reflect the market value of the account. There isno ceiling on earnings covered by this scheme.
Personal Income Taxes and Social Security Contributions
There are no special tax allowances or credits for pensioners. Pensions are subject toincome tax. There are no special reliefs for pension income. The payment under a fundedpension scheme is subject to a tax of 40 percent on lump-sum withdrawals. Since 2001,investment income of all types has been taxed at a 15 percent rate. Pensioners do not paysocial security contributions.
Pension Modeling Results
Individual earnings, multiple of average
Results 0.5 0.75 1 1.5 2 2.5
Gross pension level 41.2 42.3 43.3 45.4 47.5 49.6(% of average earnings)
Net pension level 51.9 53.0 54.1 56.4 58.7 60.9(% of average net earnings)
Gross replacement rate 82.4 56.4 43.3 30.3 23.8 19.8(% of individual earnings)
Net replacement rate 95.6 68.0 54.1 42.5 35.5 30.8(% of individual net earnings)
Gross pension wealth 7.0 7.2 7.4 7.7 8.0 8.3(multiple of average earnings) 8.1 8.2 8.4 8.7 9.0 9.3
Net pension wealth 7.5 7.7 7.8 8.2 8.5 8.8(multiple of average net earnings) 10.2 10.3 10.5 10.8 11.2 11.5
Source: OECD pension models.
Note: Results in italics are for women where the results of women are different from those of men.
66 PENSIONS PANORAMA: RETIREMENT-INCOME SYSTEMS IN 53 COUNTRIES

HIGH-INCOME OECD COUNTRIES 67
a. Gross pension level b. Gross replacement rate
0.5
0
1.0
1.5
2.0
2.5
gros
s re
lativ
e pe
nsio
n le
vel
0.5
0
1.0
1.5
2.0
2.5
net a
nd g
ross
rel
ativ
e pe
nsio
n le
vels
individual earnings, proportion of average
DC ATPbasic targeted
DC ATPbasic targeted
0.25
0
0.50
0.75
1.00
1.25
gros
s re
plac
emen
t rat
e
0.25
0
0.50
0.75
1.00
1.25
net a
nd g
ross
rep
lace
men
t rat
es
individual earnings, proportion of average
c. Gross and net pension levels d. Gross and net replacement rates
individual earnings, proportion of averagenet gross net gross
individual earnings, proportion of average
e. Taxes paid by pensioners and workers f. Sources of net replacement rate
0.1
0
0.2
0.3
0.4
0.5
prop
ortio
n of
ear
ning
s an
d in
com
e
0.5 1.0 1.5 2.0 2.5 3.0 0.5 1.0 1.5 2.0 2.5 3.0
0.5 1.0 1.5 2.0 2.5 3.0 0.5 1.0 1.5 2.0 2.5 3.0
0.5 1.0 1.5 2.0 2.5 3.0 0.5 1.0 1.5 2.0 2.5 3.0
individual pension and earnings, proportion of average earnings
worker: total worker: income tax
pensioner: total
0.25
0
0.50
0.75
1.00
prop
ortio
n of
net
rep
lace
men
t rat
e
individual earnings, proportion of average
taxes and contributions DC ATP
basic targeted
Denmark
Source: OECD pension models.

68
FINLAND’S TWO-TIER PENSION SYSTEM consists of the national state pension, which ispension income tested, and a range of statutory earnings–related schemes with similarrules. The schemes for private sector employees are partially prefunded, while the publicsector schemes are pay-as-you-go, financed with buffer funds.
Qualifying Conditions
The national pension is subject to a residency test (but no contribution requirements) andis withdrawn against pension income from the earnings-related schemes. Both thenational and the earnings-related pensions are payable from age 65. The full benefit ispayable with 40 years’ residence as an adult, with pro rata adjustments for shorter periodsof residence.
Benefit Calculation
Earnings-RelatedFrom 2005, the accrual rate will be 1.5 percent of pensionable pay at ages 18–52, 1.9percent at 53–62, and 4.5 percent at 63–67. For a full-career worker (20–65), the aggregateaccrual at the time of retirement will be 77.5 percent of pensionable earnings. The maximumreplacement rate of 60 percent is abolished from 2005. From that year, pensionable paywill be based on career-average earnings, with earlier years revalued in line with a mix ofeconomywide earnings and prices: wage growth will have an 80 percent weight, and priceinflation, 20 percent. Pensionable pay is gross earnings less employees’ pension contribu-tions. A recently legislated change will reduce pension benefits from 2010 according toincreases in life expectancy from that date. The adjustment takes the form of an annuitycalculation using a discount rate of 2 percent per year. The adjustment expected in theyear 2040, based on the mortality projections, is to reduce benefits to 88.6 percent of theirvalue under the prereform rules. There is no contribution floor and no ceiling to contri-butions or pensionable earnings. After retirement, the pension is uprated using a mix of20 percent of earnings inflation and 80 percent of price inflation.
TargetedThe basic monthly benefit for a single pensioner in 2002 was between €467 and €488(approximately a fifth of average earnings) depending on municipality. The pension isreduced by 50 percent of the difference between other pension income and a disregard of€550 per year. The basic pension benefit and the parameters of the means test are upratedannually in line with prices.
Finland

Personal Income Tax and Social Security Contributions
There are no special rules for the taxation of pensioners. Recipients of pension income maydeduct an allowance from their income subject to municipal income tax to a maximum of€6,540 for a single person in 2002. The allowance is withdrawn at a rate of 70 percent ofincome above the full allowance. The allowance is “wasteable”: the pension-incomeallowance cannot exceed the amount of pension income.
Workers receive a deduction for work-related expenses, which is not available for pen-sioners.
There are no contributions on pension income for pension or unemployment insurance.From 2003, however, the same sickness-insurance contributions are levied on pensioners’incomes as on those of workers. The sickness-insurance contribution is levied on taxableincome as defined in municipal taxation.
Pension Modeling Results
Individual earnings, multiple of average
Results 0.5 0.75 1 1.5 2 2.5
Gross pension level 38.0 47.5 63.3 95.0 126.6 158.3(% of average earnings)
Net pension level 50.5 58.5 71.5 98.3 123.1 146.6(% of average net earnings)
Gross replacement rate 75.9 63.3 63.3 63.3 63.3 63.3(% of individual earnings)
Net replacement rate 87.3 73.1 71.5 71.8 71.3 71.9(% of individual net earnings)
Gross pension wealth 5.9 7.5 10.0 14.9 19.9 24.9(multiple of average earnings) 7.0 8.9 11.8 17.7 23.6 29.5
Net pension wealth 7.9 9.2 11.2 15.5 19.4 23.0(multiple of average net earnings) 9.3 10.9 13.3 18.3 23.0 27.3
Source: OECD pension models.
Note: Results in italics are for women where the results of women are different from those of men.
HIGH-INCOME OECD COUNTRIES 69

70 PENSIONS PANORAMA: RETIREMENT-INCOME SYSTEMS IN 53 COUNTRIES
a. Gross pension level b. Gross replacement rate
0.5
0
1.0
1.5
2.0
2.5
gros
s re
lativ
e pe
nsio
n le
vel
earnings-related targeted
0.25
0
0.50
0.75
1.00
1.25
0.25
0
0.50
0.75
1.00
1.25
gros
s re
plac
emen
t rat
e
earnings-related targeted
c. Gross and net pension levels d. Gross and net replacement rates
0.5
0
1.0
1.5
2.0
2.5
net a
nd g
ross
rel
ativ
e pe
nsio
n le
vels
net gross net gross
net a
nd g
ross
rep
lace
men
t rat
es
e. Taxes paid by pensioners and workers f. Sources of net replacement rate
0.1
0
0.2
0.3
0.4
0.5
prop
ortio
n of
ear
ning
s an
d in
com
e
0.5 1.0 1.5 2.0 2.5 3.0individual pension and earnings, proportion of average earnings
worker: total worker: income taxpensioner: total
0.25
0
0.50
0.75
1.00
prop
ortio
n of
net
rep
lace
men
t rat
e
0.5 1.0 1.5 2.0 2.5 3.0
individual earnings, proportion of average
0.5 1.0 1.5 2.0 2.5 3.0individual earnings, proportion of average
0.5 1.0 1.5 2.0 2.5 3.0individual earnings, proportion of average
0.5 1.0 1.5 2.0 2.5 3.0individual earnings, proportion of average
0.5 1.0 1.5 2.0 2.5 3.0individual earnings, proportion of average
taxes and contributions earnings-relatedtargeted
Finland
Source: OECD pension models.

71
FRANCE HAS A TWO-TIER SYSTEM, with an earnings-related public pension and mandatoryoccupational schemes, based on a points system. The public scheme also has a minimumpension.
Qualifying Conditions
A full state pension will require 40 years’ contributions from 2008, compared with 37.5years in 2002. The normal pension age is 60. The minimum pension has the same qualify-ing conditions as the public, earnings-related scheme.
Benefit Calculation
Earnings-RelatedThe target replacement rate is 50 percent for a full career. For shorter contribution periods,the target is reduced pro rata, with an additional penalty for missing years (or each year thepension is drawn before age 65). The earnings measure is a number of best years, valorizedin line with prices. From 2008, pay will be averaged over 25 years. There is a ceiling oneligible earnings, which in 2002 was €28,224, equivalent to approximately 125 percent ofaverage earnings. Benefits in payment are indexed to prices.
MinimumThe minimum pension was €525 per month in 2002 (a little under 30 percent of averageearnings). For the full benefit, 40 years of contributions are needed; the pension is proratedfor shorter periods. The value of the minimum pension is indexed to prices.
Mandatory OccupationalThe ARRCO scheme covers the majority of private sector employees. The descriptionrelates to noncadres. Benefits are earned on 6 percent of earnings up to the public pensionceiling. Benefits are earned on 16 percent of pay, between one and three times the publicceiling, giving an ARRCO ceiling of €84,672 (approximately 375 percent of average earn-ings). Points earned each year are contributions divided by pension-point cost. At retire-ment, accumulated points are converted into a pension by multiplying these by thepension-point value. The calendar 2002 point value was €1.05, and the point cost, €11.00.The current accord between the social partners (government, employers, and tradeunions), which is valid until 2008, increases the pension-point cost relative to earnings andthe pension-point value relative to prices. The modeling assumes that the increases willremain.
TargetedThe minimum income for people aged 65 or over is €6,832 a year (approximately 30 per-cent of average earnings). This income is adjusted in line with earnings. The 2003 reform
France

introduced a new objective: from 2008, full-career workers earning the minimum wage(about 60 percent of average earnings) would receive a pension of at least 85 percent of thenet minimum wage. For 2002, the net minimum wage was €10,882.
Personal Income Tax and Social Security Contributions
There are no specific deductions for older people. There are no special reliefs for pensionincome. Older people are not liable for standard social security contributions. However,they pay the general social tax (CSG, contribution sociale generalisée) of 6 percent. There is anexemption for the lowest-income pensioners (depending on liability for the personalincome tax and the housing tax, taxe d’habitation), which means that some 40 percent ofolder people do not pay CSG.
Pension Modeling Results
Individual earnings, multiple of average
Results 0.5 0.75 1 1.5 2 2.5
Gross pension level 42.1 42.1 49.4 70.9 88.0 105.2(% of average earnings)
Net pension level 55.5 55.5 65.0 84.3 102.6 120.1(% of average net earnings)
Gross replacement rate 70.1 56.1 49.4 47.3 44.0 42.1(% of individual earnings)
Net replacement rate 84.2 70.8 65.0 58.7 55.3 53.4(% of individual net earnings)
Gross pension wealth 7.6 7.6 8.9 12.8 15.9 18.9(multiple of average earnings) 8.7 8.7 10.2 14.7 18.2 21.8
Net pension wealth 10.0 10.0 11.7 15.2 18.5 21.6(multiple of average net earnings) 11.5 11.5 13.5 17.5 21.3 24.9
Source: OECD pension models.
Note: Results in italics are for women where the results of women are different from those of men.
72 PENSIONS PANORAMA: RETIREMENT-INCOME SYSTEMS IN 53 COUNTRIES

HIGH-INCOME OECD COUNTRIES 73
a. Gross pension level b. Gross replacement rate
0.5
0
1.0
1.5
2.0
2.5
gros
s re
lativ
e pe
nsio
n le
vel
occupational earnings-relatedminimum targeted
0.25
0
0.50
0.75
1.00
1.25
gros
s re
plac
emen
t rat
eoccupational earnings-related
minimum targeted
c. Gross and net pension levels d. Gross and net replacement rates
0
0.5
1.0
1.5
2.0
2.5
net a
nd g
ross
rel
ativ
e pe
nsio
n le
vels
0.5 1.0 1.5 2.0 2.5 3.0individual earnings, proportion of average
0.5 1.0 1.5 2.0 2.5 3.0individual earnings, proportion of average
0.5 1.0 1.5 2.0 2.5 3.0individual earnings, proportion of average
0.5 1.0 1.5 2.0 2.5 3.0individual earnings, proportion of average
net gross
0
0.25
0.50
0.75
1.00
1.25
net a
nd g
ross
rep
lace
men
t rat
es
net gross
e. Taxes paid by pensioners and workers f. Sources of net replacement rate
0.1
0
0.2
0.3
0.4
0.5
prop
ortio
n of
ear
ning
s an
d in
com
e
0.5 1.0 1.5 2.0 2.5 3.0 0.5 1.0 1.5 2.0 2.5 3.0individual pension and earnings, proportion of average earnings
worker: total worker: income taxpensioner: total pensioner: income tax
0.25
0
0.50
0.75
1.00
prop
ortio
n of
net
rep
lace
men
t rat
e
individual earnings, proportion of average
taxes and contributions occupationalearnings-related minimum targeted
France
Source: OECD pension models.

74
THE PUBLIC PENSION IN GERMANY HAS A SINGLE TIER, based on pension points. There isalso a social-assistance safety net.
Qualifying Conditions
The pension is payable from age 65 with five years’ contributions and from age 63 with 35years’ contributions. Fewer than five years’ contributions earn no benefit.
Benefit Calculation
Earnings-RelatedA year’s contribution at average earnings earns one point. Contributions are levied onmonthly earnings between €325 and €4,500 (2002 values). The floor and ceiling are equiva-lent to 12 percent and 163 percent of average earnings, respectively. The ceiling alsoapplies to the number of points earned. Average covered earnings were €28,626 in 2002,equivalent to 86 percent of the earnings of the average production worker in that year. Thesum of points at pension age is multiplied by a pension-point value, which was €25.31 inthe first half of 2002 and €25.86 in the second half of the year. The first three years’ contri-butions before age 25 are adjusted upward to the lesser of the two quantities: 75 percent oftotal pension entitlement or 75 percent of lifetime-average pay. The pension-point value isuprated annually in line with gross wages subject to an adjustment for increases in thetotal contribution rate to the public scheme. The government aims to limit this rate to 22.0percent. In 2002, the total contribution rate was 19.1 percent. In the long term, therefore,the pension-point value will fall relative to real earnings. A further change in rules was legislated in 2004 but has not been modeled. The sustainability factor will link the upratingof the pension-point value to changes in the system-dependency ratio—that is, the ratio ofpensioners to contributors. Some parameters are slightly different in the new Länder (thefederal states that made up the German Democratic Republic before reunification).
Social AssistanceThe benefit value is determined regionally. The government pays the health and long-termcare contributions of older social-assistance recipients. There is also a supplement to coverhousing and fuel costs. Average total social-assistance receipt in the Western Länder in 2002was €648 per month.
Personal Income Tax and Social Security Contributions
There is no special relief for older people. Income up to a statutory line (the Existenzmini-mum) is exempt from tax. This was €7,236 per person in 2002. This provision appliesequally to citizens of pension age and those of working age.
Germany

Some forms of pension income are taxed as if they were annuities. A part of the incomereflecting the (notional) repayment of capital is not taxable, while a part relating to the(notional) interest on the capital is taxable. The taxable part covers the public pension, pri-vately purchased annuities, and two types of occupational pension plans. The proportionof the income subject to tax varies with the age at which the individual first started draw-ing the pension. For retirement at age 65, only 27 percent of the pension is taxable. Theshare at other illustrative ages is as follows: 38 percent at age 55, 32 percent at age 60, and21 percent at age 70. There are additional deductions totaling €138 (€102 plus €36) forpensions drawn at any age.
Pensioners do not pay social security contributions on pension income for unemploy-ment or pension insurance. However, pensioners pay half of the rate paid by workers forsickness and long-term care, which, in 2002, were 7.00 percent and 0.85 percent, respectively.
Pension Modeling Results
Individual earnings, multiple of average
Results 0.5 0.75 1 1.5 2 2.5
Gross pension level 23.6 34.4 45.8 68.7 75.2 75.2(% of average earnings)
Net pension level 37.0 53.8 71.8 107.7 117.8 117.8(% of average net earnings)
Gross replacement rate 47.3 45.8 45.8 45.8 37.6 30.1(% of individual earnings)
Net replacement rate 61.7 66.6 71.8 79.2 67.0 54.2(% of individual net earnings)
Gross pension wealth 4.3 6.2 8.3 12.5 13.7 13.7(multiple of average earnings) 5.1 7.4 9.8 14.8 16.2 16.2
Net pension wealth 6.7 9.8 13.0 19.6 21.4 21.4(multiple of average net earnings) 8.0 11.6 15.4 23.1 25.3 25.3
Source: OECD pension models.
Note: Results in italics are for women where the results of women are different from those of men.
HIGH-INCOME OECD COUNTRIES 75

76 PENSIONS PANORAMA: RETIREMENT-INCOME SYSTEMS IN 53 COUNTRIES
a. Gross pension level b. Gross replacement rate
0
0.5
1.0
1.5
2.0
2.5
gros
s re
lativ
e pe
nsio
n le
vel
0.5 1.0 1.5 2.0 2.5 3.0individual earnings, proportion of average
earnings-related SA
0
0.25
0.50
0.75
1.00
1.25
gros
s re
plac
emen
t rat
e
0.5 1.0 1.5 2.0 2.5 3.0individual earnings, proportion of average
earnings-related SA
c. Gross and net pension levels d. Gross and net replacement rates
0
0.5
1.0
1.5
2.0
2.5
net a
nd g
ross
rel
ativ
e pe
nsio
n le
vels
0.5 1.0 1.5 2.0 2.5 3.0individual earnings, proportion of average
net gross net gross
0
0.25
0.50
0.75
1.00
1.25
net a
nd g
ross
rep
lace
men
t rat
es
0.5 1.0 1.5 2.0 2.5 3.0individual earnings, proportion of average
e. Taxes paid by pensioners and workers f. Sources of net replacement rate
0
0.1
0.2
0.3
0.4
0.5
prop
ortio
n of
ear
ning
s an
d in
com
e
0.5 1.0 1.5 2.0 2.5 3.0individual pension and earnings, proportion of average earnings
worker: total worker: income taxpensioner: total pensioner: income tax
0
0.25
0.50
0.75
1.00
prop
ortio
n of
net
rep
lace
men
t rat
e
0.5 1.0 1.5 2.0 2.5 3.0individual earnings, proportion of average
taxes and contributions earnings-relatedSA
Germany
Source: OECD pension models.

77
GREECE HAS AN EARNINGS-RELATED PUBLIC SCHEME, with two components plus a series ofminimum pensions and social safety nets. The system applies to labor-market entrantsfrom 1993.
Qualifying Conditions
Normal pensionable age is 65 for men and 60 for women, equalized at 65 for peopleentering the labor force from 1993. A full pension requires a minimum of 4,500 days of con-tributions (equivalent to approximately 15 years). Workers with 11,100 working days(approximately 37 years) can retire on a full benefit regardless of age. An early pension ispayable from age 60 with the standard contribution requirement (of 4,500 days). There areconcessions for people who work in arduous or hazardous occupations and for womenwith dependent or disabled children. The minimum social pension requires 15 years’ con-tributions. The safety-net programs—the social solidarity grant and social solidaritybenefit—pay benefits from age 60, subject to income tests as described below.
Benefit Calculation
Earnings-Related: Main ComponentFor labor-market entrants from 1993, the pension is 2 percent of earnings for each year ofcontributions. The maximum insurance period is 35 years. The earnings measure is the aver-age over the last five years before retirement. Earlier years’ pay is valorized in line with theincrease in the pensions for public sector workers (see below). There is a maximum pensionof four times 1991 gross national product (GNP) per capita, linked to the evolution of civilservants’ pensions. For 2002, this cap on pension benefits was €2,144 per month. The calcu-lations indicate that, for a full-career worker, this is equivalent to a ceiling on pensionableearnings of 325 percent of average earnings. Adjustment of pensions in payment is discre-tionary. In the past five years, pension increases have been progressive (larger increases forsmaller pensioners), with one exception. Given the lack of consistent practice in recent bene-fit adjustments, pension wealth calculations are based on price indexation. All pensions have14 “monthly” payments (with two bonus payments at different times in the year).
Earnings-Related: Supplementary ComponentThe full supplementary pension is 20 percent of the earnings measure under the main com-ponent of the earnings-related scheme for workers with 35 years of contributions. The pen-sion is proportionally reduced for shorter contribution periods, implying a linear accrual rateof 0.57 percent. The value is increased by one-thirty-fifth for each year of contributions (300days) beyond 35 years.
MinimumThe minimum pension is set as 70 percent of the minimum wage for a married, full-timeemployee. For 2002, the value was €377 per month, equivalent to approximately 40 percent
Greece

of average earnings. This value is adjusted annually as part of the income policy. There areadditional income-tested, noncontributory schemes—the social solidarity grant and thesocial solidarity benefit—as well as a scheme for the uninsured. These are not relevant to afull-career worker.
Personal Income Tax and Social Security Contributions
There are no special reliefs for pensioners or for pension income. Pensioners do not paysocial security contributions.
Pension Modeling Results
Individual earnings, multiple of average
Results 0.5 0.75 1 1.5 2 2.5
Gross pension level 42.0 63.0 84.0 126.0 168.0 210.0(% of average earnings)
Net pension level 50.3 75.4 99.9 140.8 176.0 210.3(% of average net earnings)
Gross replacement rate 84.0 84.0 84.0 84.0 84.0 84.0(% of individual earnings)
Net replacement rate 99.9 99.9 99.9 99.9 99.9 99.9(% of individual net earnings)
Gross pension wealth 6.3 9.4 12.6 18.9 25.2 31.5(multiple of average earnings) 7.3 10.9 14.5 21.8 29.1 36.3
Net pension wealth 7.5 11.3 15.0 21.1 26.4 31.5(multiple of average net earnings) 8.7 13.0 17.3 24.4 30.4 36.4
Source: OECD pension models.
Note: Results in italics are for women where the results of women are different from those of men.
78 PENSIONS PANORAMA: RETIREMENT-INCOME SYSTEMS IN 53 COUNTRIES

HIGH-INCOME OECD COUNTRIES 79
a. Gross pension level b. Gross replacement rate
supplement earnings-related
targeted
supplement earnings-related
targeted
c. Gross and net pension levels d. Gross and net replacement rates
net gross net gross
e. Taxes paid by pensioners and workers f. Sources of net replacement rate
worker: total worker: income tax
pensioner: total
taxes and contributions supplement
earnings-related targeted
0
0.5
1.0
1.5
2.0
2.5
gros
s re
lativ
e pe
nsio
n le
vel
0.5 1.0 1.5 2.0 2.5 3.00
0.25
0.50
0.75
1.00
1.25
gros
s re
plac
emen
t rat
e
0.5 1.0 1.5 2.0 2.5 3.0individual earnings, proportion of average
0
0.5
1.0
1.5
2.0
2.5
net a
nd g
ross
rel
ativ
e pe
nsio
n le
vels
0.5 1.0 1.5 2.0 2.5 3.0individual earnings, proportion of average
0
0.25
0.50
0.75
1.00
1.25
net a
nd g
ross
rep
lace
men
t rat
es
0.5 1.0 1.5 2.0 2.5 3.0individual earnings, proportion of average
0
0.1
0.2
0.3
0.4
0.5
prop
ortio
n of
ear
ning
s an
d in
com
e
0.5 1.0 1.5 2.0 2.5 3.0individual pension and earnings, proportion of average earnings
0
0.25
0.50
0.75
1.00
prop
ortio
n of
net
rep
lace
men
t rat
e
0.5 1.0 1.5 2.0 2.5 3.0individual earnings, proportion of average
individual earnings, proportion of average
Greece
Source: OECD pension models.
80
THE PUBLIC PENSION IN ICELAND HAS THREE COMPONENTS, a basic and two income-testedschemes. There are also mandatory occupational pensions with a hybrid (albeit a mainlydefined-benefit) formula.
Qualifying Conditions
The normal pension age is 67. A full basic pension is earned with 40 years’ residency. Thepension is proportionally reduced for shorter periods of residency, with a minimumrequirement of three years. The pension age is also 67 for members of private sector occu-pational plans but is 65 for public sector workers.
Benefit Calculation
BasicThe full basic pension value is ISK 19,900 per month (approximately 9 percent of averageearnings). This benefit is income tested: withdrawal begins once income (from sourcesother than the supplementary pension) exceeds ISK 1,296,060, equivalent to half of aver-age earnings. The withdrawal rate is 30 percent. This income test applies only to nonpen-sion income, such as earnings or capital income.
TargetedA second element is the pension supplement, with a maximum value of ISK 34,372 permonth for a single person (16 percent of average earnings). This is withdrawn againstincome above ISK 415,894 per year (approximately 16 percent of average earnings), but thebasic pension does not affect its value. The withdrawal rate for the income test in the pen-sion supplement is 45 percent. Finally, there is an additional pension supplement with amaximum entitlement of ISK 15,257 per month (just 7 percent of average earnings). Thesupplement is withdrawn at a rate of two-thirds against all other income. All public bene-fit levels are adjusted in line with public sector pay, (which is assumed to be the same aseconomywide earnings growth).
Mandatory Occupational The law requires schemes to target a replacement rate of 56 percent with 40 years’ contri-butions, giving an accrual rate of 1.4 percent for each year of service. Coverage is manda-tory for people aged 16 to 70. The earnings base is average lifetime salary. There is noceiling on pensionable earnings. Occupational pensions in payment must, by law, increaseat least in line with consumer price inflation.
In practice, many schemes pay more than the legal minimum outlined above, typicallyintroducing a hybrid defined-contribution and defined-benefit element into the system.There is a minimum contribution to occupational schemes of 10 percent of earnings.Contributions above the level needed to finance the statutory benefits described above
Iceland

may be either used to increase defined-benefit entitlements or diverted to individualaccounts, thus delivering a defined-contribution pension. However, the modeling coversonly the mandatory component and not these extrastatutory benefits (which are by nomeans guaranteed).
Personal Income Tax and Social Security Contributions
Pensioners are taxed in the same way as people of working age: there are no additionalallowances. There is no specific relief for pension income. Pensioners do not pay socialsecurity contributions.
Pension Modeling Results
Individual earnings, multiple of average
Results 0.5 0.75 1 1.5 2 2.5
Gross pension level 42.8 47.8 52.8 64.3 82.6 100.9(% of average earnings)
Net pension level 57.1 61.5 65.9 76.0 92.0 108.1(% of average net earnings)
Gross replacement rate 85.5 63.7 52.8 42.8 41.3 40.3(% of individual earnings)
Net replacement rate 95.8 77.1 65.9 54.1 57.2 55.1(% of individual net earnings)
Gross pension wealth 7.1 7.8 8.4 9.9 12.6 15.3(multiple of average earnings) 8.1 8.8 9.4 11.1 14.1 17.2
Net pension wealth 9.5 10.0 10.5 11.7 14.0 16.4(multiple of average net earnings) 10.8 11.3 11.8 13.1 15.8 18.4
Source: OECD pension models.
Note: Results in italics are for women where the results of women are different from those of men.
HIGH-INCOME OECD COUNTRIES 81

82 PENSIONS PANORAMA: RETIREMENT-INCOME SYSTEMS IN 53 COUNTRIES
a. Gross pension level b. Gross replacement rate
occupational targetedsupplement
occupational targetedsupplement
c. Gross and net pension levels d. Gross and net replacement rates
net gross net gross
e. Taxes paid by pensioners and workers f. Sources of net replacement rate
worker: total worker: income tax
pensioner: total
taxes and contributions occupational
targeted supplement
0
0.5
1.0
1.5
2.0
2.5
gros
s re
lativ
e pe
nsio
n le
vel
0.5 1.0 1.5 2.0 2.5 3.0individual earnings, proportion of average
0
0.25
0.50
0.75
1.00
1.25
gros
s re
plac
emen
t rat
e
0.5 1.0 1.5 2.0 2.5 3.0individual earnings, proportion of average
0
0.5
1.0
1.5
2.0
2.5
net a
nd g
ross
rel
ativ
e pe
nsio
n le
vels
0.5 1.0 1.5 2.0 2.5 3.0individual earnings, proportion of average
0
0.25
0.50
0.75
1.00
1.25
net a
nd g
ross
rep
lace
men
t rat
es
0.5 1.0 1.5 2.0 2.5 3.0individual earnings, proportion of average
0
0.1
0.2
0.3
0.4
0.5
prop
ortio
n of
ear
ning
s an
d in
com
e
0.5 1.0 1.5 2.0 2.5 3.0individual pension and earnings, proportion of average earnings
0
0.25
0.50
0.75
1.00
prop
ortio
n of
net
rep
lace
men
t rat
e
0.5 1.0 1.5 2.0 2.5 3.0individual earnings, proportion of average
Iceland
Source: OECD pension models.

83
THE PUBLIC PENSION IN IRELAND IS A BASIC SCHEME paying a flat rate to all who meet thecontribution conditions. There is also a means-tested pension to provide a safety net forthe low-income elderly. Voluntary occupational pension schemes provide broad coverageto approximately half of employees. (The government has a target to increase this pro-portion to 70 percent.)
Qualifying Conditions
The old-age contributory pension is payable from age 66 while the retirement pension ispaid from age 65. Full entitlement to both benefits requires an average of 48 weeks’ contri-butions or credits per year throughout the working life. The pension value is proportion-ally reduced for incomplete contribution histories. However, the old-age contributorypension requires a minimum average of 10 weeks’ contributions per year, and the retire-ment pension, 24 weeks’ per year. There is also a minimum total period of contributions of260 weeks (equivalent to five years’ full coverage).
The means-tested pension is payable from age 66.
Benefit Calculation
BasicThe values of the old-age contributory pension and the retirement pension are both€147.30 per week (paid for 53 weeks per year), which is approximately 30 percent of aver-age earnings. There is an addition of €98.10 for a dependent adult of working age and€113.80 for a dependent age 66 or over. The value of the basic pension under a recent long-term plan is fixed relative to earnings: the target rate is 34 percent of average earnings.
TargetedThe maximum value of the means-tested benefit is €134 per week for a single person withan extra €88.50 for an adult dependent. The single person’s benefit is worth 28 percent ofaverage earnings. There is a small disregard in the means test. Otherwise, the benefit iswithdrawn at 100 percent of income. There is also an assets test, which converts capital ofmore than €20,315 to income using a standard formula.
The value of the target safety-net income in the means-tested scheme broadly followsthe uprating of the basic schemes (it is linked to earnings).
Personal Income Tax and Social Security Contributions
There is an additional tax credit for single people over 65 of €205. This is on top of thegeneral credit, which was €1,520 per person in 2002. Over 65s are also entitled to a muchhigher exemption limit (below which no tax is paid). Single people over 65 have an
Ireland

exemption of €13,000 compared with the general exemption of €5,210. There are no spe-cial rules regarding the taxation of pension income. Pensioners are not liable for socialsecurity contributions.
Pension Modeling Results
Individual earnings, multiple of average
Results 0.5 0.75 1 1.5 2 2.5
Gross pension level 30.6 30.6 30.6 30.6 30.6 30.6(% of average earnings)
Net pension level 36.6 36.6 36.6 36.6 36.6 36.6(% of average net earnings)
Gross replacement rate 61.3 40.9 30.6 20.4 15.3 12.3(% of individual earnings)
Net replacement rate 63.0 47.0 36.6 27.4 21.9 18.3(% of individual net earnings)
Gross pension wealth 5.4 5.4 5.4 5.4 5.4 5.4(multiple of average earnings) 6.5 6.5 6.5 6.5 6.5 6.5
Net pension wealth 6.5 6.5 6.5 6.5 6.5 6.5(multiple of average net earnings) 7.7 7.7 7.7 7.7 7.7 7.7
Source: OECD pension models.
Note: Results in italics are for women where the results of women are different from those of men.
84 PENSIONS PANORAMA: RETIREMENT-INCOME SYSTEMS IN 53 COUNTRIES
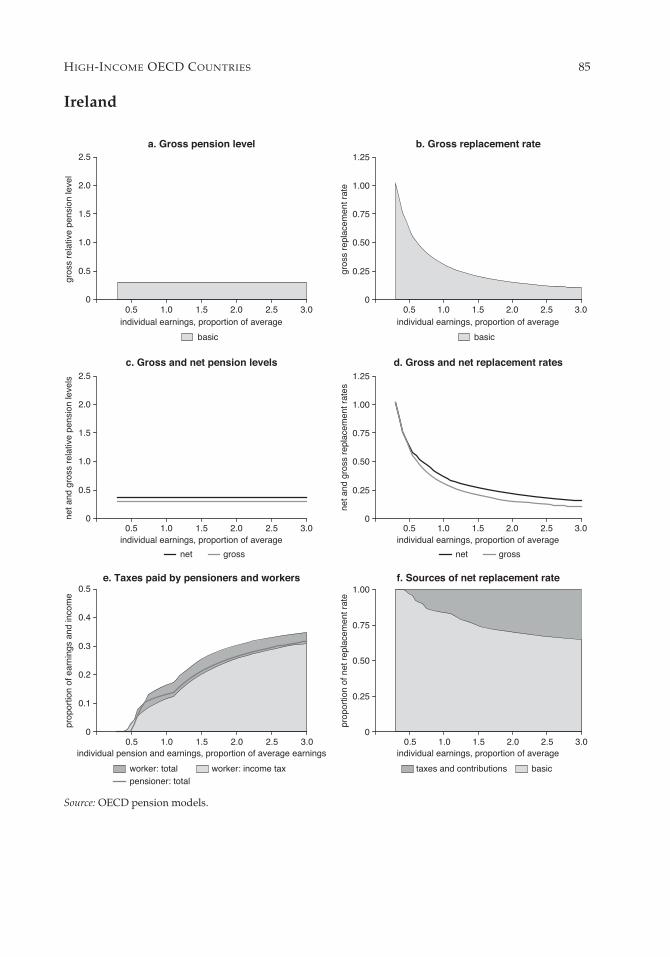
HIGH-INCOME OECD COUNTRIES 85
a. Gross pension level b. Gross replacement rate
basic basic
c. Gross and net pension levels d. Gross and net replacement rates
net gross net gross
e. Taxes paid by pensioners and workers f. Sources of net replacement rate
worker: total worker: income taxpensioner: total
taxes and contributions basic
0
0.5
1.0
1.5
2.0
2.5
gros
s re
lativ
e pe
nsio
n le
vel
0.5 1.0 1.5 2.0 2.5 3.0individual earnings, proportion of average
0
0.25
0.50
0.75
1.00
1.25
gros
s re
plac
emen
t rat
e
0.5 1.0 1.5 2.0 2.5 3.0individual earnings, proportion of average
0
0.5
1.0
1.5
2.0
2.5
net a
nd g
ross
rel
ativ
e pe
nsio
n le
vels
0.5 1.0 1.5 2.0 2.5 3.0individual earnings, proportion of average
0
0.25
0.50
0.75
1.00
1.25
net a
nd g
ross
rep
lace
men
t rat
es
0.5 1.0 1.5 2.0 2.5 3.0individual earnings, proportion of average
0
0.1
0.2
0.3
0.4
0.5
prop
ortio
n of
ear
ning
s an
d in
com
e
0.5 1.0 1.5 2.0 2.5 3.0individual pension and earnings, proportion of average earnings
0
0.25
0.50
0.75
1.00
prop
ortio
n of
net
rep
lace
men
t rat
e
0.5 1.0 1.5 2.0 2.5 3.0individual earnings, proportion of average
Ireland
Source: OECD pension models.

86
THE NEW ITALIAN PENSION SYSTEM is based on notional accounts. Contributions earn a rateof return related to GDP growth. Benefits are a function of accumulated notional capitaland an actuarial factor, which takes account of average life expectancy at retirement. Thenew system applies in full to labor-market entrants from 1996 onward.
Qualifying Conditions
The normal pension age under the new system will be 65, but it will be possible to drawthe pension from age 57, subject to five years’ contributions. However, the pension valuemust also be worth at least 1.2 times the social-assistance pension. The modeling assumesthat people retire at age 65.
Benefit Calculation
Earnings-RelatedNotional accounts are credited with 33 percent of earnings, slightly more than actual con-tributions. The notional interest rate is a five-year moving average of GDP growth. Giventhe projected decline in the Italian labor force and a baseline assumption of 2 percent realwage growth, real GDP should grow at 1.6 percent per year. The resulting notional capitalis multiplied by a transformation coefficient at retirement, which varies with the age at whichthe pension is claimed. The values are reviewed every 10 years on the basis of evidence ofmortality rates at different ages and assuming a real discount rate of 1.5 percent. Minimumpay for contribution purposes is €152 per week (37 percent of average earnings). Maxi-mum earnings are €76,443 per year (nearly 360 percent of average earnings). The indexa-tion of pensions in payment is complex. For benefits up to three times the minimumpension, there is full price indexation. This threshold is €1,178 (approximately two-thirdsof average earnings). Between three and five times the minimum pension, uprating is 90percent of price inflation. Above this threshold, uprating falls to 75 percent of prices.
Social AssistanceThe minimum pension is abolished for people covered only under the new system (that is,entrants in 1996 and after). However, pensioners with incomes below the social-assistancelevel can claim a benefit from age 65, subject to a means test. The 2002 value of social assis-tance (assegno sociale), including supplements, was €4,725 (€364 a month). There is ahigher benefit of €6,714 for individuals over 70.
Personal Income Tax and Social Security Contributions
In addition to standard reliefs, pensioners with no other income received tax credits as setout in the 2002 schedule below:
Italy

Income (lower limit) € 4,855 € 9,296 € 9,554 € 9,813Age < 75 € 98 € 62Age > 75 € 222 € 186 € 93 € 46
Private pension incomes are only partially taxable: 87.5 percent of benefits are taxablefor occupational pension schemes and 60.0 percent for personal pension plans. Social secu-rity contributions are not levied on pension income.
Pension Modeling Results
Individual earnings, multiple of average
Results 0.5 0.75 1 1.5 2 2.5
Gross pension level 39.4 59.1 78.8 118.2 157.6 197.0(% of average earnings)
Net pension level 49.1 69.3 88.8 125.2 159.7 192.0(% of average net earnings)
Gross replacement rate 78.8 78.8 78.8 78.8 78.8 78.8(% of individual earnings)
Net replacement rate 89.3 88.0 88.8 88.4 89.1 89.0(% of individual net earnings)
Gross pension wealth 5.8 8.7 11.4 16.5 22.0 27.5(multiple of average earnings) 6.9 10.4 13.5 19.4 25.9 32.4
Net pension wealth 7.2 10.2 12.8 17.5 22.3 26.8(multiple of average net earnings) 8.6 12.2 15.2 20.6 26.3 31.6
Source: OECD pension models.
Note: Results in italics are for women where the results of women are different from those of men.
HIGH-INCOME OECD COUNTRIES 87

88 PENSIONS PANORAMA: RETIREMENT-INCOME SYSTEMS IN 53 COUNTRIES
a. Gross pension level b. Gross replacement rate
earnings-related earnings-related
c. Gross and net pension levels d. Gross and net replacement rates
net gross net gross
e. Taxes paid by pensioners and workers f. Sources of net replacement rate
worker: total worker: income taxpensioner: total
taxes and contributions earnings-related
0
0.5
1.0
1.5
2.0
2.5
gros
s re
lativ
e pe
nsio
n le
vel
0.5 1.0 1.5 2.0 2.5 3.0individual earnings, proportion of average
0
0.25
0.50
0.75
1.00
1.25
gros
s re
plac
emen
t rat
e
0.5 1.0 1.5 2.0 2.5 3.0individual earnings, proportion of average
0
0.5
1.0
1.5
2.0
2.5
net a
nd g
ross
rel
ativ
e pe
nsio
n le
vels
0.5 1.0 1.5 2.0 2.5 3.0individual earnings, proportion of average
0
0.25
0.50
0.75
1.00
1.25
net a
nd g
ross
rep
lace
men
t rat
es
0.5 1.0 1.5 2.0 2.5 3.0individual earnings, proportion of average
0
0.1
0.2
0.3
0.4
0.5
prop
ortio
n of
ear
ning
s an
d in
com
e
0.5 1.0 1.5 2.0 2.5 3.0individual pension and earnings, proportion of average earnings
0
0.25
0.50
0.75
1.00
prop
ortio
n of
net
rep
lace
men
t rat
e
0.5 1.0 1.5 2.0 2.5 3.0individual earnings, proportion of average
Italy
Source: OECD pension models.
89
THE JAPANESE PUBLIC PENSION SYSTEM HAS TWO TIERS: a basic, flat-rate scheme and anearnings-related plan.
Qualifying Conditions
The old-age, basic pension is paid from age 65 with a minimum of 25 years’ contributions.However, reduced benefits may be received from age 60. The earnings-related pension ispaid in addition to basic pension with a minimum of one month’s contribution, provideda pensioner is entitled to the basic pension. The pension age under this program is gradu-ally being increased from 60 years to 65 for men in 2025 and for women in 2030.
Benefit Calculation
BasicThe full basic pension for 2002 was JPY 804,200 per year, corresponding to 19 percent ofaverage earnings. Average receipt of the basic pension is approximately JPY 620,000 peryear. The value of the basic pension is price indexed.
Earnings-RelatedThe employees’ pension scheme has a flat rate and an earnings-related component. Themost important part is the earnings-related pension. The accrual rate was 0.7500 percent oflifetime average earnings, gradually falling to 0.7125 percent. Past earnings are valorizedin line with average earnings. There is a ceiling on earnings applied to calculate contribu-tions; it is set at JPY 620,000 a month, equivalent to 175 percent of average earnings.
The flat-rate benefit amounts to JPY 1,676 per month of contributions. This is paid onlyto pensioners aged between 60 and 64 years. As the model assumes retirement at 65, thiscomponent is not included.
The employees’ pension in payment is price indexed.
Personal Income Tax and Social Security Contributions
There is an additional JPY 500,000 deduction for over 65s if their income is less than JPY 10 million in total.
There is a schedule of deductions for over 65s, beginning with 100 percent of the firstJPY 1 million of income from the public pension scheme (or from a particular type of pri-vate pension scheme such as a tax-qualified retirement plan). Next, 25 percent of incomeup to JPY 3.6 million is deductible, followed by 15 percent of income up to JPY 7.2 million,and 5 percent thereafter. Finally, the deduction is subject to a minimum of JPY 1.4 million. There are no special rules for the taxation of pension income.
Contributions to health insurance and elderly care insurance are levied on pensionincome.
Japan

Pension Modeling Results
Individual earnings, multiple of average
Results 0.5 0.75 1 1.5 2 2.5
Gross pension level 34.6 42.4 50.3 65.9 73.7 73.7(% of average earnings)
Net pension level 40.9 50.2 59.1 76.1 84.5 84.5(% of average net earnings)
Gross replacement rate 69.2 56.6 50.3 44.0 36.9 29.5(% of individual earnings)
Net replacement rate 80.1 66.3 59.1 51.9 44.3 35.8(% of individual net earnings)
Gross pension wealth 5.7 7.0 8.3 10.9 12.2 12.2(multiple of average earnings) 6.5 7.9 9.4 12.3 13.8 13.8
Net pension wealth 6.8 8.3 9.8 12.6 14.0 14.0(multiple of average net earnings) 7.6 9.4 11.0 14.2 15.8 15.8
Source: OECD pension models.
Note: Results in italics are for women where the results of women are different from those of men.
90 PENSIONS PANORAMA: RETIREMENT-INCOME SYSTEMS IN 53 COUNTRIES
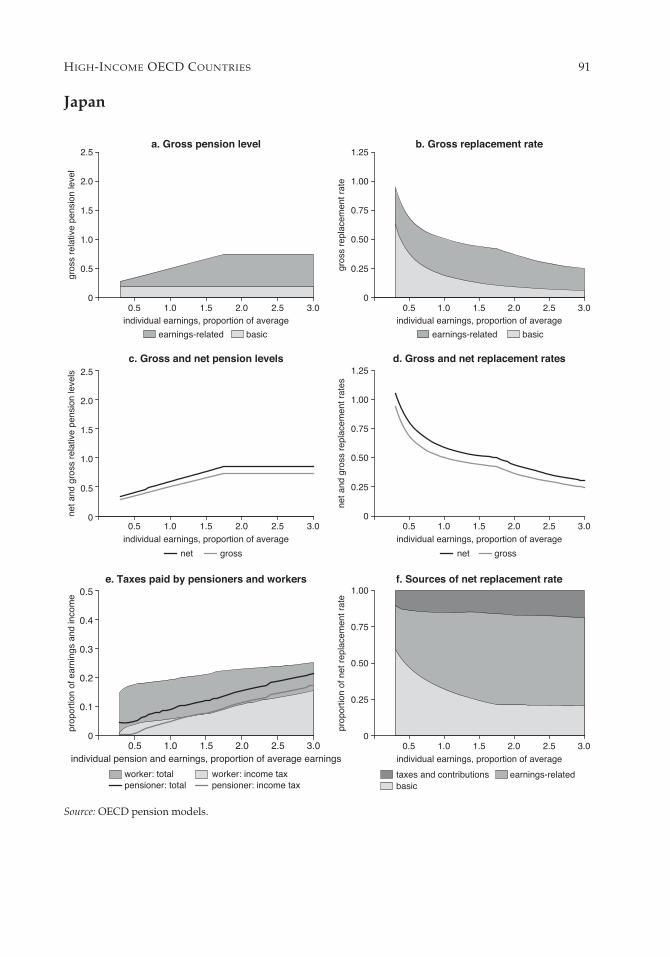
HIGH-INCOME OECD COUNTRIES 91
a. Gross pension level b. Gross replacement rate
earnings-related basic earnings-related basic
c. Gross and net pension levels d. Gross and net replacement rates
net gross net gross
e. Taxes paid by pensioners and workers f. Sources of net replacement rate
worker: total worker: income taxpensioner: total pensioner: income tax
taxes and contributions earnings-relatedbasic
0
0.5
1.0
1.5
2.0
2.5
gros
s re
lativ
e pe
nsio
n le
vel
0.5 1.0 1.5 2.0 2.5 3.0individual earnings, proportion of average
0
0.25
0.50
0.75
1.00
1.25
gros
s re
plac
emen
t rat
e
0.5 1.0 1.5 2.0 2.5 3.0individual earnings, proportion of average
0
0.5
1.0
1.5
2.0
2.5
net a
nd g
ross
rel
ativ
e pe
nsio
n le
vels
0.5 1.0 1.5 2.0 2.5 3.0individual earnings, proportion of average
0
0.25
0.50
0.75
1.00
1.25
net a
nd g
ross
rep
lace
men
t rat
es
0.5 1.0 1.5 2.0 2.5 3.0individual earnings, proportion of average
0
0.1
0.2
0.3
0.4
0.5
prop
ortio
n of
ear
ning
s an
d in
com
e
0.5 1.0 1.5 2.0 2.5 3.0individual pension and earnings, proportion of average earnings
0
0.25
0.50
0.75
1.00
prop
ortio
n of
net
rep
lace
men
t rat
e
0.5 1.0 1.5 2.0 2.5 3.0individual earnings, proportion of average
Japan
Source: OECD pension models.

92
THE KOREAN PUBLIC PENSION SCHEME was introduced relatively recently. It is an earnings-related scheme with a progressive formula: benefits are based on both individual andeconomywide average earnings.
Qualifying Conditions
The pension is available from age 60 provided the individual has contributed for 10 yearsor more. An actuarially reduced early pension can be drawn from age 55.
Benefit Calculation
Earnings-RelatedThe scheme is earnings related. Benefits accrue at the rate of 1.5 percent of earnings peryear of membership up to a maximum replacement rate of 100 percent. Earlier years’ earn-ings are valorized in line with average earnings. The earnings measure used in the formulais the average of individual lifetime-average earnings and economywide average pay(measured over the previous three years).
The component of pension based on individual earnings and the part based on averageearnings are shown separately in the charts since the part based on economywide averageearnings is akin to basic schemes operated in other countries.
There is a ceiling to pensionable pay of KRW 3.6 million per month, which is equivalentto double average earnings.
The benefit is indexed to prices after retirement.
Personal Income Tax and Social Security Contributions
Pensioners receive an additional allowance of KRW 0.5 million on top of the standardallowance of KRW 1 million.
Pension income is taxable. There is a pension-income deduction, the thresholds ofwhich are half of those that apply to workers. Below KRW 2.5 million, all income isdeductible. Above that level, the marginal rate of deduction falls to 40 percent, 20 percent,and, finally, 10 percent as shown below:
Lower limit (KRW million) 0 2.5 5 9Deduction (KRW million) total amount 2.5 3.5 4.3Marginal deduction (%) 100 40 20 10
Pensioners do not pay social security contributions.
Republic of Korea

Pension Modeling Results
Individual earnings, multiple of average
Results 0.5 0.75 1 1.5 2 2.5
Gross pension level 43.9 51.2 58.5 73.1 84.5 84.5(% of average earnings)
Net pension level 47.7 55.3 63.0 78.2 89.8 89.8(% of average net earnings)
Gross replacement rate 87.8 68.3 58.5 48.8 42.2 33.8(% of individual earnings)
Net replacement rate 93.4 73.0 63.0 54.2 48.3 39.6(% of individual net earnings)
Gross pension wealth 7.2 8.4 9.6 12.0 13.9 13.9(multiple of average earnings) 8.5 9.9 11.3 14.2 16.4 16.4
Net pension wealth 7.9 9.1 10.4 12.9 14.8 14.8(multiple of average net earnings) 9.2 10.7 12.2 15.1 17.4 17.4
Source: OECD pension models.
Note: Results in italics are for women where the results of women are different from those of men.
HIGH-INCOME OECD COUNTRIES 93

94 PENSIONS PANORAMA: RETIREMENT-INCOME SYSTEMS IN 53 COUNTRIES
b. Gross replacement ratea. Gross pension level
earnings-related basic earnings-related basic
c. Gross and net pension levels d. Gross and net replacement rates
net gross net gross
e. Taxes paid by pensioners and workers f. Sources of net replacement rate
worker: total worker: income tax
pensioner: totaltaxes and contributions earnings-relatedbasic
0
0.5
1.0
1.5
2.0
2.5
gros
s re
lativ
e pe
nsio
n le
vel
0.5 1.0 1.5 2.0 2.5 3.0individual earnings, proportion of average
0
0.25
0.50
0.75
1.00
1.25
gros
s re
plac
emen
t rat
e
0.5 1.0 1.5 2.0 2.5 3.0individual earnings, proportion of average
0
0.5
1.0
1.5
2.0
2.5
net a
nd g
ross
rel
ativ
e pe
nsio
n le
vels
0.5 1.0 1.5 2.0 2.5 3.0individual earnings, proportion of average
0
0.25
0.50
0.75
1.00
1.25
net a
nd g
ross
rep
lace
men
t rat
es
0.5 1.0 1.5 2.0 2.5 3.0individual earnings, proportion of average
0
0.1
0.2
0.3
0.4
0.5
prop
ortio
n of
ear
ning
s an
d in
com
e
0.5 1.0 1.5 2.0 2.5 3.0individual pension and earnings, proportion of average earnings
0
0.25
0.50
0.75
1.00
prop
ortio
n of
net
rep
lace
men
t rat
e
0.5 1.0 1.5 2.0 2.5 3.0individual earnings, proportion of average
Korea
Source: OECD pension models.

95
THE PUBLIC PENSION SCHEME IN LUXEMBOURG HAS TWO COMPONENTS: a flat-rate part contin-gent on years of coverage and an earnings-related part. There is also a minimum pension.
Qualifying Conditions
The pension is payable from age 57 with 40 years’ (compulsory or voluntary) contributions.With 40 years of compulsory, voluntary, or credited contributions, it is paid from age 60.Otherwise, pension age is 65 (with at least 10 years’ contributions).
Benefit Calculation
BasicThe basic pension was worth €311 per month in March 2002, subject to 40 years’ coverage(approximately 12 percent of average earnings). For incomplete insurance, the benefit isproportionally reduced. There is also an end-of-year allowance, which adds €42 per monthto the pension for 40 years’ contributions. This is proportionally reduced for insuranceperiods under 40 years, implying a little over €1 per month for each year covered. Theend-of-year allowance is indexed to nominal earnings.
Earnings-RelatedThe accrual rate is 1.85 percent per year. The earnings measure is the lifetime averagerevalued in line with average earnings. The accrual rate is higher for older workers andlonger contribution periods. Each year of work after age 55 increases the accrual rate by0.01 percentage points, as does each year of contributions above 38. The maximum accrualrate is 2.05 percent. The maximum pension in March 2002 was €5,513 per month (justabove twice the average earnings). Benefits are indexed to prices and additional adjust-ments to real wages are considered every two years. Recently, increases have kept pacewith the growth of average earnings; the modeling assumes that this scenario continues.
MinimumThe minimum pension is €1,191 per month for 40 years’ coverage (equivalent to 46 percentof average earnings). The amount is proportionally reduced for shorter periods, subject to aminimum 20 years of service periods (compulsory, voluntary, or credited contributions).
Social AssistanceThe social-assistance safety-net level is €942 per month for a single person.
Personal Income Tax and Social Security Contributions
Pensioners receive a deduction for professional expenses of a minimum of €300 (com-pared with €540 for people of working age). Pensioners do not receive the travel expensesdeduction (a minimum of €396 for workers) or the special deduction (€600 for workers).
Luxembourg

There are no special tax reliefs for pension income. Pensioners pay 2.65 percent sicknesscontributions on their gross income plus about 1.00 percent for long-term care insurance.This compares with 4.95 percent sickness contributions for employees (and the same 1.00percent for long-term care). Pensioners also contribute to the unemployment-insurancescheme through a 2.50 percent solidarity surcharge on their central government incometax liabilities. However, they do not contribute to the pension scheme.
Pension Modeling Results
Individual earnings, multiple of average
Results 0.5 0.75 1 1.5 2 2.5
Gross pension level 57.7 79.8 101.9 146.2 190.4 224.5(% of average earnings)
Net pension level 68.6 90.4 109.8 145.2 178.8 205.9(% of average net earnings)
Gross replacement rate 115.5 106.5 101.9 97.4 95.2 89.8(% of individual earnings)
Net replacement rate 125.0 115.0 109.8 105.6 104.2 100.1(% of individual net earnings)
Gross pension wealth 10.3 14.3 18.3 26.2 34.1 40.2(multiple of average earnings) 12.8 17.7 22.6 32.3 42.1 49.7
Net pension wealth 12.3 16.2 19.7 26.0 32.0 36.9(multiple of average net earnings) 15.2 20.0 24.3 32.1 39.6 45.6
Source: OECD pension models.
Note: Results in italics are for women where the results of women are different from those of men.
96 PENSIONS PANORAMA: RETIREMENT-INCOME SYSTEMS IN 53 COUNTRIES

HIGH-INCOME OECD COUNTRIES 97
a. Gross pension level b. Gross replacement rate
earnings-related end-of-yearbasic SA
earnings-related end-of-yearbasic SA
c. Gross and net pension levels d. Gross and net replacement rates
net gross net gross
e. Taxes paid by pensioners and workers f. Sources of net replacement rate
worker: total worker: income taxpensioner: total pensioner: income tax
taxes and contributions earnings-relatedbasic SA
0
0.5
1.0
1.5
2.0
2.5
gros
s re
lativ
e pe
nsio
n le
vel
0.5 1.0 1.5 2.0 2.5 3.0
individual earnings, proportion of average
0
0.25
0.50
0.75
1.00
1.25
gros
s re
plac
emen
t rat
e
0.5 1.0 1.5 2.0 2.5
individual earnings, proportion of average
0
0.5
1.0
1.5
2.0
2.5
net a
nd g
ross
rel
ativ
e pe
nsio
n le
vels
0.5 1.0 1.5 2.0 2.5 3.0individual earnings, proportion of average
0
0.25
0.50
0.75
1.00
1.25
net a
nd g
ross
rep
lace
men
t rat
es
0.5 1.0 1.5 2.0 2.5individual earnings, proportion of average
0
0.1
0.2
0.3
0.4
0.5
prop
ortio
n of
ear
ning
s an
d in
com
e
0.5 1.0 1.5 2.0 2.5 3.0individual pension and earnings, proportion of average earnings
0
0.25
0.50
0.75
1.00
prop
ortio
n of
net
rep
lace
men
t rat
e
0.5 1.0 1.5 2.0 2.5individual earnings, proportion of average
end-of-year
Luxembourg
Source: OECD pension models.

98
THE DUTCH PENSION SYSTEM HAS TWO MAIN TIERS, consisting of a flat-rate public schemeand earnings-related occupational plans. Although there is no statutory obligation foremployers to offer a pension scheme to their employees, industrial relations agreementsmean that 91 percent of employees are covered.
Qualifying Conditions
The basic pension is payable from age 65. Normal retirement age is also typically 65 inoccupational plans.
Benefit Calculation
BasicFor a single person, the gross benefit in 2002 was €11,013 (just over a third of average earnings).Its value is uprated biannually in line with the net minimum wage. The social-assistancebenefit for older people is equal to the net basic pension.
Quasi-mandatory OccupationalThe Netherlands also has a private pension system with broad coverage. More than 90percent of its members are covered by defined-benefit schemes. Of these, approximatelytwo-thirds use an average salary measure of earnings in the benefit formula, while the restuse a final salary measure. There is no ceiling to pensionable earnings.
There is no statutory requirement for entry ages for occupational plans. In 2003, a littleover half of the employees were in schemes with no entry age, 6 percent in schemes withan entry age of 16–20, 15 percent with 21–24, and 23 percent with entry age 25. Most final-salary schemes give 1.75 percent of those earnings for each year of service, implying areplacement rate of 70 percent after a complete 40-year career. Average-salary plans typi-cally have an accrual rate of 2.25 percent for each year of service.
There are no legal requirements for valorization of earlier years’ pay; thus, practicevaries. Some schemes valorize with average earnings; others use the index for upratingpensions in payment. Since the latter is also typically average earnings, the modelingassumes an average-salary scheme with valorization to average earnings. Benefits in pay-ment are typically indexed to earnings (more than half of the members are covered in suchschemes), although there is no legal uprating requirement.
Occupational pensions are integrated with the public pension system. The current taxrules allow a maximum benefit of 100 percent of final pay at age 65 from both public andprivate systems. Most schemes have a target total replacement rate of 70 percent of finalpay, so private benefits are reduced by an amount approximately equal to the value of thepublic pension entitlement, a process known as franchising.
The Netherlands

Personal Income Tax and Social Security Contributions
The basic tax credit for over 65s is €737. This tax credit is increased by €289 for incomesless than €28,563. Single people with incomes below €28,563 receive an additional taxcredit of €256. There are no special allowances for pension income.
Pensioners pay 11.5 percent of pension income for general health insurance andsurvivor’s pensions. Depending on their income, they pay for their own health insurance.The social security contributions are less than the contributions for employees (who alsopay for old-age pensions, unemployment, and so on).
Pension Modeling Results
Individual earnings, multiple of average
Results 0.5 0.75 1 1.5 2 2.5
Gross pension level 34.3 51.2 68.3 102.4 136.5 170.6(% of average earnings)
Net pension level 46.4 66.3 84.1 118.8 144.7 170.3(% of average net earnings)
Gross replacement rate 68.7 68.3 68.3 68.3 68.3 68.3(% of individual earnings)
Net replacement rate 82.5 88.2 84.1 85.8 83.8 82.8(% of individual net earnings)
Gross pension wealth 5.2 7.7 10.3 15.5 20.6 25.8(multiple of average earnings) 5.9 8.9 11.8 17.7 23.6 29.5
Net pension wealth 7.0 10.0 12.7 18.0 21.9 25.7(multiple of average net earnings) 8.0 11.5 14.6 20.6 25.1 29.5
Source: OECD pension models.
Note: Results in italics are for women where the results of women are different from those of men.
HIGH-INCOME OECD COUNTRIES 99

100 PENSIONS PANORAMA: RETIREMENT-INCOME SYSTEMS IN 53 COUNTRIES
a. Gross pension level b. Gross replacement rate
occupational basic occupational basic
c. Gross and net pension levels d. Gross and net replacement rates
net gross net gross
e. Taxes paid by pensioners and workers f. Sources of net replacement rate
worker: total worker: income taxpensioner: total pensioner: income tax
taxes and contributions occupationalbasic
0
0.5
1.0
1.5
2.0
2.5
gros
s re
lativ
e pe
nsio
n le
vel
0.5 1.0 1.5 2.0 2.5 3.0individual earnings, proportion of average
0
0.25
0.50
0.75
1.00
1.25
gros
s re
plac
emen
t rat
e
0.5 1.0 1.5 2.0 2.5 3.0individual earnings, proportion of average
0
0.5
1.0
1.5
2.0
2.5
net a
nd g
ross
rel
ativ
e pe
nsio
n le
vels
0.5 1.0 1.5 2.0 2.5 3.0individual earnings, proportion of average
0
0.25
0.50
0.75
1.00
1.25
net a
nd g
ross
rep
lace
men
t rat
es
0.5 1.0 1.5 2.0 2.5 3.0individual earnings, proportion of average
0
0.1
0.2
0.3
0.4
0.5
prop
ortio
n of
ear
ning
s an
d in
com
e
0.5 1.0 1.5 2.0 2.5 3.0individual pension and earnings, proportion of average earnings
0
0.25
0.50
0.75
1.00
prop
ortio
n of
net
rep
lace
men
t rat
e
0.5 1.0 1.5 2.0 2.5 3.0individual earnings, proportion of average
The Netherlands
Source: OECD pension models.

101
THE PUBLIC PENSION IN NEW ZEALAND IS A FLAT RATE, subject to a residency test.
Qualifying Conditions
Ten years’ residency since the age of 20 (including five years’ after age 50) entitles peopleto the public pension at 65 years of age.
Benefit Calculation
BasicThe pension in 2002 for a single person living alone was NZ$ 288 gross per week, which isapproximately 38 percent of average earnings. The value is a little lower for people shar-ing accommodation. It is NZ$ 437 gross per week for married pensioner couples, equiva-lent to 58 percent of average earnings.
The rates of public pensions are linked by law to average earnings, with the net couplerate being set between 65.0 and 72.5 percent of the net average wage, depending on move-ments in prices. The rates for single people are set at 65.0 percent (living alone) and 60.0percent (sharing) of the couple rate.
Personal Income Tax and Social Security Contributions
New Zealand does not provide any tax concessions specifically for older people. The public pension is subject to personal income tax (in the same manner as any other
personal income). Note that the calculations for the worker tax differ slightly from thosereported in the OECD’s Taxing Wages (OECD 2003). For workers, these include the 1.2percent accident compensation corporation levy, which is not paid by pensioners. Thus,people of working age pay a slightly higher average effective tax rate than do pensioners.
The New Zealand system is funded through general taxation and not specific socialsecurity contributions.
New Zealand

Pension Modeling Results
Individual earnings, multiple of average
Results 0.5 0.75 1 1.5 2 2.5
Gross pension level 37.6 37.6 37.6 37.6 37.6 37.6(% of average earnings)
Net pension level 39.5 39.5 39.5 39.5 39.5 39.5(% of average net earnings)
Gross replacement rate 75.1 50.1 37.6 25.0 18.8 15.0(% of individual earnings)
Net replacement rate 77.1 52.0 39.5 27.9 22.0 18.1(% of individual net earnings)
Gross pension wealth 5.7 5.7 5.7 5.7 5.7 5.7(multiple of average earnings) 6.5 6.5 6.5 6.5 6.5 6.5
Net pension wealth 6.0 6.0 6.0 6.0 6.0 6.0(multiple of average net earnings) 6.9 6.9 6.9 6.9 6.9 6.9
Source: OECD pension models.
Note: Results in italics are for women where the results of women are different from those of men.
102 PENSIONS PANORAMA: RETIREMENT-INCOME SYSTEMS IN 53 COUNTRIES

HIGH-INCOME OECD COUNTRIES 103
a. Gross pension level b. Gross replacement rate
basic basic
c. Gross and net pension levels d. Gross and net replacement rates
net gross net gross
e. Taxes paid by pensioners and workers f. Sources of net replacement rate
worker: total pensioner: total taxes and contributions basic
0
0.5
1.0
1.5
2.0
2.5
gros
s re
lativ
e pe
nsio
n le
vel
0.5 1.0 1.5 2.0 2.5 3.0individual earnings, proportion of average
0
0.25
0.50
0.75
1.00
1.25
gros
s re
plac
emen
t rat
e
0.5 1.0 1.5 2.0 2.5 3.0individual earnings, proportion of average
0
0.5
1.0
1.5
2.0
2.5
net a
nd g
ross
rel
ativ
e pe
nsio
n le
vels
0.5 1.0 1.5 2.0 2.5 3.0individual earnings, proportion of average
0
0.25
0.50
0.75
1.00
1.25
net a
nd g
ross
rep
lace
men
t rat
es
0.5 1.0 1.5 2.0 2.5 3.0individual earnings, proportion of average
0
0.1
0.2
0.3
0.4
0.5
prop
ortio
n of
ear
ning
s an
d in
com
e
0.5 1.0 1.5 2.0 2.5 3.0individual pension and earnings, proportion of average earnings
0
0.25
0.50
0.75
1.00
prop
ortio
n of
net
rep
lace
men
t rat
e
0.5 1.0 1.5 2.0 2.5 3.0individual earnings, proportion of average
New Zealand
Source: OECD pension models.

104
THE PUBLIC PENSION SYSTEM IN NORWAY CONSISTS OF A FLAT-RATE, basic pension and anearnings-related scheme. People with small earnings-related pensions receive an income-tested supplement.
Qualifying Conditions
The normal pension age is 67. Forty years’ insurance is required to receive the full pension,both basic and earnings-related benefits. Both benefits are proportionally reduced forshorter insurance histories. A minimum of three years of contributions is required toreceive an earnings-related pension.
Benefit Calculation
BasicBenefits are determined in relation to a basic amount, G, that was NOK 53,233 (on average)in 2002. The full basic pension for a single pensioner equals the basic amount (approxi-mately 18 percent of average earnings). There is no formal indexation procedure for thevalue of the basic amount or pension. Although past increases were below earningsgrowth, in recent years the government has agreed to increase the basic pension in linewith average earnings. The modeling assumes that this continues.
Earnings-RelatedSince the basic pension replaces the first slice of earnings, the earnings-related schemecovers pay only above the basic amount. The earnings-related scheme has a progressiveformula: the replacement rate falls for higher earnings. Annual earnings between 2.89 and6.00 times the basic amount are replaced at a 42 percent rate. From 6.00 to 12.00 times thebasic amount, the replacement rate is one-third of that level (that is, 14 percent). Given that40 years’ contributions are needed for a full pension, these are equivalent to annual accrualrates of 1.05 and 0.35 percent, respectively. The first threshold, where the accrual ratedeclines, is a little over average earnings (109 percent). The ceiling on earnings eligible forbenefits is therefore a little over double average earnings (219 percent). The calculation ofthe pension uses the best 20 years of earnings. It is specified as a points system.
TargetedThe special supplement is 79.33 percent of the basic amount, giving a total minimum pen-sion for a single pensioner of 1.7933 times the basic amount, NOK 95,463, which is equiva-lent to approximately a third of average earnings.
Norway

Personal Income Tax and Social Security Contributions
The age deduction provided an additional allowance of NOK 18,360 in 2002. There is alsoa separate tax-limitation rule for pensioners. Approximately half the people receivingbenefits or pensions either pay no tax or do so under the limitation rule. The additionalallowance cannot be used along with the tax-limitation rule. As a result of the tax-limitationrule, pensions below NOK 105,325 in 2002 are not subject to income tax or social securitycontributions.
Pension income is liable for social security contribution at a lower rate (3.0 percent) thanemployees’ wage earnings (7.8 percent). The social security contribution is not a part of thetax-limitation rule.
Pension Modeling Results
Individual earnings, multiple of average
Results 0.5 0.75 1 1.5 2 2.5
Gross pension level 32.7 42.1 52.6 69.8 76.8 79.4(% of average earnings)
Net pension level 45.9 56.6 65.1 80.0 86.8 89.3(% of average net earnings)
Gross replacement rate 65.3 56.1 52.6 46.5 38.4 31.8(% of individual earnings)
Net replacement rate 85.5 73.1 65.1 58.2 50.1 42.8(% of individual net earnings)
Gross pension wealth 5.3 6.7 8.2 10.7 11.7 12.1(multiple of average earnings) 6.2 7.7 9.5 12.4 13.5 14.0
Net pension wealth 7.4 9.0 10.1 12.2 13.2 13.6(multiple of average net earnings) 8.7 10.4 11.7 14.2 15.3 15.7
Source: OECD pension models.
Note: Results in italics are for women where the results of women are different from those of men.
HIGH-INCOME OECD COUNTRIES 105

106 PENSIONS PANORAMA: RETIREMENT-INCOME SYSTEMS IN 53 COUNTRIES
a. Gross pension level b. Gross replacement rate
earnings-related basictargeted
earnings-related basictargeted
c. Gross and net pension levels d. Gross and net replacement rates
net gross net gross
e. Taxes paid by pensioners and workers f. Sources of net replacement rate
worker: total worker: income taxpensioner: total pensioner: income tax
taxes and contributions earnings-relatedbasic targeted
0
0.5
1.0
1.5
2.0
2.5
gros
s re
lativ
e pe
nsio
n le
vel
0.5 1.0 1.5 2.0 2.5 3.0individual earnings, proportion of average
0
0.25
0.50
0.75
1.00
1.25
gros
s re
plac
emen
t rat
e
0.5 1.0 1.5 2.0 2.5 3.0individual earnings, proportion of average
0
0.5
1.0
1.5
2.0
2.5
net a
nd g
ross
rel
ativ
e pe
nsio
n le
vels
0.5 1.0 1.5 2.0 2.5 3.0individual earnings, proportion of average
0
0.25
0.50
0.75
1.00
1.25
net a
nd g
ross
rep
lace
men
t rat
es
0.5 1.0 1.5 2.0 2.5 3.0individual earnings, proportion of average
0
0.1
0.2
0.3
0.4
0.5
prop
ortio
n of
ear
ning
s an
d in
com
e
0.5 1.0 1.5 2.0 2.5 3.0individual pension and earnings, proportion of average earnings
0
0.25
0.50
0.75
1.00
prop
ortio
n of
net
rep
lace
men
t rat
e
0.5 1.0 1.5 2.0 2.5 3.0individual earnings, proportion of average
Norway
Source: OECD pension models.
107
PORTUGAL HAS AN EARNINGS-RELATED PUBLIC pension scheme with a means-tested safety net.
Qualifying Conditions
The standard pension age is 65 although early retirement is possible from age 55. A mini-mum of 15 years of contributions is also required for retirement at 65. Early retirement ispossible with 30 years of contributions.
Benefit Calculation
Earnings-RelatedThe pension accrues at 2 percent of the earnings base for each year of contributions for 20or fewer years’ contributions. For beneficiaries with 21 or more years of contributions, theaccrual rate ranges between 2.0 and 2.3 percent, depending on earnings. The schedule forthe accrual rate depends on individual earnings relative to the value of the national mini-mum wage.
Earnings/minimum wage < 1.1 1.1 2.0 4.0 8.0Accrual rate (%) 2.3 2.25 2.2 2.1 2.0
Pension accrues for a maximum of 40 years. The earnings measure is presently the best 10of the final 15 years. However, this base is currently being extended so that it will reachlifetime-average earnings from 2017. Valorization of earnings from the beginning of 2002 isa mix of earnings and prices. The weights are 75 percent price inflation and 25 percentearnings growth, subject to a maximum real increase of 0.5 percent. Pensions in paymentare indexed to prices.
MinimumThere is a minimum pension of €190 (for workers with up to 15 years of contributions).For workers with 15 to 40 years, the amount of the minimum pension varies between 65and 100 percent of the minimum wage, net of employees’ social contributions. For 2002,the minimum pension was between €201 and €310. There are 14 “monthly” payments ayear (including two bonuses).
TargetedFor people who do not qualify for the earnings-related scheme, the social pension was€138 per month in 2002. This is only paid if total income for a single person does notexceed 30 percent of the minimum wage. The social pension is payable from age 65.Although there is no formal indexation procedure for the social pension, increases haveusually been above inflation. The government has a target for the social pension of half the
Portugal
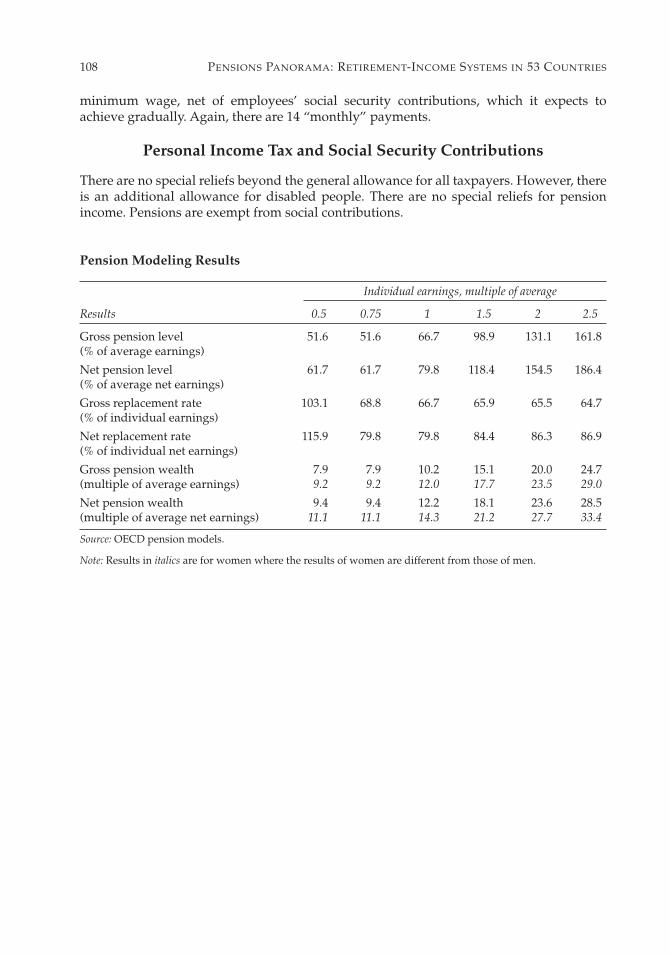
minimum wage, net of employees’ social security contributions, which it expects toachieve gradually. Again, there are 14 “monthly” payments.
Personal Income Tax and Social Security Contributions
There are no special reliefs beyond the general allowance for all taxpayers. However, thereis an additional allowance for disabled people. There are no special reliefs for pensionincome. Pensions are exempt from social contributions.
Pension Modeling Results
Individual earnings, multiple of average
Results 0.5 0.75 1 1.5 2 2.5
Gross pension level 51.6 51.6 66.7 98.9 131.1 161.8(% of average earnings)
Net pension level 61.7 61.7 79.8 118.4 154.5 186.4(% of average net earnings)
Gross replacement rate 103.1 68.8 66.7 65.9 65.5 64.7(% of individual earnings)
Net replacement rate 115.9 79.8 79.8 84.4 86.3 86.9(% of individual net earnings)
Gross pension wealth 7.9 7.9 10.2 15.1 20.0 24.7(multiple of average earnings) 9.2 9.2 12.0 17.7 23.5 29.0
Net pension wealth 9.4 9.4 12.2 18.1 23.6 28.5(multiple of average net earnings) 11.1 11.1 14.3 21.2 27.7 33.4
Source: OECD pension models.
Note: Results in italics are for women where the results of women are different from those of men.
108 PENSIONS PANORAMA: RETIREMENT-INCOME SYSTEMS IN 53 COUNTRIES

HIGH-INCOME OECD COUNTRIES 109
a. Gross pension level b. Gross replacement rate
earnings-related minimum earnings-related minimum
c. Gross and net pension levels d. Gross and net replacement rates
net gross net gross
e. Taxes paid by pensioners and workers f. Sources of net replacement rate
worker: total worker: income taxpensioner: total
taxes and contributions earnings-relatedminimum
0
0.5
1.0
1.5
2.0
2.5
gros
s re
lativ
e pe
nsio
n le
vel
0.5 1.0 1.5 2.0 2.5 3.0individual earnings, proportion of average
0
0.25
0.50
0.75
1.00
1.25
gros
s re
plac
emen
t rat
e
0.5 1.0 1.5 2.0 2.5 3.0individual earnings, proportion of average
0
0.5
1.0
1.5
2.0
2.5
net a
nd g
ross
rel
ativ
e pe
nsio
n le
vels
0.5 1.0 1.5 2.0 2.5 3.0individual earnings, proportion of average
0
0.25
0.50
0.75
1.00
1.25
net a
nd g
ross
rep
lace
men
t rat
es
0.5 1.0 1.5 2.0 2.5 3.0individual earnings, proportion of average
0
0.1
0.2
0.3
0.4
0.5
prop
ortio
n of
ear
ning
s an
d in
com
e
0.5 1.0 1.5 2.0 2.5 3.0individual pension and earnings, proportion of average earnings
0
0.25
0.50
0.75
1.00
prop
ortio
n of
net
rep
lace
men
t rat
e
0.5 1.0 1.5 2.0 2.5 3.0individual earnings, proportion of average
Portugal
Source: OECD pension models.

110
THE SPANISH PUBLIC PENSION SYSTEM CONSISTS OF A SINGLE, earnings-related benefit. Thereis also a means-tested minimum pension, which replaces the previous special social-assis-tance scheme.
Qualifying Conditions
The retirement age for a full benefit is 65 years for men and women. Fifteen years of con-tributions are necessary to qualify for a pension benefit.
Benefit Calculation
Earnings-RelatedThe benefit accrues according to a schedule. After 15 years’ contributions, it is 50 percentof the earnings base. Over the next 10 years, an extra 3 percent is accrued per year, fol-lowed by 2 percent per year thereafter. The maximum accrual is 100 percent, reached after35 years’ contributions.
The earnings base equals pay over the last 15 years that is uprated in line with prices.However, there is no adjustment for price inflation in the last two years before retirement.This means that the replacement rate relative to final salary is less than 100 percent. On thestandard assumptions for earnings growth and price inflation, the replacement rate is cal-culated to be 88 percent. There is a ceiling on earnings for contributions and benefit pur-poses of €30,899, or 191 percent of average earnings.
Benefits are price indexed.
MinimumThere is a minimum pension payable from age 65 amounting to €393 per month. There are14 payments per year.
Personal Income Tax and Social Security Contributions
There are no special rules for the taxation of pensioners. There are no special allowancesfor pension income. Social security contributions are not levied on pension income.
Spain

Pension Modeling Results
Individual earnings, multiple of average
Results 0.5 0.75 1 1.5 2 2.5
Gross pension level 40.6 60.9 81.2 121.8 153.3 153.3(% of average earnings)
Net pension level 49.9 69.9 88.3 126.0 154.1 154.1(% of average net earnings)
Gross replacement rate 81.2 81.2 81.2 81.2 76.7 61.3(% of individual earnings)
Net replacement rate 88.7 89.4 88.3 88.4 83.4 68.8(% of individual net earnings)
Gross pension wealth 6.1 9.1 12.2 18.3 23.0 23.0(multiple of average earnings) 7.1 10.7 14.3 21.4 26.9 26.9
Net pension wealth 7.5 10.5 13.2 18.9 23.1 23.1(multiple of average net earnings) 8.8 12.3 15.5 22.1 27.1 27.1
Source: OECD pension models.
Note: Results in italics are for women where the results of women are different from those of men.
HIGH-INCOME OECD COUNTRIES 111
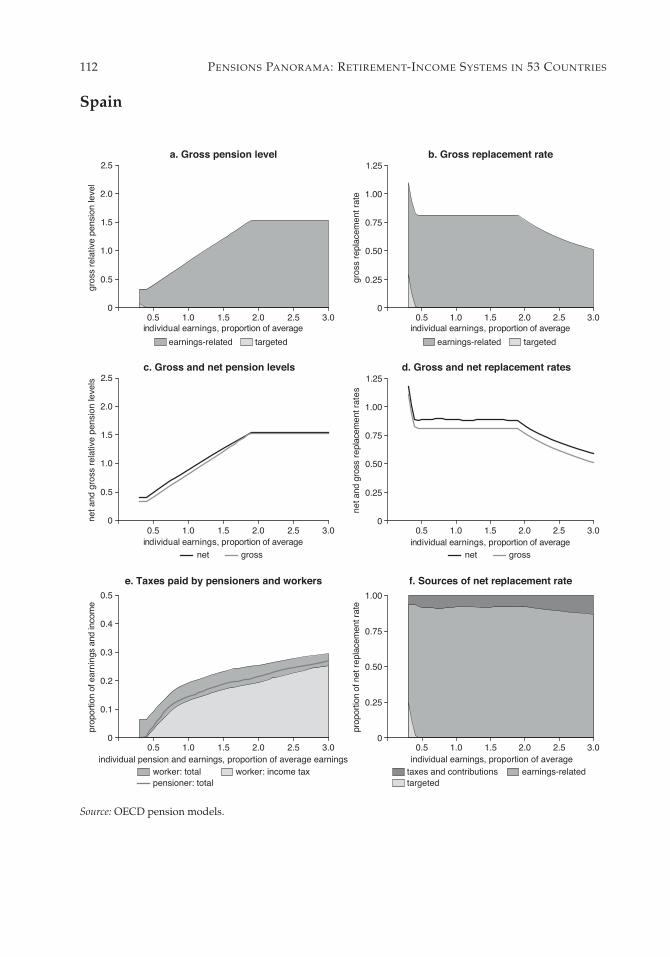
112 PENSIONS PANORAMA: RETIREMENT-INCOME SYSTEMS IN 53 COUNTRIES
a. Gross pension level b. Gross replacement rate
earnings-related targeted earnings-related targeted
c. Gross and net pension levels d. Gross and net replacement rates
net gross net gross
e. Taxes paid by pensioners and workers f. Sources of net replacement rate
worker: total worker: income taxpensioner: total
taxes and contributions earnings-relatedtargeted
0
0.5
1.0
1.5
2.0
2.5
gros
s re
lativ
e pe
nsio
n le
vel
0.5 1.0 1.5 2.0 2.5 3.0individual earnings, proportion of average
0
0.25
0.50
0.75
1.00
1.25
gros
s re
plac
emen
t rat
e
0.5 1.0 1.5 2.0 2.5 3.0individual earnings, proportion of average
0
0.5
1.0
1.5
2.0
2.5
net a
nd g
ross
rel
ativ
e pe
nsio
n le
vels
0.5 1.0 1.5 2.0 2.5 3.0individual earnings, proportion of average
0
0.25
0.50
0.75
1.00
1.25
net a
nd g
ross
rep
lace
men
t rat
es
0.5 1.0 1.5 2.0 2.5 3.0individual earnings, proportion of average
0
0.1
0.2
0.3
0.4
0.5
prop
ortio
n of
ear
ning
s an
d in
com
e
0.5 1.0 1.5 2.0 2.5 3.0individual pension and earnings, proportion of average earnings
0
0.25
0.50
0.75
1.00
prop
ortio
n of
net
rep
lace
men
t rat
e
0.5 1.0 1.5 2.0 2.5 3.0individual earnings, proportion of average
Spain
Source: OECD pension models.
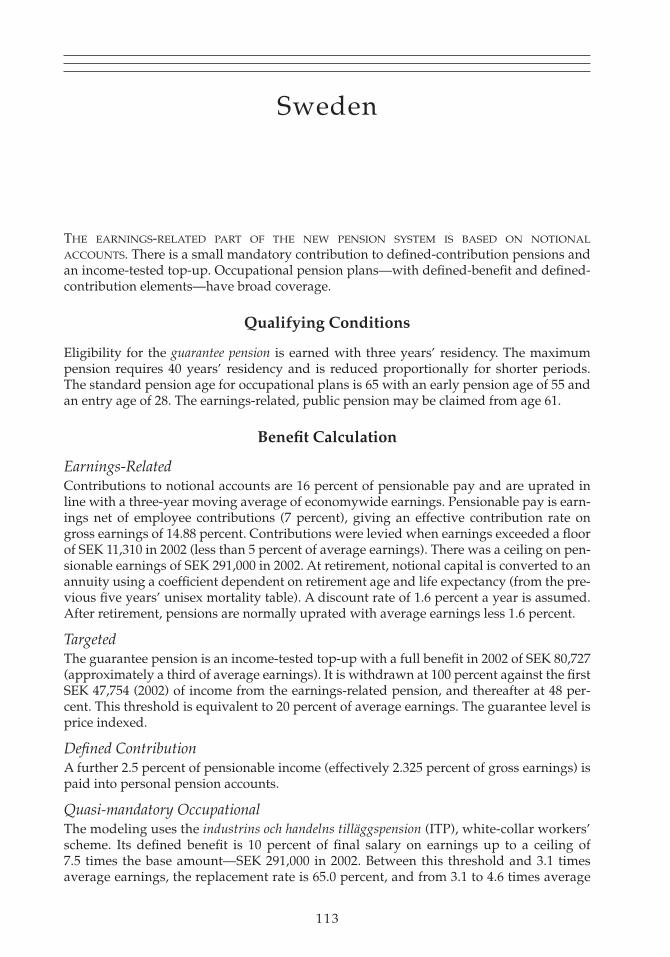
113
THE EARNINGS-RELATED PART OF THE NEW PENSION SYSTEM IS BASED ON NOTIONAL
ACCOUNTS. There is a small mandatory contribution to defined-contribution pensions andan income-tested top-up. Occupational pension plans—with defined-benefit and defined-contribution elements—have broad coverage.
Qualifying Conditions
Eligibility for the guarantee pension is earned with three years’ residency. The maximumpension requires 40 years’ residency and is reduced proportionally for shorter periods.The standard pension age for occupational plans is 65 with an early pension age of 55 andan entry age of 28. The earnings-related, public pension may be claimed from age 61.
Benefit Calculation
Earnings-RelatedContributions to notional accounts are 16 percent of pensionable pay and are uprated inline with a three-year moving average of economywide earnings. Pensionable pay is earn-ings net of employee contributions (7 percent), giving an effective contribution rate ongross earnings of 14.88 percent. Contributions were levied when earnings exceeded a floorof SEK 11,310 in 2002 (less than 5 percent of average earnings). There was a ceiling on pen-sionable earnings of SEK 291,000 in 2002. At retirement, notional capital is converted to anannuity using a coefficient dependent on retirement age and life expectancy (from the pre-vious five years’ unisex mortality table). A discount rate of 1.6 percent a year is assumed.After retirement, pensions are normally uprated with average earnings less 1.6 percent.
TargetedThe guarantee pension is an income-tested top-up with a full benefit in 2002 of SEK 80,727(approximately a third of average earnings). It is withdrawn at 100 percent against the firstSEK 47,754 (2002) of income from the earnings-related pension, and thereafter at 48 per-cent. This threshold is equivalent to 20 percent of average earnings. The guarantee level isprice indexed.
Defined Contribution A further 2.5 percent of pensionable income (effectively 2.325 percent of gross earnings) ispaid into personal pension accounts.
Quasi-mandatory Occupational The modeling uses the industrins och handelns tilläggspension (ITP), white-collar workers’scheme. Its defined benefit is 10 percent of final salary on earnings up to a ceiling of7.5 times the base amount—SEK 291,000 in 2002. Between this threshold and 3.1 timesaverage earnings, the replacement rate is 65.0 percent, and from 3.1 to 4.6 times average
Sweden

earnings, 32.5 percent. A full pension requires 30 years’ contributions. Shorter tenuresdeliver a proportionally reduced benefit. Indexation of pensions in payment is discre-tionary, but recent increases have been broadly in line with prices. The ITP also has adefined-contribution component, with a contribution of 2 percent of gross earnings.
Personal Income Tax and Social Security Contributions
Tax concessions for pensioners were abolished in 2003 as part of the policy package thatincluded the introduction of the guarantee pension. There are no allowances for pensionincome. Social security contributions are not levied on pension income.
Pension Modeling Results
Individual earnings, multiple of average
Results 0.5 0.75 1 1.5 2 2.5
Gross pension level 43.9 54.4 64.8 96.9 132.4 167.8(% of average earnings)
Net pension level 48.1 58.4 68.2 98.7 129.9 155.1(% of average net earnings)
Gross replacement rate 87.8 72.5 64.8 64.6 66.2 67.1(% of individual earnings)
Net replacement rate 90.2 76.4 68.2 70.1 74.3 75.0(% of individual net earnings)
Gross pension wealth 7.0 8.7 10.4 15.5 21.0 26.6(multiple of average earnings) 7.8 9.6 11.4 16.7 23.0 29.3
Net pension wealth 7.7 9.3 10.9 15.8 20.6 24.5(multiple of average net earnings) 8.6 10.4 12.1 17.0 22.8 27.3
Source: OECD pension models.
Note: Results in italics are for women where the results of women are different from those of men.
114 PENSIONS PANORAMA: RETIREMENT-INCOME SYSTEMS IN 53 COUNTRIES

HIGH-INCOME OECD COUNTRIES 115
a. Gross pension level b. Gross replacement rate
DC (OP) occupational DCearnings-related targeted
DC (OP) occupational DCearnings-related targeted
c. Gross and net pension levels d. Gross and net replacement rates
net gross net gross
e. Taxes paid by pensioners and workers f. Sources of net replacement rate
worker: total worker: income taxpensioner: total
taxes and contributions DC (OP) occupationalDC earnings-related targeted
0
0.5
1.0
1.5
2.0
2.5
gros
s re
lativ
e pe
nsio
n le
vel
0.5 1.0 1.5 2.0 2.5 3.0individual earnings, proportion of average
0
0.25
0.50
0.75
1.00
1.25
gros
s re
plac
emen
t rat
e
0.5 1.0 1.5 2.0 2.5 3.0individual earnings, proportion of average
0
0.5
1.0
1.5
2.0
2.5
net a
nd g
ross
rel
ativ
e pe
nsio
n le
vels
0.5 1.0 1.5 2.0 2.5 3.0individual earnings, proportion of average
0
0.25
0.50
0.75
1.00
1.25
net a
nd g
ross
rep
lace
men
t rat
es
0.5 1.0 1.5 2.0 2.5 3.0individual earnings, proportion of average
0
0.1
0.2
0.3
0.4
0.5
prop
ortio
n of
ear
ning
s an
d in
com
e
0.5 1.0 1.5 2.0 2.5 3.0individual pension and earnings, proportion of average earnings
0
0.25
0.50
0.75
1.00
prop
ortio
n of
net
rep
lace
men
t rat
e
0.5 1.0 1.5 2.0 2.5 3.0individual earnings, proportion of average
Sweden
Source: OECD pension models.
Note: OP = occupational plan.
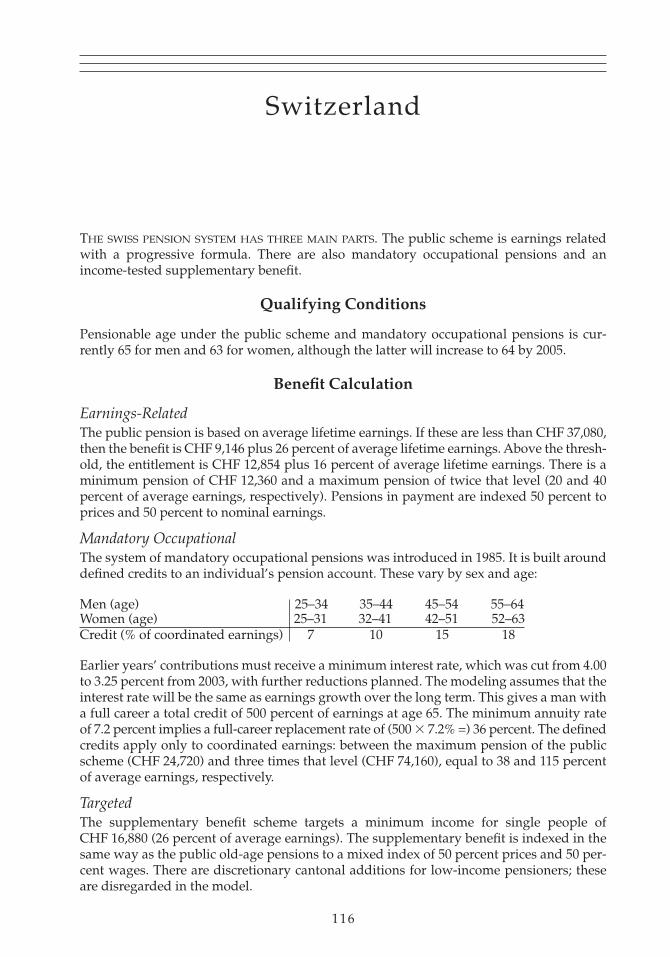
116
THE SWISS PENSION SYSTEM HAS THREE MAIN PARTS. The public scheme is earnings relatedwith a progressive formula. There are also mandatory occupational pensions and anincome-tested supplementary benefit.
Qualifying Conditions
Pensionable age under the public scheme and mandatory occupational pensions is cur-rently 65 for men and 63 for women, although the latter will increase to 64 by 2005.
Benefit Calculation
Earnings-RelatedThe public pension is based on average lifetime earnings. If these are less than CHF 37,080,then the benefit is CHF 9,146 plus 26 percent of average lifetime earnings. Above the thresh-old, the entitlement is CHF 12,854 plus 16 percent of average lifetime earnings. There is aminimum pension of CHF 12,360 and a maximum pension of twice that level (20 and 40percent of average earnings, respectively). Pensions in payment are indexed 50 percent toprices and 50 percent to nominal earnings.
Mandatory Occupational The system of mandatory occupational pensions was introduced in 1985. It is built arounddefined credits to an individual’s pension account. These vary by sex and age:
Men (age) 25–34 35–44 45–54 55–64Women (age) 25–31 32–41 42–51 52–63Credit (% of coordinated earnings) 7 10 15 18
Earlier years’ contributions must receive a minimum interest rate, which was cut from 4.00to 3.25 percent from 2003, with further reductions planned. The modeling assumes that theinterest rate will be the same as earnings growth over the long term. This gives a man witha full career a total credit of 500 percent of earnings at age 65. The minimum annuity rateof 7.2 percent implies a full-career replacement rate of (500 � 7.2% =) 36 percent. The definedcredits apply only to coordinated earnings: between the maximum pension of the publicscheme (CHF 24,720) and three times that level (CHF 74,160), equal to 38 and 115 percentof average earnings, respectively.
TargetedThe supplementary benefit scheme targets a minimum income for single people of CHF 16,880 (26 percent of average earnings). The supplementary benefit is indexed in thesame way as the public old-age pensions to a mixed index of 50 percent prices and 50 per-cent wages. There are discretionary cantonal additions for low-income pensioners; theseare disregarded in the model.
Switzerland

Personal Income Tax and Social Security Contributions
Swiss cantons often grant pensioners an additional allowance, but there is no extraallowance in the federal income tax. The modeling assumes a resident of the city of Zurichin the canton of Zurich. There are no special allowances for pension income. Social secu-rity contributions are not levied on pension income.
Pension Modeling Results
Individual earnings, multiple of average
Results 0.5 0.75 1 1.5 2 2.5
Gross pension level 31.4 45.2 58.2 66.3 66.3 66.3(% of average earnings) 31.5 45.6 58.8 67.1 67.1 67.1
Net pension level 37.8 53.1 67.3 75.7 75.7 75.7(% of average net earnings) 38.0 53.6 68.0 76.6 76.6 76.6
Gross replacement rate 62.8 60.2 58.2 44.2 33.1 26.5(% of individual earnings) 63.0 60.7 58.8 44.7 33.5 26.8
Net replacement rate 71.4 68.9 67.3 53.0 41.4 34.3(% of individual net earnings) 71.6 69.5 68.0 53.6 41.8 34.7
Gross pension wealth 5.5 7.9 10.1 11.5 11.5 11.5(multiple of average earnings) 6.7 9.7 12.5 14.2 14.2 14.2
Net pension wealth 6.6 9.3 11.7 13.2 13.2 13.2(multiple of average net earnings) 8.1 11.4 14.4 16.3 16.3 16.3
Source: OECD pension models.
Note: Results in italics are for women where the results of women are different from those of men.
HIGH-INCOME OECD COUNTRIES 117

118 PENSIONS PANORAMA: RETIREMENT-INCOME SYSTEMS IN 53 COUNTRIES
a. Gross pension level b. Gross replacement rate
occupational earnings-relatedtargeted
occupational earnings-relatedtargeted
c. Gross and net pension levels d. Gross and net replacement rates
net gross net gross
e. Taxes paid by pensioners and workers f. Sources of net replacement rate
worker: total worker: income taxpensioner: total
taxes and contributions occupationalearnings-related targeted
0
0.5
1.0
1.5
2.0
2.5
gros
s re
lativ
e pe
nsio
n le
vel
0.5 1.0 1.5 2.0 2.5 3.0individual earnings, proportion of average
0
0.25
0.50
0.75
1.00
1.25
gros
s re
plac
emen
t rat
e
0.5 1.0 1.5 2.0 2.5 3.0individual earnings, proportion of average
0
0.5
1.0
1.5
2.0
2.5
net a
nd g
ross
rel
ativ
e pe
nsio
n le
vels
0.5 1.0 1.5 2.0 2.5 3.0individual earnings, proportion of average
0
0.25
0.50
0.75
1.00
1.25
net a
nd g
ross
rep
lace
men
t rat
es
0.5 1.0 1.5 2.0 2.5 3.0individual earnings, proportion of average
0
0.1
0.2
0.3
0.4
0.5
prop
ortio
n of
ear
ning
s an
d in
com
e
0.5 1.0 1.5 2.0 2.5 3.0individual pension and earnings, proportion of average earnings
0
0.25
0.50
0.75
1.00
prop
ortio
n of
net
rep
lace
men
t rat
e
0.5 1.0 1.5 2.0 2.5 3.0individual earnings, proportion of average
Switzerland
Source: OECD pension models.

119
THE U.K. PUBLIC SCHEME HAS TWO TIERS, a flat-rate basic pension and an earnings-relatedadditional pension, which are complemented by a large voluntary private pension sector.A new income-related benefit (pension credit) has recently been introduced to target extraspending on the poorest pensioners.
Qualifying Conditions
Pension age, currently 65 for men and 60 for women, will be equalized at 65 from 2010.The eligibility age for the minimum income guarantee (Mig) or pension credit is 60, andwill increase in line with women’s pension age. The new savings credit is available onlyfrom age 65 for both men and women. To qualify for the basic state pension, people needto pay social security contributions or have credits for approximately nine-tenths of theirpotential working lives (44 years). A proportionally reduced pension is available for peo-ple who do not meet the full condition, but only to a minimum of 25 percent (11 years).
Benefit Calculation
BasicThe full basic state pension for a single person was £3,896 for the calendar year 2002.
Earnings-RelatedThe state second pension (S2P) has a progressive schedule. For earnings between thelower-earnings limit (£3,910 per year in 2002/03) and the first threshold (£10,800), thereplacement rate is 40 percent of the difference, regardless of earnings. Over the nextrange, the replacement rate is 10 percent, ending at £24,650. Between this threshold andthe ceiling, the replacement rate is 20 percent. The ceiling was £30,505 in 2002/03. The ben-efit value is calculated on average lifetime salary, with earlier years’ pay uprated withaverage economywide earnings. The benefit is then price indexed after retirement.
TargetedThe minimum income guarantee is, from 2003/04, converted into a pension credit. For con-sistency, the pension credit has been modeled using 2002 calendar year parameters. The tar-get annual income level was £5,041. The pension credit includes a new savings credit on topof the guarantee credit that replaces Mig. This reduces the withdrawal of benefits from 100percent under the Mig to 40 percent. Individuals whose income (apart from the pensioncredit) is less than the target minimum but more than a “starting point” receive a top-up.The starting point is equal to the full value of the basic pension. The top-up is 60 percent ofincome above the starting point. For people with incomes above the target minimumincome, the benefit is reduced by 40 percent of the amount of the excess. The maximumcredit for 2004/05 is therefore (£105 � £80) � 60 percent = £15 per week.
The United Kingdom
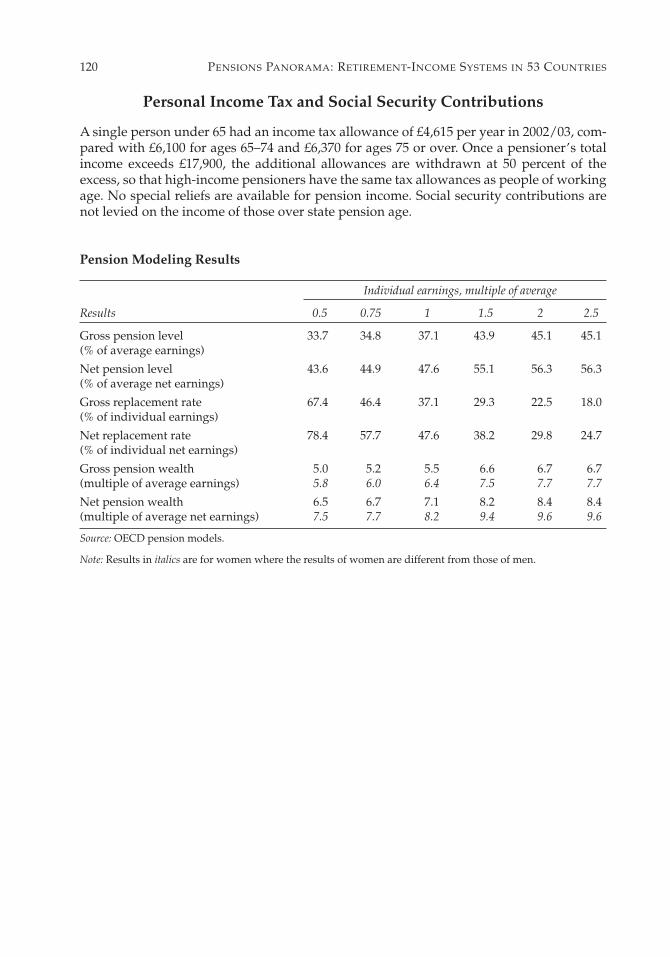
Personal Income Tax and Social Security Contributions
A single person under 65 had an income tax allowance of £4,615 per year in 2002/03, com-pared with £6,100 for ages 65–74 and £6,370 for ages 75 or over. Once a pensioner’s totalincome exceeds £17,900, the additional allowances are withdrawn at 50 percent of theexcess, so that high-income pensioners have the same tax allowances as people of workingage. No special reliefs are available for pension income. Social security contributions arenot levied on the income of those over state pension age.
Pension Modeling Results
Individual earnings, multiple of average
Results 0.5 0.75 1 1.5 2 2.5
Gross pension level 33.7 34.8 37.1 43.9 45.1 45.1(% of average earnings)
Net pension level 43.6 44.9 47.6 55.1 56.3 56.3(% of average net earnings)
Gross replacement rate 67.4 46.4 37.1 29.3 22.5 18.0(% of individual earnings)
Net replacement rate 78.4 57.7 47.6 38.2 29.8 24.7(% of individual net earnings)
Gross pension wealth 5.0 5.2 5.5 6.6 6.7 6.7(multiple of average earnings) 5.8 6.0 6.4 7.5 7.7 7.7
Net pension wealth 6.5 6.7 7.1 8.2 8.4 8.4(multiple of average net earnings) 7.5 7.7 8.2 9.4 9.6 9.6
Source: OECD pension models.
Note: Results in italics are for women where the results of women are different from those of men.
120 PENSIONS PANORAMA: RETIREMENT-INCOME SYSTEMS IN 53 COUNTRIES

HIGH-INCOME OECD COUNTRIES 121
a. Gross pension level b. Gross replacement rate
earnings-related minimumbasic credit
earnings-related minimumbasic credit
c. Gross and net pension levels d. Gross and net replacement rates
net gross net gross
e. Taxes paid by pensioners and workers f. Sources of net replacement rate
worker: total worker: income taxpensioner: total
taxes and contributions earnings-relatedminimum basic credit
0
0.5
1.0
1.5
2.0
2.5
gros
s re
lativ
e pe
nsio
n le
vel
0.5 1.0 1.5 2.0 2.5 3.0individual earnings, proportion of average
0
0.25
0.50
0.75
1.00
1.25
gros
s re
plac
emen
t rat
e
0.5 1.0 1.5 2.0 2.5 3.0individual earnings, proportion of average
0
0.5
1.0
1.5
2.0
2.5
net a
nd g
ross
rel
ativ
e pe
nsio
n le
vels
0.5 1.0 1.5 2.0 2.5 3.0individual earnings, proportion of average
0
0.25
0.50
0.75
1.00
1.25
net a
nd g
ross
rep
lace
men
t rat
es
0.5 1.0 1.5 2.0 2.5 3.0individual earnings, proportion of average
0
0.1
0.2
0.3
0.4
0.5
prop
ortio
n of
ear
ning
s an
d in
com
e
0.5 1.0 1.5 2.0 2.5 3.0individual pension and earnings, proportion of average earnings
0
0.25
0.50
0.75
1.00
prop
ortio
n of
net
rep
lace
men
t rat
e
0.5 1.0 1.5 2.0 2.5 3.0individual earnings, proportion of average
The United Kingdom
Source: OECD pension models.

122
THE PUBLICLY PROVIDED PENSION BENEFIT IN THE UNITED STATES, known as social security,has a progressive benefit formula. There is also a means-tested top-up payment availablefor low-income pensioners.
Qualifying Conditions
The current normal retirement age is between 65 and 66, increasing to 67 in steps. Eligibilitydepends on the number of years of contributions, with a minimum requirement of 10 years.Early retirement is possible from age 62 with lower benefits.
Benefit Calculation
Earnings-RelatedThe benefit formula is progressive. The first US$ 592 a month of relevant earnings attractsa 90 percent replacement rate. Earnings between US$ 592 and US$ 3,567 a month (22 and133 percent of average earnings, respectively) are replaced at 32 percent. A replacementrate of 15 percent applies between the latter threshold and the ceiling. Earlier years’ earn-ings are revalued to age 60 with growth in average earnings. There is no adjustmentbetween ages 60 and 62. Thereafter, previous earnings are revalued with prices to age 67.The benefit is based on the 35 highest years’ earnings. The ceiling for contributions andbenefits is US$ 84,900 a year—2.5 times average earnings—uprated annually in line withearnings growth. Pensions in payment are price indexed.
TargetedSingle people over the age of 65 are eligible for up to US$ 6,540 a year of supplementalsecurity income (approximately 20 percent of average earnings), depending on assets andother income. This benefit is indexed to prices. There is a small (US$ 20 a month)disregard. The benefit is then withdrawn at a 100 percent rate against income above thislevel. States often supplement the federally determined minimum: 28 administer theirown system and 12 offer supplements operated by the federal administration. The averageadditional payment in these 12 states is 13 percent for single pensioners and 18 percent for couples.
Personal Income Tax and Social Security Contributions
Older people are entitled to an additional deduction in the federal income tax. For singlepeople of working age, the deduction is US$ 4,700 compared with US$ 5,850 for over 65s.There is also a tax credit for poorer pensioners. The maximum credit is US$ 1,125 for a singleindividual. This is withdrawn against income and is exhausted once total income exceedsUS$ 17,500, or nontaxable public pension benefits exceed US$ 5,000. Up to one-half of
The United States

social security (public pension) benefits is taxable if income, including one-half of thepension, exceeds US$ 25,000. This proportion can increase to a maximum of 85 percent forhigher-income pensioners if half of social security benefits plus other income exceeds US$ 34,000. Social security contributions are not levied on pension income.
Following the OECD standard methodology, the modeling looks at a person living inDetroit, Michigan. The state income tax system for Michigan gives an extra tax-freeallowance of US$ 900 for single people over age 65. Public pensions are entirely exemptfrom the Michigan state income tax, as is the first US$ 33,810 of income from a privatepension. All income from pensions (public and private) is exempt from the Detroitincome tax.
No social security contributions are levied on pension income.
Pension Modeling Results
Individual earnings, multiple of average
Results 0.5 0.75 1 1.5 2 2.5
Gross pension level 24.8 31.7 38.6 49.8 56.3 62.7(% of average earnings)
Net pension level 32.7 41.9 51.0 63.0 69.8 77.1(% of average net earnings)
Gross replacement rate 49.6 42.3 38.6 33.2 28.1 25.1(% of individual earnings)
Net replacement rate 61.4 54.6 51.0 44.9 39.0 35.5(% of individual net earnings)
Gross pension wealth 3.5 4.5 5.5 7.1 8.0 8.9(multiple of average earnings) 4.1 5.3 6.4 8.3 9.3 10.4
Net pension wealth 4.7 6.0 7.3 9.0 9.9 11.0
Source: OECD pension models.
Note: Results in italics are for women where the results of women are different from those of men.
HIGH-INCOME OECD COUNTRIES 123
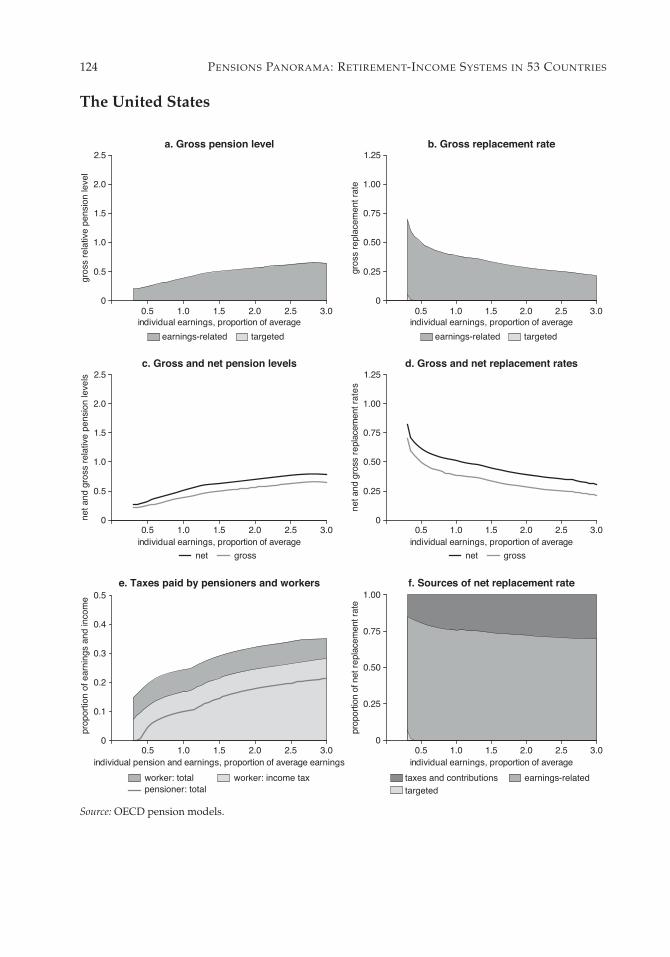
124 PENSIONS PANORAMA: RETIREMENT-INCOME SYSTEMS IN 53 COUNTRIES
a. Gross pension level b. Gross replacement rate
earnings-related targeted earnings-related targeted
c. Gross and net pension levels d. Gross and net replacement rates
net gross net gross
e. Taxes paid by pensioners and workers f. Sources of net replacement rate
worker: total worker: income taxpensioner: total
taxes and contributions earnings-relatedtargeted
0
0.5
1.0
1.5
2.0
2.5
gros
s re
lativ
e pe
nsio
n le
vel
0.5 1.0 1.5 2.0 2.5 3.0individual earnings, proportion of average
0
0.25
0.50
0.75
1.00
1.25
gros
s re
plac
emen
t rat
e
0.5 1.0 1.5 2.0 2.5 3.0individual earnings, proportion of average
0
0.5
1.0
1.5
2.0
2.5
net a
nd g
ross
rel
ativ
e pe
nsio
n le
vels
0.5 1.0 1.5 2.0 2.5 3.0individual earnings, proportion of average
0
0.25
0.50
0.75
1.00
1.25
net a
nd g
ross
rep
lace
men
t rat
es
0.5 1.0 1.5 2.0 2.5 3.0individual earnings, proportion of average
0
0.1
0.2
0.3
0.4
0.5
prop
ortio
n of
ear
ning
s an
d in
com
e
0.5 1.0 1.5 2.0 2.5 3.0individual pension and earnings, proportion of average earnings
0
0.25
0.50
0.75
1.00
prop
ortio
n of
net
rep
lace
men
t rat
e
0.5 1.0 1.5 2.0 2.5 3.0individual earnings, proportion of average
The United States
Source: OECD pension models.

125
11. Eastern Europe and Central Asia


THE NEW BULGARIAN SYSTEM COMBINES AN EARNINGS-RELATED public scheme with manda-tory contributions to individual accounts.
Qualifying Conditions
The pension age is currently being increased gradually and will reach 63 for men and 60for women from 2009. A pension also requires qualification points, which are the sum ofage and years of service. These need to be 100 for men and 90 for women, which is equiv-alent to 37 years’ coverage for men and 30 for women.
Benefit Calculation
Earnings-RelatedThe earnings-related scheme pays 1 percent of earnings for each year of service. There is amaximum benefit of four times the social pension.
MinimumThe minimum pension is 115 percent of the social pension. The social pension is Lev 44 permonth.
Defined ContributionSome 2 percent of earnings are diverted to the individual account. Accumulated capital isconverted to an income stream by the pension fund, and no annuity is bought. The actuarialcalculations are set by the state insurance supervisory agency. For comparison with othercountries, the modeling assumes that this calculation is actuarially fair, based on the stan-dard discount rate and price uprating of the benefit.
Personal Income Tax and Social Security Contributions
Employer and employee contributions to the mandatory pension system are deductibleunder the personal income tax. Investment returns are not taxed (although this provisionmight be subject to amendment). Benefit payments from both the pay-as-you-go andmandatory private pension funds are not taxed. The only exception is payments of capitalto dependents of deceased members, which are subject to inheritance tax. The tax schedulefollows:
Band lower limit (Lev) 0 1,320 1,680 4,800 12,000Rate (%) 0 18 24 28 29
Total social security contributions are 22.25 percent for employees and 8.75 percent foremployers. Of the total, 0.5 percentage points of employee and 1.5 percentage points of
127
Bulgaria

128 PENSIONS PANORAMA: RETIREMENT-INCOME SYSTEMS IN 53 COUNTRIES
employer contributions are diverted to the funded account. There is a ceiling on contribu-tions of Lev 1,000 per month. Pensioners do not pay social security contributions.
Pension Modeling Results
Individual earnings, multiple of average
Results 0.5 0.75 1 1.5 2 2.5
Gross pension level 24.8 37.2 49.7 74.5 80.0 83.9(% of average earnings) 22.6 34.0 45.3 67.9 77.3 80.5
Net pension level 38.9 58.3 75.2 104.9 111.5 116.0(% of average net earnings) 35.5 53.2 69.6 97.1 108.2 112.0
Gross replacement rate 49.7 49.7 49.7 49.7 40.0 33.5(% of individual earnings) 45.3 45.3 45.3 45.3 38.7 32.2
Net replacement rate 67.1 73.8 75.2 74.0 61.8 52.9(% of individual net earnings) 61.2 67.3 69.6 68.5 60.0 51.1
Gross pension wealth 3.5 5.2 6.9 10.4 11.2 11.7(multiple of average earnings) 4.2 6.3 8.4 12.6 14.3 14.9
Net pension wealth 5.4 8.1 10.5 14.6 15.5 16.2(multiple of average net earnings) 6.6 9.9 12.9 18.0 20.0 20.7
Source: Axia Economics APEX model.
Note: Results in italics are for women where the results of women are different from those of men.

EASTERN EUROPE AND CENTRAL ASIA 129
a. Gross pension level b. Gross replacement rate
DC earnings-relatedminimum
DC earnings-relatedminimum
c. Gross and net pension levels d. Gross and net replacement rates
net gross net gross
e. Taxes paid by pensioners and workers f. Sources of net replacement rate
worker: total worker: income taxpensioner: total
taxes and contributions DCearnings-related minimum
0
0.5
1.0
1.5
2.0
2.5
gros
s re
lativ
e pe
nsio
n le
vel
0.5 1.0 1.5 2.0 2.5 3.0individual earnings, proportion of average
0
0.25
0.50
0.75
1.00
1.25
gros
s re
plac
emen
t rat
e
0.5 1.0 1.5 2.0 2.5 3.0individual earnings, proportion of average
0
0.5
1.0
1.5
2.0
2.5
net a
nd g
ross
rel
ativ
e pe
nsio
n le
vels
0.5 1.0 1.5 2.0 2.5 3.0individual earnings, proportion of average
0
0.25
0.50
0.75
1.00
1.25
net a
nd g
ross
rep
lace
men
t rat
es
0.5 1.0 1.5 2.0 2.5 3.0individual earnings, proportion of average
0
0.1
0.2
0.3
0.4
0.5
prop
ortio
n of
ear
ning
s an
d in
com
e
0.5 1.0 1.5 2.0 2.5 3.0individual pension and earnings, proportion of average earnings
0
0.25
0.50
0.75
1.00
prop
ortio
n of
net
rep
lace
men
t rat
e
0.5 1.0 1.5 2.0 2.5 3.0individual earnings, proportion of average
Bulgaria
Source: Axia Economics APEX model.

130
A NEW SYSTEM COMBINING PUBLIC AND MANDATORY PRIVATE PENSIONS was introduced inCroatia in 2002. This is mandatory for workers aged 40 years and younger, and optionalfor those between 40 and 50 years. The public scheme is a points system but has a redis-tributive formula.
Qualifying Conditions
An increase in pension age has been legislated, and this will reach 65 for men and 60 forwomen in 2009. Fifteen years’ service is required to receive any pension benefit. Earlyretirement is possible five years early, conditional on 35 years’ service (men) and 30 years’(women).
Benefit Calculation
Earnings-RelatedThe averaging period for earnings in the pension formula will increase gradually from the 10consecutive best years to full career, reaching the latter in 2008. The points system impliesthat the pension is 0.25 percent of individual earnings divided by average covered earningsplus 0.25 percent of average covered earnings for each year of service (which are shown asearnings—related and basic, respectively—in the figures). There is no ceiling on pensionableearnings and no minimum pension under the new system. The average covered earnings inthe formula are those for 1998, uprated 50 percent in line with economywide average earn-ings and 50 percent in line with prices. Average earnings in 1998 were HRK 4,141. Pensionsin payment also follow the mixed 50–50 indexation to earnings and prices.
Defined ContributionSome 5 percent of social security contributions are diverted to funded pensions for peoplecovered by the new system. The accumulated balance is converted to a price-indexed lifeannuity at retirement.
Personal Income Tax and Social Security Contributions
The income tax allowance for workers is HRK 1,500 per month. The bands of the taxschedule are multiples of this deductible amount, giving the following on an annual basis:
Band lower limit HRK (000s) 18 36 90Rate (%) 15 25 35
The tax allowance for pensioners is 1.7 times that for workers (that is, HRK 2,550 per month).The total social security contribution rate is 19.50 percent: 10.75 percent for employees
and 8.75 percent for employers. Pensioners do not pay social security contributions.
Croatia

Pension Modeling Results
Individual earnings, multiple of average
Results 0.5 0.75 1 1.5 2 2.5
Gross pension level 32.5 36.3 40.0 47.5 52.4 54.7
Gross pension level 23.6 31.0 38.4 53.1 67.8 82.6(% of average earnings) 19.6 25.3 31.1 42.5 54.0 65.5
Net pension level 37.9 49.8 61.6 83.9 104.0 123.0(% of average net earnings) 31.4 40.6 49.9 68.3 85.2 100.9
Gross replacement rate 47.3 41.3 38.4 35.4 33.9 33.0(% of individual earnings) 39.1 33.7 31.1 28.4 27.0 26.2
Net replacement rate 66.7 63.1 61.6 59.7 59.6 58.9(% of individual net earnings) 55.2 51.5 49.9 48.6 48.8 48.3
Gross pension wealth 3.4 4.5 5.5 7.6 9.7 11.8(multiple of average earnings) 4.1 5.3 6.5 8.8 11.2 13.5
Net pension wealth 5.5 7.2 8.9 12.0 14.9 17.5(multiple of average net earnings) 6.6 8.5 10.4 14.2 17.6 20.9
Source: Axia Economics APEX model.
Note: Results in italics are for women where the results of women are different from those of men.
EASTERN EUROPE AND CENTRAL ASIA 131

132 PENSIONS PANORAMA: RETIREMENT-INCOME SYSTEMS IN 53 COUNTRIES
a. Gross pension level b. Gross replacement rate
DC earnings-relatedbasic
DC earnings-relatedbasic
c. Gross and net pension levels d. Gross and net replacement rates
net gross net gross
e. Taxes paid by pensioners and workers f. Sources of net replacement rate
worker: total worker: income taxpensioner: total
taxes and contributions DCearnings-related basic
0
0.5
1.0
1.5
2.0
2.5
gros
s re
lativ
e pe
nsio
n le
vel
0.5 1.0 1.5 2.0 2.5 3.0individual earnings, proportion of average
0
0.25
0.50
0.75
1.00
1.25
gros
s re
plac
emen
t rat
e
0.5 1.0 1.5 2.0 2.5 3.0individual earnings, proportion of average
0
0.5
1.0
1.5
2.0
2.5
net a
nd g
ross
rel
ativ
e pe
nsio
n le
vels
0.5 1.0 1.5 2.0 2.5 3.0individual earnings, proportion of average
0
0.25
0.50
0.75
1.00
1.25
net a
nd g
ross
rep
lace
men
t rat
es
0.5 1.0 1.5 2.0 2.5 3.0individual earnings, proportion of average
0
0.1
0.2
0.3
0.4
0.5
prop
ortio
n of
ear
ning
s an
d in
com
e
0.5 1.0 1.5 2.0 2.5 3.0individual pension and earnings, proportion of average earnings
0
0.25
0.50
0.75
1.00
prop
ortio
n of
net
rep
lace
men
t rat
e
0.5 1.0 1.5 2.0 2.5 3.0individual earnings, proportion of average
Croatia
Source: Axia Economics APEX model.

133
THE CZECH PUBLIC SCHEME HAS A BASIC ELEMENT AND AN EARNINGS-RELATED part calculatedaccording to a progressive formula. There is also a minimum pension in this program.
Qualifying Conditions
A phased increase in the standard retirement age will make it 63 for men from 2013. Thepension eligibility age will be 59 to 63 for women, depending on the number of childrenthey have. A full pension requires 25 years’ coverage, but people with 15 years’ contribu-tions may receive a pension from age 65.
Benefit Calculation
BasicThe value of the basic pension is CZK 1,310 per month. There is no statutory indexationrequirement for the value of the basic benefit alone, but total pensions in payment must beincreased at least by prices plus one-third of real wage growth.
Earnings-RelatedThe earnings-related pension gives 1.5 percent of earnings for each year of contributions.Currently the earnings measure takes an average across all years since 1985, but it willgradually reach 30 years. There is a progressive formula with the first CZK 7,100 permonth replaced at 100 percent; the slice of earnings between this limit and CZK 16,800, at30 percent; and above this level, at 10 percent. The first threshold, below which there is100 percent replacement, is equivalent to just over 40 percent of average earnings, whilethe second threshold is just below average earnings. There is no statutory indexationrequirement for these thresholds. Earlier years’ earnings in the benefit formula are val-orized fully to average earnings.
There is no specific statutory indexation requirement for the earnings-related pensioncomponent in payment. However, the combined total pension benefit (flat-rate andearnings-related components) is adjusted at least to price inflation, with additional, realincreases of at least one-third of real wage growth.
MinimumThe total value of the minimum pension benefit is CZK 2,080, which is made up of a min-imum earnings-related pension of CZK 770 plus the basic component of CZK 1,310. Thiscombined minimum pension is indexed as described above.
Social AssistanceOlder people are covered by the general social-assistance scheme and related benefits inkind. The target safety-net income for a single-person household is CZK 1,780.
The Czech Republic

Personal Income Tax and Social Security Contributions
Old-age pensions are not taxed up to a value of CZK 144,000. The standard tax-freeallowance is CZK 38,400, giving pensioners an effective allowance four times higher thanworkers have. There are no special income tax reliefs for pension income. Recipients ofold-age pensions do not pay social security contributions.
Pension Modeling Results
Individual earnings, multiple of average
Results 0.5 0.75 1 1.5 2 2.5
Gross pension level 35.3 40.0 44.4 47.6 50.7 53.9(% of average earnings)
Net pension level 46.2 52.4 58.2 62.3 66.4 70.6(% of average net earnings)
Gross replacement rate 70.5 53.3 44.4 31.7 25.4 21.6(% of individual earnings)
Net replacement rate 88.3 68.3 58.2 42.9 35.3 31.0(% of individual net earnings)
Gross pension wealth 5.8 6.6 7.3 7.8 8.3 8.9(multiple of average earnings) 6.8 7.7 8.6 9.2 9.8 10.4
Net pension wealth 7.6 8.6 9.6 10.2 10.9 11.6(multiple of average net earnings) 8.9 10.1 11.3 12.1 12.9 13.7
Source: OECD pension models.
Note: Results in italics are for women where the results of women are different from those of men.
134 PENSIONS PANORAMA: RETIREMENT-INCOME SYSTEMS IN 53 COUNTRIES
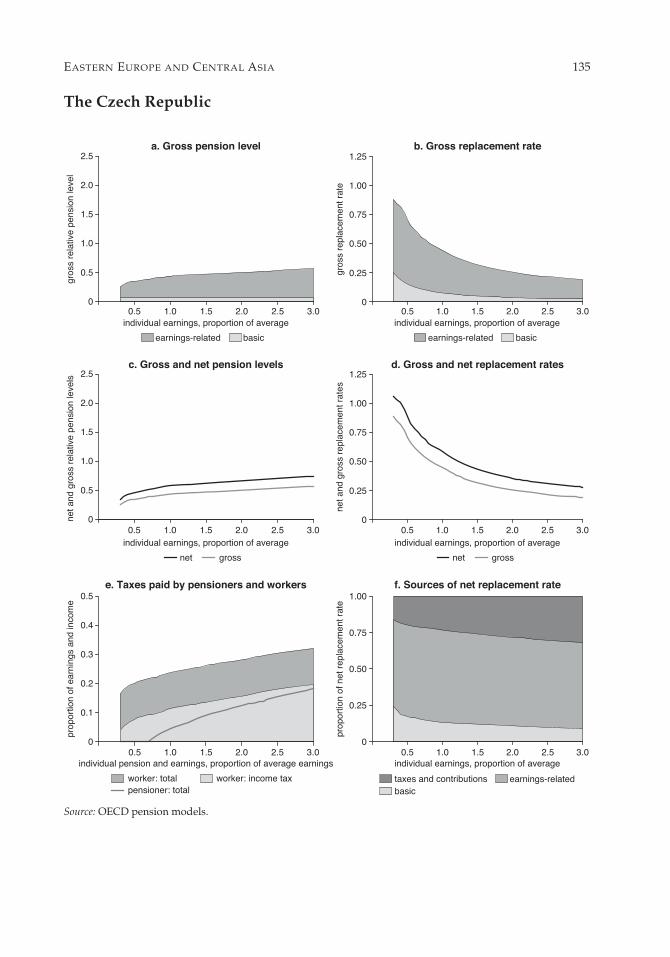
EASTERN EUROPE AND CENTRAL ASIA 135
a. Gross pension level b. Gross replacement rate
earnings-related basic earnings-related basic
c. Gross and net pension levels d. Gross and net replacement rates
net gross net gross
e. Taxes paid by pensioners and workers f. Sources of net replacement rate
worker: total worker: income taxpensioner: total
taxes and contributions earnings-relatedbasic
0
0.5
1.0
1.5
2.0
2.5
gros
s re
lativ
e pe
nsio
n le
vel
0.5 1.0 1.5 2.0 2.5 3.0individual earnings, proportion of average
0
0.25
0.50
0.75
1.00
1.25
gros
s re
plac
emen
t rat
e
0.5 1.0 1.5 2.0 2.5 3.0individual earnings, proportion of average
0
0.5
1.0
1.5
2.0
2.5
net a
nd g
ross
rel
ativ
e pe
nsio
n le
vels
0.5 1.0 1.5 2.0 2.5 3.0individual earnings, proportion of average
0
0.25
0.50
0.75
1.00
1.25
net a
nd g
ross
rep
lace
men
t rat
es
0.5 1.0 1.5 2.0 2.5 3.0individual earnings, proportion of average
0
0.1
0.2
0.3
0.4
0.5
prop
ortio
n of
ear
ning
s an
d in
com
e
0.5 1.0 1.5 2.0 2.5 3.0individual pension and earnings, proportion of average earnings
0
0.25
0.50
0.75
1.00
prop
ortio
n of
net
rep
lace
men
t rat
e
0.5 1.0 1.5 2.0 2.5 3.0individual earnings, proportion of average
The Czech Republic
Source: OECD pension models.
136
THE NEW SYSTEM IN ESTONIA COMBINES AN EARNINGS-RELATED PUBLIC SCHEME with manda-tory contributions to funded pensions. There is also a safety-net national pension and aflat-rate basic scheme.
Qualifying Conditions
The pension age will be equalized for men and women at age 63 from 2016. The pensionmay be claimed up to three years before the standard age (from age 60 in the long term)provided that the individual retires.
Benefit Calculation
BasicThere is a basic pension payable to all contributors with 15 years’ coverage. The 2003 valueis EEK 447.
Earnings-RelatedSince 1998, the pension has been earnings related with a points system. Points dependon individual earnings relative to the average. Accumulated points are multiplied bythe annual pension-insurance coefficient to calculate pension entitlement. The coefficientwas EEK 31.69 per month in 2002 and EEK 34.04 in 2003. This is equivalent to an accrualrate of approximately 0.5 percent per year of service (31.69/6,122 [monthly averageearnings] = 0.005). There is no ceiling on pensionable earnings. Parameters are upratedannually to 50 percent of price inflation and 50 percent of growth in contribution revenues.The pension value is reduced by 4.8 percent for each year that an individual retires early.Deferring pension earns an increment of 10.8 percent per year.
TargetedA minimum retirement-income guarantee is provided by the national pension. This wasEEK 867.20 per month in 2002 and EEK 931.00 in 2003. This is substantially above thesocial-assistance minimum, which has not therefore been modeled.
Defined ContributionIndividuals choosing the funded option must make an additional contribution of 2 percentof earnings into their pension fund. Four percentage points of the total social security con-tribution is then also diverted to this fund. New labor-market entrants (those born in 1983or after) are required to take the funded option. Most current workers may choose thisoption (those born in 1942 or after, up to age 60).
Estonia

Personal Income Tax and Social Security Contributions
The personal income tax has a single, flat rate of 26 percent. There is a general allowance ofEEK 3,000 per month. Pension payments now count as taxable income, but only if theyexceed three times the general allowance. Pensioners are also entitled to the generalallowance.
Employers pay social security contributions of 33 percent of gross earnings, of which 20percentage points finance pensions. There is no ceiling on contributions. Pensions in pay-ment are not subject to social security contributions. As noted previously, individuals tak-ing the funded option must contribute 2 percent of their earnings.
Pension Modeling Results
Individual earnings, multiple of average
Results 0.5 0.75 1 1.5 2 2.5
Gross pension level 29.2 40.4 51.6 74.0 96.5 118.9(% of average earnings)
Net pension level 34.5 47.7 60.9 87.4 113.8 140.2(% of average net earnings)
Gross replacement rate 58.4 53.9 51.6 49.4 48.2 47.5(% of individual earnings)
Net replacement rate 59.9 60.6 60.9 61.3 61.5 61.7(% of individual net earnings)
Gross pension wealth 4.2 5.8 7.4 10.6 13.7 16.9(multiple of average earnings) 5.4 7.5 9.5 13.6 17.7 21.8
Net pension wealth 4.9 6.8 8.7 12.5 16.2 20.0(multiple of average net earnings) 6.4 8.8 11.2 16.0 20.9 25.7
Source: Axia Economics APEX model.
Note: Results in italics are for women where the results of women are different from those of men.
EASTERN EUROPE AND CENTRAL ASIA 137

138 PENSIONS PANORAMA: RETIREMENT-INCOME SYSTEMS IN 53 COUNTRIES
a. Gross pension level b. Gross replacement rate
DC earnings-relatedbasic
DC earnings-related
basic
c. Gross and net pension levels d. Gross and net replacement rates
net gross net gross
e. Taxes paid by pensioners and workers f. Sources of net replacement rate
worker: total worker: income taxpensioner: total
taxes and contributions DCearnings-related basic
0
0.5
1.0
1.5
2.0
2.5
gros
s re
lativ
e pe
nsio
n le
vel
0.5 1.0 1.5 2.0 2.5 3.0individual earnings, proportion of average
0
0.25
0.50
0.75
1.00
1.25
gros
s re
plac
emen
t rat
e
0.5 1.0 1.5 2.0 2.5 3.0individual earnings, proportion of average
0
0.5
1.0
1.5
2.0
2.5
net a
nd g
ross
rel
ativ
e pe
nsio
n le
vels
0.5 1.0 1.5 2.0 2.5 3.0individual earnings, proportion of average
0
0.25
0.50
0.75
1.00
1.25
net a
nd g
ross
rep
lace
men
t rat
es
0.5 1.0 1.5 2.0 2.5 3.0individual earnings, proportion of average
0
0.1
0.2
0.3
0.4
0.5
prop
ortio
n of
ear
ning
s an
d in
com
e
0.5 1.0 1.5 2.0 2.5 3.0individual pension and earnings, proportion of average earnings
0
0.25
0.50
0.75
1.00
prop
ortio
n of
net
rep
lace
men
t rat
e
0.5 1.0 1.5 2.0 2.5 3.0individual earnings, proportion of average
Estonia
Source: Axia Economics APEX model.

139
THE NEW SYSTEM IN HUNGARY COMBINES AN EARNINGS-RELATED PUBLIC PENSION withmandatory, funded, defined-contribution schemes. The modeling assumes that workersare covered by the mixed system.
Qualifying Conditions
A phased increase in pension eligibility age will equalize it at 62 for men and women (from60 and 55, respectively). The age for men reached 62 in 2000 and will reach 62 for womenfrom 2009. Also, 20 years’ service is required for both earnings-related and minimum pen-sions. For those retiring before the start of 2009, 15 years’ service is required for a partialpension. The reformed system was introduced in June 1998. People who switched volun-tarily to the mixed system were allowed to return to the pure pay-as-you-go system untilthe end of 2002. The obligation for new entrants to join a private pension was suspendedfor 2002.
Benefit Calculation
Earnings-RelatedFor those covered by the mixed system, the accrual rate is 1.22 percent of earnings for eachyear of service (subject to the contribution ceiling). This compares with an accrual rate of1.65 percent for those covered by the pay-as-you-go system alone.
Currently, the earnings base is income of all years since 1988, moving toward the fulllifetime. Earlier years’ earnings excluding the last two years before retirement are val-orized with economywide average earnings. A ceiling on pensionable earnings was intro-duced in 1992. In 2002, the ceiling was HUF 2,368,850 (225 percent of average earnings).Increases in the ceiling since 2002 took it to approximately 2.5 times average earnings in2003 and 3.0 times in 2004.
The pension in payment has been indexed half to wages and half to prices since 2000.
Defined ContributionSome 8 percent of gross pensionable earnings is diverted to the funded plan from 2004 forpeople covered by the mixed pension option, increased from 6 percent in 2002 and 7 percentin 2003. By use of unisex life tables and the same indexation of pension in payment as thepublic scheme, the accumulated capital must be converted into an annuity on retirement.
MinimumThe minimum pension was worth HUF 20,100 a month in 2002 (approximately 23 percentof average earnings). Its value is indexed in the same way as the earnings-related scheme.The minimum pension will be abolished from 2009.
Hungary
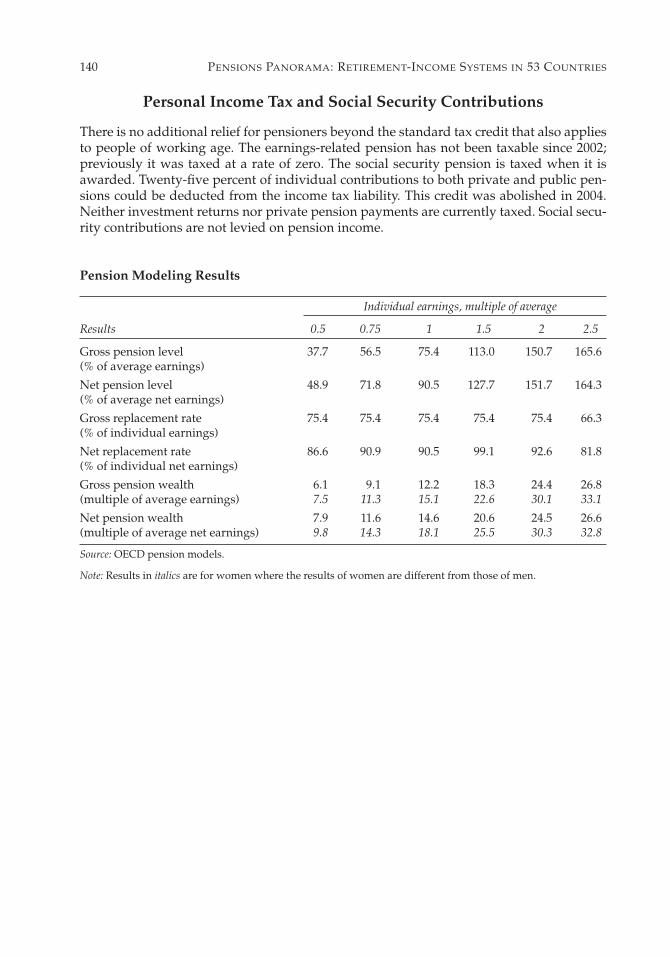
Personal Income Tax and Social Security Contributions
There is no additional relief for pensioners beyond the standard tax credit that also appliesto people of working age. The earnings-related pension has not been taxable since 2002;previously it was taxed at a rate of zero. The social security pension is taxed when it isawarded. Twenty-five percent of individual contributions to both private and public pen-sions could be deducted from the income tax liability. This credit was abolished in 2004.Neither investment returns nor private pension payments are currently taxed. Social secu-rity contributions are not levied on pension income.
Pension Modeling Results
Individual earnings, multiple of average
Results 0.5 0.75 1 1.5 2 2.5
Gross pension level 37.7 56.5 75.4 113.0 150.7 165.6(% of average earnings)
Net pension level 48.9 71.8 90.5 127.7 151.7 164.3(% of average net earnings)
Gross replacement rate 75.4 75.4 75.4 75.4 75.4 66.3(% of individual earnings)
Net replacement rate 86.6 90.9 90.5 99.1 92.6 81.8(% of individual net earnings)
Gross pension wealth 6.1 9.1 12.2 18.3 24.4 26.8(multiple of average earnings) 7.5 11.3 15.1 22.6 30.1 33.1
Net pension wealth 7.9 11.6 14.6 20.6 24.5 26.6(multiple of average net earnings) 9.8 14.3 18.1 25.5 30.3 32.8
Source: OECD pension models.
Note: Results in italics are for women where the results of women are different from those of men.
140 PENSIONS PANORAMA: RETIREMENT-INCOME SYSTEMS IN 53 COUNTRIES

EASTERN EUROPE AND CENTRAL ASIA 141
a. Gross pension level b. Gross replacement rate
DC earnings-related DC earnings-related
c. Gross and net pension levels d. Gross and net replacement rates
net gross net gross
e. Taxes paid by pensioners and workers f. Sources of net replacement rate
worker: total worker: income taxpensioner: total
taxes and contributions DC
earnings-related
0
0.5
1.0
1.5
2.0
2.5
gros
s re
lativ
e pe
nsio
n le
vel
0.5 1.0 1.5 2.0 2.5 3.0individual earnings, proportion of average
0
0.25
0.50
0.75
1.00
1.25
gros
s re
plac
emen
t rat
e
0.5 1.0 1.5 2.0 2.5 3.0individual earnings, proportion of average
0
0.5
1.0
1.5
2.0
2.5
net a
nd g
ross
rel
ativ
e pe
nsio
n le
vels
0.5 1.0 1.5 2.0 2.5 3.0individual earnings, proportion of average
0
0.25
0.50
0.75
1.00
1.25
net a
nd g
ross
rep
lace
men
t rat
es
0.5 1.0 1.5 2.0 2.5 3.0individual earnings, proportion of average
0
0.1
0.2
0.3
0.4
0.5
prop
ortio
n of
ear
ning
s an
d in
com
e
0.5 1.0 1.5 2.0 2.5 3.0individual pension and earnings, proportion of average earnings
0
0.25
0.50
0.75
1.00
prop
ortio
n of
net
rep
lace
men
t rat
e
0.5 1.0 1.5 2.0 2.5 3.0individual earnings, proportion of average
Hungary
Source: OECD pension models.

142
THE NEW SYSTEM IN LATVIA COMBINES AN EARNINGS-RELATED PUBLIC SCHEME, based onnotional accounts, with mandatory contributions to funded pensions. There is also asafety-net pension.
Qualifying Conditions
The pension age will reach age 62 for both sexes in the long term. A full pension entitle-ment requires 10 years’ service.
Benefit Calculation
Earnings-RelatedThe new pension system is based on notional accounts. The pension value is the sum ofnotional capital at retirement (contributions uprated in line with the covered wage bill)divided by the g-value (calculated annually using projected life expectancy at retirementage with a unisex life table). The ceiling on covered earnings is Lat 17,300. The pension inpayment is currently uprated by consumer prices plus 25 percent of real wage-bill growth.From 2011, it is envisaged that the share of wage growth will increase to 50 percent, withthe possibility of moving to 100 percent earnings indexation.
MinimumThe guaranteed minimum pension is set at the same level as the general safety-net benefit:50 percent of the minimum wage. From 2002, this varies with the length of service in thepension-insurance system:
Years of service 20 30 >30Multiple of minimum pension 1.1 1.3 1.5
Defined ContributionPeople under age 30 at the time of the reform must contribute to a new funded scheme.Those between 30 and 49 must choose between remaining only in the public, pay-as-you-go system or belonging to both the public and the funded scheme. The proportion of earn-ings diverted into the funded scheme is very small at first—just 2 percent—but willincrease over a 10-year period, with the growth concentrated in later years. The envisagedpath is as follows:
Year 2001 2002 2003 2004 2005 2006 2007 2008 2009 2010Contribution (%) 2 2 2 2 2 2 4 8 9 10
At retirement, the accumulated capital must be converted to an income stream underthese alternatives. First, individuals can add the balance of the fund to the notional capital
Latvia

built up under the public scheme, which yields a benefit dependent on the g-value.Second, they can buy a whole-life annuity from a life insurance company (without restric-tion on, for example, indexation or provision of survivor’s benefits).
Personal Income Tax and Social Security Contributions
There is a flat rate tax of 25 percent on all income above a threshold. This is Lat 252 peryear for people of working age and Lat 1,200 per year for people of pension age. Pensionincome is fully taxable. Social security contributions are 35 percent of earnings, fallingto 33 percent from 2003, 9 points of which are levied on employees, the rest on employers.Contributions are income tax deductible. Pensions are not subject to social securitycontributions.
Pension Modeling Results
Individual earnings, multiple of average
Results 0.5 0.75 1 1.5 2 2.5
Gross pension level 31.8 43.6 58.2 87.3 116.4 145.4(% of average earnings)
Net pension level 46.3 63.6 81.8 113.6 145.4 177.2(% of average net earnings)
Gross replacement rate 63.6 58.2 58.2 58.2 58.2 58.2(% of individual earnings)
Net replacement rate 89.2 83.7 81.8 76.7 74.1 72.5(% of individual net earnings)
Gross pension wealth 4.6 6.3 8.4 12.6 16.8 21.0(multiple of average earnings) 5.8 7.9 10.5 15.8 21.1 26.3
Net pension wealth 6.7 9.2 11.8 16.4 21.0 25.6(multiple of average net earnings) 8.4 11.5 14.8 20.6 26.3 32.1
Source: Axia Economics APEX model.
Note: Results in italics are for women where the results of women are different from those of men.
EASTERN EUROPE AND CENTRAL ASIA 143

144 PENSIONS PANORAMA: RETIREMENT-INCOME SYSTEMS IN 53 COUNTRIES
a. Gross pension level b. Gross replacement rate
DC earnings-relatedminimum
DC earnings-relatedminimum
c. Gross and net pension levels d. Gross and net replacement rates
net gross net gross
e. Taxes paid by pensioners and workers f. Sources of net replacement rate
worker: total worker: income taxpensioner: total
taxes and contributions DCearnings-related minimum
0
0.5
1.0
1.5
2.0
2.5
gros
s re
lativ
e pe
nsio
n le
vel
0.5 1.0 1.5 2.0 2.5 3.0individual earnings, proportion of average
0
0.25
0.50
0.75
1.00
1.25
gros
s re
plac
emen
t rat
e
0.5 1.0 1.5 2.0 2.5 3.0individual earnings, proportion of average
0
0.5
1.0
1.5
2.0
2.5
net a
nd g
ross
rel
ativ
e pe
nsio
n le
vels
0.5 1.0 1.5 2.0 2.5 3.0individual earnings, proportion of average
0
0.25
0.50
0.75
1.00
1.25
net a
nd g
ross
rep
lace
men
t rat
es
0.5 1.0 1.5 2.0 2.5 3.0individual earnings, proportion of average
0
0.1
0.2
0.3
0.4
0.5
prop
ortio
n of
ear
ning
s an
d in
com
e
0.5 1.0 1.5 2.0 2.5 3.0individual pension and earnings, proportion of average earnings
0
0.25
0.50
0.75
1.00
prop
ortio
n of
net
rep
lace
men
t rat
e
0.5 1.0 1.5 2.0 2.5 3.0individual earnings, proportion of average
Latvia
Source: Axia Economics APEX model.

145
THE NEW SYSTEM IN LITHUANIA HAS A TWO-TIER PUBLIC SCHEME with an earnings-relatedand a flat-rate benefit. There are also mandatory contributions to funded pensions.
Qualifying Conditions
Pensionable age will reach 62.5 for men and 60 for women in the longer term. Individualsmust have 15 years’ coverage to receive a pension. To qualify for a contribution year, theindividual must have made contributions equivalent to a full year at the minimum wage.
Benefit Calculation
BasicThe basic pension is a flat-rate contributory benefit. The full rate is earned with 30 years’contributions, with a proportionally reduced benefit available for people with shorter con-tribution histories. Its value is set at 110 percent of the government’s minimum subsistencelevel, which is Lit 147 for 2002.
Earnings-RelatedThe earnings-related pension offers 0.5 percent of individual average pay for each year ofcoverage. Earlier years’ earnings are uprated in line with average earnings. The ceiling onpensionable pay is five times average earnings.
It is possible to defer the pension after standard age: both the basic and earnings-relatedcomponents are increased by 8 percent for every year of deferral.
Defined ContributionThe law establishing the mandatory funded scheme was passed in December 2002. Thisenvisages an initial contribution rate of 2.5 percent with an eventual increase to 5.5 percentshould the finances of the social security program prove sufficiently robust. The valueof the pay-as-you-go components will be reduced proportionally to the amount of the con-trbution diverted to the pension funds.
Personal Income Tax and Social Security Contributions
There is a standard allowance of Lit 290 per month (with higher allowances for disabledpeople and people with numerous children). The standard income tax rate is 33 percent,although a lower 15 percent rate applies to income from some forms of saving. Public pen-sions are not subject to tax.
The total social security contribution rate is 34 percent of earnings; the employee pays 3.0percentage points. Of the total contribution, some 25.0 percentage points are earmarked forthe pension system; the employee pays 2.5 points. There is no ceiling on contributions
Lithuania

(although there is a ceiling on benefits: see above). Pensioners do not pay social securitycontributions.
Pension Modeling Results
Individual earnings, multiple of average
Results 0.5 0.75 1 1.5 2 2.5
Gross pension level 35.0 44.2 53.4 71.7 90.1 108.5(% of average earnings) 32.6 40.6 48.6 64.6 80.6 96.6
Net pension level 46.8 59.0 71.3 95.9 120.5 145.0(% of average net earnings) 43.6 54.3 65.0 86.4 107.8 129.2
Gross replacement rate 69.9 58.9 53.4 47.8 45.1 43.4(% of individual earnings) 65.2 54.1 48.6 43.1 40.3 38.7
Net replacement rate 81.7 75.1 71.3 67.2 64.9 63.5(% of individual net earnings) 76.2 69.0 65.0 60.5 58.1 56.6
Gross pension wealth 5.0 6.3 7.6 10.2 12.8 15.4(multiple of average earnings) 6.3 7.9 9.5 12.6 15.7 18.8
Net pension wealth 6.6 8.4 10.1 13.6 17.1 20.5(multiple of average net earnings) 8.5 10.6 12.7 16.8 21.0 25.1
Source: Axia Economics APEX model.
Note: Results in italics are for women where the results of women are different from those of men.
146 PENSIONS PANORAMA: RETIREMENT-INCOME SYSTEMS IN 53 COUNTRIES

EASTERN EUROPE AND CENTRAL ASIA 147
a. Gross pension level b. Gross replacement rate
DC earnings-related
minimum
DC earnings-related
minimum
c. Gross and net pension levels d. Gross and net replacement rates
net gross net gross
e. Taxes paid by pensioners and workers f. Sources of net replacement rate
worker: total worker: income taxpensioner: total
taxes and contributions DCearnings-related minimum
0
0.5
1.0
1.5
2.0
2.5
gros
s re
lativ
e pe
nsio
n le
vel
0.5 1.0 1.5 2.0 2.5 3.0individual earnings, proportion of average
0
0.25
0.50
0.75
1.00
1.25
gros
s re
plac
emen
t rat
e
0.5 1.0 1.5 2.0 2.5 3.0individual earnings, proportion of average
0
0.5
1.0
1.5
2.0
2.5
net a
nd g
ross
rel
ativ
e pe
nsio
n le
vels
0.5 1.0 1.5 2.0 2.5 3.0individual earnings, proportion of average
0
0.25
0.50
0.75
1.00
1.25
net a
nd g
ross
rep
lace
men
t rat
es
0.5 1.0 1.5 2.0 2.5 3.0individual earnings, proportion of average
0
0.1
0.2
0.3
0.4
0.5
prop
ortio
n of
ear
ning
s an
d in
com
e
0.5 1.0 1.5 2.0 2.5 3.0individual pension and earnings, proportion of average earnings
0
0.25
0.50
0.75
1.00
prop
ortio
n of
net
rep
lace
men
t rat
e
0.5 1.0 1.5 2.0 2.5 3.0individual earnings, proportion of average
Lithuania
Source: Axia Economics APEX model.

148
THE NEW PENSION SYSTEM IN POLAND APPLIES TO PEOPLE AGED 50 AT THE TIME OF THE
REFORM. The new public scheme is based on notional accounts. People under 30 at the timeof the reform must participate in the funded scheme; people aged 30–50 could choose, butthe choice had to be made in 1999 and was irrevocable.
Qualifying Conditions
The minimum pension age in the new system will be 65 for men and 60 for women. For theminimum pension, 25 and 20 years’ contributions are required from men and women,respectively.
Benefit Calculation
Earnings-RelatedA contribution of 12.22 percent of earnings is credited to notional accounts. These contri-butions are uprated (by price inflation plus 75 percent of the growth of the real covered-wage bill) between the time they are made and the time of retirement. From 2004 onward,the notional interest rate will be defined as the greater of the growth in real covered-wagebill and growth in prices. At retirement, accumulated notional capital is divided by the g-value to arrive at the pension. The g-value is average life expectancy at retirement age.The g-value is calculated using projections from the United Nations and World Bank pop-ulation database. The ceiling on contributions and pensionable earnings is PLN 64,620, setannually at 2.5 times projected average earnings. Pensions in payment are uprated in linewith 80 percent of prices and 20 percent of average earnings. However, the 2004 govern-ment proposal includes a shift to prices uprating from 2005.
MinimumThe minimum pension was PLN 530 per month in 2001/02 and PLN 533 in 2002/03. Themodel uses the average value for calendar 2002. The target is adjusted to 80 percent pricesplus 20 percent earnings.
Defined ContributionSome 7.3 percentage points of the total contribution are diverted to the funded scheme forthose compulsorily covered or voluntarily choosing this option. At retirement, the accu-mulated capital must be converted to an annuity. At the minimum, this must be priceindexed (to be used in the model calculation). Annuity rates will most likely have to bebased on unisex life tables, though this has not been decided yet.
Poland
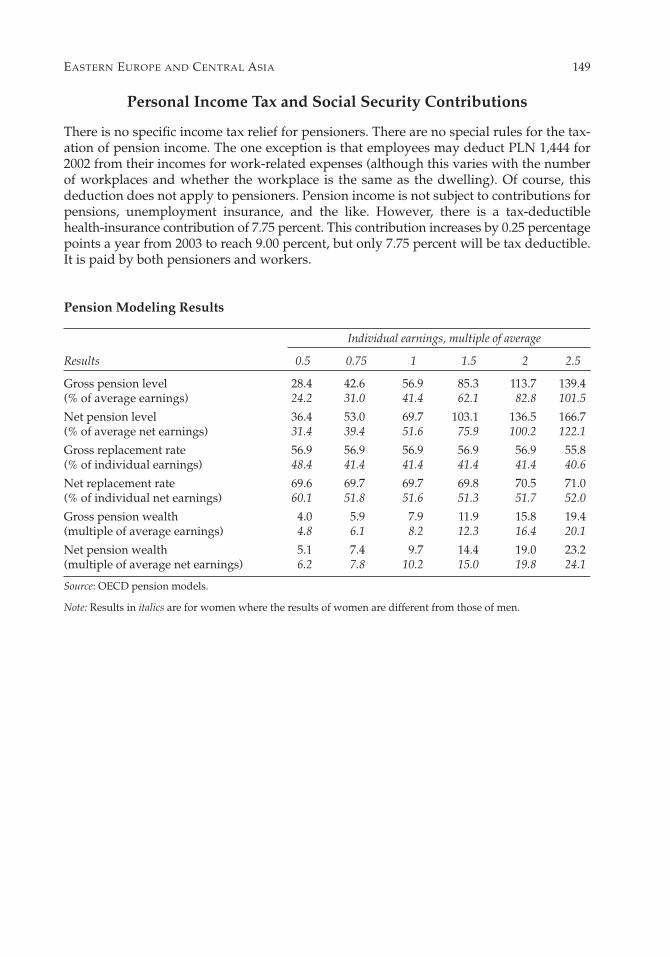
Personal Income Tax and Social Security Contributions
There is no specific income tax relief for pensioners. There are no special rules for the tax-ation of pension income. The one exception is that employees may deduct PLN 1,444 for2002 from their incomes for work-related expenses (although this varies with the numberof workplaces and whether the workplace is the same as the dwelling). Of course, thisdeduction does not apply to pensioners. Pension income is not subject to contributions forpensions, unemployment insurance, and the like. However, there is a tax-deductiblehealth-insurance contribution of 7.75 percent. This contribution increases by 0.25 percentagepoints a year from 2003 to reach 9.00 percent, but only 7.75 percent will be tax deductible.It is paid by both pensioners and workers.
Pension Modeling Results
Individual earnings, multiple of average
Results 0.5 0.75 1 1.5 2 2.5
Gross pension level 28.4 42.6 56.9 85.3 113.7 139.4(% of average earnings) 24.2 31.0 41.4 62.1 82.8 101.5
Net pension level 36.4 53.0 69.7 103.1 136.5 166.7(% of average net earnings) 31.4 39.4 51.6 75.9 100.2 122.1
Gross replacement rate 56.9 56.9 56.9 56.9 56.9 55.8(% of individual earnings) 48.4 41.4 41.4 41.4 41.4 40.6
Net replacement rate 69.6 69.7 69.7 69.8 70.5 71.0(% of individual net earnings) 60.1 51.8 51.6 51.3 51.7 52.0
Gross pension wealth 4.0 5.9 7.9 11.9 15.8 19.4(multiple of average earnings) 4.8 6.1 8.2 12.3 16.4 20.1
Net pension wealth 5.1 7.4 9.7 14.4 19.0 23.2 (multiple of average net earnings) 6.2 7.8 10.2 15.0 19.8 24.1
Source: OECD pension models.
Note: Results in italics are for women where the results of women are different from those of men.
EASTERN EUROPE AND CENTRAL ASIA 149

150 PENSIONS PANORAMA: RETIREMENT-INCOME SYSTEMS IN 53 COUNTRIES
a. Gross pension level b. Gross replacement rate
DC earnings-relatedtargeted
DC earnings-relatedtargeted
c. Gross and net pension levels d. Gross and net replacement rates
net gross net gross
e. Taxes paid by pensioners and workers f. Sources of net replacement rate
worker: total worker: income taxpensioner: total pensioner: income tax
taxes and contributions DCtargeted
0
0.5
1.0
1.5
2.0
2.5
gros
s re
lativ
e pe
nsio
n le
vel
0.5 1.0 1.5 2.0 2.5 3.0individual earnings, proportion of average
0
0.25
0.50
0.75
1.00
1.25
gros
s re
plac
emen
t rat
e
0.5 1.0 1.5 2.0 2.5 3.0individual earnings, proportion of average
earnings-related
0
0.5
1.0
1.5
2.0
2.5
net a
nd g
ross
rel
ativ
e pe
nsio
n le
vels
0.5 1.0 1.5 2.0 2.5 3.0individual earnings, proportion of average
0
0.25
0.50
0.75
1.00
1.25
net a
nd g
ross
rep
lace
men
t rat
es
0.5 1.0 1.5 2.0 2.5 3.0individual earnings, proportion of average
0
0.1
0.2
0.3
0.4
0.5
prop
ortio
n of
ear
ning
s an
d in
com
e
0.5 1.0 1.5 2.0 2.5 3.0individual pension and earnings, proportion of average earnings
0
0.25
0.50
0.75
1.00
prop
ortio
n of
net
rep
lace
men
t rat
e
0.5 1.0 1.5 2.0 2.5 3.0individual earnings, proportion of average
Poland
Source: OECD pension models.

151
THE SLOVAK EARNINGS-RELATED, PUBLIC SCHEME HAS RECENTLY BEEN TRANSFORMED from astandard defined-benefit formula to a point system. There is a minimum annual pensionaccrual related to the minimum wage.
Qualifying Conditions
The normal pension age is gradually increasing to 62 for men and women, reaching 62 forwomen in 2014. Eligibility depends on making at least 10 years of contributions.
Benefit Calculation
Earnings-RelatedThe new pension formula applies from 2004. Pension points are calculated as the ratioof individual earnings to average earnings. Each pension point from 2004 is worthSKK 183.58. This point value is indexed to average earnings.
Based on Slovak government estimates of 7.8 percent nominal wage growth in 2004 andactual wage growth of 6.3 percent in 2003, the pension-point value for 2002 would havebeen SKK 160.18. (Note that for comparison with other countries, the calculations arebased on the parameters had the reformed pension system been in operation in 2002.)Average earnings in 2002 were SKK 13,511 per month. Dividing the point value by thenational average earnings gives the equivalent to the accrual rate in a defined-benefitscheme, which is just under 1.2 percent.
There was a maximum pension of SKK 8,282 in the first half of 2002 and SKK 8,697 inthe second half. However, this is abolished under the new points-based system. Instead,there is a ceiling on pensionable earnings, fixed in 2003 at three times average earnings.Based on the 2002 average earnings, the ceiling would have been SKK 486,396 in that year.
Pensions in payment are indexed to the arithmetic average of earnings growth andprice inflation.
MinimumThe minimum pension is abolished under the new system. However, there is a mechanismto lift low pensionable earnings to the level of the minimum wage, which for 2004 isSKK 6,080. In 2002, the minimum wage was SKK 4,920 until October, when it wasincreased to SKK 5,570.
Personal Income Tax and Social Security Contributions
There are no special tax allowances or credits for pensioners. Pensions are not subject tothe income tax. Pensioners do not pay social security contributions.
The Slovak Republic

Pension Modeling Results
Individual earnings, multiple of average
Results 0.5 0.75 1 1.5 2 2.5
Gross pension level 24.3 36.4 48.6 72.9 97.2 121.5(% of average earnings)
Net pension level 30.1 45.2 60.2 90.4 120.5 150.6(% of average net earnings)
Gross replacement rate 48.6 48.6 48.6 48.6 48.6 48.6(% of individual earnings)
Net replacement rate 58.2 59.4 60.2 63.1 65.7 67.8(% of individual net earnings)
Gross pension wealth 4.0 6.0 8.0 12.0 15.9 19.9(multiple of average earnings) 4.9 7.3 9.8 14.6 19.5 24.4
Net pension wealth 4.9 7.4 9.9 14.8 19.8 24.7(multiple of average net earnings) 6.0 9.1 12.1 18.1 24.2 30.2
Source: OECD pension models.
Note: Results in italics are for women where the results of women are different from those of men.
152 PENSIONS PANORAMA: RETIREMENT-INCOME SYSTEMS IN 53 COUNTRIES

EASTERN EUROPE AND CENTRAL ASIA 153
a. Gross pension level b. Gross replacement rate
earnings-related minimum earnings-related minimum
c. Gross and net pension levels d. Gross and net replacement rates
net gross net gross
e. Taxes paid by pensioners and workers f. Sources of net replacement rate
worker: total worker: income taxpensioner: total
taxes and contributions earnings-related
minimum
0
0.5
1.0
1.5
2.0
2.5
gros
s re
lativ
e pe
nsio
n le
vel
0.5 1.0 1.5 2.0 2.5 3.0individual earnings, proportion of average
0
0.25
0.50
0.75
1.00
1.25
gros
s re
plac
emen
t rat
e
0.5 1.0 1.5 2.0 2.5 3.0individual earnings, proportion of average
0
0.5
1.0
1.5
2.0
2.5
net a
nd g
ross
rel
ativ
e pe
nsio
n le
vels
0.5 1.0 1.5 2.0 2.5 3.0individual earnings, proportion of average
0
0.25
0.50
0.75
1.00
1.25
net a
nd g
ross
rep
lace
men
t rat
es
0.5 1.0 1.5 2.0 2.5 3.0individual earnings, proportion of average
0
0.1
0.2
0.3
0.4
0.5
prop
ortio
n of
ear
ning
s an
d in
com
e
0.5 1.0 1.5 2.0 2.5 3.0individual pension and earnings, proportion of average earnings
0
0.25
0.50
0.75
1.00
prop
ortio
n of
net
rep
lace
men
t rat
e
0.5 1.0 1.5 2.0 2.5 3.0individual earnings, proportion of average
The Slovak Republic
Source: OECD pension models.

154
TURKEY HAS AN EARNINGS-RELATED PUBLIC PENSION SCHEME with an income-tested safetynet and a flat-rate supplementary pension.
Qualifying Conditions
Recent entrants (from September 1999) can draw a pension from age 60 (men) or 58(women) with 7,000 days of contributions. This is equivalent to approximately 28 years ofcontributions for continuous employment. An alternative eligibility condition is 25 yearsof insurance coverage with 4,500 days of contributions.
The means-tested pension is payable from age 65 only to those who are disabled orhave no other social security rights.
Benefit Calculation
Earnings-RelatedThe pension under the new scheme is based on average lifetime earnings revalued in linewith nominal GDP growth. The pension has a nonlinear formula with years of coverage.The first 10 years earn a pension of 35 percent of pay, with an extra 2 percent per year forthe next 15 years and 1 percent per year thereafter.
There is a floor above which contributions are required. The floor had three differentvalues during calendar 2002, varying between TRL 210 million at the beginning of the yearand TRL 328 million at the end.
There is a ceiling on pensionable earnings; its value was TRL 1,050 million at the start ofthe year and TRL 1,638 million at the end of 2002.
Indexation of pensions in payment is to the consumer price index. Pensions areadjusted monthly.
MinimumThere is a minimum pension, which varied between TRL 202 million and TRL 257 millionin 2002.
TargetedThe means-tested pension is paid quarterly. For the first half of 2002 the pension wasTRL 45 million per month; for the second, pension was TRL 49 million per month.
A monthly supplement is paid to all retirees. Its value started in 2002 at TRL 75 million.As the monthly increases are awarded to individuals’ earnings-related pensions, thissupplement is reduced by the amount of those increases.
Turkey

Personal Income Tax and Social Security Contributions
There are no special income tax allowances or credits for pensioners. Pension income is notsubject to income tax. Pension income is not subject to social security contributions.
Pension Modeling Results
Individual earnings, multiple of average
Results 0.5 0.75 1 1.5 2 2.5
Gross pension level 48.1 67.6 87.2 126.2 143.8 143.8(% of average earnings) 47.1 66.2 85.2 123.2 140.4 140.4
Net pension level 58.7 81.0 103.3 146.0 164.8 164.8(% of average net earnings) 57.6 79.3 101.1 142.8 161.2 161.2
Gross replacement rate 96.2 90.2 87.2 84.1 71.9 57.5(% of individual earnings) 94.2 88.2 85.2 82.2 70.2 56.2
Net replacement rate 113.2 106.7 103.3 99.9 84.3 66.8(% of individual net earnings) 111.0 104.5 101.1 97.8 82.4 65.4
Gross pension wealth 6.1 8.5 11.0 15.9 18.2 18.2(multiple of average earnings) 7.2 10.2 13.1 18.9 21.6 21.6
Net pension wealth 7.4 10.2 13.0 18.4 20.8 20.8(multiple of average net earnings) 8.8 12.2 15.5 21.9 24.8 24.8
Source: OECD pension models.
Note: Results in italics are for women where the results of women are different from those of men.
EASTERN EUROPE AND CENTRAL ASIA 155

156 PENSIONS PANORAMA: RETIREMENT-INCOME SYSTEMS IN 53 COUNTRIES
a. Gross pension level b. Gross replacement rate
earnings-related basicminimum
earnings-related basicminimum
c. Gross and net pension levels d. Gross and net replacement rates
net gross net gross
e. Taxes paid by pensioners and workers f. Sources of net replacement rate
worker: total worker: income taxpensioner: total
taxes and contributions earnings-relatedbasic minimum
0
0.5
1.0
1.5
2.0
2.5
gros
s re
lativ
e pe
nsio
n le
vel
0.5 1.0 1.5 2.0 2.5 3.0individual earnings, proportion of average
0
0.25
0.50
0.75
1.00
1.25
gros
s re
plac
emen
t rat
e
0.5 1.0 1.5 2.0 2.5 3.0individual earnings, proportion of average
0
0.5
1.0
1.5
2.0
2.5
net a
nd g
ross
rel
ativ
e pe
nsio
n le
vels
0.5 1.0 1.5 2.0 2.5 3.0individual earnings, proportion of average
0
0.25
0.50
0.75
1.00
1.25
net a
nd g
ross
rep
lace
men
t rat
es
0.5 1.0 1.5 2.0 2.5 3.0individual earnings, proportion of average
0
0.1
0.2
0.3
0.4
0.5
prop
ortio
n of
ear
ning
s an
d in
com
e
0.5 1.0 1.5 2.0 2.5 3.0individual pension and earnings, proportion of average earnings
0
0.25
0.50
0.75
1.00
prop
ortio
n of
net
rep
lace
men
t rat
e
0.5 1.0 1.5 2.0 2.5 3.0individual earnings, proportion of average
Turkey
Source: OECD pension models.

157
12. Latin America and the Caribbean


THE NEW SYSTEM IN ARGENTINA ALLOWS WORKERS TO CHOOSE between an earnings-relatedpublic, defined-benefit scheme and a funded, privately managed, defined-contributionplan. With 30 years’ contributions or more, people also receive a (broadly) flat-rate benefit.This is pay-as-you-go (PAYG) financed.
Qualifying Conditions
Normal retirement age is 65 for men and 60 for women. Retirement is possible only after30 years of contributions, although each two years of deferral after the normal retirementage counts as one contribution year. A reduced pension is available with 10 years of con-tributions for individuals aged 70 that have contributed in five of the last eight yearsbefore retirement.
Benefit Formula
BasicThe basic universal benefit (PBU) is a broadly flat-rate pension contingent on years of con-tributions but not on preretirement earnings. Its value is adjusted ad hoc: it has been worthapproximately 28 percent of average earnings in the past few years. The entitlement isincreased by 1 percent per year of contribution above the minimum 30 years, up to amaximum of 45 years.
Defined ContributionThe contribution rate for the funded scheme has varied over time. In the year 2000, forexample, it was 7.72 percent (after administrative charges and the premium for disabilityinsurance). In 2001 and 2002, the contribution was cut in response to macroeconomicconditions, with approximately 2.75 percent of earnings going into retirement accounts. In2003 and 2004, the overall contribution was 7.00 percent of earnings, of which 4.46 percentwent into individual accounts. The modeling assumes that this contribution rate is main-tained in the long term.
Personal Income Tax and Social Security Contributions
Contributions and investment returns to the funded scheme are not taxed, but pensionpayments count as taxable income.
There is a general income tax deduction of Arg$ 4,020. The rate schedule, above thestandard deduction, is:
Band lower limit Arg$ (000s) 0 10 20 30 60 90 120Rate (%) 9 14 19 23 27 31 35
159
Argentina

160 PENSIONS PANORAMA: RETIREMENT-INCOME SYSTEMS IN 53 COUNTRIES
Employers pay social security contributions of 22 to 31 percent of gross earnings, of whichroughly 7 to 16 percentage points finance pensions, (depending on sector and location offirm). Workers pay 15 percent of gross earnings, of which 11 points are for pensions (as ofNovember 2003). The ceiling on earnings subject to pension contributions is Arg$ 4,800,which is not indexed. Pensioners pay social security contributions for sickness benefit of 3to 6 percent.
Pension Modeling Results
Individual earnings, multiple of average
Results 0.5 0.75 1 1.5 2 2.5
Gross pension level 52.3 57.4 62.6 72.9 83.1 93.4(% of average earnings) 43.2 46.3 49.4 55.6 61.8 68.0
Net pension level 62.3 68.0 73.7 85.1 96.4 107.8(% of average net earnings) 52.3 55.7 59.2 66.0 72.9 79.7
Gross replacement rate 104.6 76.6 62.6 48.6 41.6 37.4(% of individual earnings) 86.4 61.7 49.4 37.1 30.9 27.2
Net replacement rate 119.2 89.3 73.7 57.8 50.3 45.7(% of individual net earnings) 100.0 73.2 59.2 44.8 38.0 33.8
Gross pension wealth 7.1 7.8 8.5 9.8 11.2 12.6(multiple of average earnings) 8.2 8.8 9.4 10.6 11.8 13.0
Net pension wealth 8.4 9.2 10.0 11.5 13.0 14.6(multiple of average net earnings) 10.0 10.6 11.3 12.6 13.9 15.2
Source: Axia Economics APEX model.
Note: Results in italics are for women where the results of women are different from those of men.

LATIN AMERICA AND THE CARIBBEAN 161
a. Gross pension level b. Gross replacement rate
DC basic DC basic
c. Gross and net pension levels d. Gross and net replacement rates
net gross net gross
e. Taxes paid by pensioners and workers f. Sources of net replacement rate
worker: total worker: income taxpensioner: total pensioner: income tax
taxes and contributions DCbasic
0
0.5
1.0
1.5
2.0
2.5
gros
s re
lativ
e pe
nsio
n le
vel
0.5 1.0 1.5 2.0 2.5 3.0individual earnings, proportion of average
0
0.25
0.50
0.75
1.00
1.25
gros
s re
plac
emen
t rat
e
0.5 1.0 1.5 2.0 2.5 3.0individual earnings, proportion of average
0
0.5
1.0
1.5
2.0
2.5
net a
nd g
ross
rel
ativ
e pe
nsio
n le
vels
0.5 1.0 1.5 2.0 2.5 3.0individual earnings, proportion of average
0
0.25
0.50
0.75
1.00
1.25
net a
nd g
ross
rep
lace
men
t rat
es
0.5 1.0 1.5 2.0 2.5 3.0individual earnings, proportion of average
0
0.1
0.2
0.3
0.4
0.5
prop
ortio
n of
ear
ning
s an
d in
com
e
0.5 1.0 1.5 2.0 2.5 3.0individual pension and earnings, proportion of average earnings
0
0.25
0.50
0.75
1.00
prop
ortio
n of
net
rep
lace
men
t rat
e
0.5 1.0 1.5 2.0 2.5 3.0individual earnings, proportion of average
Argentina
Source: Axia Economics APEX model.
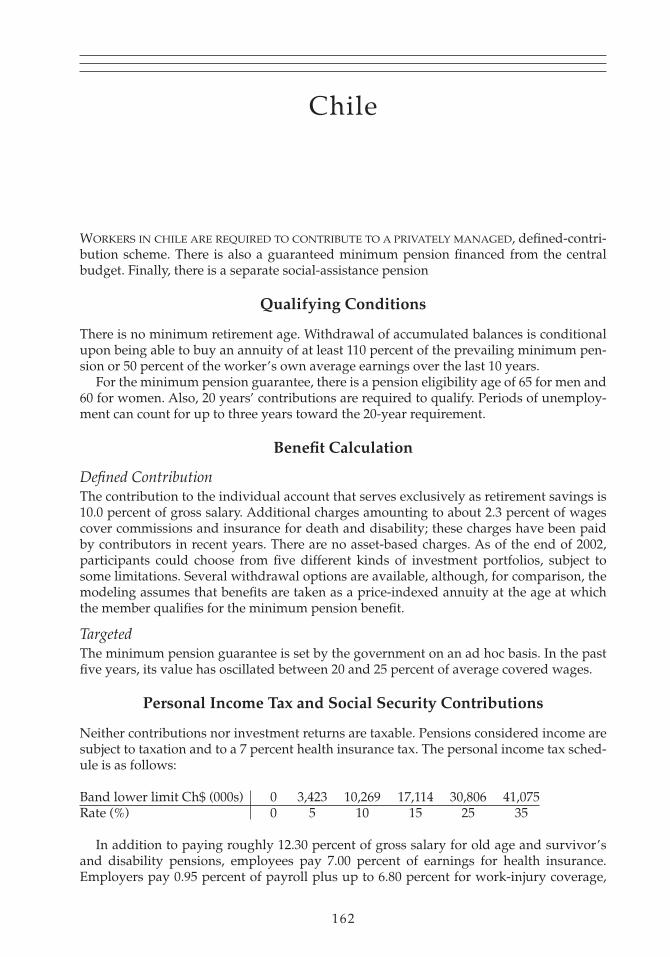
162
WORKERS IN CHILE ARE REQUIRED TO CONTRIBUTE TO A PRIVATELY MANAGED, defined-contri-bution scheme. There is also a guaranteed minimum pension financed from the centralbudget. Finally, there is a separate social-assistance pension
Qualifying Conditions
There is no minimum retirement age. Withdrawal of accumulated balances is conditionalupon being able to buy an annuity of at least 110 percent of the prevailing minimum pen-sion or 50 percent of the worker’s own average earnings over the last 10 years.
For the minimum pension guarantee, there is a pension eligibility age of 65 for men and60 for women. Also, 20 years’ contributions are required to qualify. Periods of unemploy-ment can count for up to three years toward the 20-year requirement.
Benefit Calculation
Defined ContributionThe contribution to the individual account that serves exclusively as retirement savings is10.0 percent of gross salary. Additional charges amounting to about 2.3 percent of wagescover commissions and insurance for death and disability; these charges have been paidby contributors in recent years. There are no asset-based charges. As of the end of 2002,participants could choose from five different kinds of investment portfolios, subject tosome limitations. Several withdrawal options are available, although, for comparison, themodeling assumes that benefits are taken as a price-indexed annuity at the age at whichthe member qualifies for the minimum pension benefit.
TargetedThe minimum pension guarantee is set by the government on an ad hoc basis. In the pastfive years, its value has oscillated between 20 and 25 percent of average covered wages.
Personal Income Tax and Social Security Contributions
Neither contributions nor investment returns are taxable. Pensions considered income aresubject to taxation and to a 7 percent health insurance tax. The personal income tax sched-ule is as follows:
Band lower limit Ch$ (000s) 0 3,423 10,269 17,114 30,806 41,075Rate (%) 0 5 10 15 25 35
In addition to paying roughly 12.30 percent of gross salary for old age and survivor’sand disability pensions, employees pay 7.00 percent of earnings for health insurance.Employers pay 0.95 percent of payroll plus up to 6.80 percent for work-injury coverage,
Chile

according to risk, as well as 4.11 percent for severance allowances. As of January 2003, theceiling on earnings subject to pension contributions has been 60 Unidades de Fomento (UF)or US$ 1,414. The UF is a price-indexed monetary unit, but otherwise, the ceiling is notindexed.
Pension Modeling Results
Individual earnings, multiple of average
Results 0.5 0.75 1 1.5 2 2.5
Gross pension level 22.4 32.8 43.8 65.7 87.5 109.4(% of average earnings) 22.4 22.4 27.1 40.6 54.1 67.7
Net pension level 28.0 40.4 53.5 78.8 103.4 126.7(% of average net earnings) 28.0 28.0 33.5 49.7 65.8 81.0
Gross replacement rate 44.9 43.8 43.8 43.8 43.8 43.8(% of individual earnings) 44.9 29.9 27.1 27.1 27.1 27.1
Net replacement rate 53.3 52.6 53.5 54.5 56.3 58.5(% of individual net earnings) 53.3 36.5 33.5 34.4 35.8 37.4
Gross pension wealth 3.2 4.7 6.2 9.3 12.5 15.6(multiple of average earnings) 4.4 4.4 5.3 7.9 10.6 13.2
Net pension wealth 4.0 5.8 7.6 11.2 14.7 18.0(multiple of average net earnings) 5.5 5.5 6.6 9.7 12.9 15.9
Source: Axia Economics APEX model.
Note: Results in italics are for women where the results of women are different from those of men.
LATIN AMERICA AND THE CARIBBEAN 163

164 PENSIONS PANORAMA: RETIREMENT-INCOME SYSTEMS IN 53 COUNTRIES
a. Gross pension level b. Gross replacement rate
DC minimum DC minimum
c. Gross and net pension levels d. Gross and net replacement rates
e. Taxes paid by pensioners and workers f. Sources of net replacement rate
worker: total worker: income taxpensioner: total pensioner: income tax
taxes and contributions DCminimum
0
0.5
1.0
1.5
2.0
2.5
gros
s re
lativ
e pe
nsio
n le
vel
0.5 1.0 1.5 2.0 2.5 3.0individual earnings, proportion of average
0
0.25
0.50
0.75
1.00
1.25
gros
s re
plac
emen
t rat
e
0.5 1.0 1.5 2.0 2.5 3.0individual earnings, proportion of average
0
0.5
1.0
1.5
2.0
2.5
net a
nd g
ross
rel
ativ
e pe
nsio
n le
vels
0.5 1.0 1.5 2.0 2.5 3.0individual earnings, proportion of average
0
0.25
0.50
0.75
1.00
1.25
net a
nd g
ross
rep
lace
men
t rat
es
0.5 1.0 1.5 2.0 2.5 3.0individual earnings, proportion of average
0
0.1
0.2
0.3
0.4
0.5
prop
ortio
n of
ear
ning
s an
d in
com
e
0.5 1.0 1.5 2.0 2.5 3.0individual pension and earnings, proportion of average earnings
0
0.25
0.50
0.75
1.00
prop
ortio
n of
net
rep
lace
men
t rat
e
0.5 1.0 1.5 2.0 2.5 3.0individual earnings, proportion of average
net gross net gross
Chile
Source: Axia Economics APEX model.

165
THE NEW SYSTEM IN COLOMBIA PROVIDES A CHOICE between a public, defined-benefitscheme and a funded, privately managed, defined-contribution scheme. There is also anoption to switch from one scheme to the other periodically. For a new entrant, a minimumpension is guaranteed with 25 years’ contributions.
Qualifying Conditions
Normal retirement age rises gradually to 57 for women and 62 for men by 2014 for thepublic, defined-benefit scheme. It is currently 60 for women and 62 for men in the privatescheme (unless the accumulated balance is enough for an annuity of 110 percent of theminimum pension). The minimum contribution period is increasing to 1,300 weeks (or 25years) from 2015.
Benefit Calculation
Earnings-RelatedFrom 2004, the pension is between 55 and 65 percent of average individual earnings overthe final 10 years, revalued by inflation plus 2.0 percentage points for each of four 50-weekperiods (up to 85 percent). If the earnings base equals the minimum wage, the replacementrate is 65 percent, with a 0.5 percentage point reduction for each multiple of minimumwage to a minimum of 55 percent.
TargetedThe minimum pension is equivalent to the minimum wage. (In 2002, the minimum wagewas equivalent to roughly half of the estimated average covered wage.) There are 14monthly payments per year (including two bonuses).
Defined ContributionIndividuals choosing the funded option contribute 13.5 percent of gross earnings, rising to16.5 percent (of which the employee pays one-quarter.) By the year 2008, 12.0 percent ofgross earnings will be destined for the individual account, while 3.0 percent will go tofinance commissions and insurance premiums. An additional 1.5 percent finances theminimum pension guarantee fund. Workers can switch back to the pay-as-you-go schemeonce every 5 years but cannot do so within 10 years of retirement. The minimum pensionguarantee is the same as that which applies in the defined-benefit scheme but is paid only12 times during the year.
Personal Income Tax and Social Security Contributions
Contributions and investment returns are not taxed; pension payments count as taxableincome, but only when total income exceeds 50 times the minimum wage. The personalincome tax schedule is
Colombia

Band lower limit (Col$ million) 0 18.2 18.7 27.4 72.8Rate (%) 0 10 20 30 35
Employers pay social security contributions of 23.5 to 31.8 percent of gross earnings(excluding severance fund contributions), of which 10.125 percent finances pensions. Thisis scheduled to rise to 12.375 percent by 2008. Employees pay 7.375 percent of gross earn-ings, of which 3.375 percent is for pensions (rising to 4.125 percent by 2008). There is anadditional 1 percent solidarity contribution on earnings above four times the minimumwage. The ceiling is 20 times the minimum wage. Pensioners do not pay social securitycontributions.
Pension Modeling Results
Individual earnings, multiple of average
Results 0.5 0.75 1 1.5 2 2.5
Gross pension level 50.0 50.0 50.0 69.1 92.2 115.2(% of average earnings) 50.0 50.0 50.0 50.0 57.8 72.3
Net pension level 54.4 54.4 54.4 75.3 100.3 125.4(% of average net earnings) 54.4 54.4 54.4 54.4 63.0 78.7
Gross replacement rate 100.0 66.7 50.0 46.1 46.1 46.1(% of individual earnings) 100.0 66.7 50.0 33.3 28.9 28.9
Net replacement rate 108.8 72.6 54.4 50.2 50.2 50.3(% of individual net earnings) 108.8 72.6 54.4 36.3 31.5 31.6
Gross pension wealth 7.4 7.4 7.4 10.2 13.6 17.0(multiple of average earnings) 9.9 9.9 9.9 9.9 11.5 14.3
Net pension wealth 8.0 8.0 8.0 11.1 14.8 18.5(multiple of average net earnings) 10.8 10.8 10.8 10.8 12.5 15.6
Source: Axia Economics APEX model.
Note: Results in italics are for women where the results of women are different from those of men
166 PENSIONS PANORAMA: RETIREMENT-INCOME SYSTEMS IN 53 COUNTRIES

LATIN AMERICA AND THE CARIBBEAN 167
a. Gross pension level b. Gross replacement rate
DC targeted DC targeted
c. Gross and net pension levels d. Gross and net replacement rates
net gross net gross
e. Taxes paid by pensioners and workers f. Sources of net replacement rate
worker: total worker: income taxpensioner: total
taxes and contributions DCtargeted
0
0.5
1.0
1.5
2.0
2.5
gros
s re
lativ
e pe
nsio
n le
vel
0.5 1.0 1.5 2.0 2.5 3.0individual earnings, proportion of average
0
0.25
0.50
0.75
1.00
1.25
gros
s re
plac
emen
t rat
e
0.5 1.0 1.5 2.0 2.5 3.0individual earnings, proportion of average
0
0.5
1.0
1.5
2.0
2.5
net a
nd g
ross
rel
ativ
e pe
nsio
n le
vels
0.5 1.0 1.5 2.0 2.5 3.0individual earnings, proportion of average
0
0.25
0.50
0.75
1.00
1.25
net a
nd g
ross
rep
lace
men
t rat
es
0.5 1.0 1.5 2.0 2.5 3.0individual earnings, proportion of average
0
0.1
0.2
0.3
0.4
0.5
prop
ortio
n of
ear
ning
s an
d in
com
e
0.5 1.0 1.5 2.0 2.5 3.0individual pension and earnings, proportion of average earnings
0
0.25
0.50
0.75
1.00
prop
ortio
n of
net
rep
lace
men
t rat
e
0.5 1.0 1.5 2.0 2.5 3.0individual earnings, proportion of average
Colombia
Source: Axia Economics APEX model.

168
ALL WORKERS IN COSTA RICA PARTICIPATE IN THE PUBLIC, defined-benefit scheme. Lower-income workers have the option to split their contributions evenly between a defined-con-tribution scheme and the defined-benefit scheme. Higher-income workers must split theircontributions between the two schemes. There is a separate social-assistance pension.
Qualifying Conditions
Retirement is possible at age 59 and 11 months for women and 61 and 11 months for menif they have contributed for 450 or 462 months, respectively. The contribution requirementis reduced for each month so that retirement is possible at age 65 for both sexes after 240months of contribution. The social-assistance program targeted to the elderly is based on ameans test.
Benefit Calculation
Earnings-RelatedThe target replacement rate for pensions is 60 percent of individual earnings after the first240 months’ coverage plus 1 percentage point per year thereafter. The earnings base is thebest 48 out of the last 60 months’ pay. Earnings are not revalued for the purposes of thiscalculation. Pensions in payment are indexed to prices.
TargetedThe minimum pension has been set recently at approximately 20 percent of average cov-ered earnings, while the social-assistance pension has been set at about 10 percent ofaverage earnings.
Defined ContributionContributions equivalent to 4.25 percent of gross wage are made to individual accounts forall covered workers. A commission is deducted from this flow with a maximum of either 8percent of returns or 4 percent of contributions. Disability and survivor’s benefits are paid from the public scheme. Benefits may be taken as indexed annuities or scheduledwithdrawals.
Personal Income Tax and Social Security Contributions
Employer contributions are tax deductible. However, the 1 percent employee contributionto the funded scheme is not deductible. Investment returns are not taxed. Benefits aretaxed as income. The personal income tax schedule is
Band lower limit C (000s) 0 296 445Rate (%) 0 10 15
Costa Rica

Employers pay a total of 27.00 percent gross wages for social insurance and the mandatoryseverance program, while the employee pays 11.75 percent. There is no ceiling on thewages subject to contributions. Pensioners do not pay social security contributions.
Pension Modeling Results
Individual earnings, multiple of average
Results 0.5 0.75 1 1.5 2 2.5
Gross pension level 44.5 66.7 89.0 133.5 178.0 222.5(% of average earnings) 41.8 62.7 83.5 125.3 167.1 208.8
Net pension level 54.5 78.8 103.1 151.7 200.3 248.9(% of average net earnings) 51.5 74.3 97.1 142.7 188.4 234.0
Gross replacement rate 89.0 89.0 89.0 89.0 89.0 89.0(% of individual earnings) 83.5 83.5 83.5 83.5 83.5 83.5
Net replacement rate 102.9 103.0 103.1 103.1 103.2 103.2(% of individual net earnings) 97.3 97.2 97.1 97.1 97.0 97.0
Gross pension wealth 7.2 10.8 14.4 21.6 28.8 36.0(multiple of average earnings) 8.4 12.6 16.7 25.1 33.5 41.9
Net pension wealth 8.8 12.8 16.7 24.6 32.4 40.3(multiple of average net earnings) 10.3 14.9 19.5 28.6 37.8 46.9
Source: Axia Economics APEX model.
Note: Results in italics are for women where the results of women are different from those of men.
LATIN AMERICA AND THE CARIBBEAN 169

170 PENSIONS PANORAMA: RETIREMENT-INCOME SYSTEMS IN 53 COUNTRIES
a. Gross pension level b. Gross replacement rate
DC earnings-related DC earnings-related
c. Gross and net pension levels d. Gross and net replacement rates
net gross net gross
e. Taxes paid by pensioners and workers f. Sources of net replacement rate
worker: total worker: income taxpensioner: total
taxes and contributions DCearnings-related
0
0.5
1.0
1.5
2.0
2.5
gros
s re
lativ
e pe
nsio
n le
vel
0.5 1.0 1.5 2.0 2.5 3.0individual earnings, proportion of average
0
0.25
0.50
0.75
1.00
1.25
gros
s re
plac
emen
t rat
e
0.5 1.0 1.5 2.0 2.5 3.0individual earnings, proportion of average
0
0.5
1.0
1.5
2.0
2.5
net a
nd g
ross
rel
ativ
e pe
nsio
n le
vels
0.5 1.0 1.5 2.0 2.5 3.0individual earnings, proportion of average
0
0.25
0.50
0.75
1.00
1.25
net a
nd g
ross
rep
lace
men
t rat
es
0.5 1.0 1.5 2.0 2.5 3.0individual earnings, proportion of average
0
0.1
0.2
0.3
0.4
0.5
prop
ortio
n of
ear
ning
s an
d in
com
e
0.5 1.0 1.5 2.0 2.5 3.0individual pension and earnings, proportion of average earnings
0
0.25
0.50
0.75
1.00
prop
ortio
n of
net
rep
lace
men
t rat
e
0.5 1.0 1.5 2.0 2.5 3.0individual earnings, proportion of average
Costa Rica
Source: Axia Economics APEX model.
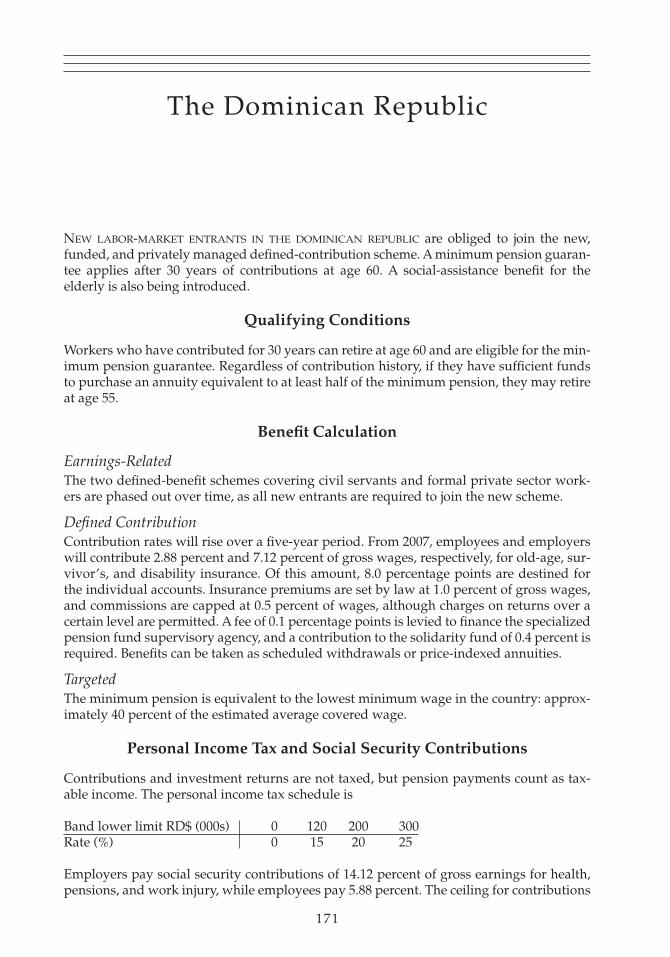
171
NEW LABOR-MARKET ENTRANTS IN THE DOMINICAN REPUBLIC are obliged to join the new,funded, and privately managed defined-contribution scheme. A minimum pension guaran-tee applies after 30 years of contributions at age 60. A social-assistance benefit for theelderly is also being introduced.
Qualifying Conditions
Workers who have contributed for 30 years can retire at age 60 and are eligible for the min-imum pension guarantee. Regardless of contribution history, if they have sufficient fundsto purchase an annuity equivalent to at least half of the minimum pension, they may retireat age 55.
Benefit Calculation
Earnings-RelatedThe two defined-benefit schemes covering civil servants and formal private sector work-ers are phased out over time, as all new entrants are required to join the new scheme.
Defined ContributionContribution rates will rise over a five-year period. From 2007, employees and employerswill contribute 2.88 percent and 7.12 percent of gross wages, respectively, for old-age, sur-vivor’s, and disability insurance. Of this amount, 8.0 percentage points are destined forthe individual accounts. Insurance premiums are set by law at 1.0 percent of gross wages,and commissions are capped at 0.5 percent of wages, although charges on returns over acertain level are permitted. A fee of 0.1 percentage points is levied to finance the specializedpension fund supervisory agency, and a contribution to the solidarity fund of 0.4 percent isrequired. Benefits can be taken as scheduled withdrawals or price-indexed annuities.
Targeted The minimum pension is equivalent to the lowest minimum wage in the country: approx-imately 40 percent of the estimated average covered wage.
Personal Income Tax and Social Security Contributions
Contributions and investment returns are not taxed, but pension payments count as tax-able income. The personal income tax schedule is
Band lower limit RD$ (000s) 0 120 200 300Rate (%) 0 15 20 25
Employers pay social security contributions of 14.12 percent of gross earnings for health,pensions, and work injury, while employees pay 5.88 percent. The ceiling for contributions
The Dominican Republic

is 10 minimum wages for health and 20 minimum wages for pensions. The minimumwage was estimated at approximately 40 percent of projected average covered wage. Pen-sioners do not pay social security contributions.
Pension Modeling Results
Individual earnings, multiple of average
Results 0.5 0.75 1 1.5 2 2.5
Gross pension level 52.6 52.6 52.6 52.6 58.7 73.4(% of average earnings) 52.6 52.6 52.6 52.6 52.6 59.9
Net pension level 55.9 55.9 55.9 55.9 62.4 78.0(% of average net earnings) 55.9 55.9 55.9 55.9 55.9 63.6
Gross replacement rate 105.3 70.2 52.6 35.1 29.4 29.4(% of individual earnings) 105.3 70.2 52.6 35.1 26.3 23.9
Net replacement rate 111.8 74.6 55.9 37.3 31.6 32.6(% of individual net earnings) 111.8 74.6 55.9 37.3 28.3 26.5
Gross pension wealth 7.6 7.6 7.6 7.6 8.5 10.6(multiple of average earnings) 9.3 9.3 9.3 9.3 9.3 10.6
Net pension wealth 8.1 8.1 8.1 8.1 9.0 11.3(multiple of average net earnings) 9.9 9.9 9.9 9.9 9.9 11.3
Source: Axia Economics APEX model.
Note: Results in italics are for women where the results of women are different from those of men.
172 PENSIONS PANORAMA: RETIREMENT-INCOME SYSTEMS IN 53 COUNTRIES

LATIN AMERICA AND THE CARIBBEAN 173
a. Gross pension level b. Gross replacement rate
DC targeted DC targeted
c. Gross and net pension levels d. Gross and net replacement rates
net gross net gross
e. Taxes paid by pensioners and workers f. Sources of net replacement rate
worker: total worker: income taxpensioner: total
taxes and contributions DCtargeted
0
0.5
1.0
1.5
2.0
2.5
gros
s re
lativ
e pe
nsio
n le
vel
0.5 1.0 1.5 2.0 2.5 3.0individual earnings, proportion of average
0
0.25
0.50
0.75
1.00
1.25
gros
s re
plac
emen
t rat
e
0.5 1.0 1.5 2.0 2.5 3.0individual earnings, proportion of average
0
0.5
1.0
1.5
2.0
2.5
net a
nd g
ross
rel
ativ
e pe
nsio
n le
vels
0.5 1.0 1.5 2.0 2.5 3.0individual earnings, proportion of average
0
0.25
0.50
0.75
1.00
1.25
net a
nd g
ross
rep
lace
men
t rat
es
0.5 1.0 1.5 2.0 2.5 3.0individual earnings, proportion of average
0
0.1
0.2
0.3
0.4
0.5
prop
ortio
n of
ear
ning
s an
d in
com
e
0.5 1.0 1.5 2.0 2.5 3.0individual pension and earnings, proportion of average earnings
0
0.25
0.50
0.75
1.00
prop
ortio
n of
net
rep
lace
men
t rat
e
0.5 1.0 1.5 2.0 2.5 3.0individual earnings, proportion of average
The Dominican Republic
Source: Axia Economics APEX model.

174
NEW ENTRANTS IN EL SALVADOR ARE OBLIGED TO JOIN THE NEW, FUNDED, and privatelymanaged defined-contribution scheme. A minimum pension guarantee requires 25 yearsof contributions at minimum retirement age.
Qualifying Conditions
Men that have contributed for 25 years are eligible to retire at age 60 and women at age 55.After 30 years of contribution, there is no age requirement. Retirement is also allowed ifthe account balance is sufficient to purchase an annuity equal to 60 percent of basic earn-ings or 160 percent of the minimum pension.
Benefit Calculation
Defined ContributionEmployees and employers contribute 6.25 and 6.75 percent, respectively, of which 10 per-centage points are allocated to individual accounts. Commissions and disability and sur-vivor’s insurance are financed from up to 3 percentage points of the total contribution.Benefits can be taken as scheduled withdrawals or price-indexed annuities, althoughcurrently the former are only allowed.
TargetedThe minimum pension is set at US$ 100. Eligibility for the minimum pension is achievedwith 25 years of contribution.
Personal Income Tax and Social Security Contributions
Contributions and investment returns are not taxed, but pension payments count as tax-able income. Wages and pensions are subject to a progressive income tax. Below the lowerlimit (US$ 3,800) no tax is due. Beyond that the tax consists of a flat amount plus a ratelevied on income above a certain threshold, as set out in the table:
Band lower limit (US $) Flat payment (US $) Rate on excess (%) Threshold (US $)
3,800 57 10 3,8005,630 57 10 2,7439,143 720 20 9,143
22,856 2,743 30 22,856
Employers pay social security contributions of 14.25 percent of gross earnings forhealth, pensions, and work injury, while employees pay 9.25 percent. Of this, 13 percentagepoints are for pensions. The ceiling is US$ 6,100. It is adjusted on an ad hoc basis.Pensioners pay 7.80 percent of their pensions for public health insurance.
El Salvador

Pension Modeling Results
Individual earnings, multiple of average
Results 0.5 0.75 1 1.5 2 2.5
Gross pension level 32.1 32.1 38.7 58.0 77.4 96.7(% of average earnings) 32.1 32.1 32.1 35.8 47.7 59.7
Net pension level 32.6 32.6 39.3 58.9 78.6 98.2(% of average net earnings) 32.6 32.6 32.6 36.4 48.5 60.6
Gross replacement rate 64.1 42.7 38.7 38.7 38.7 38.7(% of individual earnings) 64.1 42.7 32.1 23.9 23.9 23.9
Net replacement rate 65.1 43.4 39.3 41.2 44.3 44.4(% of individual net earnings) 65.1 43.4 32.6 25.4 27.4 27.4
Gross pension wealth 4.8 4.8 5.8 8.8 11.7 14.6(multiple of average earnings) 6.6 6.6 6.6 7.3 9.8 12.2
Net pension wealth 4.9 4.9 5.9 8.9 11.9 14.8(multiple of average net earnings) 6.7 6.7 6.7 7.4 9.9 12.4
Source: Axia Economics APEX model.
Note: Results in italics are for women where the results of women are different from those of men.
LATIN AMERICA AND THE CARIBBEAN 175

176 PENSIONS PANORAMA: RETIREMENT-INCOME SYSTEMS IN 53 COUNTRIES
a. Gross pension level b. Gross replacement rate
DC targeted DC targeted
c. Gross and net pension levels d. Gross and net replacement rates
net gross net gross
e. Taxes paid by pensioners and workers f. Sources of net replacement rate
worker: total worker: income tax
pensioner: total pensioner: income taxtaxes and contributions DCtargeted
0
0.5
1.0
1.5
2.0
2.5
gros
s re
lativ
e pe
nsio
n le
vel
0.5 1.0 1.5 2.0 2.5 3.0individual earnings, proportion of average
0
0.25
0.50
0.75
1.00
1.25
gros
s re
plac
emen
t rat
e
0.5 1.0 1.5 2.0 2.5 3.0individual earnings, proportion of average
0
0.5
1.0
1.5
2.0
2.5
net a
nd g
ross
rel
ativ
e pe
nsio
n le
vels
0.5 1.0 1.5 2.0 2.5 3.0individual earnings, proportion of average
0
0.25
0.50
0.75
1.00
1.25
net a
nd g
ross
rep
lace
men
t rat
es
0.5 1.0 1.5 2.0 2.5 3.0individual earnings, proportion of average
0
0.1
0.2
0.3
0.4
0.5
prop
ortio
n of
ear
ning
s an
d in
com
e
0.5 1.0 1.5 2.0 2.5 3.0individual pension and earnings, proportion of average earnings
0
0.25
0.50
0.75
1.00
prop
ortio
n of
net
rep
lace
men
t rat
e
0.5 1.0 1.5 2.0 2.5 3.0individual earnings, proportion of average
El Salvador
Source: Axia Economics APEX model.
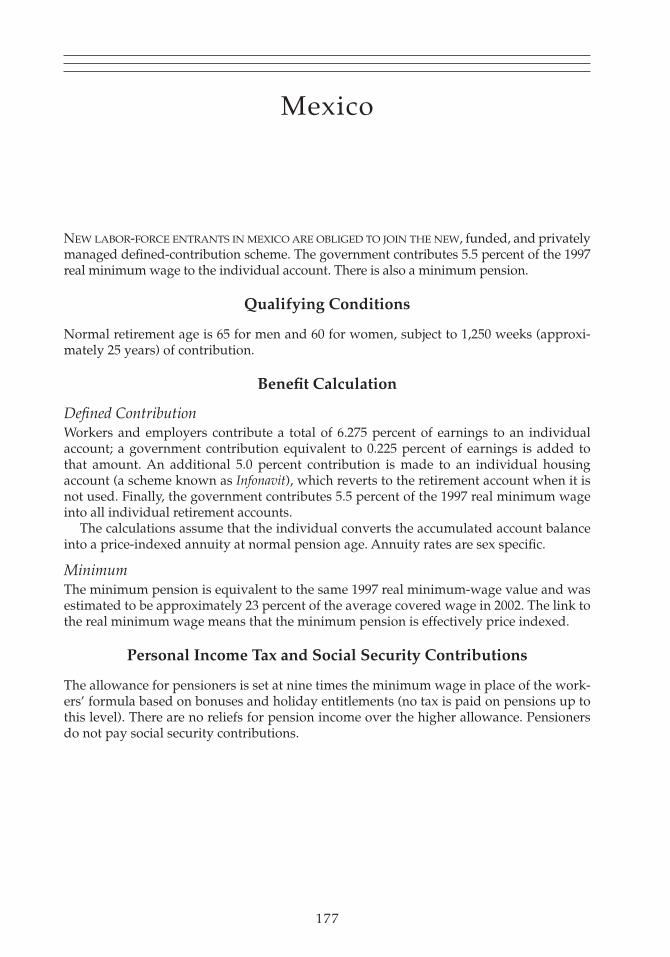
177
NEW LABOR-FORCE ENTRANTS IN MEXICO ARE OBLIGED TO JOIN THE NEW, funded, and privatelymanaged defined-contribution scheme. The government contributes 5.5 percent of the 1997real minimum wage to the individual account. There is also a minimum pension.
Qualifying Conditions
Normal retirement age is 65 for men and 60 for women, subject to 1,250 weeks (approxi-mately 25 years) of contribution.
Benefit Calculation
Defined ContributionWorkers and employers contribute a total of 6.275 percent of earnings to an individualaccount; a government contribution equivalent to 0.225 percent of earnings is added tothat amount. An additional 5.0 percent contribution is made to an individual housingaccount (a scheme known as Infonavit), which reverts to the retirement account when it isnot used. Finally, the government contributes 5.5 percent of the 1997 real minimum wageinto all individual retirement accounts.
The calculations assume that the individual converts the accumulated account balanceinto a price-indexed annuity at normal pension age. Annuity rates are sex specific.
MinimumThe minimum pension is equivalent to the same 1997 real minimum-wage value and wasestimated to be approximately 23 percent of the average covered wage in 2002. The link tothe real minimum wage means that the minimum pension is effectively price indexed.
Personal Income Tax and Social Security Contributions
The allowance for pensioners is set at nine times the minimum wage in place of the work-ers’ formula based on bonuses and holiday entitlements (no tax is paid on pensions up tothis level). There are no reliefs for pension income over the higher allowance. Pensionersdo not pay social security contributions.
Mexico

Pension Modeling Results
Individual earnings, multiple of average
Results 0.5 0.75 1 1.5 2 2.5
Gross pension level 19.6 27.8 36.0 52.4 68.7 85.1(% of average earnings) 19.4 19.4 21.7 31.6 41.5 51.3
Net pension level 28.1 36.6 45.1 62.1 78.7 95.1(% of average net earnings) 27.9 27.9 30.4 40.6 50.8 61.1
Gross replacement rate 39.1 37.0 36.0 34.9 34.4 34.1(% of individual earnings) 38.8 25.9 21.7 21.1 20.7 20.5
Net replacement rate 50.4 46.4 45.1 44.3 44.1 44.2(% of individual net earnings) 50.1 35.4 30.4 28.9 28.5 28.4
Gross pension wealth 2.6 3.7 4.8 7.0 9.1 11.3(multiple of average earnings) 3.6 3.6 4.1 5.9 7.8 9.6
Net pension wealth 3.7 4.9 6.0 8.3 10.5 12.6(multiple of average net earnings) 5.2 5.2 5.7 7.6 9.5 11.5
Source: OECD pension models.
Note: Results in italics are for women where the results of women are different from those of men.
178 PENSIONS PANORAMA: RETIREMENT-INCOME SYSTEMS IN 53 COUNTRIES

LATIN AMERICA AND THE CARIBBEAN 179
a. Gross pension level b. Gross replacement rate
DC DC-fixedtargeted
DC DC-fixedtargeted
c. Gross and net pension levels d. Gross and net replacement rates
net gross net gross
e. Taxes paid by pensioners and workers f. Sources of net replacement rate
worker: total worker: income taxpensioner: total
taxes and contributions DCDC-fixed targeted
0
0.5
1.0
1.5
2.0
2.5
gros
s re
lativ
e pe
nsio
n le
vel
0.5 1.0 1.5 2.0 2.5 3.0individual earnings, proportion of average
0
0.25
0.50
0.75
1.00
1.25
gros
s re
plac
emen
t rat
e
0.5 1.0 1.5 2.0 2.5 3.0individual earnings, proportion of average
0
0.5
1.0
1.5
2.0
2.5
net a
nd g
ross
rel
ativ
e pe
nsio
n le
vels
0.5 1.0 1.5 2.0 2.5 3.0individual earnings, proportion of average
0
0.25
0.50
0.75
1.00
1.25
net a
nd g
ross
rep
lace
men
t rat
es
0.5 1.0 1.5 2.0 2.5 3.0individual earnings, proportion of average
–0.3
–0.2
–0.1
0
0.1
0.2
prop
ortio
n of
ear
ning
s an
d in
com
e
0.5 1.0 1.5 2.0 2.5 3.0individual pension and earnings, proportion of average earnings
0
0.25
0.50
0.75
1.00
prop
ortio
n of
net
rep
lace
men
t rat
e
0.5 1.0 1.5 2.0 2.5 3.0individual earnings, proportion of average
Mexico
Source: OECD pension models.

180
THE DEFINED-CONTRIBUTION PENSION SCHEME IN PERU is an option for new labor-marketentrants as well as for current workers. The minimum pension for people taking the fundedoption has not yet been established.
Qualifying Conditions
The standard pension age for both men and women is 65. The vesting requirement is 20years’ contributions.
Benefit Calculation
TargetedThe minimum pension, as currently legislated, does not apply to younger workers. How-ever, there appears to be a general expectation that this will be extended to youngercohorts in due course. The value of the scheme is currently 415 pesos per month, equiva-lent to approximately a quarter of average covered earnings.
Defined ContributionThe contribution rate to the funded scheme is 8.00 percent. In addition, there are contribu-tions of 2.27 percent and 1.23 percent on average, respectively, for insurance and charges.
Personal Income Tax and Social Security Contributions
Contributions and returns on individual account balances are exempted from tax. There isa general allowance of 1,560 pesos per month. The income tax schedule is based on multi-ples of tax reference units (UITs), which are 0, 27, and 54. This converts into annual incomeas follows:
Band lower limit S/. (000s) 0 83.7 167.4Rate (%) 15 21 30
The total employee contribution for pensions is 13.5 percent (split, as set out above).There are no further employee social security contributions. For sickness and maternity,employers pay 9.0 percent, and pensioners, 4.0 percent. For work injury, the employer con-tribution varies between 1.0 and 12.2 percent, according to risk in the relevant industry.
Peru
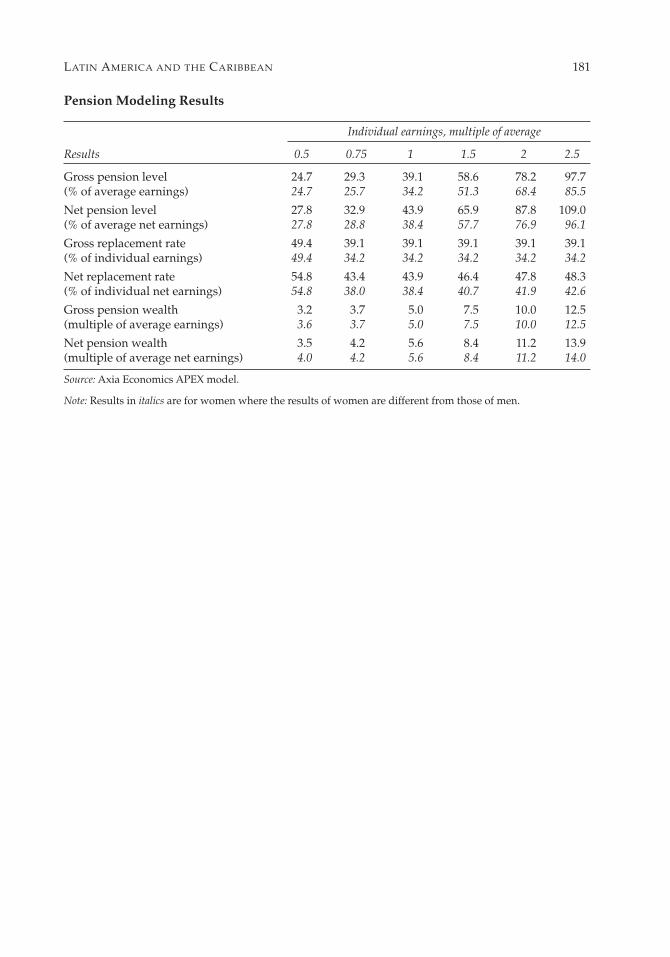
Pension Modeling Results
Individual earnings, multiple of average
Results 0.5 0.75 1 1.5 2 2.5
Gross pension level 24.7 29.3 39.1 58.6 78.2 97.7(% of average earnings) 24.7 25.7 34.2 51.3 68.4 85.5
Net pension level 27.8 32.9 43.9 65.9 87.8 109.0(% of average net earnings) 27.8 28.8 38.4 57.7 76.9 96.1
Gross replacement rate 49.4 39.1 39.1 39.1 39.1 39.1(% of individual earnings) 49.4 34.2 34.2 34.2 34.2 34.2
Net replacement rate 54.8 43.4 43.9 46.4 47.8 48.3(% of individual net earnings) 54.8 38.0 38.4 40.7 41.9 42.6
Gross pension wealth 3.2 3.7 5.0 7.5 10.0 12.5(multiple of average earnings) 3.6 3.7 5.0 7.5 10.0 12.5
Net pension wealth 3.5 4.2 5.6 8.4 11.2 13.9(multiple of average net earnings) 4.0 4.2 5.6 8.4 11.2 14.0
Source: Axia Economics APEX model.
Note: Results in italics are for women where the results of women are different from those of men.
LATIN AMERICA AND THE CARIBBEAN 181

182 PENSIONS PANORAMA: RETIREMENT-INCOME SYSTEMS IN 53 COUNTRIES
a. Gross pension level b. Gross replacement rate
DC targeted DC targeted
c. Gross and net pension levels d. Gross and net replacement rates
net gross net gross
e. Taxes paid by pensioners and workers f. Sources of net replacement rate
worker: total worker: income taxpensioner: total pensioner: income tax
taxes and contributions DCtargeted
0
0.5
1.0
1.5
2.0
2.5
gros
s re
lativ
e pe
nsio
n le
vel
0.5 1.0 1.5 2.0 2.5 3.0individual earnings, proportion of average
0
0.25
0.50
0.75
1.00
1.25
gros
s re
plac
emen
t rat
e
0.5 1.0 1.5 2.0 2.5 3.0individual earnings, proportion of average
0
0.5
1.0
1.5
2.0
2.5
net a
nd g
ross
rel
ativ
e pe
nsio
n le
vels
0.5 1.0 1.5 2.0 2.5 3.0individual earnings, proportion of average
0
0.25
0.50
0.75
1.00
1.25
net a
nd g
ross
rep
lace
men
t rat
es
0.5 1.0 1.5 2.0 2.5 3.0individual earnings, proportion of average
0
0.1
0.2
0.3
0.4
0.5
prop
ortio
n of
ear
ning
s an
d in
com
e
0.5 1.0 1.5 2.0 2.5 3.0individual pension and earnings, proportion of average earnings
0
0.25
0.50
0.75
1.00
prop
ortio
n of
net
rep
lace
men
t rat
e
0.5 1.0 1.5 2.0 2.5 3.0individual earnings, proportion of average
Peru
Source: Axia Economics APEX model.

183
THE PUBLIC, DEFINED-BENEFIT SCHEME IN URUGUAY COVERS earnings up to a specific level.Lower-income workers can split their contributions evenly between defined-contributionand defined-benefit schemes. The split for higher-income workers varies with income.There is a separate social-assistance pension.
Qualifying Conditions
Retirement is allowed at age 60 for both men and women with 35 years of contribution.Pensions can also be paid to individuals with 15 years of contributions at age 70.
Benefit Calculation
Earnings-RelatedThe pension is 50.0 percent of the earnings base plus 0.5 percent for each contribution yearabove 35 years (up to 2.5 percent). It increases by 3.0 percent for each year retirement isdeferred after age 60 (up to 30.0 percent). The earnings base is the final 10 years’ pay(revalued with average earnings). The ceiling, indexed to average earnings, is approxi-mately twice average earnings. In the calculation of pensionable earnings, the portion ofpay subject to contributions is multiplied by 1.5 up to the maximum earnings base (10,908pesos in 2003).
TargetedThe minimum pension, linked to the minimum wage, is worth approximately 20 percentof average earnings. From age 70, an individual with 15 years’ contributions qualifies foran advanced age pension and a higher minimum pension.
Defined ContributionOn earnings below the maximum base, the contribution is 7.5 percent of earnings up tohalf the maximum base and 7.5 percent on half of pay below half the maximum base. Onearnings between 1.0 and 1.5 times the maximum base, the contribution is 7.5 percent onhalf of pay up to the maximum base. For these workers, the entire 15 percent contributionon income between 1.0 and 1.5 times the maximum base goes to the earnings-relatedscheme. On earnings above 1.5 times the maximum base, the whole contribution (up to theceiling on taxable earnings) goes to the individual account. For workers with individualaccounts, the contribution to the funded scheme covers disability and survivor’s insur-ance as well as commissions for private providers. Over the past few years, this has costabout 2.7 percent of covered wage. Benefits must be taken as price-indexed annuities.
Uruguay

Personal Income Tax and Social Security Contributions
Contributions and investment returns are exempt. The income tax is 2 percent onincomes above three times the minimum wage and 3 percent above six times. Theminimum wage was approximately 17 percent of average earnings in 2002. The progressivetax schedule is
Band lower limit (minimum wages) 20 30 40 50Rate (%) 3 4 5 8
Employers contribute at least 22.5 percent, while employees pay 18.0 percent. The ceilingis 32,725 pesos per month (2003) or 5.7 times average covered earnings. It is indexed toaverage earnings.
Pension Modeling Results
Individual earnings, multiple of average
Results 0.5 0.75 1 1.5 2 2.5
Gross pension level 51.3 77.0 102.6 135.8 145.6 145.6(% of average earnings) 49.0 73.5 98.0 128.8 136.8 136.8
Net pension level 63.3 94.4 125.4 165.5 177.4 177.4(% of average net earnings) 60.5 90.2 119.8 157.1 166.8 166.8
Gross replacement rate 102.6 102.6 102.6 90.5 72.8 58.2(% of individual earnings) 98.0 98.0 98.0 85.9 68.4 54.7
Net replacement rate 125.1 125.3 125.4 110.8 89.5 71.8(% of individual net earnings) 119.5 119.7 119.8 105.2 84.2 67.5
Gross pension wealth 8.3 12.4 16.6 21.9 23.5 23.5(multiple of average earnings) 9.7 14.6 19.5 25.6 27.2 27.2
Net pension wealth 10.2 15.2 20.2 26.7 28.6 28.6(multiple of average net earnings) 12.0 17.9 23.8 31.2 33.1 33.1
Source: Axia Economics APEX model.
Note: Results in italics are for women where the results of women are different from those of men.
184 PENSIONS PANORAMA: RETIREMENT-INCOME SYSTEMS IN 53 COUNTRIES

LATIN AMERICA AND THE CARIBBEAN 185
a. Gross pension level b. Gross replacement rate
DC earnings-related DC earnings-related
c. Gross and net pension levels d. Gross and net replacement rates
net gross net gross
e. Taxes paid by pensioners and workers f. Sources of net replacement rate
worker: total worker: income taxpensioner: total
taxes and contributions DC
earnings-related
0
0.5
1.0
1.5
2.0
2.5
gros
s re
lativ
e pe
nsio
n le
vel
0.5 1.0 1.5 2.0 2.5 3.0individual earnings, proportion of average
0
0.25
0.50
0.75
1.00
1.25
gros
s re
plac
emen
t rat
e
0.5 1.0 1.5 2.0 2.5 3.0individual earnings, proportion of average
0
0.5
1.0
1.5
2.0
2.5
net a
nd g
ross
rel
ativ
e pe
nsio
n le
vels
0.5 1.0 1.5 2.0 2.5 3.0individual earnings, proportion of average
0
0.25
0.50
0.75
1.00
1.25
net a
nd g
ross
rep
lace
men
t rat
es
0.5 1.0 1.5 2.0 2.5 3.0individual earnings, proportion of average
0
0.1
0.2
0.3
0.4
0.5
prop
ortio
n of
ear
ning
s an
d in
com
e
0.5 1.0 1.5 2.0 2.5 3.0individual pension and earnings, proportion of average earnings
0
0.25
0.50
0.75
1.00
prop
ortio
n of
net
rep
lace
men
t rat
e
0.5 1.0 1.5 2.0 2.5 3.0individual earnings, proportion of average
Uruguay
Source: Axia Economics APEX model.


187187
13. Middle East and North Africa


189
ALGERIA HAS AN EARNINGS-RELATED PUBLIC SCHEME with a minimum pension that coversboth public and private sectors.
Qualifying Conditions
The normal pension age is 60 for men and 55 for women. The contribution condition is 15 years for men and 10 years for women. Earlier retirement is available for veterans andfor people in arduous or hazardous occupations. The pension age for women is reducedby one year for each child they have raised, to a maximum of three children. Pensionreceipt is subject to a retirement test.
Early retirement is possible at 50 for men and 45 for women, subject to 14 years ofemployment for women and 20 years of employment for men.
Finally, people may retire at any age with 32 years of contributions.
Benefit Calculation
Earnings-RelatedThe accrual rate is 2.5 percent of earnings per year of coverage. The earnings measure isthe final five years of pay. There is no valorization of earlier years’ earnings. There is amaximum replacement rate of 80 percent (achieved after 32 years of contributions).
There is a maximum pension (15 times the minimum wage or DA 150,000) and a ceilingon pensionable earnings.
There is a reduction of 1 percent for each year that the pension is claimed earlier thanthe legal retirement age.
There is a requirement that the value of pensions in payment be reviewed annually, butthere is no formal indexation procedure.
MinimumThere is a minimum pension worth 75 percent of the minimum wage, which in 2002 wasequivalent to DA 7,500 per month.
Personal Income Tax and Social Security Contributions
The income tax schedule is shown below. Employees’ social security contributions aredeductible against the personal income tax. Pension benefits are taxable.
Band lower limit DA 0 10,000 15,000 30,000 70,000 100,000Rate (%) 0 5 10 15 20 25
Total social security contributions are 34.5 percent of gross earnings, of which 25percentage points are paid by employers and the remainder by employees. Of the total
Algeria
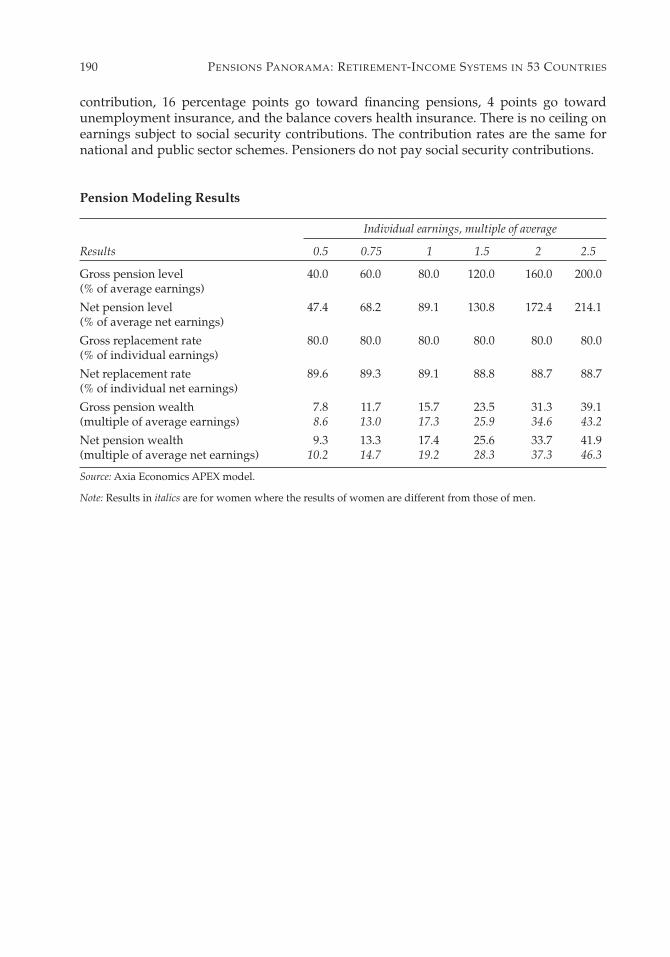
190 PENSIONS PANORAMA: RETIREMENT-INCOME SYSTEMS IN 53 COUNTRIES
contribution, 16 percentage points go toward financing pensions, 4 points go towardunemployment insurance, and the balance covers health insurance. There is no ceiling onearnings subject to social security contributions. The contribution rates are the same fornational and public sector schemes. Pensioners do not pay social security contributions.
Pension Modeling Results
Individual earnings, multiple of average
Results 0.5 0.75 1 1.5 2 2.5
Gross pension level 40.0 60.0 80.0 120.0 160.0 200.0(% of average earnings)
Net pension level 47.4 68.2 89.1 130.8 172.4 214.1(% of average net earnings)
Gross replacement rate 80.0 80.0 80.0 80.0 80.0 80.0(% of individual earnings)
Net replacement rate 89.6 89.3 89.1 88.8 88.7 88.7(% of individual net earnings)
Gross pension wealth 7.8 11.7 15.7 23.5 31.3 39.1(multiple of average earnings) 8.6 13.0 17.3 25.9 34.6 43.2
Net pension wealth 9.3 13.3 17.4 25.6 33.7 41.9(multiple of average net earnings) 10.2 14.7 19.2 28.3 37.3 46.3
Source: Axia Economics APEX model.
Note: Results in italics are for women where the results of women are different from those of men.

a. Gross pension level b. Gross replacement rate
earnings-related minimum earnings-related minimum
c. Gross and net pension levels d. Gross and net replacement rates
net gross net gross
e. Taxes paid by pensioners and workers f. Sources of net replacement rate
worker: total worker: income taxpensioner: total
taxes and contributions earnings-relatedminimum
0
0.5
1.0
1.5
2.0
2.5
gros
s re
lativ
e pe
nsio
n le
vel
0.5 1.0 1.5 2.0 2.5 3.0individual earnings, proportion of average
0
0.25
0.50
0.75
1.00
1.25
gros
s re
plac
emen
t rat
e
0.5 1.0 1.5 2.0 2.5 3.0individual earnings, proportion of average
0
0.5
1.0
1.5
2.0
2.5
net a
nd g
ross
rel
ativ
e pe
nsio
n le
vels
0.5 1.0 1.5 2.0 2.5 3.0individual earnings, proportion of average
0
0.25
0.50
0.75
1.00
1.25
net a
nd g
ross
rep
lace
men
t rat
es
0.5 1.0 1.5 2.0 2.5 3.0individual earnings, proportion of average
0
0.1
0.2
0.3
0.4
0.5
prop
ortio
n of
ear
ning
s an
d in
com
e
0.5 1.0 1.5 2.0 2.5 3.0individual pension and earnings, proportion of average earnings
0
0.25
0.50
0.75
1.00
prop
ortio
n of
net
rep
lace
men
t rat
e
0.5 1.0 1.5 2.0 2.5 3.0individual earnings, proportion of average
Algeria
Source: Axia Economics APEX model.
MIDDLE EAST AND NORTH AFRICA 191

BAHRAIN HAS AN EARNINGS-RELATED SCHEME WITH A MINIMUM PENSION.
Qualifying Conditions
Retirement is possible at different ages depending on the number of years of contribu-tions. The normal pension age in the scheme for private sector workers is 60 for men and55 for women. There is a contribution condition of 15 years for men and 10 years forwomen to retire at the normal pension age. Early retirement is possible from age 45 with 20years of contributions for men and 15 years for women. Pension receipt is subject toretirement from the current job. Earnings plus pension receipt must not exceed previousearnings.
Benefit Calculation
Earnings-RelatedThe pension value is 2.2 percent of earnings for each year of contributions. There is a max-imum replacement rate of 80 percent, normally reached after 36 years’ contributions.
The earnings measure is average pay in the two years before retirement. There is anadditional credit of five years of coverage for retirement after age 60, subject to a maxi-mum accrual of 30 years.
There is no ceiling on pensionable earnings. Pensions in payment are adjusted ad hoc.
MinimumThere is a minimum pension of 150 dinars per month.
Personal Income Tax and Social Security Contributions
There is no personal income tax in Bahrain. Employees contribute 5 percent, and employers contribute 7 percent for pensions.
Employers pay an additional 3 percent for the work-injury scheme. There is no ceiling onearnings subject to contributions. Pensioners do not pay social security contributions.
Bahrain
192

Pension Modeling Results
Individual earnings, multiple of average
Results 0.5 0.75 1 1.5 2 2.5
Gross pension level 42.0 59.4 79.2 118.8 158.4 198.0(% of average earnings) 42.0 57.8 77.0 115.5 154.0 192.5
Net pension level 44.2 62.5 83.4 125.1 166.7 208.4(% of average net earnings) 44.2 60.8 81.1 121.6 162.1 202.6
Gross replacement rate 84.0 79.2 79.2 79.2 79.2 79.2(% of individual earnings) 84.0 77.0 77.0 77.0 77.0 77.0
Net replacement rate 88.4 83.4 83.4 83.4 83.4 83.4(% of individual net earnings) 88.4 81.1 81.1 81.1 81.1 81.1
ross pension wealth 7.7 10.9 14.5 21.7 29.0 36.2(multiple of average earnings) 9.0 12.4 16.5 24.8 33.0 41.3
Net pension wealth 8.1 11.4 15.3 22.9 30.5 38.1(multiple of average net earnings) 9.5 13.0 17.4 26.1 34.8 43.5
Source: Axia Economics APEX model.
Note: Results in italics are for women where the results of women are different from those of men.
MIDDLE EAST AND NORTH AFRICA 193

a. Gross pension level b. Gross replacement rate
earnings-related minimum earnings-related minimum
c. Gross and net pension levels d. Gross and net replacement rates
e. Taxes paid by pensioners and workers d. Sources of net replacement rate
worker: total worker: income tax
pensioner: totaltaxes and contributions earnings-related
minimum
0
0.25
0.50
0.75
1.00
1.25
net a
nd g
ross
rep
lace
men
t rat
es
0.5 1.0 1.5 2.0 2.5 3.0individual earnings, proportion of average
0
0.1
0.2
0.3
0.4
0.5
prop
ortio
n of
ear
ning
s an
d in
com
e
0.5 1.0 1.5 2.0 2.5 3.0individual pension and earnings, proportion of average earnings
0
0.25
0.50
0.75
1.00
prop
ortio
n of
net
rep
lace
men
t rat
e
0.5 1.0 1.5 2.0 2.5 3.0individual earnings, proportion of average
0
0.5
1.0
1.5
2.0
2.5
net a
nd g
ross
rel
ativ
e pe
nsio
n le
vels
0.5 1.0 1.5 2.0 2.5 3.0individual earnings, proportion of average
0
0.25
0.50
0.75
1.00
1.25
gros
s re
plac
emen
t rat
e
0.5 1.0 1.5 2.0 2.5 3.0individual earnings, proportion of average
0
0.5
1.0
1.5
2.0
2.5
gros
s re
lativ
e pe
nsio
n le
vel
0.5 1.0 1.5 2.0 2.5 3.0individual earnings, proportion of average
net gross net gross
Bahrain
Source: Axia Economics APEX model.
194 PENSIONS PANORAMA: RETIREMENT-INCOME SYSTEMS IN 53 COUNTRIES
SEPARATE PROGRAMS COVER PRIVATE AND PUBLIC SECTOR WORKERS, but the parameters andrules have been partially harmonized between the two programs. There is also a minimumpension.
Qualifying Conditions
The normal pension eligibility age under the national scheme is 55 for both men andwomen. The number of years of contributions required has recently been increased. Thus,people born after 1951 need 25 years’ contributions, while those born in 1946 or beforerequire only 15 years’. During the phased introduction of this reform, the number ofcontribution years increases by two years per year. For people not meeting the vestingrequirement, it is intended that they will be able to retire at 55 or later with a reducedpension. However, the regulations have not yet been issued. Retirement on medicalgrounds is possible from age 50.
Benefit Calculation
Earnings-RelatedThe accrual rate has been changed recently and will fall from 2.0 percent (up to the end of2001) to 1.5 percent (2006 onward). In the interim, the accrual rate is 1.8 percent. There is amaximum replacement rate of 81 percent of earnings.
The earnings measure is the average over the last 10 years. There is a legal requirementto valorize earlier years’ earnings according to an index specified by the government.However, again, no regulations have been issued. The modeling therefore assumes thatthese earlier years’ earnings are valorized in line with the growth of average earnings.
There is no ceiling on pensionable earnings.Indexation of pensions in payment is discretionary.
MinimumThere is a minimum pension of DF 170,000 per year.
Personal Income Tax and Social Security Contributions
Pension contributions are deductible against the personal income tax. Pensions in pay-ment are taxable. For incomes between DF 25,000 and DF 30,000 per year, the tax liabilityis DF 500. Thereafter, there is a schedule as follows:
Band lower limit DF (000s) 30 50 150 600Rate (%) 15 18 20 30
Djibouti
195

196 PENSIONS PANORAMA: RETIREMENT-INCOME SYSTEMS IN 53 COUNTRIES
For private sector employees, total contributions are 19.7 percent of earnings, of which 8percentage points are for pensions. These contributions are split 50–50 between employeesand their employers. Pensioners do not pay social security contributions.
Pension Modeling Results
Individual earnings, multiple of average
Results 0.5 0.75 1 1.5 2 2.5
Gross pension level 21.3 28.1 37.5 56.3 75.0 93.8(% of average earnings)
Net pension level 25.3 32.9 43.4 64.3 85.2 103.5(% of average net earnings)
Gross replacement rate 42.5 37.5 37.5 37.5 37.5 37.5(% of individual earnings)
Net replacement rate 48.7 42.8 43.4 44.7 45.3 44.6(% of individual net earnings)
Gross pension wealth 4.2 5.6 7.4 11.1 14.8 18.5(multiple of average earnings) 4.4 5.8 7.8 11.7 15.6 19.5
Net pension wealth 5.0 6.5 8.6 12.7 16.8 20.4(multiple of average net earnings) 5.2 6.8 9.0 13.4 17.7 21.5
Source: Axia Economics APEX model.
Note: Results in italics are for women where the results of women are different from those of men.

MIDDLE EAST AND NORTH AFRICA 197
a. Gross pension level b. Gross replacement rate
earnings-related minimum earnings-related minimum
c. Gross and net pension levels d. Gross and net replacement rates
net gross net gross
e. Taxes paid by pensioners and workers f. Sources of net replacement rate
worker: total worker: income tax
pensioner: totaltaxes and contributions earnings-relatedminimum
0
0.5
1.0
1.5
2.0
2.5
gros
s re
lativ
e pe
nsio
n le
vel
0.5 1.0 1.5 2.0 2.5 3.0individual earnings, proportion of average
0
0.25
0.50
0.75
1.00
1.25
gros
s re
plac
emen
t rat
e
0.5 1.0 1.5 2.0 2.5 3.0individual earnings, proportion of average
0
0.5
1.0
1.5
2.0
2.5
net a
nd g
ross
rel
ativ
e pe
nsio
n le
vels
0.5 1.0 1.5 2.0 2.5 3.0individual earnings, proportion of average
0
0.25
0.50
0.75
1.00
1.25
net a
nd g
ross
rep
lace
men
t rat
es
0.5 1.0 1.5 2.0 2.5 3.0individual earnings, proportion of average
0
0.1
0.2
0.3
0.4
0.5
prop
ortio
n of
ear
ning
s an
d in
com
e
0.5 1.0 1.5 2.0 2.5 3.0individual pension and earnings, proportion of average earnings
0
0.25
0.50
0.75
1.00
prop
ortio
n of
net
rep
lace
men
t rat
e
0.5 1.0 1.5 2.0 2.5 3.0individual earnings, proportion of average
Djibouti
Source: Axia Economics APEX model.

EGYPT HAS AN EARNINGS-RELATED SCHEME that covers both public and private sectorsalong with a minimum pension.
Qualifying Conditions
The basic wage pension is available from age 60 subject to 120 months (10 years) ofcontributions. Early retirement is possible at any age when 20 years of contributions arereached, subject to an actuarial decrement. These qualifying conditions also apply to thevariable wage pension. Lump-sum payouts are made at age 60 to people who do not qualifyfor the pension.
Benefit Calculation
Earnings-RelatedThe basic wage pension covers earnings up to LE 8,100 per year. The pension is 1/45th (2.2 percent) of earnings, with higher accrual rates for periods in arduous or hazardouswork. The earnings measure is the average pay in the last two years. Maximum coverageis 36 years, giving a maximum replacement rate of 80 percent. (Contribution years beyond36 earn a lump sum of 15 percent of basic wage.) There is an additional bonus of 25 percentof the basic wage pension, subject to a minimum of LE 20 and a maximum of LE 35 permonth. Early retirement, conditional on 20 years’ contributions, is subject to adjustments:
Pension age <45 45–49 50–54 55+Reduction (%) 15 10 5 0
The variable wage pension covers earnings above LE 8,100 per year and variable remu-neration, such as bonuses and commissions, up to LE 6,000 per year. This gives an overallceiling of LE 14,100 per year. The accrual rate is 1/45th of earnings. However, the earn-ings measure is the lifetime average of nominal earnings. For variable wage pensionsclaimed before age 60, the pension is reduced by 5 percent per year. The earnings measureis increased by 2 percent per year of contributions (an ad hoc alternative to valorization).At baseline assumptions for price and earnings growth, this reduces pensions to 66 percentof their value under a policy of full valorization to earnings. There is no legal require-ment to adjust pensions in payment, but the basic wage pension is increased annually.Recent rises were 20 percent in 1987, 15 percent per annum in 1988–91, 20 percent in 1992, and10 percent per annum in 1993–2004.
MinimumThe minimum pension is LE 105 per month for civil servants and LE 45 per month forothers (covering both basic and variable wage pensions). The minimum is not reduced forearly retirement. The maximum pension is LE 900 per month.
The Arab Republic of Egypt
198

Personal Income Tax and Social Security Contributions
Pensions are not subject to personal income tax. There is a general deduction of LE 2,000 peryear for single taxpayers plus an additional allowance of LE 2,000 per year, for earnings.The schedule applied after these allowances is
Band lower limit (LE) 0 2,500 7,000 16,000Rate (%) 20 27 35 40
Contributions for pensions by employees are 12 percent of basic wages and 10 percentof variable wages. For employers, the rates are 18 and 15 percent, respectively. Employeesocial security contributions are deductible under the personal income tax. The govern-ment contributes 1 percent of payroll and covers any deficit. Pensioners do not pay socialsecurity contributions.
Pension Modeling Results
Individual earnings, multiple of average
Results 0.5 0.75 1 1.5 2 2.5
Gross pension level 45.3 65.3 85.3 112.8 127.1 127.1(% of average earnings)
Net pension level 63.6 91.7 119.8 158.5 178.6 178.6(% of average net earnings)
Gross replacement rate 90.5 87.0 85.3 75.2 63.6 50.9(% of individual earnings)
Net replacement rate 117.5 118.3 119.8 104.8 90.5 73.5(% of individual net earnings)
Gross pension wealth 7.8 11.3 14.7 19.5 21.9 21.9(multiple of average earnings) 8.7 12.5 16.4 21.7 24.4 24.4
Net pension wealth 11.0 15.8 20.7 27.4 30.8 30.8(multiple of average net earnings) 12.2 17.6 23.0 30.4 34.3 34.3
Source: Axia Economics APEX model.
Note: Results in italics are for women where the results of women are different from those of men.
MIDDLE EAST AND NORTH AFRICA 199

a. Gross pension level b. Gross replacement rate
variable-wage basic-wagebonus
variable-wage basic-wagebonus
c. Gross and net pension levels d. Gross and net replacement rates
net gross net gross
e. Taxes paid by pensioners and workers f. Sources of net replacement rate
worker: total worker: income taxpensioner: total
taxes and contributions variable-wagebasic-wage bonus
0
0.5
1.0
1.5
2.0
2.5
gros
s re
lativ
e pe
nsio
n le
vel
0.5 1.0 1.5 2.0 2.5 3.0individual earnings, proportion of average
0
0.25
0.50
0.75
1.00
1.25
gros
s re
plac
emen
t rat
e
0.5 1.0 1.5 2.0 2.5 3.0individual earnings, proportion of average
0
0.5
1.0
1.5
2.0
2.5
net a
nd g
ross
rel
ativ
e pe
nsio
n le
vels
0.5 1.0 1.5 2.0 2.5 3.0individual earnings, proportion of average
0
0.25
0.50
0.75
1.00
1.25
net a
nd g
ross
rep
lace
men
t rat
es
0.5 1.0 1.5 2.0 2.5 3.0individual earnings, proportion of average
0
0.1
0.2
0.3
0.4
0.5
prop
ortio
n of
ear
ning
s an
d in
com
e
0.5 1.0 1.5 2.0 2.5 3.0individual pension and earnings, proportion of average earnings
0
0.25
0.50
0.75
1.00
prop
ortio
n of
net
rep
lace
men
t rat
e
0.5 1.0 1.5 2.0 2.5 3.0individual earnings, proportion of average
The Arab Republic of Egypt
Source: Axia Economics APEX model.
200 PENSIONS PANORAMA: RETIREMENT-INCOME SYSTEMS IN 53 COUNTRIES

201
THE ISLAMIC REPUBLIC OF IRAN HAS AN EARNINGS-RELATED public scheme with a minimumpension.
Qualifying Conditions
Under the national scheme, the pension may be claimed at any age once 30 years’ contri-butions have accrued. With fewer years’ contributions, the pension may be claimed at 60 bymen and 55 by women, subject to a minimum of 10 years’ contributions. For 20–25 years’coverage in a hazardous or arduous occupation, the pension age is 50 for men and 45 forwomen. Pension receipt is subject to a retirement test.
Benefit Calculation
Earnings-RelatedPension accrues at 3.3 percent of earnings per year of contributions. There is a minimumreplacement rate of 50 percent (normally reached at 15 years) and a maximum of 116 percent(reached after 35 years). The earnings measure in the benefit formula is the pay in the finaltwo years before retirement without adjustment for price inflation or earnings growth.
There is a ceiling on covered earnings of eight times average earnings. Indexation of pensions in payment is discretionary.
MinimumThere is also a minimum pension amount equal to the minimum wage, which is approxi-mately two-thirds of average earnings or 850,000 rials.
Personal Income Tax and Social Security Contributions
There is a general income tax allowance of 19.2 million rials. Income above this level istaxed at a 10 percent rate. Social security contributions are not deductible for income taxpurposes. Pensions in payment are not subject to tax.
Under the national scheme, employees pay 7 percent of earnings, and employers, 20percent for pensions. Employers also pay an additional 3 percent of earnings for unem-ployment benefits. The government contributes 3 percent of earnings. There is a floor(equal to the minimum wage of 696,460 rials) and a ceiling (of 2,507,400 rials) on bothcontributions and pensionable earnings.
The Islamic Republic of Iran

Pension Modeling Results
Individual earnings, multiple of average
Results 0.5 0.75 1 1.5 2 2.5
Gross pension level 66.0 86.6 115.5 173.3 231.0 250.0(% of average earnings)
Net pension level 71.0 93.1 124.2 186.3 248.4 310.5(% of average net earnings)
Gross replacement rate 132.0 115.5 115.5 115.5 115.5 115.5(% of individual earnings)
Net replacement rate 141.9 124.2 124.2 126.5 129.5 131.3(% of individual net earnings)
Gross pension wealth 12.0 15.7 20.9 31.4 41.8 52.3(multiple of average earnings) 13.2 17.3 23.1 34.6 46.1 57.6
Net pension wealth 12.9 16.9 22.5 33.7 45.0 56.2(multiple of average net earnings) 14.2 18.6 24.8 37.2 49.6 62.0
Source: Axia Economics APEX model.
Note: Results in italics are for women where the results of women are different from those of men.
202 PENSIONS PANORAMA: RETIREMENT-INCOME SYSTEMS IN 53 COUNTRIES

MIDDLE EAST AND NORTH AFRICA 203
a. Gross pension level b. Gross replacement rate
earnings-related minimum earnings-related minimum
c. Gross and net pension levels d. Gross and net replacement rates
net gross net gross
e. Taxes paid by pensioners and workers f. Sources of net replacement rate
worker: total worker: income tax
pensioner: totaltaxes and contributions earnings-relatedminimum
0
0.5
1.0
1.5
2.0
2.5
gros
s re
lativ
e pe
nsio
n le
vel
0.5 1.0 1.5 2.0 2.5 3.0individual earnings, proportion of average
0
0.25
0.50
0.75
1.00
1.25
gros
s re
plac
emen
t rat
e
0.5 1.0 1.5 2.0 2.5 3.0individual earnings, proportion of average
0
0.5
1.0
1.5
2.0
2.5
net a
nd g
ross
rel
ativ
e pe
nsio
n le
vels
0.5 1.0 1.5 2.0 2.5 3.0
individual earnings, proportion of average
0
0.25
0.50
0.75
1.00
1.25
net a
nd g
ross
rep
lace
men
t rat
es
0.5 1.0 1.5 2.0 2.5 3.0
individual earnings, proportion of average
0
0.1
0.2
0.3
0.4
0.5
prop
ortio
n of
ear
ning
s an
d in
com
e
0.5 1.0 1.5 2.0 2.5 3.0individual pension and earnings, proportion of average earnings
0
0.25
0.50
0.75
1.00
prop
ortio
n of
net
rep
lace
men
t rat
e
0.5 1.0 1.5 2.0 2.5 3.0individual earnings, proportion of average
The Islamic Republic of Iran
Source: Axia Economics APEX model.

JORDAN HAS AN EARNINGS-RELATED PUBLIC SCHEME WITH A MINIMUM PENSION. The separateschemes for public sector workers are closed to new entrants who are covered by thenational scheme.
Qualifying Conditions
The normal pension age is 60 for men and 55 for women, subject to 180 months (15 years)of coverage or 60 months (five years) of actual contributions. An early pension may beclaimed from age 45 with 18 years’ contributions (men) or 15 years’ (women). People withincomplete contribution histories may pay between the normal pension age and 65 or 60(men or women) to complete their record, provided they have already reached 10 years’coverage. There is provision for lump-sum payments for people who do not qualify for apension. Early pensions are subject to an actuarial reduction (see below).
Benefit Calculation
Earnings-RelatedPension accrues at 2.5 percent of earnings per year of contributions. The earnings measureis average (nominal) pay in the last two years before retirement. The earnings measure isadjusted upward to 1.2 times initial earnings (if final pay is below this level) and downwardto 1.6 times initial earnings (if it exceeds this ceiling). There is a maximum replacementrate of 75 percent, normally reached after 30 years’ contributions. There is a reduction forearly retirement, which for women is
Pension age 45–49 50–54 55+Reduction (%) 10 5 0
For men the reductions are larger:
Pension age 45–46 47 48 49 50–60Reduction (%) 18 16 14 12 1 per year
Both pensions in payment and the value of the minimum pension are subject to dis-cretionary uprating: there is no automatic indexation procedure. There is no ceiling onpensionable earnings.
MinimumThere is a minimum pension that is equal to the minimum wage, 960 dinars per year in2003.
Jordan
204

MIDDLE EAST AND NORTH AFRICA 205
Personal Income Tax and Social Security Contributions
Employee social security contributions are deductible against the personal income tax.Pensions in payment are not subject to tax. There is no general allowance or basic relief,and the income tax schedule is as follows:
Band lower limit (dinars) 0 2,000 6,000 12,000Rate (%) 5 10 20 25
For pensions, employees contribute 5.5 percent and employers, 7.0 percent. Employerspay 2.0 percent for the work-injury program.
Pension Modeling Results
Individual earnings, multiple of average
Results 0.5 0.75 1 1.5 2 2.5
Gross pension level 34.8 50.6 67.5 101.3 135.0 168.8(% of average earnings) 35.6 53.4 71.3 106.9 142.5 178.1
Net pension level 39.2 57.1 76.1 114.2 152.2 190.3(% of average net earnings) 40.2 60.3 80.4 120.5 160.7 200.9
Gross replacement rate 69.6 67.5 67.5 67.5 67.5 67.5(% of individual earnings) 71.3 71.3 71.3 71.3 71.3 71.3
Net replacement rate 77.5 75.2 76.1 77.2 77.7 78.7(% of individual net earnings) 79.4 79.4 80.4 81.5 82.0 83.1
ross pension wealth 7.3 10.7 14.2 21.4 28.5 35.6(multiple of average earnings) 8.2 12.4 16.5 24.7 32.9 41.2
Net pension wealth 8.3 12.0 16.1 24.1 32.1 40.2(multiple of average net earnings) 9.3 13.9 18.6 27.9 37.1 46.4
Source: Axia Economics APEX model.
Note: Results in italics are for women where the results of women are different from those of men.
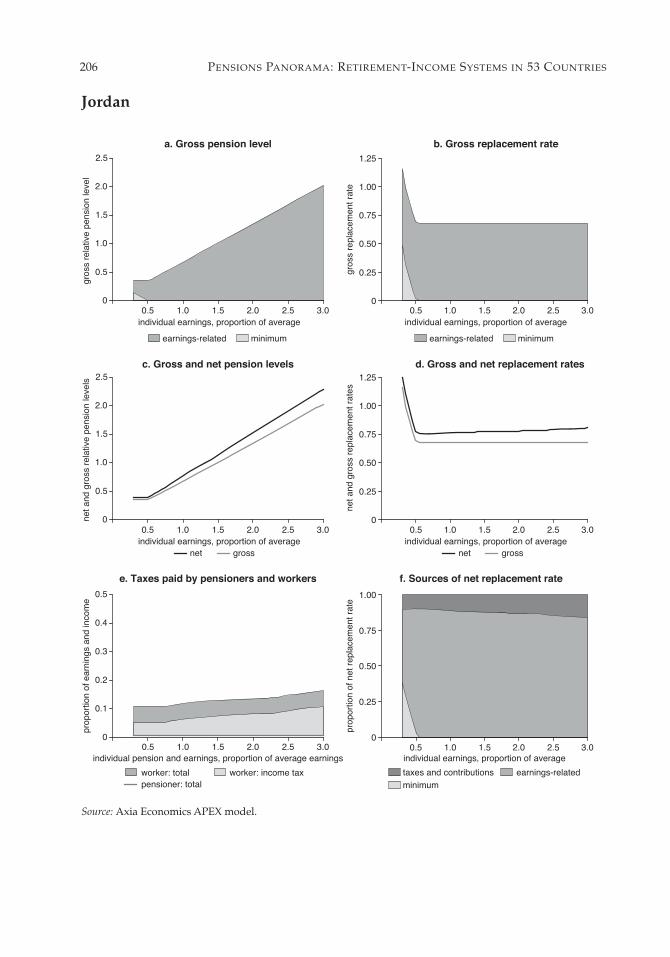
a. Gross pension level b. Gross replacement rate
earnings-related minimum earnings-related minimum
c. Gross and net pension levels d. Gross and net replacement rates
net gross net gross
e. Taxes paid by pensioners and workers f. Sources of net replacement rate
worker: total worker: income taxpensioner: total
taxes and contributions earnings-relatedminimum
0
0.5
1.0
1.5
2.0
2.5
gros
s re
lativ
e pe
nsio
n le
vel
0.5 1.0 1.5 2.0 2.5 3.0individual earnings, proportion of average
0
0.25
0.50
0.75
1.00
1.25
gros
s re
plac
emen
t rat
e
0.5 1.0 1.5 2.0 2.5 3.0individual earnings, proportion of average
0
0.5
1.0
1.5
2.0
2.5
net a
nd g
ross
rel
ativ
e pe
nsio
n le
vels
0.5 1.0 1.5 2.0 2.5 3.0individual earnings, proportion of average
0
0.25
0.50
0.75
1.00
1.25
net a
nd g
ross
rep
lace
men
t rat
es
0.5 1.0 1.5 2.0 2.5 3.0individual earnings, proportion of average
0
0.1
0.2
0.3
0.4
0.5
prop
ortio
n of
ear
ning
s an
d in
com
e
0.5 1.0 1.5 2.0 2.5 3.0individual pension and earnings, proportion of average earnings
0
0.25
0.50
0.75
1.00
prop
ortio
n of
net
rep
lace
men
t rat
e
0.5 1.0 1.5 2.0 2.5 3.0individual earnings, proportion of average
Jordan
Source: Axia Economics APEX model.
206 PENSIONS PANORAMA: RETIREMENT-INCOME SYSTEMS IN 53 COUNTRIES

LIBYA HAS AN EARNINGS-RELATED PUBLIC SCHEME WITH A MINIMUM PENSION.
Qualifying Conditions
The normal pension age is 65 for men and 60 for women. Vesting is immediate: there is norequirement for minimum years of contributions. Early retirement is possible from age 62for men in the private sector.
Benefit Calculation
Earnings-RelatedThe accrual rate is 2.5 percent per year for the first 20 years and 2.0 percent thereafter to amaximum replacement rate of 80 percent, normally reached after 35 years’ contributions.There is no actuarial adjustment for early retirement. The earnings measure is the averageover the final three years. There is no ceiling on pensionable earnings. There is no legalrequirement to adjust the value of pensions in payment.
MinimumThere is a minimum pension of 80 percent of the minimum wage. The latter is 85 dinarsper month, giving a minimum pension of 68 dinars per month.
Personal Income Tax and Social Security Contributions
There is a general personal allowance in the income tax, which is 480 dinars for a singleperson (higher for married people and for those with children). The rate schedule after thisallowance is as follows:
Band lower limit (dinars) 0 1,800 3,000 4,800 6,600 8,400Rate (%) 8 10 15 20 25 35
There is an additional Jihad tax on taxable incomes. This has three rates (1, 2, and 3percent). Pensioners are not subject to income tax.
The total contribution for social security programs is 15 percent of gross earnings. Theemployee pays 25 percent of this total; the employer, 70 percent; and the government,the balance of 5 percent. Of the 15.0 percentage-point total, 10.5 percentage points financepensions, with the remainder going to other programs. Pensioners do not pay socialsecurity contributions.
Libya
207

208 PENSIONS PANORAMA: RETIREMENT-INCOME SYSTEMS IN 53 COUNTRIES
Pension Modeling Results
Individual earnings, multiple of average
Results 0.5 0.75 1 1.5 2 2.5
Gross pension level 40.0 60.0 80.0 120.0 160.0 200.0(% of average earnings)
Net pension level 45.6 68.4 91.2 136.8 182.4 228.0(% of average net earnings)
Gross replacement rate 80.0 80.0 80.0 80.0 80.0 80.0(% of individual earnings)
Net replacement rate 89.0 90.2 91.2 93.6 96.1 98.8(% of individual net earnings)
Gross pension wealth 5.6 8.4 11.2 16.9 22.5 28.1(multiple of average earnings) 7.7 11.6 15.5 23.2 30.9 38.6
Net pension wealth 7.4 11.2 14.9 22.3 29.8 37.2(multiple of average net earnings) 10.2 15.5 20.6 30.6 40.9 51.1
Source: Axia Economics APEX model.
Note: Results in italics are for women where the results of women are different from those of men.

a. Gross pension level b. Gross replacement rate
earnings-related minimum earnings-related minimum
c. Gross and net pension levels d. Gross and net replacement rates
net gross net gross
e. Taxes paid by pensioners and workers f. Sources of net replacement rate
worker: total worker: income taxpensioner: total
taxes and contributions earnings-relatedminimum
0
0.5
1.0
1.5
2.0
2.5
gros
s re
lativ
e pe
nsio
n le
vel
0.5 1.0 1.5 2.0 2.5 3.0individual earnings, proportion of average
0
0.25
0.50
0.75
1.00
1.25
gros
s re
plac
emen
t rat
e
0.5 1.0 1.5 2.0 2.5 3.0individual earnings, proportion of average
0
0.5
1.0
1.5
2.0
2.5
net a
nd g
ross
rel
ativ
e pe
nsio
n le
vels
0.5 1.0 1.5 2.0 2.5 3.0individual earnings, proportion of average
0
0.25
0.50
0.75
1.00
1.25
net a
nd g
ross
rep
lace
men
t rat
es
0.5 1.0 1.5 2.0 2.5 3.0individual earnings, proportion of average
0
0.1
0.2
0.3
0.4
0.5
prop
ortio
n of
ear
ning
s an
d in
com
e
0.5 1.0 1.5 2.0 2.5 3.0individual pension and earnings, proportion of average earnings
0
0.25
0.50
0.75
1.00
prop
ortio
n of
net
rep
lace
men
t rat
e
0.5 1.0 1.5 2.0 2.5 3.0individual earnings, proportion of average
Libya
Source: Axia Economics APEX model.
MIDDLE EAST AND NORTH AFRICA 209
MOROCCO HAS AN EARNINGS-RELATED NATIONAL SCHEME WITH A MINIMUM PENSION. Threeseparate schemes cover civil servants, the military, and contractual, public-sector workers.
Qualifying Conditions
The pension-eligibility age under both national and civil service schemes is 60 for bothmen and women.
Early retirement is possible at age 55, but the employer must pay the pension betweenages 55 and 60. (This early pension, since it requires employers to provide voluntarily thepension, is not modeled.) There is also a lower pension-eligibility age for miners under thenational program. Pension receipt is subject to a retirement test. The qualifying contribu-tion period for a pension is 3,240 days of contributions. Based on the 216 days, which qual-ify as a single year for contribution purposes (see below), this is equivalent to a 15-yearvesting period.
Benefit Calculation
Earnings-RelatedThe pension is 50 percent of earnings once the contribution condition is met plus 1 percentof earnings for each 216 days above the minimum. This implies an accrual rate of 3.33 percentfor the first 15 years of coverage. There is a maximum replacement rate of 70 percent,which is reached after 35 years’ contributions. The earnings measure is the average payduring the last three or five years, whichever is higher. There is no valorization of earlieryears’ earnings. The ceiling on pensionable earnings is 6,000 dirhams per month. Pensionsin payment are adjusted periodically. However, there is no formal indexation policy.
MinimumThere is a minimum pension of 500 dirhams per month.
Personal Income Tax and Social Security Contributions
Social security contributions are deductible against the personal income tax. There is ageneral relief against earned income, meaning that only 83 percent of wages are subject tothe income tax. Similarly, only 60 percent of pension income is taxable. The personalincome tax schedule is
Band lower limit (dirhams) 0 20,000 24,000 30,000 60,000Rate (%) 0 13 21 25 44
The total contribution for the private sector pension scheme is 20.39 percent, of which11.89 percent goes toward pensions. Of the total, 16.10 points are paid by the employer,and 4.29 points, by the employee. Pensioners do not pay social security contributions.
Morocco
210

MIDDLE EAST AND NORTH AFRICA 211
Pension Modeling Results
Individual earnings, multiple of average
Results 0.5 0.75 1 1.5 2 2.5
Gross pension level 35.0 52.5 70.0 105.0 140.0 152.6(% of average earnings)
Net pension level 37.5 56.2 74.1 107.0 138.9 150.4(% of average net earnings)
Gross replacement rate 70.0 70.0 70.0 70.0 70.0 61.1(% of individual earnings)
Net replacement rate 72.6 72.6 74.1 75.2 75.8 68.1(% of individual net earnings)
Gross pension wealth 5.1 7.7 10.3 15.4 20.5 22.4(multiple of average earnings) 6.7 10.1 13.5 20.2 26.9 29.4
Net pension wealth 5.5 8.2 10.9 15.7 20.4 22.0(multiple of average net earnings) 7.2 10.8 14.3 20.6 26.7 28.9
Source: Axia Economics APEX model.
Note: Results in italics are for women where the results of women are different from those of men.

Morocco
Source: Axia Economics APEX model.
a. Gross pension level b. Gross replacement rate
earnings-related earnings-related
c. Gross and net pension levels d. Gross and net replacement rates
net gross net gross
e. Taxes paid by pensioners and workers f. Sources of net replacement rate
worker: total worker: income taxpensioner: total
taxes and contributions earnings-relatedminimum
0
0.5
1.0
1.5
2.0
2.5
gros
s re
lativ
e pe
nsio
n le
vel
0.5 1.0 1.5 2.0 2.5 3.0individual earnings, proportion of average
0
0.25
0.50
0.75
1.00
1.25
gros
s re
plac
emen
t rat
e
0.5 1.0 1.5 2.0 2.5 3.0individual earnings, proportion of average
0
0.5
1.0
1.5
2.0
2.5
net a
nd g
ross
rel
ativ
e pe
nsio
n le
vels
0.5 1.0 1.5 2.0 2.5 3.0individual earnings, proportion of average
0
0.25
0.50
0.75
1.00
1.25
net a
nd g
ross
rep
lace
men
t rat
es
0.5 1.0 1.5 2.0 2.5 3.0individual earnings, proportion of average
0
0.1
0.2
0.3
0.4
0.5
prop
ortio
n of
ear
ning
s an
d in
com
e
0.5 1.0 1.5 2.0 2.5 3.0individual pension and earnings, proportion of average earnings
0
0.25
0.50
0.75
1.00
prop
ortio
n of
net
rep
lace
men
t rat
e
0.5 1.0 1.5 2.0 2.5 3.0individual earnings, proportion of average
212 PENSIONS PANORAMA: RETIREMENT-INCOME SYSTEMS IN 53 COUNTRIES

213
TUNISIA HAS ONE PUBLIC SECTOR AND FOUR PRIVATE SECTOR SCHEMES with earnings-relatedpensions plus a minimum pension.
Qualifying Conditions
The normal pension age in the national scheme is 60, subject to 120 months (10 years) ofcontributions for the full benefit. Retirement at 50 is possible for people in arduousoccupations, subject to unemployment conditions, or mothers of three or more children.Other workers may also retire at 50 if they have 360 months (30 years) of contributions. A proportionally reduced pension is paid to people with between 60 and 120 months ofcoverage (that is, at least five years). There are lump-sum payments for workers withfewer than 60 months’ (five years’) contributions at age 60 or above.
Benefit Calculation
Earnings-RelatedThe pension value is 40 percent of earnings plus 0.5 percent for each quarter of contribu-tions beyond 120 months (10 years), equivalent to an accrual rate of 4 percent per year forthe first 10 years and 2 percent per year thereafter. The earnings measure is the averageover the final 10 years, valorized in line with price inflation. There is a maximum replace-ment rate of 80 percent, normally reached after 30 years’ contributions. The maximumpension is six times the minimum wage, which is 13,236 dinars per year. Early pensionsare subject to an actuarial reduction of 0.5 percent per quarter that the pension is paidbefore age 60. The proportionally reduced partial pension has a minimum pension of halfof the minimum wage, giving a value of 1,103 dinars. Pensions in payment are indexed tothe minimum wage, which is assumed to increase in line with average earnings.
MinimumThere is a minimum pension of two-thirds of the minimum wage relevant to workers cov-ered by this scheme. The latter was 2,206 dinars per year, giving a minimum pension of1,470 dinars.
Personal Income Tax and Social Security Contributions
Pension benefits are subject to tax, but there is an abatement of 25 percent. Social securitycontributions are deductible under the personal income tax. Furthermore, 10 percent ofearnings are exempted from tax. The income tax schedule is
Tunisia

214 PENSIONS PANORAMA: RETIREMENT-INCOME SYSTEMS IN 53 COUNTRIES
Band lower limit (dinars) 0 1,500 5,000 10,000 20,000 50,000Rate (%) 0 15 20 25 30 35
In the private sector scheme, contributions total 12.50 percent of gross earnings, of whichthe employer pays 9.75 percent and the employee, 2.75 percent. Pensioners do not paysocial security contributions.
Pension Modeling Results
Individual earnings, multiple of average
Results 0.5 0.75 1 1.5 2 2.5
Gross pension level 32.0 48.0 64.0 96.0 128.0 160.0(% of average earnings)
Net pension level 38.3 55.5 72.7 107.0 139.9 172.8(% of average net earnings)
Gross replacement rate 64.0 64.0 64.0 64.0 64.0 64.0(% of individual earnings)
Net replacement rate 73.1 72.8 72.7 73.5 73.4 73.9(% of individual net earnings)
Gross pension wealth 9.0 13.5 18.0 27.0 36.0 45.0(multiple of average earnings) 11.3 17.0 22.7 34.0 45.4 56.7
Net pension wealth 10.8 15.6 20.4 30.1 39.3 48.6(multiple of average net earnings) 13.6 19.7 25.7 37.9 49.6 61.3
Source: Axia Economics APEX model.
Note: Results in italics are for women where the results of women are different from those of men.

Tunisia
Source: Axia Economics APEX model.
a. Gross pension level b. Gross replacement rate
earnings-related minimum earnings-related minimum
c. Gross and net pension levels d. Gross and net replacement rates
net gross net gross
e. Taxes paid by pensioners and workers f. Sources of net replacement rate
worker: total worker: income taxpensioner: total
taxes and contributions earnings-relatedminimum
0
0.5
1.0
1.5
2.0
2.5
gros
s re
lativ
e pe
nsio
n le
vel
0.5 1.0 1.5 2.0 2.5 3.0individual earnings, proportion of average
0
0.25
0.50
0.75
1.00
1.25
gros
s re
plac
emen
t rat
e
0.5 1.0 1.5 2.0 2.5 3.0individual earnings, proportion of average
0
0.5
1.0
1.5
2.0
2.5
net a
nd g
ross
rel
ativ
e pe
nsio
n le
vels
0.5 1.0 1.5 2.0 2.5 3.0individual earnings, proportion of average
0
0.25
0.50
0.75
1.00
1.25
net a
nd g
ross
rep
lace
men
t rat
es
0.5 1.0 1.5 2.0 2.5 3.0individual earnings, proportion of average
0
0.1
0.2
0.3
0.4
0.5
prop
ortio
n of
ear
ning
s an
d in
com
e
0.5 1.0 1.5 2.0 2.5 3.0individual pension and earnings, proportion of average earnings
0
0.25
0.50
0.75
1.00
prop
ortio
n of
net
rep
lace
men
t rat
e
0.5 1.0 1.5 2.0 2.5 3.0individual earnings, proportion of average
MIDDLE EAST AND NORTH AFRICA 215

THE REPUBLIC OF YEMEN HAS AN EARNINGS-RELATED NATIONAL SCHEME with separateprograms for civil servants and the uniformed services.
Qualifying Conditions
The pension under the national scheme may be claimed at any age once 30 years’ contri-butions have accrued for men and 25 years’ for women. For 25 years’ contributions, thepension age is 50 for men. For 20 years’ contributions, women may retire at age 46. With 15 years’ contributions, the pension may be claimed at 60 by men and 55 by women.
Benefit Calculation
Earnings-RelatedThe accrual rate is 2.5 percent of earnings for each year of service. There is a maximumreplacement rate of 100 percent. The earnings measure is the average pay over the final twoyears. There is no minimum pension under this scheme. There is no ceiling on pensionableearnings. There is no legal requirement to adjust the value of pensions in payment.
Personal Income Tax and Social Security Contributions
Pension benefits are subject to tax. Social security contributions are deductible against thepersonal income tax. This is the income tax schedule:
Band lower limit (rials) 0 3,000 7,000 22,000Rate (%) 0 10 15 20
In the national pension program, employers contribute 9 percent of earnings forpensions, and employees pay 6 percent. Employers pay an additional 4 percent for thework-injury plan. Pensioners are not liable for social security contributions.
The Republic of Yemen
216

MIDDLE EAST AND NORTH AFRICA 217
Pension Modeling Results
Individual earnings, multiple of average
Results 0.5 0.75 1 1.5 2 2.5
Gross pension level 50.0 75.0 100.0 150.0 200.0 250.0(% of average earnings) 43.8 65.6 87.5 131.3 175.0 218.8
Net pension level 53.9 80.1 106.3 158.7 211.1 263.5(% of average net earnings) 47.3 70.3 93.2 139.0 184.9 230.8
Gross replacement rate 100.0 100.0 100.0 100.0 100.0 100.0(% of individual earnings) 87.5 87.5 87.5 87.5 87.5 87.5
Net replacement rate 106.2 106.3 106.3 106.3 106.3 106.3(% of individual net earnings) 93.3 93.2 93.2 93.2 93.1 93.1
Gross pension wealth 6.7 10.0 13.4 20.1 26.8 33.5(multiple of average earnings) 7.6 11.4 15.2 22.9 30.5 38.1
Net pension wealth 7.2 10.7 14.2 21.2 28.3 35.3(multiple of average net earnings) 8.2 12.2 16.2 24.2 32.2 40.2
Source: Axia Economics APEX model.
Note: Results in italics are for women where the results of women are different from those of men.

218 PENSIONS PANORAMA: RETIREMENT-INCOME SYSTEMS IN 53 COUNTRIES
a. Gross pension level b. Gross replacement rate
earnings-related earnings-related
c. Gross and net pension levels d. Gross and net replacement rates
net gross net gross
e. Taxes paid by pensioners and workers f. Sources of net replacement rate
worker: total worker: income taxpensioner: total
taxes and contributions earnings-related
0
0.5
1.0
1.5
2.0
2.5
gros
s re
lativ
e pe
nsio
n le
vel
0.5 1.0 1.5 2.0 2.5 3.0individual earnings, proportion of average
0
0.25
0.50
0.75
1.00
1.25
gros
s re
plac
emen
t rat
e
0.5 1.0 1.5 2.0 2.5 3.0individual earnings, proportion of average
0
0.5
1.0
1.5
2.0
2.5
net a
nd g
ross
rel
ativ
e pe
nsio
n le
vels
0.5 1.0 1.5 2.0 2.5 3.0individual earnings, proportion of average
0
0.25
0.50
0.75
1.00
1.25
net a
nd g
ross
rep
lace
men
t rat
es
0.5 1.0 1.5 2.0 2.5 3.0individual earnings, proportion of average
0
0.1
0.2
0.3
0.4
0.5
prop
ortio
n of
ear
ning
s an
d in
com
e
0.5 1.0 1.5 2.0 2.5 3.0individual pension and earnings, proportion of average earnings
0
0.25
0.50
0.75
1.00
prop
ortio
n of
net
rep
lace
men
t rat
e
0.5 1.0 1.5 2.0 2.5 3.0individual earnings, proportion of average
The Republic of Yemen
Source: Axia Economics APEX model.

219
Keenay, G., and E. R. Whitehouse. 2002a. “Taxing Pensioners.” In Taxing Wages. Paris:OECD. 2003.
———. 2002b. “The Role of the Personal Tax System in Old-Age Support: A Survey of 15Countries.” Discussion Paper 02/07, Centre for Pensions and Superannuation, Uni-versity of New South Wales, Sydney.
———. 2003a. “Financial Resources and Retirement in Nine OECD Countries: The Role ofthe Tax System.” Social, Employment, and Migration Working Paper 8, OECD, Paris.
———. 2003b. “The Role of the Personal Tax System in Old-Age Support: A Survey of 15Countries.” Fiscal Studies 24 (1): 1–21.
Mattil, B., and E. R. Whitehouse. Forthcoming. “Individual Incentives to Switch betweenPublic and Private Pension Schemes.” Social, Employment, and Migration WorkingPaper, OECD, Paris.
OECD (Organisation for Economic Co-operation and Development). 2003. Taxing Wages.Paris: OECD.
———. 2005. Pensions at a Glance: Public Policies across OECD Countries. Paris: OECD. Palacios, R. J., and E. R. Whitehouse. 2006. “Civil-Service Pension Schemes Around the
World.” Pension Reform Series, Social Protection Discussion Paper No. 0602, WorldBank, Washington, DC.
Queisser, M., and E. R. Whitehouse. 2006. “Comparing the Pension Promises of 30 OECDCountries.” International Social Security Review 59 (3): 49–77.
Robalino, D., E. R. Whitehouse, et al. 2005. Pensions in Middle East and North Africa: Time forChange. Washington, DC: World Bank.
Vordring, H., and K. Goudswaard. 1997. “Indexation of Public Pension Benefits on a LegalBasis: Some Experiences in European Countries.” International Social Security Review 50(3): 31–44.
Weaver, R. K. 1988. Automatic Government: The Politics of Indexation. Washington, DC:Brookings Institution.
Whitehouse, E. R. 2000. “Administrative Charges for Funded Pensions: MeasurementConcepts, International Comparison, and Assessment.” Journal of Applied Social ScienceStudies 120 (3): 311–61.
———. 2001. “Administrative Charges for Funded Pensions: Comparison and Assessmentof 13 Countries.” In Private Pension Systems: Administrative Costs and Reforms, PrivatePensions Series. Vol. 3. Paris: OECD.
———. 2002. “Pension Systems in 15 Countries Compared: The Value of Entitlements.”Discussion Paper 02/04, Centre for Pensions and Superannuation, University of NewSouth Wales, Sydney.
References


Libya, 207links to GDP, 21Luxembourg, 95Spain, 110the Republic of Yemen, 216
ageage-based tax allowances, 24age credit, 63and contribution rate, 9
age eligibility, 13, 15, 16Algeria, 189Argentina, 159Australia, 53Austria, 56Bahrain, 192Belgium, 59Bulgaria, 127Canada, 62Chile, 162Colombia, 165Croatia, 130the Czech Republic, 133Denmark, 65Djibouti, 195the Dominican Republic, 171the Arab Republic of Egypt, 198El Salvador, 174Estonia, 136France, 71Germany, 74Greece, 77Hungary, 139Iceland, 80the Islamic Republic of Iran, 201Ireland, 83Italy, 86Japan, 89Jordan, 204
221
Index
Aaccident compensation corporation levy, 101accrual rates, 11–12, 14–18t3.1–3.4
Algeria, 189Bahrain, 192Djibouti, 195the Arab Republic of Egypt, 198Estonia, 136Finland, 68Greece, 77Hungary, 139Iceland, 80the Islamic Republic of Iran, 201Japan, 89Jordan, 204Korea, 92Libya, 207Luxembourg, 95Morocco, 210the Netherlands, 98Norway, 104Portugal, 107the Slovak Republic, 151Spain, 110Tunisia, 213the Republic of Yemen, 216
actuarial factors, 27, 30Bulgaria, 127Korea, 92Italy, 86Tunisia, 213
adequacy, vs. insurance, 39, 43–44adjustments, 77
Austria, 56the Czech Republic, 133earnings-related schemes, 22–23t3.6the Islamic Republic of Iran, 201Jordan, 204
Figures, notes, and tables are indicated by f, n, and t, respectively.

Korea, 92Latvia, 142Libya, 207Lithuania, 145Luxembourg, 95Mexico, 177Morocco, 210the Netherlands, 98New Zealand, 101Norway, 104Peru, 180Poland, 148Portugal, 107the Slovak Republic, 151Spain, 110Sweden, 113Switzerland, 116Tunisia, 213Turkey, 154the United Kingdom, 119the United States, 122the Republic of Yemen, 216See also residency requirements; vesting
requirementsaggregate taxable income (ATI), Belgium, 60Algeria, 189–91annual pension-insurance coefficient, 136annuities, 27
Bulgaria, 127Chile, 162Costa Rica, 168the Dominican Republic, 171El Salvador, 174Germany, 75Latvia, 143Mexico, 177Poland, 148Switzerland, 116
Arbeidsmarkedets Tillægspension (ATP), 65arduous occupations
Algeria, 189the Arab Republic of Egypt, 198Greece, 77the Islamic Republic of Iran, 201Tunisia, 213
Argentina, 159–61ARRCO scheme, France, 71asset-based charges, 162assets test, 83ATI. See aggregate taxable income (ATI)ATP. See Arbeidsmarkedets Tillægspension (ATP)Australia, 53–55Austria, 56–58average replacement rate, 31, 33
BBahrain, 192–94basic pension schemes, 5, 39, 41
adjustments of, 24Argentina, 159–61Canada, 62–64the Czech Republic, 133–35Denmark, 65–67Eastern Europe and Central Asia, 6t2.1Estonia, 136–38high-income OECD countries, 6t2.1Iceland, 80–82Ireland, 83–85Japan, 89–91Latin America and the Caribbean, 6t2.1Latvia, 145–47Luxembourg, 95–97Middle East and North Africa, 7t2.1the Netherlands, 98–100New Zealand, 101–03Norway, 104–06the United Kingdom, 119–21See also first-tier, redistributive schemes
basic universal benefit (PBU), Argentina, 159Belgium, 59–61benefit calculations
Algeria, 189Argentina, 159Australia, 54Austria, 56Bahrain, 192Belgium, 59–61Bulgaria, 127Canada, 62Chile, 162Colombia, 165Costa Rica, 168Croatia, 130Denmark, 65–66the Dominican Republic, 171El Salvador, 174Finland, 68–70France, 71–72Greece, 77–78Hungary, 139–41Iceland, 80–81the Islamic Republic of Iran, 201Ireland, 83Italy, 86Japan, 89Latvia, 142–44Lithuania, 145Morocco, 210the Netherlands, 98
222 INDEX
New Zealand, 101Norway, 104Poland, 148Spain, 110Sweden, 113Turkey, 154the United Kingdom, 119the United States, 122Uruguay, 183the Republic of Yemen, 216
bonuses, Mexico, 177Bulgaria, 127–29
CCanada, 62–64ceiling on benefits
Canada, 62Spain, 110the United States, 122
ceiling on contributionsEl Salvador, 174the Islamic Republic of Iran, 201
ceiling on earnings, 12, 13, 34, 42Algeria, 189Austria, 56Belgium, 59Canada, 62Croatia, 130Estonia, 136, 137Finland, 68France, 71Germany, 74Greece, 77Hungary, 139Iceland, 80the Islamic Republic of Iran, 201Japan, 89Jordan, 204Korea, 92Latvia, 142Libya, 207Lithuania, 145Morocco, 210the Netherlands, 98Norway, 104Poland, 148the Slovak Republic, 151Spain, 110Sweden, 113Turkey, 154the United Kingdom, 119the United States, 122Uruguay, 183the Republic of Yemen, 216
charges, Peru, 182Chile, 162–64civil service
the Dominican Republic, 171Morocco, 210wage index, 23, 23t3.6the Republic of Yemen, 216
Colombia, 165–67commissions
Chile, 162Colombia, 165Costa Rica, 168the Dominican Republic, 171El Salvador, 174Uruguay, 183
compound-interest effect, 21consumer price index, 154contributions
as parameter of pension systems, 24ceilings on, 174, 201See also taxes and social security
contributionscontribution sociale generalisée (CSG), 72Costa Rica, 168–70Croatia, 130–32CSG. See contribution sociale generalisée (CSG)the Czech Republic, 133–35
DDB. See defined-benefit (DB) schemesDC. See defined-contribution (DC) schemesdeath insurance, Chile, 162defined-benefit (DB) schemes, 6–7t2.1, 8, 12,
44, 45Argentina, 159–61Austria, 56–58Colombia, 165–67Costa Rica, 168–70Iceland, 80–81link between pension and earnings, 41, 42the Netherlands, 98–100Spain, 113–15Uruguay, 183–85
defined-contribution (DC) schemes, 6–7t2.1, 8,11, 13, 44, 45
Argentina, 159–61Australia, 53–55Bulgaria, 127–29Chile, 162–64Colombia, 165–67Costa Rica, 168–70Croatia, 130Denmark, 65–66El Salvador, 174–76
INDEX 223
Estonia, 136Hungary, 139–41Iceland, 80–81Latvia, 142–43and link between pension and earnings, 39,
41–42Lithuania, 145–47Mexico, 177–79and modeling, 27Peru, 180–82Poland, 148–50the Slovak Republic, 151–53Sweden, 113–15Uruguay, 183–85
defined-credit schemes, 9Denmark, 65–67disability insurance
Belgium, 60Chile, 162Costa Rica, 168the Dominican Republic, 171El Salvador, 174Portugal, 108Uruguay, 183
Djibouti, 195–97the Dominican Republic, 171–73
Eearnings
average earnings, 31–34calculation of average earnings, 27defining of, 16, 17, 18, 20–21high earners, 32t5.1, 34, 37, 123, 168link to pensions, 4, 39–42, 43–44See also ceiling on earnings; earnings-related
schemes; low earnersearnings measures, 18–21
Austria, 56Bahrain, 192Belgium, 59–61Canada, 62–63Denmark, 65Djibouti, 195the Arab Republic of Egypt, 198the Islamic Republic of Iran, 201Jordan, 204Korea, 92Libya, 207lifetime average earnings measures, 18, 20Morocco, 210Portugal, 107–09Tunisia, 213the Republic of Yemen, 216
earnings-related schemes
adjustments of pensions in payment,22–23t3.6
Algeria, 189–91Argentina, 159–61Austria, 56–58Bahrain, 192–94Belgium, 59–61Bulgaria, 127–29Canada, 62–64Colombia, 165–67Costa Rica, 168–70Croatia, 130–32the Czech Republic, 133–35defining earnings, 16, 17, 18, 20–21Djibouti, 195–97the Dominican Republic, 171–73earnings measure and valorization, 19–20t3.5the Arab Republic of Egypt, 198–200Estonia, 136–38Finland, 68–70France, 71–73Germany, 74–76Greece, 77–79Hungary, 139–41the Islamic Republic of Iran, 201–03Italy, 86–88Japan, 89–91Jordan, 204–06Korea, 92–94Latvia, 142–44Libya, 207–09link between pensions and earnings, 39–42Lithuania, 145–47Luxembourg, 95–97Morocco, 210–12the Netherlands, 98–100Norway, 104–06Poland, 148–50Portugal, 107–09the Slovak Republic, 151–53Spain, 110–12Sweden, 113–15Switzerland, 116–18Tunisia, 213–15Turkey, 154–56Uruguay, 183–85the Republic of Yemen, 216–18
Eastern Europe and Central Asiacountry studies, 127–56earnings measure and valorization, 20t3.5first-tier, redistributive schemes, 6t2.1, 7, 44gross replacement rates by earnings level, 31,
32t5.1minimum pension plans, 6t2.1
224 INDEX

net pension entitlements, 35–38net replacement rates, 36t6.1parameters of pension systems, 16t3.2private vs. public sector pension
provision, 44procedures for adjustment of pensions in
payment, 22t3.6, 23second-tier, earnings-related schemes, 6t2.1,
7, 45targeted pension plans, 6t2.1See also names of specific countries; specific
pension schemeeffective accrual rates, 12the Arab Republic of Egypt, 198–200elderly care insurance, 89eligibility age. See age eligibilityEl Salvador, 175–76end-of-year allowances, Luxembourg, 95entitlements
overview, 31–34under today’s rules, 25See also specific pension scheme
Estonia, 136–38European Commission, 4European Union, 4
Ffederal income tax, the United States, 122–23Finland, 68–70first-tier, redistributive schemes, 5–7, 39
adequacy vs. insurance, 43–44designing of, 44Eastern Europe and Central Asia
parameters, 16t3.2high-income OECD countries parameters,
11–12, 14t3.1Latin America and the Caribbean
parameters, 17t3.3Middle East and North Africa parameters,
18t3.4See also basic pension schemes; minimum
pension schemes; social assistance; targeted pension schemes
flat-rate schemes, 34Argentina, 159–61Canada, 62–64Estonia, 136–38Japan, 89–91Lithuania, 145–47Luxembourg, 95–97the Netherlands, 98–100New Zealand, 101–03Norway, 104–06the United Kingdom, 119–21
France, 71–73franchise and franchising, 33, 98free area, 53
GGDP. See gross domestic product (GDP)general social tax (CSG), France, 72Germany, 74–76Greece, 77–79gross domestic product (GDP), adjustments
linked to, 21Italy, 86Turkey, 154
gross pension levels. See pension modelingresults
gross pension wealth. See pension modelingresults
gross replacement rates, 21, 35, 43by earnings level, 31–34See also pension modeling results;
replacement ratesguaranteed income supplements, Canada,
62–64g-value, 142, 143
Hhazardous occupations
Algeria, 189the Arab Republic of Egypt, 198Greece, 77the Islamic Republic of Iran, 201
health insuranceAlgeria, 190Belgium, 69Chile, 162El Salvador, 174Germany, 74, 75Japan, 89the Netherlands, 99Poland, 149
high earners, 32t5.1, 34Costa Rica, 168net pension entitlements, 37the United States, 123Uruguay, 183
high-income OECD countriescountry studies, 53–124earnings measure and valorization, 19t3.5first-tier, redistributive schemes, 6t2.1, 7, 44gross replacement rates by earnings level, 31,
32t5.1link between pensions and earnings, 39,
40ff7.1a–7.1dminimum pension plans, 6t2.1
INDEX 225

net pension entitlements, 35–38net replacement rates, 36t6.1pension system parameters, 11–12,
14–15t3.1private vs. public sector pension
provision, 44procedures for adjustment of pensions in
payment, 21, 22t3.6, 24second-tier, earnings-related schemes, 6t2.1,
8–9, 45targeted pension plans, 6t2.1See also names of specific OECD countries;
specific pension schemesholiday entitlements, Mexico, 177Holzmann, Robert, 3–4housing accounts, Mexico, 177Hungary, 139–41
IIceland, 80–82income taxes. See taxes; taxes and social security
contributionsincome-tested schemes, 5
Austria, 56–58Canada, 62–64Denmark, 65–67Finland, 68–70Greece, 78Iceland, 80–82Norway, 104–06Sweden, 113–15Switzerland, 116–18Turkey, 154–56the United Kingdom, 119–21
indexation, 21–24Algeria, 189Argentina, 160Australia, 53Belgium, 59Croatia, 130the Czech Republic, 133Denmark, 65Djibouti, 195Hungary, 139the Islamic Republic of Iran, 201Jordan, 204Latvia, 142Luxembourg, 95Morocco, 210the Netherlands, 98Norway, 104Portugal, 107the Slovak Republic, 151Sweden, 114–15
Switzerland, 116Tunisia, 213Turkey, 154Uruguay, 183, 184See also, price indexation
individual accounts, 26, 127–29Industrins och handelns tilläggspension (ITP),
113–14inflation
Colombia, 165and indexation, 21, 22t3.6and targeted pension schemes, 107–08See also price inflation
Infonavit, 177information technology, 17–18insurance, 5
Peru, 180premiums, 165vs. adequacy, 39, 43–44See also specific pension scheme; specific type of
insuranceinsurance premiums, Colombia, 165interest rates
notional nominal interest rate, 65Switzerland, 116
investment portfolios, Chile, 162the Islamic Republic of Iran, 201–03Ireland, 83–85Italy, 86–88ITP. See Industrins och handelns tilläggspension
(ITP)
JJapan, 89–91Jihad tax, 207Jordan, 204–06
KKorea, 92–94
LLatin America and the Caribbean
country studies, 159–85earnings measure and valorization, 20t3.5first-tier, redistributive schemes, 6t2.1,
17t3.3, 44gross replacement rates by earnings level, 31,
32–33t5.1net pension entitlements, 35–38net replacement rates, 36–37t6.1private vs. public sector pension
provision, 44procedures for adjustment of pensions in
payment, 23t3.6
226 INDEX

second-tier, earnings-related schemes, 6t2.1,8, 17t3.3, 44
targeted pension plans, 6t2.1See also names of specific countries; specific
pension schemeLatvia, 142–44length of service, 12Libya, 207–09life expectancy, 148
Finland, 68Italy, 86Latvia, 142Sweden, 113
lifetime average earnings measures, 18, 20Lithuania, 145–47living arrangements, and pension benefits,
101long-term care contributions
Germany, 74, 75Luxembourg, 96
low earners, 31–34Austria, 56–58Costa Rica, 168Denmark, 65–67Ireland, 83net pension entitlements, 37the Slovak Republic, 151Switzerland, 116the United States, 122–24Uruguay, 183
lump-sum paymentsthe Arab Republic of Egypt, 198Jordan, 204Tunisia, 213
Luxembourg, 95–97
Mmandatory occupational schemes
France, 71–73the Netherlands, 98Switzerland, 116–18See also occupational schemes
mandatory pension schemesAustralia, 53–55Bulgaria, 127–29Croatia, 130–32Estonia, 136–38France, 71–73gross replacement rates by earnings level,
32–33t5.1, 45t1Hungary, 139–41Iceland, 80–82Latvia, 142–44Lithuania, 145–47
net replacement rates, 36–37t6.1and target replacement rates, 43
maternity contributions, Peru, 180maximum pension schemes
Algeria, 189–91Bulgaria, 127–29the Arab Republic of Egypt, 198–200the Slovak Republic, 151–53
means-tested schemes, 5, 33Australia, 53–55Austria, 56–58Belgium, 59–61Finland, 68–70Ireland, 83–85Portugal, 107–09Spain, 110–12Turkey, 154–56the United States, 122–24
Mexico, 177–79Middle East and North Africa
country studies, 189–218earnings measure and valorization, 20t3.5first-tier, redistributive schemes, 7t2.1, 44gross replacement rates by earnings level, 31,
33t5.1minimum pension plans, 6t2.1, 7t2.1net pension entitlements, 35–38net replacement rates, 37t6.1parameters of pension systems, 18t3.4private vs. public sector pension
provision, 44procedures for adjustment of pensions in
payment, 23, 23t3.6second-tier, earnings-related schemes, 7t2.1, 8targeted pension plans, 7t2.1See also names of specific countries; specific
pension schemesMig. See minimum income guarantee (Mig)military workers, Morocco, 210miners, Morocco, 210minimum income guarantee (Mig), the United
Kingdom, 119–21minimum pension schemes, 5, 7, 39, 44
Algeria, 189–91Bahrain, 192–94Belgium, 59–61Bulgaria, 127–29Chile, 162–64Colombia, 165, 165–67Costa Rica, 168–70Croatia, 130–32the Czech Republic, 133–35Djibouti, 195–97the Dominican Republic, 171–73
INDEX 227

Eastern Europe and Central Asia, 6t2.1the Arab Republic of Egypt, 198–200El Salvador, 174–76France, 71Greece, 77–78high-income OECD countries, 6t2.1Hungary, 139the Islamic Republic of Iran, 201–03Jordan, 204–06Latin America and the Caribbean, 6t2.1Latvia, 142Libya, 207–09Luxembourg, 95–97Mexico, 177–79Middle East and North Africa, 7t2.1Morocco, 210–12Peru, 180–82Poland, 148–50Portugal, 107–09the Slovak Republic, 151Spain, 110–12Tunisia, 213–15Turkey, 154Uruguay, 183–85
mixed indexation, 21mixed systems
Croatia, 130–32Hungary, 139
modeling pensions, 3–4and average earnings, 27calculations for full-career, single workers, 25coverage, 25–26defined-contribution schemes, 27economic variables, 26–27future entitlements under today’s rules, 25indicators and results, 28–29overview, 49–50and taxes and social security
contributions, 27–28worked example, 29–30See also names of specific countries; pension
modeling resultsMorocco, 210–12mortality
data, 27projections in Finland, 68rates in Italy, 86
Nnational schemes
Finland, 68–70Morocco, 210–12the Republic of Yemen, 216–18
the Netherlands, 98–100
net pension entitlements, 4, 35–38See also pension modeling results
net pension wealth. See pension modelingresults
net replacement rates, 35by earnings level, 36–37t6.1See also pension modeling results;
replacement ratesNew Zealand, 101–03noncontributory schemes, 78Norway, 104–06notional-account schemes, 8, 11–12, 21, 45
Italy, 86–88Latvia, 142–44and mortality data, 27Poland, 148–50Sweden, 113–15
notional interest rate, 86, 148notional nominal interest rate, 65
Ooccupational schemes, 8, 12, 18, 33, 44
France, 71–73Iceland, 80–82Ireland, 83–85the Netherlands, 98–100Sweden, 113–15Switzerland, 116–18
OECD. See Organization for Economic Co-operation and Development(OECD)
old-age security, 62Organization for Economic Co-operation and
Development (OECD), 3–4See also high-income OECD countries; names
of specific OECD countries
Pparameters of pension systems, 3–24, 28
defined-contribution schemes, 11, 13Eastern Europe and Central Asia, 16t3.2high-income OECD countries, 11–12,
14–15t3.1and indexation, 21–24Latin America and the Caribbean, 17t3.3Middle East and North Africa, 18t3.4See also age eligibility; ceiling on earnings;
defined-contribution (DC) schemes;first-tier, redistributive schemes;second-tier, earnings-related schemes;taxes and social security contributions
pay-as-you-go (PAYG) schemesArgentina, 159–61Bulgaria, 127–29
228 INDEX

Colombia, 165–67Finland, 68–70Hungary, 139–41Latvia, 142–44Lithuania, 145–47
PBU. See basic universal benefit (PBU)Pearson, Mark, 3–4pension credit, the United Kingdom,
119–21pension fund supervisory agencies,
the Dominican Republic, 171pension modeling results
Algeria, 190–91Argentina, 160–61Australia, 54–55Austria, 57–58Bahrain, 193–94Belgium, 60–61Bulgaria, 128–29Canada, 63–64Chile, 163–64Colombia, 166–67Costa Rica, 169–70Croatia, 131–32the Czech Republic, 134Denmark, 66–67Djibouti, 196–97the Dominican Republic, 172–73the Arab Republic of Egypt, 199–200El Salvador, 175–76Estonia, 137–38Finland, 69–70France, 72–73Germany, 75–76Greece, 78–79Hungary, 140–41Iceland, 81–82the Islamic Republic of Iran, 202–03Ireland, 84–85Italy, 87–88Japan, 90–91Jordan, 205–06Korea, 93–94Latvia, 143–44Libya, 208–10Lithuania, 146–47Luxembourg, 96–97Mexico, 178–79Morocco, 211–12the Netherlands, 99–100New Zealand, 102–03Norway, 105–06Peru, 181–82Poland, 149–50
Portugal, 108–09the Slovak Republic, 152–53Spain, 111–12Sweden, 114–15Tunisia, 214–15Turkey, 155–56the United Kingdom, 120–21the United States, 123–24Uruguay, 184–85the Republic of Yemen, 217–18
pension-point value, 71, 74pension report
future developments, 4overview of conclusions, 4structure of, 3–4
Pensions at a Glance: Public Policies across OECDCountries, 3
pension schemeshigh-income OECD countries, 11–12,
14–15t3.1international comparisons of, 3link between entitlements and
earnings, 4link with earnings, 39–42, 43–44structure of, 6–7t2.1See also benefit calculations; names of specific
countries; specific parameters of schemes;specific pension scheme; taxes and socialsecurity contributions
pension wealth, 28, 29, 77personal income tax. See taxes; taxes and social
security contributionsPeru, 180–82points system, 6–7t2.1, 8, 18, 21, 45
Estonia, 136France, 71–73Norway, 104the Slovak Republic, 151–53
Poland, 148–50Portugal, 107–09price indexation, 21, 22t3.6, 24
Austria, 56Belgium, 59Canada, 62Chile, 163Costa Rica, 168Croatia, 130El Salvador, 174France, 71Greece, 77Hungary, 139Italy, 86Japan, 89Korea, 92
INDEX 229

Luxembourg, 95–97Poland, 148Portugal, 107Sweden, 113Switzerland, 116the United States, 122Uruguay, 183See also indexation
price-indexed annuities, 27, 53, 171the Dominican Republic, 171
price inflationEstonia, 136Finland, 68Italy, 86the Slovak Republic, 151Tunisia, 213
private pension schemes, 71Argentina, 159–61Australia, 53, 53–55Bulgaria, 127–29Chile, 162–64Colombia, 165–67Croatia, 130–32Djibouti, 195–97the Dominican Republic, 171–73Eastern Europe and Central Asia, 6t2.1the Arab Republic of Egypt, 198–200El Salvador, 174–76Finland, 68–70high-income OECD countries, 6t2.1Hungary, 139–41Latin America and the Caribbean, 6t2.1Mexico, 177–79Middle East and North Africa, 7, 7t2.1Morocco, 210–12the Netherlands, 98–100Tunisia, 213–15the United Kingdom, 119–21See also public pension schemes; specific
pension schemeprivate sector
occupational plans, 80–82role in pension provision, 44
progressive schemes, 12, 23, 39, 42, 43the Czech Republic, 133El Salvador, 174and indexation, 23Korea, 92Norway, 104Switzerland, 116and taxes, 24, 35the United Kingdom, 119the United States, 122Uruguay, 183
public health insurance, El Salvador, 174public pension schemes, 12
Algeria, 189–91Austria, 56–58Belgium, 59–61Bulgaria, 127–29Colombia, 165–67Costa Rica, 168–70Croatia, 130–32the Czech Republic, 133–35Denmark, 65–67Eastern Europe and Central Asia, 6t2.1, 8the Arab Republic of Egypt, 198–200Estonia, 136–38Finland, 68–70Greece, 77–79high-income OECD countries, 6t2.1Hungary, 139–41the Islamic Republic of Iran, 201–03Ireland, 83–85Japan, 89, 89–91Jordan, 204–06Korea, 92–94Latin America and the Caribbean,
6t2.1, 7Latvia, 142–44Libya, 207–09Lithuania, 145–47Luxembourg, 95–97Middle East and North Africa, 7, 7t2.1New Zealand, 101–03Norway, 104–06Poland, 148–50Portugal, 107–09the Slovak Republic, 151–53Spain, 110–12Switzerland, 116–18(the) United Kingdom, 119–21Tunisia, 213–15Turkey, 154–56the United States, 122–24Uruguay, 183–85See also private pension schemes; specific
pension schemepublic sector, role in pension provision, 44
Qqualification points, 127qualifying conditions. See age eligibility;
residency requirements; vestingrequirements
quasi-mandatory occupational schemesthe Netherlands, 98–100Sweden, 113–14
230 INDEX
Rreal rate of return, 27, 30n2redistributive programs. See first-tier,
redistributive schemesrelative pension levels, 28–29replacement rates, 4, 28, 39, 43
Algeria, 189and average earnings, 31–34average replacement rate, 31, 33Bahrain, 192Belgium, 59–61Canada, 62Colombia, 165Costa Rica, 168, 168–70the Czech Republic, 133Djibouti, 195the Arab Republic of Egypt, 198Finland, 68France, 71Iceland, 800the Islamic Republic of Iran, 201Jordan, 204Korea, 92, 93–94Libya, 207Morocco, 210the Netherlands, 98, 99–100Norway, 104Sweden, 113–14Switzerland, 116target replacement rates, 43Tunisia, 213the United Kingdom, 119the United States, 122the Republic of Yemen, 216See also pension modeling results
residency requirementsCanada, 62Denmark, 65Finland, 68Iceland, 80–82New Zealand, 101–03See also age eligibility; vesting requirements
resource-tested benefits, 26, 39, 44See also means-tested schemes
SS2P. See state second pension (S2P)safety-net income, 56
Belgium, 59the Czech Republic, 133Estonia, 136–38Germany, 74–76Greece, 77–79Ireland, 83
Latvia, 142Portugal, 107–09Turkey, 154–56
savings credit, the United Kingdom, 119second-tier, earnings-related schemes, 6–7t2.1,
8–9adequacy vs. insurance, 43–44designing of, 45Eastern Europe and Central Asia
parameters, 16t3.2France, 71–73high-income OECD countries parameters,
11–12, 14–15t3.1Latin America and Caribbean parameters,
17t3.3Middle East and North Africa parameters,
18t3.4overview, 11–12, 14–18t3.1–3.4See also defined-benefit (DB) schemes;
defined-contribution (DC) schemes;defined-credit schemes; mandatorypension schemes; notional-accountschemes; points system
severance allowances, Chile, 163sickness contributions
Argentina, 160Austria, 57Finland, 69Luxembourg, 96Peru, 180
the Slovak Republic, 45n1, 151–53social assistance, 5, 7, 33
Chile, 162Costa Rica, 168–70the Czech Republic, 133the Dominican Republic, 171Estonia, 136Germany, 74–76Italy, 86–88Luxembourg, 95the Netherlands, 98Uruguay, 183
social pensions, Portugal, 107–09social security
Lithuania, 145the United States, 122–24See also taxes and social security
contributionssocial solidarity benefits and grants, 77social sustainability, 3solidarity contributions
Belgium, 60Colombia, 166the Dominican Republic, 171
INDEX 231
sources of net replacement rate. Seepension modeling results
SP. See special pension (SP) savings schemesSpain, 110–12special pension (SP) savings schemes, Denmark,
65–67standards of living
and pension adjustments, 21and valorization, 20–21
state second pension (S2P), the UnitedKingdom, 119
superannuation guarantees, 53–55supplemental income
Canada, 52–54Denmark, 65–67Greece, 77guaranteed income supplements, 62–64Iceland, 80Switzerland, 116–18Turkey, 154–56the United States, 122
survivor’s insuranceCosta Rica, 168the Dominican Republic, 171El Salvador, 174the Netherlands, 99Uruguay, 183
Sweden, 113–15Switzerland, 116–18system-dependency ratio, 74
Ttargeted pension schemes, 5, 7, 39, 43–44
adjustments of, 24Australia, 53–55Austria, 56–58Belgium, 59–61Canada, 62–64Chile, 162–64Colombia, 165Costa Rica, 168–70Denmark, 65–67the Dominican Republic, 171–73Eastern Europe and Central Asia, 6t2.1El Salvador, 174–76Estonia, 136–38Finland, 68–70France, 71–72high-income OECD countries, 6t2.1Iceland, 80–82Ireland, 83–85Latin America and the Caribbean,
6t2.1
Middle East and North Africa, 7t2.1Norway, 104–06Peru, 180–82Portugal, 107–09Sweden, 113–15Switzerland, 116–18Turkey, 154–56the United Kingdom, 119–21the United States, 122–24Uruguay, 183–85
target replacement rates, 39, 43taxes
impact on net replacement rates, 37as parameter of pension schemes, 24See also pension modeling results; taxes and
social security contributionstaxes and social security contributions, 24,
27–28, 189–90Argentina, 159–61Australia, 53–54Austria, 56–57Bahrain, 192–94Belgium, 60Bulgaria, 127–28Canada, 63Chile, 162–63Colombia, 165–66Costa Rica, 168–69Croatia, 130the Czech Republic, 134Denmark, 66Djibouti, 195–96the Dominican Republic, 171–72the Arab Republic of Egypt, 199El Salvador, 174Estonia, 137Finland, 69France, 72Germany, 74–75Greece, 78Hungary, 140Iceland, 81the Islamic Republic of Iran, 201Ireland, 83–84Italy, 86–87Japan, 89Jordan, 205Korea, 92Latvia, 143Libya, 207Lithuania, 145–46Luxembourg, 95–97Mexico, 177
232 INDEX

Morocco, 210the Netherlands, 99New Zealand, 101Norway, 105Peru, 180Poland, 149Portugal, 108the Slovak Republic, 151Spain, 110Sweden, 114Switzerland, 117–18Tunisia, 213–14Turkey, 155the United Kingdom, 120the United States, 122–23Uruguay, 184the Republic of Yemen, 216See also names of specific countries
tax-limitation rule, Norway, 105tax reference units (UITs), Peru, 180top-up schemes
Austria, 56–58Sweden, 113–15the United Kingdom, 119the United States, 122–24
transformation coefficient, 86Tunisia, 213–15Turkey, 154–56typology, 3
overview, 5–7See also first tier, redistributive schemes;
mandatory pension schemes; secondtier, earnings-related schemes
UUITs. See Unidades Impostivitas Tributarias
(UITs)unemployment insurance
Algeria, 190Chile, 162Finland, 69Germany, 75the Islamic Republic of Iran, 201Luxembourg, 96Tunisia, 213
Unidades Impostivitas Tributarias (UITs), 180
uniform servicesMorocco, 210the Republic of Yemen, 216
unisex life tables, 139, 148the United Kingdom, 119–21the United States, 122–24
universal pension schemes, Canada, 62–64
Uruguay, 183–85
Vvalorization
Algeria, 189Austria, 56earnings-related schemes, 19–20t3.5the Arab Republic of Egypt, 198France, 71Greece, k, 77Japan, 89Korea, 92Morocco, 210the Netherlands, 98Portugal, 107Tunisia, 213
vesting requirementsAlgeria, 189Argentina, 159Australia, 53Austria, 56Bahrain, 192Belgium, 59Bulgaria, 127Chile, 162Colombia, 165–67Costa Rica, 168Croatia, 130the Czech Republic, 133Djibouti, 195the Dominican Republic, 171–73the Arab Republic of Egypt, 198El Salvador, 174Estonia, 136France, 71Germany, 74Greece, 77Hungary, 139the Islamic Republic of Iran, 201Ireland, 83Italy, 86Japan, 89Jordan, 204Korea, 92Latvia, 142Libya, 207Lithuania, 145Luxembourg, 95Mexico, 177Morocco, 210
INDEX 233

Norway, 104Peru, 180Poland, 148Portugal, 107the Slovak Republic, 151Spain, 110, 113Sweden, 114Turkey, 154the United Kingdom, 119the United States, 122Uruguay, 183the Republic of Yemen, 216See also age eligibility; residency
requirementsveterans, Algeria, 189voluntary schemes, 43
Denmark, 65–67Ireland, 83–85the United Kingdom, 119–21
Wwage index, 23, 23t3.6white-collar workers’ schemes, Sweden, 113
withdrawalsAustralia, 53Canada, 62Chile, 162Costa Rica, 168Denmark, 65, 66the Dominican Republic, 171El Salvador, 174Finland, 68Iceland, 80lump sum, 66Sweden, 113See also lump-sum payments
with-profit schemes, 65work-injury coverage
Bahrain, 192Chile, 162–63Peru, 180
work-related expenses, 149World Bank, 3–4
Ythe Republic of Yemen, 216–18
234 INDEX


ECO-AUDIT
Environmental Benefits Statement
The World Bank is committed to preservingendangered forests and natural resources. TheOffice of the Publisher has chosen to printPensions Panorama on recycled paper with30 percent post-consumer content in accor-dance with the recommended standards forpaper usage set by the Green Press Initiative,a nonprofit program supporting publishers inusing fiber that is not sourced from endan-gered forests. For more information, visitwww.greenpressinitiative.org.
Saved:• 12 trees• 9 million BTUs of
energy• 1,094 lbs. of net
greenhouse gases• 4,541 gallons of
wastewater• 583 lbs. of solid waste


The accurate presentation of a country’s pension system and thecomparison of pension systems across countries are crucial partsof policy analysis and reform. This is equally valid for high-income countries of the Organisation for Economic Co-operation
and Development as it is for low- and middle-income countries. PensionsPanorama: Retirement-Income Systems in 53 Countries provides acompendium of facts and analysis that should inform policy makingand public debate about retirement-income systems around the world.Reforming pensions is a central policy issue for all countries; it is chal-lenging and controversial because it involves long-term planning bygovernments that face numerous short-term pressures.
In Pensions Panorama, Edward Whitehouse combines painstaking, rigorous analysis with a clear, easy-to-understand presentation of empirical results. While the author does not advocate any particular kind of pension system or type of pension reform, the analysis presented can inform debates on retirement-income systems. A core concern is social sustainability, which involves the future adequacy of pension benefits, the impact of pension reforms on income distribution among older people, and the means to combat old-age poverty. Pensions Panorama is a useful resource for policy makers, government officials, and others involved in pension reform.
ISBN 0-8213-6764-1